Attached files
| file | filename |
|---|---|
| EX-32.2 - EX-32.2 - Steel Connect, Inc. | d362657dex322.htm |
| EX-32.1 - EX-32.1 - Steel Connect, Inc. | d362657dex321.htm |
| EX-31.2 - EX-31.2 - Steel Connect, Inc. | d362657dex312.htm |
| EX-31.1 - EX-31.1 - Steel Connect, Inc. | d362657dex311.htm |
| EX-23.1 - EX-23.1 - Steel Connect, Inc. | d362657dex231.htm |
| EX-21 - EX-21 - Steel Connect, Inc. | d362657dex21.htm |
| EX-10.61 - EX-10.61 - Steel Connect, Inc. | d362657dex1061.htm |
Table of Contents
UNITED STATES
SECURITIES AND EXCHANGE COMMISSION
WASHINGTON, D.C. 20549
FORM 10-K
(Mark One)
| ☒ | ANNUAL REPORT PURSUANT TO SECTION 13 OR 15(d) OF THE SECURITIES EXCHANGE ACT OF 1934 |
For the Fiscal Year Ended July 31, 2017
| ☐ | TRANSITION REPORT PURSUANT TO SECTION 13 OR 15(d) OF THE SECURITIES EXCHANGE ACT OF 1934 |
For the Transition Period From to
Commission file number: 001-35319
ModusLink Global Solutions, Inc.
(Exact name of registrant as specified in its charter)
| Delaware | 04-2921333 | |
| (State or other jurisdiction of incorporation or organization) |
(I.R.S. Employer Identification No.) |
| 1601 Trapelo Road, Suite 170 Waltham, Massachusetts |
02451 | |
| (Address of principal executive offices) | (Zip Code) | |
(781) 663-5001
(Registrant’s telephone number, including area code)
Securities registered pursuant to Section 12(b) of the Act:
| Title of each class: | Name of each exchange on which registered: | |
| Common Stock, $0.01 par value | The NASDAQ Stock Market LLC |
Securities registered pursuant to Section 12(g) of the Act:
None
Indicate by check mark if the registrant is a well-known seasoned issuer, as defined in Rule 405 of the Securities Act. Yes ☐ No ☒
Indicate by check mark if the registrant is not required to file reports pursuant to Section 13 or Section 15(d) of the Act. Yes ☐ No ☒
Indicate by check mark whether the registrant: (1) has filed all reports required to be filed by Section 13 or 15(d) of the Securities Exchange Act of 1934 during the preceding 12 months (or for such shorter period that the registrant was required to file such reports), and (2) has been subject to such filing requirements for the past 90 days. Yes ☒ No ☐
Indicate by check mark whether the registrant has submitted electronically and posted on its corporate Web site, if any, every Interactive Data File required to be submitted and posted pursuant to Rule 405 of Regulation S-T (§232.405 of this chapter) during the preceding 12 months (or for such shorter period that the registrant was required to submit and post such files). Yes ☒ No ☐
Indicate by check mark if disclosure of delinquent filers pursuant to Item 405 of Regulation S-K is not contained herein, and will not be contained, to the best of registrant’s knowledge, in definitive proxy or information statements incorporated by reference in Part III of this Form 10-K or any amendment to this Form 10-K. ☐
Indicate by check mark whether the registrant is a large accelerated filer, an accelerated filer, a non-accelerated filer, a smaller reporting company or an emerging growth company. See the definitions of “large accelerated filer,” “accelerated filer,” “smaller reporting company” and “emerging growth company” in Rule 12b-2 of the Exchange Act. (Check one):
| Large accelerated filer | ☐ | Accelerated filer | ☒ | |||
| Non-accelerated filer | ☐ (Do not check if a smaller reporting company) | Smaller reporting company | ☐ | |||
| Emerging growth company | ☐ |
If an emerging growth company, indicate by check mark if the registrant has elected not to use the extended transition period for complying with any new or revised financial accounting standards provided pursuant to Section 13(a) of the Exchange Act. ☐
Indicate by check mark whether the registrant is a shell company (as defined in Rule 12b-2 of the Act). Yes ☐ No ☒
The aggregate market value of the Registrant’s common stock held by non-affiliates of the Registrant computed with reference to the price at which the common stock was last sold as of the last business day of the Registrant’s most recently completed second fiscal quarter was $63,711,482.
On October 1, 2017, the Registrant had 55,555,973 outstanding shares of common stock, $0.01 par value.
DOCUMENTS INCORPORATED BY REFERENCE
Portions of the registrant’s definitive proxy statement to be delivered to stockholders in connection with the Company’s 2016 Annual Meeting of Stockholders are incorporated by reference into Part III of this Annual Report on Form 10-K where indicated.
Table of Contents
ANNUAL REPORT ON FORM 10-K
FISCAL YEAR ENDED JULY 31, 2017
MODUSLINK GLOBAL SOLUTIONS, INC.
| Item |
Page |
|||||
| PART I | ||||||
| 1. |
1 | |||||
| 1A. |
5 | |||||
| 1B. |
16 | |||||
| 2. |
16 | |||||
| 3. |
16 | |||||
| 4. |
16 | |||||
| PART II | ||||||
| 5. |
17 | |||||
| 6. |
19 | |||||
| 7. |
Management’s Discussion and Analysis of Financial Condition and Results of Operations |
20 | ||||
| 7A. |
39 | |||||
| 8. |
41 | |||||
| 9. |
Changes in and Disagreements with Accountants on Accounting and Financial Disclosure |
80 | ||||
| 9A. |
80 | |||||
| 9B. |
83 | |||||
| PART III | ||||||
| 10. |
83 | |||||
| 11. |
83 | |||||
| 12. |
Security Ownership of Certain Beneficial Owners and Management and Related Stockholder Matters |
83 | ||||
| 13. |
Certain Relationships and Related Transactions, and Director Independence |
84 | ||||
| 14. |
84 | |||||
| PART IV | ||||||
| 15. |
85 | |||||
Table of Contents
This Annual Report on Form 10-K contains forward-looking statements within the meaning of Section 21E of the Securities Exchange Act of 1934, as amended, and Section 27A of the Securities Act of 1933, as amended. For this purpose, any statements contained herein that are not statements of historical fact may be deemed to be forward-looking statements. Without limiting the foregoing, the words “believes,” “anticipates,” “plans,” “expects” and similar expressions are intended to identify forward-looking statements. Factors that could cause actual results to differ materially from those reflected in the forward-looking statements include, but are not limited to, those discussed in Item 1A of this report, “Risk Factors”, and elsewhere in this report. Readers are cautioned not to place undue reliance on these forward-looking statements, which reflect management’s analysis, judgment, belief or expectation only as of the date hereof. We do not undertake any obligation to update forward-looking statements whether as a result of new information, future events or otherwise.
ModusLink Global Solutions, Inc. (together with its consolidated subsidiaries, “ModusLink Global Solutions” or the “Company” or “Registrant”), through its wholly owned subsidiaries, ModusLink Corporation (“ModusLink”) and ModusLink PTS, Inc. (“ModusLink PTS”), provides comprehensive digital and physical supply chain optimization services (the “Supply Chain Business”) that are designed to improve clients’ revenue, cost, sustainability and customer experience. ModusLink Global Solutions provides a diverse range of solutions and services to leading companies across a wide spectrum of industries, including consumer electronics, communications, computing, medical devices, software and retail industries, among others. The Company’s operations are supported by a global footprint, which includes more than 20 sites across North America, Europe, and the Asia Pacific region.
The Company previously operated under the names CMGI, Inc. and CMG Information Services, Inc. and was
incorporated in Delaware in 1986. The Company’s address is 1601 Trapelo Road, Suite 170, Waltham, Massachusetts 02451.
Services
The Supply Chain Business operation’s revenue primarily comes from the sale of supply chain management solutions to its clients. Among ModusLink’s core physical supply chain solutions are sourcing, planning, procurement, postponement and customization, order management, freight management, home replenishment, consumer returns and B2C and B2B fulfillment. Digital supply chain solutions, include e-Commerce and Marketplace integration, customer contact, payment services, financial management services, data analytic services, cross-device data, and entitlement, subscription and Internet of Things (“IOT”) management. In addition, ModusLink is a Microsoft Authorized Replicator, further enhancing its position as a valued supply chain services provider to leading technology hardware original equipment manufacturers (“OEMs”).
The Supply Chain Business operation’s core solutions include:
Material Planning and Factory Supply—ModusLink sources inbound materials, delivers on-time and maintains high quality standards based on its local supplier relationships. ModusLink performs kitting and assembly of packaging materials and accessories while managing logistics and delivery schedules into multiple manufacturing sites or partners for just-in-time manufacturing. Solutions are designed to reduce the complexity, lead times and costs of inbound materials, supply chain procurement, and factory feed processes, providing an end-to-end solution to ensure full optimization of client’s supply chain operations.
Value-Added Warehousing and Distribution—ModusLink’s capabilities are designed for flexibility, reliability and speed, to support clients’ distribution, retail and end-user fulfillment. Services include order management, pick, pack, and ship, retail connectivity, demand planning and integrated transportation management services, which are supported by a global technology infrastructure.
ModusLink’s postponement and configuration solutions are based on a technology-driven planning and execution process. By analyzing operating variables and supply chain costs, ModusLink can defer product configuration and packaging of a client’s product until the optimal time and at the most strategic location. Client programs can leverage any combination of ModusLink’s fulfillment sites around the globe, including those near manufacturing sites or close to the consumer.
ModusLink provides a complete solution for the physical programming of digital content – such as software, firmware, upgrades or promotional material – onto numerous types of flash media, including SD and MicroSD cards, USB drives, navigation systems, smartphones and tablets.
1
Table of Contents
Aftermarket Services
Product Returns Management—With the shift from traditional brick-and-mortar storefronts into the digital sphere, product returns have increased globally, making it critical to offer a seamless, efficient experience that attracts and retains customers. ModusLink simplifies the returns process for retailers and manufacturers that want to improve service parts management and the value of returned assets. ModusLink manages the end-to-end process including receipt of goods, managing the Returns Management Authorization (RMA) process, sorting, triage, credit processing and ultimate disposition of the returned product.
Product Repair and Recovery—ModusLink helps clients maximize the value of returned and excess inventory by handling all aspects of the returns process, coupled with the ability to manage trade-in services as well. ModusLink provides clients with a post-sale solution that integrates the Company’s product remanufacturing and value recovery experience with its returns management and contact center capabilities.
E-Business
E-Commerce—ModusLink’s e-Commerce platform addresses the complexities and risk of a global web store, optimizing for each stage of the online buying experience so that products can be quickly and easily purchased, serviced and delivered anywhere in the world. This is especially important given the proliferation of mobile devices and the continued, rapid expansion of Internet-enabled technologies. ModusLink’s end-to-end digital and physical solutions are fully integrated with global payment, CRM and fulfillment systems, helping clients quickly and easily expand into a new region and country, while simultaneously enabling clients to take advantage of new revenue streams created by the digital marketplace, without having to change their entire business models
Contact Center—ModusLink’s contact center solution is designed to improve the customer brand experience by increasing the quality of customer interaction across multiple channels. Professional agents have in-depth knowledge of the client, brand and products and the experience to manage both consumer and business-to-business contacts.
Entitlement Management— ModusLink’s entitlement management solution uses a platform, which gives software publishers, channel providers and end-users a single, centralized portal for the control and use of intellectual property. The platform manages access to digital and multimedia products, content, features and services that can be configured to a client’s needs.
Financial Management—ModusLink provides clients with a single payment platform for e-commerce, based on a proven technology infrastructure and business processes. Through these services, clients can access new markets, reduce cart abandonment, maximize conversion rate and increase revenue, protect the business and customers from fraud, and maintain customer visibility and ownership, while optimizing behind-the-scenes financial operations.
The Supply Chain Business solutions seamlessly integrate with other supply chain service providers such as contract manufacturing companies and transportation providers.
Operating Segments
The Company has four operating segments: Americas; Asia; Europe; and e-Business. Based on the information provided to the Company’s chief operating decision-maker (“CODM”) for purposes of making decisions about allocating resources and assessing performance and quantitative thresholds, the Company has determined that it has four reportable segments: Americas, Asia, Europe and e-Business. The Company also has Corporate-level activity, which consists primarily of costs associated with certain corporate administrative functions such as legal and finance, which are not allocated to the Company’s reportable segments. The Corporate-level balance sheet information includes cash and cash equivalents, trading securities, investments in affiliates, notes payables and other assets and liabilities which are not identifiable to the operations of the Company’s operating segments. Certain reportable segment information, including revenue, profit and asset information, is set forth in Note 19 of the accompanying notes to consolidated financial statements included in Item 8 below and in “Management’s Discussion and Analysis of Financial Condition and Results of Operations” included in Item 7 below.
Technology Infrastructure
The Company’s information technology systems and infrastructure serves as the backbone of a client’s fully integrated global supply chain program and manages the flow and use of physical assets and information. The Company offers a secure and redundant operating environment to ensure the integrity and privacy of its clients’ data. The Company works with clients to integrate data, tools and applications to deliver an optimized solution that meets its clients’ business needs and improves management of the global supply chain.
2
Table of Contents
The Company’s Enterprise Resource Planning (“ERP”) system is designed to provide the visibility and control needed for better decision making, rapid response to global market dynamics and effective asset utilization across services and geographies. The Company has recently embarked on an ERP upgrade further improving its data collection and reporting tools and systems across its geographic footprint.
Facilities
The Company’s global footprint consists of an integrated network of strategically located facilities, including sites throughout North America, Europe and Asia. The Company’s regionally optimized and highly scalable solution centers are designed to provide the flexibility to manage supply chain requirements, deliver and configure products in-region, close to the point of consumption or close to the point of manufacturing in low-cost regions, such as Asia Pacific, Eastern Europe and Mexico for maximum efficiency and cost-effectiveness. Investments in automation and Lean methodologies have enhanced the Company’s overall value proposition to its clients, enabling quicker response times, more efficient service levels and improved customer satisfaction.
Sales and Marketing
The Company’s sales and marketing staff is strategically and globally aligned to support the development, marketing and sale of its supply chain management services and solutions worldwide.
The Company’s marketing efforts are focused on developing greater awareness and brand recognition among its target client base, with an emphasis on companies within its key markets of computing, software, storage, consumer electronics, communications and retail, among others. The Company markets its services and solutions through its website, other online channels, public relations, advertising and tradeshow campaigns, and has developed collateral materials and sales tools to support these efforts. The Company sells its services and solutions on a global scale, through a direct sales channel. The Company’s strategically aligned, global sales staff identifies new opportunities and cultivates leads in all of its key regions throughout North America, Europe and Asia as well as within its target markets around the world. The Company’s sales staff is focused on winning new programs with existing clients, while developing new relationships to further diversify its client base.
Competition
The market for the supply chain management service offerings provided by the Company is highly competitive. As an end-to-end solutions provider with service offerings covering a range of physical and digital supply chain operations and activities across the globe, the Company competes with different companies depending on the type of service it is providing or the geographic area in which an activity is taking place.
For the supply chain solutions, the Company faces competition from Electronics Manufacturing Services/Contract Manufacturers (EMS/CM), third party logistics (3PL) providers, Supply Chain Management (SCM) companies, and regional specialty companies. For the aftermarket services, the Company competes against independent repair vendors, EMS/CM companies, 3PL providers, and SCM companies. For the e-business solutions, the Company’s competition includes global outsource providers, software as service providers and technology providers. For the entitlement management solutions the Company competes against computer software providers offering content and document management solutions. As a provider of an outsourcing solution, the Company’s competition also includes current and prospective clients, who evaluate the Company’s capabilities in light of their own capabilities and cost structures.
The Company believes that the principal competitive factors in its market are quality and range of solutions and services, technological capabilities, costs, location of facilities, responsiveness, and flexibility. With the Company’s end-to-end physical and digital supply chain solution, global footprint, strong client service acumen, and its integrated global supply chain e-Commerce services, the Company believes that it is positioned well to compete in each of the markets it serves, while expanding across various industry subsets.
Clients
A limited number of clients account for a significant percentage of the Company’s consolidated net revenue. For the fiscal year ended July 31, 2017, 2016 and 2015, the Company’s 10 largest clients accounted for approximately 70%, 71% and 76% of consolidated net revenue, respectively. Sales to a consumer electronics client (“Client A”) accounted for approximately 15%, 13%, and 10% of the Company’s consolidated net revenue for the fiscal years ended July 31, 2017, 2016 and 2015, respectively. Sales to
3
Table of Contents
a another consumer electronics client (“Client B”) accounted for approximately 10%, 13%, and 19% of the Company’s consolidated net revenue for the fiscal years ended July 31, 2017, 2016 and 2015, respectively. The Europe reportable segment reports revenue associated with Client A. All four reportable segments report revenues associated with Client B. In general, the Company does not have any agreements which obligate any client to buy a minimum amount of services from the Company, or which designate the Company as its sole supplier of any particular services. The loss of a significant amount of business or program with any key client could have a material adverse effect on the Company. The Company believes that it will continue to derive the vast majority of its consolidated operating revenue from sales to a small number of clients. There can be no assurance that revenue from key clients will not decline in future periods.
The Company sells its services to its clients primarily on a purchase order basis rather than pursuant to contracts with minimum purchase requirements. Consequently, sales are subject to demand variability by such clients. The Company purchases and maintains adequate levels of inventory in order to meet client needs rapidly and on a timely basis. The Company has no guaranteed price, quantity or delivery agreements with its suppliers other than the purchase obligations noted in Note 10 of the accompanying notes to consolidated financial statements included in Item 8 below. Because of the diversity of its services, as well as the wide geographic dispersion of its facilities, the Company uses numerous sources for the wide variety of raw materials needed for its operations. The Company is not and does not expect to be adversely affected by an inability to obtain materials.
International Operations
The Company currently conducts business in many countries including China, the Czech Republic, the Netherlands, Ireland, and Singapore, among others, in addition to its North America operations. During the year ended July 31, 2017, approximately 76% of the Company’s consolidated net revenue was generated internationally. Refer to Note 19 of the accompanying notes to consolidated financial statements included in Item 8 below.
The Company’s international operations increase its exposure to U.S. and foreign laws, regulations, and labor practices, which are often complex and subject to variation and unexpected changes, and with which the Company must comply. A substantial portion of our international business is conducted in China, where we face (i) the challenge of navigating a complex set of licensing and tax requirements and restrictions affecting the conduct of business in China by foreign companies, (ii) potential limitations on the repatriation of cash, (iii) foreign currency fluctuation and (iv) evolving tax laws.
Seasonality
The demand of our clients’ products is subject to seasonal consumer buying patterns. As a result, the services we provide to our clients are also subject to seasonality, with higher revenue and operating income typically being realized from handling our clients’ products during the first half of our fiscal year, which includes the holiday selling season.
Intellectual Property
The Company relies upon a combination of patent, trade secret, copyright and trademark laws to protect our intellectual property. From time to time, we develop new trade secrets and other intellectual property or obtain intellectual property through acquisition activities. Our business is not substantially dependent on any single or group of patents, trademarks, copyrights or licenses.
Employees
At July 31, 2017, we employed approximately 1,990 persons on a full-time basis, 330 in the Americas, 940 in Asia and 720 in Europe. Our subsidiaries in Mexico are parties to several collective bargaining agreements covering approximately 48 employees. Our subsidiary in France is party to collective bargaining agreements covering its employees. Approximately 50 of the employees of our Ireland operation are members of labor unions. As of August 2017, approximately 110 of the employees at one of our China operations are members of labor unions. We consider our employee relations to be good. From time to time we hire project-based, temporary workers based on our client needs and seasonality of our business, and at times the number of these workers may approximate the number of our full-time employees.
Our Corporate Information
We make our annual reports on Form 10-K, quarterly reports on Form 10-Q, current reports on Form 8-K and amendments to those reports available through our website, free of charge, as soon as reasonably practicable after we file such material with, or furnish it to, the Securities and Exchange Commission. Our internet address is http://www.moduslink.com. The contents of our website are not part of this annual report on Form 10-K, and our internet address is included in this document as an inactive textual reference only.
4
Table of Contents
| ITEM 1A.— | RISK FACTORS |
We operate in a rapidly changing environment that involves a number of risks, some of which are beyond our control. Forward-looking statements in this document and those we make from time to time through our senior management are made pursuant to the safe harbor provisions of the Private Securities Litigation Reform Act of 1995. Forward-looking statements concerning the expected future revenue or earnings or concerning projected plans, performance, or development of products and services, as well as other estimates related to future operations are necessarily only estimates of future results. We cannot assure you that actual results will not materially differ from expectations. Forward-looking statements represent our current expectations and are inherently uncertain. We do not undertake any obligation to update forward-looking statements. Factors that could cause actual results to differ materially from results anticipated in forward-looking statements include, but are not limited to, the following:
RISKS RELATED TO MODUSLINK’S SUPPLY CHAIN BUSINESS
We derive a substantial portion of our revenue and or profits from a small number of clients and adverse industry trends or the loss of one or more of any of those clients could significantly damage our business.
We derive a substantial portion of our revenue by providing supply chain management services to a small number of clients. Our business and future growth will continue to depend in large part on the industry trend towards outsourcing supply chain management and other business processes. If this trend does not continue or declines, demand for our supply chain management services will decline and our financial results could suffer.
In addition, the loss of a significant amount of business or program with any key client could cause our revenue and or profits to decline and our financial results could suffer.
For the fiscal year ended July 31, 2017, 2016 and 2015, the Company’s 10 largest clients accounted for approximately 70%, 71% and 76% of consolidated net revenue, respectively. Sales to Client A accounted for approximately 15%, 13%, and 10% of the Company’s consolidated net revenue for the fiscal years ended July 31, 2017, 2016 and 2015, respectively. Sales to Client B accounted for approximately 10%, 13%, and 19% of the Company’s consolidated net revenue for the fiscal years ended July 31, 2017, 2016 and 2015, respectively. We expect to continue to derive the vast majority of our consolidated net revenue and or profits from sales to a small number of key clients. In general, we do not have any agreements which obligate any client to buy a minimum amount of services from us, or to designate us as its sole supplier of any particular services. The loss of business with any key clients, or a decision by any one of our key clients to significantly change or reduce the services we provide, could have a material adverse effect on our business. Further, demand for our clients’ products is subject to ever-changing consumer tastes and depends on our client nimbleness in responding to these shifts by introducing improved and/or new products. If any of our key clients fail to respond successfully to market shifts, we would be adversely affected. We cannot assure you that our revenue and or profits from key clients will not decline in future periods.
In addition, ModusLink has been designated as an authorized replicator for Microsoft. This designation provides a license to replicate Microsoft software products and documentation for clients who want to bundle licensed software with their hardware products. This designation is annually renewable at Microsoft’s discretion. A failure to maintain authorized replicator status could have a material adverse effect on our business and our revenue.
We may have difficulty achieving and sustaining operating profitability, and if we deplete our working capital balances, our business will be materially and adversely affected.
For the fiscal years ended July 31, 2017 and 2016, we reported operating losses of $19.8 million and $40.6 million, respectively. Although we have reduced our cost of revenues and selling, general & administrative expenses, we anticipate that we may continue to incur significant fixed operating expenses in the future, including both cost of revenue and selling, general and administrative expenses. Therefore, since our revenue is subject to fluctuations, we cannot assure you that we will achieve or sustain operating income in the future. We may also use significant amounts of cash in an effort to increase the efficiency and profitability of our business. At July 31, 2017, we had consolidated cash and cash equivalents of approximately $110.7 million and current liabilities of approximately $149.2 million. If we are unable to achieve or sustain operating profitability, we risk depleting our working capital balances and our business will be materially adversely affected.
5
Table of Contents
Because our contracts do not contain minimum purchase requirements and we sell primarily on a purchase order basis, we are subject to uncertainties and variability in demand by clients, which could decrease revenue and materially adversely affect our financial results.
Our contracts generally do not contain minimum purchase requirements and we sell primarily on a purchase order basis. Therefore, our sales are subject to demand variability by our clients, which is difficult to predict, has fluctuated historically and may continue to fluctuate, sometimes materially from year to year and even from quarter to quarter. The level and timing of orders placed by these clients vary for a variety of reasons, including seasonal buying by end-users, individual client strategies, the introduction of new technologies, the desire of our clients to reduce their exposure to any single supplier and general economic conditions. If we are unable to anticipate and respond to the demands of our clients, we may lose clients because we have an inadequate supply of their products or insufficient capacity in our sites, or in the alternative, we may have excess inventory or excess capacity, either of which may have a material adverse effect on our business, financial position and operating results.
Disruption in the economy and financial markets could have a negative effect on our business.
The global economy and financial markets had experienced extreme disruption during the last several years, including, among other things, extreme volatility in securities prices and liquidity and credit availability, rating downgrades of certain investments and declining valuations of others. The businesses of our clients, and in turn our business, is highly dependent on consumer demand, which may been affected by an economic downturn, the volatility in securities prices and is highly uncertain. Governments have taken unprecedented actions intended to address these market conditions. However, there can be no assurance that there will not be deterioration in financial markets and confidence in major economies, which could then lead to challenges in the operation of our business. These economic developments affect businesses such as ours in a number of ways. The tightening of credit in financial markets adversely affects the ability of clients and suppliers to obtain financing for significant purchases and operations and could result in a decrease in orders and spending for our products and services. We are unable to predict the likelihood, duration and severity of disruptions in financial markets and adverse economic conditions and the effects they may have on our business and financial condition.
A decline in the technology and consumer products sectors or a reduction in consumer demand generally could have a material adverse effect on our business.
A large portion of our revenue comes from clients in the technology and consumer products sectors, which is intensely competitive, very volatile and subject to rapid changes. Declines in the overall performance of the technology and consumer products sectors have in the past and could in the future adversely affect the demand for supply chain management services and reduce our revenue and profitability from these clients. In addition, industry changes, such as the transition of more collateral materials from physical form to digital form, and the convergence of functionality of smart phones, could lessen the demand for certain of our services or devices we currently handle. To the extent recent uncertainty in the economy or other factors result in decreased consumer demand for our clients’ products, we may experience a reduction in volumes of client products that we handle, which could have a material adverse effect on our business, financial position and operating results.
Our quarterly results may fluctuate significantly.
Our operating results have fluctuated widely on a quarterly basis during the last several years. We expect that we may experience significant fluctuations in future quarterly operating results. Many factors, some of which are beyond our control, have contributed to these quarterly fluctuations in the past and may continue to contribute to fluctuations. Therefore, operating results for future periods are difficult to predict, and prior results are not necessarily indicative of results to be expected in future periods. These factors include:
| • | how well we execute on our strategy and operating plans; |
| • | implementation of our strategic initiatives and achievement of expected results of these initiatives; |
| • | demand for our services; |
| • | consumer confidence and demand; |
| • | specific economic conditions in the industries in which we compete; |
| • | general economic and financial market conditions; |
| • | timing of new product introductions or software releases by our clients or their competitors; |
| • | payment of costs associated with our acquisitions, sales of assets and investments; |
| • | timing of sales of assets and marketable securities; |
6
Table of Contents
| • | market acceptance of new products and services; |
| • | seasonality; |
| • | temporary shortages in supply from vendors; |
| • | charges for impairment of long-lived assets, including restructuring in future periods; |
| • | political instability or natural disasters in the countries in which we operate; |
| • | actual events, circumstances, outcomes, and amounts differing from judgments, assumptions, and estimates reflected in our accompanying consolidated financial statements; |
| • | changes in accounting rules; |
| • | changes in tax rules and regulations; |
| • | changes in labor laws; |
| • | availability of temporary labor and the variability of available rates for the temporary labor; |
| • | unionization of our labor and contract labor; and |
| • | implementation of automation. |
We believe that period-to-period comparisons of our results of operations will not necessarily be meaningful or indicative of our future performance. In some fiscal quarters our operating results may be below the expectations of securities analysts and investors, which may cause the price of our common stock to decline.
We must maintain adequate levels of inventory in order to meet client needs, which present risks to our financial position and operating results.
We must purchase and maintain adequate levels of inventory in order to meet client needs rapidly and on a timely basis. The markets, including the technology sector served by many of our clients, are subject to rapid technological change, new and enhanced product specification requirements, and evolving industry standards. These changes may cause inventory on hand to decline substantially in value or to rapidly become obsolete. The majority of our clients offer protection from the loss in value of inventory. However, our clients may become unable or unwilling to fulfill their protection obligations and the inability of our clients to fulfill their protection obligations could lower our gross margins and cause us to record inventory write-downs. If we are unable to manage the inventory on hand with our clients with a high degree of precision, we may have insufficient product supplies or we may have excess inventory, resulting in inventory write-downs, which may harm our business, financial position and operating results.
Our ability to obtain particular products or components in the quantities required to fulfill client orders on a timely basis is critical to our success. We have no guaranteed price or delivery agreements with our suppliers. We may occasionally experience a supply shortage of some products as a result of strong demand or problems experienced by our suppliers. If shortages or delays persist, the price of those products may increase, or the products may not be available at all. Accordingly, an inability to secure and maintain an adequate supply of products, packaging materials or components to fulfill our client orders on a timely basis, or a failure to meet clients’ expectations could result in lost revenue, lower client satisfaction, negative perceptions in the marketplace, potential claims for damages and have a material adverse effect on our business.
If we are not able to establish or maintain sites where requested, or if we fail to retain key clients at established sites, our client relationships, revenue and expenses could be seriously harmed.
Our clients have, at times, requested that we add capacity or open a facility in locations near their sites. If we do not elect to add required capacity at sites near existing clients, maintain sites or establish sites near existing or potential clients, clients may decide to seek other service providers. In addition, if we lose a significant client of a particular site or open or expand a site with the expectation of business that does not materialize, operations at that site could become unprofitable or significantly less efficient and we may need to incur restructuring costs. Any of these events could have a material adverse effect on our business, financial position and operating results.
We may encounter problems in our efforts to increase operational efficiencies.
We continue to seek to identify ways to increase efficiencies and productivity and effect cost savings. In addition to already undertaken projects designed to increase our operational efficiencies, including the standardization to a global solutions platform
7
Table of Contents
through an integrated ERP system, the opening of new solution centers in low cost areas to expand client offerings and to effect cost savings and the implementation of a model utilizing centralized “hub” locations to service multiple “spoke” locations across the Americas, Asia and Europe regions, our new executive team is continuing its review across the organization designed to improve our operations, including a commitment to automate certain facilities. We cannot assure you that these projects will result in the realization of the expected benefits that we anticipate in a timely manner or at all. We may encounter problems with these projects that will divert the attention of management and/or result in additional costs and unforeseen project delays. If we, or these projects do not achieve expected results, our business, financial position and operating results may be materially and adversely affected.
We are subject to risks of operating internationally.
We maintain significant operations outside of the United States, and we may expand these operations. Our success depends, in part, on our ability to manage these international operations. These international operations require significant management attention, financial resources and are subject to numerous and varied regulations worldwide, some of which may have an adverse effect on our ability to develop or maintain our international operations in accordance with our business plans or on a timely basis.
We currently conduct business in many countries including China, Czech Republic, the Netherlands, Ireland, and Singapore, among others, in addition to our United States operations. During the year ended July 31, 2017, approximately 76% of the Company’s consolidated net revenue was generated internationally. A portion of our international revenue, cost of revenue and operating expenses are denominated in foreign currencies. Changes in exchange rates between foreign currencies and the U.S. dollar may adversely affect our operating results. There is also additional risk if the foreign currency is not freely traded. Some currencies, such as the Chinese Renminbi, are subject to limitations on conversion into other currencies, which can limit or delay our ability to repatriate funds or engage in hedging activities. While we may enter into forward currency exchange contracts to manage a portion of our exposure to foreign currencies, future exchange rate fluctuations may have a material adverse effect on our business and operating results.
There are other risks inherent in conducting international operations, including:
| • | added fulfillment complexities in operations, including multiple languages, currencies, bills of materials and stock keeping units; |
| • | the complexity of ensuring compliance with multiple U.S. and foreign laws, particularly differing laws on intellectual property rights, export control, taxation and duties; and |
| • | labor practices, difficulties in staffing and managing foreign operations, political and social instability, health crises or similar issues, and potentially adverse tax consequences. |
In addition, a substantial portion of our business is conducted in China, where we face additional risks, including the following:
| • | the challenge of navigating a complex set of licensing and tax requirements and restrictions affecting the conduct of business in China by foreign companies; |
| • | difficulties and limitations on the repatriation of cash; |
| • | currency fluctuation and exchange rate risks; |
| • | protection of intellectual property, both for us and our clients; |
| • | evolving regulatory systems and standards, including recent tax law and labor law changes; |
| • | difficulty retaining management personnel and skilled employees; and |
| • | expiration of tax holidays. |
Our international operations increase our exposure to international laws and regulations. Noncompliance with foreign laws and regulations, which are often complex and subject to variation and unexpected changes, could result in unexpected costs and potential litigation. For example, the governments of foreign countries might attempt to regulate our products and services or levy sales or other taxes relating to our activities; foreign countries may impose tariffs, duties, price controls or other restrictions on foreign currencies or trade barriers; or a governmental authority could make an unfavorable determination regarding our operations, any of which could make it more difficult to conduct our business and have a material adverse effect on our business and operating results.
8
Table of Contents
If we are unable to manage these risks, we may face significant liability, our international sales may decline and our business, operating and financial results may be adversely affected.
We may be affected by strikes, work stoppages and slowdowns by our employees.
Some of our international employees are covered by collective bargaining agreements or represented by works councils or labor unions. We believe our relations with our employees are generally good; however, we may experience strikes, work stoppages or slowdowns by employees. A strike, work stoppage or slowdown may affect our ability to meet our clients’ needs, which may result in the loss of business and clients and have a material adverse effect on our financial condition and results of operations. The terms of future collective bargaining agreements also may affect our competitive position, our financial condition and results of operations.
Change in our effective tax rate may harm our results of operations.
A number of factors may increase our future effective tax rates, including:
| • | the jurisdictions in which profits are determined to be earned and taxed; |
| • | the resolution of issues arising from tax audits with various tax authorities; |
| • | changes in the valuation of our deferred tax assets and liabilities; |
| • | adjustments to estimated taxes upon finalization of various tax returns; |
| • | increases in expenses not deductible for tax purposes, including write-offs of acquired in-process R&D, impact of costs associated with business combinations and impairments of goodwill in connection with acquisitions; |
| • | changes in available tax credits; |
| • | changes in share-based compensation; |
| • | changes in tax laws or the interpretation of such tax laws, and changes in generally accepted accounting principles; |
| • | the repatriation of non-U.S. earnings for which we have not previously provided for U.S. taxes; |
| • | increases in tax rates in various jurisdictions; and |
| • | the expiration of tax holidays. |
Any significant increase in our future effective tax rates could reduce net income for future periods.
The gross margins in the Supply Chain Business are low, which magnify the impact of variations in revenue and operating costs on our financial results.
As a result of intense price competition in the technology products and consumer products marketplaces, the gross margins in our Supply Chain Business are low, and we expect them to continue to be low in the future. These low gross margins magnify the impact of variations in revenue and operating costs on our financial results. Increased competition arising from industry consolidation and/or low demand for products may hinder our ability to maintain or improve our gross margins. Portions of our operating expenses are relatively fixed, and planned expenditures are based in part on anticipated orders. Our current ability to forecast the amount and timing of future order volumes is difficult, and we expect this to continue because we are highly dependent upon the business needs of our clients, which are highly variable. As a result, we may not be able to reduce our operating expenses as a percentage of revenue to mitigate any further reductions in gross margins. We may also be required to spend money to restructure our operations should future demand fall significantly in one or more facilities. If we cannot proportionately decrease our cost structure in response to competitive price pressures, our business, financial condition and operating results could be adversely affected.
We continue to be subject to intense competition.
The markets for our services are highly competitive and often lack significant barriers to entry enabling new businesses to enter these markets relatively easily. Numerous well-established companies and smaller entrepreneurial companies are focusing significant resources on developing and marketing products and services that will compete with our offerings. The market for supply chain management products and services is very competitive, and the intensity of the competition is expected to continue to
9
Table of Contents
increase. Any failure to maintain and enhance our competitive position would limit our ability to maintain and increase market share, which could result in serious harm to our business. Increased competition may also result in price reductions, reduced gross margins and loss of market share. In addition, many of our current and potential competitors will continue to have greater financial, technical, operational and marketing resources. We may not be able to compete successfully against these competitors. Competitive pressures may also force prices for supply chain management products and services down and these price reductions may reduce our revenue. The competition we face may also increase as a result of consolidation within the supply chain management and logistics industries. For example, if as a result of consolidation, our competitors are able to obtain more favorable terms from their suppliers, offer more comprehensive services to their customers, or otherwise take actions that increase their competitive strengths, our competitive position and therefore our business, results of operations and financial condition may be materially adversely affected.
The trend toward outsourcing of supply chain management and logistics activities, either globally or within specific industries that we serve, may change, thereby reducing demand for our services.
Our growth strategy is partially based on the assumption that the trend toward outsourcing of supply chain management and logistics services will continue. Third-party service providers like ourselves are generally able to provide such services more efficiently than otherwise could be provided “in-house”, primarily as a result of our expertise and lower and more flexible employee cost structure. However, many factors could cause a reversal in the outsourcing trend. For example, our clients may see risks in relying on third-party service providers, or they may begin to define supply chain management and logistics activities as within their core competencies and decide to perform these operations themselves. If our clients are able to develop supply chain management expertise or improve the cost structure of their in-house supply chain activities, we may not be able to provide such clients with an attractive alternative for their supply chain management and logistics needs. If our clients in-source significant aspects of their supply chain operations, or if potential new clients decide to continue to perform their own supply chain activities in-house, our business, results of operations and financial condition may be materially adversely affected. In addition, if our current and potential clients choose to change their sourcing strategy, wherein they utilize multiple supply chain management and logistics service providers, this could have an adverse effect on our results of operations and financial condition.
The physical or intellectual property of our clients may be damaged, misappropriated, stolen or lost while in our possession, subjecting us to litigation and other adverse consequences.
In the course of providing supply chain management services to our clients, we often have possession of or access to their physical and intellectual property, including consigned inventory, databases, software masters, certificates of authenticity and similar valuable physical or intellectual property. If this physical or intellectual property is damaged, misappropriated, stolen or lost, we could suffer:
| • | claims under client agreements or applicable law, or other liability for damages; |
| • | delayed or lost revenue due to adverse client reaction; |
| • | negative publicity; and |
| • | litigation that could be costly and time consuming. |
We could be subject to infringement claims and other intellectual property disputes.
Our business employs a broad range of intellectual property and from time to time, we have been, and will continue to be, subject to third-party claims in the ordinary course of business, including claims of alleged infringement of intellectual property rights. These claims may damage our business by:
| • | subjecting us to significant liability for damages; |
| • | resulting in invalidation of our proprietary rights; |
| • | resulting in costly license fees in order to settle the claims; |
| • | being time-consuming and expensive to defend even if the claims are not meritorious; and |
| • | resulting in the diversion of our management’s time and attention. |
We may be liable if third parties misappropriate personal information of our clients or our clients’ customers.
We often handle personal information as part of our e-Business offering. Any security breach or inadvertent release of this information could expose us to risks of loss, litigation and liability and could seriously disrupt our operations. If third parties are
10
Table of Contents
able to penetrate our network or telecommunications security or otherwise misappropriate the personal information or credit card information of our clients’ customers or if we give third parties improper access to such information, we could be subject to liability. This liability could include claims for unauthorized purchases with credit card information, impersonation or other similar fraud claims. They could also include claims for other misuses of personal information, including unauthorized marketing purposes. These claims could result in litigation. Liability for misappropriation of this information could be significant. Further, any resulting adverse publicity arising from investigations could have a material adverse impact on our business.
We depend on third-party software, systems and services.
Our business and operations rely on third parties to provide products and services, including IT products and services, and shipping and transportation services. We may experience operational problems attributable to the installation, implementation, integration, performance, features or functionality of third-party software, systems and services. Any interruption in the availability or usage of the products and services provided by third parties could have a material adverse effect on our business or operations.
The funds held for clients may be subject to credit risk.
In the course of providing services to our clients, we at times have possession of client funds. The funds are maintained at financial institutions and the balances associated with these funds are at times without and in excess of federally insured limits. If these funds are impaired, misappropriated or stolen, we could suffer:
| • | claims under client agreements or applicable law, or other liability for damages; |
| • | delayed or lost revenue due to adverse client reaction; |
| • | negative publicity; and |
| • | litigation that could be costly and time consuming. |
Material disruption in our information systems could adversely affect our business or results of operations.
We rely on our information systems to process transactions on behalf of our clients, summarize our operating results and manage our business. Our information systems are subject to damage or interruption from power outages, computer and telecommunications failures, computer viruses, cyber-attack or other security breaches and catastrophic events such as fires, floods, earthquakes, tornadoes, hurricanes and acts of war or terrorism.
To keep pace with changing technology, we must continuously implement new information technology systems as well as enhance our existing systems. The successful execution of some of our growth strategies is dependent on the design and implementation of new systems and technologies and/or the enhancement of existing systems, in particular the expansion of our online e-commerce capabilities.
The reliability and capacity of our information systems is critical to our operations and the implementation of our growth initiatives. Any disruptions affecting our information systems, or delays or difficulties in implementing or integrating new systems, could have an adverse effect on our business, in particular our e-commerce operations, and results of operations.
OTHER RISKS ASSOCIATED WITH THE COMPANY
We may be unable to realize the benefits of our net operating loss carry-forwards (“NOLs”).
NOLs may be carried forward to offset federal and state taxable income in future years and eliminate income taxes otherwise payable on such taxable income, subject to certain adjustments. Based on current federal and state corporate income tax rates, our NOLs and other carry-forwards could provide a benefit to us, if fully utilized, of significant future tax savings. However, our ability to use these tax benefits in future years will depend upon the amount of our otherwise federal and state taxable income. If we do not have sufficient federal and state taxable income in future years to use the tax benefits before they expire, we will lose the benefit of these NOLs permanently. Consequently, in addition to dependence on the generation of future business profits, our ability to use the tax benefits associated with our substantial NOLs will depend significantly on our success in identifying suitable acquisition or investment candidates, and once identified, successfully consummating an acquisition of or investment in these candidates.
Additionally, federal NOLs are subject to annual limitations under the change of ownership rules within Section 382 of the Internal Revenue Code. In general, an ownership change occurs when the percentage of stock held by one or more 5-percent
11
Table of Contents
shareholders increases by more than 50 percentage points over the lowest stock ownership held by such shareholders at any time within a prescribed period, usually three years. If an ownership change were to occur, we may be unable to use a significant portion of our NOLs to offset taxable income. As discussed in Note 14 of the accompanying notes to consolidated financial statements included in Item 8 below, on October 17, 2011, the Company’s Board of Directors adopted a Tax Benefit Preservation Plan (“Tax Plan”) intended to reduce the likelihood that changes in the Company’s investor base have the unintended effect of limiting the Company’s use of its Tax Benefits. The Tax Plan is intended to require any person acquiring shares of the Company’s securities equal to or exceeding 4.99% of the Company’s outstanding shares to obtain the approval of the Board of Directors. This would protect the Tax Benefits because changes in ownership by a person owning less than 4.99% of the Company’s stock are considered and included in one or more public groups in the calculation of “ownership change” for purposes of Section 382 of the Code. However, there can be no assurance that the Tax Plan would be effective under all circumstances. On October 9, 2014, the Tax Plan was amended by our Board of Directors to extend the expiration of the Tax Plan until October 17, 2017. Following the stockholders’ approval of the Protective Amendment (as described in the following paragraphs) at the Company’s 2014 Annual Meeting, the Tax Plan was further amended so that it expired at the close of business on December 31, 2014.
On December 29, 2014, the Company filed an Amendment to its Restated Certificate of Incorporation (the “Protective Amendment”) with the Delaware Secretary of State to protect the significant potential long-term tax benefits presented by its net operating losses and other tax benefits (collectively, the “NOLs”). The Protective Amendment was approved by the Company’s stockholders at the Company’s 2014 Annual Meeting of Stockholders held on December 9, 2014. As a result of the filing of the Protective Amendment with the Delaware Secretary of State, the Company amended its Tax Benefit Preservation Plan so that it expired at the close of business on December 31, 2014.
The Protective Amendment limits certain transfers of the Company’s common stock, to assist the Company in protecting the long-term value of its accumulated NOLs. The Protective Amendment’s transfer restrictions generally restrict any direct or indirect transfers of the common stock if the effect would be to increase the direct or indirect ownership of the common stock by any person (as defined in the Protective Amendment) from less than 4.99% to 4.99% or more of the common stock, or increase the percentage of the common stock owned directly or indirectly by a Person owning or deemed to own 4.99% or more of the common stock. Any direct or indirect transfer attempted in violation of the Protective Amendment will be void as of the date of the prohibited transfer as to the purported transferee. The Board of Directors of the Company has discretion to grant waivers to permit transfers otherwise restricted by the Protective Amendment.
In accordance with the Protective Amendment, Handy & Harman (“HNH”), a related party, requested, and the Company granted HNH and its affiliates, a waiver under the Protective Amendment to permit their acquisition of up to 45% of the Company’s outstanding shares of common stock in the aggregate (subject to proportionate adjustment, the “45% Cap”), in addition to acquisitions of common stock in connection with the exercise of certain warrants of the Company (the “Warrants”) held by Steel Partners Holdings L.P. (“SPH”), an affiliate of HNH, as well as a limited waiver under Section 203 of the Delaware General Corporation Law for this purpose. Notwithstanding the foregoing, HNH and its affiliates (and any group of which HNH or any of its affiliates is a member) are not permitted to acquire securities that would result in an “ownership change” of the Company for purposes of Section 382 of the Internal Revenue Code of 1986, as amended, that would have the effect of impairing any of the Company’s NOLs. The foregoing waiver was approved by the independent directors of the Company.
The amount of NOLs that we have claimed has not been audited or otherwise validated by the U.S. Internal Revenue Service (“IRS”). The IRS could challenge our calculation of the amount of our NOLs or our determinations as to when a prior change in ownership occurred, and other provisions of the Internal Revenue Code may limit our ability to carry forward our NOLs to offset taxable income in future years. If the IRS was successful with respect to any such challenge, the potential tax benefit of the NOLs to us could be substantially reduced.
We may have problems raising or accessing capital we need in the future.
In recent years, we have financed our operations and met our capital requirements primarily through funds generated from operations, the sale of our securities and borrowings from lending institutions. Market and other conditions largely beyond our control may affect our ability to engage in future sales of our securities, the timing of any sales, and the amount of proceeds we receive from sales of our securities. Even if we are able to sell our securities in the future, we may not be able to sell at favorable prices or on favorable terms. In addition, this funding source may not be sufficient in the future, and we may need to obtain funding from outside sources. However, we may not be able to obtain funding from outside sources. In addition, even if we find outside funding sources, we may be required to issue to those outside sources securities with greater rights than those currently possessed by holders of our common stock. We may also be required to take other actions, which may lessen the value of our common stock or dilute our common stockholders, including borrowing money on terms that are not favorable to us or issuing
12
Table of Contents
additional shares of common stock. If we experience difficulties raising capital in the future, our business could be materially adversely affected.
If financial institutions that have extended credit commitments to us are adversely affected by the conditions of the U.S. and international capital markets, they may become unable to fund borrowings under their credit commitments to us, which could have an adverse impact on our ability to borrow funds, if needed, for working capital, capital expenditures, acquisitions and other corporate purposes.
We depend on important employees, and the loss of any of those employees may harm our business.
Our performance is substantially dependent on the performance of our executive officers and other key employees, as well as management of our subsidiaries. The familiarity of these individuals with technology and service-related industries makes them especially critical to our success. Our success is also dependent on our ability to attract, train, retain and motivate high quality personnel. Competition for highly qualified personnel is intense. The loss of the services of any of our executive officers or key employees may harm our business.
Our strategy of expanding our business through acquisitions of other businesses and technologies presents special risks.
We may expand our business in certain areas through the acquisition of businesses, technologies, products and services from other businesses. We may also seek to identify new business acquisition opportunities with existing or prospective taxable income, or from which we can realize capital gains. Acquisitions involve a number of special problems, including:
| • | the need to incur additional indebtedness, issue stock (which may have rights superior to the rights of our common stockholders and which may have a dilutive effect on our common stockholders) or use cash in order to complete the acquisition; |
| • | difficulty integrating acquired technologies, operations and personnel with the existing businesses; |
| • | diversion of management attention in connection with both negotiating the acquisitions and integrating the assets; |
| • | strain on managerial and operational resources as management tries to oversee larger operations; |
| • | the working capital needs for acquired companies may be significant; |
| • | we may acquire a new line of business in which we have no operating history and the success of such new business cannot be assured; |
| • | exposure to unforeseen liabilities of acquired companies; and |
| • | increased risk of costly and time-consuming litigation, including stockholder lawsuits. |
We may not be able to successfully address these problems. Our future operating results may depend to a significant degree on our ability to successfully identify suitable acquisitions, negotiate such acquisitions on acceptable terms, complete such transactions, integrate acquisitions and manage operations.
The price of our common stock has been volatile and may fluctuate.
The market price of our common stock has been and is likely to continue to be volatile. Our common stock has traded with a closing price as low as $1.21 per share and as high as $2.02 per share during the year ended July 31, 2017. Future market movements unrelated to our performance may adversely affect the market price of our common stock.
Steel Partners Holdings L.P. and its affiliates may have interests that conflict with the interests of our other stockholders and have significant influence over corporate decisions.
Steel Partners Holdings L.P. (“Steel Partners”), Handy & Harman, Ltd. (“HNH”), Steel Partners, Ltd. (“SPL”) and SPH Group Holdings LLC (“SPHG Holdings”) collectively owned greater than 37% of our outstanding capital stock as of July 31, 2017. Steel Partners, HNH, SPL and SPHG Holdings will be able to influence our management and affairs and all matters requiring stockholder approval, including the election of directors and approval of mergers, consolidations or the sale of all or substantially all of our assets. In addition, this concentration of ownership may have the effect of delaying or preventing a change in control of our Company and might adversely affect the market price of our Common Stock.
13
Table of Contents
On December 24, 2014, the Company entered into a Management Services Agreement with SP Corporate Services LLC (“SP Corporate”), effective as of January 1, 2015 (as amended, the “Management Services Agreement”). SP Corporate is an indirect wholly owned subsidiary of Steel Partners and is a related party. Pursuant to the Management Services Agreement, SP Corporate provided the Company and its subsidiaries with the services of certain employees, including certain executive officers, and other corporate services. The Management Services Agreement had an initial term of six months. On June 30, 2015, the Company entered into an amendment that extended the term of the Management Services Agreement to December 31, 2015 and provided for automatic renewal for successive one year periods, unless and until terminated in accordance with the terms set forth therein, which include, under certain circumstances, the payment by the Company of certain termination fees to SP Corporate. On March 10, 2016, the Company entered into a Second Amendment to the Management Services Agreement with SPH Services, Inc. (“SPH Services”) pursuant to which SPH Services assumed rights and responsibilities of SP Corporate and the services provided by SPH Services to the Company were modified pursuant to the terms of the amendment. SPH Services, which has since changed its name to Steel Services Ltd. (“Steel Services”) is the parent of SP Corporate and an affiliate of SPH Group Holdings LLC. On March 10, 2016, the Company entered into a Transfer Agreement with SPH Services pursuant to which the parties agreed to transfer to the Company certain individuals who provide corporate services to the Company.
During the year ended July 31, 2017, pursuant to the Management Services Agreement, the Company paid a fixed monthly fee of $175,000 in consideration for the services and incremental costs as incurred. Pursuant to a third amendment to the Management Services Agreement, effective September 1, 2017, the fixed monthly fee paid by the Company to Steel Services was reduced from $175,000 per month to $95,641 per month. The fees payable under the Management Services Agreement are subject to review and such adjustments as may be agreed upon by the parties.
Members of our Board of Directors also have significant interests in Steel Partners and its affiliates, which may create conflicts of interest.
Some of the members of our Board of Directors also hold positions with Steel Partners and its affiliates. Specifically, Warren G. Lichtenstein, our Chairman of the Board, is the Executive Chairman of the general partner of Steel Partners and holds various other positions with affiliates of Steel Partners. Glen M. Kassan, our Vice Chairman, is the managing director and operating partner of an affiliate of Steel Partners. As a result, these individuals may face potential conflicts of interest with each other and with our stockholders. They may be presented with situations in their capacity as our directors that conflict with their fiduciary obligations to Steel Partners and its affiliates, which in turn may have interests that conflict with the interests of our other stockholders.
We may incur non-cash impairment charges related to long-lived assets.
We test long-lived assets for impairment if a triggering event occurs. Long-lived asset impairment analysis and measurement is a process that requires significant judgment and the use of significant estimates related to valuation such as discount rates, long-term growth rates and the level and timing of future cash flows. As a result, several factors could result in the impairment of some or all of our long-lived assets in future periods, including, but not limited to further weakening of the global economy, continued weakness in the industry, or failure of the Company to reach our internal forecasts which could impact our ability to achieve our forecasted levels of cash flows.
It is not possible at this time to determine if any such future impairment charge would result from these factors, or if it does, whether such charges would be material. We will continue to review our long-lived assets for possible impairment. We cannot be certain that a downturn in our business or changes in market conditions will not result in an impairment of long-lived assets and the recognition of resulting expenses in future periods, which could adversely affect our results of operations for those periods.
Investing in securities is risky and speculative.
We invest in Trading Securities and Available-for-Sale securities. Our ability to earn returns on our investment, or even recover our capital, is dependent upon factors outside of our control, including the success of our portfolio companies’ businesses, and the market. We typically own a minority position in our portfolio companies, which may afford us representation on the board of directors of a portfolio company, but does not give us control over the entity. As a result we may have limited, if any, influence over our portfolio companies’ businesses and strategies. We cannot assure you that we will earn any returns or recover our invested capital.
14
Table of Contents
Future proxy contests could be disruptive and costly and the possibility that activist stockholders may wage proxy contests or gain representation on or control of our Board of Directors could cause uncertainty about the direction of our business.
Future proxy contests, if any, could be costly and time-consuming, disrupt our operations and divert the attention of management and our employees from executing our strategic plan. Perceived uncertainties as to our future direction as a result of changes to composition of the Board of Directors may lead to the perception of a change in the direction of the business, instability or lack of continuity which may be exploited by our competitors, cause concern to our current or potential clients, and make it more difficult to attract and retain qualified personnel. In addition, disagreement among our directors about the direction of our business could impair our ability to effectively execute our strategic plan.
Litigation pending against us could materially impact our business and results of operations.
We are currently a party to various legal and other proceedings. See Item 3, Legal Proceedings. These matters may involve substantial expense to us, which could have a material adverse impact on our financial position and our results of operations. We can provide no assurances as to the outcome of any litigation.
Management’s determination that a material weakness exists in our internal controls over financial reporting could have a material adverse impact on the Company.
We are required to maintain internal control over financial reporting to provide reasonable assurance regarding the reliability of financial reporting and the preparation of our financial statements for external purposes in accordance with generally accepted accounting principles. In Item 9A of this Annual Report, management reports that a material weakness exists in the Company’s internal control over financial reporting. Due to this material weakness, management has concluded that as of the end of the period covered by this Annual Report, the Company did not maintain effective internal control over financial reporting based on the criteria in Internal Control—Integrated Framework (2013) issued by the Committee of Sponsoring Organizations of the Treadway Commission. We are actively engaged in developing and implementing a remediation plan designed to address this material weakness. Any failure to implement effective internal controls could harm our operating results or cause us to fail to meet our reporting obligations. Inadequate internal controls, among other things, could also cause investors to lose confidence in our reported financial information, which could have a negative effect on the trading price of our common stock, and may require us to incur additional costs to improve our internal control system.
RISKS RELATED TO OUR 5.25% SENIOR CONVERTIBLE NOTES
Servicing our debt requires a significant amount of cash, and we may not have sufficient cash flow from our business to pay our substantial debt.
Our ability to make scheduled payments of the principal of, to pay interest on or to refinance our indebtedness, including relating to the Company’s outstanding balance of the 5.25% Convertible Senior Notes (the “Notes”), depends on our financial and operating performance, which is subject to economic, financial, competitive and other factors, some which are beyond our control. We cannot assure you that we will be able to generate cash flow or that we will be able to borrow funds in amounts sufficient to enable us to service our debt, meet working capital requirements and make necessary capital expenditures. If we are unable to generate such cash flow, we may be required to adopt one or more alternatives, such as selling assets, restructuring debt or obtaining additional equity capital on terms that may be onerous or highly dilutive. Our ability to refinance our indebtedness will depend on the capital and credit markets and our financial condition at such time. We may not be able to engage in any of these activities or engage in these activities on desirable terms, which could result in a default on our debt obligations.
In addition, holders of the Notes may convert all or any portion of their notes at their option at any time prior to the close of business or the business day immediately preceding their maturity date. This conversion may lessen the value of our common stock and/or dilute our common stockholders.
Despite existing debt levels, we may incur substantially more debt, which would increase the risks associated with our leverage.
We, and our subsidiaries may be able to incur substantial additional debt in the future, subject to the restrictions contained in our debt instruments at that time, some of which may be secured debt. The indenture governing the Notes (Note 9 of the accompanying notes to consolidated financial statements included in Item 8 below) does not contain any financial or operating covenants or restrictions on the payment of dividends, the incurrence of indebtedness, transactions with affiliates, incurrence of liens or the issuance or repurchase of securities by us or any of our subsidiaries. As a result, we will not be restricted under the terms of the indenture governing the notes from incurring additional debt, securing existing or future debt or recapitalizing our debt. If new debt is added to our and our subsidiaries’ current debt levels, the related risks that we, and they now face could intensify and could further exacerbate the risks associated with our leverage.
15
Table of Contents
ITEM 1B.— UNRESOLVED STAFF COMMENTS
None.
We lease or own more than 20 sites in several countries from which we operate ModusLink, which facilities consist of office and warehouse space. These facilities are located throughout the world, including, but not limited to, facilities throughout the United States (including our corporate headquarters in Waltham, Massachusetts), in Mexico, the Netherlands, Czech Republic, Singapore, Japan and China. e-Business operates from its leased facilities in the Netherlands with offices in Massachusetts, Utah, Singapore and Australia. We believe that our existing facilities are suitable and adequate for our present purposes, and that new facilities will be available in the event we need additional or new space.
Our leases generally expire at varying dates through fiscal year 2022 and include renewals at our option. Certain facilities leased by us are subleased in whole or in part to subtenants and we are seeking to sublease additional office and warehouse space that is not currently being utilized by us.
On June 8, 2015, Sean Peters, a former employee filed a complaint (the “Complaint”) against ModusLink Corporation (together, the “parties”) in Superior Court of California asserting claims, among other things, for failure to pay wages, breach of contract, wrongful retaliation and termination, fraud, violations of California Business and Professions Code Section 17200, et seq., and civil penalties pursuant to California Labor Code Sections and pursuant to the California Private Attorney General Act, seeking over $1.0 million in damages, attorneys’ fees and costs and penalties. ModusLink filed an Answer to the Complaint making a general denial and asserting various affirmative defenses. The parties agreed to mediate the matter and on June 29, 2017, the parties attended a confidential mediation. At mediation ModusLink Corporation and its insurance carrier agreed to pay an immaterial amount to settle the matter.
On May 12, 2017, the Excise Tax Branch of the Internal Revenue Service issued a claim associated with the Company’s compliance with the self-assessment of excise tax on Ozone Depleting Chemicals. The Company is objecting to the assessment on a number of technical and substantive grounds, and plans to vigorously defend itself against this claim. Currently the Company is unable to determine the probability of an unfavorable outcome or a range of outcomes. Accordingly, the Company has not recorded a reserve associated with this matter.
ITEM 4.— MINE SAFETY DISCLOSURES
Not Applicable.
16
Table of Contents
| ITEM 5.— | MARKET FOR REGISTRANT’S COMMON EQUITY, RELATED STOCKHOLDER MATTERS AND ISSUER PURCHASES OF EQUITY SECURITIES |
Market Information
Our common stock is traded on the NASDAQ Global Select Market under the symbol “MLNK”. The following table sets forth the range of high and low closing stock prices per share of common stock per fiscal quarter, as reported by the NASDAQ for our two most recent fiscal years.
| Fiscal Year Ended July 31, 2017 |
High | Low | ||||||
| First Quarter |
$ | 1.68 | $ | 1.21 | ||||
| Second Quarter |
$ | 2.02 | $ | 1.35 | ||||
| Third Quarter |
$ | 1.89 | $ | 1.41 | ||||
| Fourth Quarter |
$ | 1.72 | $ | 1.51 | ||||
| Fiscal Year Ended July 31, 2016 |
High | Low | ||||||
| First Quarter |
$ | 3.24 | $ | 2.72 | ||||
| Second Quarter |
$ | 2.89 | $ | 2.07 | ||||
| Third Quarter |
$ | 2.13 | $ | 1.41 | ||||
| Fourth Quarter |
$ | 1.53 | $ | 1.07 | ||||
Stockholders
As of July 31, 2017, there were approximately 344 holders of record of common stock of the Company.
Dividends
Prior and subsequent to the special cash dividend announced on March 7, 2011, the Company had never declared or paid cash dividends on our common stock. We currently intend to retain earnings, if any, to support our business and do not anticipate paying cash dividends in the foreseeable future. Payment of future dividends, if any, will be at the discretion of our Board of Directors, after taking into account various factors, including our financial condition, operating results, any restrictions on payment of dividends under our credit facility, current and anticipated cash needs and plans for expansion.
Recent sales of Unregistered Securities
None.
Issuer Purchases of Equity Securities
The following table provides information about purchases by the Company of its common stock during the quarter ended
July 31, 2017.
| Total Number of Shares Repurchased |
Average Price Paid Per Share |
Total Number of
Shares Purchased as Part of Publicly Announced Plans or Program |
Approximate Dollar Value of Shares that May Yet Be Purchased Under the Plans or Programs |
|||||||||||||
| May 1, 2017 to May 31, 2017 |
— | $ | — | — | — | |||||||||||
| June 1, 2017 to June 30, 2017 |
— | $ | — | — | — | |||||||||||
| July 1, 2017 to July 31, 2017 |
— | $ | — | — | — | |||||||||||
17
Table of Contents
Stock Performance Graph
The following graph shows the yearly change in the cumulative total stockholder return on our common stock from July 31, 2012 through July 31, 2017, with the cumulative total return of the 1) NASDAQ Composite Index (U.S. companies), 2) the NASDAQ Computer Services Index, and 3) our chosen industry peer group during the same period. The graph reflects reinvestment of dividends and market capitalization weighting. Our Peer Group Index is comprised of the following publicly traded companies: Plexus Corp., Benchmark Electronics, Inc., Jabil Circuit, Inc., Key Tronic Corporation, IEC Electronics Corp, Egain Corp., Ingram Micro Corp. The graph assumes an investment of $100 on July 31, 2012, and the reinvestment of any dividends, if any. The comparison shown in the graph below are based upon historical data.
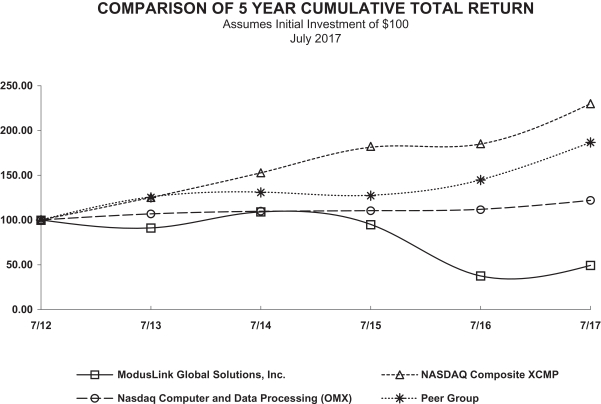
| Fiscal year ending July 31, | ||||||||||||||||||||||||
| 2012 | 2013 | 2014 | 2015 | 2016 | 2017 | |||||||||||||||||||
| ModusLink Global Solutions, Inc. |
100.00 | 90.94 | 109.06 | 95.03 | 37.43 | 49.12 | ||||||||||||||||||
| NASDAQ Composite XCMP |
100.00 | 125.15 | 152.69 | 181.26 | 184.74 | 229.84 | ||||||||||||||||||
| NASDAQ Computer and Data Processing (OMX) |
100.00 | 106.72 | 109.62 | 110.23 | 111.95 | 121.69 | ||||||||||||||||||
| Peer Group |
100.00 | 125.72 | 131.19 | 127.50 | 144.84 | 186.72 | ||||||||||||||||||
The unit price performance included in this graph is not necessarily indicative of future unit price performance.
This graph is not “soliciting material,” is not deemed “filed” with the SEC and is not to be incorporated by reference in any of our filings under the Securities Act or the Exchange Act whether made before or after the date hereof and irrespective of any general incorporation language in any such filing.
Equity Compensation Plans
Information regarding the Company’s equity compensation plans and the securities authorized for issuance thereunder is set forth in Item 12 of Part III.
18
Table of Contents
ITEM 6.— SELECTED FINANCIAL DATA
The following table sets forth selected consolidated financial information of the Company for the five years ended July 31,
2017. The following selected consolidated financial data should be read in conjunction with “Management’s Discussion and Analysis of Financial Condition and Results of Operations” in Item 7 below and our accompanying consolidated financial statements and notes to consolidated financial statements in Item 8 below. The historical results presented herein are not necessarily indicative of future results.
| Years ended July 31, | ||||||||||||||||||||
| 2017 | 2016 | 2015 | 2014 | 2013 | ||||||||||||||||
| (In thousands) | ||||||||||||||||||||
| Consolidated Statements of Operations Data: |
||||||||||||||||||||
| Net revenue |
$ | 436,620 | $ | 459,023 | $ | 561,673 | $ | 723,400 | $ | 754,504 | ||||||||||
|
|
|
|
|
|
|
|
|
|
|
|||||||||||
| Operating loss |
(19,761 | ) | (40,572 | ) | (14,339 | ) | (5,449 | ) | (28,232 | ) | ||||||||||
|
|
|
|
|
|
|
|
|
|
|
|||||||||||
| Loss from continuing operations |
(25,827 | ) | (61,281 | ) | (18,429 | ) | (16,362 | ) | (39,330 | ) | ||||||||||
| Income (loss) from discontinued operations |
— | — | — | 80 | (1,025 | ) | ||||||||||||||
|
|
|
|
|
|
|
|
|
|
|
|||||||||||
| Net loss |
$ | (25,827 | ) | $ | (61,281 | ) | $ | (18,429 | ) | $ | (16,282 | ) | $ | (40,355 | ) | |||||
|
|
|
|
|
|
|
|
|
|
|
|||||||||||
| Basic and diluted loss per share: |
||||||||||||||||||||
| Loss from continuing operations |
$ | (0.47 | ) | $ | (1.18 | ) | $ | (0.35 | ) | $ | (0.32 | ) | $ | (0.84 | ) | |||||
| Income (loss) from discontinued operations |
— | — | — | — | (0.02 | ) | ||||||||||||||
|
|
|
|
|
|
|
|
|
|
|
|||||||||||
| Net loss |
$ | (0.47 | ) | $ | (1.18 | ) | $ | (0.35 | ) | $ | (0.32 | ) | $ | (0.86 | ) | |||||
|
|
|
|
|
|
|
|
|
|
|
|||||||||||
| Weighted average common shares outstanding—basic and diluted |
55,134 | 51,934 | 51,940 | 51,582 | 46,654 | |||||||||||||||
| July 31, | ||||||||||||||||||||
| 2017 | 2016 | 2015 | 2014 | 2013 | ||||||||||||||||
| Consolidated Balance Sheet Data: |
||||||||||||||||||||
| Working capital |
$ | 108,691 | $ | 125,125 | $ | 202,289 | $ | 207,174 | $ | 114,655 | ||||||||||
| Total assets |
281,298 | 347,932 | 446,502 | 451,646 | 343,696 | |||||||||||||||
| Long-term liabilities |
69,172 | 67,226 | 90,548 | 81,434 | 10,360 | |||||||||||||||
| Stockholders’ equity |
62,971 | 85,940 | 144,601 | 171,618 | 156,905 | |||||||||||||||
19
Table of Contents
| ITEM 7.— | MANAGEMENT’S DISCUSSION AND ANALYSIS OF FINANCIAL CONDITION AND RESULTS OF OPERATIONS |
This Annual Report on Form 10-K contains forward-looking statements within the meaning of Section 21E of the Securities Exchange Act of 1934, as amended, and Section 27A of the Securities Act of 1933, as amended. For this purpose, any statements contained herein that are not statements of historical fact may be deemed to be forward-looking statements. Without limiting the foregoing, the words “believes,” “anticipates,” “plans,” “expects” and similar expressions are intended to identify forward-looking statements. Factors that could cause actual results to differ materially from those reflected in the forward-looking statements include, but are not limited to, those discussed in Item 1A of this report, “Risk Factors”, and elsewhere in this report. Readers are cautioned not to place undue reliance on these forward-looking statements, which reflect management’s analysis, judgment, belief or expectation only as of the date hereof. We do not undertake any obligation to update forward-looking statements whether as a result of new information, future events or otherwise.
Overview
ModusLink Global Solutions, Inc. provides comprehensive physical and digital supply chain optimization services (the “Supply Chain Business”) that are designed to improve clients’ revenue, cost, sustainability and customer experience objectives. We provide services to leading companies across a wide spectrum of industries, including consumer electronics, communications, computing, medical devices, software, and retail, among others. The Supply Chain Business operations are supported by a global footprint that includes more than 20 sites across North America, Europe, and the Asia Pacific region.
We operate an integrated physical and digital supply chain system infrastructure that extends from front-end order management through distribution and returns management. This end-to-end solution enables clients to link supply and demand in real-time, improve visibility and performance throughout the supply chain, and provide real-time access to information for greater collaboration and making informed business decisions. We believe that our clients can benefit from our global integrated business solution, especially given the increased usage of connected devices and digitalized solutions.
Historically, a significant portion of our revenue from our Supply Chain Business has been generated from clients in the computer and software markets. These markets, while large in size, are mature and, as a result, gross margins in these markets tend to be lower than other markets the Company operates in. To address this, in addition to the computer and software markets, we have expanded our sales focus to include additional markets such as communications and consumer electronics, with a long-term focus on expanding in growth industries, such as the connected home, and connected healthcare, among others. We believe these markets, and other verticals we operate in, may experience faster growth than our historical markets, and represent opportunities to realize higher gross margins on the services we offer. Companies in these markets often have significant need for a supply chain partner who will be an extension to their business models. We believe the scope of our service offerings, including value-added warehousing and distribution, repair and recovery, aftersales, returns management, financial management, entitlement management, contact center support, material planning and factory supply, and e-Business will increase the overall value of the supply chain solutions we deliver to our existing clients and to new clients.
Many of our clients’ products are subject to seasonal consumer buying patterns. As a result, the services we provide to our clients are also subject to seasonality, with higher revenue and operating income typically being realized from handling our clients’ products during the first half of our fiscal year, which includes the holiday selling season. Furthermore, many of our clients’ have global operations and we believe they have been adversely impacted by continued economic pressures in certain global regions.
Management evaluates operating performance based on net revenue, operating income (loss) and net income (loss) and a measure that we refer to as Adjusted EBITDA, defined as net income (loss) excluding net charges related to interest income, interest expense, income tax expense, depreciation, amortization of intangible assets, SEC inquiry and financial restatement costs, SEC penalties on resolution, strategic consulting and other related professional fees, executive severance and employee retention, restructuring, share-based compensation, impairment of goodwill and long-lived assets, unrealized foreign exchange gains and losses, net, other non-operating gains and losses, net, and gains and losses on investments in affiliates and impairments. Among the key factors that will influence our performance are successful execution and implementation of our strategic initiatives, global economic conditions, especially in the technology sector, which comprises a predominant proportion of our business, demand for our clients’ products, the effect of product form factor changes, technology changes, revenue mix and demand for outsourcing services.
As a large portion of our revenue comes from outsourcing services provided to clients such as retail products and consumer electronics companies, our operating performance has been and may continue to be adversely affected by declines in the overall
20
Table of Contents
performance within these sectors and uncertainty affecting the world economy. In addition, the drop in consumer demand for products of certain clients has had and may continue to have the effect of reducing our volumes and adversely affecting our revenue, gross margin and overall operating performance. Additionally, the markets for our services are generally very competitive, though we believe we have a compelling and differentiated offering due to the value-added services we provide, our commitment to client management, and our global reach. We also face pressure from our clients to continually realize efficiency gains in order to help our clients maintain their profitability objectives. Increased competition and client demands for efficiency improvements may result in price reductions, reduced gross margins and, in some cases, loss of market share. In addition, our profitability varies based on the types of services we provide and the regions in which we perform them. Therefore, the mix of revenue derived from our various services and locations can impact our gross margin results. Also, form factor changes, which we describe as the reduction in the amount of materials and product components used in our clients’ completed packaged product, can also have the effect of reducing our revenue and gross margin opportunities. As a result of these competitive and client pressures the gross margins in our business are low. We have developed plans and will continue to monitor plans to address process improvements and realize other efficiencies throughout our global footprint with a goal to reduce cost, remove waste and improve our overall gross margins. There can be no assurance that these actions will improve gross margins. For the years ended July 31, 2017, 2016 and 2015, our gross margin percentage was 8.3%, 5.4% and 9.7%, respectively. Increased competition as well as industry consolidation and/or low demand for our clients’ products and services may hinder our ability to maintain or improve our gross margins, profitability and cash flows. We must continue to focus on margin improvement, through implementation of our strategic initiatives, cost reductions and asset and employee productivity gains in order to improve the profitability of our business and maintain our competitive position. We generally manage margin and pricing pressures in several ways, including efforts to target new markets, expand and enhance our service offerings, improve the efficiency of our processes and to lower our infrastructure costs. We seek to lower our cost to service clients by moving work to lower-cost venues, consolidating and leveraging our global facility footprint, drive process and efficiency reforms and other actions designed to improve the productivity of our operations.
Historically, a limited number of key clients have accounted for a significant percentage of our revenue. For the fiscal year ended July 31, 2017, 2016 and 2015, the Company’s 10 largest clients accounted for approximately 70%, 71% and 76% of consolidated net revenue, respectively. Sales to Client A accounted for approximately 15%, 13%, and 10% of the Company’s consolidated net revenue for the fiscal years ended July 31, 2017, 2016 and 2015, respectively. Sales to Client B accounted for approximately 10%, 13%, and 19% of the Company’s consolidated net revenue for the fiscal years ended July 31, 2017, 2016 and 2015, respectively. The Europe reportable segment reports revenue associated with Client A. All four reportable segment report revenues associated with Client B. We expect to continue to derive the vast majority of our revenue from sales to a small number of key clients, and we plan to expand into new markets and over time, diversify the concentration of revenue across additional clients. In general, we do not have any agreements which obligate any client to buy a minimum amount of services from us or designate us as an exclusive service provider. Consequently, our net revenue is subject to demand variability by our clients. The level and timing of orders placed by our clients vary for a variety of reasons, including seasonal buying by end-users, the introduction of new technologies and general economic conditions. By diversifying into new markets and improving the operational support structure for our clients, we expect to offset the adverse financial impact such factors may bring about.
For the fiscal year ended July 31, 2017, the Company reported net revenue of $436.6 million, an operating loss of $19.8 million, a loss before income taxes of $24.4 million and a net loss of $25.8 million. For the fiscal year ended July 31, 2016, the Company reported net revenue of $459.0 million, an operating loss of $40.6 million, a loss before income taxes of $56.6 million and net a loss of $61.3 million. For the fiscal year ended July 31, 2015, the Company reported net revenue of $561.7 million, an operating loss of $14.3 million, a loss before income taxes of $16.4 million and a net loss of $18.4 million. At July 31, 2017, we had cash and cash equivalents of $110.7 million, and working capital of $108.7 million.
Basis of Presentation
The Company presents its financial information in accordance with accounting principles generally accepted in the United States, U.S. GAAP (or “GAAP”). The Company has four operating segments: Americas; Asia; Europe and e-Business. The Company has four reportable segments: Americas; Asia; Europe; and e-Business. The Company also has Corporate-level activity, which consists primarily of costs associated with certain corporate administrative functions such as legal and finance which are not allocated to the Company’s reportable segments and administration costs related to the Company’s venture capital activities. The corporate-level balance sheet information includes cash and cash equivalents, trading securities, investments in affiliates, notes payables and other assets and liabilities which are not identifiable to the operations of the Company’s operating segments.
All significant intercompany transactions and balances have been eliminated in consolidation.
21
Table of Contents
Results of Operations
Fiscal Year 2017 compared to Fiscal Year 2016
Net Revenue:
| Twelve Months Ended July 31, 2017 |
As a % Total Net Revenue |
Twelve Months Ended July 31, 2016 |
As a % of Total Net Revenue |
$ Change | % Change | |||||||||||||||||
| (In thousands) | ||||||||||||||||||||||
| Americas |
$ | 92,324 | 21.1% | $ | 106,143 | 23.1 | % | $ | (13,819 | ) | (13.0 | %) | ||||||||||
| Asia |
158,048 | 36.2% | 167,861 | 36.6 | % | (9,813 | ) | (5.8 | %) | |||||||||||||
| Europe |
159,085 | 36.4% | 151,842 | 33.1 | % | 7,243 | 4.8 | % | ||||||||||||||
| e-Business |
27,163 | 6.3% | 33,177 | 7.2 | % | (6,014 | ) | (18.1 | %) | |||||||||||||
|
|
|
|
|
|
|
|||||||||||||||||
| Total |
$ | 436,620 | 100.0% | $ | 459,023 | 100.0 | % | $ | (22,403 | ) | (4.9 | %) | ||||||||||
|
|
|
|
|
|
|
|||||||||||||||||
Net revenue decreased by approximately $22.4 million during the year ended July 31, 2017, as compared to the same period in the prior year. This change in net revenue was primarily driven by decreased revenues from two clients in the consumer electronics industry, one of which had a significant impact on revenues in the Americas and the other which impacted revenues in Asia, as discussed below. Fluctuations in foreign currency exchange rates had an insignificant impact on net revenues for the year ended July 31, 2017.
During the year ended July 31, 2017, net revenue in the Americas region decreased by approximately $13.8 million. This change in net revenue was primarily driven by decreased revenues from a client in the consumer electronics market. Within the Asia region, the net revenue decrease of approximately $9.8 million primarily resulted from lower revenues from a program in the consumer electronics market, partially offset by higher revenues from another consumer electronics program. Within the Europe region, net revenue increased by approximately $7.2 million primarily due to higher revenues from clients in the consumer electronics industry. Net revenue for e-Business decreased by approximately $6.0 million primarily due to lower revenues from clients in the consumer electronics industry.
Cost of Revenue:
| Twelve Months Ended July 31, 2017 |
As a
% of Segment Net Revenue |
Twelve Months Ended July 31, 2016 |
As a % of Segment Net Revenue |
$ Change | % Change | |||||||||||||||||||
| (In thousands) | ||||||||||||||||||||||||
| Americas |
$ | 91,622 | 99.2 | % | $ | 107,057 | 100.9 | % | $ | (15,435 | ) | (14.4 | %) | |||||||||||
| Asia |
131,760 | 83.4 | % | 145,900 | 86.9 | % | (14,140 | ) | (9.7 | %) | ||||||||||||||
| Europe |
151,305 | 95.1 | % | 147,929 | 97.4 | % | 3,376 | 2.3 | % | |||||||||||||||
| e-Business |
25,568 | 94.1 | % | 33,379 | 100.6 | % | (7,811 | ) | (23.4 | %) | ||||||||||||||
|
|
|
|
|
|
|
|||||||||||||||||||
| Total |
$ | 400,255 | 91.7 | % | $ | 434,265 | 94.6 | % | $ | (34,010 | ) | (7.8 | %) | |||||||||||
|
|
|
|
|
|
|
|||||||||||||||||||
Cost of revenue consists primarily of expenses related to the cost of materials purchased in connection with the provision of supply chain management services as well as costs for salaries and benefits, contract labor, consulting, fulfillment and shipping, and applicable facilities costs. Cost of revenue for the year ended July 31, 2017 included materials procured on behalf of our clients of $250.6 million, or 57.4% of consolidated net revenue, as compared to $265.6 million, or 57.9% of consolidated net revenue for the same period in the prior year, a decrease of $15.0 million. Total cost of revenue decreased by $34.0 million for the year ended July 31, 2017, as compared to the year ended July 31, 2016, primarily due to the decline in volume as well as reductions in labor and facility costs related to the Company’s turnaround initiatives. The Company’s focus on operational and process enhancements, coupled with improved productivity had a positive impact on supply chain management and expenses related to cost of revenue.
Gross margin increased to 8.3% for the year ended July 31, 2017, from 5.4% for the year ended July 31, 2016, primarily as a result of more effective supply chain management, improved processes and efficiencies which are directly attributable to the Company’s turnaround plan, and client mix, partially offset by the reduction in revenues. For the year ended July 31, 2017, the Company’s gross margin percentages within the Americas, Asia, Europe and e-Business were 0.8%, 16.6%. 4.9% and 5.9%, as compared to -0.9%, 13.1%. 2.6% and -0.6%, respectively, for the same period of the prior year. Furthermore, fluctuations in foreign currency exchange rates had an insignificant impact on gross margin for the year ended July 31, 2017.
22
Table of Contents
In the Americas, the 1.7 percentage point increase in gross margin, from -0.9% to 0.8%, resulted from a decline in material costs, reduction in force and other cost reductions related to the Company’s turnaround plan, partially offset by a decline in revenues and increased facility costs. In Asia, the 3.5 percentage point increase, from 13.1% to 16.6% was primarily resulted from a decline in materials costs, reduction in force and an improved client and product mix, partially offset by a decline in revenues. In Europe, the 2.3 percentage point increase in gross margin, from 2.6% to 4.9%, resulted from an increase in revenues, as well as a more efficient use of temporary labor. The gross margin for e-Business was 5.9% for the year ended July 31, 2017 as compared to -0.6% for the same period of the prior year. This favorable increase was primarily due reduced labor cost as a percentage of revenue and improved client mix, partially offset by a decline in revenues. All of the Company’s business segments had improved gross margins in the fiscal year 2017 compared to the prior year.
Selling, General and Administrative Expenses:
| Twelve Months Ended July 31, 2017 |
As a % of Segment Net Revenue |
Twelve Months Ended July 31, 2016 |
As a % of Segment Net Revenue |
$ Change | % Change | |||||||||||||||||||
| (In thousands) | ||||||||||||||||||||||||
| Americas |
$ | 10,706 | 11.6 | % | $ | 11,932 | 11.2 | % | $ | (1,226 | ) | (10.3 | %) | |||||||||||
| Asia |
19,850 | 12.6 | % | 20,569 | 12.3 | % | (719 | ) | (3.5 | %) | ||||||||||||||
| Europe |
16,165 | 10.2 | % | 15,174 | 10.0 | % | 991 | 6.5 | % | |||||||||||||||
| e-Business |
2,592 | 9.5 | % | 3,152 | 9.5 | % | (560 | ) | (17.8 | %) | ||||||||||||||
|
|
|
|
|
|
|
|||||||||||||||||||
| Sub-total |
49,313 | 11.3 | % | 50,827 | 11.1 | % | (1,514 | ) | (3.0 | %) | ||||||||||||||
| Corporate-level activity |
4,846 | 6,777 | (1,931 | ) | (28.5 | %) | ||||||||||||||||||
|
|
|
|
|
|
|
|||||||||||||||||||
| Total |
$ | 54,159 | 12.4 | % | $ | 57,604 | 12.5 | % | $ | (3,445 | ) | (6.0 | %) | |||||||||||
|
|
|
|
|
|
|
|||||||||||||||||||
Selling, general and administrative expenses consist primarily of compensation and employee-related costs, sales commissions and incentive plans, information technology expenses, travel expenses, facilities costs, consulting fees, fees for professional services, depreciation expense and marketing expenses. Selling, general and administrative expenses, during the year ended July 31, 2017, decreased by approximately $3.4 million compared to the same period in the prior year primarily as a result of reduced employee-related costs ($0.2 million) related to restructuring and cost containment programs, lower professional fees ($4.1 million) primarily associated with outsourced services and a decrease in other selling, general and administrative expenses ($0.3 million). This decrease was offset by a gain included in the comparable period in the prior year related to the sale of a building in Europe of $1.2 million. Excluding the costs associated with the management incentive plan in the fiscal year 2017 and the gain associate with the sale of the building in Europe in the prior year, selling, general and administrative expenses decreased by $7.9 million. Fluctuations in foreign currency exchange rates had an insignificant impact on selling, general and administrative expenses for the year ended July 31, 2017.
Impairment of Long-Lived Assets:
During the year ended, July 31, 2016, the Company recorded an impairment charge of $0.3 million to adjust the carrying value of its building in Kildare, Ireland to its estimated fair value.
Restructuring, net:
| Twelve Months Ended July 31, 2017 |
As a % of Segment Net Revenue |
Twelve Months Ended July 31, 2016 |
As a % of Segment Net Revenue |
$ Change | % Change | |||||||||||||||||||
| (In thousands) | ||||||||||||||||||||||||
| Americas |
$ | 338 | 0.4 | % | $ | 1,885 | 1.8 | % | $ | (1,547 | ) | (82.1 | %) | |||||||||||
| Asia |
818 | 0.5 | % | 2,247 | 1.3 | % | (1,429 | ) | (63.6 | %) | ||||||||||||||
| Europe |
623 | 0.4 | % | 2,259 | 1.5 | % | (1,636 | ) | (72.4 | %) | ||||||||||||||
| e-Business |
188 | 0.7 | % | 1,030 | 3.1 | % | (842 | ) | (81.7 | %) | ||||||||||||||
|
|
|
|
|
|
|
|||||||||||||||||||
| Total |
$ | 1,967 | 0.5 | % | $ | 7,421 | 1.6 | % | $ | (5,454 | ) | (73.5 | %) | |||||||||||
|
|
|
|
|
|
|
|||||||||||||||||||
23
Table of Contents
During the fiscal year ended July 31, 2017, the Company recorded a net restructuring charge of $2.0 million. Of this amount,
$1.5 million primarily related to the workforce reduction of 78 employees across all operating segments, and $0.5 million related to contractual obligations.
During the fiscal year ended July 31, 2016, the Company recorded a net restructuring charge of $7.4 million. Of this amount,
$5.9 million primarily related to the workforce reduction of 228 employees across all operating segments, and $1.5 million related to contractual obligations.
Interest Income/Expense:
During the fiscal year ended July 31, 2017, interest income decreased to $0.4 million from $0.7 million during the fiscal year ended July 31, 2016.
Interest expense totaled approximately $8.2 million and $10.9 million for the fiscal years ended July 31, 2017 and 2016, respectively. The decrease in interest expense primarily relates to the purchases of the Company’s 5.25% Convertible Senior Notes subsequent to the quarter ended January 31, 2016.
Other Gains (Losses), net:
Other gains (losses), net totaled approximately $3.2 million for the fiscal years ended July 31, 2017. The balance consists primarily of $2.2 million and $0.9 million, in net non-cash and cash gains, respectively, associated with its Trading Securities, and $0.2 million in net realized and unrealized foreign exchange gains, offset by other gain and losses. For the fiscal year ended July 31, 2017, the net gains of $0.2 million primarily related to realized and unrealized gains (losses) from foreign currency exposures and settled transactions of approximately $(0.1) million, $0.2 million, $0.5 million, $0.5 million and $(0.9) million in the Americas, Asia, Europe, e-Business and Corporate, respectively.
Other gains (losses), net totaled approximately $(5.8) million for the fiscal years ended July 31, 2016. The balance consists primarily of $(12.3) million and $6.4 million, in net non-cash and cash gains and (losses), respectively, associated with its Trading Securities, $0.8 million in non-cash gains associated with the repurchase of the Company’s Notes and $(0.6) million in net realized and unrealized foreign exchange losses, offset by other gain and losses. For the fiscal year ended July 31, 2016, the net losses of $(0.6) million primarily related to realized and unrealized gains (losses) from foreign currency exposures and settled transactions of approximately $0.1 million, $(0.2) million, $(0.5) million in the Americas, Asia, Europe, respectively.
Gains (losses) on investments in affiliates and impairments:
Gains (losses) on investments in affiliates and impairments results from the Company’s minority ownership in certain investments that are accounted for under the cost method and impairments on these investments. For the fiscal years ended July 31, 2017 and 2016, the Company recorded gains of $1.3 million and $0.8 million, respectively, associated with its cost method investments. For the fiscal years ended July 31, 2017 and 2016, the Company recorded an immaterial balance of impairment charges related to these investments. During the fiscal years ended July 31, 2017 and 2016, the Company received distributions of approximately $1.3 million and $0.8 million, respectively, from its investments.
Income Tax Expense:
During the fiscal year ended July 31, 2017, the Company recorded income tax expense of approximately $2.7 million compared to income tax expense of $5.4 million, for the prior fiscal year. For the fiscal years ended July 31, 2017 and 2016, the Company was profitable in certain jurisdictions where the Company operates, resulting in an income tax expense using the enacted tax rates in those jurisdictions. We provide a valuation allowance against deferred tax assets that in our estimation are not more likely than not to be realized. During the year ended July 31, 2017, we provided valuation allowances totaling $11.0 million primarily related to our operations in the United States.
The Company provides for income tax expense related to federal, state, and foreign income taxes. For the fiscal year ended July 31, 2017, the Company’s taxable income for certain foreign locations was offset by net operating loss carryovers from prior years, and the Company calculated a taxable loss in the U.S. For the fiscal year ended July 31, 2016, the Company’s taxable income for certain foreign locations was offset by net operating loss carryovers from prior years, and the Company calculated a taxable loss in the U.S. The Company continues to maintain a full valuation allowance against its deferred tax asset in the U.S. and certain of its foreign subsidiaries due to the uncertainty of realizing such benefits..
24
Table of Contents
Non-GAAP Measures
In addition to the financial measures prepared in accordance with generally accepted accounting principles, the Company uses Adjusted EBITDA, a non-GAAP financial measure, to assess its performance. EBITDA represents earnings before interest, income tax expense, depreciation and amortization. We define Adjusted EBITDA as EBITDA excluding the effects of SEC inquiry and financial restatement costs, SEC penalties on resolution, strategic consulting and other related professional fees, executive severance and employee retention, restructuring, share-based compensation, impairment of goodwill and long-lived assets, unrealized foreign exchange gains and losses, net, other non-operating gains and losses, net, and gains and losses on investments in affiliates and impairments.
We believe that providing Adjusted EBITDA to investors is useful as this measure provides important supplemental information of our performance to investors and permits investors and management to evaluate the operating performance of our core supply chain business. We use Adjusted EBITDA in internal forecasts and models when establishing internal operating budgets, supplementing the financial results and forecasts reported to our Board of Directors, determining a component of incentive compensation for executive officers and other key employees based on operating performance and evaluating short-term and long-term operating trends in our core supply chain business. We believe that the Adjusted EBITDA financial measure assists in providing an enhanced understanding of our underlying operational measures to manage the core supply chain business, to evaluate performance compared to prior periods and the marketplace, and to establish operational goals. We believe that these non-GAAP financial adjustments are useful to investors because they allow investors to evaluate the effectiveness of the methodology and information used by management in our financial and operational decision-making.
Adjusted EBITDA is a non-GAAP financial measure and should not be considered in isolation or as a substitute for financial information provided in accordance with U.S. GAAP. This non-GAAP financial measure may not be computed in the same manner as similarly titled measures used by other companies.
Adjusted EBITDA has limitations as an analytical tool. Some of these limitations are:
| • | Adjusted EBITDA does not reflect our cash expenditures, or future requirements, for capital expenditures or contractual commitments; |
| • | Adjusted EBITDA does not reflect changes in, or cash requirements for, our working capital needs; |
| • | although depreciation and amortization are non-cash charges, the assets being depreciated and amortized will often have to be replaced in the future, and Adjusted EBITDA does not reflect any cash requirements for such replacements; |
| • | non-cash compensation is and will remain a key element of our overall long-term incentive compensation package, although we exclude it as an expense when evaluating our ongoing operating performance for a particular period; |
| • | Adjusted EBITDA does not reflect the impact of certain cash charges resulting from matters we consider not to be indicative of our ongoing operations; and |
| • | other companies in our industry may calculate Adjusted EBITDA differently than we do, limiting its usefulness as a comparative measure. |
25
Table of Contents
The following table includes the reconciliations of our U.S. GAAP net loss, the most directly comparable U.S. GAAP financial measure, to EBITDA and Adjusted EBITDA for fiscal 2017, 2016 and 2015:
| Twelve Months Ended July 31, | ||||||||||||
| (In thousands) | 2017 | 2016 | 2015 | |||||||||
| Net loss |
$ | (25,827 | ) | $ | (61,281 | ) | $ | (18,429 | ) | |||
| Interest income |
(399 | ) | (668 | ) | (893 | ) | ||||||
| Interest expense |
8,247 | 10,924 | 10,618 | |||||||||
| Income tax expense |
2,696 | 5,443 | 2,283 | |||||||||
| Depreciation |
8,206 | 8,119 | 8,668 | |||||||||
| Amortization of intangible assets |
— | — | 667 | |||||||||
|
|
|
|
|
|
|
|||||||
| EBITDA |
(7,077 | ) | (37,463 | ) | 2,914 | |||||||
| SEC inquiry and financial restatement costs |
12 | 293 | 489 | |||||||||
| SEC penalties on resolution |
— | — | 1,600 | |||||||||
| Strategic consulting and other related professional fees |
92 | 455 | 678 | |||||||||
| Executive severance and employee retention |
750 | 662 | — | |||||||||
| Restructuring |
1,967 | 7,421 | 5,130 | |||||||||
| Share-based compensation |
681 | 1,126 | 1,757 | |||||||||
| Impairment of goodwill and long-lived assets |
261 | 305 | 3,360 | |||||||||
| Unrealized foreign exchange (gains) losses |
670 | 1,037 | (1,585 | ) | ||||||||
| Other non-cash (gains) losses, net |
(3,001 | ) | 5,340 | (13,439 | ) | |||||||
| (Gains) on investments in affiliates and impairments |
(1,278 | ) | (747 | ) | 7,087 | |||||||
|
|
|
|
|
|
|
|||||||
| Adjusted EBITDA |
$ | (6,923 | ) | $ | (21,571 | ) | $ | 7,991 | ||||
|
|
|
|
|
|
|
|||||||
Our Adjusted EBITDA measure reflects adjustments based on the following items:
SEC inquiry and financial restatement costs. We exclude external costs related to our SEC inquiry and financial restatement. We exclude these costs because we do not believe they are indicative of our normal operating costs.
SEC penalties on resolution. We exclude SEC penalties because we do not believe they are indicative of our normal operating costs.
Strategic consulting and other related professional expenses. We exclude certain professional fees related to our evaluation of strategic alternatives, cost alignment initiatives, and proxy contests with activist investors. We exclude these costs because we do not believe they are indicative of our normal operating costs.
Executive severance and employee retention. We have incurred severance charges related to certain executives of the Company, and costs related to the retention of certain employees of the Company. We exclude these costs because we do not believe they are indicative of our normal operating costs.
Restructuring. We incur charges due to the restructuring of our business, including severance charges and contractual obligations associated with facility reductions resulting from our streamlining efforts. The amount and timing of any future restructuring activity is difficult to predict.
Share-based Compensation Expense. We incur expenses related to share-based compensation included in our U.S. GAAP presentation of cost of revenues and selling, general and administrative expense. Although share-based compensation is an expense we incur and is viewed as a form of compensation, the expense varies in amount from period to period, and is affected by market forces that are difficult to predict and are not within the control of management, such as the market price and volatility of our shares, risk-free interest rates and the expected term and forfeiture rates of the awards.
Impairment of goodwill and long-lived assets. Although an impairment of goodwill and long-lived assets does not directly impact the Company’s current cash position, such expense represents the declining value of the goodwill recorded at the time of the business acquisition and the other long-lived assets that were acquired. We exclude these impairments because they are not indicative of our normal operating costs.
26
Table of Contents
Unrealized foreign exchange (gains) losses. We exclude these gains and losses as we do not believe they directly impact the Company’s cash position until they are realized.
Other non-cash (gains) losses. We exclude other non-cash (gains) losses as they do not relate to the performance of our core supply chain business. This caption includes items such as the derecognition of accrued pricing liabilities and gains or losses on the sale of assets.
(Gains) losses on investments in affiliates and impairments. We exclude (gains) losses on investments in affiliates and impairments related to our investments in a small number of privately held companies. We exclude this balance because it is not related to or indicative of the results of the Company’s core supply chain business.
Fiscal Year 2016 compared to Fiscal Year 2015
Net Revenue:
| Twelve Months Ended July 31, 2016 |
As a % of Total Net Revenue |
Twelve Months Ended July 31, 2015 |
As a % of Total Net Revenue |
$ Change | % Change | |||||||||||||||||||
| (In thousands) | ||||||||||||||||||||||||
| Americas |
$ | 106,143 | 23.1 | % | $ | 200,929 | 35.8 | % | $ | (94,786 | ) | (47.2 | %) | |||||||||||
| Asia |
167,861 | 36.6 | % | 163,262 | 29.1 | % | 4,599 | 2.8 | % | |||||||||||||||
| Europe |
151,842 | 33.1 | % | 160,602 | 28.6 | % | (8,760 | ) | (5.5 | %) | ||||||||||||||
| e-Business |
33,177 | 7.2 | % | 36,880 | 6.5 | % | (3,703 | ) | (10.0 | %) | ||||||||||||||
|
|
|
|
|
|
|
|||||||||||||||||||
| Total |
$ | 459,023 | 100.0 | % | $ | 561,673 | 100.0 | % | $ | (102,650 | ) | (18.3 | %) | |||||||||||
|
|
|
|
|
|
|
|||||||||||||||||||
Net revenue decreased by approximately $102.7 million during the year ended July 31, 2016, as compared to the same period in the prior year. This decrease was primarily a result of lower volumes from a major computing market client, a major consumer electronics client and an aftermarket services program related to the repair and refurbishment of mobile devices, partially offset by an increase in revenue from other clients in the consumer electronics industries. Fluctuations in foreign currency exchange rates had an insignificant impact on net revenues for the year ended July 31, 2016. Revenue from new programs, which the Company defines as client programs that have been executed for fewer than 12 months, was $80.0 million during the year ended July 31, 2016, as compared to $65.8 million during the year ended July 31, 2015. The increase in revenue from new programs was primarily due to the addition of client programs associated with consumer electronics and consumer products markets. Base business is defined as client programs that have been executed for 12 months or more.
During the year ended July 31, 2016, net revenue in the Americas region decreased by approximately $94.8 million. This decrease occurred primarily as a result of lower volumes from a major computing market client, an aftermarket services program related to the repair and refurbishment of mobile devices and a large consumer electronics client. Within the Asia region, the net revenue increase of approximately $4.6 million primarily resulted from higher revenues from clients in the consumer electronics market. Within the Europe region, net revenue decreased by approximately $8.8 million primarily related to lower volumes from clients in the computing and consumer electronics markets, partially offset by increased revenue from other consumer electronics and consumer products clients. Net revenue for e-Business decreased by approximately $3.7 million, primarily due to lower revenues from consumer electronics clients, partially offset by other clients in the consumer electronics industries.
During the second quarter of fiscal year 2014, a major client in the computing market notified us of an intended change in their sourcing strategy effective during our third fiscal quarter of fiscal 2014 for one of their supply chain programs in Asia for which we were the primary service provider. While we were notified that the client intended to add an additional service provider to this program, we expect to continue to be the primary service provider. This change in sourcing strategy reduced annualized net revenue of approximately $15 million to $20 million, and had a greater proportionate impact on operating income consistent with the historical margins realized from this type of service program.
During the fourth quarter of fiscal year 2014, the Company was informed by a major client in the computing market that due to a further change in the client’s supply chain strategy, a number of programs previously sourced with the Company, primarily in the Americas, concluded by the first quarter of fiscal year 2015. Combined, these programs accounted for approximately $150 million to $160 million of annual net revenue and approximately $2.5 million to $3.5 million of operating income due to the historically low margins we had realized from these programs.
27
Table of Contents
Cost of Revenue:
| Twelve Months Ended July 31, 2016 |
As a % of Segment Net Revenue |
Twelve Months Ended July 31, 2015 |
As a % of Segment Net Revenue |
$ Change | % Change | |||||||||||||||||||
| (In thousands) | ||||||||||||||||||||||||
| Americas |
$ | 107,057 | 100.9 | % | $ | 190,941 | 95.0 | % | $ | (83,884 | ) | (43.9 | %) | |||||||||||
| Asia |
145,900 | 86.9 | % | 133,703 | 81.9 | % | 12,197 | 9.1 | % | |||||||||||||||
| Europe |
147,929 | 97.4 | % | 149,410 | 93.0 | % | (1,481 | ) | (1.0 | %) | ||||||||||||||
| e-Business |
33,379 | 100.6 | % | 33,134 | 89.8 | % | 245 | 0.7 | % | |||||||||||||||
|
|
|
|
|
|
|
|||||||||||||||||||
| Total |
$ | 434,265 | 94.6 | % | $ | 507,188 | 90.3 | % | $ | (72,923 | ) | (14.4 | %) | |||||||||||
|
|
|
|
|
|
|
|||||||||||||||||||
Cost of revenue consists primarily of expenses related to the cost of materials purchased in connection with the provision of supply chain management services as well as costs for salaries and benefits, contract labor, consulting, fulfillment and shipping, and applicable facilities costs. Cost of revenue for the year ended July 31, 2016 included materials procured on behalf of our clients of $265.6 million, or 57.9% of consolidated net revenue, as compared to $307.3 million, or 54.7% of consolidated net revenue for the same period in the prior year, a decrease of $41.7 million. Total cost of revenue decreased by $72.9 million for the year ended July 31, 2016, as compared to the year ended July 31, 2015, primarily due to the decline in cost of materials associated with the loss of a major computing market and a consumer electronics market client and the reduction in labor costs primarily associated with the loss of an aftermarket services program related to the repair and refurbishment of mobile devices and a computing market client.
Gross margin decreased to 5.4% for the year ended July 31, 2016, from 9.7% for the year ended July 31, 2015, primarily as a result of a reduction in revenue, partially offset by a reduction in labor costs. For the year ended July 31, 2016, the Company’s gross margin percentages within the Americas, Asia, Europe and e-Business were -0.9%, 13.1%. 2.6% and -0.6%, as compared to 5.0%, 18.1%, 7.0% and 10.2%, respectively, for the same period of the prior year. Furthermore, fluctuations in foreign currency exchange rates had an insignificant impact on gross margin for the year ended July 31, 2016.
In the Americas, the 5.9 percentage point decrease in gross margin, from 5.0% to -0.9%, resulted from a decline in revenues, primarily related to three clients, partially offset by a less significant decline in labor costs. In Asia, the 5.0 percentage point decrease, from 18.1% to 13.1% was primarily the result of unfavorable revenue mix and higher material costs, partially offset by a lower decline in labor costs. In Europe, the 4.4 percentage point decrease in gross margin, from 7.0% to 2.6%, resulted from a decline in revenues. The gross margin for e-Business was -0.6% for the year ended July 31, 2016 as compared to 10.2% for the same period of the prior year. This unfavorable decline of 10.8 percentage points was due to lower revenues, as well as higher labor costs.
Selling, General and Administrative Expenses:
| Twelve Months Ended July 31, 2016 |
As a % of Segment Net Revenue |
Twelve Months Ended July 31, 2015 |
As a % of Segment Net Revenue |
$ Change | % Change | |||||||||||||||||||
| (In thousands) | ||||||||||||||||||||||||
| Americas |
$ | 11,932 | 11.2 | % | $ | 13,129 | 6.5 | % | $ | (1,197 | ) | (9.1 | %) | |||||||||||
| Asia |
20,569 | 12.3 | % | 18,559 | 11.4 | % | 2,010 | 10.8 | % | |||||||||||||||
| Europe |
15,174 | 10.0 | % | 14,506 | 9.0 | % | 668 | 4.6 | % | |||||||||||||||
| e-Business |
3,152 | 9.5 | % | 2,384 | 6.5 | % | 768 | 32.2 | % | |||||||||||||||
|
|
|
|
|
|
|
|||||||||||||||||||
| Sub-total |
50,827 | 11.1 | % | 48,578 | 8.6 | % | 2,249 | 4.6 | % | |||||||||||||||
| Corporate-level activity |
6,777 | 11,089 | (4,312 | ) | (38.9 | %) | ||||||||||||||||||
|
|
|
|
|
|
|
|||||||||||||||||||
| Total |
$ | 57,604 | 12.5 | % | $ | 59,667 | 10.6 | % | $ | (2,063 | ) | (3.5 | %) | |||||||||||
|
|
|
|
|
|
|
|||||||||||||||||||
Selling, general and administrative expenses consist primarily of compensation and employee-related costs, sales commissions and incentive plans, information technology expenses, travel expenses, facilities costs, consulting fees, fees for professional services, depreciation expense and marketing expenses. Selling, general and administrative expenses, during the year ended July 31, 2016, decreased by approximately $2.1 million compared to the same period in the prior year, primarily as a result
28
Table of Contents
of reduced employee-related costs ($1.6 million) related to restructuring and a reduction in depreciation expense ($1.0 million), partially offset by higher professional fees ($1.7 million) primarily associated with outsourced services and gains ($1.2 million) associated with the sale of a building in Europe. Fluctuations in foreign currency exchange rates had an insignificant impact on selling, general and administrative expenses for the year ended July 31, 2016.
Amortization of Intangible Assets:
| Twelve Months Ended July 31, 2016 |
As a % of Segment Net Revenue |
Twelve Months Ended July 31, 2015 |
As a % of Segment Net Revenue |
$ Change | % Change | |||||||||||||||||||
| (In thousands) | ||||||||||||||||||||||||
| Americas |
$ | — | 0.0 | % | $ | 55 | 0.0 | % | $ | (55 | ) | (100.0 | %) | |||||||||||
| e-Business |
— | 0.0 | % | 612 | 1.7 | % | (612 | ) | (100.0 | %) | ||||||||||||||
|
|
|
|
|
|
|
|||||||||||||||||||
| Total |
$ | — | 0.0 | % | $ | 667 | 0.1 | % | $ | (667 | ) | (100.0 | %) | |||||||||||
|
|
|
|
|
|
|
|||||||||||||||||||
The intangible asset amortization relates to certain amortizable intangible assets acquired by the Company in connection with its acquisitions. The intangible assets were fully amortized as of July 31, 2015.
Impairment of Goodwill and Long-Lived Assets:
| Twelve Months Ended July 31, 2016 |
As a % of Segment Net Revenue |
Twelve Months Ended July 31, 2015 |
As a % of Segment Net Revenue |
$ Change | % Change | |||||||||||||||||||
| (In thousands) | ||||||||||||||||||||||||
| Americas |
$ | — | 0.0 | % | $ | 302 | 0.2 | % | $ | (302 | ) | (100.0 | %) | |||||||||||
| Europe |
305 | 0.2 | % | — | 0.0 | % | 305 | 100.0 | % | |||||||||||||||
| e-Business |
— | 0.0 | % | 3,058 | 8.3 | % | (3,058 | ) | (100.0 | %) | ||||||||||||||
|
|
|
|
|
|
|
|||||||||||||||||||
| Total |
$ | 305 | 0.1 | % | $ | 3,360 | 0.6 | % | $ | (3,055 | ) | (90.9 | %) | |||||||||||
|
|
|
|
|
|
|
|||||||||||||||||||
During the year ended, July 31, 2016, the Company recorded an impairment charge of $0.3 million to adjust the carrying value of its building in Kildare, Ireland to its estimated fair value.
During the fourth quarter of fiscal year 2015, the Company completed its annual impairment analysis of goodwill and determined that the fair value of the reporting unit, derived from forecasted cash flows, did not exceed its carrying value. As a result of the annual impairment analysis and in connection with the preparation of its annual financial statements for the fiscal year ended July 31, 2015, the Company concluded that its remaining goodwill was fully impaired and recorded a $3.1 million non-cash goodwill impairment charge. The impairment of long-lived assets in the Americas, during the year ended July 31, 2015, related to the write-down of leasehold improvements associated with the planned closure of a facility.
Restructuring, net:
| Twelve Months Ended July 31, 2016 |
As a % of Segment Net Revenue |
Twelve Months Ended July 31, 2015 |
As a % of Segment Net Revenue |
$ Change | % Change | |||||||||||||||||||
| (In thousands) | ||||||||||||||||||||||||
| Americas |
$ | 1,885 | 1.8 | % | $ | 909 | 0.5 | % | $ | 976 | 107.4 | % | ||||||||||||
| Asia |
2,247 | 1.3 | % | 997 | 0.6 | % | 1,250 | 125.4 | % | |||||||||||||||
| Europe |
2,259 | 1.5 | % | 3,165 | 2.0 | % | (906 | ) | (28.6 | %) | ||||||||||||||
| e-Business |
1,030 | 3.1 | % | 59 | 0.2 | % | 971 | 1,645.8 | % | |||||||||||||||
|
|
|
|
|
|
|
|||||||||||||||||||
| Total |
$ | 7,421 | 1.6 | % | $ | 5,130 | 0.9 | % | $ | 2,291 | 44.7 | % | ||||||||||||
|
|
|
|
|
|
|
|||||||||||||||||||
29
Table of Contents
During the fiscal year ended July 31, 2016, the Company recorded a net restructuring charge of $7.4 million. Of this amount,
$5.9 million primarily related to the workforce reduction of 228 employees across all operating segments, and $1.5 million related to contractual obligations.
During the fiscal year ended July 31, 2015, the Company recorded a net restructuring charge of $5.1 million. Of this amount,
$4.9 million primarily related to the workforce reduction of 235 employees across all operating segments, and $0.2 million related to contractual obligations.
Interest Income/Expense:
During the fiscal year ended July 31, 2016, interest income decreased to $0.7 million from $0.9 million during the fiscal year ended July 31, 2015.
Interest expense totaled approximately $10.9 million and $10.6 million for the fiscal years ended July 31, 2016 and 2015, respectively. The interest expense primarily relates to cash and non-cash interest associated with the Company’s issuance of $100 million of 5.25% Convertible Senior Notes (the “Notes”) during the year ended July 31, 2014.
Other Gains (Losses), net:
Other gains (losses), net totaled approximately $(5.8) million for the fiscal years ended July 31, 2016. The balance consists primarily of $(12.3) million and $6.4 million, in net non-cash and cash gains and (losses), respectively, associated with its Trading Securities, $0.8 million in non-cash gains associated with the repurchase of the Company’s Notes and $(0.6) million in net realized and unrealized foreign exchange losses, offset by other gains and losses. For the fiscal year ended July 31, 2016, the net losses of $(0.6) million primarily related to realized and unrealized gains (losses) from foreign currency exposures and settled transactions of approximately $0.1 million, $(0.2) million and $(0.5) million in the Americas, Asia and Europe, respectively.
Other gains (losses), net totaled approximately $15.0 million for the fiscal years ended July 31, 2015. The balance consists primarily of $12.8 million and $0.8 million, in net non-cash and cash gains, respectively, associated with its Trading Securities and $1.8 million in net realized and unrealized foreign exchange gains, offset by other gain and losses. For the fiscal year ended July 31, 2015, the net gains of $1.8 million primarily related to realized and unrealized gains (losses) from foreign currency exposures and settled transactions of approximately $0.5 million, $0.2 million and $0.7 million in the Americas, Asia and Europe, respectively.
(Gains) losses on investments in affiliates and impairments:
(Gains) losses on investments in affiliates and impairments results from the Company’s minority ownership in certain investments that are accounted for under the cost method and impairments on these investments. For the fiscal years ended July 31, 2016 and 2015, the Company recorded gains of $0.8 million and $0.2 million, respectively, associated with its cost method investments. For the fiscal years ended July 31, 2015, the Company recorded an immaterial proportionate share of the affiliates’ gains. During the fiscal years ended July 31, 2016, the Company recorded an immaterial balance of impairment charges related to these investments. During the fiscal years ended July 31, 2015, the Company recorded $7.3 million of impairment charges related to these investments. During the fiscal years ended July 31, 2016 and 2015, the Company received distributions of approximately $0.8 million and $0.4 million, respectively, from its investments.
Income Tax Expense:
During the fiscal year ended July 31, 2016, the Company recorded income tax expense of approximately $5.4 million compared to income tax expense of $2.3 million, for the prior fiscal year. For the fiscal years ended July 31, 2016 and 2015, the Company was profitable in certain jurisdictions where the Company operates, resulting in an income tax expense using the enacted tax rates in those jurisdictions. We provide a valuation allowance against deferred tax assets that in our estimation are not more likely than not to be realized. During the year ended July 31, 2016, we provided valuation allowances totaling $10.3 million primarily related to our operations in the Netherlands. This increase in the valuation allowance increased the income tax expense by approximately $2.7 million.
The Company provides for income tax expense related to federal, state, and foreign income taxes. For the fiscal year ended July 31, 2016, the Company’s taxable income for certain foreign locations was offset by net operating loss carryovers from prior years, and the Company calculated a taxable loss in the U.S. For the fiscal year ended July 31, 2015, the Company’s taxable income for certain foreign locations was offset by net operating loss carryovers from prior years, and the Company calculated a taxable loss in the U.S. The Company continues to maintain a full valuation allowance against its deferred tax asset in the U.S. and certain of its foreign subsidiaries due to the uncertainty of realizing such benefits.
30
Table of Contents
Liquidity and Capital Resources
Historically, the Company has financed its operations and met its capital requirements primarily through funds generated from operations, the sale of our securities and borrowings from lending institutions. As of July 31, 2017, the Company’s primary sources of liquidity consisted of cash and cash equivalents of $110.7 million. The Company’s ModusLink Corporation subsidiary has undistributed earnings from its foreign subsidiaries of approximately $39.1 million at July 31, 2017, of which approximately $2.0 million is considered to be permanently reinvested due to certain restrictions under local laws as well as the Company’s plans to reinvest such earnings for future expansion in certain foreign jurisdictions. Due to the Company’s U.S. net operating loss carryforward there is no U.S. tax payable upon repatriating the undistributed earnings of foreign subsidiaries considered not subject to permanent investment. Foreign withholding taxes would range from 0% to 10% on any repatriated funds.
On June 30, 2014, two direct and wholly owned subsidiaries of the Company (the “Borrowers”) entered into a revolving credit and security agreement (the “Credit Agreement”), as borrowers and guarantors, with PNC Bank and National Association, as lender and as agent, respectively. The Credit Agreement has a five (5) year term which expires on June 30, 2019. It includes a
maximum credit commitment of $50.0 million, is available for letters of credit (with a sublimit of $5.0 million) and has a $20.0 million uncommitted accordion feature. The actual maximum credit available under the Credit Agreement varies from time to time and is determined by calculating the applicable borrowing base, which is based upon applicable percentages of the values of eligible accounts receivable and eligible inventory minus reserves determined by the Agent (including other reserves that the Agent may establish from time to time in its permitted discretion), all as specified in the Credit Agreement. During the year ended July 31, 2017, the Company did not meet the criteria that would cause its financial covenants to be effective. As of July 31, 2017 and 2016, the Company did not have any balance outstanding on the Credit Agreement.
On March 18, 2014, the Company entered into an indenture (the “Indenture”) with Wells Fargo Bank, National Association, as trustee (the “Trustee”), relating to the Company’s issuance of $100 million of 5.25% Convertible Senior Notes (the “Notes”). The Notes bear interest at the rate of 5.25% per year, payable semi-annually in arrears on March 1 and September 1 of each year, beginning on September 1, 2014. The Notes will mature on March 1, 2019, unless earlier repurchased by the Company or converted by the holder in accordance with their terms prior to such maturity date. Holders of the Notes may convert all or any portion of their notes, in multiples of $1,000 principal amount, at their option at any time prior to the close of business or the business day immediately preceding the maturity date. Each $1,000 of principal of the Notes will initially be convertible into 166.2593 shares of our common stock, which is equivalent to an initial conversion price of approximately $6.01 per share, subject to adjustment upon the occurrence of certain events, or, if the Company obtains the required consent from its stockholders, into shares of the Company’s common stock, cash or a combination of cash and shares of its common stock, at the Company’s election. If the Company has received stockholder approval, and it elects to settle conversions through the payment of cash or payment or delivery of a combination of cash and shares, the Company’s conversion obligation will be based on the volume weighted average prices (“VWAP”) of its common stock for each VWAP trading day in a 40 VWAP trading day observation period. The Notes and any of the shares of common stock issuable upon conversion have not been registered. Holders will have the right to require the Company to repurchase their Notes, at a repurchase price equal to 100% of the principal amount of the Notes plus accrued and unpaid interest, upon the occurrence of certain fundamental changes, subject to certain conditions. No fundamental changes occurred during the year ended July 31, 2017. The Company may not redeem the Notes prior to the maturity date, and no sinking fund is provided for the Notes. The Company will have the right to elect to cause the mandatory conversion of the Notes in whole, and not in part, at any time on or after March 6, 2017, if the last reported sale price of its common stock has been at least 130% of the conversion price then in effect for at least 20 trading days (whether or not consecutive), including the trading day immediately preceding the date on which the Company notifies holders of its election to mandatorily convert the Notes, during any 30 consecutive trading day period ending on, and including, the trading day immediately preceding the date on which the Company notifies holders of its election to mandatorily convert the notes. The repurchase of Notes by the Company is discussed in Note 9 in the consolidated financial statements in Item 8. As of July 31, 2017 and 2016, the net carrying value of the Notes was $59.8 million and $57.2 million, respectively. As of July 31, 2017 and 2016, the principal amount of the Notes was $67.6 million and $69.6 million, respectively.
Consolidated working capital was $108.7 million at July 31, 2017, compared with $125.1 million at July 31, 2016. Included in working capital were cash and cash equivalents of $110.7 million at July 31, 2017 and $130.8 million at July 31, 2016.
Net cash used in operating activities was $24.4 million for the year ended July 31, 2017, as compared to net cash used in operating activities of $19.8 million in the prior year period. The $4.7 million increase in net cash used in operating activities as compared with the same period in the prior year was primarily due to payments of accounts payable, accrued restructuring and accrued expenses as compared to the payments made in the prior year, primarily offset by improvement in the Company’s net loss. During the year ended July 31, 2017, the Company exited a program with a large consumer electronics client, requiring a net
31
Table of Contents
working capital payment of approximately $14.5 million, which negatively impacted cash flows from operating activities as compared to the same period in the prior year. In addition to this, during the year ended July 31, 2017, non-cash items within net cash provided by operating activities included depreciation expense of $8.2 million, amortization of deferred financing costs of $0.6 million, accretion of debt discount of $3.9 million, impairment of long-lived assets of $0.3 million, share-based compensation of $0.7 million, non-cash gains, net, of $3.2 million and (gains) losses on investments in affiliates and impairments of $1.3 million. During the fiscal year ended July 31, 2016, non-cash items within net cash provided by operating activities included depreciation expense of $8.1 million, amortization of deferred financing costs of $0.7 million, accretion of debt discount of $5.0 million, impairment of long-lived assets of $0.3 million, share-based compensation of $1.1 million, non-cash gains, net, of $4.5 million and (gains) losses, and gains on investments in affiliates and impairments of $(0.7) million.
The Company believes that its cash flows related to operating activities of continuing operations are dependent on several factors, including profitability, accounts receivable collections, effective inventory management practices, and optimization of the credit terms of certain vendors of the Company. Our cash flows from operations are also dependent on several factors including the overall performance of the technology sector and the market for outsourcing services.
Investing activities provided cash of $5.6 million and $52.2 million during the year ended July 31, 2017 and 2016, respectively. The cash provided by investing activities during the year ended July 31, 2017 was primarily comprised of $4.7 million in capital expenditures, $0.9 million in proceeds from the termination of a defined benefit pension plan, $8.0 million in proceeds from the sale of Trading Securities and $1.3 million in proceeds from investments in affiliates. The $52.2 million of cash provided by investing activities during the fiscal year ended July 31, 2016 was primarily comprised of $7.9 million in capital expenditures, $1.3 million in proceeds from the disposition of property and equipment, $1.2 million in purchase of Trading Securities, $59.3 million in proceeds from the sale of Trading Securities and $0.8 million in proceeds from investments in affiliates.
Cash flows used in financing activities during the year ended July 31, 2017 is primarily related to the repurchase of $2.0 million face value of the Company’s outstanding Notes. Cash flows used in financing activities during the year ended July 31, 2016 is primarily related to the repurchase of $30.4 million face value of the Company’s outstanding Notes.
The Company believes it has access to adequate resources to meet its needs for normal operating costs, capital expenditures, mandatory debt redemptions and working capital for its existing business for at least the next twelve months. These resources include cash and cash equivalents, Trading Securities, the PNC Credit Agreement noted above and cash, if any, provided by operating activities. At July 31, 2017 and July 31, 2016, the Company had cash and cash equivalents and Trading Securities of $122.6 million and $147.6 million, respectively. At July 31, 2017 and July 31, 2016, the Company had a readily available borrowing capacity under its PNC Bank Credit Facility of $16.0 million and $9.3 million, respectively. In order to obtain funding for strategic initiatives, which may include capital expenditures or acquisitions, we may seek to raise additional funds through divestitures, public or private equity offerings, debt financings, or other means. In addition, as part of our strategic initiatives, our management may seek to retire or purchase our outstanding debt through cash purchases and/or exchanges for equity securities, in open market purchases, privately negotiated transactions or otherwise if we believe that it is in our best interests. Such repurchases or exchanges, if any, will depend on prevailing market conditions, our liquidity requirements, contractual restrictions and other factors. The amounts involved may be material.
Management is utilizing the following strategies to continue to enhance liquidity: (1) continuing to implement improvements throughout all of the Company’s operations to increase sales and operating efficiencies, (2) supporting profitable revenue growth both internally and potentially through acquisitions and (3) evaluating from time to time and as appropriate, strategic alternatives with respect to its businesses and/or assets and capital raising opportunities. The Company continues to examine all of its options and strategies, including acquisitions, divestitures and other corporate transactions, to increase cash flow and stockholder value.
Off-Balance Sheet Financing Arrangements
The Company does not have any off-balance sheet financing arrangements.
32
Table of Contents
Contractual Obligations
The Company leases facilities and certain other machinery and equipment under various non-cancelable operating leases and executory contracts expiring through July 2022. Certain non-cancelable leases are classified as capital leases and the leased assets are included in property, plant and equipment, at cost. Such leasing arrangements involve buildings and machinery and equipment as discussed in Note 10 of the accompanying notes to consolidated financial statements included in Item 8 below.
| Operating Leases |
Capital Lease Obligations |
Purchase Obligations |
Notes Interest & Principal |
Total | ||||||||||||||||
| (In thousands) | ||||||||||||||||||||
| Payments due by period |
||||||||||||||||||||
| Less than 1 year |
$ | 9,947 | $ | 64 | $ | 30,998 | $ | 3,550 | $ | 44,559 | ||||||||||
| 1-3 years |
9,716 | 156 | — | 71,175 | 81,047 | |||||||||||||||
| 3-5 years |
4,518 | 85 | — | — | 4,603 | |||||||||||||||
| More than 5 years |
— | — | — | — | — | |||||||||||||||
|
|
|
|
|
|
|
|
|
|
|
|||||||||||
| $ | 24,181 | $ | 305 | $ | 30,998 | $ | 74,725 | $ | 130,209 | |||||||||||
|
|
|
|
|
|
|
|
|
|
|
|||||||||||
Purchase obligations represent an estimate of all open purchase orders and contractual obligations in the ordinary course of business for which the Company has not received the goods or services. Although open purchase orders are considered enforceable and legally binding, the terms generally allow us the option to cancel, reschedule, and adjust our requirements based on our business needs prior to the delivery of goods or performance of services.
Future minimum payments, including previously recorded restructuring obligations, as of July 31, 2017 are as follows:
| 1. | These Contractual Obligations do not include any reserves for income taxes. Because we are unable to reasonably predict the ultimate amount or timing of settlement of our reserves for income taxes, the Contractual Obligations and Other Commitments table does not include our reserves for income taxes. As of July 31, 2017, our reserves for income taxes totaled approximately $0.7 million. |
| 2. | The table above excludes obligations related to the Company’s defined benefit pension plans. See Note 11 of the accompanying notes to consolidated financial statements included in Item 8 below for a summary of our expected contributions and benefit payments for these plans. |
| 3. | Total rent and equipment lease expense charged to continuing operations was $15.6 million, $17.3 million and $19.7 million for the fiscal years ended July 31, 2017, 2016 and 2015, respectively. |
| 4. | From time to time, the Company agrees to provide indemnification to its clients in the ordinary course of business. Typically, the Company agrees to indemnify its clients for losses caused by the Company. As of July 31, 2017, the Company had no recorded liabilities with respect to these arrangements. |
Critical Accounting Policies
The discussion and analysis of our financial condition and results of operations are based on our consolidated financial statements, which have been prepared in accordance with accounting principles generally accepted in the U.S. The preparation of these financial statements requires management to make estimates and assumptions that affect the reported amounts of assets and liabilities and disclosure of contingent assets and liabilities at the date of the consolidated financial statements and the reported amounts of revenue and expenses during the reporting period. On an ongoing basis, we evaluate our estimates, including those related to revenue recognition, allowance for doubtful accounts, inventory, restructuring, contingencies, share-based compensation expense, goodwill and long-lived assets, investments, pension obligations and income taxes. Of the accounting estimates we routinely make relating to our critical accounting policies, those estimates made in the process of: determining the valuation of inventory and related reserves; determining future lease assumptions related to restructured facility lease obligations; measuring share-based compensation expense; determining projected and discounted cash flows for purposes of evaluating goodwill, long-lived assets and intangible assets for impairment; preparing investment valuations; and establishing income tax valuation allowances and liabilities are the estimates most likely to have a material impact on our financial position and results of operations. The Company bases its estimates on historical experience and on various other assumptions that are believed to be reasonable under the circumstances. However, because these estimates inherently involve judgments and uncertainties, there can be no assurance that actual results will not differ materially from those estimates.
33
Table of Contents
The Company has identified the accounting policies below as the policies most critical to its business operations and the understanding of our results of operations. The impact and any associated risks related to these policies on our business operations is discussed throughout Management’s Discussion and Analysis of Financial Condition and Results of Operations where such policies affect our reported and expected financial results. Our critical accounting policies are as follows:
| • | Revenue recognition |
| • | Inventory valuation |
| • | Restructuring expenses |
| • | Share-based compensation expense |
| • | Accounting for impairment of long-lived assets, goodwill and other intangible assets |
| • | Investments |
| • | Income taxes |
Revenue Recognition
The Company’s revenue primarily comes from the sale of supply chain management services to its clients. Amounts billed to clients under these arrangements include revenue attributable to the services performed as well as for materials procured on the Company’s clients’ behalf as part of its service to them. Other sources of revenue include the sale of products and other services. Revenue is recognized for services when the services are performed and for product sales when the products are shipped or in certain cases when products are built and title had transferred, if the client has also contracted with us for warehousing and/or logistics services for a separate fee, assuming all other applicable revenue recognition criteria are met.
The Company recognizes revenue in accordance with the provisions of the Accounting Standards Codification (“ASC”) Topic 605, “Revenue Recognition” (“ASC Topic 605”). Specifically, the Company recognizes revenue when persuasive evidence of an arrangement exists, title and risk of loss have passed or services have been rendered, the sales price is fixed or determinable and collection of the related receivable is reasonably assured. The Company’s shipping terms vary by client and can include FOB shipping point, which means that risk of loss passes to the client when it is shipped from the Company’s location, as well as other terms such as ex-works, meaning that title and risk of loss transfer upon delivery of product to the customer’s designated carrier. The Company also evaluates the terms of each major client contract relative to a number of criteria that management considers in making its determination with respect to gross versus net reporting of revenue for transactions with its clients. Management’s criteria for making these judgments place particular emphasis on determining the primary obligor in a transaction and which party bears general inventory risk. The Company records all shipping and handling fees billed to clients as revenue, and related costs as cost of sales, when incurred.
The Company applies the provisions of ASC Topic 985, “Software” (“ASC Topic 985”), with respect to certain transactions involving the sale of software products by the Company’s e-Business operations.
The Company applies the guidance of Accounting Standards Codification (“ASC”) 605-25 “Revenue – Multiple-Element Arrangements” for determining whether an arrangement involving more than one deliverable contains more than one unit of accounting and how the arrangement consideration should be measured and allocated to the separate units of accounting. Under this guidance, when vendor specific objective evidence or third party evidence for deliverables in an arrangement cannot be determined, a best estimate of the selling price is required to separate deliverables and allocate arrangement consideration using the relative selling price method. For those contracts which contain multiple deliverables, management must first determine whether each service, or deliverable, meets the separation criteria. In general, a deliverable (or a group of deliverables) meets the separation criteria if the deliverable has standalone value to the client. Each deliverable that meets the separation criteria is considered a “separate unit of accounting.” Management allocates the total arrangement consideration to each separate unit of accounting based on the relative selling price of each separate unit of accounting. After the arrangement consideration has been allocated to each separate unit of accounting, management applies the appropriate revenue recognition method for each separate unit of accounting as described previously based on the nature of the arrangement. In general, revenue is recognized upon completion of the last deliverable. All deliverables that do not meet the separation criteria are combined into one unit of accounting and the appropriate revenue recognition method is applied.
34
Table of Contents
Inventory Valuation
We value the inventory at the lower of cost or market. We continuously monitor inventory balances and record inventory provisions for any excess of the cost of the inventory over its estimated market value. We also monitor inventory balances for obsolescence and excess quantities as compared to projected demands. Our inventory methodology is based on assumptions about average shelf life of inventory, forecasted volumes, forecasted selling prices, contractual provisions with our clients, write-down history of inventory and market conditions. While such assumptions may change from period to period, in determining the net realizable value of our inventories, we use the best information available as of the balance sheet date. If actual market conditions are less favorable than those projected, or we experience a higher incidence of inventory obsolescence because of rapidly changing technology and client requirements, additional inventory provisions may be required. Once established, write-downs of inventory are considered permanent adjustments to the cost basis of inventory and cannot be reversed due to subsequent increases in demand forecasts.
Restructuring Expenses
The Company follows the provisions of ASC Topic 420, “Exit or Disposal Cost Obligations”, which addresses financial accounting and reporting for costs associated with exit or disposal activities. The statement requires companies to recognize costs associated with exit or disposal activities when they are incurred rather than at the date of a commitment to an exit or disposal plan.
The Company records liabilities that primarily include estimated severance and other costs related to employee benefits and certain estimated costs to exit equipment and facility lease obligations and other service contracts and also costs for leases with no future economic benefit. As of July 31, 2017, the Company’s accrued restructuring balance totaled $0.2 million, of which remaining contractual obligations represented $0.1 million. These contractual obligations principally represent future obligations under non- cancelable real estate leases. Restructuring estimates relating to real estate leases involve consideration of a number of factors including: potential sublet rental rates, estimated vacancy period for the property, brokerage commissions and certain other costs. Estimates relating to potential sublet rates and expected vacancy periods are most likely to have a material impact on the Company’s results of operations in the event that actual amounts differ significantly from estimates. These estimates involve judgment and uncertainties, and the settlement of these liabilities could differ materially from recorded amounts. As such, in the course of making such estimates management often uses third party real estate advisors to assist management in its assessment of the marketplace for purposes of estimating sublet rates and vacancy periods. A 10%—20% unfavorable settlement of our remaining restructuring liabilities, as compared to our current estimates, would decrease our income from continuing operations by an immaterial amount.
Share-Based Compensation Expense
The Company recognizes share-based compensation in accordance with the provisions of ASC Topic 718, “Compensation— Stock Compensation” (“ASC Topic 718”) which requires the measurement and recognition of compensation expense for all share- based payment awards made to employees and directors including employee stock options and employee stock purchases based on estimated fair values.
ASC Topic 718 requires companies to estimate the fair value of share-based payment awards on the date of grant. The value of the portion of the award that is ultimately expected to vest is recognized as expense over the requisite service periods in the Company’s Consolidated Statements of Operations.
ASC Topic 718 requires forfeitures to be estimated at the time of grant and revised, if necessary, in subsequent periods if actual forfeitures differ from those estimates. The Company estimates its forfeiture rate based on a historical analysis of share- based payment award forfeitures. If actual forfeitures should vary from estimated forfeitures, adjustments to share-based compensation expense may be required. The Company uses the binomial-lattice option-pricing model (“binomial-lattice model”) for valuation of share-based awards with time-based vesting. The Company believes that the binomial-lattice model is an accurate
model for valuing employee stock options since it reflects the impact of stock price changes on option exercise behavior. For performance-based awards, stock-based compensation expense is recognized over the expected performance achievement period of individual performance milestones when the achievement of each individual performance milestone becomes probable. For share- based awards based on market conditions, specifically, the Company’s stock price, the compensation cost and derived service periods are estimated using the Monte Carlo valuation method. The Company uses third party analyses to assist in developing the assumptions used in its binomial-lattice model and Monte Carlo valuations and the resulting fair value used to record compensation expense. The Company’s determination of fair value of stock options on the date of grant using an option-pricing model is affected by the Company’s stock price as well as assumptions regarding a number of highly complex and subjective variables. These variables include, but are not limited to the Company’s expected stock price volatility over the term of the awards, and actual and
35
Table of Contents
projected employee stock option exercise behaviors. Any significant changes in these assumptions may materially affect the estimated fair value of the share-based award.
Accounting for Impairment of Long-Lived Assets, Goodwill and Other Intangible Assets
The Company follows ASC Topic 360, “Property, Plant, and Equipment” (“ASC Topic 360”). Under ASC Topic 360, the Company tests certain long-lived assets or group of assets for recoverability whenever events or changes in circumstances indicate that the Company may not be able to recover the asset’s carrying amount. ASC Topic 360 defines impairment as the condition that exists when the carrying amount of a long-lived asset or group, including property and equipment and other intangible assets, exceeds its fair value. The Company evaluates recoverability by determining whether the undiscounted cash flows expected to result from the use and eventual disposition of that asset or group cover the carrying value at the evaluation date. If the undiscounted cash flows are not sufficient to cover the carrying value, the Company measures an impairment loss as the excess of the carrying amount of the long-lived asset or group over its fair value. Management may use third party valuation experts to assist in its determination of fair value. As of July 31, 2017, $2.4 million, $8.5 million, $8.4 million, and $1.6 million of the Company’s long-lived assets related to the Americas, Asia, Europe, and e-Business reporting units, respectively, consisting primarily of property, equipment and software.
The Company is required to test goodwill for impairment annually or if a triggering event occurs in accordance with the provisions of ASC Topic 350, “Goodwill and Other” (“ASC Topic 350”). The Company’s policy is to perform its annual impairment testing for its reporting units on July 31, of each fiscal year. The Income Approach indicates the fair value of an asset based on the present value of the cash flows that the asset can be expected to generate in the future. Specifically, the Discounted Cash Flow (“DCF”) Method was relied upon in the valuation of the net assets of the e-Business reporting unit. During the fourth quarter of fiscal year 2015, the Company completed its annual impairment analysis of goodwill. As a result of the annual impairment analysis and in connection with the preparation of its annual financial statements for the fiscal year ended July 31, 2015, the Company concluded that its remaining goodwill was fully impaired and recorded a $3.1 million non-cash goodwill impairment charge.
Investments
The Company had maintained interests in a small number of privately held companies primarily through its various venture capital funds. The Company’s venture capital investment portfolio, @Ventures, invested in early-stage technology companies. These investments are generally made in connection with a round of financing with other third-party investors. Investments in which the Company’s interest is less than 20% and which are not classified as available-for-sale securities, are accounted for under the cost method of accounting, and are carried at the lower of cost or net realizable value. Under this method, the investment balance, originally recorded at is cost, is only adjusted for impairments to the investment. Gains and losses realized upon the sale of the investment are reflected in “Gains on investments in affiliates, net of tax” in the Company’s Consolidated Statements of Operations. For the fiscal years ended July 31, 2017, the Company recorded gains of $1.3 million associated with its cost method investments. If it is determined that the Company exercises significant influence over the investee company, then the equity method of accounting is used. For those investments in which the Company’s voting interest is between 20% and 50%, the equity method of accounting is generally used. Under this method, the investment balance, originally recorded at cost, is adjusted to recognize the Company’s share of net earnings or losses of the investee company as they occur, limited to the extent of the Company’s investment in, advances to and commitments for the investee. The Company’s share of net income or losses of the investee are reflected in “Gains on investments in affiliates, net of tax” in the Company’s Consolidated Statements of Operations. As of July 31, 2017 and 2016, the value of these investments was fully impaired. For the fiscal year ended July 31, 2015, the Company recorded an immaterial amount of its proportionate share of the affiliates’ gains.
The Company assesses the need to record impairment losses on its investments and records such losses when the impairment of an investment is determined to be other than temporary in nature. The process of assessing whether a particular investment’s net realizable value is less than its carrying cost requires a significant amount of judgment. This valuation process is based primarily on information that the Company requests from these privately held companies who are not subject to the same disclosure and audit requirements as the reports required of U.S. public companies. As such, the reliability and accuracy of the data may vary. Based on the Company’s evaluation, it recorded impairment charges related to its investments in privately held companies of $42 thousand and $7.3 million for fiscal years ended July 31, 2016 and 2015, respectively. These impairment losses are reflected in “Impairment of investments in affiliates” in the Company’s Consolidated Statements of Operations.
Estimating the net realizable value of investments in privately held early-stage technology companies is inherently subjective and has contributed to significant volatility in our reported results of operations in the past and it may negatively impact our results of operations in the future.
36
Table of Contents
At the time an equity method investee issues its stock to unrelated parties, the Company accounts for that share issuance as if the Company has sold a proportionate share of its investment. The Company records any gain or loss resulting from an equity method investee’s share issuance in its Consolidated Statements of Operations. During fiscal years ended July 31, 2016, 2015, and
2014, no such gains or losses had been recorded related to any @Ventures investments.
Income Taxes
Income taxes are accounted for under the provisions of ASC Topic 740, “Income Taxes” (“ASC Topic 740”) using the asset and liability method whereby deferred tax assets and liabilities are recognized for the estimated future tax consequences attributable to differences between the financial statement carrying amounts of existing assets and liabilities and their respective tax bases. Deferred tax assets and liabilities are measured using enacted tax rates in effect for the year in which those temporary differences are expected to be recovered or settled. The effect on deferred tax assets and liabilities of a change in tax rates is
recognized in income in the period that includes the enactment date. Deferred tax assets must be reduced by a valuation allowance, if based on the weight of available evidence it is more likely than not that some portion or all of the recorded deferred tax assets will not be realized in future periods. This methodology is subjective and requires significant estimates and judgments in the determination of the recoverability of deferred tax assets and in the calculation of certain tax liabilities. At July 31, 2017, 2016 and 2015, a valuation allowance has been recorded against the deferred tax asset in the U.S. and certain of its foreign subsidiaries since management believes that after considering all the available objective evidence, both positive and negative, historical and prospective, with greater weight given to historical evidence, it is more likely than not that these assets will not be realized. In each reporting period, we evaluate the adequacy of our valuation allowance on our deferred tax assets. In the future, if the Company is
able to demonstrate a consistent trend of pre-tax income, then at that time management may reduce its valuation allowance, accordingly. The Company’s federal, state and foreign net operating loss carryforwards at July 31, 2017 totaled approximately $2.1 billion, $209.8 million and $84.1 million, respectively. A 5% reduction in the Company’s current valuation allowance on these federal and state net operating loss carryforwards would result in an income tax benefit of approximately $37.5 million.
In addition, the calculation of the Company’s tax liabilities involves dealing with uncertainties in the application of complex tax regulations in several tax jurisdictions. The Company is periodically reviewed by domestic and foreign tax authorities regarding the amount of taxes due. These reviews include questions regarding the timing and amount of deductions and the allocation of income among various tax jurisdictions. In evaluating the exposure associated with various filing positions, we record estimated reserves for exposures. Based on our evaluation of current tax positions, the Company believes it has appropriately accrued for exposures as of July 31, 2017.
Recent Accounting Pronouncements
In May 2014, the FASB issued ASU No. 2014-09, Revenue from Contracts with Customers (Topic 606), which supersedes the revenue recognition requirements in ASC 605, Revenue Recognition. This ASU is based on the principle that revenue is recognized to depict the transfer of goods or services to customers in an amount that reflects the consideration to which the entity expects to be entitled in exchange for those goods or services. The ASU also requires additional disclosure about the nature, amount, timing and uncertainty of revenue and cash flows arising from customer contracts, including significant judgments and changes in judgments and assets recognized from costs incurred to obtain or fulfill a contract. The effective date will be the first quarter of fiscal year 2019 using one of two retrospective application methods or a cumulative effect approach. The Company is evaluating the potential effects on the consolidated financial statements.
In August 2014, the FASB issued ASU No. 2014-15 Presentation of Financial Statements—Going Concern (Subtopic 205-40), which amends the accounting guidance related to the evaluation of an entity’s ability to continue as a going concern. The amendment establishes management’s responsibility to evaluate whether there is substantial doubt about an entity’s ability to continue as a going concern in connection with preparing financial statements for each annual and interim reporting period. The update also gives guidance to determine whether to disclose information about relevant conditions and events when there is substantial doubt about an entity’s ability to continue as a going concern. This guidance will be effective for the Company as of the first quarter of fiscal year 2018. The new guidance is not anticipated to have an effect on the Company’s consolidated financial statements.
In April 2015, the FASB issued ASU No. 2015-03, Interest—Imputation of Interest (Subtopic 835-30)—Simplifying the Presentation of Debt Issuance Costs, which requires debt issuance costs related to a recognized debt liability to be presented in the balance sheet as a direct deduction from the debt liability rather than as an asset. The Company adopted this guidance beginning in the first quarter of fiscal year 2017. Upon adoption, an entity must apply the guidance retrospectively to all prior periods presented in the financial statements. As such, the prior year consolidated balance sheets were also adjusted.
37
Table of Contents
In July 2015, the FASB issued ASU No. 2015-11, Simplifying the Measurement of Inventory (Topic 330), which provides guidance related to inventory measurement. The new standard requires entities to measure inventory at the lower of cost and net realizable value thereby simplifying the current guidance under which an entity must measure inventory at the lower of cost or market. The new standard is effective for the Company beginning in the first quarter of fiscal year 2018. The adoption of the guidance is not expected to have material impact on the Company’s financial statement disclosures, results of operations and financial position.
In November 2015, the FASB issued ASU No. 2015-17, Balance Sheet Classification of Deferred Taxes, which requires companies to classify all deferred tax assets and liabilities as noncurrent on the balance sheet instead of separating deferred taxes into current and noncurrent amounts. This guidance allowed for adoption on either a prospective or retrospective basis. The Company had elected to early adopt this guidance on a prospective basis and, as a result, prior consolidated balance sheets were not retrospectively adjusted. The adoption of this guidance did increase the assets and liabilities balance on the Company’s consolidated financial statements and related disclosures.
In February 2016, the FASB issued ASU No. 2016-02, Leases, which requires lessees to put most leases on their balance sheets but recognize expenses on their income statements in a manner similar to today’s accounting. This ASU will be effective for the Company beginning in the first quarter of fiscal year 2020. The Company is currently evaluating the effect the guidance will have on the Company’s financial statement disclosures, results of operations and financial position.
In March 2016, the FASB issued ASU No. 2016-08, Revenue from Contracts with Customers (Topic 606): Principal versus Agent Considerations (Reporting Revenue Gross versus Net). The amendments in this update relate to when another party, along with the Company, are involved in providing a good or service to a customer and are intended to improve the operability and understandability of the implementation guidance on principal versus agent. Revenue recognition guidance requires companies to determine whether the nature of its promise is to provide that good or service to the customer (i.e., the Company is a principal) or to arrange for the good or service to be provided to the customer by the other party (i.e., the Company is an agent). This ASU will be effective for the Company beginning in the first quarter of fiscal year 2019. The Company is currently in the process of assessing what impact this new update may have on its consolidated financial statements.
In March 2016, the FASB issued ASU No. 2016-09, Compensation-Stock Compensation (Topic 718): Improvements to Employee Share-Based Payment Accounting. Several aspects of the accounting for share-based payment award transactions are simplified, including: (a) income tax consequences; (b) classification of awards as either equity or liabilities; and (c) classification on the statement of cash flows. This ASU will be effective for the Company beginning in the first quarter of fiscal year 2018. The adoption of the guidance is not expected to have material impact on the Company’s financial statement disclosures, results of operations and financial position.
In November 2016, the FASB issued ASU No. 2016-18, Restricted Cash. When cash, cash equivalents, restricted cash and restricted cash equivalents are presented in more than one line item on the balance sheet, the new guidance requires a reconciliation of the totals in the statement of cash flows to the related captions in the balance sheet. Entities will also have to disclose the nature of their restricted cash and restricted cash equivalent balances, which is similar to what is required today for Securities and Exchange Commission Registrants. This ASU will be effective for the Company beginning in the first quarter of fiscal year 2019. The Company is currently in the process of assessing what impact this new standard may have on its combined financial statements but does not believe that implementing this standard will have a significant impact on the Company’s current presentation and disclosures.
In March 2017, the FASB issued ASU No. 2017-07, Compensation—Retirement Benefits (Topic 715), which requires that the service cost component of net periodic pension and postretirement benefit cost be presented in the same line item as other employee compensation costs, while the other components be presented separately as non-operating income (expense). This ASU will be effective for the Company beginning in the first quarter of fiscal year 2019. The Company is currently in the process of assessing what impact this new standard may have on its consolidated financial statements.
Protective Amendment
On October 9, 2014, the Tax Plan was amended by our Board of Directors to extend the expiration of the Tax Plan until October 17, 2017. Following the stockholders’ approval of the Protective Amendment (as described in the following paragraphs) at the Company’s 2014 Annual Meeting, the Tax Plan was further amended so that it expired at the close of business on December 31, 2014.
On December 29, 2014, the Company filed an Amendment to its Restated Certificate of Incorporation (the “Protective Amendment”) with the Delaware Secretary of State to protect the significant potential long-term tax benefits presented by its net
38
Table of Contents
operating losses and other tax benefits (collectively, the “NOLs”). The Protective Amendment was approved by the Company’s stockholders at the Company’s 2014 Annual Meeting of Stockholders held on December 9, 2014. As a result of the filing of the Protective Amendment with the Delaware Secretary of State, the Company amended its Tax Benefit Preservation Plan so that it expired at the close of business on December 31, 2014.
The Protective Amendment limits certain transfers of the Company’s common stock, to assist the Company in protecting the long-term value of its accumulated NOLs. The Protective Amendment’s transfer restrictions generally restrict any direct or indirect transfers of the common stock if the effect would be to increase the direct or indirect ownership of the common stock by any person (as defined in the Protective Amendment) from less than 4.99% to 4.99% or more of the common stock, or increase the percentage of the common stock owned directly or indirectly by a Person owning or deemed to own 4.99% or more of the common stock. Any direct or indirect transfer attempted in violation of the Protective Amendment will be void as of the date of the prohibited transfer as to the purported transferee. The Board of Directors of the Company has discretion to grant waivers to permit transfers otherwise restricted by the Protective Amendment.
In accordance with the Protective Amendment, Handy & Harman (“HNH”), a related party, requested, and the Company granted HNH and its affiliates, a waiver under the Protective Amendment to permit their acquisition of up to 45% of the Company’s outstanding shares of common stock in the aggregate (subject to proportionate adjustment, the “45% Cap”), in addition to acquisitions of common stock in connection with the exercise of certain warrants of the Company (the “Warrants”) held by Steel Partners Holdings L.P. (“SPH”), an affiliate of HNH, as well as a limited waiver under Section 203 of the Delaware General Corporation Law for this purpose. Notwithstanding the foregoing, HNH and its affiliates (and any group of which HNH or any of its affiliates is a member) are not permitted to acquire securities that would result in an “ownership change” of the Company for purposes of Section 382 of the Internal Revenue Code of 1986, as amended, that would have the effect of impairing any of the Company’s NOLs. The foregoing waiver was approved by the independent directors of the Company.
| ITEM 7A.— | QUANTITATIVE AND QUALITATIVE DISCLOSURES ABOUT MARKET RISK |
The Company is exposed to the impact of interest rate changes, foreign currency exchange rate fluctuations and changes in the market values of its investments. The carrying values of financial instruments including cash and cash equivalents, accounts receivable, accounts payable and the revolving line of credit, approximate fair value because of the short-term nature of these instruments. The carrying value of capital lease obligations approximates fair value, as estimated by using discounted future cash flows based on the Company’s current incremental borrowing rates for similar types of borrowing arrangements.
As a matter of policy, the Company does not enter into derivative financial instruments for trading purposes. All derivative positions are used to reduce risk by hedging underlying economic or market exposure and are valued at their fair value on our consolidated balance sheets and adjustments to the fair value during this holding period are recorded in the Consolidated Statements of Operations. As of July 31, 2017, the Company did not have any foreign currency exchange contracts outstanding.
Interest Rate Risk
At July 31, 2017, the Company did not have an outstanding balance under its Credit Facility and the Company did not have any open derivative positions with respect to its borrowing arrangements.
We maintain a portfolio of highly liquid cash equivalents typically maturing in three months or less as of the date of purchase. We place our investments in instruments that meet high credit quality standards, as specified in our investment policy and include corporate and state municipal obligations such as commercial paper, certificates of deposit and institutional market funds.
Foreign Currency Risk
The Company has operations in various countries and currencies throughout the world and its operating results and financial position are subject to exposure from fluctuations in foreign currency exchange rates. The Company has historically used derivative financial instruments, principally foreign currency exchange rate contracts, to minimize the transaction exposure that results from such fluctuations. As of July 31, 2017, the Company did not have any derivative financial instruments.
In the year ended July 31, 2017, approximately 76% of the Company’s consolidated net revenue was generated internationally. A portion of our international sales made by our foreign business units in their respective countries is denominated in the local currency of each country. These business units also incur a majority of their expenses in the local currency.
Primary currencies include Euros, Singapore Dollars, Chinese Renminbi, Czech Koruna, Taiwan Dollars, Japanese Yen, and Australian Dollars. The statements of operations of our international operations are translated into U.S. dollars at the average exchange rates in each applicable period. To the extent the U.S. dollar weakens against foreign currencies, the translation of these
39
Table of Contents
foreign currency-denominated transactions results in increased revenue and operating expenses for our international operations. Similarly, our revenue and operating expenses will decrease for our international operations when the U.S. dollar strengthens against foreign currencies. While we attempt to balance local currency revenue to local currency expenses to provide in effect a natural hedge, it is not always possible to completely reduce the foreign currency exchange rate risk due to competitive and other reasons.
The conversion of the foreign subsidiaries’ financial statements into U.S. dollars will lead to a translation gain or loss which is recorded as a component of other comprehensive income (loss). For the fiscal year ended July 31, 2017, we recorded foreign currency translation gains of $1.4 million, which are recorded within accumulated other comprehensive income in Stockholders’ Equity in our consolidated balance sheet. In addition, certain of our foreign subsidiaries have assets and liabilities that are denominated in currencies other than the relevant entity’s functional currency. Changes in the functional currency value of these assets and liabilities create fluctuations that will lead to a transaction gain or loss. For the fiscal year ended July 31, 2017, we
recorded foreign currency transaction gains of $0.2 million which are recorded in “Other gains (losses), net” in our Consolidated Statement of Operations.
Our international business is subject to risks, including, but not limited to differing economic conditions, changes in political climate, differing tax structures, other regulations and restrictions, and foreign currency exchange rate volatility when compared to the United States. Accordingly, our future results could be materially adversely impacted by significant changes in these or other factors. As exchange rates vary, our international financial results may vary from expectations and adversely impact our overall operating results.
40
Table of Contents
ITEM 8.— FINANCIAL STATEMENTS AND SUPPLEMENTARY DATA
INDEX TO CONSOLIDATED FINANCIAL STATEMENTS
41
Table of Contents
Report of Independent Registered Public Accounting Firm
Board of Directors and Stockholders
ModusLink Global Solutions, Inc.
Waltham, Massachusetts
We have audited the accompanying consolidated balance sheets of ModusLink Global Solutions, Inc. as of July 31, 2017 and 2016 and the related consolidated statements of operations, comprehensive loss, stockholders’ equity, and cash flows for each of the three years in the period ended July 31, 2017. These financial statements are the responsibility of the Company’s management. Our responsibility is to express an opinion on these financial statements based on our audits.
We conducted our audits in accordance with the standards of the Public Company Accounting Oversight Board (United States). Those standards require that we plan and perform the audit to obtain reasonable assurance about whether the financial statements are free of material misstatement. An audit includes examining, on a test basis, evidence supporting the amounts and disclosures in the financial statements, assessing the accounting principles used and significant estimates made by management, as well as evaluating the overall financial statement presentation. We believe that our audits provides a reasonable basis for our opinion.
In our opinion, the consolidated financial statements referred to above present fairly, in all material respects, the financial position of ModusLink Global Solutions, Inc. at July 31, 2017 and 2016, and the results of its operations and its cash flows for each of the three years in the period ended July 31, 2017, in conformity with accounting principles generally accepted in the United States of America.
We also have audited, in accordance with the standards of the Public Company Accounting Oversight Board (United States), ModusLink Global Solutions, Inc.’s internal control over financial reporting as of July 31, 2017, based on criteria established in Internal Control – Integrated Framework (2013) issued by the Committee of Sponsoring Organizations of the Treadway Commission (the COSO criteria) and our report dated October 16, 2017 expressed an adverse opinion thereon.
/s/ BDO USA, LLP
Boston, Massachusetts
October 16, 2017
42
Table of Contents
MODUSLINK GLOBAL SOLUTIONS, INC. AND SUBSIDIARIES
CONSOLIDATED BALANCE SHEETS
(in thousands, except share data)
| July 31, 2017 | July 31, 2016 | |||||||
| ASSETS | ||||||||
| Current assets: |
||||||||
| Cash and cash equivalents |
$ | 110,670 | $ | 130,790 | ||||
| Trading securities |
11,898 | 16,768 | ||||||
| Accounts receivable, trade, net of allowance for doubtful accounts of $616 and $489 at July 31, 2017 and July 31, 2016, respectively |
81,450 | 111,336 | ||||||
| Inventories |
34,369 | 40,270 | ||||||
| Funds held for clients |
13,454 | 12,549 | ||||||
| Prepaid expenses and other current assets |
6,005 | 8,178 | ||||||
|
|
|
|
|
|||||
| Total current assets |
257,846 | 319,891 | ||||||
| Property and equipment, net |
18,555 | 22,271 | ||||||
| Other assets |
4,897 | 5,770 | ||||||
|
|
|
|
|
|||||
| Total assets |
$ | 281,298 | $ | 347,932 | ||||
|
|
|
|
|
|||||
| LIABILITIES AND STOCKHOLDERS’ EQUITY | ||||||||
| Current liabilities: |
||||||||
| Accounts payable |
$ | 71,476 | $ | 114,432 | ||||
| Accrued restructuring |
186 | 2,936 | ||||||
| Accrued expenses |
37,898 | 37,740 | ||||||
| Funds held for clients |
13,454 | 12,549 | ||||||
| Other current liabilities |
26,141 | 27,109 | ||||||
|
|
|
|
|
|||||
| Total current liabilities |
149,155 | 194,766 | ||||||
|
|
|
|
|
|||||
| Long-term portion of accrued restructuring |
— | 93 | ||||||
| Notes payable |
59,758 | 57,169 | ||||||
| Other long-term liabilities |
9,414 | 9,964 | ||||||
|
|
|
|
|
|||||
| Long-term liabilities |
69,172 | 67,226 | ||||||
|
|
|
|
|
|||||
| Total liabilities |
218,327 | 261,992 | ||||||
|
|
|
|
|
|||||
| Commitments and contingencies (Note 10) |
||||||||
| Stockholders’ equity: |
||||||||
| Preferred stock, $0.01 par value per share. Authorized 5,000,000 shares; zero issued or outstanding shares at July 31, 2017 and July 31, 2016 |
— | — | ||||||
| Common stock, $0.01 par value per share. Authorized 1,400,000,000 shares; 55,555,973 issued and outstanding shares at July 31, 2017; 55,249,076 issued and outstanding shares at July 31, 2016 |
556 | 553 | ||||||
| Additional paid-in capital |
7,457,051 | 7,456,490 | ||||||
| Accumulated deficit |
(7,398,949 | ) | (7,373,122 | ) | ||||
| Accumulated other comprehensive income |
4,313 | 2,019 | ||||||
|
|
|
|
|
|||||
| Total stockholders’ equity |
62,971 | 85,940 | ||||||
|
|
|
|
|
|||||
| Total liabilities and stockholders’ equity |
$ | 281,298 | $ | 347,932 | ||||
|
|
|
|
|
|||||
The accompanying notes are an integral part of these consolidated financial statements.
43
Table of Contents
MODUSLINK GLOBAL SOLUTIONS, INC. AND SUBSIDIARIES
CONSOLIDATED STATEMENTS OF OPERATIONS
(in thousands, except per share amounts)
| Twelve Months Ended July 31, | ||||||||||||
| 2017 | 2016 | 2015 | ||||||||||
| Net revenue |
$ | 436,620 | $ | 459,023 | $ | 561,673 | ||||||
| Cost of revenue |
400,255 | 434,265 | 507,188 | |||||||||
|
|
|
|
|
|
|
|||||||
| Gross profit |
36,365 | 24,758 | 54,485 | |||||||||
|
|
|
|
|
|
|
|||||||
| Operating expenses |
||||||||||||
| Selling, general and administrative |
54,159 | 57,604 | 59,667 | |||||||||
| Amortization of intangible assets |
— | — | 667 | |||||||||
| Impairment of goodwill and long-lived assets |
— | 305 | 3,360 | |||||||||
| Restructuring, net |
1,967 | 7,421 | 5,130 | |||||||||
|
|
|
|
|
|
|
|||||||
| Total operating expenses |
56,126 | 65,330 | 68,824 | |||||||||
|
|
|
|
|
|
|
|||||||
| Operating loss |
(19,761 | ) | (40,572 | ) | (14,339 | ) | ||||||
|
|
|
|
|
|
|
|||||||
| Other income (expense): |
||||||||||||
| Interest income |
399 | 668 | 893 | |||||||||
| Interest expense |
(8,247 | ) | (10,924 | ) | (10,618 | ) | ||||||
| Other gains (losses), net |
3,200 | (5,757 | ) | 15,005 | ||||||||
| Impairment of investments in affiliates |
— | (42 | ) | (7,295 | ) | |||||||
|
|
|
|
|
|
|
|||||||
| Total other income (expense) |
(4,648 | ) | (16,055 | ) | (2,015 | ) | ||||||
|
|
|
|
|
|
|
|||||||
| Loss before income taxes |
(24,409 | ) | (56,627 | ) | (16,354 | ) | ||||||
| Income tax expense |
2,696 | 5,443 | 2,283 | |||||||||
| Gains on investments in affiliates, net of tax |
(1,278 | ) | (789 | ) | (208 | ) | ||||||
|
|
|
|
|
|
|
|||||||
| Net loss |
$ | (25,827 | ) | $ | (61,281 | ) | $ | (18,429 | ) | |||
|
|
|
|
|
|
|
|||||||
| Basic and diluted net loss per share: |
$ | (0.47 | ) | $ | (1.18 | ) | $ | (0.35 | ) | |||
| Weighted average common shares used in basic and diluted earnings per share |
55,134 | 51,934 | 51,940 | |||||||||
The accompanying notes are an integral part of these consolidated financial statements.
44
Table of Contents
MODUSLINK GLOBAL SOLUTIONS, INC. AND SUBSIDIARIES
CONSOLIDATED STATEMENTS OF COMPREHENSIVE LOSS
(in thousands)
| Twelve Months Ended July 31, | ||||||||||||
| 2017 | 2016 | 2015 | ||||||||||
| Net loss |
$ | (25,827 | ) | $ | (61,281 | ) | $ | (18,429 | ) | |||
| Other comprehensive loss: |
||||||||||||
| Foreign currency translation adjustment |
1,391 | (1,539 | ) | (8,163 | ) | |||||||
| Pension liability adjustments, net of tax |
830 | — | (2,306 | ) | ||||||||
| Net unrealized holding gain (loss) on securities, net of tax |
73 | 48 | 11 | |||||||||
|
|
|
|
|
|
|
|||||||
| Other comprehensive gain (loss) |
2,294 | (1,491 | ) | (10,458 | ) | |||||||
|
|
|
|
|
|
|
|||||||
| Comprehensive loss |
$ | (23,533 | ) | $ | (62,772 | ) | $ | (28,887 | ) | |||
|
|
|
|
|
|
|
|||||||
The accompanying notes are an integral part of these consolidated financial statements.
45
Table of Contents
MODUSLINK GLOBAL SOLUTIONS, INC. AND SUBSIDIARIES
CONSOLIDATED STATEMENTS OF STOCKHOLDERS’ EQUITY
(in thousands, except share amounts)
| Number of Shares |
Common Stock |
Additional Paid-in Capital |
Accumulated Deficit |
Accumulated Other Comprehensive Income |
Total Stockholders’ Equity |
|||||||||||||||||||
| Balance at July 31, 2014 |
52,100,763 | $ | 521 | $ | 7,450,541 | $ | (7,293,412 | ) | $ | 13,968 | $ | 171,618 | ||||||||||||
| Net loss |
(18,429 | ) | (18,429 | ) | ||||||||||||||||||||
| Equity portion of convertible senior notes |
— | |||||||||||||||||||||||
| Issuance of common stock pursuant to employee stock purchase plan and stock option exercises |
33,358 | — | 113 | — | — | 113 | ||||||||||||||||||
| Restricted stock grants |
111,110 | 1 | (1 | ) | — | — | — | |||||||||||||||||
| Restricted stock forfeitures |
(11,343 | ) | — | — | — | — | — | |||||||||||||||||
| Share-based compensation |
— | — | 1,757 | — | — | 1,757 | ||||||||||||||||||
| Other comprehensive items |
— | — | — | — | (10,458 | ) | (10,458 | ) | ||||||||||||||||
|
|
|
|
|
|
|
|
|
|
|
|
|
|||||||||||||
| Balance at July 31, 2015 |
52,233,888 | 522 | 7,452,410 | (7,311,841 | ) | 3,510 | 144,601 | |||||||||||||||||
| Net loss |
(61,281 | ) | (61,281 | ) | ||||||||||||||||||||
| Equity portion of convertible notes |
— | — | (64 | ) | — | — | (64 | ) | ||||||||||||||||
| Issuance of common stock to Highbridge International LLC and Highbridge Tactical Credit & Convertibles Master Fund, L.P. |
2,656,336 | 27 | 3,107 | — | — | 3,134 | ||||||||||||||||||
| Issuance of common stock pursuant to employee stock purchase plan and stock option exercises |
70,136 | — | 51 | — | — | 51 | ||||||||||||||||||
| Restricted stock grants |
340,259 | 4 | (4 | ) | — | — | — | |||||||||||||||||
| Restricted stock forfeitures |
(51,543 | ) | — | (136 | ) | — | — | (136 | ) | |||||||||||||||
| Share-based compensation |
— | — | 1,126 | — | — | 1,126 | ||||||||||||||||||
| Other comprehensive items |
— | — | — | — | (1,491 | ) | (1,491 | ) | ||||||||||||||||
|
|
|
|
|
|
|
|
|
|
|
|
|
|||||||||||||
| Balance at July 31, 2016 |
55,249,076 | 553 | 7,456,490 | (7,373,122 | ) | 2,019 | 85,940 | |||||||||||||||||
| Net loss |
(25,827 | ) | (25,827 | ) | ||||||||||||||||||||
| Equity portion of convertible notes |
— | — | (135 | ) | — | — | (135 | ) | ||||||||||||||||
| Issuance of common stock pursuant to employee stock purchase plan and stock option exercises |
10,605 | — | 18 | — | — | 18 | ||||||||||||||||||
| Restricted stock grants |
296,292 | 3 | (3 | ) | — | — | — | |||||||||||||||||
| Share-based compensation |
— | — | 681 | — | — | 681 | ||||||||||||||||||
| Other comprehensive items |
— | — | — | — | 2,294 | 2,294 | ||||||||||||||||||
|
|
|
|
|
|
|
|
|
|
|
|
|
|||||||||||||
| Balance at July 31, 2017 |
55,555,973 | $ | 556 | $ | 7,457,051 | $ | (7,398,949 | ) | $ | 4,313 | $ | 62,971 | ||||||||||||
|
|
|
|
|
|
|
|
|
|
|
|
|
|||||||||||||
The accompanying notes are an integral part of these consolidated financial statements.
46
Table of Contents
MODUSLINK GLOBAL SOLUTIONS, INC. AND SUBSIDIARIES
CONSOLIDATED STATEMENTS OF CASH FLOWS
(in thousands)
| Twelve Months Ended July 31, | ||||||||||||
| 2017 | 2016 | 2015 | ||||||||||
| Cash flows from operating activities: |
||||||||||||
| Net loss |
$ | (25,827 | ) | $ | (61,281 | ) | $ | (18,429 | ) | |||
| Adjustments to reconcile net loss to net cash used in operating activities: |
||||||||||||
| Depreciation |
8,206 | 8,119 | 8,668 | |||||||||
| Amortization of intangible assets |
— | — | 667 | |||||||||
| Amortization of deferred financing costs |
566 | 733 | 557 | |||||||||
| Accretion of debt discount |
3,919 | 4,967 | 4,473 | |||||||||
| Impairment of goodwill and long-lived assets |
261 | 305 | 3,360 | |||||||||
| Share-based compensation |
681 | 1,126 | 1,757 | |||||||||
| Non-cash (gains) losses, net |
(3,200 | ) | 4,519 | (15,005 | ) | |||||||
| (Gains) losses on investments in affiliates and impairments |
(1,278 | ) | (747 | ) | 7,087 | |||||||
| Changes in operating assets and liabilities: |
||||||||||||
| Trade accounts receivable, net |
31,102 | 19,130 | (14,970 | ) | ||||||||
| Inventories |
6,852 | 7,752 | 11,839 | |||||||||
| Prepaid expenses and other current assets |
1,572 | 10,763 | (26,580 | ) | ||||||||
| Accounts payable, accrued restructuring and accrued expenses |
(45,314 | ) | (4,245 | ) | 22,258 | |||||||
| Refundable and accrued income taxes, net |
(1,014 | ) | 2,660 | 367 | ||||||||
| Other assets and liabilities |
(971 | ) | (13,589 | ) | 33,145 | |||||||
|
|
|
|
|
|
|
|||||||
| Net cash used in operating activities |
(24,445 | ) | (19,788 | ) | 19,194 | |||||||
|
|
|
|
|
|
|
|||||||
| Cash flows from investing activities: |
||||||||||||
| Additions to property and equipment |
(4,730 | ) | (7,936 | ) | (8,518 | ) | ||||||
| Proceeds from the disposition of property and equipment |
187 | 1,318 | — | |||||||||
| Proceeds from the termination of defined benefit pension plan |
905 | — | — | |||||||||
| Purchase of Trading Securities |
— | (1,220 | ) | (69,221 | ) | |||||||
| Proceeds from the sale of Trading Securities |
7,998 | 59,327 | 2,325 | |||||||||
| Investments in affiliates |
— | (42 | ) | (323 | ) | |||||||
| Proceeds from investments in affiliates |
1,278 | 789 | 408 | |||||||||
|
|
|
|
|
|
|
|||||||
| Net cash provided by investing activities |
5,638 | 52,236 | (75,329 | ) | ||||||||
|
|
|
|
|
|
|
|||||||
| Cash flows from financing activities: |
||||||||||||
| Purchase of the Company’s Convertible Notes |
(1,763 | ) | (20,257 | ) | — | |||||||
| Repayments on capital lease obligations |
(171 | ) | (228 | ) | (216 | ) | ||||||
| Net proceeds from revolving line of credit |
— | — | (4,453 | ) | ||||||||
| Proceeds from issuance of common stock |
18 | 51 | 113 | |||||||||
| Repurchase of common stock |
— | (127 | ) | — | ||||||||
|
|
|
|
|
|
|
|||||||
| Net cash used in financing activities |
(1,916 | ) | (20,561 | ) | (4,556 | ) | ||||||
|
|
|
|
|
|
|
|||||||
| Net effect of exchange rate changes on cash and cash equivalents |
603 | (528 | ) | (3,393 | ) | |||||||
|
|
|
|
|
|
|
|||||||
| Net increase (decrease) in cash and cash equivalents |
(20,120 | ) | 11,359 | (64,084 | ) | |||||||
| Cash and cash equivalents at beginning of period |
130,790 | 119,431 | 183,515 | |||||||||
|
|
|
|
|
|
|
|||||||
| Cash and cash equivalents at end of period |
$ | 110,670 | $ | 130,790 | $ | 119,431 | ||||||
|
|
|
|
|
|
|
|||||||
The accompanying notes are an integral part of these consolidated financial statements.
47
Table of Contents
MODUSLINK GLOBAL SOLUTIONS, INC. AND SUBSIDIARIES
NOTES TO CONSOLIDATED FINANCIAL STATEMENTS
| (1) | NATURE OF OPERATIONS |
ModusLink Global Solutions, Inc. (together with its consolidated subsidiaries, “ModusLink Global Solutions” or the “Company”), through its wholly owned subsidiaries, ModusLink Corporation (“ModusLink”) and ModusLink PTS, Inc. (“ModusLink PTS”), is a leader in global supply chain business process management serving clients in markets such as consumer electronics, communications, computing, medical devices, software, and retail. The Company designs and executes critical elements in its clients’ global supply chains to improve speed to market, product customization, flexibility, cost, quality and service. These benefits are delivered through a combination of industry expertise, innovative service solutions, integrated operations, proven business processes, expansive global footprint and world-class technology.
The Company has an integrated network of strategically located facilities in various countries, including numerous sites throughout North America, Europe and Asia. The Company previously operated under the names CMGI, Inc. and CMG Information Services, Inc. and was incorporated in Delaware in 1986.
| (2) | SUMMARY OF SIGNIFICANT ACCOUNTING POLICIES |
The accompanying consolidated financial statements reflect the application of certain significant accounting policies described below.
Principles of Consolidation
The accompanying consolidated financial statements of the Company include the results of its wholly-owned and majority- owned subsidiaries. All significant intercompany transactions and balances have been eliminated in consolidation. The Company accounts for investments in businesses in which it owns between 20% and 50% of the voting interest using the equity method, if the Company has the ability to exercise significant influence over the investee company. All other investments in privately held businesses over which the Company does not have the ability to exercise significant influence, or for which there is not a readily determinable market value, are accounted for under the cost method of accounting.
Use of Estimates
The preparation of the Company’s consolidated financial statements in conformity with accounting principles generally accepted in the U.S. requires management to make estimates and assumptions that affect the reported amounts of assets and liabilities and disclosure of contingent assets and liabilities at the date of the financial statements, and the reported amounts of revenue and expenses during the reporting period. On an ongoing basis, the Company evaluates its estimates including those related to revenue recognition, allowance for doubtful accounts, inventories, fair value of its trading and available-for-sale securities, intangible assets, income taxes, restructuring, valuation of long-lived assets, impairments, contingencies, restructuring charges, litigation, pension obligations and the fair value of stock options and share bonus awards granted under the Company’s stock based compensation plans. Accounting estimates are based on historical experience and various assumptions that are considered reasonable under the circumstances. However, because these estimates inherently involve judgments and uncertainties, actual results could differ materially from those estimated.
Revenue Recognition
The Company’s revenue primarily comes from the sale of supply chain management services to its clients. Amounts billed to clients under these arrangements include revenue attributable to the services performed as well as for materials procured on the Company’s clients’ behalf as part of its service to them. Other sources of revenue include the sale of products and other services. Revenue is recognized for services when the services are performed and for product sales when the products are shipped or in certain cases when products are built and title had transferred, if the client has also contracted with us for warehousing and/or logistics services for a separate fee, assuming all other applicable revenue recognition criteria are met.
The Company recognizes revenue in accordance with the provisions of the Accounting Standards Codification (“ASC”) Topic 605, “Revenue Recognition” (“ASC Topic 605”). Specifically, the Company recognizes revenue when persuasive evidence of an arrangement exists, title and risk of loss have passed or services have been rendered, the sales price is fixed or determinable and collection of the related receivable is reasonably assured. The Company’s shipping terms vary by client and can include FOB
48
Table of Contents
shipping point, which means that risk of loss passes to the client when it is shipped from the Company’s location, as well as other terms such as ex-works, meaning that title and risk of loss transfer upon delivery of product to the customer’s designated carrier. The Company also evaluates the terms of each major client contract relative to a number of criteria that management considers in making its determination with respect to gross versus net reporting of revenue for transactions with its clients. Management’s criteria for making these judgments place particular emphasis on determining the primary obligor in a transaction and which party bears general inventory risk. The Company records all shipping and handling fees billed to clients as revenue, and related costs as cost of sales, when incurred.
The Company applies the provisions of ASC Topic 985, “Software” (“ASC Topic 985”), with respect to certain transactions involving the sale of software products by the Company’s e-Business operations.
The Company applies the guidance of Accounting Standards Codification (“ASC”) 605-25 “Revenue – Multiple-Element Arrangements” for determining whether an arrangement involving more than one deliverable contains more than one unit of accounting and how the arrangement consideration should be measured and allocated to the separate units of accounting. Under this guidance, when vendor specific objective evidence or third party evidence for deliverables in an arrangement cannot be determined, a best estimate of the selling price is required to separate deliverables and allocate arrangement consideration using the relative selling price method. For those contracts which contain multiple deliverables, management must first determine whether each service, or deliverable, meets the separation criteria. In general, a deliverable (or a group of deliverables) meets the separation criteria if the deliverable has standalone value to the client. Each deliverable that meets the separation criteria is considered a “separate unit of accounting.” Management allocates the total arrangement consideration to each separate unit of accounting based on the relative selling price of each separate unit of accounting. After the arrangement consideration has been allocated to each separate unit of accounting, management applies the appropriate revenue recognition method for each separate unit of accounting as described previously based on the nature of the arrangement. In general, revenue is recognized upon completion of the last deliverable. All deliverables that do not meet the separation criteria are combined into one unit of accounting and the appropriate revenue recognition method is applied.
Accounts Receivable and Allowance for Doubtful Accounts
The Company’s unsecured accounts receivable are stated at original invoice amount less an estimate made for doubtful receivables based on a monthly review of all outstanding amounts. Management determines the allowance for doubtful accounts by regularly evaluating individual customer receivables and considering each customer’s financial condition, credit history and current economic conditions. The Company writes off accounts receivable when management deems them uncollectible and records recoveries of accounts receivable previously written off when received. When accounts receivable are considered past due, the Company generally does not charge interest on past due balances.
Foreign Currency Translation
All assets and liabilities of the Company’s foreign subsidiaries, whose functional currency is the local currency, are translated to U.S. dollars at the rates in effect at the balance sheet date. All amounts in the Consolidated Statements of Operations are translated using the average exchange rates in effect during the year. Resulting translation adjustments are reflected in the accumulated other comprehensive income (loss) component of stockholders’ equity. Settlement of receivables and payables in a foreign currency that is not the functional currency result in foreign currency transaction gains and losses. Foreign currency transaction gains and losses are included in “Other gains (losses), net” in the Consolidated Statements of Operations.
Cash, Cash Equivalents and Short-term Investments
The Company considers all highly liquid investments with original maturities of three months or less at the time of purchase to be cash equivalents. Investments with maturities greater than three months to twelve months at the time of purchase are considered short- term investments. Cash and cash equivalents consisted of the following:
| July 31, 2017 |
July 31, 2016 |
|||||||
| (In thousands) | ||||||||
| Cash and bank deposits |
$ | 24,987 | $ | 29,566 | ||||
| Money market funds |
85,683 | 101,224 | ||||||
|
|
|
|
|
|||||
| $ | 110,670 | $ | 130,790 | |||||
|
|
|
|
|
|||||
49
Table of Contents
Fair Value of Financial Instruments
The carrying value of cash and cash equivalents, accounts receivable, accounts payable, current liabilities and the revolving line of credit approximate fair value because of the short maturity of these instruments. The carrying value of capital lease obligations approximates fair value, as estimated by using discounted future cash flows based on the Company’s current incremental borrowing rates for similar types of borrowing arrangements. The fair values of the Company’s Trading Securities are estimated using quoted market prices. The fair value of the Company’s Notes payable is $63.9 million as of July 31, 2017, which represents the value at which its lenders could trade its debt with in the financial markets, and does not represent the settlement value of these long-term debt liabilities to us. The fair value of the Notes payable could vary each period based on fluctuations in market interest rates, the Company’s stock price, as well as changes to the Company’s credit ratings. The Notes payable are traded and their fair values are based upon traded prices as of the reporting dates.
The defined benefit plans have assets invested in insurance contracts and bank managed portfolios. Conservation of capital with some conservative growth potential is the strategy for the plans. The Company’s pension plans are outside the United States, where asset allocation decisions are typically made by an independent board of trustees. Investment objectives are aligned to generate returns that will enable the plans to meet their future obligations. The Company acts in a consulting and governance role in reviewing investment strategy and providing a recommended list of investment managers for each plan, with final decisions on asset allocation and investment manager made by local trustees.
ASC Topic 820 provides that fair value is an exit price, representing the price that would be received to sell an asset or paid to transfer a liability in an orderly transaction between market participants based on the highest and best use of the asset or liability. As such, fair value is a market-based measurement that should be determined based on assumptions that market participants would use in pricing an asset or liability. ASC Topic 820 requires the Company to use valuation techniques to measure fair value that maximize the use of observable inputs and minimize the use of unobservable inputs. These inputs are prioritized as follows:
| Level 1: | Observable inputs such as quoted prices for identical assets or liabilities in active markets |
| Level 2: | Other inputs that are observable directly or indirectly, such as quoted prices for similar assets or liabilities or market-corroborated inputs |
| Level 3: | Unobservable inputs for which there is little or no market data and which require the Company to develop its own assumptions about how market participants would price the assets or liabilities |
Investments
Marketable securities held by the Company which meet the criteria for classification as trading securities or available-for-sale are carried at fair value. Gains and losses on securities classified as trading are reflected in other income (expense) in the Company’s Consolidated Statements of Operations. Unrealized holding gains and losses on securities classified as available-for-sale are carried net of income taxes, when applicable, as a component of accumulated other comprehensive income (loss) in the Consolidated Statements of Stockholders’ Equity.
The Company maintained interests in a small number of privately held companies primarily through its various venture capital funds. The Company’s venture capital investment portfolio, @Ventures, invested in early-stage technology companies. These investments are generally made in connection with a round of financing with other third-party investors. Investments in which the Company’s interest is less than 20% and which are not classified as available-for-sale securities, are accounted for under the cost method of accounting, and are carried at the lower of cost or net realizable value. Under this method, the investment balance, originally recorded at is cost, is only adjusted for impairments to the investment. Gains and losses realized upon the sale of the investment are reflected in “Gains on investments in affiliates, net of tax” in the Company’s Consolidated Statements of Operations. If it is determined that the Company exercises significant influence over the investee company, then the equity method of accounting is used. For those investments in which the Company’s voting interest is between 20% and 50%, the equity method of accounting is generally used. Under this method, the investment balance, originally recorded at cost, is adjusted to recognize the Company’s share of net earnings or losses of the investee company as they occur, limited to the extent of the Company’s investment in, advances to and commitments for the investee.
The Company assesses the need to record impairment losses on its investments and records such losses when the impairment of an investment is determined to be other than temporary in nature. The process of assessing whether a particular equity investment’s net realizable value is less than its carrying cost requires a significant amount of judgment. This valuation process is based primarily on information that the Company obtains from these privately held companies who are not subject to the same disclosure and audit requirements as the reports required of U.S. public companies. As such, the timeliness and completeness of the
50
Table of Contents
data may vary. Based on the Company’s evaluation, it recorded impairment charges related to its investments in privately held companies of approximately $42 thousand and $7.3 million for the fiscal years ended July 31, 2016 and 2015, respectively. These impairment losses are reflected in “Impairment of investments in affiliates” in the Company’s Consolidated Statements of Operations.
At the time an equity method investee issues its stock to unrelated parties, the Company accounts for that share issuance as if the Company has sold a proportionate share of its investment. The Company records any gain or loss resulting from an equity method investee’s share issuance in its Consolidated Statements of Operations.
Funds held for clients
Funds held for clients represent assets that are restricted for use solely for the purposes of satisfying the obligations to remit client’s customer funds to the Company’s clients. These funds are classified as a current asset and a corresponding other current liability on the Company’s Consolidated Balance Sheets.
Inventory
Inventories are stated at the lower of cost or market. Cost is determined by both the moving average and the first-in, first-out methods. Materials that the Company typically procures on behalf of its clients that are included in inventory include materials such as compact discs, printed materials, manuals, labels, hardware accessories, hard disk drives, consumer packaging, shipping boxes and labels, power cords and cables for client-owned electronic devices.
Inventories consisted of the following:
| July 31, 2017 |
July 31, 2016 |
|||||||
| (In thousands) | ||||||||
| Raw materials |
$ | 24,129 | $ | 28,506 | ||||
| Work-in-process |
713 | 590 | ||||||
| Finished goods |
9,527 | 11,174 | ||||||
|
|
|
|
|
|||||
| $ | 34,369 | $ | 40,270 | |||||
|
|
|
|
|
|||||
The Company continuously monitors inventory balances and records inventory provisions for any excess of the cost of the inventory over its estimated market value. The Company also monitors inventory balances for obsolescence and excess quantities as compared to projected demands. The Company’s inventory methodology is based on assumptions about average shelf life of inventory, forecasted volumes, forecasted selling prices, contractual provisions with its clients, write-down history of inventory and market conditions. While such assumptions may change from period to period, in determining the net realizable value of its inventories, the Company uses the best information available as of the balance sheet date. If actual market conditions are less favorable than those projected, or the Company experiences a higher incidence of inventory obsolescence because of rapidly changing technology and client requirements, additional inventory provisions may be required. Once established, write-downs of inventory are considered permanent adjustments to the cost basis of inventory and cannot be reversed due to subsequent increases in demand forecasts. Accordingly, if inventory previously written down to its net realizable value is subsequently sold, gross profit margins may be favorably impacted.
Long-Lived Assets, Goodwill and Other Intangible Assets
The Company follows ASC Topic 360, “Property, Plant, and Equipment” (“ASC Topic 360”). Under ASC Topic 360, the Company tests certain long-lived assets or group of assets for recoverability whenever events or changes in circumstances indicate that the Company may not be able to recover the asset’s carrying amount. ASC Topic 360 defines impairment as the condition that exists when the carrying amount of a long-lived asset or group, including property and equipment and other definite-lived intangible assets, exceeds its fair value. The Company evaluates recoverability by determining whether the undiscounted cash flows expected to result from the use and eventual disposition of that asset or group cover the carrying value at the evaluation date. If the undiscounted cash flows are not sufficient to cover the carrying value, the Company measures an impairment loss as the excess of the carrying amount of the long-lived asset or group over its fair value. Management may use third party valuation experts to assist in its determination of fair value.
51
Table of Contents
The Company is required to test goodwill for impairment annually or if a triggering event occurs in accordance with the provisions of ASC Topic 350, “Goodwill and Other” (“ASC Topic 350”). The Company’s policy is to perform its annual impairment testing for all reporting units with goodwill on July 31 of each fiscal year. As a result of the annual impairment analysis and in connection with the preparation of its annual financial statements for the fiscal year ended July 31, 2015, the Company concluded that its remaining goodwill was fully impaired and recorded a $3.1 million non-cash goodwill impairment charge.
The Company’s valuation methodology for assessing impairment of long-lived assets, goodwill and other intangible assets requires management to make judgments and assumptions based on historical experience and on projections of future operating performance. Management may use third party valuation advisors to assist in its determination of the fair value of reporting units subject to impairment testing. The Company operates in highly competitive environments and projections of future operating results and cash flows may vary significantly from actual results. If the assumptions used in estimating the valuations of the Company’s reporting units for purposes of impairment testing differ materially from actual future results, the Company may record impairment charges in the future and our financial results may be materially adversely affected.
Restructuring Expenses
The Company follows the provisions of ASC Topic 420, “Exit or Disposal Cost Obligations”, which addresses financial accounting and reporting for costs associated with exit or disposal activities. The statement requires companies to recognize costs associated with exit or disposal activities when a liability has been incurred rather than at the date of a commitment to an exit or disposal plan. The Company records liabilities that primarily include estimated severance and other costs related to employee benefits and certain estimated costs related to equipment and facility lease obligations and other service contracts. These contractual obligations principally represent future obligations under non-cancelable real estate leases. Restructuring estimates relating to real estate leases involve consideration of a number of factors including: potential sublet rental rates, estimated vacancy period for the property, brokerage commissions and certain other costs. Estimates relating to potential sublet rates and expected vacancy periods are most likely to have a material impact on the Company’s results of operations in the event that actual amounts differ significantly from estimates. These estimates involve judgment and uncertainties, and the settlement of these liabilities could differ materially from recorded amounts.
Property and Equipment
Property, plant and equipment are stated at cost. The costs of additions and improvements are capitalized, while maintenance and repairs are charged to expense as incurred. Depreciation and amortization is provided on the straight-line basis over the estimated useful lives of the respective assets. The Company capitalizes certain computer software development costs when incurred in connection with developing or obtaining computer software for internal use. The estimated useful lives are as follows:
| Buildings | 32 years | |
| Machinery & equipment | 3 to 5 years | |
| Furniture & fixtures | 5 to 7 years | |
| Automobiles | 5 years | |
| Software | 3 to 8 years | |
| Leasehold improvements | Shorter of the remaining lease term or the estimated useful life of the asset |
Income Taxes
Income taxes are accounted for under the provisions of ASC Topic 740, “Income Taxes” (“ASC Topic 740”), using the asset and liability method whereby deferred tax assets and liabilities are recognized for the estimated future tax consequences attributable to differences between the financial statement carrying amounts of existing assets and liabilities and their respective tax bases. Deferred tax assets and liabilities are measured using enacted tax rates in effect for the year in which those temporary differences are expected to be recovered or settled. The effect on deferred tax assets and liabilities of a change in tax rates is recognized in income in the period that includes the enactment date. ASC Topic 740 also requires that the deferred tax assets be reduced by a valuation allowance, if based on the weight of available evidence, it is more likely than not that some portion or all of the recorded deferred tax assets will not be realized in future periods. This methodology is subjective and requires significant estimates and judgments in the determination of the recoverability of deferred tax assets and in the calculation of certain tax liabilities.
In accordance with ASC Topic 740, the Company applies the criteria that an individual tax position must satisfy for some or all of the benefits of that position to be recognized in a company’s financial statements. ASC Topic 740 prescribes a recognition threshold of more-likely-than-not, and a measurement attribute for all tax positions taken or expected to be taken on a tax return, in
52
Table of Contents
order for those tax positions to be recognized in the financial statements. In accordance with the Company’s accounting policy, interest and penalties related to uncertain tax positions is included in the “income tax expense” line of the Consolidated Statements of Operations. See Note 14, “Income Taxes,” for additional information.
Earnings (Loss) Per Share
The following table reconciles earnings per share for the fiscal years ended July 31, 2017, 2016 and 2015.
| Twelve Months Ended | ||||||||||||
| July 31, | ||||||||||||
| 2017 | 2016 | 2015 | ||||||||||
| (In thousands, except per share data) | ||||||||||||
| Net loss |
$ | (25,827 | ) | $ | (61,281 | ) | $ | (18,429 | ) | |||
| Weighted average common shares outstanding |
55,134 | 51,934 | 51,940 | |||||||||
| Weighted average common equivalent shares arising from dilutive stock options and restricted stock |
— | — | — | |||||||||
|
|
|
|
|
|
|
|||||||
| Weighted average number of common and potential common shares |
55,134 | 51,934 | 51,940 | |||||||||
|
|
|
|
|
|
|
|||||||
| Basic and diluted net loss per share |
$ | (0.47 | ) | $ | (1.18 | ) | $ | (0.35 | ) | |||
Approximately 14.2 million, 21.1 million and 21.6 million common stock equivalent shares relating to the effects of outstanding stock options and restricted stock were excluded from the denominator in the calculation of diluted earnings per share for the fiscal years ended July 31, 2017, 2016 and 2015, respectively, as their effect would be anti-dilutive due to the fact that the Company recorded a net loss for those periods. Approximately 11.4 million and 16.5 million and 16.6 million common shares outstanding associated with the convertible Notes, using the if-converted method, were excluded from the denominator in the calculation of diluted earnings (loss) per share for the fiscal years ended July 31, 2017, 2016 and 2015, respectively.
Share-Based Compensation Plans
The Company recognizes share-based compensation in accordance with the provisions of ASC Topic 718, “Compensation— Stock Compensation” (“ASC Topic 718”) which requires the measurement and recognition of compensation expense for all share- based payment awards made to employees and directors including employee stock options and employee stock purchases based on estimated fair values.
The Company estimates the fair value of share-based payment awards on the date of grant using an option-pricing model. The value of the portion of the award that is ultimately expected to vest is recognized as expense over the requisite service periods. The Company estimates forfeitures at the time of grant and revises those estimates, if necessary, in subsequent periods if actual forfeitures differ from those estimates.
The Company uses a binomial-lattice option-pricing model (“binomial-lattice model”) for valuation of share-based awards with time-based vesting. The Company believes that the binomial-lattice model is an accurate model for valuing employee stock options since it reflects the impact of stock price changes on option exercise behavior. For performance-based awards, stock-based compensation expense is recognized over the expected performance achievement period of individual performance milestones when the achievement of each individual performance milestone becomes probable. For share-based awards based on market conditions, specifically, the Company’s stock price, the compensation cost and derived service periods are estimated using the Monte Carlo valuation method. The Company uses third party analyses to assist in developing the assumptions used in its binomial-lattice model and Monte Carlo valuations and the resulting fair value used to record compensation expense. The Company’s determination of fair value of share-based payment awards on the date of grant using an option-pricing model is affected by the Company’s stock price as well as assumptions regarding a number of highly complex and subjective variables. These variables include, but are not limited to the Company’s expected stock price volatility over the term of the awards, and actual and projected employee stock option exercise behaviors. Any significant changes in these assumptions may materially affect the estimated fair value of the share-based award.
Major Clients and Concentration of Credit Risk
For the fiscal year ended July 31, 2017, 2016 and 2015, the Company’s 10 largest clients accounted for approximately 70%, 71% and 76% of consolidated net revenue, respectively. Sales to a consumer electronics client (“Client A”) accounted for approximately 15%, 13%, and 10% of the Company’s consolidated net revenue for the fiscal years ended July 31, 2017, 2016 and
53
Table of Contents
2015, respectively. Sales to another consumer electronics client (“Client B”) accounted for approximately 10%, 13%, and 19% of the Company’s consolidated net revenue for the fiscal years ended July 31, 2017, 2016 and 2015, respectively. The Europe reportable segment reports revenue associated with Client A. All four reportable segments report revenues associated with Client B. A computing market client accounted for approximately 13% and 3% of the Company’s Net Accounts Receivable balance as of July 31, 2017 and 2016, respectively. A consumer electronics client accounted for approximately 11% and 16% of the Company’s Net Accounts Receivable balance as of July 31, 2017 and 2016, respectively. To manage risk, the Company performs ongoing credit evaluations of its clients’ financial condition. The Company generally does not require collateral on accounts receivable. The Company maintains an allowance for doubtful accounts based on its assessment of the collectability of accounts receivable.
Financial instruments which potentially subject the Company to concentrations of credit risk are cash, cash equivalents and accounts receivable. The Company’s cash equivalent portfolio is diversified and consists primarily of short-term investment grade securities placed with high credit quality financial institutions. Cash and cash equivalents are maintained at accredited financial institutions, and those and the balances associated with Funds Held for Clients are at times without and in excess of federally insured limits. The Company has never experienced any losses related to these balances and does not believe that it is subject to unusual credit risk beyond the normal credit risk associated with financial institutions.
Recent Accounting Pronouncements
In May 2014, the FASB issued ASU No. 2014-09, Revenue from Contracts with Customers (Topic 606), which supersedes the revenue recognition requirements in ASC 605, Revenue Recognition. This ASU is based on the principle that revenue is recognized to depict the transfer of goods or services to customers in an amount that reflects the consideration to which the entity expects to be entitled in exchange for those goods or services. The ASU also requires additional disclosure about the nature, amount, timing and uncertainty of revenue and cash flows arising from customer contracts, including significant judgments and changes in judgments and assets recognized from costs incurred to obtain or fulfill a contract. The effective date will be the first quarter of fiscal year 2019 using one of two retrospective application methods or a cumulative effect approach. The Company is evaluating the potential effects on the consolidated financial statements.
In August 2014, the FASB issued ASU No. 2014-15 Presentation of Financial Statements—Going Concern (Subtopic 205-40), which amends the accounting guidance related to the evaluation of an entity’s ability to continue as a going concern. The amendment establishes management’s responsibility to evaluate whether there is substantial doubt about an entity’s ability to continue as a going concern in connection with preparing financial statements for each annual and interim reporting period. The update also gives guidance to determine whether to disclose information about relevant conditions and events when there is substantial doubt about an entity’s ability to continue as a going concern. This guidance will be effective for the Company as of the first quarter of fiscal year 2018. The new guidance is not anticipated to have an effect on the Company’s consolidated financial statements.
In April 2015, the FASB issued ASU No. 2015-03, Interest—Imputation of Interest (Subtopic 835-30)—Simplifying the Presentation of Debt Issuance Costs, which requires debt issuance costs related to a recognized debt liability to be presented in the balance sheet as a direct deduction from the debt liability rather than as an asset. The Company adopted this guidance beginning in the first quarter of fiscal year 2017. Upon adoption, an entity must apply the guidance retrospectively to all prior periods presented in the financial statements. As such, the prior year consolidated balance sheets were also adjusted.
In July 2015, the FASB issued ASU No. 2015-11, Simplifying the Measurement of Inventory (Topic 330), which provides guidance related to inventory measurement. The new standard requires entities to measure inventory at the lower of cost and net realizable value thereby simplifying the current guidance under which an entity must measure inventory at the lower of cost or market. The new standard is effective for the Company beginning in the first quarter of fiscal year 2018. The adoption of the guidance is not expected to have material impact on the Company’s financial statement disclosures, results of operations and financial position.
In November 2015, the FASB issued ASU No. 2015-17, Balance Sheet Classification of Deferred Taxes, which requires companies to classify all deferred tax assets and liabilities as noncurrent on the balance sheet instead of separating deferred taxes into current and noncurrent amounts. This guidance allowed for adoption on either a prospective or retrospective basis. The Company had elected to early adopt this guidance on a prospective basis and, as a result, prior consolidated balance sheets were not retrospectively adjusted. The adoption of this guidance did increase the assets and liabilities balance on the Company’s consolidated financial statements and related disclosures.
In February 2016, the FASB issued ASU No. 2016-02, Leases, which requires lessees to put most leases on their balance sheets but recognize expenses on their income statements in a manner similar to today’s accounting. This ASU will be effective for
54
Table of Contents
the Company beginning in the first quarter of fiscal year 2020. The Company is currently evaluating the effect the guidance will have on the Company’s financial statement disclosures, results of operations and financial position.
In March 2016, the FASB issued ASU No. 2016-08, Revenue from Contracts with Customers (Topic 606): Principal versus Agent Considerations (Reporting Revenue Gross versus Net). The amendments in this update relate to when another party, along with the Company, are involved in providing a good or service to a customer and are intended to improve the operability and understandability of the implementation guidance on principal versus agent. Revenue recognition guidance requires companies to determine whether the nature of its promise is to provide that good or service to the customer (i.e., the Company is a principal) or to arrange for the good or service to be provided to the customer by the other party (i.e., the Company is an agent). This ASU will be effective for the Company beginning in the first quarter of fiscal year 2019. The Company is currently in the process of assessing what impact this new update may have on its consolidated financial statements.
In March 2016, the FASB issued ASU No. 2016-09, Compensation-Stock Compensation (Topic 718): Improvements to Employee Share-Based Payment Accounting. Several aspects of the accounting for share-based payment award transactions are simplified, including: (a) income tax consequences; (b) classification of awards as either equity or liabilities; and (c) classification on the statement of cash flows. This ASU will be effective for the Company beginning in the first quarter of fiscal year 2018. The adoption of the guidance is not expected to have material impact on the Company’s financial statement disclosures, results of operations and financial position.
In November 2016, the FASB issued ASU No. 2016-18, Restricted Cash. When cash, cash equivalents, restricted cash and restricted cash equivalents are presented in more than one line item on the balance sheet, the new guidance requires a reconciliation of the totals in the statement of cash flows to the related captions in the balance sheet. Entities will also have to disclose the nature of their restricted cash and restricted cash equivalent balances, which is similar to what is required today for Securities and Exchange Commission Registrants. This ASU will be effective for the Company beginning in the first quarter of fiscal year 2019. The Company is currently in the process of assessing what impact this new standard may have on its combined financial statements but does not believe that implementing this standard will have a significant impact on the Company’s current presentation and disclosures.
In March 2017, the FASB issued ASU No. 2017-07, Compensation—Retirement Benefits (Topic 715), which requires that the service cost component of net periodic pension and postretirement benefit cost be presented in the same line item as other employee compensation costs, while the other components be presented separately as non-operating income (expense). This ASU will be effective for the Company beginning in the first quarter of fiscal year 2019. The Company is currently in the process of assessing what impact this new standard may have on its consolidated financial statements.
| (3) | ACCOUNTS RECEIVABLE |
The Company’s unsecured accounts receivable are stated at original invoice amount less an estimate made for doubtful receivables based on a monthly review of all outstanding amounts. Management determines the allowance for doubtful accounts by regularly evaluating individual customer receivables and considering each customer’s financial condition, credit history and current economic conditions. The Company writes off accounts receivable when management deems them uncollectible and records recoveries of accounts receivable previously written off when received. When accounts receivable are considered past due, the Company generally does not charge interest on past due balances. The allowance for doubtful accounts consisted of the following:
| July 31, | ||||||||||||
| 2017 | 2016 | 2015 | ||||||||||
| (In thousands) | ||||||||||||
| Balance at beginning of year |
$ | 489 | $ | 57 | $ | 63 | ||||||
| Provisions charged to expense |
132 | 458 | — | |||||||||
| Accounts written off |
(5 | ) | (26 | ) | (6 | ) | ||||||
|
|
|
|
|
|
|
|||||||
| $ | 616 | $ | 489 | $ | 57 | |||||||
|
|
|
|
|
|
|
|||||||
During the fourth quarter of fiscal 2013, as a part of its working capital management, the Company entered into a factoring agreement with a third party financial institution for the sale of certain accounts receivables without recourse. The activity under this agreement is accounted for as a sale of accounts receivable under ASC 860 “Transfers and Servicing”. This agreement relates exclusively to the accounts receivables of one of the Company’s significant clients. The amount sold varies each month based on the amount of underlying receivables and cash flow requirements of the Company. The factoring agreement is permitted under the Company’s Credit Facility agreement.
55
Table of Contents
The total amount of accounts receivable factored was $41.1 million and $0.9 million for the years ended July 31, 2017 and 2016, respectively. The cost incurred on the sale of these receivables was immaterial for years ended July 31, 2017 and 2016, respectively. The cost of selling these receivable is dependent upon the number of days between the sale date of the receivable and the date the client’s invoice is due and the interest rate. The interest rate associated with the sale of these receivables is equal to LIBOR plus 0.85%. The expense associated with the sale of these receivables is recorded as a component of selling, general and administrative expense in the accompanying consolidated statements of operations.
| (4) | PROPERTY AND EQUIPMENT |
Property and equipment at cost, consists of the following:
| July 31, | ||||||||
| 2017 | 2016 | |||||||
| (In thousands) | ||||||||
| Buildings |
$ | 24,476 | $ | 24,344 | ||||
| Machinery and equipment |
24,504 | 24,676 | ||||||
| Leasehold improvements |
14,815 | 14,735 | ||||||
| Software |
48,536 | 44,579 | ||||||
| Other |
22,126 | 24,156 | ||||||
|
|
|
|
|
|||||
| 134,457 | 132,490 | |||||||
| Less: Accumulated depreciation and amortization |
(115,902 | ) | (110,219 | ) | ||||
|
|
|
|
|
|||||
| Property and equipment, net |
$ | 18,555 | $ | 22,271 | ||||
|
|
|
|
|
|||||
Assets under capital leases which are included in the amounts above are summarized as follows:
| July 31, | ||||||||
| 2017 | 2016 | |||||||
| (In thousands) | ||||||||
| Machinery and equipment |
$ | 492 | $ | 370 | ||||
| Other |
13 | 118 | ||||||
|
|
|
|
|
|||||
| 505 | 488 | |||||||
| Less: Accumulated depreciation and amortization |
(431 | ) | (455 | ) | ||||
|
|
|
|
|
|||||
| $ | 74 | $ | 33 | |||||
|
|
|
|
|
|||||
The Company recorded depreciation expense of $8.2 million, $8.1 million and $8.7 million for the fiscal years ended July 31, 2017, 2016 and 2015, respectively. Depreciation expense within the Americas, Asia, Europe, and e-Business was $1.2 million, $1.9 million, $1.8 million, and $0.6 million, respectively, for the year ended July 31, 2017, $1.5 million, $3.2 million, $2.6 million, and $0.8 million, respectively, for the year ended July 31, 2016, and $2.3 million, $3.2 million, $2.5 million, and $0.6 million, respectively, for the year ended July 31, 2015. Amortization of assets recorded under capital leases is included in the depreciation expense amounts.
During the year ended, July 31, 2017, the Company recorded impairment charges totaling $0.2 million across multiple segments. During the year ended, July, 2016, the Company recorded an impairment charge of $0.3 million to adjust the carrying value of its building in Kildare, Ireland to its estimated fair value. During the year ended July 31, 2015, the Company recorded $0.3 million in impairment charges related to the write-down of leasehold improvements associated with the planned closure of a facility. These charges are reflected in “impairment of goodwill and long-lived assets” in the Consolidated Statements of Operations.
| (5) | INVESTMENTS |
Trading securities
During the year ended July 31, 2017, the Company received $8.0 million in proceeds associated with the sale of publicly traded securities (“Trading Securities”), which included a $0.9 million cash gain. During the year ended July 31, 2017, the Company recognized $2.2 million in net non-cash net gains associated with its Trading Securities. During the year ended July 31,
56
Table of Contents
2016, the Company sold $57.2 million in publicly traded securities, with a realized gain of $6.4 million. During the year ended July 31, 2016, the Company received proceeds of $59.3 million associated with the sale of publicly traded securities. However, $2.1 million of these proceeds are related to trades executed during the year ended July 31, 2015. During the year ended July 31, 2016, the Company acquired publicly traded securities of $1.2 million. During the year ended July 31, 2016, the Company recognized $12.3 million in net non-cash losses associated with its Trading Securities.
As of July 31, 2017, the Company had $11.9 million in investments in Trading Securities. As of July 31, 2016, the Company had $16.8 million in investments in Trading Securities, $12.6 million of which were the publicly traded convertible debentures. The Company’s purchases of the publicly traded convertible debentures were on the open market. The chairman of the board of the company issuing the publicly traded convertible debentures is also the chairman of the board of ModusLink Global Solutions, Inc. The Trading Securities were classified within Level 1 of the fair value hierarchy.
Investments in affiliates
The Company maintained interests in a small number of privately held companies. As of July 31, 2017 and 2016, the value of these investments was fully impaired. As of July 31, 2017, the Company is not committed to fund any follow-on investments in any of the portfolio companies. Investments in which the Company’s interest is less than 20% and which are not classified as available-for-sale securities, are accounted for under the cost method of accounting, and are carried at the lower of cost or net realizable value. Under this method, the investment balance, originally recorded at is cost, is only adjusted for impairments to the investment. Gains and losses realized upon the sale of the investment are reflected in “Gains on investments in affiliates, net of tax” in the Company’s Consolidated Statements of Operations. For the fiscal years ended July 31, 2017, 2016 and 2015, the Company recorded gains of $1.3 million, $0.8 million and $0.2 million, respectively, associated with its cost method investments. If it is determined that the Company exercises significant influence over the investee company, then the equity method of accounting is used. For those investments in which the Company’s voting interest is between 20% and 50%, the equity method of accounting is generally used. Under this method, the investment balance, originally recorded at cost, is adjusted to recognize the Company’s share of net earnings or losses of the investee company as they occur, limited to the extent of the Company’s investment in, advances to and commitments for the investee.
During the year ended July 31, 2015, the Company became aware in various quarters that there may be indicators of impairment for certain investments in the portfolio of companies. During the same year, the Company performed evaluations of its portfolio companies and determined that due to market conditions and their recent performance the portfolio companies were unable to secure potential investors or buyers to fund them as a going concern. As a result, these investments were impaired and the Company recorded impairment charges of $7.3 million during the year ended July 31, 2015.
| (6) | GOODWILL AND INTANGIBLE ASSETS |
The Company conducted its annual goodwill impairment test on July 31 of each fiscal year ended July 31, 2015. In addition, if and when events or circumstances changed that would more likely than not reduce the fair value of any of its reporting units below its carrying value, an interim test would be performed. In making this assessment, the Company relied on a number of factors including operating results, business plans, economic projections, anticipated future cash flows, transactions and marketplace data. The Company’s reporting units are the same as the operating segments: Americas, Asia, Europe and e-Business.
If the carrying value of a reporting unit exceeds its fair value, the Company calculates the implied fair value of the reporting unit’s goodwill and compares it to the carrying value. If the carrying value of goodwill exceeds its implied fair value, an impairment charge is recorded for the difference. The fair value of a reporting unit is primarily based on a discounted cash flow (“DCF”) method. The DCF approach requires that the Company forecast future cash flows for the reporting unit and discount the cash flow streams based on a weighted average cost of capital that is derived, in part, from comparable companies within similar industries. The DCF calculations also include a terminal value calculation that is based upon an expected long-term growth rate for the applicable reporting unit. The Company believes that the use of the income approach is appropriate due to lack of comparability to guideline companies and the lack of comparable transactions under the market approach. The income approach incorporates many assumptions including future growth rates, discount factors, expected capital expenditures and income tax cash flows. The carrying values of each reporting unit include assets and liabilities which relate to the reporting unit’s operations. During the fourth quarter of fiscal year 2015, the Company completed its annual impairment analysis of goodwill and determined that the fair value of the reporting unit, derived from forecasted cash flows, did not exceed its carrying value. As a result of the annual impairment analysis and in connection with the preparation of its annual financial statements for the fiscal year ended July 31, 2015, the Company concluded that its remaining goodwill was fully impaired and recorded a $3.1 million non-cash goodwill impairment charge. The impairment charge was not deductible for tax purposes. The impairment charge did not affect the
57
Table of Contents
Company’s liquidity or cash flows and had no effect on the Company’s compliance with the financial covenants under its credit agreement.
The intangible asset amortization relates to certain amortizable intangible assets acquired by the Company in connection with its acquisitions. The intangible assets were fully amortized as of July 31, 2015. Amortization expense for intangible assets for the fiscal years ended July 31, 2015 was $0.7 million.
| (7) | RESTRUCTURING |
The following tables summarize the activity in the restructuring accrual for the fiscal years ended July 31, 2017, 2016, and 2015:
| Employee Related Expenses |
Contractual Obligations |
Total | ||||||||||
| (In thousands) | ||||||||||||
| Accrued restructuring balance at July 31, 2014 |
$ | 1,687 | $ | 598 | $ | 2,285 | ||||||
|
|
|
|
|
|
|
|||||||
| Restructuring charges |
5,063 | 324 | 5,387 | |||||||||
| Restructuring adjustments |
(193 | ) | (64 | ) | (257 | ) | ||||||
| Cash paid |
(4,949 | ) | (691 | ) | (5,640 | ) | ||||||
| Non-cash adjustments |
(171 | ) | (76 | ) | (247 | ) | ||||||
|
|
|
|
|
|
|
|||||||
| Accrued restructuring balance at July 31, 2015 |
1,437 | 91 | 1,528 | |||||||||
|
|
|
|
|
|
|
|||||||
| Restructuring charges |
6,025 | 1,536 | 7,561 | |||||||||
| Restructuring adjustments |
(108 | ) | (32 | ) | (140 | ) | ||||||
| Cash paid |
(5,244 | ) | (641 | ) | (5,885 | ) | ||||||
| Non-cash adjustments |
(36 | ) | 1 | (35 | ) | |||||||
|
|
|
|
|
|
|
|||||||
| Accrued restructuring balance at July 31, 2016 |
2,074 | 955 | 3,029 | |||||||||
|
|
|
|
|
|
|
|||||||
| Restructuring charges |
1,853 | 439 | 2,292 | |||||||||
| Restructuring adjustments |
(416 | ) | 91 | (325 | ) | |||||||
| Cash paid |
(3,357 | ) | (1,419 | ) | (4,776 | ) | ||||||
| Non-cash adjustments |
(54 | ) | 20 | (34 | ) | |||||||
|
|
|
|
|
|
|
|||||||
| Accrued restructuring balance at July 31, 2017 |
$ | 100 | $ | 86 | $ | 186 | ||||||
|
|
|
|
|
|
|
|||||||
Restructuring and other costs for the year ended July 31, 2017 primarily included continuing charges for personnel reductions and facility consolidations in an effort to streamline operations across our global supply chain operations. The payments of employee-related charges were substantially completed during the fiscal year ended July 31, 2017. The remaining contractual obligations include facility lease obligations for vacant space resulting from the previous restructuring activities of the Company. The Company anticipates that these contractual obligations will be substantially fulfilled by the end of December 2017.
During the fiscal year ended July 31, 2017, the Company recorded a net restructuring charge of $2.0 million. Of this amount, $1.5 million primarily related to the workforce reduction of 78 employees across all operating segments, and $0.5 million related to contractual obligations.
During the fiscal year ended July 31, 2016, the Company recorded a net restructuring charge of $7.4 million. Of this amount, $5.9 million primarily related to the workforce reduction of 228 employees across all operating segments, and $1.5 million related to contractual obligations.
During the fiscal year ended July 31, 2015, the Company recorded a net restructuring charge of $5.1 million. Of this amount, $4.9 million primarily related to the workforce reduction of 235 employees across all operating segments, and $0.2 million related to contractual obligations
58
Table of Contents
The net restructuring charges for the fiscal years ended July 31, 2017, 2016 and 2015 would have been allocated as follows had the Company recorded the expense and adjustments within the functional department of the restructured activities:
| Twelve Months Ended July 31, |
||||||||||||
| 2017 | 2016 | 2015 | ||||||||||
| (In thousands) | ||||||||||||
| Cost of revenue |
$ | 563 | $ | 4,812 | $ | 4,718 | ||||||
| Selling, general and administrative |
1,404 | 2,609 | 412 | |||||||||
|
|
|
|
|
|
|
|||||||
| $ | 1,967 | $ | 7,421 | $ | 5,130 | |||||||
|
|
|
|
|
|
|
|||||||
The following tables summarize the restructuring accrual by operating segment for the fiscal years ended July 31, 2017, 2016 and 2015:
| Americas | Asia | Europe | e-Business | Consolidated Total |
||||||||||||||||
| (In thousands) | ||||||||||||||||||||
| Accrued restructuring balance at July 31, 2014 |
$ | 195 | $ | 274 | $ | 1,750 | $ | 66 | $ | 2,285 | ||||||||||
|
|
|
|
|
|
|
|
|
|
|
|||||||||||
| Restructuring charges |
1,073 | 1,056 | 3,158 | 100 | 5,387 | |||||||||||||||
| Restructuring adjustments |
(164 | ) | (59 | ) | 7 | (41 | ) | (257 | ) | |||||||||||
| Cash paid |
(869 | ) | (1,106 | ) | (3,655 | ) | (10 | ) | (5,640 | ) | ||||||||||
| Non-cash adjustments |
— | 88 | (234 | ) | (101 | ) | (247 | ) | ||||||||||||
|
|
|
|
|
|
|
|
|
|
|
|||||||||||
| Accrued restructuring balance at July 31, 2015 |
235 | 253 | 1,026 | 14 | 1,528 | |||||||||||||||
|
|
|
|
|
|
|
|
|
|
|
|||||||||||
| Restructuring charges |
1,885 | 2,293 | 2,353 | 1,030 | 7,561 | |||||||||||||||
| Restructuring adjustments |
— | (46 | ) | (94 | ) | — | (140 | ) | ||||||||||||
| Cash paid |
(1,258 | ) | (1,563 | ) | (2,895 | ) | (169 | ) | (5,885 | ) | ||||||||||
| Non-cash adjustments |
— | (43 | ) | 8 | — | (35 | ) | |||||||||||||
|
|
|
|
|
|
|
|
|
|
|
|||||||||||
| Accrued restructuring balance at July 31, 2016 |
862 | 894 | 398 | 875 | 3,029 | |||||||||||||||
|
|
|
|
|
|
|
|
|
|
|
|||||||||||
| Restructuring charges |
500 | 972 | 698 | 122 | 2,292 | |||||||||||||||
| Restructuring adjustments |
(162 | ) | (154 | ) | (75 | ) | 66 | (325 | ) | |||||||||||
| Cash paid |
(1,172 | ) | (1,672 | ) | (984 | ) | (948 | ) | (4,776 | ) | ||||||||||
| Non-cash adjustments |
23 | (40 | ) | (14 | ) | (3 | ) | (34 | ) | |||||||||||
|
|
|
|
|
|
|
|
|
|
|
|||||||||||
| Accrued restructuring balance at July 31, 2017 |
$ | 51 | $ | — | $ | 23 | $ | 112 | $ | 186 | ||||||||||
|
|
|
|
|
|
|
|
|
|
|
|||||||||||
| (8) | ACCRUED EXPENSES AND OTHER CURRENT LIABILITIES |
The following schedules reflect the components of “Accrued expenses” and “Other Current Liabilities”:
| July 31, 2017 |
July 31, 2016 |
|||||||
| (In thousands) | ||||||||
| Accrued taxes |
$ | 2,272 | $ | 3,068 | ||||
| Accrued compensation |
10,678 | 9,590 | ||||||
| Accrued interest |
1,366 | 1,346 | ||||||
| Accrued audit, tax and legal |
2,759 | 2,544 | ||||||
| Accrued contract labor |
1,632 | 2,966 | ||||||
| Accrued other |
19,191 | 18,226 | ||||||
|
|
|
|
|
|||||
| $ | 37,898 | $ | 37,740 | |||||
|
|
|
|
|
|||||
| July 31, 2017 |
July 31, 2016 |
|||||||
| (In thousands) | ||||||||
| Accrued pricing liabilities |
$ | 18,882 | $ | 18,882 | ||||
| Other |
7,259 | 8,227 | ||||||
|
|
|
|
|
|||||
| $ | 26,141 | $ | 27,109 | |||||
|
|
|
|
|
|||||
59
Table of Contents
As of July 31, 2017 and 2016, the Company had accrued pricing liabilities of approximately $18.9 million. As previously reported by the Company, several principal adjustments were made to its historic financial statements for periods ending on or before January 31, 2012, the most significant of which related to the treatment of vendor rebates in its pricing policies. Where the retention of a rebate or a mark-up was determined to have been inconsistent with a client contract (collectively referred to as “pricing adjustments”), the Company concluded that these amounts were not properly recorded as revenue. Accordingly, revenue was reduced by an equivalent amount for the period that the rebate was estimated to have been affected. A corresponding liability for the same amount was recorded in that period (referred to as accrued pricing liabilities). The Company believes that it may not ultimately be required to pay all of the accrued pricing liabilities, due in part to the nature of the interactions with its clients. The remaining accrued pricing liabilities at July 31, 2017 will be derecognized when there is sufficient information for the Company to conclude that such liabilities have been extinguished, which may occur through payment, legal release, or other legal or factual determination.
| (9) | DEBT |
Notes Payable
On March 18, 2014, the Company entered into an indenture (the “Indenture”) with Wells Fargo Bank, National Association, as trustee, relating to the Company’s issuance of $100 million of 5.25% Convertible Senior Notes (the “Notes”). The Notes bear interest at the rate of 5.25% per year, payable semi-annually in arrears on March 1 and September 1 of each year, beginning on September 1, 2014. The Notes will mature on March 1, 2019, unless earlier repurchased by the Company or converted by the holder in accordance with their terms prior to such maturity date.
Holders of the Notes may convert all or any portion of their notes, in multiples of $1,000 principal amount, at their option at any time prior to the close of business or the business day immediately preceding the maturity date. Each $1,000 of principal of the Notes will initially be convertible into 166.2593 shares of our common stock, which is equivalent to an initial conversion price of approximately $6.01 per share, subject to adjustment upon the occurrence of certain events, or, if the Company obtains the required consent from its stockholders, into shares of the Company’s common stock, cash or a combination of cash and shares of its common stock, at the Company’s election. If the Company has received stockholder approval, and it elects to settle conversions through the payment of cash or payment or delivery of a combination of cash and shares, the Company’s conversion obligation will be based on the volume weighted average prices (“VWAP”) of its common stock for each VWAP trading day in a 40 VWAP trading day observation period. The Notes and any of the shares of common stock issuable upon conversion have not been registered. As of July 31, 2017, the if-converted value of the Notes did not exceed the principal value of the Notes.
Holders will have the right to require the Company to repurchase their Notes, at a repurchase price equal to 100% of the principal amount of the Notes plus accrued and unpaid interest, upon the occurrence of certain fundamental changes, subject to certain conditions. No fundamental changes occurred during the year ended July 31, 2017.
The Company may not redeem the Notes prior to the mandatory date, and no sinking fund is provided for the Notes. The Company will have the right to elect to cause the mandatory conversion of the Notes in whole, and not in part, at any time on or after March 6, 2017, if the last reported sale price of its common stock has been at least 130% of the conversion price then in effect for at least 20 trading days (whether or not consecutive), including the trading day immediately preceding the date on which the Company notifies holders of its election to mandatorily convert the Notes, during any 30 consecutive trading day period ending on, and including, the trading day immediately preceding the date on which the Company notifies holders of its election to mandatorily convert the notes.
Per the Indenture, if the Notes are assigned a restricted CUSIP or the Notes are not otherwise freely tradable by holders at any time during the three months immediately preceding as of the 365th day after the last date of original issuance of the Notes, the Company shall pay additional interest on the Notes at a rate equal to 0.50% per annum of the principal amount of Notes outstanding until the restrictive legend on the Notes has been removed. The restrictive legend was removed on August 26, 2015 and, as such, the Company paid $0.2 million in additional interest associated with this restriction.
The Company has valued the debt using similar nonconvertible debt as of the original issuance date of the Notes and bifurcated the conversion option associated with the Notes from the host debt instrument and recorded the conversion option of $28.1 million in stockholders’ equity prior to the allocation of debt issuance costs. The initial value of the equity component, which reflects the equity conversion feature, is equal to the initial debt discount. The resulting debt discount on the Notes is being accreted to interest expense at the effective interest rate over the estimated life of the Notes. The equity component is included in the additional paid-in-capital portion of stockholders’ equity on the Company’s consolidated balance sheet. In addition, the debt issuance costs of $3.4 million are allocated between the liability and equity components in proportion to the allocation of the proceeds. During the first quarter of fiscal year 2017, the Company adopted ASU No. 2015-03. As such, the issuance costs allocated to the liability component ($2.5 million) are capitalized as a reduction of the principal amount of the Notes payable on the
60
Table of Contents
Company’s balance sheet and amortized, using the effective-interest method, as additional interest expense over the term of the Notes. The issuance costs allocated to the equity component is recorded as a reduction to additional paid-in capital.
During the year ended July 31, 2017, the Company purchased $2.0 million in face value of the Notes in the open market at a purchase price of $1.8 million. The gain of $0.1 million on this transaction is presented as a component of other gains and losses. The fair value of the Company’s Notes payable, calculated as of the closing price of the traded securities, was $63.9 million and $51.0 million as of July 31, 2017 and July 31, 2016, respectively. This value does not represent the settlement value of these long-term debt liabilities to the Company. The fair value of the Notes payable could vary each period based on fluctuations in market interest rates, as well as changes to our credit ratings. The Notes payable are traded and their fair values are based upon traded prices as of the reporting dates. As of July 31, 2017 and July 31, 2016, the net carrying value of the Notes was $59.8 million and $57.2 million, respectively.
| July 31, 2017 |
July 31, 2016 |
|||||||
| (In thousands) | ||||||||
| Carrying amount of equity component (net of allocated debt issuance costs) |
$ | 26,961 | $ | 27,099 | ||||
| Principal amount of Notes |
$ | 67,625 | $ | 69,625 | ||||
| Unamortized debt discount |
(7,227 | ) | (11,443 | ) | ||||
| Unamortized debt issuance costs |
(640 | ) | (1,013 | ) | ||||
|
|
|
|
|
|||||
| Net carrying amount |
$ | 59,758 | $ | 57,169 | ||||
|
|
|
|
|
|||||
As of July 31, 2017, the remaining period over which the unamortized discount will be amortized is 19 months.
| Twelve Months Ended July 31, |
||||||||||||
| 2017 | 2016 | 2015 | ||||||||||
| (In thousands) | ||||||||||||
| Interest expense related to contractual interest coupon |
$ | 3,651 | $ | 5,159 | $ | 5,310 | ||||||
| Interest expense related to accretion of the discount |
3,919 | 4,967 | 4,473 | |||||||||
| Interest expense related to debt issuance costs |
347 | 439 | 344 | |||||||||
|
|
|
|
|
|
|
|||||||
| $ | 7,917 | $ | 10,565 | $ | 10,127 | |||||||
|
|
|
|
|
|
|
|||||||
During the year ended July 31, 2017, 2016 and 2015, the Company recognized interest expense of $7.9 million, $10.6 million and $10.1 million associated with the Notes, respectively. The effective interest rate on the Notes, including amortization of debt issuance costs and accretion of the discount, is 13.9%. The notes bear interest of 5.25%.
PNC Bank Credit Facility
On June 30, 2014, two direct and wholly owned subsidiaries of the Company (the “Borrowers”) entered into a revolving credit and security agreement (the “Credit Agreement”), as borrowers and guarantors, with PNC Bank and National Association, as lender and as agent, respectively.
The Credit Agreement has a five (5) year term which expires on June 30, 2019. It includes a maximum credit commitment of $50.0 million, is available for letters of credit (with a sublimit of $5.0 million) and has a $20.0 million uncommitted accordion feature. The actual maximum credit available under the Credit Agreement varies from time to time and is determined by calculating the applicable borrowing base, which is based upon applicable percentages of the values of eligible accounts receivable and eligible inventory minus reserves determined by the Agent (including other reserves that the Agent may establish from time to time in its permitted discretion), all as specified in the Credit Agreement.
Generally, borrowings under the Credit Agreement bear interest at a rate per annum equal to, at the Borrowers’ option, either (a) LIBOR (adjusted to reflect any required bank reserves) for an interest period equal to one, two or three months (as selected by the Borrowers) plus a margin of 2.25% per annum or (b) a base rate determined by reference to the highest of (1) the base commercial lending rate publicly announced from time to time by PNC Bank, National Association, (2) the sum of the Federal Funds Open Rate in effect on such day plus one half of one percent (0.5%) per annum, or (3) the LIBOR rate (adjusted to reflect any required bank reserves) in effect on such day plus 1.00% per annum. In addition to paying interest on outstanding principal under the Credit Agreement, the Borrowers are required to pay a commitment fee, in respect of the unutilized commitments thereunder, of 0.25% per annum, paid quarterly in arrears. The Borrowers are also required to pay a customary letter of credit fee equal to the applicable margin on revolving credit LIBOR loans and fronting fees.
61
Table of Contents
Obligations under the Credit Agreement are guaranteed by the Borrowers’ existing and future direct and indirect wholly-owned domestic subsidiaries, subject to certain limited exceptions; and the Credit Agreement is secured by security interests in substantially all the Borrowers’ assets and the assets of each subsidiary guarantor, whether owned as of the closing or thereafter acquired, including a pledge of 100.0% of the equity interests of each subsidiary guarantor that is a domestic entity (subject to certain limited exceptions) and 65.0% of the voting equity interests of any direct first tier foreign entity owned by either Borrower or by a subsidiary guarantor. The Company is not a borrower or a guarantor under the Credit Agreement.
The Credit Agreement contains certain customary negative covenants, which include limitations on mergers and acquisitions, the sale of assets, liens, guarantees, investments, loans, capital expenditures, dividends, indebtedness, changes in the nature of business, transactions with affiliates, the creation of subsidiaries, changes in fiscal year and accounting practices, changes to governing documents, compliance with certain statutes, and prepayments of certain indebtedness. The Credit Agreement also contains certain customary affirmative covenants (including periodic reporting obligations) and events of default, including upon a change of control. The Credit Agreement requires compliance with certain financial covenants providing for maintenance of specified liquidity, maintenance of a minimum fixed charge coverage ratio and/or maintenance of a maximum leverage ratio following the occurrence of certain events and/or prior to taking certain actions, all as more fully described in the Credit Agreement. The Company believes that the Credit Agreement provides greater financial flexibility to the Company and the Borrowers and may enhance their ability to consummate one or several larger and/or more attractive acquisitions and should provide the Company’s clients and/or potential clients with greater confidence in the Company’s and the Borrowers’ liquidity. During the year ended July 31, 2017, the Company did not meet the criteria that would cause its financial covenants to be applicable. As of July 31, 2017 and 2016, the Company did not have any balance outstanding on the PNC Bank credit facility.
| (10) | COMMITMENTS AND CONTINGENCIES |
The Company leases facilities and certain other machinery and equipment under various non-cancelable operating leases and executory contracts expiring through December 2021. Certain non-cancelable leases are classified as capital leases and the leased assets are included in property, plant and equipment, at cost. Future annual minimum payments, including restructuring related obligations as of July 31, 2017, are as follows:
| Operating Leases |
Capital Lease Obligations |
Purchase Obligations |
Convertible Notes Interest & Principal |
Total | ||||||||||||||||
| (In thousands) | ||||||||||||||||||||
| For the fiscal years ended July 31: |
||||||||||||||||||||
| 2018 |
$ | 9,947 | $ | 64 | $ | 30,998 | $ | 3,550 | $ | 44,559 | ||||||||||
| 2019 |
6,318 | 101 | — | 71,175 | 77,594 | |||||||||||||||
| 2020 |
3,398 | 55 | — | — | 3,453 | |||||||||||||||
| 2021 |
2,358 | 55 | — | — | 2,413 | |||||||||||||||
| 2022 |
2,160 | 30 | — | — | 2,190 | |||||||||||||||
| Thereafter |
— | — | — | — | — | |||||||||||||||
|
|
|
|
|
|
|
|
|
|
|
|||||||||||
| $ | 24,181 | $ | 305 | $ | 30,998 | $ | 74,725 | $ | 130,209 | |||||||||||
|
|
|
|
|
|
|
|
|
|
|
|||||||||||
Total rent and equipment lease expense charged to continuing operations was $15.6 million, $17.3 million and $19.7 million for the fiscal years ended July 31, 2017, 2016 and 2015, respectively.
From time to time, the Company agrees to provide indemnification to its clients in the ordinary course of business. Typically, the Company agrees to indemnify its clients for losses caused by the Company. As of July 31, 2017, the Company had no recorded liabilities with respect to these arrangements.
Purchase obligations represent an estimate of all open purchase orders and contractual obligations in the ordinary course of business for which the Company has not received the goods or services. Although open purchase orders are considered enforceable and legally binding, the terms generally allow us the option to cancel, reschedule, and adjust the Company’s requirements based on its business needs prior to the delivery of goods or performance of services.
Legal Proceedings
On June 8, 2015, Sean Peters, a former employee filed a complaint (the “Complaint”) against ModusLink Corporation (together, the “parties”) in Superior Court of California asserting claims, among other things, for failure to pay wages, breach of
62
Table of Contents
contract, wrongful retaliation and termination, fraud, violations of California Business and Professions Code Section 17200, et seq., and civil penalties pursuant to California Labor Code Sections and pursuant to the California Private Attorney General Act, seeking over $1.0 million in damages, attorneys’ fees and costs and penalties. ModusLink filed an Answer to the Complaint making a general denial and asserting various affirmative defenses. The parties agreed to mediate the matter and on June 29, 2017, the parties attended a confidential mediation. At mediation ModusLink Corporation and its insurance carrier agreed to pay an immaterial amount to settle the matter.
On May 12, 2017, the Excise Tax Branch of the Internal Revenue Service issued a claim associated with the Company’s compliance with the self-assessment of excise tax on Ozone Depleting Chemicals. The Company is objecting to the assessment on a number of technical and substantive grounds, and plans to vigorously defend itself against this claim. Currently the Company is unable to determine the probability of an unfavorable outcome or a range of outcomes. Accordingly, the Company has not recorded a reserve associated with this matter.
| (11) | DEFINED BENEFIT PENSION PLANS |
During the year ended July 31, 2017, the Company terminated the defined benefit pension plan (the “Taiwan Plan”) covering certain of its employees in its Taiwan facility. As of the Taiwan Plan termination date, the fair value of the Taiwan Plan assets were in excess of the project benefit obligation. The Company received $0.9 million in cash proceeds associated with the termination of this defined benefit pension plan. The termination of this defined benefit pension plan did not result in a gain or loss for the year ended July 31, 2017.
As of July 31, 2017, the Company sponsored two defined benefit pension plans covering certain of its employees in its Netherlands facility and one unfunded defined benefit pension plan covering certain of its employees in Japan. Pension costs are actuarially determined.
The plan assets are primarily related to the defined benefit plan associated with the Company’s Netherlands facility. It consists of an insurance contract that guarantees the payment of the funded pension entitlements. Insurance contract assets are recorded at fair value, which is determined based on the cash surrender value of the insured benefits which is the present value of the guaranteed funded benefits. Insurance contracts are valued using unobservable inputs, primarily by discounting expected future cash flows relating to benefits paid from a notional investment portfolio in order to determine the cash surrender value of the policy. The following table presents the plan assets measured at fair value on a recurring basis as of July 31, 2017 and 2016, classified by fair value hierarchy:
| Fair Value Measurements at Reporting Date Using | ||||||||||||||||||||
| (In thousands) | July 31, 2017 | Asset Allocations |
Level 1 | Level 2 | Level 3 | |||||||||||||||
| Insurance contract |
$ | 20,726 | 98 | % | $ | — | $ | — | $ | 20,726 | ||||||||||
| Other investments |
478 | 2 | % | — | — | 478 | ||||||||||||||
|
|
|
|
|
|
|
|
|
|
|
|||||||||||
| $ | 21,204 | 100 | % | $ | — | $ | — | $ | 21,204 | |||||||||||
|
|
|
|
|
|
|
|
|
|
|
|||||||||||
| Fair Value Measurements at Reporting Date Using | ||||||||||||||||||||
| (In thousands) | July 31, 2016 | Asset Allocations |
Level 1 | Level 2 | Level 3 | |||||||||||||||
| Insurance contract |
$ | 24,012 | 94 | % | $ | — | $ | — | $ | 24,012 | ||||||||||
| Other investments |
1,461 | 6 | % | — | — | 1,461 | ||||||||||||||
|
|
|
|
|
|
|
|
|
|
|
|||||||||||
| $ | 25,473 | 100 | % | $ | — | $ | — | $ | 25,473 | |||||||||||
|
|
|
|
|
|
|
|
|
|
|
|||||||||||
63
Table of Contents
The aggregate change in benefit obligation and plan assets related to these plans was as follows:
| July 31, | ||||||||
| 2017 | 2016 | |||||||
| (In thousands) | ||||||||
| Change in benefit obligation |
||||||||
| Benefit obligation at beginning of year |
$ | 31,667 | $ | 25,617 | ||||
| Service cost |
700 | 632 | ||||||
| Interest cost |
573 | 637 | ||||||
| Actuarial (gain) loss |
(6,814 | ) | 5,351 | |||||
| Employee contributions |
103 | 120 | ||||||
| Benefits and administrative expenses paid |
(157 | ) | (269 | ) | ||||
| Adjustments |
— | 156 | ||||||
| Settlements |
(279 | ) | (55 | ) | ||||
| Effect of curtailment |
— | (941 | ) | |||||
| Currency translation |
1,671 | 419 | ||||||
|
|
|
|
|
|||||
| Benefit obligation at end of year |
27,464 | 31,667 | ||||||
|
|
|
|
|
|||||
| Change in plan assets |
||||||||
| Fair value of plan assets at beginning of year |
25,473 | 19,350 | ||||||
| Actual return on plan assets |
(5,005 | ) | 5,556 | |||||
| Employee contributions |
104 | 120 | ||||||
| Employer contributions (withdrawals), net |
(342 | ) | 539 | |||||
| Settlements |
(279 | ) | (55 | ) | ||||
| Benefits and administrative expenses paid |
(157 | ) | (269 | ) | ||||
| Currency translation |
1,410 | 232 | ||||||
|
|
|
|
|
|||||
| Fair value of plan assets at end of year |
21,204 | 25,473 | ||||||
|
|
|
|
|
|||||
| Funded status |
||||||||
| Assets |
— | 889 | ||||||
| Current liability |
(12 | ) | (68 | ) | ||||
| Noncurrent liability |
(6,248 | ) | (7,015 | ) | ||||
|
|
|
|
|
|||||
| Net amount recognized in statement of financial position as a noncurrent asset (liability) |
$ | (6,260 | ) | $ | (6,194 | ) | ||
|
|
|
|
|
|||||
The accumulated benefit obligation was approximately $25.5 million and $29.0 million at July 31, 2017 and 2016, respectively.
Information for pension plans with an accumulated benefit obligation in excess of plan assets was as follows:
| July 31, | ||||||||
| 2017 | 2016 | |||||||
| (In thousands) | ||||||||
| Projected benefit obligation |
$ | 27,464 | $ | 31,667 | ||||
| Accumulated benefit obligation |
$ | 25,531 | $ | 29,031 | ||||
| Fair value of plan assets |
$ | 21,204 | $ | 24,584 | ||||
64
Table of Contents
Components of net periodic pension cost were as follows:
| Twelve Months Ended July 31, |
||||||||||||
| 2017 | 2016 | 2015 | ||||||||||
| (In thousands) | ||||||||||||
| Service cost |
$ | 700 | $ | 632 | $ | 658 | ||||||
| Interest costs |
573 | 637 | 604 | |||||||||
| Expected return on plan assets |
(457 | ) | (491 | ) | (537 | ) | ||||||
| Amortization of net actuarial (gain) loss |
201 | 222 | 64 | |||||||||
| Curtailment gain |
— | (844 | ) | (164 | ) | |||||||
|
|
|
|
|
|
|
|||||||
| Net periodic pension costs |
$ | 1,017 | $ | 156 | $ | 625 | ||||||
|
|
|
|
|
|
|
|||||||
The amount included in accumulated other comprehensive income expected to be recognized as a component of net periodic pension costs in fiscal year 2018 is approximately $4.7 million related to amortization of a net actuarial loss and prior service cost.
Assumptions:
Weighted-average assumptions used to determine benefit obligations was as follows:
| Twelve Months Ended July 31, |
||||||||||||
| 2017 | 2016 | 2015 | ||||||||||
| Discount rate |
2.47 | % | 1.72 | % | 2.46 | % | ||||||
| Rate of compensation increase |
1.93 | % | 1.92 | % | 1.95 | % | ||||||
Weighted-average assumptions used to determine net periodic pension cost was as follows:
| Twelve Months Ended July 31, |
||||||||||||
| 2017 | 2016 | 2015 | ||||||||||
| Discount rate |
1.69 | % | 1.95 | % | 3.05 | % | ||||||
| Expected long-term rate of return on plan assets |
1.69 | % | 2.41 | % | 3.02 | % | ||||||
| Rate of compensation increase |
1.91 | % | 1.83 | % | 2.41 | % | ||||||
The discount rate reflects the Company’s best estimate of the interest rate at which pension benefits could be effectively settled as of the valuation date. It is based on the Mercer Yield Curve for the Eurozone as per July 31, 2017 for the appropriate duration of the plan.
To develop the expected long-term rate of return on assets assumptions consideration is given to the current level of expected returns on risk free investments, the historical level of risk premium associated with the other asset classes in which the portfolio is invested and the expectations for the future returns of each asset class. The expected return for each asset class was then weighted based on the target asset allocation to develop the expected long-term rate of return on assets assumption for the portfolio.
Benefit payments:
The following table summarizes expected benefit payments from the plans through fiscal year 2026. Actual benefit payments may differ from expected benefit payments. The minimum required contributions to the plans are expected to be approximately $0.2 million in fiscal year 2018.
| Pension Benefit Payments |
||||
| (in thousands) | ||||
| For the fiscal years ended July 31: |
||||
| 2018 |
168 | |||
| 2019 |
211 | |||
| 2020 |
210 | |||
| 2021 |
252 | |||
| 2022 |
254 | |||
| Next 5 years |
2,095 | |||
65
Table of Contents
The current target allocations for plan assets are primarily insurance contracts. The market value of plan assets using Level 3 inputs is approximately $21.2 million.
Valuation Technique:
Benefit obligations are computed using the projected unit credit method. Benefits are attributed to service based on the plan’s benefit formula. Cumulative gains and losses in excess of 10% of the greater of the pension benefit obligation or market-related value of plan assets are amortized over the expected average remaining future service of the current active membership.
| (12) | OTHER GAINS (LOSSES), NET |
The following schedule reflects the components of “Other gains (losses), net”:
| Twelve Months Ended July 31, |
||||||||||||
| 2017 | 2016 | 2015 | ||||||||||
| (In thousands) | ||||||||||||
| Foreign currency exchange gain (losses) |
$ | 199 | $ | (593 | ) | $ | 1,796 | |||||
| Gains (losses) on Trading Securities |
3,128 | (5,920 | ) | 13,611 | ||||||||
| Other, net |
(127 | ) | 756 | (402 | ) | |||||||
|
|
|
|
|
|
|
|||||||
| $ | 3,200 | $ | (5,757 | ) | $ | 15,005 | ||||||
|
|
|
|
|
|
|
|||||||
Other gains (losses), net totaled approximately $3.2 million for the fiscal years ended July 31, 2017. The balance consists primarily of $2.2 million and $0.9 million, in net non-cash and cash gains, respectively, associated with its Trading Securities, and $0.2 million in net realized and unrealized foreign exchange gains, offset by other gain and losses.
Other gains (losses), net totaled approximately $(5.8) million for the fiscal years ended July 31, 2016. The balance consists primarily of $(12.3) million and $6.4 million, in net non-cash and cash gains and (losses), respectively, associated with its Trading Securities, $0.8 million in non-cash gains associated with the repurchase of the Company’s Notes and $(0.6) million in net realized and unrealized foreign exchange losses, offset by other gain and losses.
Other gains (losses), net totaled approximately $15.0 million for the fiscal years ended July 31, 2015. The balance consists primarily of $12.8 million and $0.8 million, in net non-cash and cash gains, respectively, associated with its Trading Securities and $1.8 million in net realized and unrealized foreign exchange gains, offset by other gain and losses.
| (13) | SHARE-BASED PAYMENTS |
Stock Option Plans
During the fiscal year ended July 31, 2017, the Company had outstanding awards for stock options under two plans: the 2010 Incentive Award Plan (the “2010 Plan”) and the 2005 Non-Employee Director Plan (the “2005 Plan”). Historically, the Company has had the 2004 Stock Incentive Plan (the “2004 Plan”), the 2002 Non-Officer Employee Stock Incentive Plan (the “2002 Plan”), and the 2000 Stock Incentive Plan (the “2000 Plan”). Options granted under the 2010 Plan are generally exercisable as to 25% of the shares underlying the options beginning one year after the date of grant, with the option being exercisable as to the remaining shares in equal monthly installments over the next three years. The Company may also grant awards other than stock options under the 2010 Plan. Options granted under the 2005 plan are exercisable in equal monthly installments over three years, and have a term of ten years. As of December 2010, no additional grants may be issued under this plan. Stock options granted under all other plans have contractual terms of seven years.
During the fiscal year ended July 31, 2013, under the 2010 Plan, the Company issued to certain officers options that vest based on market conditions, specifically, the performance of the Company’s stock (the “Market Options”). The Market Options have a seven-year term and vest and become exercisable as to 20% of the total number of shares subject to the Market Option on each of the first five anniversaries of the grant date, subject to a minimum average share price being achieved as of each such vesting date (the “Price Performance Threshold”), which shall be (i) 1.5 times the exercise price, (ii) 2 times the exercise price, (iii) 2.5 times the exercise price, (iv) 3 times the exercise price and (v) 3.5 times the exercise price, respectively. If the specified minimum average share price for the applicable anniversary date is not achieved, 20% of the total number of shares subject to the Market Option shall not vest and become exercisable but may vest on the subsequent anniversary date if the minimum average share price related to the earlier anniversary date is achieved or exceeded on the subsequent anniversary date. These options were no longer outstanding as of July 31, 2017.
66
Table of Contents
Under the 2010 Plan, pursuant to which the Company may grant stock options, stock appreciation rights, restricted stock awards and other equity-based awards for the issuance of (i) 5,000,000 shares of common stock of the Company plus (ii) the number of shares subject to outstanding awards under the Company’s 2000 Plan, 2002 Plan and 2004 Plan (collectively, the “Prior Plans”) that expire or are forfeited following December 8, 2010, the effective date of the 2010 Plan. As of December 8, 2010, the Company ceased making any further awards under its Prior Plans. As of December 8, 2010, the effective date of the 2010 Plan, there were an additional 2,922,258 shares of common stock underlying equity awards issued under the Company’s Prior Plans. This amount represents the maximum number of additional shares that may be added to the 2010 Plan should these awards expire or be forfeited subsequent to December 8, 2010. Any awards that were outstanding under the Prior Plans as of the effective date continued to be subject to the terms and conditions of such Prior Plan. As of July 31, 2017, 5,299,305 shares were available for future issuance under the 2010 Plan.
The Board of Directors administers all stock plans, approves the individuals to whom options will be granted, and determines the number of shares and exercise price of each option and may delegate this authority to a committee of the Board or to certain officers of the Company in accordance with SEC regulations and applicable Delaware law.
Employee Stock Purchase Plan
The Company offers to its employees an Employee Stock Purchase Plan, (the “ESPP”) under which an aggregate of 600,000 shares of the Company’s stock may be issued. Employees who elect to participate in the ESPP instruct the Company to withhold a specified amount through payroll deductions during each quarterly period. On the last business day of each applicable quarterly payment period, the amount withheld is used to purchase the Company’s common stock at a purchase price equal to 85% of the lower of the market price on the first or last business day of the quarterly period. During the fiscal years ended July 31, 2017, 2016 and 2015, the Company issued approximately 11,000, 30,000 and 15,000 shares, respectively, under the ESPP. Approximately 136,000 shares are available for future issuance as of July 31, 2017.
Stock Option Valuation and Expense Information
The following table summarizes share-based compensation expense related to employee stock options, employee stock purchases and nonvested shares for the fiscal years ended July 31, 2017, 2016 and 2015:
| Twelve Months Ended July 31, | ||||||||||||
| 2017 | 2016 | 2015 | ||||||||||
| Cost of revenue |
$ | 53 | $ | 96 | $ | 171 | ||||||
| Selling, general and administrative |
628 | 1,030 | 1,586 | |||||||||
|
|
|
|
|
|
|
|||||||
| $ | 681 | $ | 1,126 | $ | 1,757 | |||||||
|
|
|
|
|
|
|
|||||||
The Company estimates the fair value of stock option awards on the date of grant using a binomial-lattice model. No employee stock options were granted during the fiscal year ended July 31, 2017. The weighted-average grant date fair value of employee stock options granted during the fiscal years ended July 31, 2016, and 2015 was $1.11 and $1.59, respectively, using the binomial-lattice model with the following weighted-average assumptions:
| Twelve Months Ended July 31, | ||||||||
| 2016 | 2015 | |||||||
| Expected volatility |
55.80 | % | 56.30 | % | ||||
| Risk-free interest rate |
1.28 | % | 1.24 | % | ||||
| Expected term (in years) |
4.41 | 4.41 | ||||||
| Expected dividend yield |
0.00 | % | 0.00 | % | ||||
The volatility assumption for fiscal years 2016 and 2015 is based on the weighted-average of the historical volatility of the Company’s common shares for a period equal to the expected term of the stock option awards.
The weighted-average risk-free interest rate assumption is based upon the interpolation of various U.S. Treasury rates, as of the month of the grants.
The expected term of employee stock options represents the weighted-average period the stock options are expected to remain outstanding and is based on historical option activity. The determination of the expected term of employee stock options assumes
67
Table of Contents
that employees’ exercise behavior is comparable to historical option activity. The binomial-lattice model estimates the probability of exercise as a function of time based on the entire history of exercises and cancellations on all past option grants made by the Company. The expected term generated by these probabilities reflects actual and anticipated exercise behavior of options granted historically.
As share-based compensation expense recognized in the Consolidated Statements of Operations for the fiscal years ended July 31, 2017, 2016 and 2015 is based on awards ultimately expected to vest, it has been reduced for estimated forfeitures. ASC Topic 718 requires forfeitures to be estimated at the time of grant and revised, if necessary, in subsequent periods if actual forfeitures differ from those estimates. Forfeitures were estimated based on historical experience.
Stock Options
A summary of option activity for the fiscal year ended July 31, 2017 is as follows:
| Number of Shares |
Weighted- Average Exercise Price |
Weighted-Average Remaining Contractual Term (Years) |
Aggregate Intrinsic Value |
|||||||||||||
| (in thousands, except exercise price and years) | ||||||||||||||||
| Stock options outstanding, July 31, 2016 |
1,368 | $ | 4.36 | |||||||||||||
| Granted |
— | — | ||||||||||||||
| Exercised |
— | — | ||||||||||||||
| Forfeited or expired |
(795 | ) | 4.37 | |||||||||||||
|
|
|
|||||||||||||||
| Stock options outstanding, July 31, 2017 |
573 | 4.36 | 2.70 | $ | — | |||||||||||
|
|
|
|
|
|
|
|
|
|||||||||
| Stock options exercisable, July 31, 2017 |
532 | $ | 4.40 | 2.60 | $ | — | ||||||||||
|
|
|
|
|
|
|
|
|
|||||||||
As of July 31, 2017, unrecognized share-based compensation related to stock options was approximately $0.1 million. This cost is expected to be expensed over a weighted average period of 0.9 years. The aggregate intrinsic value of options exercised during the fiscal years ended July 31, 2017, 2016 and 2015 was immaterial.
As of July 31, 2017, there were 0.6 million stock options that were vested and expected to vest in the future with a weighted- average remaining contractual term of 2.71 years. The aggregate intrinsic value of these awards is immaterial.
Nonvested Stock
Nonvested stock consists of shares of common stock that are subject to restrictions on transfer and risk of forfeiture until the fulfillment of specified conditions. Nonvested stock is expensed ratably over the term of the restriction period, ranging from one to five years unless there are performance restrictions placed on the nonvested stock, in which case the nonvested stock is expensed using graded vesting. Nonvested stock compensation expense for the fiscal years ended July 31, 2017, 2016 and 2015 was $0.5 million, $0.7 million and $0.6 million, respectively.
A summary of the activity of the Company’s nonvested stock for the fiscal year ended July 31, 2017, is as follows:
| Number of Shares |
Weighted-Average Grant Date Fair Value |
|||||||
| (share amounts in thousands) | ||||||||
| Nonvested stock outstanding, July 31, 2016 |
258 | $ | 2.48 | |||||
| Granted |
296 | — | ||||||
| Vested |
(245 | ) | 2.45 | |||||
| Forfeited |
(13 | ) | 3.05 | |||||
|
|
|
|||||||
| Nonvested stock outstanding, July 31, 2017 |
296 | $ | — | |||||
|
|
|
|||||||
The fair value of nonvested shares is determined based on the market price of the Company’s common stock on the grant date. The total grant date fair value of nonvested stock that vested during the fiscal years ended July 31, 2017, 2016 and 2015 was approximately $0.6 million, $1.0 million and $0.3 million, respectively. As of July 31, 2017, there was approximately $0.2 million of total unrecognized compensation cost related to nonvested stock to be recognized over a weighted-average period of 0.4 years.
68
Table of Contents
(14) INCOME TAXES
The components of loss from continuing operations before provision for income taxes are as follows:
| Twelve Months
Ended July 31, |
||||||||||||
| 2017 | 2016 | 2015 | ||||||||||
| (In thousands) | ||||||||||||
| Income (loss) from operations before income taxes: |
||||||||||||
| U.S. |
$ | (34,884 | ) | $ | (69,861 | ) | $ | (8,476 | ) | |||
| Foreign |
10,475 | 13,234 | (7,878 | ) | ||||||||
|
|
|
|
|
|
|
|||||||
| Total loss from operations before income taxes |
$ | (24,409 | ) | $ | (56,627 | ) | $ | (16,354 | ) | |||
|
|
|
|
|
|
|
|||||||
The components of income tax expense have been recorded in the Company’s consolidated financial statements as follows:
| Twelve Months
Ended July 31, |
||||||||||||
| 2017 | 2016 | 2015 | ||||||||||
| (In thousands) | ||||||||||||
| Income tax expense from continuing operations |
2,696 | 5,443 | 2,283 | |||||||||
|
|
|
|
|
|
|
|||||||
| Total income tax expense |
$ | 2,696 | $ | 5,443 | $ | 2,283 | ||||||
|
|
|
|
|
|
|
|||||||
The components of income tax expense from continuing operations consist of the following:
| Twelve Months
Ended July 31, |
||||||||||||
| 2017 | 2016 | 2015 | ||||||||||
| (In thousands) | ||||||||||||
| Current provision |
||||||||||||
| Federal |
$ | — | $ | — | $ | — | ||||||
| State |
— | — | — | |||||||||
| Foreign |
2,298 | 3,090 | 4,323 | |||||||||
|
|
|
|
|
|
|
|||||||
| 2,298 | 3,090 | 4,323 | ||||||||||
|
|
|
|
|
|
|
|||||||
| Deferred provision: |
||||||||||||
| Federal |
— | — | — | |||||||||
| State |
— | — | — | |||||||||
| Foreign |
398 | 2,353 | (2,040 | ) | ||||||||
|
|
|
|
|
|
|
|||||||
| 398 | 2,353 | (2,040 | ) | |||||||||
|
|
|
|
|
|
|
|||||||
| Total tax provision |
$ | 2,696 | $ | 5,443 | $ | 2,283 | ||||||
|
|
|
|
|
|
|
|||||||
Deferred income tax assets and liabilities have been classified on the Consolidated Balance Sheets in accordance with the nature of the item giving rise to the temporary differences. During the year ended July 31, 2016, the Company elected to early adopt ASU No. 2015-17, which requires companies to classify all deferred tax assets and liabilities as noncurrent on the balance sheet instead of separating deferred taxes into current and noncurrent amounts. This guidance allows for adoption on either a prospective or retrospective basis. As of July 31, 2017, the Company recorded a non-current deferred tax asset of $1.9 million and a non-current deferred tax liability of $0.7 million in Other Assets, and Other Long-term Liabilities, respectively. As of July 31,
69
Table of Contents
2016, the Company recorded a non-current deferred tax asset of $2.3 million and a non-current deferred tax liability of $0.8 million in Other Assets and Other Long-term Liabilities, respectively. The components of deferred tax assets and liabilities are as follows:
| July 31, 2017 | July 31, 2016 | |||||||
| (In thousands) | ||||||||
| Deferred tax assets: |
||||||||
| Accruals and reserves |
$ | 12,193 | $ | 12,240 | ||||
| Tax basis in excess of financial basis of investments in affiliates |
18,332 | 19,051 | ||||||
| Tax basis in excess of financial basis for intangible and fixed assets |
7,689 | 8,455 | ||||||
| Net operating loss and capital loss carry forwards |
751,435 | 744,357 | ||||||
|
|
|
|
|
|||||
| Total gross deferred tax assets |
789,649 | 784,103 | ||||||
| Less: valuation allowance |
(771,884 | ) | (760,906 | ) | ||||
|
|
|
|
|
|||||
| Net deferred tax assets |
$ | 17,765 | $ | 23,197 | ||||
|
|
|
|
|
|||||
| Deferred tax liabilities: |
||||||||
| Financial basis in excess of tax basis for intangible and fixed assets |
$ | (784 | ) | $ | (861 | ) | ||
| Convertible Debt |
(2,655 | ) | (4,241 | ) | ||||
| Undistributed accumulated earnings of foreign subsidiaries |
(13,150 | ) | (16,554 | ) | ||||
|
|
|
|
|
|||||
| Total gross deferred tax liabilities |
(16,589 | ) | (21,656 | ) | ||||
|
|
|
|
|
|||||
| Net deferred tax asset |
$ | 1,176 | $ | 1,541 | ||||
|
|
|
|
|
|||||
Subsequently reported tax benefits relating to the valuation allowance for deferred tax assets as of July 31, 2017 will be allocated as follows (in thousands):
| Income tax benefit recognized in the consolidated statement of operations |
$ | (756,423 | ) | |
| Additional paid in capital |
(15,461 | ) | ||
|
|
|
|||
| $ | (771,884 | ) | ||
|
|
|
The net change in the total valuation allowance for the fiscal year ended July 31, 2017 was an increase of approximately $11.0 million. This increase is primarily due to the U.S. valuation allowance as well as the valuation allowance provided for Taiwan and France for the year ended July 31, 2017. A valuation allowance has been recorded against the gross deferred tax asset in the U.S and certain foreign subsidiaries since management believes that after considering all the available objective evidence, both positive and negative, historical and prospective, it is more likely than not that certain assets will not be realized. The net change in the total valuation allowance for the fiscal year ended July 31, 2016 was an increase of approximately $10.3 million.
The Company has certain deferred tax benefits, including those generated by net operating losses and certain other tax attributes (collectively, the “Tax Benefits”). The Company’s ability to use these Tax Benefits could be substantially limited if it were to experience an “ownership change,” as defined under Section 382 of the Internal Revenue Code of 1986, as amended (the “Code”). In general, an ownership change would occur if there is a greater than 50-percentage point change in ownership of securities by stockholders owning (or deemed to own under Section 382 of the Code) five percent or more of a corporation’s securities over a rolling three-year period.
On October 17, 2011, the Company’s Board of Directors adopted a Tax Benefit Preservation Plan between the Company and American Stock Transfer & Trust Company, LLC, as rights agent (as amended from time to time, the “Tax Plan”). The Tax Plan reduces the likelihood that changes in the Company’s investor base would have the unintended effect of limiting the Company’s use of its Tax Benefits. The Tax Plan is intended to require any person acquiring shares of the Company’s securities equal to or exceeding 4.99% of the Company’s outstanding shares to obtain the approval of the Board of Directors. This would protect the Tax Benefits because changes in ownership by a person owning less than 4.99% of the Company’s stock are considered and included in
70
Table of Contents
one or more public groups in the calculation of “ownership change” for purposes of Section 382 of the Code. On October 9, 2014, the Tax Plan was amended by the Company’s Board of Directors to extend the expiration of the Tax Plan until October 17, 2017. Following the stockholders’ approval of the Protective Amendment (as described in the following paragraphs) at the Company’s 2014 Annual Meeting, the Tax Plan was further amended so that it expired at the close of business on December 31, 2014.
On December 29, 2014, the Company filed an Amendment to its Restated Certificate of Incorporation (the “Protective Amendment”) with the Delaware Secretary of State to protect the significant potential long-term tax benefits presented by its net operating losses and other tax benefits (collectively, the “NOLs”). The Protective Amendment was approved by the Company’s stockholders at the Company’s 2014 Annual Meeting of Stockholders held on December 9, 2014. As a result of the filing of the Protective Amendment with the Delaware Secretary of State, the Company amended its Tax Benefit Preservation Plan so that it expired at the close of business on December 31, 2014.
The Protective Amendment limits certain transfers of the Company’s common stock, to assist the Company in protecting the long-term value of its accumulated NOLs. The Protective Amendment’s transfer restrictions generally restrict any direct or indirect transfers of the common stock if the effect would be to increase the direct or indirect ownership of the common stock by any person (as defined in the Protective Amendment) from less than 4.99% to 4.99% or more of the common stock, or increase the percentage of the common stock owned directly or indirectly by a Person owning or deemed to own 4.99% or more of the common stock. Any direct or indirect transfer attempted in violation of the Protective Amendment will be void as of the date of the prohibited transfer as to the purported transferee. The Board of Directors of the Company has discretion to grant waivers to permit transfers otherwise restricted by the Protective Amendment.
In accordance with the Protective Amendment, Handy & Harman (“HNH”), a related party, requested, and the Company granted HNH and its affiliates, a waiver under the Protective Amendment to permit their acquisition of up to 45% of the Company’s outstanding shares of common stock in the aggregate (subject to proportionate adjustment, the “45% Cap”), in addition to acquisitions of common stock in connection with the exercise of certain warrants of the Company (the “Warrants”) held by Steel Partners Holdings L.P. (“SPH”), an affiliate of HNH, as well as a limited waiver under Section 203 of the Delaware General Corporation Law for this purpose. Notwithstanding the foregoing, HNH and its affiliates (and any group of which HNH or any of its affiliates is a member) are not permitted to acquire securities that would result in an “ownership change” of the Company for purposes of Section 382 of the Internal Revenue Code of 1986, as amended, that would have the effect of impairing any of the Company’s NOLs. The foregoing waiver was approved by the independent directors of the Company.
The Company has net operating loss carryforwards for federal and state tax purposes of approximately $2.1 billion and $209.8 million, respectively, at July 31, 2017. The federal net operating losses will expire from fiscal year 2022 through 2037 and the state net operating losses will expire from fiscal year 2018 through 2037. The Company has a foreign net operating loss carryforward of approximately $84.1 million, of which $58.8 million has an indefinite carryforward period. In addition, the Company has an immaterial amount of capital loss carryforwards for federal and state tax purposes. The federal and state capital losses will expire in fiscal year 2018.
The Company’s ModusLink Corporation subsidiary has undistributed earnings from its foreign subsidiaries of approximately $39.1 million at July 31, 2017, of which approximately $2.0 million is considered to be permanently reinvested due to certain restrictions under local laws as well as the Company’s plans to reinvest such earnings for future expansion in certain foreign jurisdictions. The amount of taxes attributable to the permanently undistributed earnings is estimated at $0.7 million. The Company has recorded a deferred tax liability of $13.2 million on the remaining $37.1 million of undistributed earnings that are not considered to be permanently reinvested.
71
Table of Contents
Income tax expense attributable to income from continuing operations differs from the expense computed by applying the U.S. federal income tax rate of 35% to income (loss) from continuing operations before income taxes as a result of the following:
| Twelve Months Ended July 31, | ||||||||||||
| 2017 | 2016 | 2015 | ||||||||||
| (In thousands) | ||||||||||||
| Computed “expected” income tax expense (benefit) |
$ | (8,106 | ) | $ | (19,368 | ) | $ | (5,653 | ) | |||
| Increase (decrease) in income tax expense resulting from: |
||||||||||||
| Change in valuation allowance |
10,978 | 22,907 | 2,067 | |||||||||
| Foreign dividends |
2,724 | 4,730 | 732 | |||||||||
| Foreign tax rate differential |
(2,386 | ) | (1,082 | ) | 1,262 | |||||||
| Capitalized costs |
— | — | (478 | ) | ||||||||
| Nondeductible goodwill impairment |
— | — | 1,070 | |||||||||
| Nondeductible expenses |
20 | 262 | 417 | |||||||||
| Foreign withholding taxes |
239 | 762 | (19 | ) | ||||||||
| Reversal of uncertain tax position reserves |
(481 | ) | (2,768 | ) | — | |||||||
| Other |
(292 | ) | — | 2,885 | ||||||||
|
|
|
|
|
|
|
|||||||
| Actual income tax expense |
$ | 2,696 | $ | 5,443 | $ | 2,283 | ||||||
|
|
|
|
|
|
|
|||||||
The calculation of the Company’s tax liabilities involves dealing with uncertainties in the application of complex tax regulations in several tax jurisdictions. The Company is periodically reviewed by domestic and foreign tax authorities regarding the amount of taxes due. These reviews include questions regarding the timing and amount of deductions and the allocation of income among various tax jurisdictions. In evaluating the exposure associated with various filing positions, the Company records estimated reserves when necessary. Based on the evaluation of current tax positions, the Company believes it has appropriately accrued for exposures.
The Company operates in multiple taxing jurisdictions, both within and outside of the United States. At July 31, 2017, 2016 and 2015, the total amount of the liability for unrecognized tax benefits, including interest, related to federal, state and foreign taxes was approximately $0.7 million, $1.2 million and $3.9 million, respectively. To the extent the unrecognized tax benefits are recognized, the entire amount would impact income tax expense.
The Company files income tax returns in the U.S., various states and in foreign jurisdictions. The federal and state income tax returns are generally subject to tax examinations for the tax years ended July 31, 2013 through July 31, 2017. To the extent the Company has tax attribute carryforwards, the tax year in which the attribute was generated may still be adjusted upon examination by the Internal Revenue Service or state tax authorities to the extent utilized in a future period. In addition, a number of tax years remain subject to examination by the appropriate government agencies for certain countries in the Europe and Asia regions. In Europe, the Company’s 2009 through 2016 tax years remain subject to examination in most locations while the Company’s 2005 through 2016 tax years remain subject to examination in most Asia locations.
A reconciliation of the beginning and ending balances of the total amounts of gross unrecognized tax benefits is as follows:
| Twelve Months Ended July 31, | ||||||||||||
| 2017 | 2016 | 2015 | ||||||||||
| (In thousands) | ||||||||||||
| Balance as of beginning of year |
$ | 994 | $ | 3,756 | $ | 1,028 | ||||||
| Additions for current year tax positions |
— | 19 | 2,884 | |||||||||
| Currency translation |
18 | — | (156 | ) | ||||||||
| Reductions for lapses in statute of limitations |
(331 | ) | (27 | ) | — | |||||||
| Reductions of prior year tax positions |
— | (2,754 | ) | — | ||||||||
|
|
|
|
|
|
|
|||||||
| Balance as of end of year |
$ | 681 | $ | 994 | $ | 3,756 | ||||||
|
|
|
|
|
|
|
|||||||
In accordance with the Company’s accounting policy, interest related to income taxes is included in the provision of income taxes line of the Consolidated Statements of Operations. For the fiscal year ended July 31, 2017, the Company has not recognized any material interest expense related to uncertain tax positions. As of July 31, 2017, 2016 and 2015, the Company had recorded liabilities for increases (decreases) in interest expense related to uncertain tax positions in the amount of ($168,000), $40,000 and $48,000, respectively. The Company did not accrue for penalties related to income tax positions as there were no income tax positions that required the Company to accrue penalties. The Company does not expect that any unrecognized tax benefits will reverse in the next twelve months.
72
Table of Contents
| (15) | ACCUMULATED OTHER COMPREHENSIVE INCOME |
The components of accumulated other comprehensive income, net of income taxes, are as follows:
| Foreign currency items |
Pension items |
Unrealized gains (losses) on securities |
Total | |||||||||||||
| (In thousands) | ||||||||||||||||
| Accumulated other comprehensive income (loss) at July 31, 2016 |
$ | 6,131 | $ | (4,206 | ) | $ | 94 | $ | 2,019 | |||||||
| Foreign currency translation adjustment |
1,391 | — | — | 1,391 | ||||||||||||
| Pension liability adjustments |
— | 830 | — | 830 | ||||||||||||
| Net unrealized holding gain on securities |
— | — | 73 | 73 | ||||||||||||
|
|
|
|
|
|
|
|
|
|||||||||
| Net current-period other comprehensive income (loss) |
1,391 | 830 | 73 | 2,294 | ||||||||||||
|
|
|
|
|
|
|
|
|
|||||||||
| Accumulated other comprehensive income (loss) at July 31, 2017 |
$ | 7,522 | $ | (3,376 | ) | $ | 167 | $ | 4,313 | |||||||
|
|
|
|
|
|
|
|
|
|||||||||
In the fiscal years ended July 31, 2017, the Company recorded approximately $0.3 million in taxes related to other comprehensive income. In the fiscal years ended July 31, 2016, the Company recorded an immaterial amount in taxes related to other comprehensive income. In the fiscal years ended July 31, 2015, the Company recorded approximately $0.5 million in taxes related to other comprehensive income.
| (16) | STATEMENT OF CASH FLOWS SUPPLEMENTAL INFORMATION |
Cash used for operating activities reflect cash payments for interest and income taxes as follows:
| Years Ended July 31, | ||||||||||||
| 2017 | 2016 | 2015 | ||||||||||
| (In thousands) | ||||||||||||
| Cash paid for interest |
$ | 3,783 | $ | 6,111 | $ | 5,281 | ||||||
| Cash paid for income taxes |
$ | 2,500 | $ | 3,287 | $ | 2,078 | ||||||
Cash paid for taxes can be higher than income tax expense as shown on the Company’s consolidated statements of operations due to prepayments made in certain jurisdictions as well as to the timing of required payments in relation to recorded expense, which can cross fiscal years.
Non-cash Activities
Non-cash financing activities during the fiscal years ended July 31, 2017, 2016 and 2015 included the issuance of approximately 0.3 million, 0.2 million and 0.1 million shares, respectively, of nonvested common stock, valued at approximately $0.5 million, $0.6 million and $0.5 million, respectively, to certain employees of the Company. Non-cash financing activities during the fiscal year ended July 31, 2016 also included the issuance of 2.7 million shares of the Company’s common stock, valued at $3.1 million, associated with the repurchase of the Company’s Notes. See Note 17 for further details.
| (17) | STOCKHOLDERS’ EQUITY |
Preferred Stock
The Company’s board of directors has the authority, subject to any limitations prescribed by Delaware law, to issue shares of preferred stock in one or more series and to fix and determine the designation, privileges, preferences and rights and the qualifications, limitations and restrictions of those shares, including dividend rights, conversion rights, voting rights, redemption rights, terms of sinking funds, liquidation preferences and the number of shares constituting any series or the designation of the series, without any further vote or action by the stockholders. Any shares of the Company’s preferred stock so issued may have priority over its common stock with respect to dividend, liquidation and other rights. The Company’s board of directors may authorize the issuance of preferred stock with voting rights or conversion features that could adversely affect the voting power or other rights of the holders of its common stock. Although the issuance of preferred stock could provide us with flexibility in connection with possible acquisitions and other corporate purposes, under some circumstances, it could have the effect of delaying, deferring or preventing a change of control.
Common Stock
Each holder of the Company’s common stock is entitled to:
| • | one vote per share on all matters submitted to a vote of the stockholders, subject to the rights of any preferred stock that may be outstanding; |
73
Table of Contents
| • | dividends as may be declared by the Company’s board of directors out of funds legally available for that purpose, subject to the rights of any preferred stock that may be outstanding; and |
| • | a pro rata share in any distribution of the Company’s assets after payment or providing for the payment of liabilities and the liquidation preference of any outstanding preferred stock in the event of liquidation. |
Holders of the Company’s common stock have no cumulative voting rights, redemption rights or preemptive rights to purchase or subscribe for any shares of its common stock or other securities. All of the outstanding shares of common stock are fully paid and nonassessable. The rights, preferences and privileges of holders of its common stock are subject to, and may be adversely affected by, the rights of the holders of shares of any existing series of preferred stock and any series of preferred stock that the Company may designate and issue in the future. There are no redemption or sinking fund provisions applicable to the Company’s common stock.
On March 12, 2013, stockholders of the Company approved the sale of 7,500,000 shares of newly issued common stock to Steel Partners Holdings L.P. (“Steel Partners”) at a price of $4.00 per share, resulting in aggregate proceeds of $30.0 million before transaction costs. The Company incurred $2.3 million of transaction costs, which consisted primarily of investment banking and legal fees, resulting in net proceeds from the sale of $27.7 million. In addition, as part of the transaction, the Company issued Steel Partners a warrant to acquire an additional 2,000,000 shares at an exercise price of $5.00 per share. These warrants expire after a term of five years after issuance. All the warrants were outstanding as of July 31, 2017.
Pursuant to the investment agreement, the Company agreed to grant Steel Partners certain registration rights. The Company agreed to file a resale registration statement on Form S-3 as soon as practicable after it is eligible to do so, covering the shares of common stock purchased by Steel Partners and the shares of common stock issuable upon exercise of the warrants. The Company is required to keep the resale registration statement effective for three years following the date it is declared effective. Steel Partners also has the right, until such time as it owns less than one-third of the common stock originally issued to it under the investment agreement, to require that the Company file a prospectus supplement or amendment to cover sales of common stock through a firm commitment underwritten public offering. The underwriters of any underwritten offering have the right to limit the number of shares to be included in any such offering. In addition, the Company has agreed to certain “piggyback registration rights.” If the Company registers any securities for public sale, Steel Partners has the right to include its shares in the registration, subject to certain exceptions. The underwriters of any underwritten offering have the right to limit the number of Steel Partners’ shares to be included in any such offering for marketing reasons. The Company has agreed to pay the expenses of Steel Partners in connection with any registration of the securities issued in the Steel Partners investment and to provide customary indemnification to Steel Partners in connection with such registration.
On July 21, 2016, the Company entered into an agreement with Highbridge International LLC and Highbridge Tactical Credit & Convertibles Master Fund, L.P. (together “Highbridge”) for the repurchase of 5.25% Convertible Senior Notes of the Company. The consideration paid to Highbridge included 2,656,336 newly issued shares of the Company’s common stock, par value $0.01 per share (valued based on the closing price of the ModusLink Common Stock on July 21, 2016), a cash payment of $18.5 million and a cash payment in the amount of the unpaid interest ($0.6 million). The transaction was executed in a private transaction and closed on July 27, 2016. The Notes were cancelled following closing.
| (18) | FAIR VALUE MEASUREMENTS |
ASC Topic 820 provides that fair value is an exit price, representing the price that would be received to sell an asset or paid to transfer a liability in an orderly transaction between market participants based on the highest and best use of the asset or liability. As such, fair value is a market-based measurement that should be determined based on assumptions that market participants would use in pricing an asset or liability. ASC Topic 820 requires the Company to use valuation techniques to measure fair value that maximize the use of observable inputs and minimize the use of unobservable inputs. These inputs are prioritized as follows:
| Level 1: | Observable inputs such as quoted prices for identical assets or liabilities in active markets |
| Level 2: | Other inputs that are observable directly or indirectly, such as quoted prices for similar assets or liabilities or market-corroborated inputs |
| Level 3: | Unobservable inputs for which there is little or no market data and which require the Company to develop its own assumptions about how market participants would price the assets or liabilities |
The carrying value of cash and cash equivalents, accounts receivable, funds held for clients, accounts payable, current liabilities and the revolving line of credit approximate fair value because of the short maturity of these instruments. The carrying
74
Table of Contents
value of capital lease obligations approximates fair value, as estimated by using discounted future cash flows based on the Company’s current incremental borrowing rates for similar types of borrowing arrangements. The fair values of the Company’s Trading Securities are estimated using quoted market prices. The Company values foreign exchange forward contracts using observable inputs which primarily consist of an income approach based on the present value of the forward rate less the contract rate multiplied by the notional amount. The defined benefit plans have 100% of their assets invested in bank-managed portfolios of debt securities and other assets. Conservation of capital with some conservative growth potential is the strategy for the plans. The Company’s pension plans are outside the United States, where asset allocation decisions are typically made by an independent board of trustees. Investment objectives are aligned to generate returns that will enable the plans to meet their future obligations. The Company acts in a consulting and governance role in reviewing investment strategy and providing a recommended list of investment managers for each plan, with final decisions on asset allocation and investment manager made by local trustees.
Assets and Liabilities that are Measured at Fair Value on a Recurring Basis
The following tables present the Company’s financial assets measured at fair value on a recurring basis as of July 31, 2017 and 2016, classified by fair value hierarchy:
| Fair Value Measurements at Reporting Date Using |
||||||||||||||||
| (In thousands) | July 31, 2017 | Level 1 | Level 2 | Level 3 | ||||||||||||
| Assets: |
||||||||||||||||
| Marketable equity securities |
$ | 11,898 | $ | 11,898 | $ | — | $ | — | ||||||||
| Money market funds |
85,683 | 85,683 | — | — | ||||||||||||
| Fair Value Measurements at Reporting Date Using |
||||||||||||||||
| (In thousands) | July 31, 2016 | Level 1 | Level 2 | Level 3 | ||||||||||||
| Assets: |
||||||||||||||||
| Marketable equity securities |
$ | 4,209 | $ | 4,209 | $ | — | $ | — | ||||||||
| Marketable corporate bonds |
12,559 | 12,559 | — | — | ||||||||||||
| Money market funds |
101,224 | 101,224 | — | — | ||||||||||||
The following table presents the pension plan assets measured at fair value on a recurring basis as of July 31, 2017 and 2016, classified by fair value hierarchy:
| Fair Value Measurements at Reporting Date Using | ||||||||||||||||||||
| (In thousands) | July 31, 2017 | Asset Allocations |
Level 1 | Level 2 | Level 3 | |||||||||||||||
| Insurance contract |
$ | 20,726 | 98 | % | $ | — | $ | — | $ | 20,726 | ||||||||||
| Other investments |
478 | 2 | % | — | — | 478 | ||||||||||||||
|
|
|
|
|
|
|
|
|
|
|
|||||||||||
| $ | 21,204 | 100 | % | $ | — | $ | — | $ | 21,204 | |||||||||||
|
|
|
|
|
|
|
|
|
|
|
|||||||||||
| Fair Value Measurements at Reporting Date Using | ||||||||||||||||||||
| (In thousands) | July 31, 2016 | Asset Allocations |
Level 1 | Level 2 | Level 3 | |||||||||||||||
| Insurance contract |
$ | 24,012 | 94 | % | $ | — | $ | — | $ | 24,012 | ||||||||||
| Other investments |
1,461 | 6 | % | — | — | 1,461 | ||||||||||||||
|
|
|
|
|
|
|
|
|
|
|
|||||||||||
| $ | 25,473 | 100 | % | $ | — | $ | — | $ | 25,473 | |||||||||||
|
|
|
|
|
|
|
|
|
|
|
|||||||||||
The following table sets forth a summary of the changes in the fair value of the pension plan assets for the years ended July 31, 2017 and 2016:
| July 31, | ||||||||
| 2017 | 2016 | |||||||
| (In thousands) | ||||||||
| Fair value of plan assets at beginning of year |
25,473 | 19,350 | ||||||
| Actual return on plan assets |
(5,005 | ) | 5,556 | |||||
| Employee contributions |
104 | 120 | ||||||
| Employer contributions (withdrawals), net |
(342 | ) | 539 | |||||
| Settlements |
(279 | ) | (55 | ) | ||||
| Benefits and administrative expenses paid |
(157 | ) | (269 | ) | ||||
| Currency translation |
1,410 | 232 | ||||||
|
|
|
|
|
|||||
| Fair value of plan assets at end of year |
21,204 | 25,473 | ||||||
|
|
|
|
|
|||||
75
Table of Contents
There were no transfers between Levels 1, 2 or 3 during any of the periods presented.
When available, quoted prices were used to determine fair value. When quoted prices in active markets were available, investments were classified within Level 1 of the fair value hierarchy. When quoted prices in active markets were not available, fair values were determined using pricing models, and the inputs to those pricing models were based on observable market inputs. The inputs to the pricing models were typically benchmark yields, reported trades, broker-dealer quotes, issuer spreads and benchmark securities, among others.
Assets and Liabilities that are Measured at Fair Value on a Nonrecurring Basis
The Company reviews the carrying amounts of these assets whenever certain events or changes in circumstances indicate that the carrying amounts may not be recoverable. An impairment loss is recognized when the carrying amount of the asset group or reporting unit is not recoverable and exceeds its fair value. The Company estimated the fair values of assets subject to impairment based on the Company’s own judgments about the assumptions that market participants would use in pricing the assets and on observable market data, when available.
Fair Value of Financial Instruments
The Company’s financial instruments not measured at fair value on a recurring basis include cash and cash equivalents, accounts receivable, accounts payable, funds held for clients and long-term debt and are reflected in the financial statements at cost. With the exception of long-term debt, cost approximates fair value for these items due to their short-term nature.
Included in trading securities in the accompanying balance sheet are marketable equity securities and marketable corporate bonds. These instruments are valued at quoted market prices in active markets. Included in cash and cash equivalents in the accompanying balance sheet are money market funds. These are valued at quoted market prices in active markets.
The following table presents the Company’s debt not carried at fair value:
| July 31, 2017 | July 31, 2016 | |||||||||||||||||||
| Carrying Amount |
Fair Value |
Carrying Amount |
Fair Value |
Fair Value Hierarchy |
||||||||||||||||
| (In thousands) | ||||||||||||||||||||
| Notes payable |
$ | 59,758 | $ | 63,852 | $ | 57,169 | $ | 50,957 | Level 1 | |||||||||||
The fair value of the Company’s Notes payable represents the value at which its lenders could trade its debt within the financial markets, and does not represent the settlement value of these long-term debt liabilities to us. The fair value of the Notes payable could vary each period based on fluctuations in market interest rates, as well as changes to our credit ratings. The Notes payable are traded and their fair values are based upon traded prices as of the reporting dates.
(19) SEGMENT INFORMATION
The Company has four operating segments: Americas; Asia; Europe; and e-Business. Based on the information provided to the Company’s chief operating decision-maker (“CODM”) for purposes of making decisions about allocating resources and assessing performance and quantitative thresholds, the Company has determined that it has four reportable segments: Americas, Asia, Europe and e-Business. During the prior year, the Company had determined that it had three reportable segments: Americas; Asia; and Europe. e-Business was reported as a part of the All Other category in the prior year. The Company also has Corporate-level activity, which consists primarily of costs associated with certain corporate administrative functions such as legal and finance, which are not allocated to the Company’s reportable segments. The Corporate-level balance sheet information includes cash and cash equivalents, trading securities, Notes payables and other assets and liabilities which are not identifiable to the operations of the Company’s operating segments. All significant intra-segment amounts have been eliminated.
Management evaluates segment performance based on segment net revenue, operating income (loss) and “adjusted operating income (loss)”, which is defined as the operating income (loss) excluding net charges related to depreciation, amortization of intangible assets, goodwill and long-lived asset impairment, share-based compensation and restructuring. These items are excluded because they may be considered to be of a non-operational or non-cash nature. Historically, the Company has recorded significant impairment and restructuring charges and therefore management uses adjusted operating income to assist in evaluating the performance of the Company’s core operations.
76
Table of Contents
Summarized financial information of the Company’s continuing operations by operating segment is as follows:
| Twelve Months Ended July 31, | ||||||||||||
| 2017 | 2016 | 2015 | ||||||||||
| (In thousands) | ||||||||||||
| Net revenue: |
||||||||||||
| Americas |
$ | 92,324 | $ | 106,143 | $ | 200,929 | ||||||
| Asia |
158,048 | 167,861 | 163,262 | |||||||||
| Europe |
159,085 | 151,842 | 160,602 | |||||||||
| e-Business |
27,163 | 33,177 | 36,880 | |||||||||
|
|
|
|
|
|
|
|||||||
| $ | 436,620 | $ | 459,023 | $ | 561,673 | |||||||
|
|
|
|
|
|
|
|||||||
| Operating income (loss): |
||||||||||||
| Americas |
$ | (10,342 | ) | $ | (14,731 | ) | $ | (4,407 | ) | |||
| Asia |
5,620 | (855 | ) | 10,003 | ||||||||
| Europe |
(9,008 | ) | (13,825 | ) | (6,479 | ) | ||||||
| e-Business |
(1,185 | ) | (4,384 | ) | (2,367 | ) | ||||||
|
|
|
|
|
|
|
|||||||
| Total Segment operating income (loss) |
(14,915 | ) | (33,795 | ) | (3,250 | ) | ||||||
| Corporate-level activity |
(4,846 | ) | (6,777 | ) | (11,089 | ) | ||||||
|
|
|
|
|
|
|
|||||||
| Total operating loss |
(19,761 | ) | (40,572 | ) | (14,339 | ) | ||||||
|
|
|
|
|
|
|
|||||||
| Total other expense |
4,648 | 16,055 | 2,015 | |||||||||
|
|
|
|
|
|
|
|||||||
| Loss before income taxes |
$ | (24,409 | ) | $ | (56,627 | ) | $ | (16,354 | ) | |||
|
|
|
|
|
|
|
|||||||
| July 31, 2017 |
July 31, 2016 |
|||||||
| (In thousands) | ||||||||
| Total assets: |
||||||||
| Americas |
$ | 21,876 | $ | 28,280 | ||||
| Asia |
63,819 | 89,242 | ||||||
| Europe |
64,639 | 75,952 | ||||||
| e-Business |
20,703 | 22,884 | ||||||
|
|
|
|
|
|||||
| Sub-total—segment assets |
171,037 | 216,358 | ||||||
| Corporate |
110,261 | 131,574 | ||||||
|
|
|
|
|
|||||
| $ | 281,298 | $ | 347,932 | |||||
|
|
|
|
|
|||||
Summarized financial information of the Company’s net revenue from external customers by group of services is as follows:
| Twelve Months Ended | ||||||||||||
| July 31, | ||||||||||||
| 2017 | 2016 | 2015 | ||||||||||
| (In thousands) | ||||||||||||
| Supply chain services |
$ | 409,457 | $ | 425,846 | $ | 524,793 | ||||||
| e-Business services |
27,163 | 33,177 | 36,880 | |||||||||
|
|
|
|
|
|
|
|||||||
| $ | 436,620 | $ | 459,023 | $ | 561,673 | |||||||
|
|
|
|
|
|
|
|||||||
As of July 31, 2017, approximately $9.3 million, $3.3 million, $3.6 million $2.4 million and $2.2 million of the Company’s long-lived assets were located in the U.S.A., Netherlands, Ireland, Singapore and China, respectively. As of July 31, 2016, approximately $5.2 million, $3.0 million, $3.5 million, $2.9 million and $3.0 million of the Company’s long-lived assets were located in the U.S.A., Netherlands, Ireland, Singapore and China, respectively.
For the fiscal year ended July 31, 2017, the Company’s net revenues within U.S.A., China, Netherlands and Czech Republic were $95.1 million, $128.3 million, $70.8 million and $79.8 million, respectively. For the fiscal year ended July 31, 2016, the Company’s net revenues within U.S.A., China, Netherlands and Czech Republic were $110.9 million, $140.2 million, $68.1 million and $75.7 million, respectively. For the fiscal year ended July 31, 2015, the Company’s net revenues within U.S.A., China, Netherlands and Czech Republic were $205.0 million, $134.5 million, $71.9 million and $80.6 million, respectively.
77
Table of Contents
(20) RELATED PARTY TRANSACTIONS
On December 24, 2014, the Company entered into a Management Services Agreement with SP Corporate Services LLC (“SP Corporate”), effective as of January 1, 2015 (as amended, the “Management Services Agreement”). SP Corporate is an indirect wholly owned subsidiary of Steel Partners Holdings L.P. (“Steel Holdings”) and is a related party. Pursuant to the Management Services Agreement, SP Corporate provided the Company and its subsidiaries with the services of certain employees, including certain executive officers, and other corporate services.
The Management Services Agreement had an initial term of six months. On June 30, 2015, the Company entered into an amendment that extended the term of the Management Services Agreement to December 31, 2015 and provided for automatic renewal for successive one year periods, unless and until terminated in accordance with the terms set forth therein, which include, under certain circumstances, the payment by the Company of certain termination fees to SP Corporate. On March 10, 2016, the Company entered into a Second Amendment to the Management Services Agreement with SPH Services, Inc. (“SPH Services”) pursuant to which SPH Services assumed rights and responsibilities of SP Corporate and the services provided by SPH Services to the Company were modified pursuant to the terms of the amendment. SPH Services is the parent of SP Corporate and an affiliate of SPH Group Holdings LLC. On March 10, 2016, the Company entered into a Transfer Agreement with SPH Services pursuant to which the parties agreed to transfer to the Company certain individuals who provide corporate services to the Company. SPH Services has since changed its name to Steel Services Ltd. (“Steel Services”).
During the year ended July 31, 2017, pursuant to the Management Services Agreement, the Company paid a fixed monthly fee of $175,000 in consideration for the services and incremental costs as incurred. A third amendment to the Management Services Agreement, effective September 1, 2017, reduced the fixed monthly fee paid by the Company to Steel Services under the Management Services Agreement from $175,000 per month to $95,641 per month. The monthly fee is subject to review and adjustment by agreement between the Company and Steel Services for periods commencing in fiscal 2016 and beyond. Additionally, the Company may be required to reimburse Steel Services and its affiliates for all reasonable and necessary business expenses incurred on the Company’s behalf in connection with the performance of the services under the Management Services Agreement. Total expenses incurred related to this agreement for the twelve months ended July 31, 2017 and 2016 were $2.3 million and $2.2 million, respectively. As of July 31, 2017 and 2016, amounts due to SP Corporate and Steel Services were $0.3 million and $0.5 million, respectively.
The Related Party Transactions Committee of the Board (the “Related Party Transactions Committee”) approved the entry into the Management Services Agreement (and the first and second amendments thereto) and the Transfer Agreement. The Audit Committee of the Board approved the third amendment to the Management Services Agreement. The Related Party Transactions Committee held the responsibility to review, approve and ratify related party transactions from November 20, 2014, until October 11, 2016. On October 11, 2016, the Board adopted a Related Person Transaction Policy that is administered by the Audit Committee and applies to all related party transactions. As of October 11, 2016, the Audit Committee reviews all related party transactions on an ongoing basis and all such transactions must be approved or ratified by the Audit Committee.
Mutual Securities, Inc. (“Mutual Securities”) serves as the broker and record-keeper for all the transactions associated with the Trading Securities. An officer of SP Corporate and of the General Partner of Steel Partners Holdings L.P., is a registered principal of Mutual Securities. Commissions charged by Mutual Securities are generally commensurate with commissions charged by other institutional brokers, and the Company believes its use of Mutual Securities is consistent with its desire to obtain best price and execution. During the year ended July 31, 2017, Mutual Securities received an immaterial amount in commissions associated with these transactions. During the year ended July 31, 2016, Mutual Securities received $0.1 million in commissions associated with these transactions.
78
Table of Contents
(21) SELECTED QUARTERLY FINANCIAL INFORMATION (Unaudited)
The following table sets forth selected quarterly financial information for the fiscal years ended July 31, 2017 and 2016. The operating results for any given quarter are not necessarily indicative of results for any future period.
| Quarter Ended | Quarter Ended | |||||||||||||||||||||||||||||||
| Oct. 31, ‘16 | Jan. 31, ‘17 | Apr. 30, ‘17 | Jul. 31, ‘17 | Oct. 31, ‘15 | Jan. 31, ‘16 | Apr. 30, ‘16 | Jul. 31, ‘16 | |||||||||||||||||||||||||
| (In thousands, except per share data) | (In thousands, except per share data) | |||||||||||||||||||||||||||||||
| Net revenue |
$ | 121,327 | $ | 117,568 | $ | 97,948 | $ | 99,777 | $ | 141,089 | $ | 119,966 | $ | 96,460 | $ | 101,508 | ||||||||||||||||
| Cost of revenue |
111,994 | 106,370 | 89,406 | 92,485 | $ | 128,637 | $ | 116,311 | $ | 94,286 | $ | 95,031 | ||||||||||||||||||||
|
|
|
|
|
|
|
|
|
|
|
|
|
|
|
|
|
|||||||||||||||||
| Gross profit |
9,333 | 11,198 | 8,542 | 7,292 | 12,452 | 3,655 | 2,174 | 6,477 | ||||||||||||||||||||||||
| Total operating expenses |
14,975 | 12,702 | 13,785 | 14,664 | 14,021 | 15,318 | 14,671 | 21,320 | ||||||||||||||||||||||||
|
|
|
|
|
|
|
|
|
|
|
|
|
|
|
|
|
|||||||||||||||||
| Operating loss |
(5,642 | ) | (1,504 | ) | (5,243 | ) | (7,372 | ) | (1,569 | ) | (11,663 | ) | (12,497 | ) | (14,843 | ) | ||||||||||||||||
| Total other income (expense) |
(2,352 | ) | (1,075 | ) | 763 | (1,984 | ) | (12,354 | ) | (2,338 | ) | (260 | ) | (1,103 | ) | |||||||||||||||||
| Income tax expense |
(1,049 | ) | (723 | ) | (819 | ) | (105 | ) | (850 | ) | (206 | ) | (408 | ) | (3,979 | ) | ||||||||||||||||
| Gains on investments in affiliates, net of tax |
500 | 396 | 232 | 150 | — | 259 | 316 | 214 | ||||||||||||||||||||||||
|
|
|
|
|
|
|
|
|
|
|
|
|
|
|
|
|
|||||||||||||||||
| Net loss |
$ | (8,543 | ) | $ | (2,906 | ) | $ | (5,067 | ) | $ | (9,311 | ) | $ | (14,773 | ) | $ | (13,948 | ) | $ | (12,849 | ) | $ | (19,711 | ) | ||||||||
|
|
|
|
|
|
|
|
|
|
|
|
|
|
|
|
|
|||||||||||||||||
| Basic and diluted earnings (loss) per share: |
||||||||||||||||||||||||||||||||
| Net income (loss) |
$ | (0.16 | ) | $ | (0.05 | ) | $ | (0.09 | ) | $ | (0.17 | ) | $ | (0.29 | ) | $ | (0.27 | ) | $ | (0.25 | ) | $ | (0.38 | ) | ||||||||
(22) SUBSEQUENT EVENTS
Subsequent to July 31, 2017, and prior to the issuance of these financial statements, the Company sold $11.9 million in Trading Securities. During this period, the Company received approximately $13.7 in cash proceeds associated with the trading activities.
Subsequent to July 31, 2017, and prior to the issuance of these financial statements, the Company completed the sale of its facility in Kildare, Ireland for the sale price of approximately $4.5 million, less legal and administrative expense.
79
Table of Contents
ITEM 9.— CHANGES IN AND DISAGREEMENTS WITH ACCOUNTANTS ON ACCOUNTING AND FINANCIAL DISCLOSURE
Not applicable.
ITEM 9A.— CONTROLS AND PROCEDURES
Evaluation of Disclosure Controls and Procedures
At the end of the period covered by this Annual Report on Form 10-K, we carried out an evaluation, under the supervision and with the participation of management, including our Chief Executive Officer and Chief Financial Officer, of the effectiveness of our disclosure controls and procedures, as defined in Rules 13a-15(e) and 15d-15(e) under the Exchange Act. “Disclosure controls and procedures” means controls and other procedures of a company that are designed to ensure that information required to be disclosed by a company in the reports that it files or submits under the Exchange Act is recorded, processed, summarized and reported within the time periods specified in the SEC’s rules and forms. Disclosure controls and procedures include, without limitation, controls and procedures designed to ensure that information required to be disclosed by a company in the reports that it files or submits under the Exchange Act is accumulated and communicated to the company’s management, including its principal executive and principal financial officers, or persons performing similar functions, as appropriate to allow timely decisions regarding required disclosure. Management recognizes that any controls and procedures, no matter how well designed and operated, can provide only reasonable assurance of achieving their objectives and management necessarily applies its judgment in evaluating the cost-benefit relationship of possible controls and procedures. Based on that evaluation, our Chief Executive Officer and Chief Financial Officer concluded that our disclosure controls and procedures were not effective as of July 31, 2017 because of the material weakness in internal control over financial reporting discussed below.
Management’s Report on Internal Control Over Financial Reporting
Management is responsible for establishing and maintaining adequate internal control over financial reporting for the Company. A company’s internal control over financial reporting is a process designed by, or under the supervision of, the company’s principal executive and principal financial officers, or persons performing similar functions, and effected by the company’s board of directors, management and other personnel, to provide reasonable assurance regarding the reliability of its financial reporting and the preparation of its financial statements for external purposes in accordance with generally accepted accounting principles and includes those policies and procedures that: (i) pertain to the maintenance of records that, in reasonable detail, accurately and fairly reflect the transactions and dispositions of the assets of the company; (ii) provide reasonable assurance that transactions are recorded as necessary to permit preparation of financial statements in accordance with generally accepted accounting principles, and that receipts and expenditures of the company are being made only in accordance with authorizations of management and directors of the company; and (iii) provide reasonable assurance regarding prevention or timely detection of unauthorized acquisition, use, or disposition of the company’s assets that could have a material effect on the financial statements. Because of its inherent limitations, internal control over financial reporting may not prevent or detect misstatements. Also, projections of any evaluation of effectiveness to future periods are subject to the risk that controls may become inadequate because of changes in conditions or that the degree of compliance with the policies or procedures may deteriorate.
Under the supervision of and with the participation of management, including the Chief Executive Officer and the Chief Financial Officer, the Company conducted an evaluation of the effectiveness of its internal control over financial reporting based on the criteria in Internal Control—Integrated Framework (2013) issued by the Committee of Sponsoring Organizations of the Treadway Commission (“COSO”). Based upon that evaluation, management identified a material weakness in the Company’s internal control over financial reporting in the prior fiscal year. Because of the material weakness described below, despite significant Audit Committee oversight, management involvement and the engagement of a nationally recognized accounting firm, management concluded that we did not maintain effective internal control over financial reporting in one area, as of July 31, 2017, based on the criteria established by COSO.
A material weakness is a control deficiency, or combination of control deficiencies, such that there is a reasonable possibility that a material misstatement to the annual or interim financial statements will not be prevented or detected on a timely basis. In its evaluation of the effectiveness of its internal control over financial reporting as of July 31, 2017, management identified that the Company did not maintain effective internal controls over the financial statement close process for the Company’s e-Business operating segment.
Notwithstanding the identified material weakness, management believes the consolidated financial statements included in this Annual Report on Form 10-K fairly represent in all material respects our financial condition, results of operations and cash flows at and for the periods presented in accordance with U.S. GAAP.
80
Table of Contents
BDO USA, LLP, an independent registered public accounting firm, has audited the effectiveness of our internal control over financial reporting and has issued an attestation report as of July 31, 2017. Please see their report included in this Item 9A below.
Remediation of the Material Weakness in Internal Control Over Financial Reporting
Management had been actively engaged in the planning for, and implementation of, remediation efforts to address the material weakness throughout the fiscal year 2017. These remediation efforts, outlined below, are intended both to address the identified material weakness and to enhance the Company’s overall financial control environment.
| • | Management has enhanced the formality and rigor of the reconciliation procedures and the evaluation of certain accounts and transactions, controls, including access controls. This deficiency was not effectively remediated during the fiscal year primarily due to the number of access rights, segregation of duties and review controls not sufficiently documented for a sufficient period of time, primarily within the e-Business segment. |
| • | Management has enhanced the design and precision level of existing monitoring controls to provide additional controls supporting the reporting process. |
| • | A significant amount of remediation was performed in implementing additional policies, improved processes and documented procedures relating to our financial statement close processes and procedures within the e-Business and Americas segments. |
| • | We will continue to engage a nationally recognized accounting firm to provide assistance and guidance in designing, implementing and testing the Company’s internal controls during the year. |
Under the direction of the Audit Committee, management will continue to review and make necessary changes to the overall design of the Company’s internal control environment, as well as policies and procedures to improve the overall effectiveness of internal control over financial reporting.
Management believes the measures described above and others that will be implemented will remediate the control deficiencies the Company has identified and strengthen its internal control over financial reporting. Management is committed to continuous improvement of the Company’s internal control processes and will continue to diligently review the Company’s financial reporting controls and procedures. The material weakness in our internal control over financial reporting will not be considered remediated until the remediated controls operate for a sufficient period of time and management has concluded, through testing, that these controls are operating effectively. We are working to have the material weakness remediated as soon as possible and significant progress has been made to date. We are committed to continuing to improve our internal control processes and will continue to diligently and vigorously review our financial reporting controls and procedures. As management continues to evaluate and work to improve internal control over financial reporting, the Company may decide to take additional measures to address control deficiencies or decide to modify, or in appropriate circumstances not to complete, certain of the remediation measures described above.
Changes in Internal Control over Financial Reporting
Other than the changes resulting from the remediation activities described above, there have been no changes in our internal control over financial reporting (as defined in Rule 13a-15(f) of the Exchange Act) during the quarter ended July 31, 2017 that have materially affected, or are reasonably likely to materially affect, our internal control over financial reporting.
81
Table of Contents
Report of Independent Registered Public Accounting Firm
Board of Directors and Stockholders
ModusLink Global Solutions, Inc.
Waltham, Massachusetts
We have audited ModusLink Global Solutions, Inc.’s (the “Company”) internal control over financial reporting as of July 31, 2017, based on criteria established in Internal Control—Integrated Framework (2013) issued by the Committee of Sponsoring Organizations of the Treadway Commission (the COSO criteria). ModusLink Global Solutions, Inc.’s management is responsible for maintaining effective internal control over financial reporting and for its assessment of the effectiveness of internal control over financial reporting, included in the accompanying Item 9A, Management’s Report on Internal Control Over Financial Reporting. Our responsibility is to express an opinion on the Company’s internal control over financial reporting based on our audit.
We conducted our audit in accordance with the standards of the Public Company Accounting Oversight Board (United States). Those standards require that we plan and perform the audit to obtain reasonable assurance about whether effective internal control over financial reporting was maintained in all material respects. Our audit included obtaining an understanding of internal control over financial reporting, assessing the risk that a material weakness exists, and testing and evaluating the design and operating effectiveness of internal control based on the assessed risk. Our audit also included performing such other procedures as we considered necessary in the circumstances. We believe that our audit provides a reasonable basis for our opinion.
A company’s internal control over financial reporting is a process designed to provide reasonable assurance regarding the reliability of financial reporting and the preparation of financial statements for external purposes in accordance with generally accepted accounting principles. A company’s internal control over financial reporting includes those policies and procedures that (1) pertain to the maintenance of records that, in reasonable detail, accurately and fairly reflect the transactions and dispositions of the assets of the company; (2) provide reasonable assurance that transactions are recorded as necessary to permit preparation of financial statements in accordance with generally accepted accounting principles, and that receipts and expenditures of the company are being made only in accordance with authorizations of management and directors of the company; and (3) provide reasonable assurance regarding prevention or timely detection of unauthorized acquisition, use, or disposition of the company’s assets that could have a material effect on the financial statements.
Because of its inherent limitations, internal control over financial reporting may not prevent or detect misstatements. Also, projections of any evaluation of effectiveness to future periods are subject to the risk that controls may become inadequate because of changes in conditions, or that the degree of compliance with the policies or procedures may deteriorate.
A material weakness is a deficiency, or a combination of deficiencies, in internal control over financial reporting, such that there is a reasonable possibility that a material misstatement of the company’s annual or interim financial statements will not be prevented or detected on a timely basis. A material weakness regarding management’s failure to design and maintain controls over the financial statement closing process has been identified and described in management’s assessment. This material weakness was considered in determining the nature, timing, and extent of audit tests applied in our audit of the fiscal year 2017 financial statements, and this report does not affect our report dated October 16, 2017 on those financial statements.
In our opinion, ModusLink Global Solutions, Inc. did not maintain, in all material respects, effective internal control over financial reporting as of July 31, 2017, based on the COSO criteria.
We do not express an opinion or any other form of assurance on management’s statements referring to any corrective actions taken by the company after the date of management’s assessment.
We also have audited, in accordance with the standards of the Public Company Accounting Oversight Board (United States), the consolidated balance sheet of ModusLink Global Solutions, Inc. as of July 31, 2017 and 2016 and the related consolidated statements of operations, comprehensive loss, changes in stockholders’ equity, and cash flows for each of the three years in the period ended July 31, 2017 and our report dated October 16, 2017 expressed an unqualified opinion thereon.
/s/ BDO USA, LLP
Boston, Massachusetts
October 16, 2017
82
Table of Contents
None.
ITEM 10.— DIRECTORS, EXECUTIVE OFFICERS AND CORPORATE GOVERNANCE
The information with respect to directors and executive officers required by this Item will be contained in our Definitive Proxy Statement to be filed with the SEC not later than 120 days after the close of business of the fiscal year and is incorporated in this report by reference.
During the fiscal year ended July 31, 2017, we made no material changes to the procedures by which stockholders may recommend nominees to our Board of Directors, as described in our most recent proxy statement.
The Company has adopted a Code of Business Conduct and Ethics that applies to all directors, officers and employees of the Company, including the Company’s principal executive officer, and its senior financial officers (principal financial officer and controller or principal accounting officer, or persons performing similar functions). The Company’s Code of Business Conduct and Ethics is posted on its website, www.moduslink.com (under the Investor Relations—Governance section). We intend to satisfy the disclosure requirement regarding any amendment to, or waiver of, a provision of the Code of Business Conduct and Ethics applicable to the Company’s principal executive officer or its senior financial officers (principal financial officer and controller or principal accounting officer, or persons performing similar functions) by posting such information on our website.
ITEM 11.— EXECUTIVE COMPENSATION
The information required by this Item will be contained in our Definitive Proxy Statement and is incorporated in this report by reference.
ITEM 12.— SECURITY OWNERSHIP OF CERTAIN BENEFICIAL OWNERS AND MANAGEMENT AND RELATED
STOCKHOLDER MATTERS
Information regarding the security ownership of certain beneficial owners and management will be contained in our Definitive Proxy Statement and is incorporated in this report by reference.
Equity Compensation Plan Information as of July 31, 2017
The following table sets forth certain information regarding the Company’s equity compensation plans as of July 31, 2017:
| (a) | (b) | (c) | ||||||||||
| Plan Category |
Number of securities to be issued upon exercise of outstanding options, warrants and rights |
Weighted-average exercise price of outstanding options, warrants and rights |
Number of securities remaining available for future issuance under equity compensation plans (excluding securities reflected in column (a)) |
|||||||||
| Equity compensation plans approved by security holders |
838,734 | $ | 2.73 | 5,299,305 | (1) | |||||||
| Equity compensation plans not approved by security holders(2) |
30,250 | $ | 6.58 | — | ||||||||
|
|
|
|
|
|||||||||
| Total |
868,984 | $ | 9.31 | 5,299,305 | ||||||||
|
|
|
|
|
|||||||||
| (1) | Includes approximately 136,400 shares available for issuance under the Company’s Amended and Restated 1995 Employee Stock Purchase Plan, as amended. |
| (2) | In March 2002, the Board of Directors adopted the 2002 Non-officer Employee Stock Incentive Plan (the “2002 Plan”), which was adopted without the approval of our security holders. Pursuant to the 2002 Plan, 415,000 shares of common stock were reserved for issuance (subject to adjustment in the event of stock splits and other similar events). In May 2002, the Board of Directors approved an amendment to the 2002 Plan in which the total shares available under the plan were increased to 1,915,000. Under the 2002 Plan, non-statutory stock options or restricted stock awards were granted to the Company’s or its subsidiaries’ employees, other than those who were also officers or directors, as defined. In connection with the adoption of the 2010 Incentive Award Plan on December 8, 2010, equity awards are no longer granted under the 2002 Plan. |
83
Table of Contents
ITEM 13.— CERTAIN RELATIONSHIPS AND RELATED TRANSACTIONS, AND DIRECTOR INDEPENDENCE
The information required by this Item will be contained in our Definitive Proxy Statement and is incorporated in this report by reference.
ITEM 14.— PRINCIPAL ACCOUNTING FEES AND SERVICES
The information required by this Item will be contained in our Definitive Proxy Statement and is incorporated in this report by reference.
84
Table of Contents
ITEM 15.— EXHIBITS, FINANCIAL STATEMENT SCHEDULES
(a) 1. Financial Statements.
The financial statements listed in the Index to Consolidated Financial Statements are filed as part of this report.
(a) 2. Financial Statement Schedules.
All financial statement schedules have been omitted as they are either not required, not applicable, or the information is otherwise included.
(a) 3. Exhibits.
The exhibits listed in the Exhibit Index are filed, furnished, or incorporated by reference in this report.
85
Table of Contents
EXHIBIT INDEX
86
Table of Contents
87
Table of Contents
88
Table of Contents
89
Table of Contents
| * | Management contract or compensatory plan or arrangement filed in response to Item 15(a)(3) of the instructions to Form 10-K. |
| ** | Filed herewith. |
| ‡ | Furnished herewith. |
90
Table of Contents
Pursuant to the requirements of Section 13 or 15(d) of the Securities Exchange Act of 1934, the Registrant has duly caused this report to be signed on its behalf by the undersigned, thereunto duly authorized.
| MODUSLINK GLOBAL SOLUTIONS, INC. | ||||||
| Date: October 16, 2017 | By: | /s/ JAMES R. HENDERSON | ||||
| James R. Henderson | ||||||
| President and Chief Executive Officer | ||||||
POWER OF ATTORNEY
KNOW ALL MEN BY THESE PRESENTS, that each person whose signature appears below constitutes and appoints jointly and severally, Glen M. Kassan and James R. Henderson, or either of them as his or her true and lawful attorneys-in-fact and agents, with full power of substitution and resubstitution, for him or her and in his or her name, place and stead, in any and all capacities, to sign any and all amendments (including post-effective amendments) to this Annual Report on Form 10-K, and to file the same, with all exhibits thereto, and other documents in connection therewith, with the Securities and Exchange Commission, granting unto said attorneys-in-fact and agents, and each of them, full power and authority to do and perform each and every act and thing requisite and necessary to be done in connection therewith, as fully to all intents and purposes as he might or could do in person, hereby ratifying and confirming all that said attorneys-in-fact and agents, or any of them, or their or his substitute or substitutes, may lawfully do or cause to be done by virtue hereof.
IN WITNESS WHEREOF, each of the undersigned has executed this Power of Attorney as of the date indicated.
Pursuant to the requirements of the Securities Exchange Act of 1934, this report has been signed below by the following persons on behalf of the Registrant and in the capacities and on the 16th day of October 2017.
| Signature |
Title | |
| /S/ JAMES R HENDERSON James R. Henderson |
President and Chief Executive Officer (Principal Executive Officer) | |
| /S/ LOUIS J. BELARDI Louis J. Belardi |
Chief Financial Officer (Principal Financial and Accounting Officer) | |
| /S/ JEFFREY J. FENTON Jeffrey J. Fenton |
Director | |
| /S/ GLEN M. KASSAN Glen M. Kassan |
Director | |
| /S/ PHILIP E. LENGYEL Philip E. Lengyel |
Director | |
| /S/ WARREN G. LICHTENSTEIN Warren G. Lichtenstein |
Executive Chairman of the Board and Director | |
| /S/ JEFFREY S. WALD Jeffrey S. Wald |
Director | |
91