Attached files
| file | filename |
|---|---|
| 8-K - 8-K - Telaria, Inc. | a17-22532_18k.htm |
SAFE HARBOR STATEMENT This presentation is for informational purposes only and is not an offer to sell securities or a solicitation of an offer to buy any securities, and may not be related upon in connection with the purchase or sale of any security. Sales and offers to sell Telaria, Inc. securities will only be made in accordance with the Securities Act of 1933, as amended, and applicable SEC regulations, including written prospectus requirements. This presentation contains forward-looking statements that involve risks, uncertainties, assumptions and other factors that could cause actual results and the timing of certain events to differ materially from those set forth in or implied by such forward-looking statements. All statements other than statements of historical fact contained in this presentation are forward-looking statements, including, but not limited to, statements related to Telaria’s future financial results, growth potential, or future profitability, including 2017 third quarter, fourth quarter and full year financial guidance and statements with respect to the development or adoption of the company’s solutions. In some cases, you can identify forward-looking statements by terminology such as “may,” “will,” should,” “expects,” “plans,” “anticipates,” “believes,” “estimates,” “predicts,” “potential,” or “continue” or the negative of these terms or other comparable terminology. These statements are only current predictions and are subject to known and unknown risks, uncertainties and other factors that may cause our or our industry’s actual results, levels of activity, performance or achievements to be materially different from those anticipated by the forward-looking statements. These forward-looking statements are subject to a number of risks, including those described under the heading “Risk Factors” and elsewhere in Telaria’s filings with the Securities and Exchange Commission (the “SEC”), including its Annual Report on form 10-K for the year ended December 31, 2016, filed with the SEC on March 10, 2017, its Quarterly Report on Form 10-Q for the quarter ended March 31, 2017 filed with the SEC on May 10, 2017, and its Form 10-Q for the period ended June 30, 2017, filed with the SEC on August 9, 2017. Although we believe that the expectations reflected in the forward-looking statements are reasonable, we cannot guarantee future results, levels of activity, performance or achievements. Except as required by law, we are under no duty to update or revise any of the forward-looking statements, whether as a result of new information, future events or otherwise, after the date of this presentation.
YESTERDAY, TODAY & TOMORROW NYSE: TLRA

OUR VISION Advertising powers content we love. For content owners and publishers who entertain the world, and for advertisers whose brand stories introduce audiences to the products and services that enrich their lives, Telaria makes the software they rely on to unlock the fullest value of their premium content. NYSE: TLRA

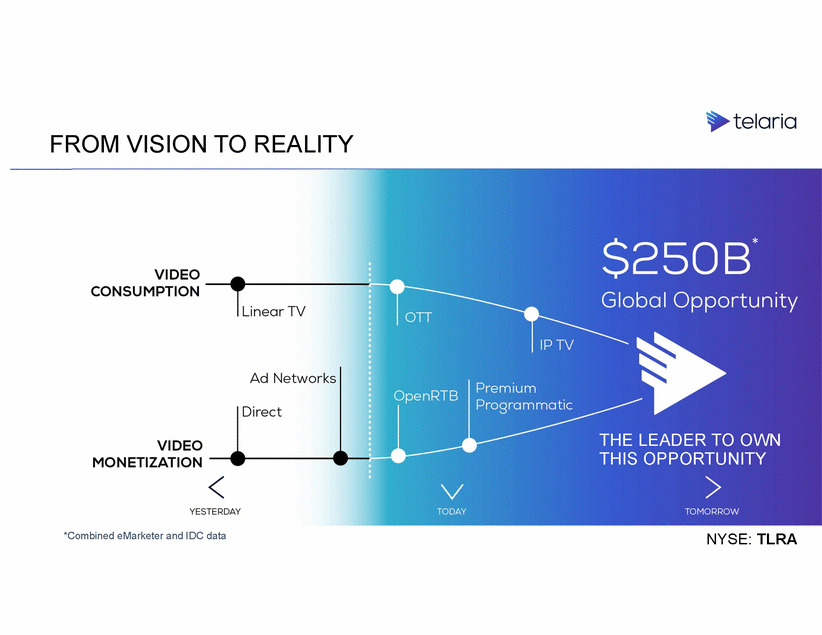
FROM VISION TO REALITY * THE LEADER TO OWN THIS OPPORTUNITY *Combined eMarketer and IDC data NYSE: TLRA
UNCOMPROMISED MISSION DIFFERENTIATED SOFTWARE ROBUST BUSINESS MODEL NYSE: TLRA
OUR MISSION To become the single, essential seller platform for the monetization and management of premium video anywhere. NYSE: TLRA
OUR MISSION DEFINED SINGLE: Not the only SSP in the world, but the only SSP that our clients use. ESSENTIAL: We become a critical part of their workflow. We are a sticky piece of software. MONETIZATION: Best tech will drive the best yield. Best yield attracts the best sellers. Best sellers attract best buyers. Virtuous cycle. MANAGEMENT: Intelligence and enhancement of video delivery beyond just yield. PREMIUM VIDEO: Not long tail. Not UGC. Cream of the crop. ANYWHERE: All formats, all players. NYSE: TLRA
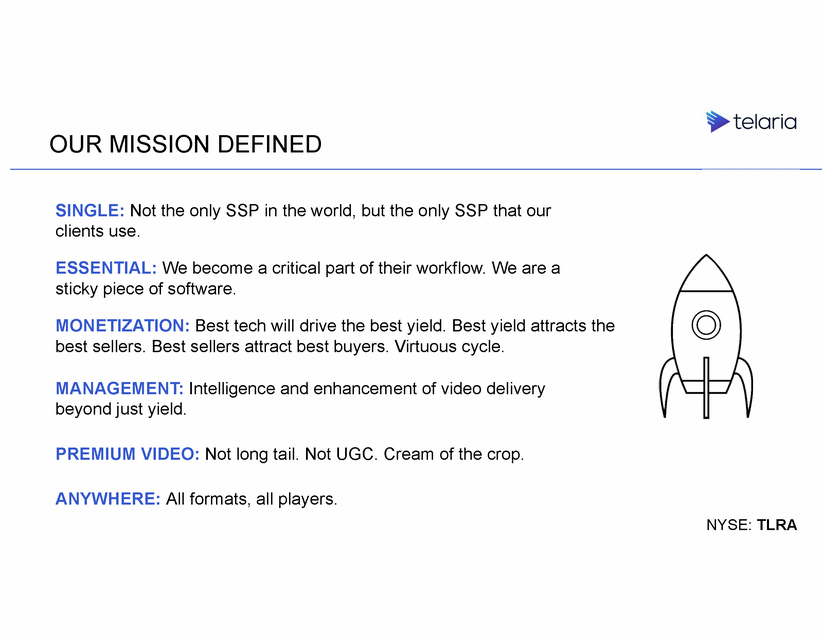
ACCELERATING OUR MISSION Expanded Team Focused Business Strategy NYSE: TLRA
INTRODUCING TELARIA Our new name is a derivation of the Greek word Talaria, which are the winged sandals that carried Hermes, the messenger of the gods, through space. It reflects our belief that advertising technology needs to be fast and frictionless in order to lift our clients towards their goals. NYSE: TLRA
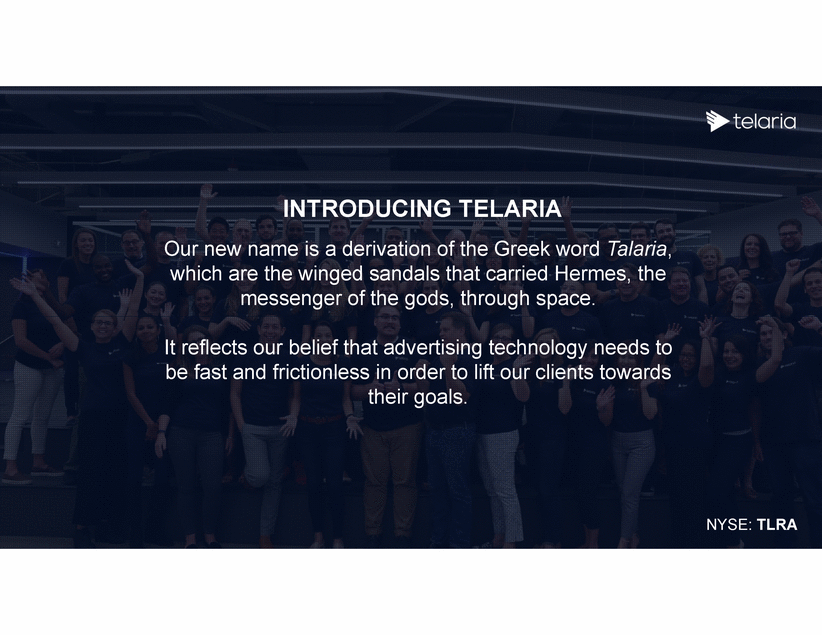
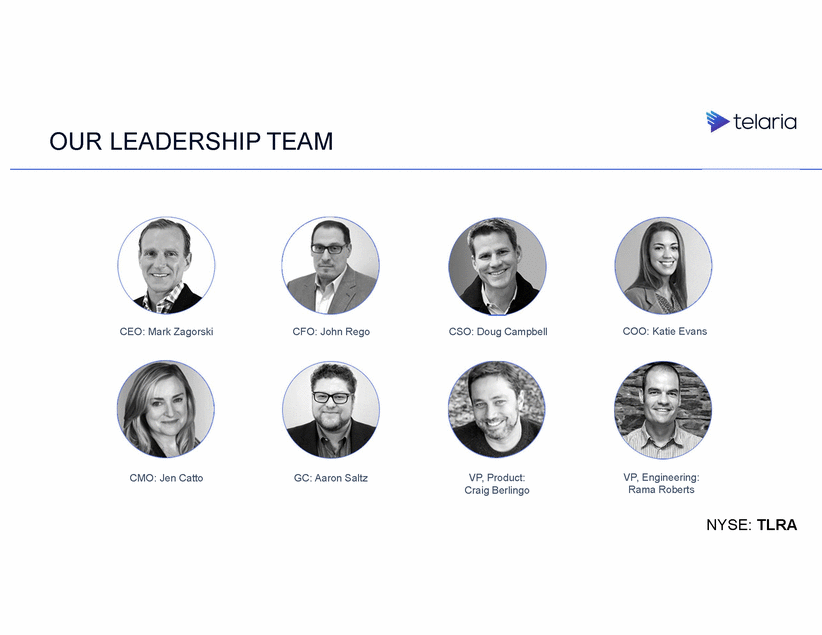
OUR LEADERSHIP TEAM CEO: Mark Zagorski CFO: John Rego CSO: Doug Campbell COO: Katie Evans VP, Engineering: Rama Roberts CMO: Jen Catto GC: Aaron Saltz VP, Product: Craig Berlingo NYSE: TLRA
OUR BOARD Paul Caine Warren Lee Rachel Lam James Rossman Robert Schechter Kevin Thompson Mark Zagorski NYSE: TLRA

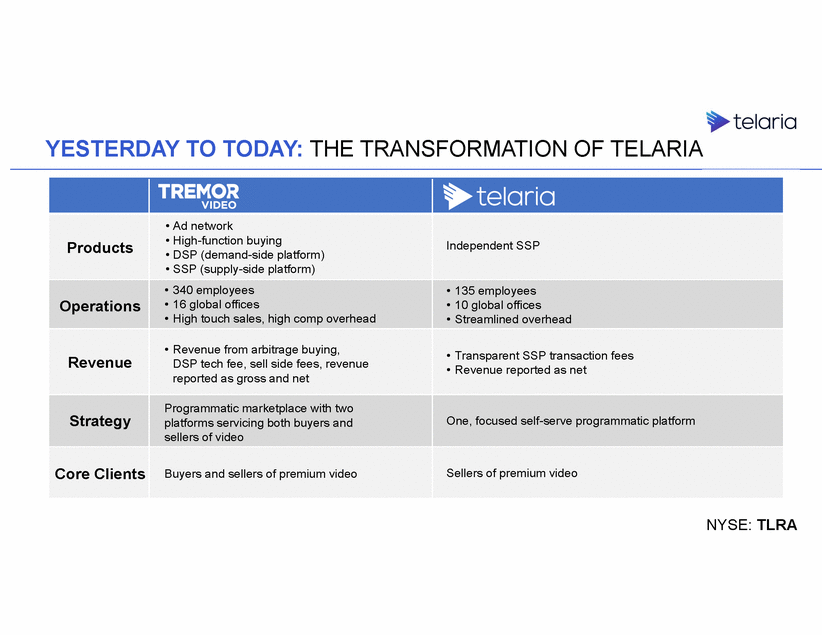
YESTERDAY TO TODAY: THE TRANSFORMATION OF TELARIA • Streamlined overhead • Revenue reported as net NYSE: TLRA Products • Ad network • High-function buying • DSP (demand-side platform) • SSP (supply-side platform) Independent SSP Operations • 340 employees • 16 global offices • High touch sales, high comp overhead • 135 employees • 10 global offices Revenue • Revenue from arbitrage buying, DSP tech fee, sell side fees, revenue reported as gross and net • Transparent SSP transaction fees Strategy Programmatic marketplace with two platforms servicing both buyers and sellers of video One, focused self-serve programmatic platform Core Clients Buyers and sellers of premium video Sellers of premium video
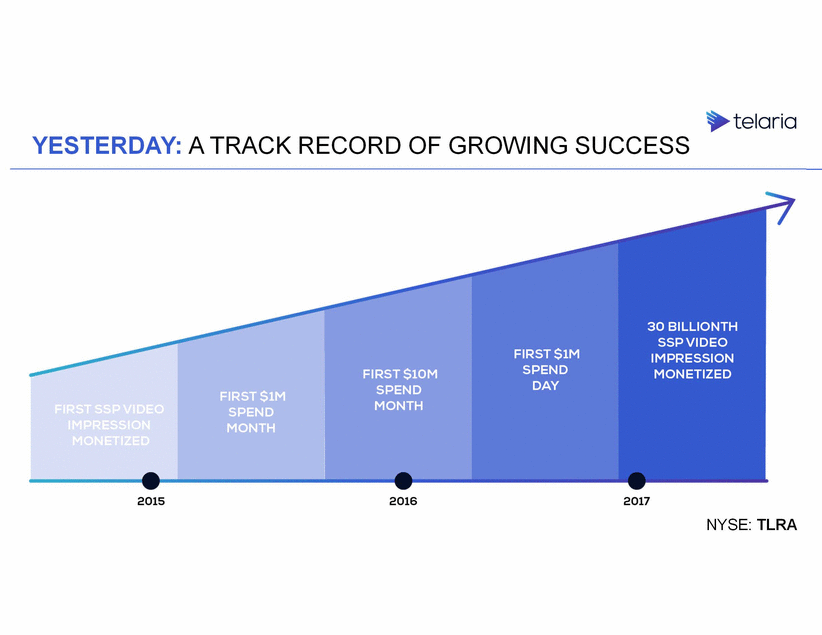
YESTERDAY: A TRACK RECORD OF GROWING SUCCESS NYSE: TLRA
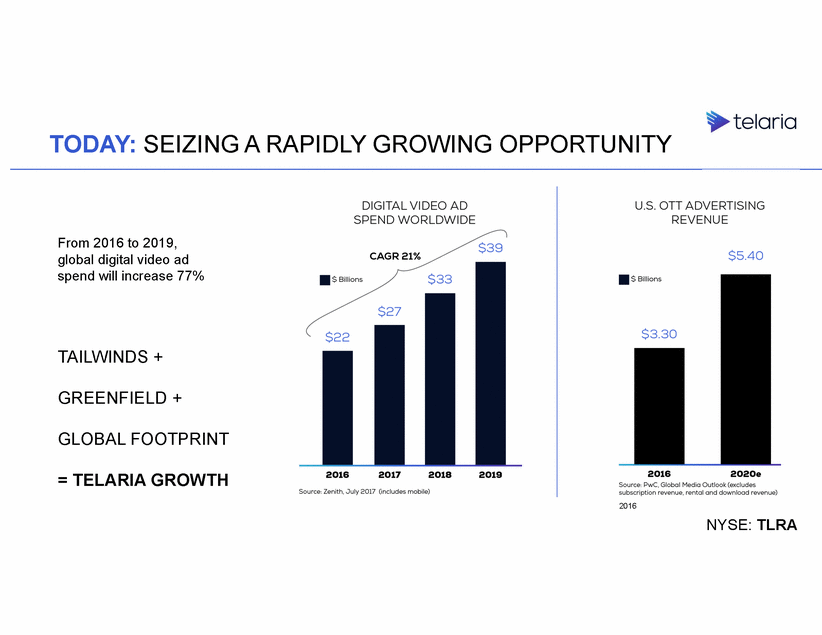
TODAY: SEIZING A RAPIDLY GROWING OPPORTUNITY From 2016 to 2019, global digital video ad spend will increase 77% TAILWINDS + GREENFIELD + GLOBAL FOOTPRINT = TELARIA GROWTH 2016 NYSE: TLRA
TODAY: MAXIMIZING BUYING CONNECTIONS DSPs AGENCIES ADVERTISERS PUBLISHERS TELARIA IS PAID EVERY TIME A TRANSACTION OCCURS
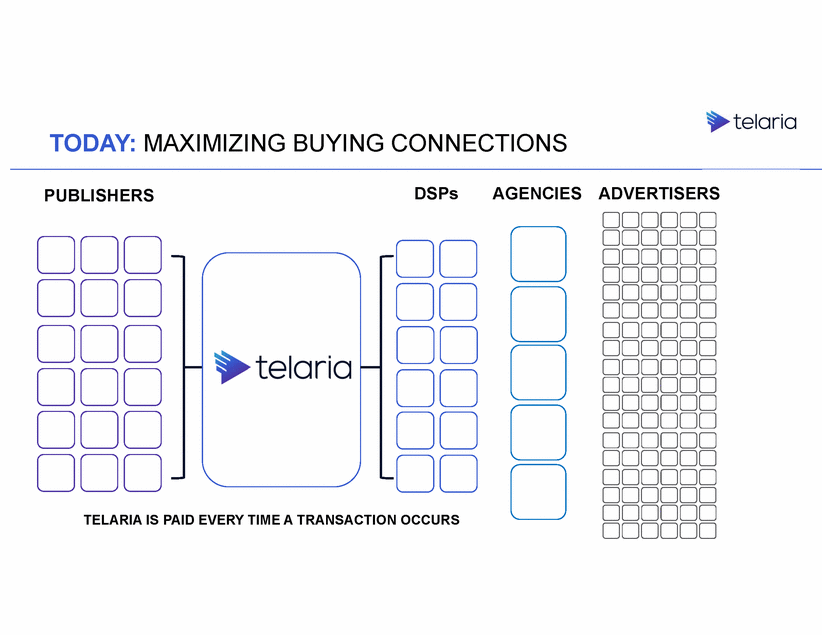
TODAY: WHO WE DO IT WITH SELLERS Leading premium video publishers around the globe BUYING PARTNERS Curated demand that connects brands with premium supply 5B requests processed per day 120B auctions per day 44ms avg per complete request 191 countries served ALL TOP 30 VIDEO VOLUME BUYERS 90 OF COMSCORE TOP 100 PUBLISHERS 95% RETENTION RATE OF SELLERS & BUYERS NYSE: TLRA
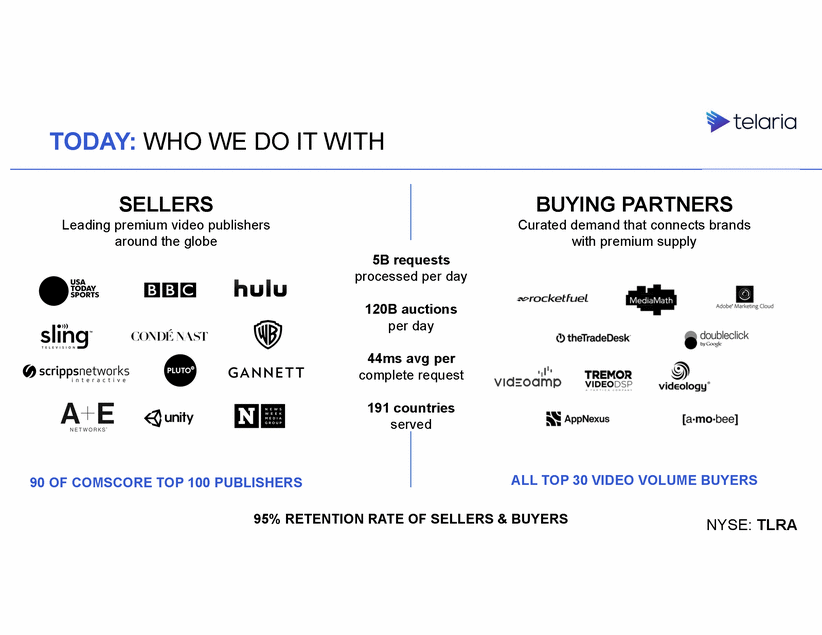
TODAY: DRIVING INNOVATION & SUCCESS FOR OUR PARTNERS OBJECTIVE: Solve for programmatic buying of live TV during the NCAA Final Four tournament SOLUTION: Telaria’s SSP PROGRAM: Premium Private Marketplace Packages RESULTS: after it implemented a programmatic integration with Telaria for the recent NCAA tournament. ” NYSE: TLRA “Sling TV said it saw a 51% rise in programmatic ad sales
TODAY: WHAT OUR CLIENTS ARE SAYING “Given the audience shift to connected TV and OTT, our clients are looking to access these viewers in the most targeted, efficient and measurable way, and [Telaria’s] programmatic enables that.” “Advertiser response to our programmatic partnership with Telaria has been overwhelming as brands jump onboard to reach live linear TV audiences in real time.” Adam Lowy, Director of Advanced TV and Digital Brian Stempeck, Chief Client Officer NYSE: TLRA
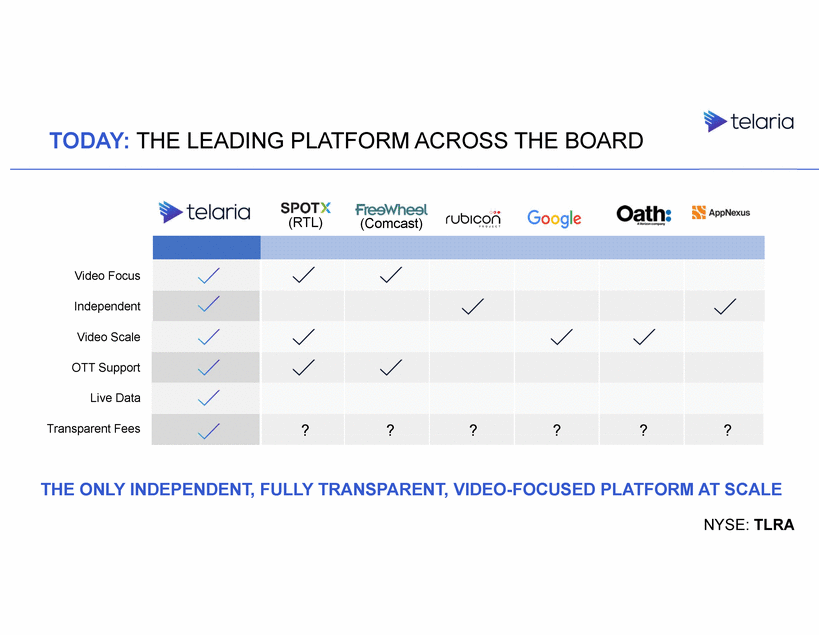
TODAY: THE LEADING PLATFORM ACROSS THE BOARD (RTL) (Comcast) Video Focus Independent Video Scale OTT Support Live Data Transparent Fees THE ONLY INDEPENDENT, FULLY TRANSPARENT, VIDEO-FOCUSED PLATFORM AT SCALE NYSE: TLRA ? ? ? ? ? ?
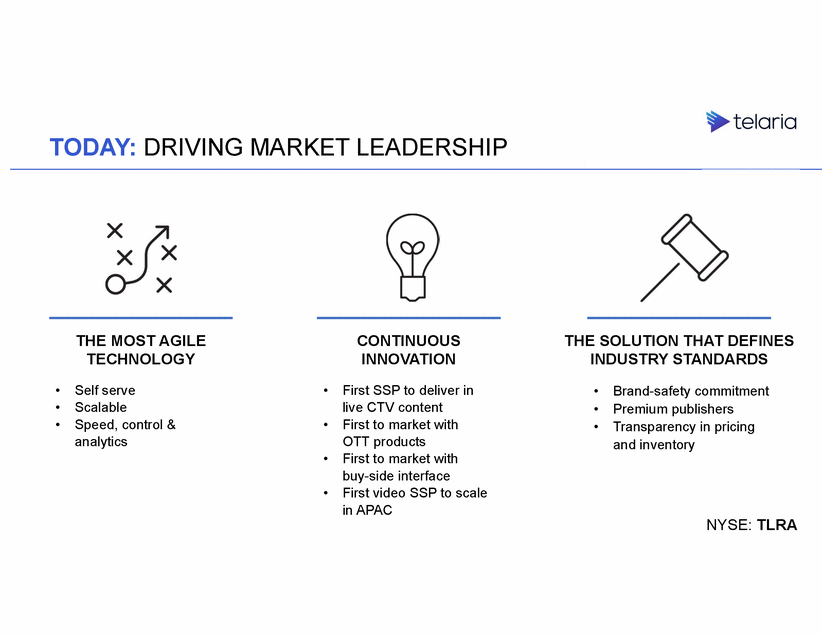
TODAY: DRIVING MARKET LEADERSHIP THE MOST AGILE TECHNOLOGY CONTINUOUS INNOVATION THE SOLUTION THAT DEFINES INDUSTRY STANDARDS • • • Self serve Scalable Speed, control & analytics • First SSP to deliver in live CTV content First to market with OTT products First to market with buy-side interface First video SSP to scale in APAC • • • Brand-safety commitment Premium publishers Transparency in pricing and inventory • • • NYSE: TLRA
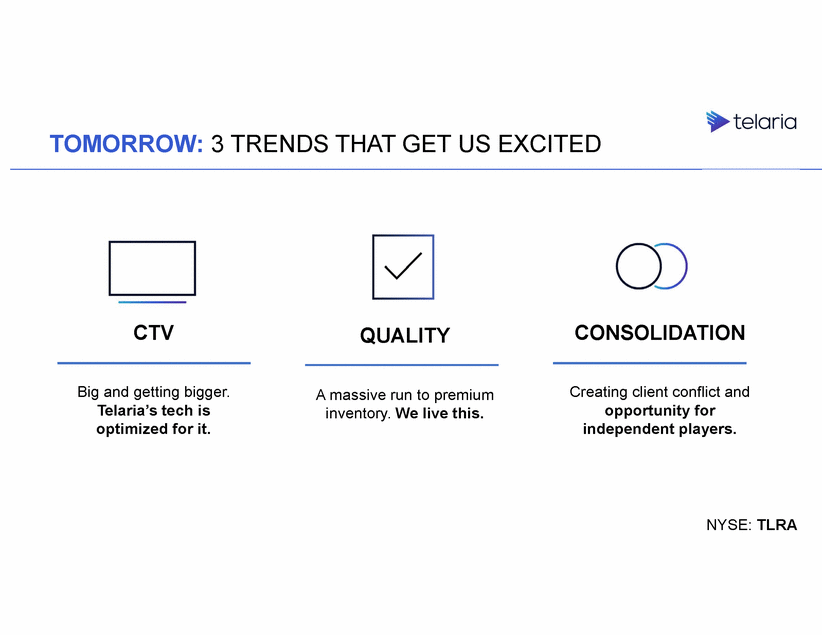
TOMORROW: 3 TRENDS THAT GET US EXCITED CTV CONSOLIDATION QUALITY Big and getting bigger. Telaria’s tech is optimized for it. Creating client conflict and opportunity for independent players. A massive run to premium inventory. We live this. NYSE: TLRA
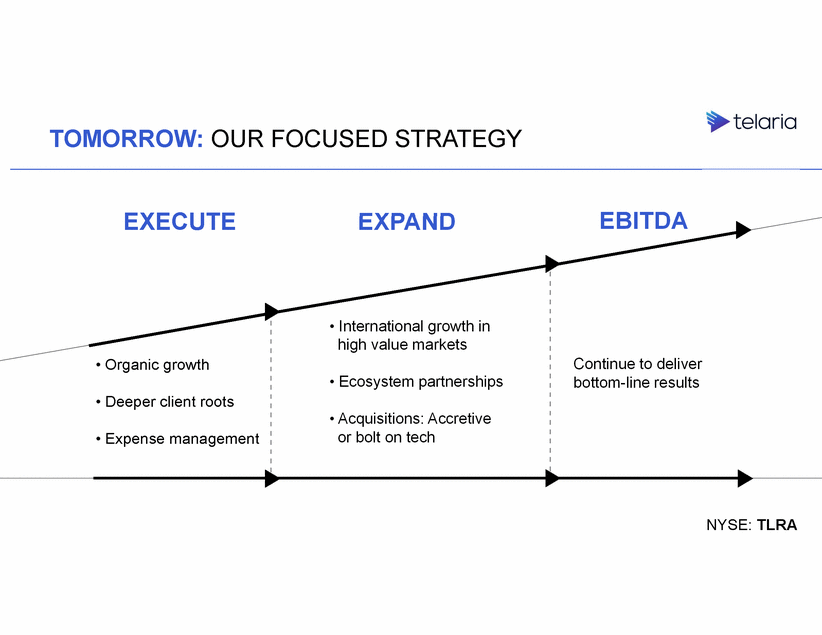
TOMORROW: OUR FOCUSED STRATEGY EBITDA EXECUTE EXPAND • International growth in high value markets • Organic growth Continue to deliver bottom-line results • Ecosystem partnerships • Deeper client roots • Acquisitions: Accretive or bolt on tech • Expense management NYSE: TLRA
TOMORROW: OUR FUTURE PAYOFF + We become ESSENTIAL to our partners + We build SCALE & MOMENTUM as the industry goes programmatic + We LEAD the race to capitalize on massive global digital video ad spend = We build EXCEPTIONAL VALUE for our stakeholders & shareholders NYSE: TLRA
PRODUCT &ENGINEERING VP, Product: Craig Berlingo VP, Engineering: Rama Roberts Analyst & Investor Day 2017 NYSE: TLRA
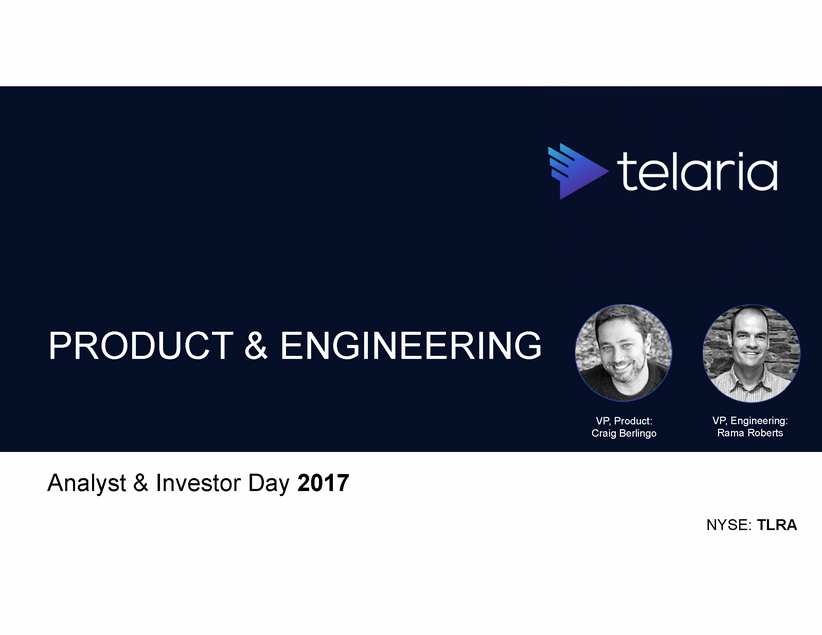
BUILDING FOR TOMORROW’S VIDEO WE MAKE THE SOFTWARE PREMIUM SELLERS RELY ON TO UNLOCK THE FULLEST VALUE OF THEIR VIDEO CONTENT, WHEREVER IT MAY BE. NYSE: TLRA
SELLERS DEMAND ADVANCED TECHNOLOGY Control Yield Insights NYSE: TLRA
WITH THE ADDED EXPECTATIONS OF TODAY’S VIEWERS ADS THAT: Repeat Are louder than the content Don’t match quality Break Slow down the experience Are device specific ARE NOT ACCEPTABLE THIS MAKES VIDEO DIFFERENT (AND HARDER) NYSE: TLRA
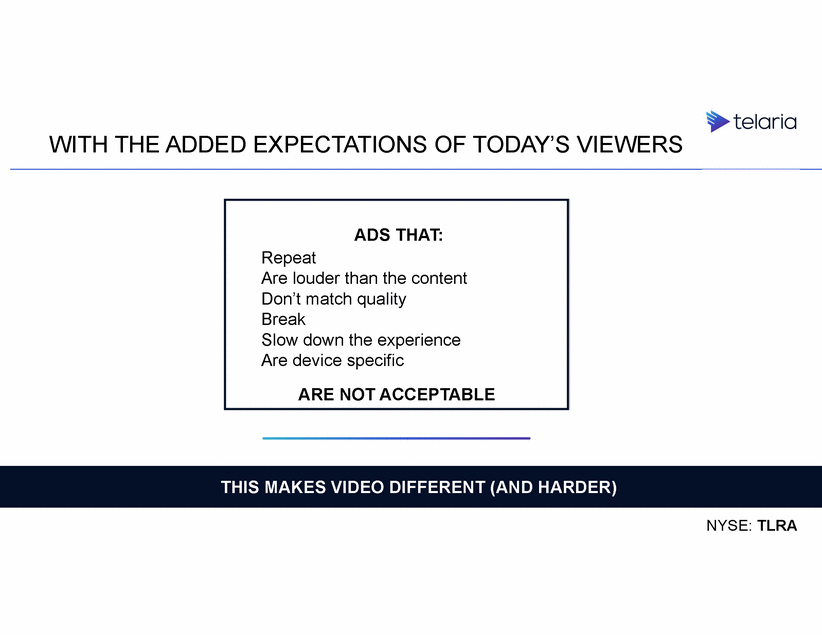
TELARIA SSP: THE ESSENTIAL VIDEO PLATFORM WHAT VIEWERS DEMAND WHAT PREMIUM VIDEO SELLERS NEED Quality Control Reliability Yield Speed Insights NYSE: TLRA
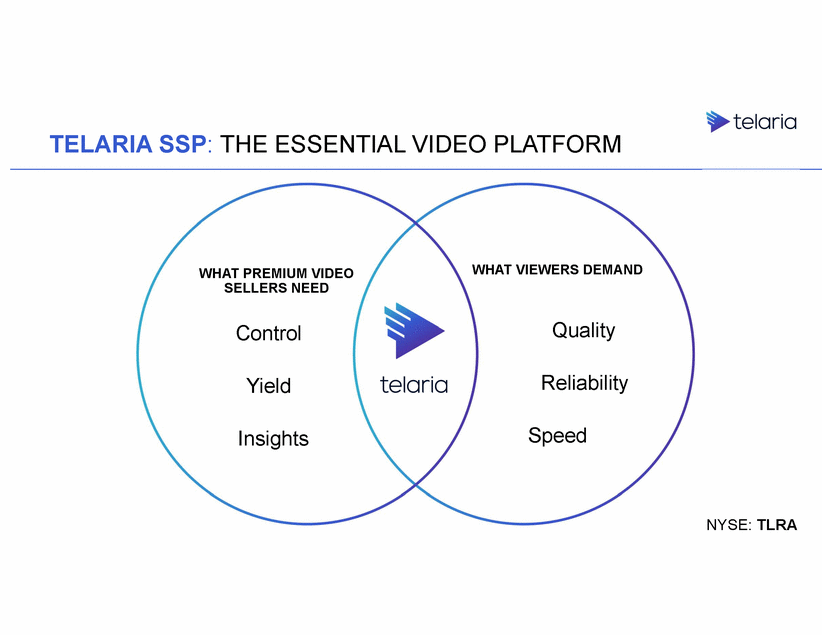
CONTROL: EXCLUSIVE BRAND SAFETY CONTROLS MAINTAIN THE VALUE OF YOUR BRAND NYSE: TLRA
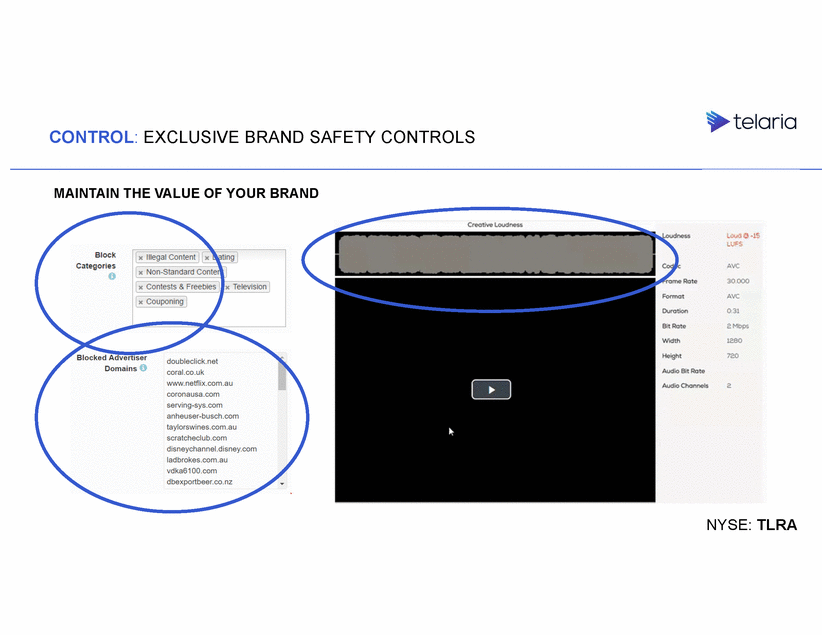
CONTROL: TRUE REAL TIME DIAGNOSTIC CAPABILITIES RESOLVE REVENUE IMPACTING ISSUES IN SECONDS, NOT HOURS OTHER SYSTEMS TAKE UPWARDS OF 24HRS TO TROUBLESHOOT NYSE: TLRA
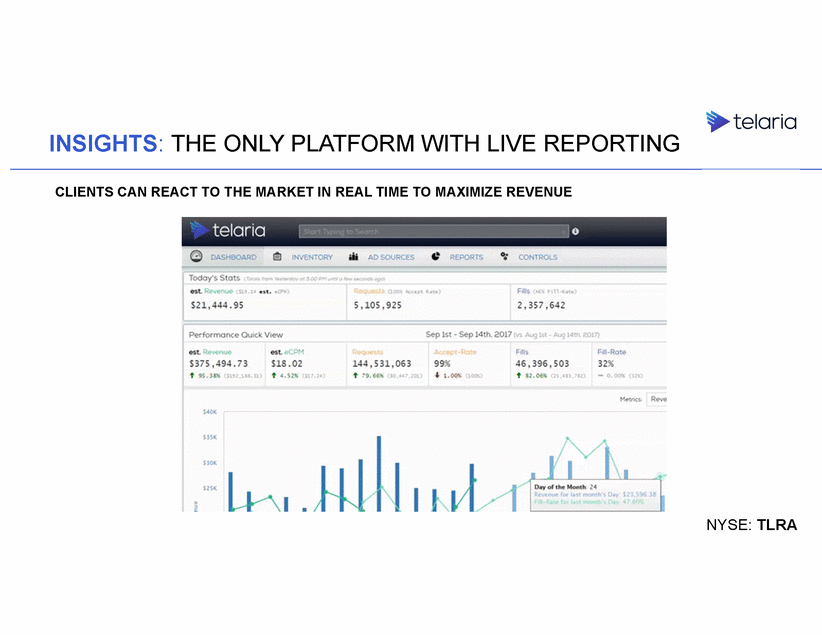
INSIGHTS: THE ONLY PLATFORM WITH LIVE REPORTING CLIENTS CAN REACT TO THE MARKET IN REAL TIME TO MAXIMIZE REVENUE NYSE: TLRA
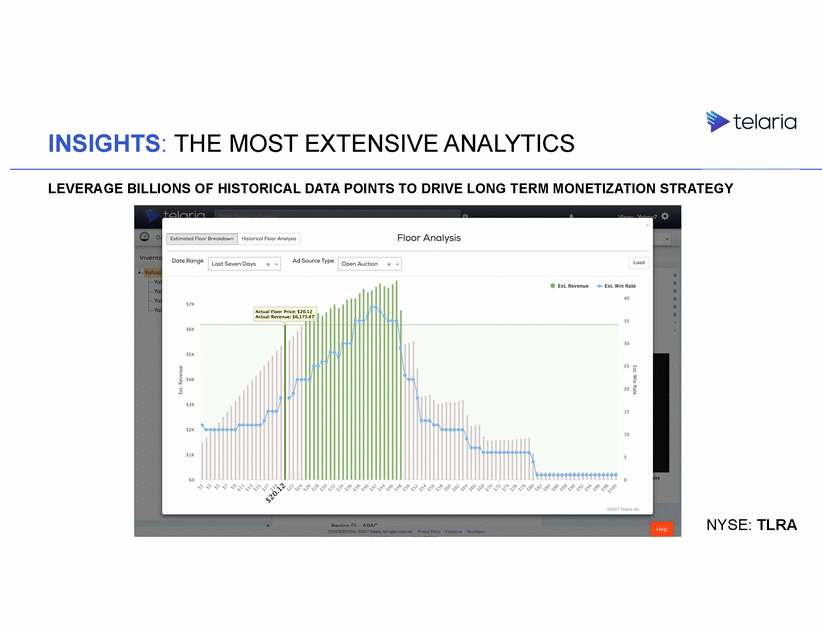
INSIGHTS: THE MOST EXTENSIVE ANALYTICS LEVERAGE BILLIONS OF HISTORICAL DATA POINTS TO DRIVE LONG TERM MONETIZATION STRATEGY NYSE: TLRA
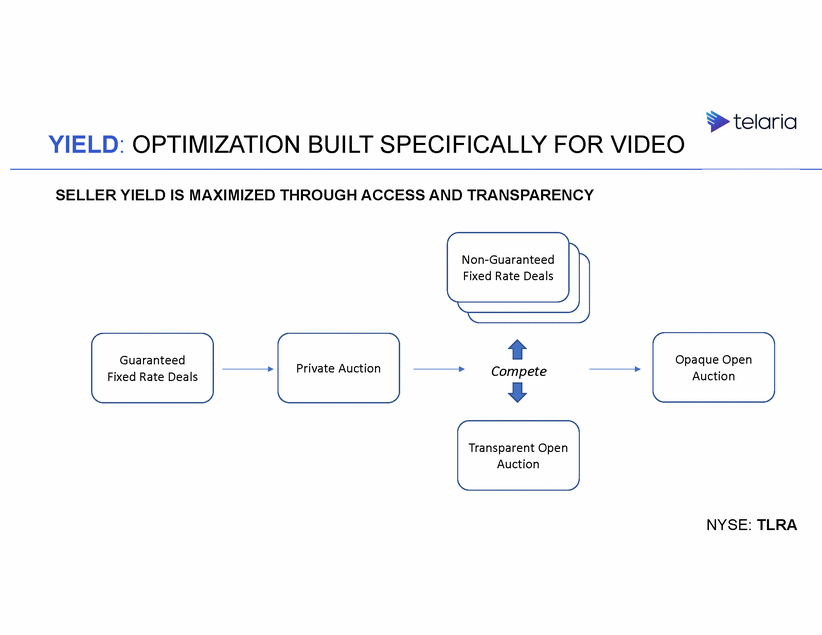
YIELD: OPTIMIZATION BUILT SPECIFICALLY FOR VIDEO SELLER YIELD IS MAXIMIZED THROUGH ACCESS AND TRANSPARENCY Non-Guaranteed Fixed Rate Deals Guaranteed Fixed Rate Deals Opaque Open Auction Private Auction Compete Transparent Open Auction NYSE: TLRA
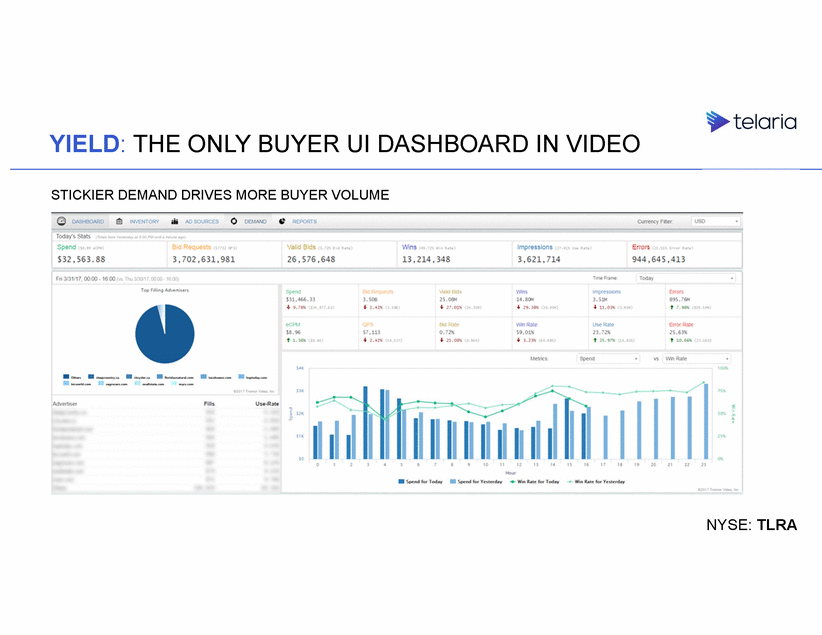
YIELD: THE ONLY BUYER UI DASHBOARD IN VIDEO STICKIER DEMAND DRIVES MORE BUYER VOLUME NYSE: TLRA
PLATFORM ARCHITECTURE BUILT FOR THE FUTURE NYSE: TLRA

WHAT THRIVING PLATFORMS NEED Scale Effectively Open & Interconnected Manage Volatility NYSE: TLRA
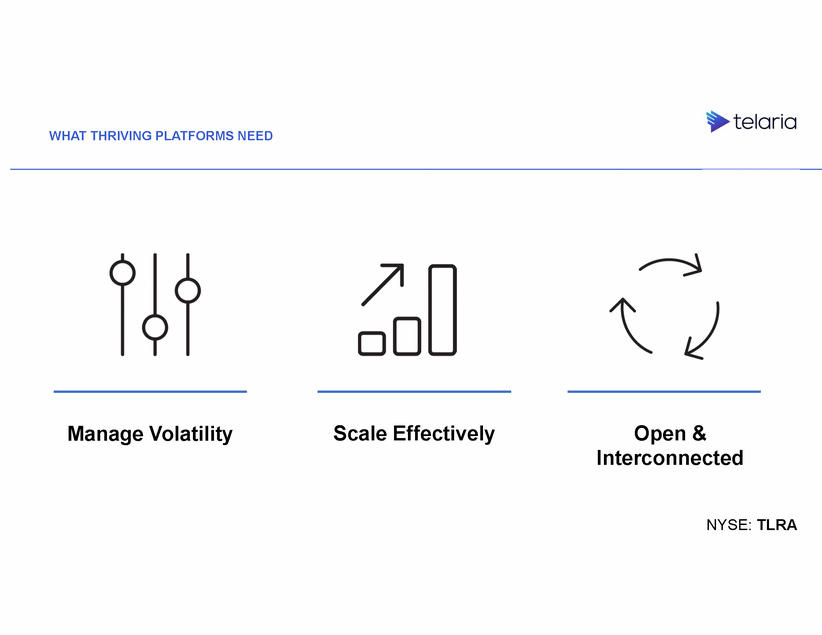
MANAGE VOLATILITY: VIDEO VOLUME IS UNIQUE NYSE: TLRA
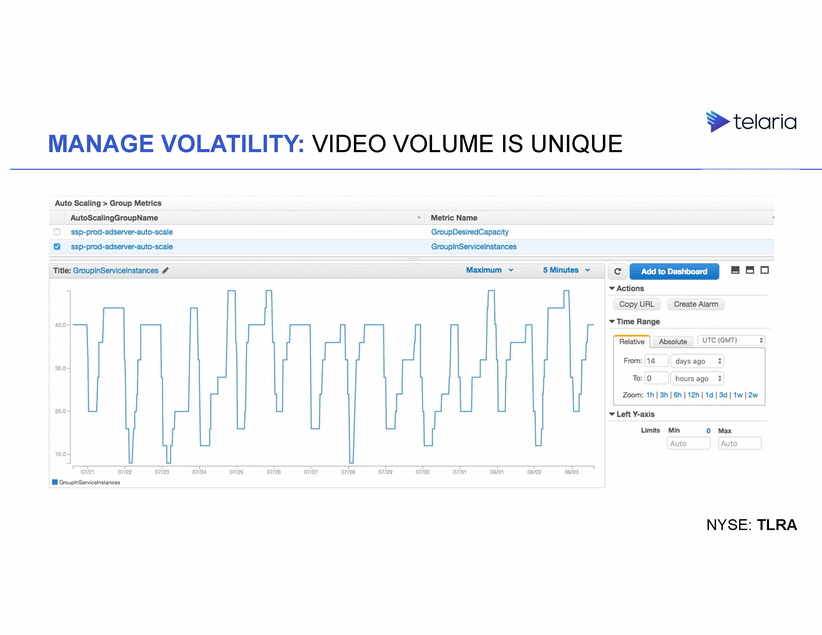
SCALE EFFICIENTLY: EXCEPTIONAL RELIABILITY NYSE: TLRA
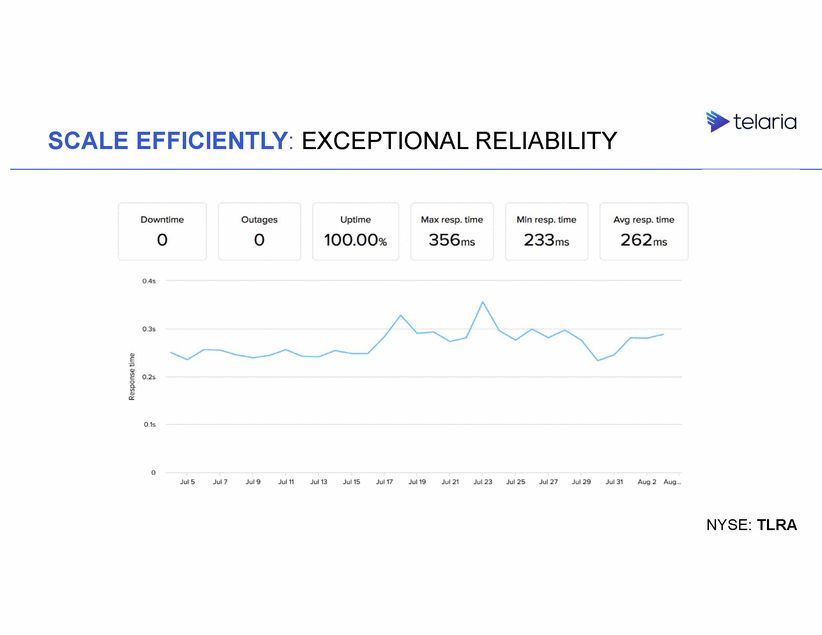
SCALE EFFICIENTLY: COST-EFFECTIVE ARCHITECTURE You just lost customers Large Capital Expenditure Opportunity Cost Predicted Demand Traditional Hardware Actual Demand Automated Virtualization NYSE: TLRA
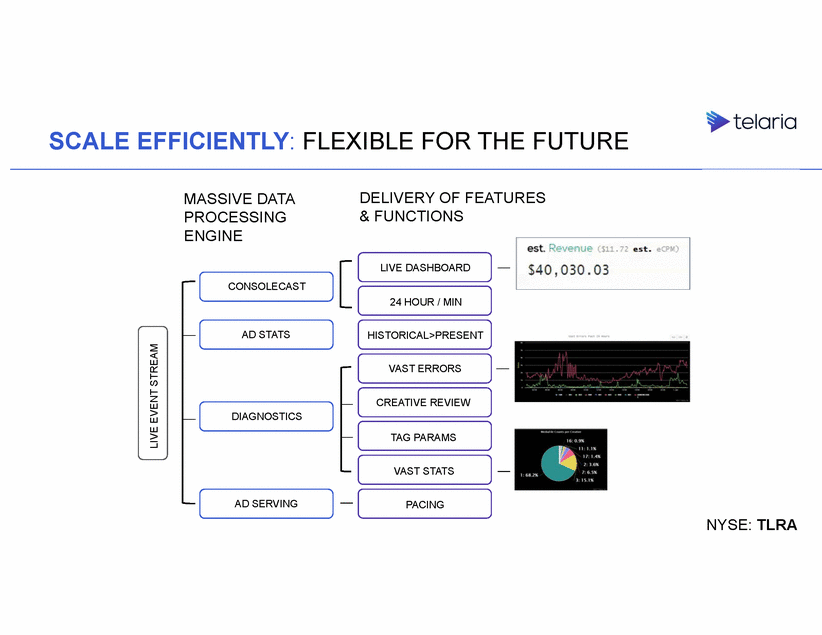
SCALE EFFICIENTLY: FLEXIBLE FOR THE FUTURE DELIVERY OF FEATURES & FUNCTIONS MASSIVE DATA PROCESSING ENGINE LIVE DASHBOARD CONSOLECAST 24 HOUR / MIN AD STATS HISTORICAL>PRESENT VAST ERRORS CREATIVE REVIEW DIAGNOSTICS TAG PARAMS VAST STATS AD SERVING PACING NYSE: TLRA LIVE EVENT STREAM
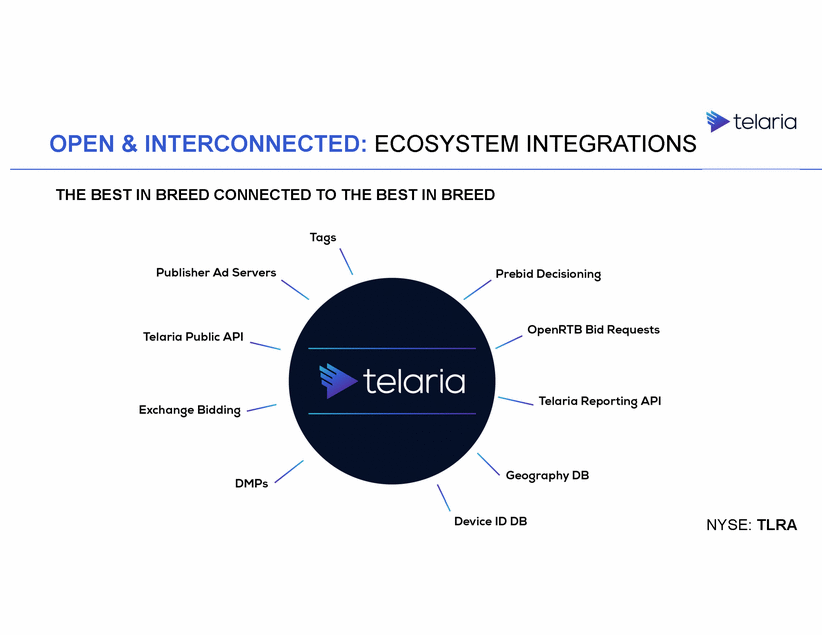
OPEN & INTERCONNECTED: ECOSYSTEM INTEGRATIONS THE BEST IN BREED CONNECTED TO THE BEST IN BREED NYSE: TLRA
WHAT THRIVING PLATFORMS NEED Scale Effectively Open & Interconnected Manage Volatility NYSE: TLRA

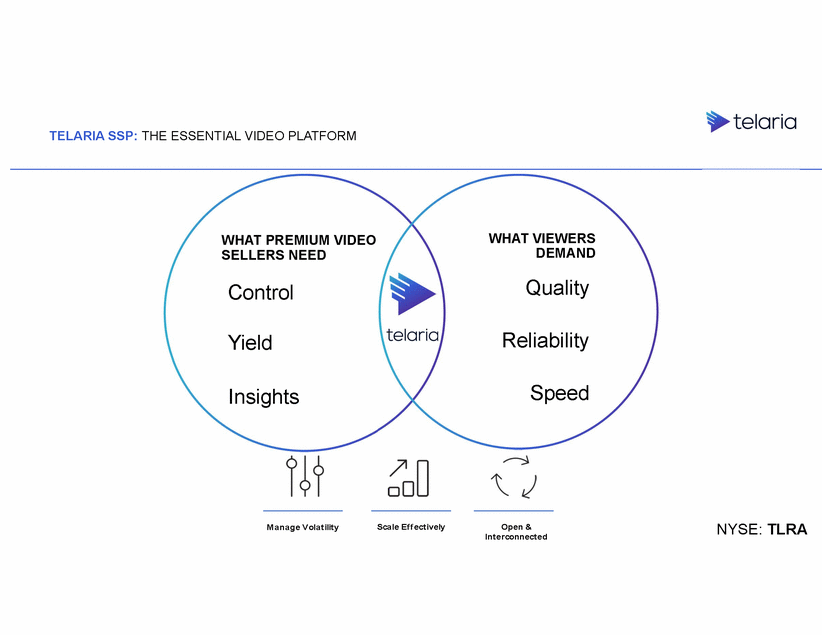
TELARIA SSP: THE ESSENTIAL VIDEO PLATFORM WHAT VIEWERS DEMAND WHAT PREMIUM VIDEO SELLERS NEED Quality Control Reliability Yield Speed Insights NYSE: TLRA M ana ge V ola t ilit y Scale Ef f ect ively Open & Int er connect ed
FINANCE CFO: John Rego Analyst & Investor Day 2017
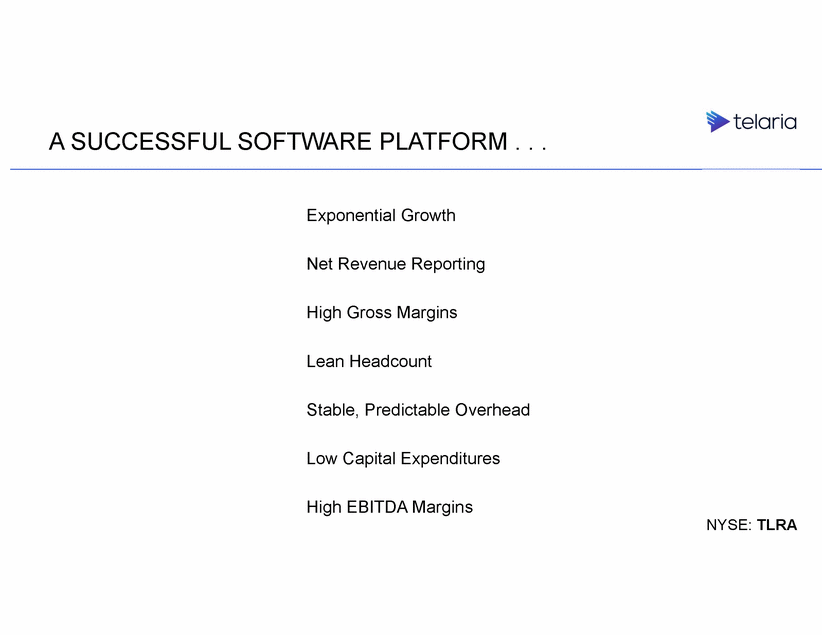
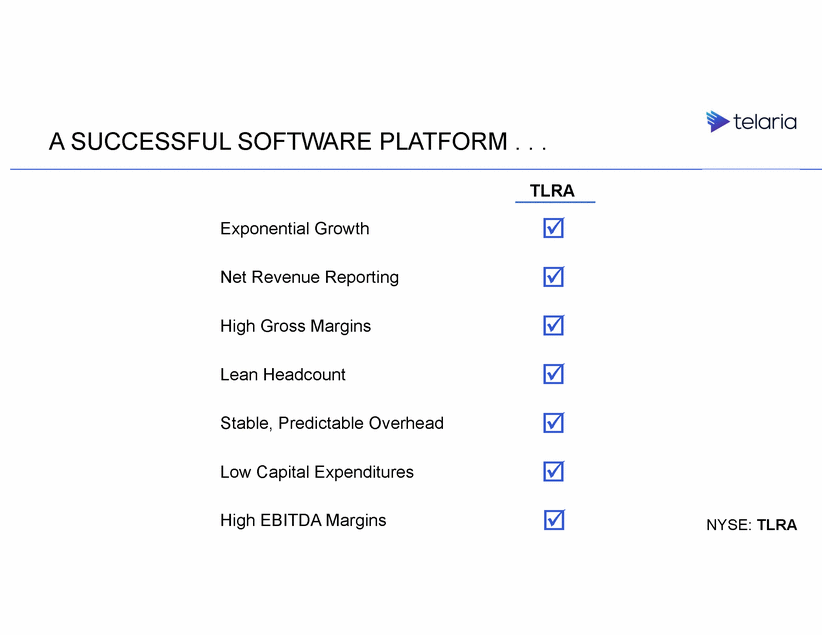
A SUCCESSFUL SOFTWARE PLATFORM . . . Exponential Growth Net Revenue Reporting High Gross Margins Lean Headcount Stable, Predictable Overhead Low Capital Expenditures High EBITDA Margins NYSE: TLRA
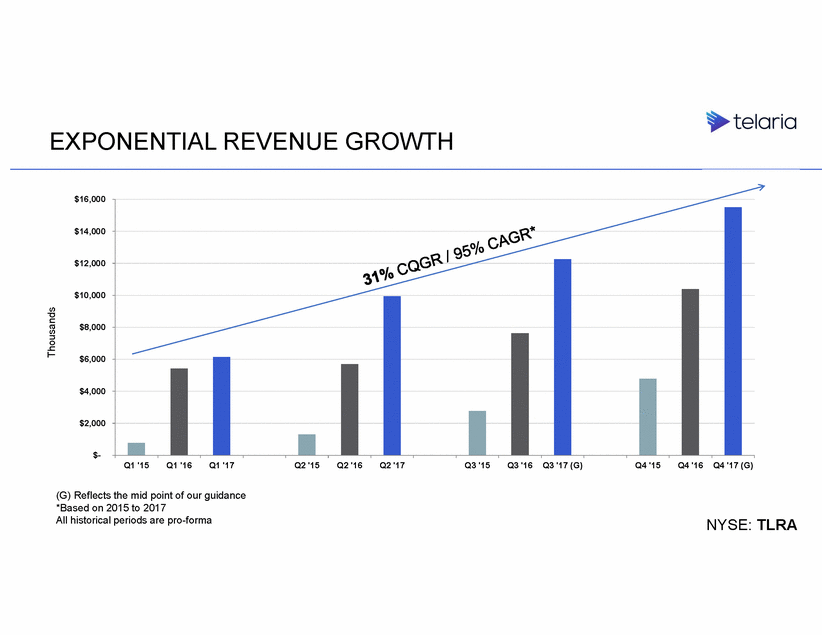
EXPONENTIAL REVENUE GROWTH $16,000 $14,000 $12,000 $10,000 $8,000 $6,000 $4,000 $2,000 $-Q1 '15 Q1 '16 Q1 '17 Q2 '15 Q2 '16 Q2 '17 Q3 '15 Q3 '16 Q3 '17 (G) Q4 '15 Q4 '16 Q4 '17 (G) (G) Reflects the mid point of our guidance *Based on 2015 to 2017 All historical periods are pro-forma NYSE: TLRA Thousands
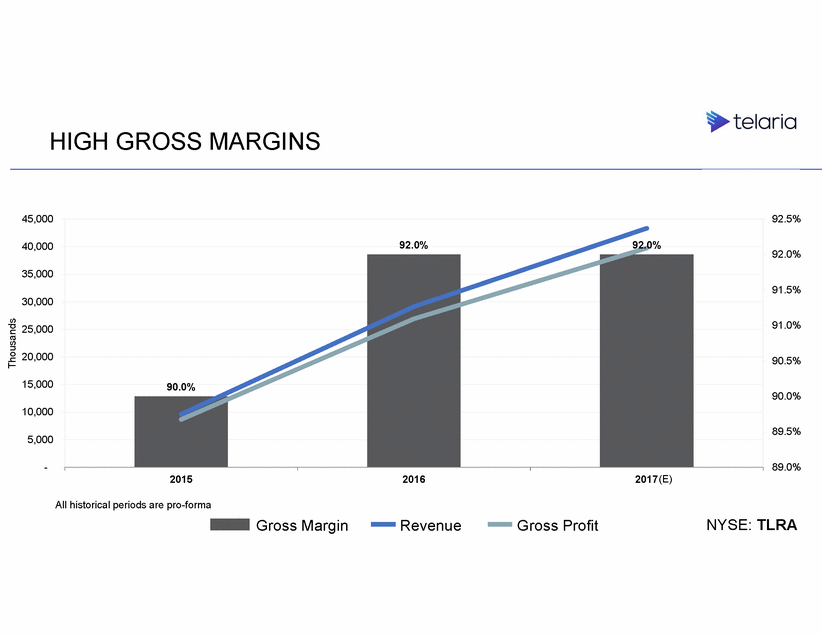
HIGH GROSS MARGINS 45,000 92.5% 92.0% 92.0% 40,000 92.0% 35,000 91.5% 30,000 91.0% 25,000 20,000 90.5% 15,000 90.0% 10,000 89.5% 5,000 - 89.0% 2015 2016 2017(E) All historical periods are pro-forma Gross Margin Revenue Gross Profit NYSE: TLRA Thousands 90.0%
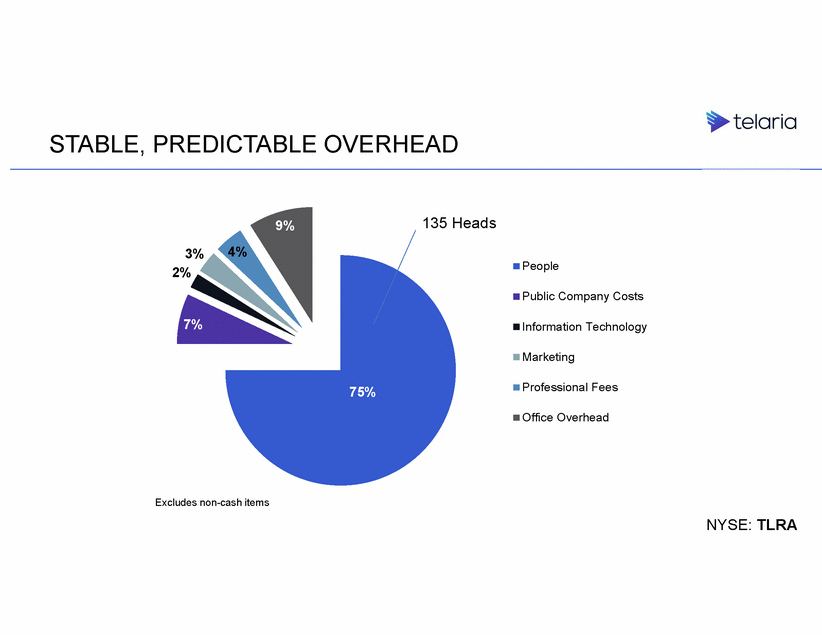
STABLE, PREDICTABLE OVERHEAD 135 Heads 9% 4% 3% 2% People Public Company Costs Information Technology Marketing Professional Fees 75% Office Overhead Excludes non-cash items NYSE: TLRA
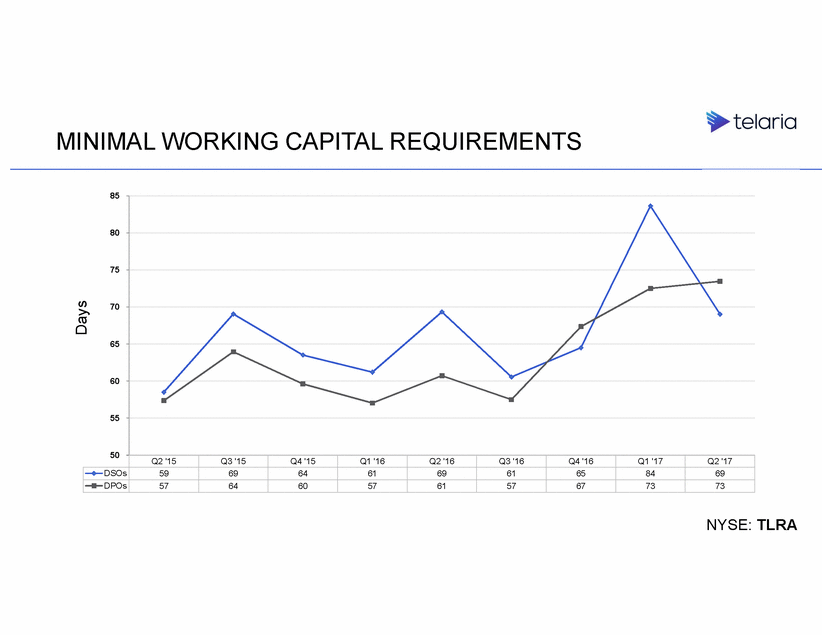
GUIDANCE (1) Adjusted EBITDA is a non-GAAP financial measure. Please see the discussion in the section called ”Non-GAAP Financial Measures” and the reconciliations included at the end of this presentation. (G) Guidance All historical periods are pro-forma NYSE: TLRA MILLIONS Q1 ’17 Q2 ’17 Q3 ’17 (G) Q4 ’17 (G) FYE ’17 (G) Revenue $6.1 $9.9 $12.0-$12.5 $14.5 - $16.5 $42.5 - $45.0 Adjusted EBITDA(1) $(6.4) $(3.4) $(0.5) - $0.0 $2.5 - $3.5 $(7.8) - $(6.3) EBITDA Margin 17.2% - 21.2%
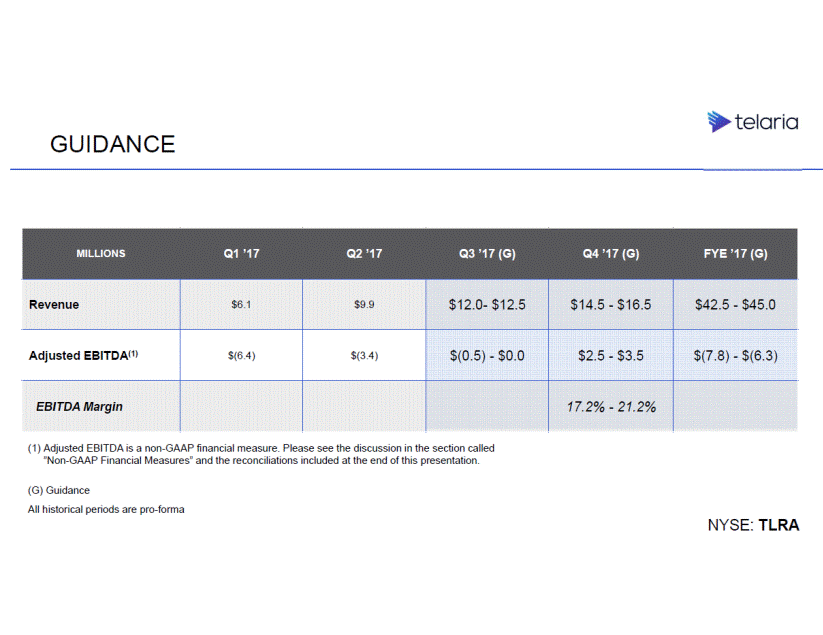
SIGNIFICANT OPERATING LEVERAGE $13,000 $8,000 $3,000 $(2,000) $(7,000) Q1 '17 Q2 '17 Q3 '17 (G) Q4 '17 (G) Adjusted EBITDA(1) Revenue (1) Adjusted EBITDA is a non-GAAP financial measure. Please see the discussion in the section called ”Non-GAAP Financial Measures” and the reconciliations included at the end of this presentation. (G) Reflects the mid point of our guidance All historical periods are pro-forma NYSE: TLRA Thousands
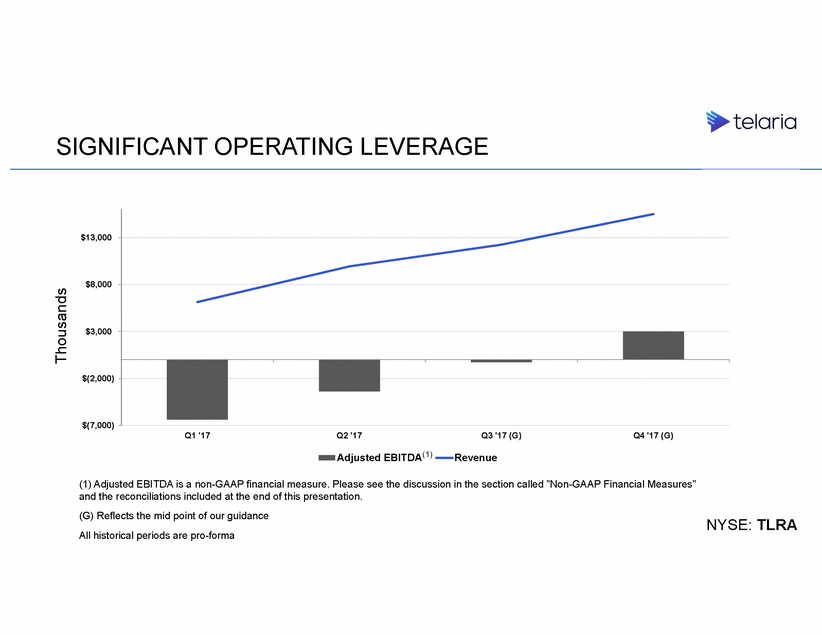
STRONG LIQUIDITY & CAPITAL RESOURCES June 2017 NYSE: TLRA (000’s) Pro Forma Cash & cash equivalents $83,553 Total Current Assets $117,412 Total Current Liabilities $39,436 Working Capital $77,976 Unused Credit Facility $35,000 CAPITAL RESOURCES $ 112,976
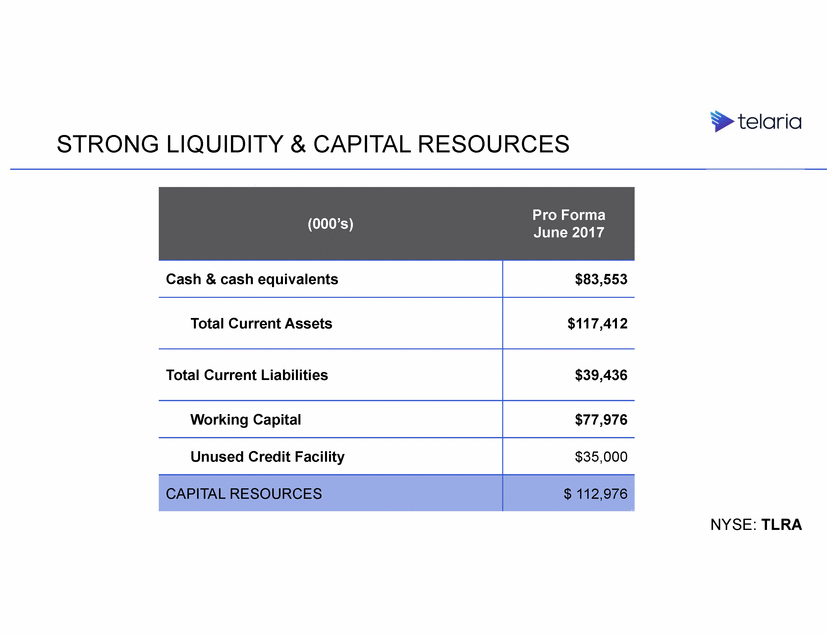
MINIMAL WORKING CAPITAL REQUIREMENTS 85 NYSE: TLRA Days 80 75 70 65 60 55 50 Q2 '15 Q3 '15 Q4 '15 Q1 '16 Q2 '16 Q3 '16 Q4 '16 Q1 '17 Q2 '17 DSOs 59 69 64 61 69 61 65 84 69 DPOs 57 64 60 57 61 57 67 73 73
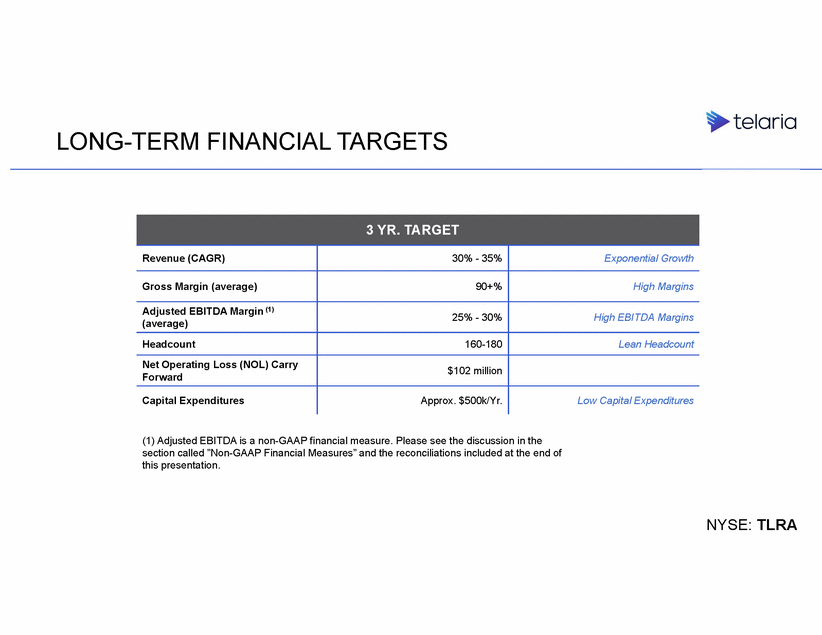
LONG-TERM FINANCIAL TARGETS (1) Adjusted EBITDA is a non-GAAP financial measure. Please see the discussion in the section called ”Non-GAAP Financial Measures” and the reconciliations included at the end of this presentation. NYSE: TLRA 3 YR. TARGET Revenue (CAGR) 30% - 35% Exponential Growth Gross Margin (average) 90+% High Margins Adjusted EBITDA Margin (1) (average) 25% - 30% High EBITDA Margins Headcount 160-180 Lean Headcount Net Operating Loss (NOL) Carry Forward $102 million Capital Expenditures Approx. $500k/Yr. Low Capital Expenditures
A SUCCESSFUL SOFTWARE PLATFORM . . . TLRA Exponential Growth Net Revenue Reporting High Gross Margins Lean Headcount Stable, Predictable Overhead Low Capital Expenditures High EBITDA Margins NYSE: TLRA
Q&A NYSE: TLRA 56
WRAP UP NYSE: TLRA 57

FROM VISION TO REALITY * THE LEADER TO OWN THIS OPPORTUNITY *Combined eMarketer and IDC data NYSE: TLRA

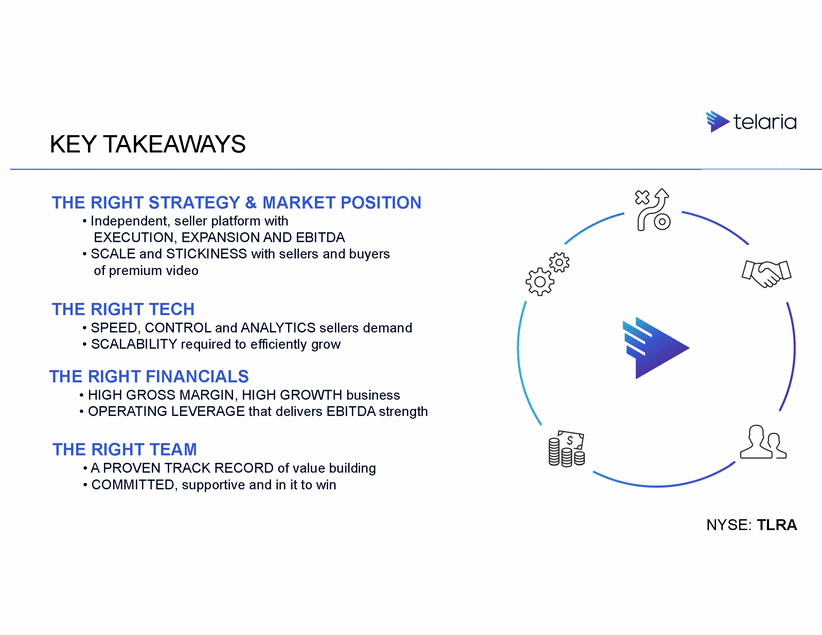
KEY TAKEAWAYS THE RIGHT STRATEGY & MARKET POSITION • Independent, seller platform with EXECUTION, EXPANSION AND EBITDA • SCALE and STICKINESS with sellers and buyers of premium video THE RIGHT TECH • SPEED, CONTROL and ANALYTICS sellers demand • SCALABILITY required to efficiently grow THE RIGHT FINANCIALS • HIGH GROSS MARGIN, HIGH GROWTH business • OPERATING LEVERAGE that delivers EBITDA strength THE RIGHT TEAM • A PROVEN TRACK RECORD of value building • COMMITTED, supportive and in it to win NYSE: TLRA
THE RIGHT STUFF to take advantage of the massive opportunity of IP-enabled video everywhere and deliver exceptional ROI for our stakeholders NYSE: TLRA
NYSE: TLRA
APPENDIX NYSE: TLRA
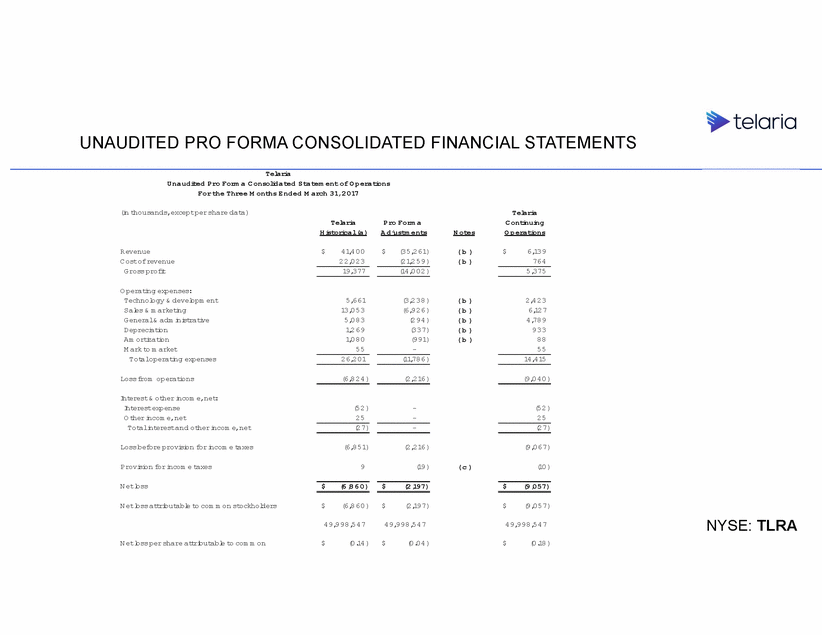
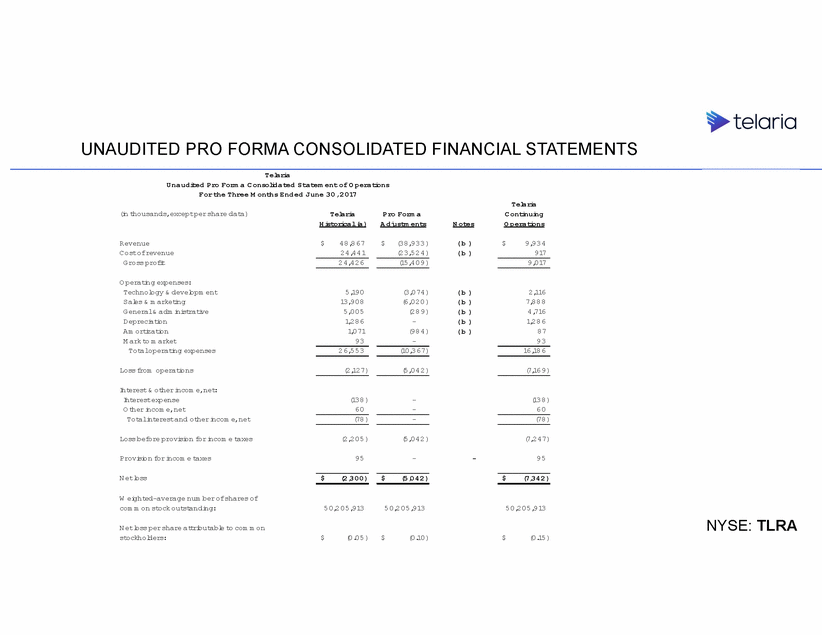
UNAUDITED PRO FORMA CONSOLIDATED FINANCIAL STATEMENTS On August 7, 2017, Telaria (the “Company”) and ScanScout, Inc. (the “Subsidiary”) completed the sale to Taptica Ltd. (“Buyer”), an affiliate of Taptica International Ltd, of certain assets and certain liabilities primarily related to the Company’s buyer platform, through which buyers of digital video advertising are able to buy, optimize, and measure the effectiveness of their video advertising campaigns across internet connected devices and screens (the “Business”), pursuant to an Asset Purchase Agreement (“Buy Side Transaction”), by and between the Company, the Subsidiary and the Buyer, dated August 4, 2017. The following unaudited pro forma consolidated statement of operations for the three-month periods ended March 31, 2017 and June 30, 2017, respectively, are presented as if the Buy Side Transaction had occurred on January 1, 2017. The unaudited consolidated pro forma financial statements have been derived from historical financial statements prepared in accordance with U.S. generally accepted accounting principles (“US GAAP”) and are presented based on information currently available. They are intended for informational purposes only and are not intended to represent the Company’s financial position or results of operations had the Buy Side Transaction and related events occurred on the dates indicated, or to project the Company’s financial performance for any future period. The unaudited pro forma consolidated financial statements and the accompanying notes should be read in conjunction with the following: (i) the unaudited consolidated financial statements and accompanying notes and “Management’s Discussion and Analysis of Financial Condition and Results of Operations” included in the Company’s Form 10-Q for the three months ended March 31, 2017 and (ii) the unaudited consolidated financial statements and accompanying notes and “Management’s Discussion and Analysis of Financial Condition and Results of Operations” included in the Company’s Form 10-Q for the three months ended June 30, 2017. NYSE: TLRA
UNAUDITED PRO FORMA CONSOLIDATED FINANCIAL STATEMENTS Telaria U naudited Pro Form a Consolidated Statem ent of Operations For the Three M onths Ended M arch 31,2017 (in thousands,exceptpershare data) Telaria C ontinuing Operations Telaria Historica l(a ) Pro Form a Adjustm ents Notes Revenue Costofrevenue G ross profit $ 41,400 22,023 $ (35,261) (21,259) (b ) (b ) $ 6,139 764 19,377 (14,002) 5,375 O perating expenses: Technology & developm ent Sales & m arketing G eneral& adm inistrative D epreciation Am ortization M ark to m arket Totaloperating expenses 5,661 13,053 5,083 1,269 1,080 55 (3,238) (6,926) (294) (337) (991) - (b ) (b ) (b ) (b ) (b ) 2,423 6,127 4,789 933 88 55 26,201 (11,786) 14,415 Loss from operations (6,824) (2,216) (9,040) Interest& otherincom e,net: Interestexpense O therincom e,net Totalinterestand otherincom e,net (52) 25 - - (52) 25 (27) - (27) Loss before provision forincom e taxes (6,851) (2,216) (9,067) Provision forincom e taxes 9 (19) (c ) (10) N etloss $ (6 ,86 0) $ (2,197) $ (9,057) N etloss attributable to com m on stockholders $ (6,860) $ (2,197) $ (9,057) NYSE: TLRA 49,998,547 49,998,547 49,998,547 N etloss pershare attributable to com m on $ (0.14) $ (0.04) $ (0.18)
UNAUDITED PRO FORMA CONSOLIDATED FINANCIAL STATEMENTS Telaria U naudited Pro Form a Consolidated Statem ent of Operations For the Three M onths Ended June 30,2017 Telaria C ontinuing Operations (in thousands,exceptpershare data) Telaria Historica l(a ) Pro Form a Adjustm ents Notes Revenue Costofrevenue G ross profit $ 48,867 24,441 $ (38,933) (23,524) $ 9,934 917 (b ) (b ) 24,426 (15,409) 9,017 O perating expenses: Technology & developm ent Sales & m arketing G eneral& adm inistrative D epreciation Am ortization M ark to m arket Totaloperating expenses 5,190 13,908 5,005 1,286 1,071 93 (3,074) (6,020) (289) - (984) - (b ) (b ) (b ) (b ) (b ) 2,116 7,888 4,716 1,286 87 93 26,553 (10,367) 16,186 Loss from operations (2,127) (5,042) (7,169) Interest& otherincom e,net: Interestexpense O therincom e,net Totalinterestand otherincom e,net (138) 60 - - (138) 60 (78) - (78) Loss before provision forincom e taxes (2,205) (5,042) (7,247) Provision forincom e taxes 95 - - 95 N etloss $ (2,300) $ (5,042) $ (7,342) W eighted-average num berofshares of com m on stock outstanding: 50,205,913 50,205,913 50,205,913 NYSE: TLRA N etloss pershare attributable to com m on stockholders: $ (0.05) $ (0.10) $ (0.15)
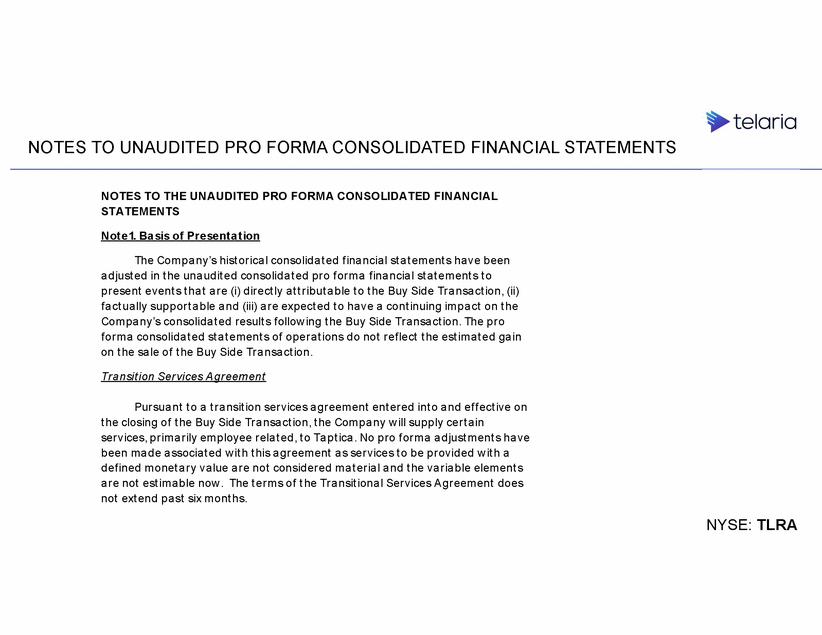
NOTES TO UNAUDITED PRO FORMA CONSOLIDATED FINANCIAL STATEMENTS NOTES TO THE UNAUDITED PRO FORM A CONSOLIDA TED FINAN CIA L STATEM ENTS N ot e1. Ba sis of Pr esent a t ion The Company’s hist or ical consolid at ed f ina ncia l st a t em ent s ha ve been ad just ed in t he unaudit ed consolid a t ed p r o f or m a f ina ncia l st a t em ent s t o pr esent event s t hat ar e (i) dir ect ly a t t r ib ut a b le t o t he Buy Side Tr ansa ct ion, (ii) f a ct ua lly suppor t ab le and (iii) ar e exp ect ed t o ha ve a cont inuing im pa ct on t he Com p a ny’s consolid a t ed r esult s f ollow ing t he Buy Sid e Tr ansa ct ion. The p r o f or m a consolid a t ed st a t em ent s of op er a t ions d o not r ef lect t he est im a t ed ga in on t he sa le of t he Buy Sid e Tr a nsact ion. Tr a nsit ion Ser v ices A gr eem ent Pur sua nt t o a t r a nsit ion ser vices a gr eem ent ent er ed int o a nd ef f ect ive on t he closing of t he Buy Sid e Tr a nsa ct ion, t he Com p a ny w ill sup p ly cer t a in ser vices, p r im ar ily em ployee r ela t ed, t o Ta pt ica . No p r o f or m a ad just ment s ha ve been m ade associat ed w it h t his agreem ent a s ser vices t o b e p r ovid ed w it h a def ined monet a r y va lue ar e not consid er ed mat er ial a nd t he va r iab le elem ent s a r e not est im a b le now . The t er m s of t he Tr a nsit iona l Ser vices A gr eem ent d oes not ext end p a st six m ont hs. NYSE: TLRA
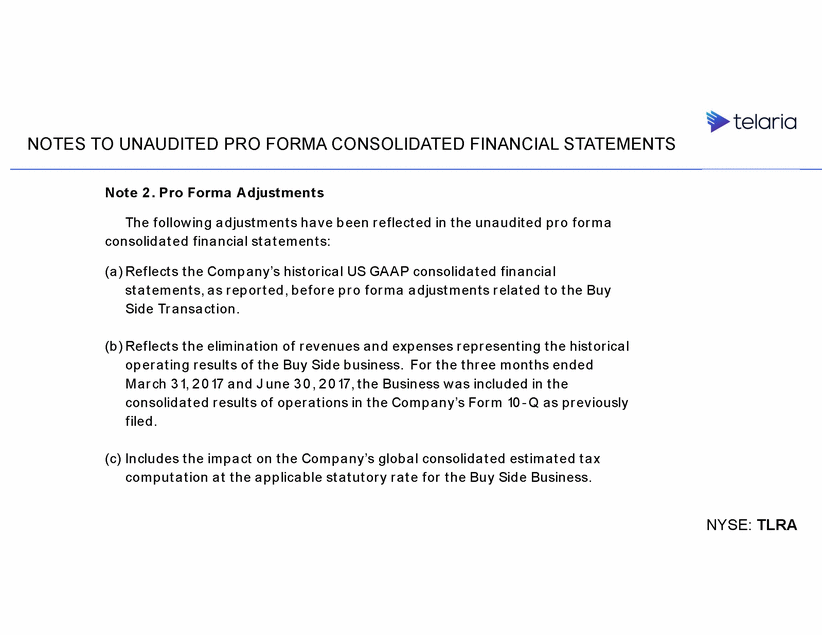
NOTES TO UNAUDITED PRO FORMA CONSOLIDATED FINANCIAL STATEMENTS Not e 2 . Pro For ma Adjust ment s The f ollow ing adjust ment s ha ve been ref lect ed in t he unaudit ed pr o f or m a consolid a t ed f ina ncia l st a t em ent s: (a ) Ref lect s t he Com p a ny’s hist or ica l US GA A P consolid a t ed f ina ncia l st at em ent s, as repor t ed , bef or e pr o f or m a adjust m ent s r ela t ed t o t he Buy Side Tr ansa ct ion. (b ) Ref lect s t he elim ina t ion of r evenues a nd exp enses r ep r esent ing t he hist or ica l op er a t ing r esult s of t he Buy Sid e b usiness. For t he t hr ee m ont hs end ed Ma r ch 3 1, 2 0 17 a nd J une 3 0 , 2 0 17, t he Business w a s includ ed in t he consolid at ed r esult s of op er at ions in t he Company’s For m 10 - Q as pr eviously f iled . (c) Includ es t he im p a ct on t he Com p a ny’s glob a l consolid a t ed est im a t ed ta x com p ut a t ion a t t he a p p lica b le st a t ut or y r a t e f or t he Buy Sid e Business. NYSE: TLRA
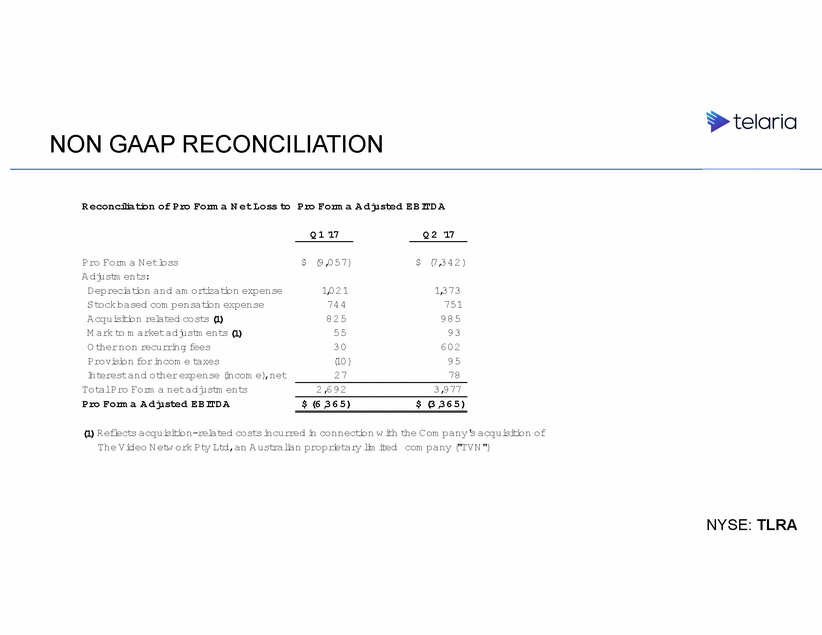
NON-GAAP FINANCIAL MEASURES To supplement its consolidated financial statements, which are prepared and presented in accordance with U.S. generally accepted accounting principles (“GAAP”), Telaria reports Adjusted EBITDA which is a non-GAAP financial measure. We define Adjusted EBITDA as net loss plus (minus): interest expense and other income (expense), net, provision for income taxes, depreciation and amortization expense, non-cash stock-based compensation expense, non-cash stock-based long-term incentive compensation, executive severance and retention costs, acquisition related costs, litigation costs associated with class action securities litigation, mark-to-market expense, impairment charges, other professional fees, and other adjustments. We use this non-GAAP financial measure for financial and operational decision making and as a means to evaluate period-to-period comparisons. We believe that this measure provides useful information about our operating results, enhance the overall understanding of our past financial performance and future prospects, and allow for greater transparency with respect to key metrics used by management in its financial and operational decision making. Non-GAAP financial measures should be considered in addition to results and guidance prepared in accordance with GAAP, but should not be considered a substitute for, or superior to, GAAP results. The non-GAAP financial measures included in this presentation have been reconciled to the nearest GAAP measure in the table following the financial statements attached to this presentation. With respect to our expectations under “Guidance” above, reconciliation of Adjusted EBITDA guidance to the closest corresponding GAAP measure is not available without unreasonable efforts on a forward-looking basis due to the high variability, complexity and low visibility with respect to the costs and charges excluded from these non-GAAP measures, in particular, the measures and effects of stock-based compensation expense specific to equity compensation awards that are directly impacted by unpredictable fluctuations in our stock price. We expect the variability of these costs and charges to have a significant, and potentially unpredictable, impact on our future GAAP financial results. NYSE: TLRA
NON GAAP RECONCILIATION R econciliation of Pro Form a N et Loss to Pro Form a A djusted EB ITD A Q1 '17 Q 2 '17 Pro Form a N etloss A djustm ents: D epreciation and am ortization expense Stock based com pensation expense A cquisition related costs (1) M ark to m arketadjustm ents (1) O thernon recurring fees Provision forincom e taxes Interestand otherexpense (incom e),net TotalPro Form a netadjustm ents Pro Form a A djusted EB ITD A $ (9,057) $ (7,342) 1,021 744 825 55 30 (10) 27 1,373 751 985 93 602 95 78 2,692 3,977 $ (6 ,36 5) $ (3,36 5) (1)Reflects acquisition-related costs incurred in connection w ith the Com pany's acquisition of The Video N etw ork Pty Ltd,an A ustralian proprietary lim ited com pany ("TVN ") NYSE: TLRA
