Attached files
| file | filename |
|---|---|
| 8-K - FORM 8-K - CAPITAL SENIOR LIVING CORP | d450842d8k.htm |
 Capital
Senior Living A Leading Pure-Play Senior Housing Owner-Operator
Exhibit 99.1 |
 2 Forward-Looking Statements • The forward-looking statements in this presentation are subject to certain risks and uncertainties that
could cause results to differ materially, including, but not without limitation to, the
Company’s ability to complete the refinancing of certain of our
wholly owned communities, realize the anticipated savings related to such
financing, find suitable acquisition properties at favorable terms, financing, licensing, business conditions, risks of downturns in economic conditions generally, satisfaction of closing
conditions such as those pertaining to licensures, availability of insurance at
commercially reasonable rates and changes in accounting principles and
interpretations among others, and other risks and factors identified from
time to time in our reports filed with the Securities and Exchange Commission • The Company assumes no obligation to update or supplement forward-looking statements in this
presentation that become untrue because of new information, subsequent events or
otherwise. |
 Non-GAAP Financial Measures
• Adjusted EBITDAR is a financial valuation measure and Adjusted Net Income and Adjusted CFFO are financial performance
measures that are not calculated in accordance with U.S. generally accepted accounting
principles (“GAAP”). Non-GAAP financial measures may
have material limitations in that they do not reflect all of the costs associated with our results of operations as determined in accordance with GAAP. As a result, these non-GAAP financial measures should not be considered a substitute for, nor superior to, financial results and measures determined or calculated in accordance with GAAP. Adjusted EBITDAR is a valuation measure commonly used by our management, research analysts and investors to value companies in
the senior living industry. Because Adjusted EBITDAR excludes interest expense and
rent expense, it allows our management, research analysts and investors to
compare the enterprise values of different companies without regard to differences in capital structures and leasing arrangements. The Company believes that Adjusted Net Income and Adjusted CFFO are useful as
performance measures in identifying trends in day-to-day operations because they
exclude the costs associated with acquisitions and conversions and other
items that do not ordinarily reflect the ongoing operating results of our primary business. Adjusted Net Income and Adjusted CFFO provide indicators to management of progress in achieving both
consolidated and individual business unit operating performance and are used by research
analysts and investors to evaluate the performance of companies in the
senior living industry. The Company strongly urges you to review on the last page of this release the reconciliation of net loss to Adjusted EBITDAR and the reconciliation of net (loss) income to Adjusted Net (Loss)
Income and Adjusted CFFO, along with the Company’s consolidated balance sheets,
statements of operations, and statements of cash flows.
3 |
 Capital
Senior Living Investment Rationale Attractively Positioned in the Highly
Fragmented Senior Housing Market Executing a Long-Term, Sustainable
Growth Strategy with a Focus on Real Estate Ownership
Capital Plan Supports Long-Term Growth Initiatives
Track Record of Strong Growth and Uniquely Positioned for Continued
Success CSU has a clear and differentiated real-estate strategy to drive industry-leading growth
and superior shareholder value
CSU has a clear and differentiated real-estate strategy to drive
industry-leading growth and superior shareholder value
4 1 2 3 4 |
 Attractively Positioned in the Highly
Fragmented Senior Housing Market
5 1 |
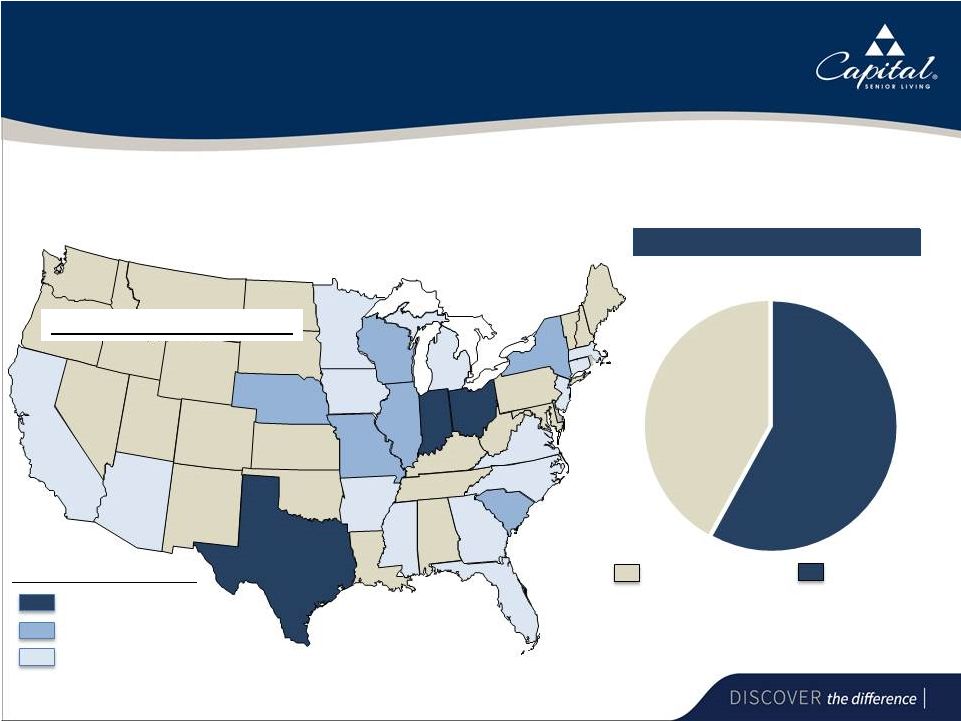 6 Top-10 Operator and Pure-Play Senior Housing Company Portfolio Mix (Average Units) As of June 30, 2017 AR. 173 CT. 238 FL. 429 IA. 122 IL. 762 IN. 2,440 MI. 173 MN. 173 MO. 662 MS. 143 NC. 457 SC. 683 NE. 650 NJ. 98 NY. 603 OH. 2,372 TX. 3,990 VA. 455 CA. 408 AZ. 189 Resident Capacity By State Capital Senior Living operates 129 communities in geographically concentrated regions with the capacity to serve 16,500 residents WI. 741 GA. 168 MA. 323 Number of residents by State Greater than 2,000 500 - 2,000 Less than 500 Assisted Living Independent Living 58.0% 42.0% |
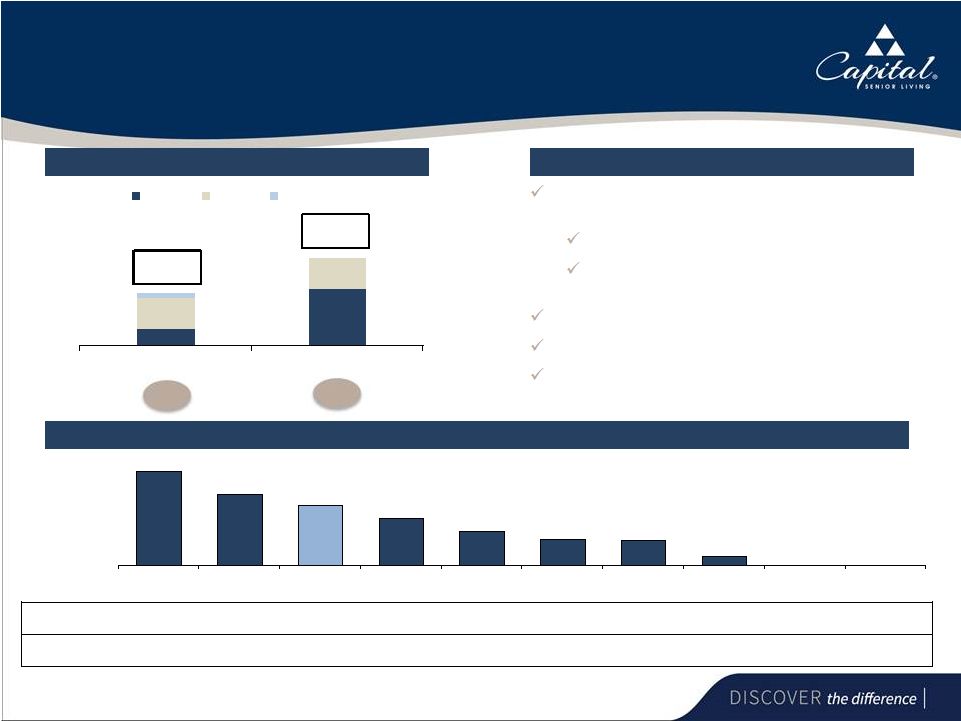 7 25 83 45 46 7 2010 Current Owned Leased Joint Venture One of the Largest Senior Housing Owners by Percentage of Ownership Ownership Evolution Advantages to Real Estate Ownership Ownership of 10 Largest US Senior Housing Operators Maximizes cash flow and real estate value by providing valuation support Stronger margin profile Eliminates lease escalators, driving sustainable cash flows Optimizes asset management and financial flexibility Ability to reposition communities Ability to increase loans based on the appreciated value to re-deploy the capital into growth initiatives Owned % 129 Total Properties 77 Total Properties 100.0% 75.6% 64.3% 50.0% 36.5% 27.9% 26.4% 9.4% Enlivant Senior Lifestyle Capital Senior Living Erickson Living Brookdale Senior Living Holiday Retirement LCS Five Star Senior Living Sunrise Senior Living Atria Senior Living 2016 Properties Owned 179 161 83 9 407 86 37 26 0 0 2016 Properties Operated 179 213 129 18 1,114 308 140 276 252 156 Source: ASHA 2016 Top 50, company filings and investor presentations. Note: Five Star Senior Living pro forma for property acquisitions and divestitures. Primarily minority interest in joint ventures. (1) NM NM (1) 32.5% 64.3% |
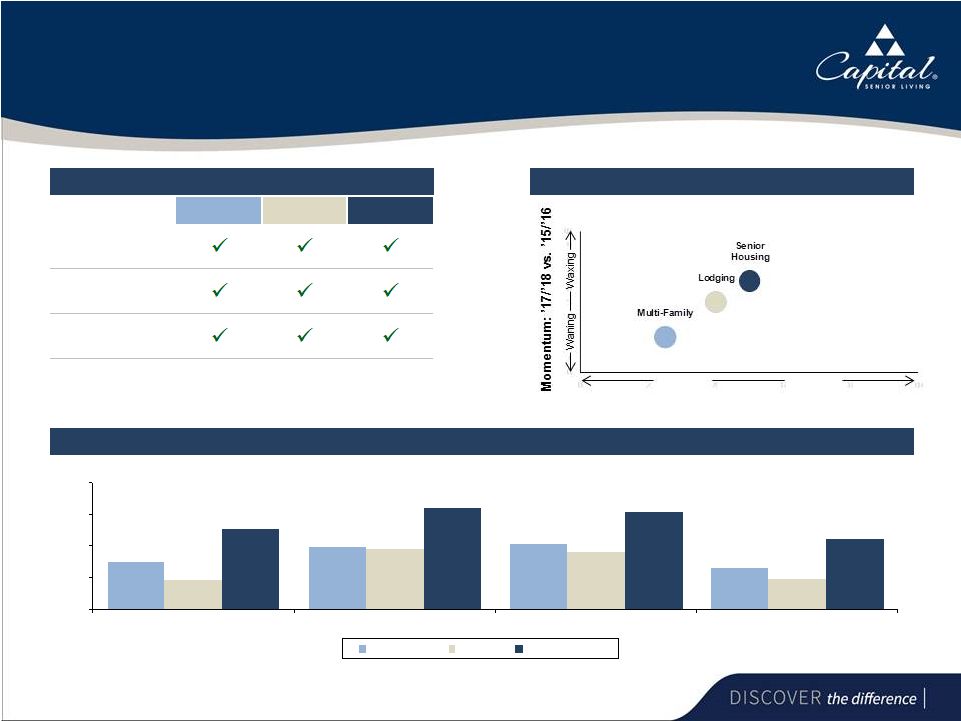 8 7.3% 9.9% 10.2% 6.6% 4.7% 9.6% 8.9% 4.8% 12.8% 16.1% 15.3% 11.2% 0% 5% 10% 15% 20% 1-Year 3-Years 5-Years 10-Years Multi-Family Lodging Senior Housing Multi-Family Lodging Senior Housing Economy Population Growth / Demographic Mix Location Specific Demand/Supply Government Reimbursement × × × CSU’s Pure-Play Private-Pay Senior Housing Model has Many Similarities to the Multi-Family and Lodging Sectors, While Historically Providing Investors with Higher Returns Key Housing Sector Drivers Benchmarking the Housing Sector Senior Housing Yields Consistent High Investment Returns NCREIF Annualized Total Investment Returns (1,3,5, 10-Year Periods, as of 12/31/16)
’17/’18 Average
M-RevPAF (1) Expected Actual & Momentum Source: Green Street Advisors and NIC MAP Data Service as of 12/31/16. (1) M-RevPAF is Market Revenue per Available Foot and represents the combined changes in occupancy (demand)
and rents (pricing). Strongest Weakest |
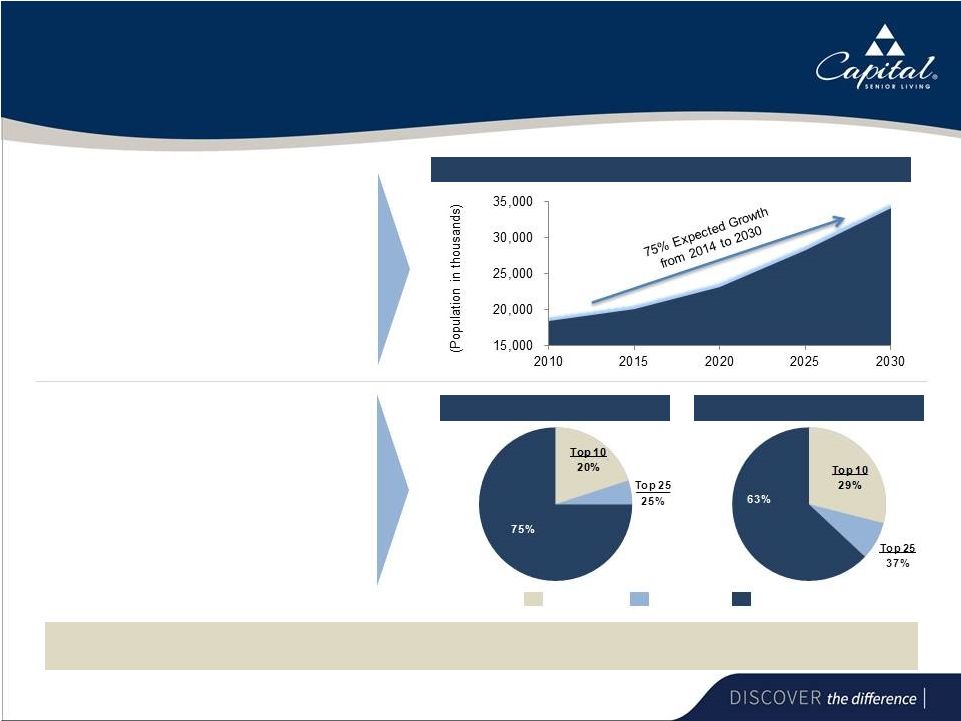 9 The Senior Living Market Offers Attractive Long Term Fundamentals... • U.S. population 75+ years old is expected to increase from ~6% of total current population to 12% by 2030 • Current penetration rate implies demand growth of ~40K units per annum • 75% of the Independent Living market and 63% of the Assisted Living market is comprised of small players operating at a cost structure disadvantage Top 10 Remaining Market Top 25 Clear opportunity for scale players to capture a disproportionate share of growth through organic initiatives
and accretive acquisitions
Source: 2010 Consensus Summary File 1, U.S. Census Bureau, Population Division,
IBISWorld and Wall Street Research. U.S. Seniors Population Trends (75+
years old) Independent Living Companies
Assisted Living Companies |
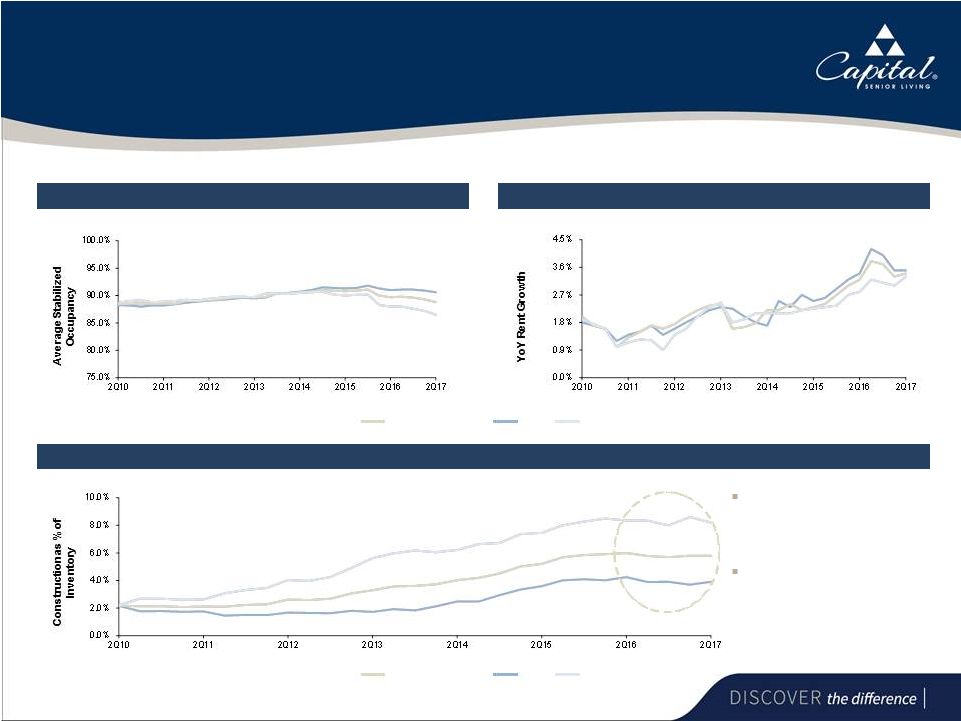 10 ...and a Highly Constructive Current Operating Environment Source: NIC MAP Data Service as of 06/30/17. Occupancy Stabilizing Across the Country Senior Housing Rent is Seeing Growth After Recent Declines Senior Housing IL AL Industry Supply is Stabilizing in IL and Senior Housing Since 2Q 2016, overall industry supply has flat lined across Senior Housing as a whole AL experienced a decline in supply in 2Q 2017 after an uptick in 1Q 2017 Senior Housing IL AL |
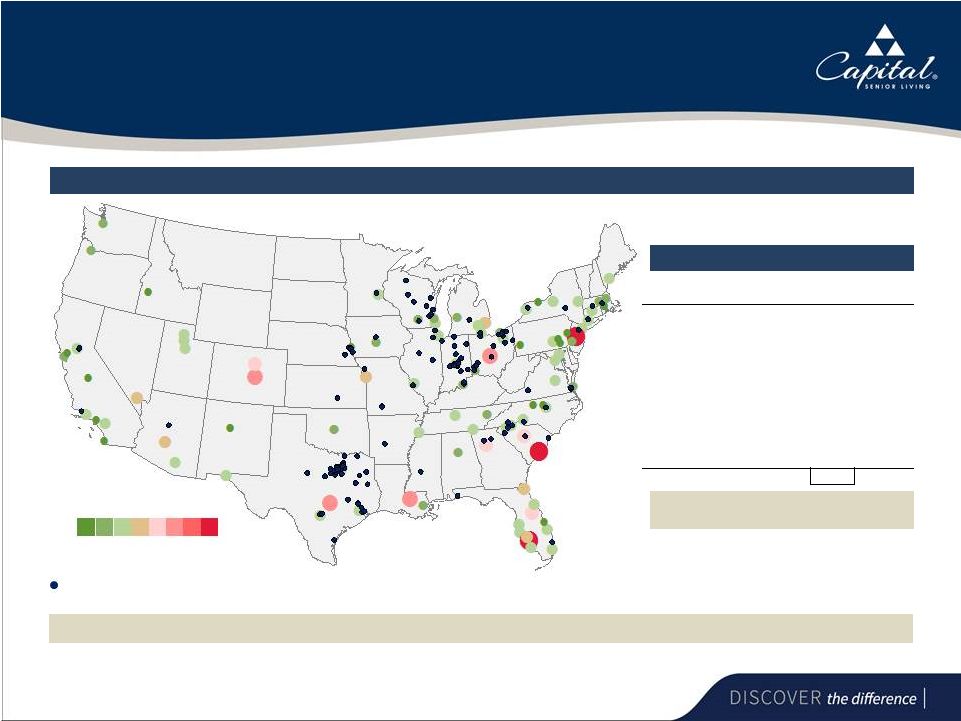 11 CSU Has Limited Exposure to the Top 10 MSAs with the Highest Levels of Construction Source: NIC MAP Data Service data as of 06/30/2017. Senior Housing Construction vs. Inventory Across the U.S. Top 10 Highest Construction in MSAs Total CSU units in top 10 highest construction MSAs (~2% of total CSU units) Over ~98% of CSU units are located outside of the top 10 highest construction MSAs
Capital Senior Living Community
0 – 2% Construction vs. Inventory > 24% Metro Construction vs Inventory CSU Units CSU Occupancy Trenton, NJ 25.7% - - Fort Myers, FL 24.6% - - Charleston, SC 24.3% - - Austin, TX 18.4% - - Colorado Springs, CO 17.4% - - Baton Rouge, LA 16.9% - - Columbus, OH 16.7% 111 97% Columbia, SC 14.6% 118 89% Atlanta, GA 13.3% - - Orlando, FL 12.5% - - 229 |
 12 • Executing a Long-Term, Sustainable Growth Strategy with a Focus on Real Estate Ownership 2 |
 13 Executing a Long-Term, Sustainable Growth Strategy with a Focus on Real Estate Ownership Core Organic Growth Increasing Real Estate Ownership Conversions Accretive Acquisitions |
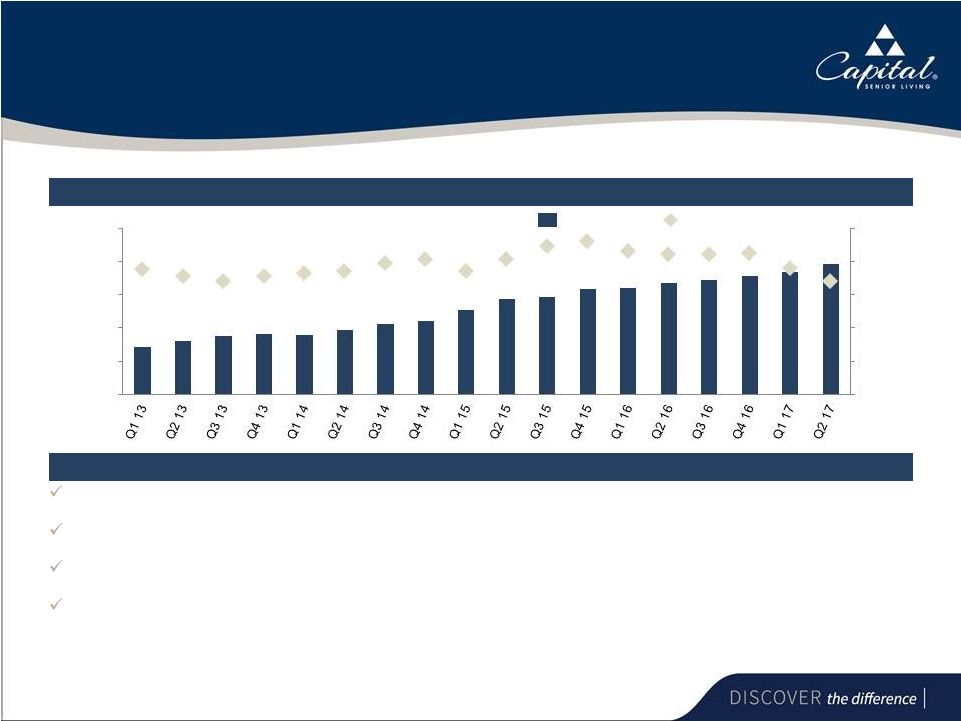 14 Core Organic Growth Driven by Occupancy, Pricing Improvements and Cost Containment Occupancy improvement where opportunity exists Increasing average rents through increasing market and in-house rents and level of care charges
Proactive expense management
Cash flow enhancing renovations and refurbishments
Core Organic Growth Increasing Occupancy and Average Monthly Rent Trends Average Rent Occupancy % 80% 82% 84% 86% 88% 90% $2,800 $3,000 $3,200 $3,400 $3,600 $3,800 |
 15 Laser Focused on Execution - Taking Immediate Action to Drive Sustainable Profitable Growth and Enhance Shareholder Value Executing comprehensive strategy to drive higher revenues, enhance cash flow and maximize value of real estate portfolio Instituting new operating model and realigning sales team to instill greater accountability and drive operational excellence Strengthened team with the recent appointment of Brett Lee as COO Strong record of operational success within healthcare services sector Experience leading operations within highly complex care delivery environments Building more centralized, robust operating platform to improve all facets of community operations to better serve residents Quality Service People Growth Cost 15 |
 16 Moving to Centralized Platform to Improve Community Operations While Serving New Residents Implementing immediate occupancy growth plans and budget recovery goals for each community Leveraging operational scale to optimize supply chain and large expense categories
Revised sales and marketing structure to improve performance
Evaluating opportunities to enhance care in existing communities
Addressing internal structural challenges by implementing:
Regional review and approval of all contract labor/premium pay
Staffing grid to address variation in labor cost through standardization
Expect the continued execution of strategic plan to produce growth in all key metrics for
the remainder of 2017 and beyond |
 17 Upholding Highest Standards of Core Pillars to Improve Resident Experience Continuously focused on improving resident satisfaction by upholding the highest quality standards for each community through standardized processes, protocols and policies We maintain a family-centered culture so all residents feel as if they are part of the Capital Senior Living family The Capital Operating System drives all facets of our community operations Quality Service People Growth Cost 17 |
 18 Strategic Accretive Acquisitions have Achieved 16% Average Cash-On-Cash Returns Year 1 Cash-On-Cash Returns With a strong reputation among sellers, CSU sources the majority of acquisitions off market and at attractive terms, and maintains a
robust pipeline of near-to medium-term targets
Pipeline allows for ~$150mm of highly accretive acquisitions annually over the
near-to medium term Acquisitions financed with attractive fixed rate
non-recourse mortgage loans Weighted average interest rate has
decreased 140bps since 2010 14.1%
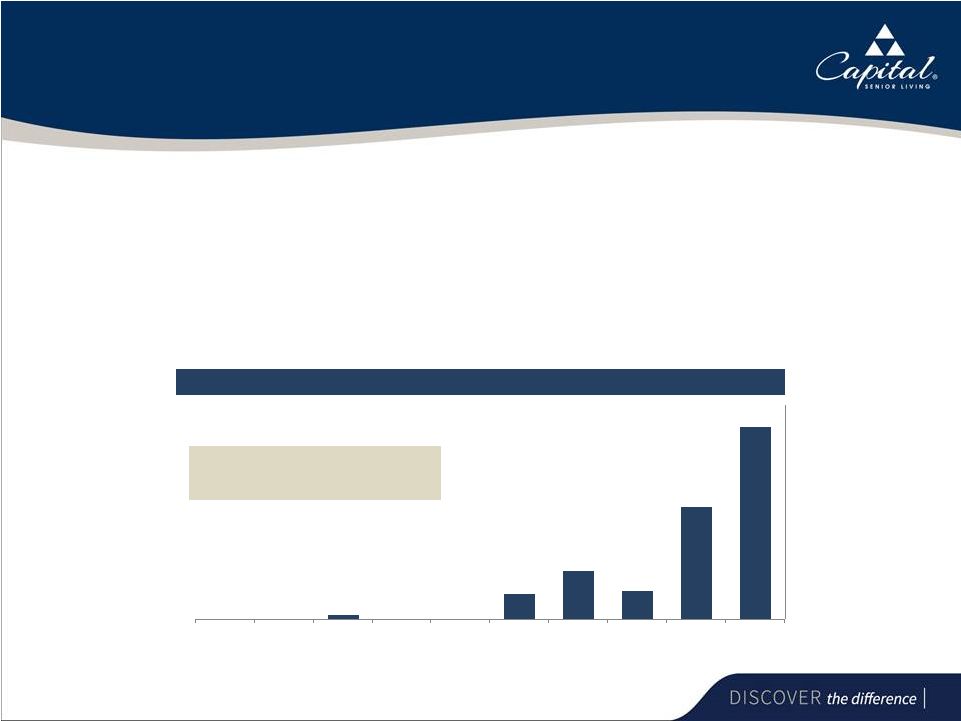
17.6% 15.2% 16.5% 15.1% 15.8% 15.0% 2011 2012 2013 2014 2015 2016 2017 YTD Total Purchase Price ($mm) $ 83.4M $ 181.3 $ 150.4 $ 160.2 $ 162.5 $ 138.4 $ 85.0 Communities 7 17 11 8 9 8 4 Units 551 1,367 881 819 791 723 547 Average Borrowing Rate 5.1% 4.5% 5.4% 4.5% 4.3% 4.3% 4.8%* 10-Year Treasury Range 1.7% - 3.2% 1.4% - 2.4% 1.7% - 3.0% 2.1% - 3.0% 1.7% - 2.5% 1.4% - 2.5% 2.2% - 2.6% * Variable Rate 18 |
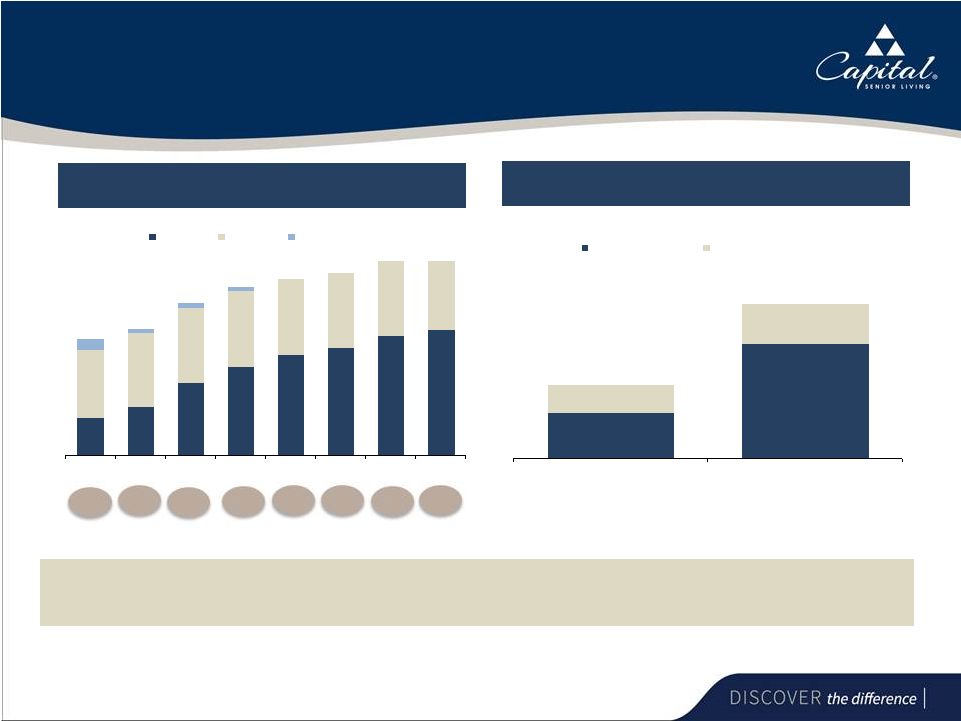 19 Increasing Owned Portfolio Provides Increased Financial Flexibility CSU has achieved on average a 42.0% increase in property value over a 3 year period at communities on which
it has executed supplemental loans in 2015 and 2016, which has provided financial
flexibility through $66.3mm of proceeds for re-deployment to growth
initiatives $87.5
$220.1 $53.4 $75.9 2015 Supplemental Loan Properties 2016 Supplemental Loan Properties Original Value Incremental Value Added $140.9 $296.0 Appreciated Value of Supplemental Loan Properties Appreciated Value of Supplemental Loan Properties 25 32 48 59 67 71 79 83 45 49 50 50 50 50 50 46 7 3 3 3 2010 2011 2012 2013 2014 2015 2016 Current Owned Leased Joint Venture Capital Senior Living’s Ownership History Capital Senior Living’s Ownership History Owned % 38.1% 32.5% 47.5% 52.7% 57.3% 58.7% 61.2% 64.3% |
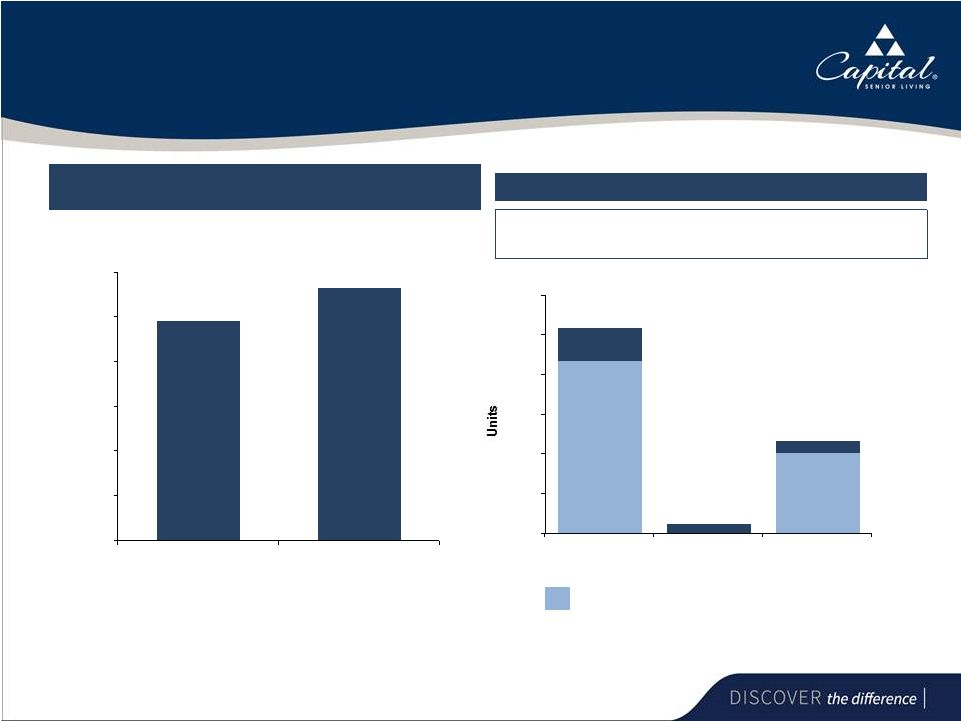 20 Conversions Drive Significant Improvements in Key Financial Metrics Revenue and NOI Growth – 2Q17 vs. 2Q14 (Period prior to Conversions) (1) Expected Completion of Units Out of Service (2) 776 total units were out of service at the beginning of 2017; when stabilized, the total
776 units are expected to contribute approximately $32.0mm of Revenue, $11.0mm of
EBITDAR and $7.5mm of CFFO on an annual basis
Three communities being repositioned or under significant renovation; all
units are out of CSU non-GAAP statistical and financial measures and will
be added back when the communities reach stabilization
(1) Represents the 400 units with conversions completed as of 2Q15. (2) Represents when the units are completed. Actual contributions of Revenue, EBITDAR and CFFO will depend on timing
of lease-up. 24.6% 28.3% 0.0% 5.0% 10.0% 15.0% 20.0% 25.0% 30.0% Revenue Growth NOI Growth 435 0 202 84 24 31 0 100 200 300 400 500 600 Completed 3Q17 4Q17 519 233 249 2 |
 21 Capital Plan Supports Long-Term Growth Initiatives 3 |
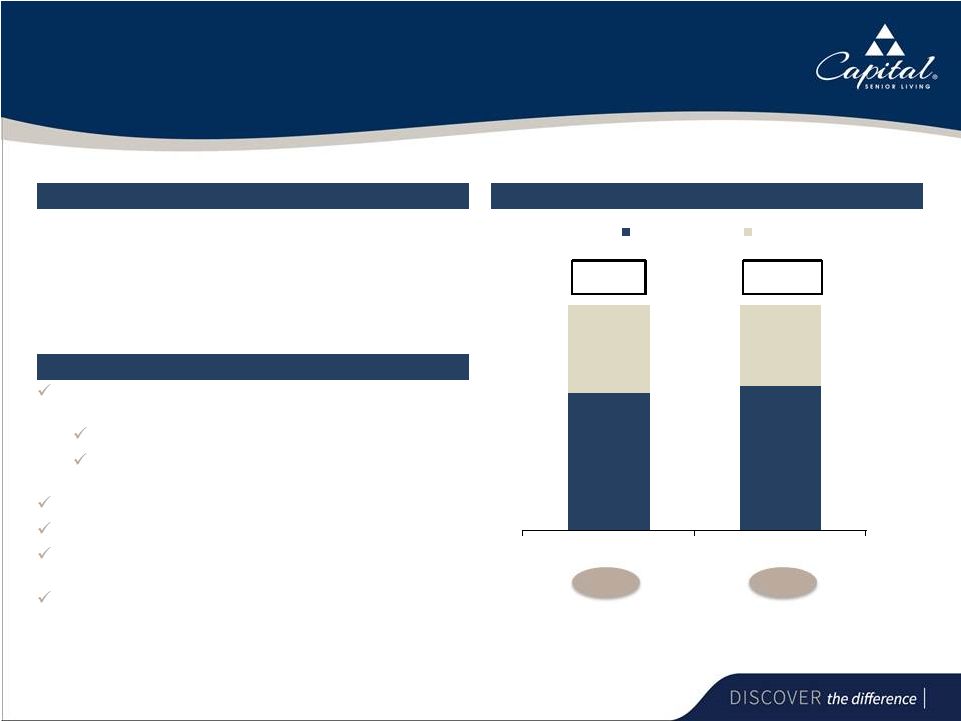 22 79 83 50 46 Prior to Transaction Post Transaction Owned Leased Transaction Overview Overview of the Transaction 1. CSU purchased four previously leased properties in January 2017 • Purchase Price: $85mm • CFFO accretion of $3.0mm in Year 1 Percentage of Owned Real Estate Owned % 129 Total Properties 129 Total Properties Benefits of the Transaction Maximizes cash flow and real estate value by providing valuation support Stronger margin profile Eliminates lease escalators, driving sustainable cash flows Optimizes asset management and financial flexibility Ability to reposition communities Ability to increase loans based on the appreciated value to re-deploy the capital into growth initiatives Increased owned portfolio from 61.2% to 64.3% 61.2% 64.3% |
 23 Track Record of Strong Growth and Uniquely Positioned for Continued Success 4 |
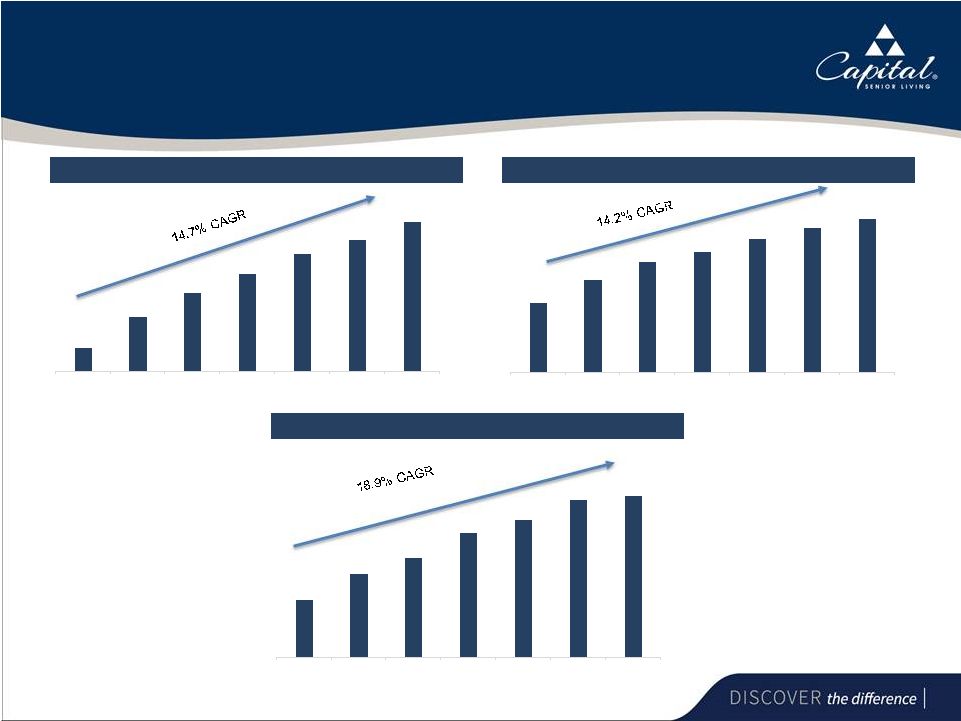 24 $197 $257 $305 $343 $384 $412 $448 2010A 2011A 2012A 2013A 2014A 2015A 2016A $69 $92 $110 $120 $133 $144 $153 2010A 2011A 2012A 2013A 2014A 2015A 2016A $17 $25 $30 $37 $41 $47 $48 2010A 2011A 2012A 2013A 2014A 2015A 2016A Strategy and Execution Have Delivered Strong Growth Revenue (1) Adjusted EBITDAR Adjusted CFFO (2) Note: $ in millions. (1) Excludes community reimbursement revenue and management services revenue. (2) Excludes prepaid resident rent and tax savings related to cost segregation studies in 2012 and 2013.
($ In Millions) ($ In Millions) ($ In Millions) |
 25 Healthy Balance Sheet to Support Future Initiatives Assets Cash and Securities $ 29.6 Other Current Assets 26.0 Total Current Assets 55.6 Fixed Assets 1,111.9 Other Assets 20.3 Total Assets $ 1,187.8 Liabilities & Equity Current Liabilities $ 81.1 Long-Term Debt 939.2 Other Liabilities 76.4 Total Liabilities 1,096.7 Stockholders’ Equity 91.1 Total Liabilities & Equity $ 1,187.8 As of June 30, 2017 (in millions) |
 26 Debt Maturities • CSU has ample financial capacity to pursue all initiatives contemplated under its growth strategy • No near term debt maturities • Acquisitions financed with attractive fixed rate non-recourse mortgage loans $448,669 $262,930 $67,913 $113,956 $59,009 $11,624 $0 $50,000 $100,000 $150,000 $200,000 $250,000 $300,000 $350,000 $400,000 $450,000 $500,000 2025 & After 2024 2023 2022 2021 2020 2019 2018 2017 2016 Average duration of debt is 6.8 years, with approximately 93% of all debt maturing in 2021 and after (In thousands) Ample Financial Capacity to Pursue Growth Initiatives |
 27 Capital Senior Living Investment Rationale Attractively Positioned in the Highly Fragmented Senior Housing Market Executing a Long-Term, Sustainable Growth Strategy with a Focus on Real Estate Ownership Capital Plan Supports Long-Term Growth Initiatives Track Record of Strong Growth and Uniquely Positioned for Continued Success CSU has a clear and differentiated real-estate strategy to drive industry-leading growth
and superior shareholder value
CSU has a clear and differentiated real-estate strategy to drive
industry-leading growth and superior shareholder value
Core Organic Growth Increasing Real Estate Ownership Conversions Accretive Acquisitions 1 2 3 4 |