Attached files
| file | filename |
|---|---|
| EX-32.2 - EX-32.2 - CAPITAL SENIOR LIVING CORP | csu-ex322_8.htm |
| EX-32.1 - EX-32.1 - CAPITAL SENIOR LIVING CORP | csu-ex321_6.htm |
| EX-31.2 - EX-31.2 - CAPITAL SENIOR LIVING CORP | csu-ex312_7.htm |
| EX-31.1 - EX-31.1 - CAPITAL SENIOR LIVING CORP | csu-ex311_9.htm |
| EX-23.1 - EX-23.1 - CAPITAL SENIOR LIVING CORP | csu-ex231_10.htm |
| EX-21.1 - EX-21.1 - CAPITAL SENIOR LIVING CORP | csu-ex211_11.htm |
UNITED STATES
SECURITIES AND EXCHANGE COMMISSION
Washington, D.C. 20549
Form 10-K
(Mark One)
|
☑ |
ANNUAL REPORT PURSUANT TO SECTION 13 OR 15(d) OF THE SECURITIES EXCHANGE ACT OF 1934 |
For the Fiscal Year Ended December 31, 2017
Or
|
☐ |
TRANSITION REPORT PURSUANT TO SECTION 13 OR 15(d) OF THE SECURITIES EXCHANGE ACT OF 1934 |
For the transition period from to
Commission file number: 1-13445

Capital Senior Living Corporation
(Exact name of registrant as specified in its charter)
|
Delaware |
|
75-2678809 |
|
(State or other jurisdiction of incorporation or organization) |
|
(I.R.S. Employer Identification No.) |
|
|
|
|
|
14160 Dallas Parkway, Suite 300 Dallas, Texas |
|
75254 |
|
(Address of principal executive offices) |
|
(Zip Code) |
Registrant’s telephone number, including area code:
(972) 770-5600
Securities registered pursuant to Section 12(b) of the Act:
|
Title of each class |
|
Name of each exchange on which registered |
|
Common Stock, $.01 par value per share |
|
New York Stock Exchange |
Securities registered pursuant to Section 12(g) of the Act:
None
Indicate by a check mark if the registrant is a well-known seasoned issuer, as defined by Rule 405 of the Securities Act. Yes ☐ No ☑
Indicate by a check mark if the registrant is not required to file reports pursuant to Section 13 or Section 15(d) of the Act. Yes ☐ No ☑
Indicate by check mark whether the registrant (1) has filed all reports required to be filed by Section 13 or 15(d) of the Securities Exchange Act of 1934 during the preceding 12 months (or for such shorter period that the registrant was required to file such reports), and (2) has been subject to such filing requirements for the past 90 days. Yes ☑ No ☐
Indicate by check mark whether the registrant has submitted electronically and posted on its corporate Web site, if any, every Interactive Data File required to be submitted and posted pursuant to Rule 405 of Regulation S-T during the preceding 12 months (or for such shorter period that the registrant was required to submit and post such files). Yes ☑ No ☐
Indicate by check mark if disclosure of delinquent filers pursuant to Item 405 of Regulation S-K is not contained herein, and will not be contained, to the best of registrant’s knowledge, in definitive proxy statements incorporated by reference in Part III of this Form 10-K or any amendment to this Form 10-K. ☐
Indicate by check mark whether the registrant is a large accelerated filer, an accelerated filer, a non-accelerated filer, a smaller reporting company, or an emerging growth company. See the definitions of “large accelerated filer,” “accelerated filer,” “smaller reporting company,” and “emerging growth company” in Rule 12b-2 of the Exchange Act.
|
Large accelerated filer |
|
☐ |
|
Accelerated filer |
|
☑ |
|
Non-accelerated filer |
|
☐ (Do not check if a smaller reporting company) |
|
Smaller reporting company |
|
☐ |
|
|
|
|
|
Emerging growth company |
|
☐ |
If an emerging growth company, indicate by check mark if the registrant has elected not to use the extended transition period for complying with any new or revised financial accounting standards provided pursuant to Section 13(a) of the Exchange Act. ☐
Indicate by a check mark whether the registrant is a shell company (as defined in Rule 12b-2 of the Exchange Act). Yes ☐ No ☑
The aggregate market value of the 24,076,010 shares of the Registrant’s common stock, par value $0.01 per share (“Common Stock”), held by non-affiliates (defined to exclude all of the Registrant’s executive officers, directors, and certain significant stockholders) on June 30, 2017, based upon the adjusted closing price of the Registrant’s Common Stock as reported by the New York Stock Exchange on such date was approximately $366.2 million. As of February 23, 2018, the Registrant had 30,500,800 shares of Common Stock outstanding.
DOCUMENTS INCORPORATED BY REFERENCE
Portions of the Registrant’s definitive proxy statement pertaining to its 2018 Annual Meeting of Stockholders and filed or to be filed not later than 120 days after the end of the fiscal year pursuant to Regulation 14A are incorporated herein by reference into Part III of this report.
CAPITAL SENIOR LIVING CORPORATION
TABLE OF CONTENTS
|
|
|
Page |
|
|
|
|
|
Item 1. |
2 |
|
|
Item 1A. |
20 |
|
|
Item 1B. |
27 |
|
|
Item 2. |
27 |
|
|
Item 3. |
27 |
|
|
Item 4. |
27 |
|
|
|
|
|
|
Item 5. |
28 |
|
|
Item 6. |
31 |
|
|
Item 7. |
Management’s Discussion and Analysis of Financial Condition and Results of Operations |
32 |
|
Item 7A. |
48 |
|
|
Item 8. |
48 |
|
|
Item 9. |
Changes in and Disagreements with Accountants on Accounting and Financial Disclosure |
48 |
|
Item 9A. |
49 |
|
|
Item 9B. |
49 |
|
|
|
|
|
|
Item 10. |
50 |
|
|
Item 11. |
50 |
|
|
Item 12. |
Security Ownership of Certain Beneficial Owners and Management and Related Stockholder Matters |
50 |
|
Item 13. |
Certain Relationships and Related Transactions, and Director Independence |
50 |
|
Item 14. |
50 |
|
|
|
|
|
|
Item 15. |
51 |
|
|
54 |
||
|
F-1 |
||
i
Overview
Capital Senior Living Corporation, a Delaware corporation (together with its subsidiaries, the “Company”), is one of the largest operators of senior housing communities in the United States in terms of resident capacity. The Company and its predecessors have provided senior housing since 1990. As of December 31, 2017, the Company operated 129 senior housing communities in 23 states with an aggregate capacity of approximately 16,500 residents, including 83 senior housing communities which the Company owned and 46 senior housing communities the Company leased. During 2017, approximately 94.4% of total revenues for the senior housing communities operated by the Company were derived from private pay sources.
The Company’s operating strategy is to provide value to its senior living residents by providing quality senior living services at reasonable prices, while achieving and sustaining a strong, competitive position within its geographically concentrated regions, as well as continuing to enhance the performance of its operations. The Company provides senior living services to the elderly, including independent living, assisted living, and memory care services. Many of the Company’s communities offer a continuum of care to meet its residents’ needs as they change over time by integrating independent living, assisted living, and memory care, and is bridged by home care through independent home care agencies, sustaining residents’ autonomy and independence based on their physical and mental abilities.
Website
The Company’s Internet website www.capitalsenior.com contains an Investor Relations section, which provides links to the Company’s annual reports on Form 10-K, quarterly reports on Form 10-Q, current reports on Form 8-K, proxy statements, Section 16 filings and any amendments to those reports and filings. These reports and filings are available through the Company’s Internet website free of charge as soon as reasonably practicable after such material is electronically filed with or furnished to the Securities and Exchange Commission (“SEC”).
Industry Background
The senior living industry encompasses a broad and diverse range of living accommodations and supportive services that are provided primarily to persons 75 years of age or older.
For the elderly who require limited services, independent living residences supplemented at times by home health care, offers a viable option. Most independent living communities typically offer community living packaged with basic services consisting of meals, housekeeping, laundry, 24-hour staffing, transportation, social and recreational activities and health care monitoring. Independent living residents typically are not reliant on assistance with activities of daily living (“ADLs”) although some residents may contract out for those services.
As a senior’s need for assistance increases, care in an assisted living residence is often preferable and more cost-effective than home-based care or nursing home care. Typically, assisted living represents a combination of housing and support services designed to aid elderly residents with ADLs such as ambulation, bathing, dressing, eating, grooming, personal hygiene and monitoring or assistance with medications. Certain assisted living residences may also provide assistance to residents with low acuity medical needs, or may offer higher levels of personal assistance for incontinent residents or residents with Alzheimer’s disease or other cognitive or physical frailties. Generally, assisted living residents require higher levels of care than residents of independent living residences and retirement living centers, but require lower levels of care than patients in skilled nursing facilities. For seniors who need the constant attention of a skilled nurse or medical practitioner, a skilled nursing facility may be required.
According to the American Seniors Housing Association, Seniors Housing Construction Monitor – Winter 2018 Report, as of the fourth quarter of fiscal 2017, 21.0% of the age-restricted seniors housing supply in the United States were assisted living units, 22.6% were independent living units, 49.8% were nursing care units, and 6.6% were memory care units.
2
The senior living industry is highly fragmented and characterized by numerous small operators. Moreover, the scope of senior living services varies substantially from one operator to another. Many smaller senior living providers do not operate purpose-built residences, do not have extensive professional training for staff and provide only limited assistance with ADLs. The Company believes that many senior living operators do not provide the required comprehensive range of senior living services designed to permit residents to “age in place” within the community as residents develop further physical or cognitive frailties. The Company believes that as one of the nation’s largest operators it has scale and resources that provide it with certain competitive advantages.
The Company believes that a number of demographic, regulatory and other trends will contribute to the continued growth in the senior living market, including the following:
Consumer Preference
The Company believes that senior housing communities are increasingly becoming the setting preferred by prospective residents and their families for the care of the elderly. Senior living offers residents greater independence and allows them to “age in place” in a residential setting, which the Company believes results in a higher quality of life than that experienced in more institutional or clinical settings.
The likelihood of living alone increases with age. Most of this increase is due to an aging population in which women outlive men. Societal changes, such as high divorce rates and the growing numbers of persons choosing not to marry, have further increased the number of Americans living alone. This growth in the number of elderly living alone has resulted in an increased demand for services that historically have been provided by a spouse, other family members or live-in caregivers.
Demographics
The primary market for the Company’s senior living services is comprised of persons aged 75 and older. This age group is one of the fastest growing segments of the United States population. The older population itself is increasingly older. In 2011, the 75-84 age group in the United States (12.8 million persons) was 16 times larger than in 1900 and the 85 and over age group in the United States (5.7 million persons) was 40 times larger. The 85 and over population in the United States is projected to more than double from 5.7 million persons in 2011 to 14.1 million persons in 2040. As the number of persons aged 75 and older continues to grow, the Company believes that there will be corresponding increases in the number of persons who need assistance with ADLs.
Senior Affluence
The average net worth of senior citizens is typically higher than non-senior citizens, partially as a result of accumulated equity through home ownership. The Company believes that a substantial portion of the senior population has historically accumulated significant resources available for their retirement and long-term care needs. The Company’s target population is comprised of moderate to upper income seniors who have, either directly or indirectly through familial support, the financial resources to pay for senior housing communities, including an assisted living alternative to traditional long-term care.
Reduced Reliance on Family Care
Historically, the family has been the primary provider of care for seniors. The Company believes that the increase in the percentage of women in the work force, the reduction of average family size, and overall increased mobility in society is reducing the role of the family as the traditional caregiver for aging parents. The Company believes that these factors will make it necessary for many seniors to look outside the family for assistance as they age.
3
Restricted Supply of Nursing Beds
Several states in the United States have adopted Certificate of Need (“CON”) or similar statutes generally requiring that, prior to the addition of new skilled nursing beds, the addition of new services, or the making of certain capital expenditures, a state agency must determine that a need exists for the new beds or the proposed activities. The Company believes that this CON process tends to restrict the supply and availability of licensed nursing facility beds. High construction costs, limitations on government reimbursement, and start-up expenses also act to constrain growth in the supply of such facilities. At the same time, nursing facility operators are continuing to focus on improving occupancy and expanding services to sub-acute patients generally of a younger age and requiring significantly higher levels of nursing care. As a result, the Company believes that there has been a decrease in the number of skilled nursing beds available to patients with lower acuity levels and that this trend should increase the demand for the Company’s senior housing communities, including, particularly, the Company’s assisted living communities.
Cost-Containment Pressures
In response to rapidly rising health care costs, governmental and private pay sources have adopted cost containment measures that have reduced admissions and encouraged reduced lengths of stays in hospitals and other acute care settings. Private insurers have begun to limit reimbursement for medical services in general to predetermined charges, and managed care organizations (such as health maintenance organizations) are attempting to limit hospitalization costs by negotiating for discounted rates for hospital and acute care services and by monitoring and reducing hospital use. In response, hospitals are discharging patients earlier and referring elderly patients, who may be too sick or frail to manage their lives without assistance, to nursing homes and assisted living residences where the cost of providing care is typically lower than hospital care. In addition, third-party payors are increasingly becoming involved in determining the appropriate health care settings for their insureds or clients, based primarily on cost and quality of care. Based on industry data, the typical day-rate in an assisted living facility is one-fourth of the cost for comparable care in a nursing home and two-thirds of the cost of living at home with a third party home health care provider.
Operating Strategy
The Company’s operating strategy is to provide value to its senior living residents by providing quality senior living services at reasonable prices, while achieving and sustaining a strong, competitive position within its geographically concentrated regions, as well as continuing to enhance the performance of its operations. The Company is implementing its operating strategy principally through the following methods:
Provide a Broad Range of Quality Personalized Care
Central to the Company’s operating strategy is its focus on providing quality care and services that are personalized and tailored to meet the individual needs of each community resident. The Company’s residences and services are designed to provide a broad range of care that permits residents to thrive and “age in place” as their needs change and as they develop further physical or cognitive frailties. By creating an environment that maximizes resident autonomy and provides individualized service programs, the Company seeks to attract seniors at an earlier stage, before they need the higher level of care provided in a skilled nursing facility. The Company also maintains a comprehensive quality assurance program designed to ensure the satisfaction of its residents and their family members. The Company conducts annual resident satisfaction surveys that allow residents at each community to express whether they are “very satisfied,” “satisfied” or “dissatisfied” with all major areas of a community, including, housekeeping, maintenance, activities and transportation, food service, security and management. In each of fiscal 2017 and 2016, the Company achieved 94.6% overall approval ratings from the residents’ satisfaction surveys. In addition, the Company ranked third among senior living operators nationally in 2018 according to J.D. Powers 2018 Senior Living Satisfaction Study. The study measured resident and family overall satisfaction across factors important to them including community staff, convenience of location, food and beverage, room, building and grounds, senior service and activities among others.
4
Offer Services Across a Range of Pricing Options
The Company’s range of products and services is continually expanding to meet the evolving needs of its residents. The Company has developed a menu of products and service programs that may be further customized to serve both the moderate and upper income markets of a particular targeted geographic area. By offering a range of pricing options that are customized for each target market, the Company believes that it can develop synergies, economies of scale and operating efficiencies in its efforts to serve a larger percentage of the elderly population within a particular geographic market.
Improve Occupancy Rates
The Company continually seeks to maintain and improve occupancy rates by: (i) retaining residents as they “age in place” by extending optional care and service programs and converting existing units to higher levels of care; (ii) attracting new residents through the use of technology to enhance Internet marketing and on-site marketing programs focused on residents and family members; (iii) selecting communities in underserved markets; (iv) aggressively seeking referrals from senior care referral services, professional community outreach sources, including area religious organizations, senior social service programs, civic and business networks, as well as the medical community; and (v) continually refurbishing and renovating its communities.
Improve Operating Efficiencies
The Company seeks to improve operating efficiencies at its communities by actively monitoring and managing operating costs and by moving to a more centralized operating platform. By having an established portfolio of communities in geographically concentrated regions throughout the United States with regional management in place, the Company believes it has established a platform to achieve operating efficiencies through economies of scale in the purchase of bulk items, such as food and supplies, and in the spreading of fixed costs, such as corporate overhead, over a larger revenue base, and to provide more effective management supervision and financial controls. The Company’s growth strategy includes acquiring additional communities within our geographically concentrated regions to achieve further efficiencies.
Emphasize Employee Training and Retention
The Company devotes special attention to the hiring, screening, training, supervising and retention of its employees and caregivers to ensure that quality standards are achieved. In addition to normal on-site training, the Company conducts national management meetings and encourages sharing of expertise among managers. The Company has also implemented a comprehensive online training program that addresses the specific challenges of working within the senior living environment. The Company’s commitment to the total quality management concept is emphasized throughout its training programs. This commitment to the total quality management concept means identification of the “best practices” in the senior living market and communication of those “best practices” to the Company’s executive directors and their staff. The identification of best practices is realized by a number of means, including: emphasis on regional and executive directors keeping up with professional trade publications; interaction with other professionals and consultants in the senior living industry through seminars, conferences and consultations; visits to other properties; leadership and participation at national and local trade organization events; and information derived from marketing studies and resident satisfaction surveys. This information is continually processed by regional managers and the executive directors and communicated to the Company’s employees as part of their training. The Company hires an executive director for each of its communities and provides them with autonomy, responsibility and accountability. The Company’s staffing of each community with an executive director allows it to hire more professional employees at these positions, while the Company’s developed career path helps it to retain the professionals it hires. The Company believes its commitment to and emphasis on employee training and retention differentiates the Company from many of its competitors.
5
The Company provides senior living services to the elderly, including independent living, assisted living, and memory care services. By offering a variety of services and encouraging the active participation of the resident and the resident’s family and medical consultants, the Company is able to customize its service plan to meet the specific needs and desires of each resident. Additionally, the Company is actively working to expand service offerings through conversions of existing units to higher levels of care. As a result, the Company believes that it is able to maximize customer satisfaction and avoid the high cost of delivering unnecessary services to residents.
The Company’s operating philosophy is to provide quality senior housing communities and services to senior citizens and deliver a continuum of care for its residents as their needs change over time coordinated with third party post-acute care providers. This continuum of care, which integrates independent living, assisted living, and memory care services and is bridged by home care, sustains residents’ autonomy and independence based on their physical and mental abilities. As residents age, in many of the Company’s communities, they are able to obtain the additional services they need within the same community, avoiding the disruptive and often traumatic move to a different facility.
Independent Living Services
The Company provides independent living services to seniors who typically do not yet need assistance or support with ADLs, but who prefer the physical and psychological comfort of a residential community that offers health care and other services. As of December 31, 2017, the Company owned 40 communities and leased 15 communities that provide independent living services, which include communities that combine assisted living and other services, with an aggregate capacity for approximately 6,900 residents.
Independent living services provided by the Company include daily meals, transportation, social and recreational activities, laundry, housekeeping and 24-hour staffing. The Company also fosters the wellness of its residents by offering access to health screenings (such as blood pressure checks), periodic special services (such as influenza inoculations), dietary and similar programs, as well as ongoing exercise and fitness classes. Classes are given by health care professionals to keep residents informed about health and disease management. Subject to applicable government regulation, personal care and medical services are available to independent living residents through either the community staff or through the Company’s agency or other independent home care agencies. The Company’s independent living residents pay an average fee of $2,800 per month, in general, depending on the specific community, program of services, size of the unit and amenities offered. The Company’s contracts with its independent living residents are generally for a term of one year and are typically terminable by either party, under certain circumstances, upon providing 30 days’ notice unless state law stipulates otherwise.
Assisted Living Services
The Company offers a wide range of assisted living care and services, including personal care services, 24-hour staffing, support services, and supplemental services. As of December 31, 2017, the Company owned 67 communities and leased 40 communities that provide assisted living services, which include communities that combine independent living and other services, with an aggregate capacity for approximately 9,600 residents. The residents of the Company’s assisted living residences generally need help with some or all ADLs, but do not require the more acute medical care traditionally given in nursing homes. Upon admission to the Company’s assisted living communities, and in consultation with the resident, the resident’s family and medical consultants, each resident is assessed to determine his or her health status, including functional abilities and need for personal care services. The resident also completes a lifestyles assessment to determine the resident’s preferences. From these assessments, a care plan is developed for each resident to ensure that all staff members who render care meet the specific needs and preferences of each resident where possible. Each resident’s care plan is reviewed periodically to determine whether a change in care is needed.
6
The Company has adopted a philosophy of assisted living care that allows a resident to maintain a dignified independent lifestyle. Residents and their families are encouraged to be partners in the residents’ care and to take as much responsibility for their well-being as possible. The basic types of assisted living services offered by the Company include the following:
Personal Care Services. These services include assistance with ADLs such as ambulation, bathing, dressing, eating, grooming, personal hygiene, and monitoring or assistance with medications.
Support Services. These services include meals, assistance with social and recreational activities, laundry services, general housekeeping, maintenance services and transportation services.
Supplemental Services. These services include extra transportation services, personal maintenance, extra laundry services, and special care services, such as services for residents with certain forms of dementia. Certain of these services require extra charges.
The Company’s assisted living residents pay an average fee of $4,000 per month, in general, depending on the specific community, the level of personal care services, support service and supplemental services provided to the resident, size of the unit and amenities offered. The Company’s contracts with its assisted living residents are generally for a term of one year and are typically terminable by either party, under certain circumstances, upon providing 30 days’ notice unless state law stipulates otherwise.
Memory Care Services
The Company maintains programs and special units at some of its communities for residents with certain forms of dementia, which provide the attention, care and services needed to help those residents maintain a higher quality of life. Specialized services include assistance with ADLs, behavior management and life skills-based activities programs, the goal of which is to provide a normalized environment that supports residents’ remaining functional abilities. Special units for residents with certain forms of dementia are located in a separate area of the community and have their own dining facilities, resident lounge areas, and specially trained staff. The special care areas are designed to allow residents the freedom to ambulate as they wish, while keeping them safely contained within a secure area with a minimum of disruption to other residents. Resident fees for these special units are dependent on the size of the unit, the design type and the level of services provided.
The Company’s memory care residents pay an average fee of $5,200 per month, in general, depending on the specific community, the level of personal care services, support service and supplemental services provided to the resident, size of the unit and amenities offered. The Company’s contracts with its memory care residents are generally for a term of one year and are typically terminable by either party, under certain circumstances, upon providing 30 days’ notice unless state law stipulates otherwise.
Home Care Services
As of December 31, 2017, the Company made home care services available to clients at a majority of its senior housing communities through third-party providers. The Company believes that the provision of private pay, home care services is an attractive adjunct to its independent living services because it allows the Company to make available more services to its residents as they age in place and increases the length of stay in the Company’s communities. In addition, the Company makes available to residents certain customized physician, dentistry, podiatry and other health-related rehabilitation and therapy services that may be offered by third-party providers.
7
The table below sets forth certain information with respect to senior housing communities operated by the Company as of December 31, 2017.
|
|
|
|
|
|
|
|
Resident Capacity1 |
|
|
|
|
|
|
Commencement |
|||||||||
|
Community |
Location |
|
Units |
|
|
IL |
|
|
AL |
|
|
Total |
|
|
Ownership |
|
|
of Operations2 |
|||||
|
Owned: |
|
|
|
|
|
|
|
|
|
|
|
|
|
|
|
|
|
|
|
|
|
|
|
|
Aspen Grove |
Lamberville, MI |
|
|
78 |
|
|
|
— |
|
|
|
83 |
|
|
|
83 |
|
|
|
100 |
% |
|
03/14 |
|
Autumn Glen |
Greencastle, IN |
|
|
49 |
|
|
|
— |
|
|
|
64 |
|
|
|
64 |
|
|
|
100 |
% |
|
06/13 |
|
Brookview Meadows |
Green Bay, WI |
|
|
78 |
|
|
|
— |
|
|
|
156 |
|
|
|
156 |
|
|
|
100 |
% |
|
01/15 |
|
Canton Regency |
Canton, OH |
|
|
239 |
|
|
|
162 |
|
|
|
145 |
|
|
|
307 |
|
|
|
100 |
% |
|
03/91 |
|
Chateau of Batesville |
Batesville, IN |
|
|
41 |
|
|
|
— |
|
|
|
43 |
|
|
|
43 |
|
|
|
100 |
% |
|
10/12 |
|
Cottonwood Village |
Cottonwood, AZ |
|
|
163 |
|
|
|
131 |
|
|
|
58 |
|
|
|
189 |
|
|
|
100 |
% |
|
03/91 |
|
Country Charm |
Greenwood, IN |
|
|
89 |
|
|
|
— |
|
|
|
166 |
|
|
|
166 |
|
|
|
100 |
% |
|
10/12 |
|
Courtyards at Lake Granbury |
Granbury, TX |
|
|
81 |
|
|
|
— |
|
|
|
112 |
|
|
|
112 |
|
|
|
100 |
% |
|
03/12 |
|
Georgetowne Place |
Fort Wayne, IN |
|
|
159 |
|
|
|
242 |
|
|
|
0 |
|
|
|
242 |
|
|
|
100 |
% |
|
10/05 |
|
Good Tree Retirement and Memories |
Stephenville, TX |
|
|
60 |
|
|
|
20 |
|
|
|
75 |
|
|
|
95 |
|
|
|
100 |
% |
|
03/12 |
|
Gramercy Hill |
Lincoln, NE |
|
|
143 |
|
|
|
34 |
|
|
|
113 |
|
|
|
147 |
|
|
|
100 |
% |
|
10/98 |
|
Greenbriar Village |
Indianapolis, IN |
|
|
124 |
|
|
|
— |
|
|
|
134 |
|
|
|
134 |
|
|
|
100 |
% |
|
08/15 |
|
Harbor Court |
Rocky River, OH |
|
|
122 |
|
|
|
— |
|
|
|
144 |
|
|
|
144 |
|
|
|
100 |
% |
|
12/12 |
|
Harrison at Eagle Valley |
Indianapolis, IN |
|
|
104 |
|
|
|
138 |
|
|
|
0 |
|
|
|
138 |
|
|
|
100 |
% |
|
03/91 |
|
Heritage at the Plains at Parish Homestead |
Oneonta, NY |
|
|
108 |
|
|
|
97 |
|
|
|
53 |
|
|
|
150 |
|
|
|
100 |
% |
|
05/15 |
|
Independence Village of Peoria |
Peoria, IL |
|
|
158 |
|
|
|
158 |
|
|
|
— |
|
|
|
158 |
|
|
|
100 |
% |
|
08/00 |
|
Keystone Woods Assisted Living |
Anderson, IN |
|
|
58 |
|
|
|
— |
|
|
|
70 |
|
|
|
70 |
|
|
|
100 |
% |
|
07/11 |
|
Laurel Hurst Laurel Woods |
Columbus, NC |
|
|
102 |
|
|
|
70 |
|
|
|
60 |
|
|
|
130 |
|
|
|
100 |
% |
|
10/11 |
|
Marquis Place of Elkhorn |
Elkhorn, NE |
|
|
65 |
|
|
|
— |
|
|
|
69 |
|
|
|
69 |
|
|
|
100 |
% |
|
03/13 |
|
Middletown |
Middletown, OH |
|
|
61 |
|
|
|
— |
|
|
|
75 |
|
|
|
75 |
|
|
|
100 |
% |
|
09/13 |
|
Montclair |
Springfield, MO |
|
|
156 |
|
|
|
178 |
|
|
|
— |
|
|
|
178 |
|
|
|
100 |
% |
|
12/12 |
|
North Pointe |
Anderson, SC |
|
|
64 |
|
|
|
— |
|
|
|
70 |
|
|
|
70 |
|
|
|
100 |
% |
|
10/11 |
|
Park-Oak Grove |
Roanoke, VA |
|
|
93 |
|
|
|
— |
|
|
|
164 |
|
|
|
164 |
|
|
|
100 |
% |
|
08/14 |
|
River Crossing Assisted Living |
Charlestown, IN |
|
|
100 |
|
|
|
— |
|
|
|
106 |
|
|
|
106 |
|
|
|
100 |
% |
|
12/13 |
|
Riverbend Independent and Assisted Living |
Jeffersonville, IN |
|
|
97 |
|
|
|
— |
|
|
|
114 |
|
|
|
114 |
|
|
|
100 |
% |
|
03/12 |
|
Remington at Valley Ranch |
Irving, TX |
|
|
127 |
|
|
|
158 |
|
|
|
— |
|
|
|
158 |
|
|
|
100 |
% |
|
04/12 |
|
Residence of Chardon |
Chardon, OH |
|
|
42 |
|
|
|
— |
|
|
|
52 |
|
|
|
52 |
|
|
|
100 |
% |
|
10/12 |
|
Rose Arbor |
Maple Grove, MN |
|
|
146 |
|
|
|
86 |
|
|
|
87 |
|
|
|
173 |
|
|
|
100 |
% |
|
06/06 |
|
Rosemont Assisted Living and Memory Care |
Humble, TX |
|
|
96 |
|
|
|
— |
|
|
|
120 |
|
|
|
120 |
|
|
|
100 |
% |
|
09/16 |
|
Sugar Grove |
Plainfield, IN |
|
|
164 |
|
|
|
48 |
|
|
|
116 |
|
|
|
164 |
|
|
|
100 |
% |
|
12/13 |
|
Summit Place |
Anderson, SC |
|
|
80 |
|
|
|
19 |
|
|
|
89 |
|
|
|
108 |
|
|
|
100 |
% |
|
10/11 |
|
Summit Point Living |
Macedonia, OH |
|
|
163 |
|
|
|
126 |
|
|
|
98 |
|
|
|
224 |
|
|
|
100 |
% |
|
08/11 |
|
Towne Centre Retirement Community |
Merrillville, IN |
|
|
210 |
|
|
|
163 |
|
|
|
75 |
|
|
|
238 |
|
|
|
100 |
% |
|
03/91 |
|
Vintage Gardens |
St. Joseph, MO |
|
|
95 |
|
|
|
44 |
|
|
|
92 |
|
|
|
136 |
|
|
|
100 |
% |
|
05/13 |
|
Waterford at Baytown |
Baytown, TX |
|
|
129 |
|
|
|
18 |
|
|
|
132 |
|
|
|
150 |
|
|
|
100 |
% |
|
03/15 |
|
Waterford at Bridle Brook |
Mahomet, IL |
|
|
78 |
|
|
|
— |
|
|
|
120 |
|
|
|
120 |
|
|
|
100 |
% |
|
09/15 |
|
Waterford at Carpenter’s Creek |
Pensacola, FL |
|
|
94 |
|
|
|
— |
|
|
|
105 |
|
|
|
105 |
|
|
|
100 |
% |
|
02/16 |
|
Waterford at Colby |
Colby, TX |
|
|
44 |
|
|
|
— |
|
|
|
48 |
|
|
|
48 |
|
|
|
100 |
% |
|
01/16 |
|
Waterford at College Station |
College Station, TX |
|
|
53 |
|
|
|
— |
|
|
|
87 |
|
|
|
87 |
|
|
|
100 |
% |
|
03/12 |
|
Waterford at Columbia |
Columbia, SC |
|
|
117 |
|
|
|
141 |
|
|
|
— |
|
|
|
141 |
|
|
|
100 |
% |
|
11/00 |
|
Waterford at Corpus Christi |
Corpus Christi, TX |
|
|
50 |
|
|
|
— |
|
|
|
56 |
|
|
|
56 |
|
|
|
100 |
% |
|
10/12 |
|
Waterford at Creekside |
Pensacola, FL |
|
|
84 |
|
|
|
— |
|
|
|
98 |
|
|
|
98 |
|
|
|
100 |
% |
|
02/16 |
|
Waterford at Deer Park |
Deer Park, TX |
|
|
119 |
|
|
|
144 |
|
|
|
— |
|
|
|
144 |
|
|
|
100 |
% |
|
11/00 |
|
Waterford at Dillon Pointe |
Spartanburg, SC |
|
|
51 |
|
|
|
— |
|
|
|
55 |
|
|
|
55 |
|
|
|
100 |
% |
|
12/13 |
|
Waterford at Edison Lakes |
South Bend, IN |
|
|
116 |
|
|
|
— |
|
|
|
138 |
|
|
|
138 |
|
|
|
100 |
% |
|
12/00 |
|
Waterford at Fairfield |
Fairfield, OH |
|
|
120 |
|
|
|
140 |
|
|
|
— |
|
|
|
140 |
|
|
|
100 |
% |
|
11/00 |
|
Waterford at Fitchburg |
Fitchburg, WI |
|
|
82 |
|
|
|
— |
|
|
|
150 |
|
|
|
150 |
|
|
|
100 |
% |
|
10/13 |
|
Waterford at Fort Worth |
Fort Worth, TX |
|
|
154 |
|
|
|
177 |
|
|
|
— |
|
|
|
177 |
|
|
|
100 |
% |
|
06/00 |
|
Waterford at Hartford |
Hartford, WI |
|
|
39 |
|
|
|
— |
|
|
|
53 |
|
|
|
53 |
|
|
|
100 |
% |
|
05/15 |
|
Waterford at Hidden Lake |
Canton, GA |
|
|
43 |
|
|
|
— |
|
|
|
98 |
|
|
|
98 |
|
|
|
100 |
% |
|
12/14 |
|
Waterford at Highland Colony |
Jackson, MS |
|
|
119 |
|
|
|
143 |
|
|
|
— |
|
|
|
143 |
|
|
|
100 |
% |
|
11/00 |
|
Waterford at Ironbridge |
Springfield, MO |
|
|
118 |
|
|
|
142 |
|
|
|
— |
|
|
|
142 |
|
|
|
100 |
% |
|
06/01 |
|
Waterford at Levis Commons |
Toledo, OH |
|
|
146 |
|
|
|
163 |
|
|
|
44 |
|
|
|
207 |
|
|
|
100 |
% |
|
04/09 |
8
|
|
|
|
|
|
|
|
Resident Capacity1 |
|
|
|
|
|
|
Commencement |
|||||||||
|
Community |
Location |
|
Units |
|
|
IL |
|
|
AL |
|
|
Total |
|
|
Ownership |
|
|
of Operations2 |
|||||
|
Mansfield, OH |
|
|
118 |
|
|
|
97 |
|
|
|
45 |
|
|
|
142 |
|
|
|
100 |
% |
|
10/00 |
|
|
Waterford at Mesquite |
Mesquite, TX |
|
|
153 |
|
|
|
176 |
|
|
|
— |
|
|
|
176 |
|
|
|
100 |
% |
|
09/99 |
|
Waterford at Oakwood |
Oakwood, GA |
|
|
64 |
|
|
|
— |
|
|
|
70 |
|
|
|
70 |
|
|
|
100 |
% |
|
09/13 |
|
Waterford at Oshkosh |
Oshkosh, WI |
|
|
91 |
|
|
|
— |
|
|
|
109 |
|
|
|
109 |
|
|
|
100 |
% |
|
08/14 |
|
Waterford at Pantego |
Pantego, TX |
|
|
118 |
|
|
|
143 |
|
|
|
— |
|
|
|
143 |
|
|
|
100 |
% |
|
12/00 |
|
Waterford at Park Falls |
Park Falls, WI |
|
|
36 |
|
|
|
— |
|
|
|
36 |
|
|
|
36 |
|
|
|
100 |
% |
|
01/16 |
|
Waterford at Plano |
Plano, TX |
|
|
135 |
|
|
|
109 |
|
|
|
57 |
|
|
|
166 |
|
|
|
100 |
% |
|
12/00 |
|
Waterford at Plymouth |
Plymouth, WI |
|
|
69 |
|
|
|
— |
|
|
|
82 |
|
|
|
82 |
|
|
|
100 |
% |
|
08/14 |
|
Waterford at Richmond Heights |
Richmond Heights, OH |
|
|
148 |
|
|
|
117 |
|
|
|
110 |
|
|
|
227 |
|
|
|
100 |
% |
|
04/09 |
|
Waterford at Thousand Oaks |
San Antonio, TX |
|
|
119 |
|
|
|
135 |
|
|
|
— |
|
|
|
135 |
|
|
|
100 |
% |
|
05/00 |
|
Waterford at Virginia Beach |
Virginia Beach, VA |
|
|
111 |
|
|
|
— |
|
|
|
138 |
|
|
|
138 |
|
|
|
100 |
% |
|
10/15 |
|
Waterford at West Bend |
West Bend, WI |
|
|
40 |
|
|
|
— |
|
|
|
41 |
|
|
|
41 |
|
|
|
100 |
% |
|
05/15 |
|
Waterford at Wisconsin Rapids |
Wisconsin Rapids, WI |
|
|
58 |
|
|
|
— |
|
|
|
66 |
|
|
|
66 |
|
|
|
100 |
% |
|
01/16 |
|
Waterford on Cooper |
Arlington, TX |
|
|
105 |
|
|
|
— |
|
|
|
151 |
|
|
|
151 |
|
|
|
100 |
% |
|
03/12 |
|
Waterford on Huebner |
San Antonio, TX |
|
|
119 |
|
|
|
135 |
|
|
|
— |
|
|
|
135 |
|
|
|
100 |
% |
|
04/99 |
|
Wellington at Arapaho |
Richardson, TX |
|
|
140 |
|
|
|
113 |
|
|
|
57 |
|
|
|
170 |
|
|
|
100 |
% |
|
05/02 |
|
Wellington at Conroe |
Conroe, TX |
|
|
44 |
|
|
|
25 |
|
|
|
35 |
|
|
|
60 |
|
|
|
100 |
% |
|
03/12 |
|
Wellington at Dayton |
Dayton, OH |
|
|
149 |
|
|
|
146 |
|
|
|
94 |
|
|
|
240 |
|
|
|
100 |
% |
|
08/08 |
|
Wellington at Kokomo |
Kokomo, IN |
|
|
96 |
|
|
|
— |
|
|
|
138 |
|
|
|
138 |
|
|
|
100 |
% |
|
07/11 |
|
Wellington at North Bend Crossing |
Cincinnati, OH |
|
|
122 |
|
|
|
54 |
|
|
|
146 |
|
|
|
200 |
|
|
|
100 |
% |
|
11/16 |
|
Wellington at North Richland Hills |
North Richland Hills, TX |
|
|
118 |
|
|
|
139 |
|
|
|
— |
|
|
|
139 |
|
|
|
100 |
% |
|
01/02 |
|
Wellington at Southport |
Indianapolis, IN |
|
|
64 |
|
|
|
— |
|
|
|
105 |
|
|
|
105 |
|
|
|
100 |
% |
|
10/12 |
|
Wellington at Springfield |
Springfield, MA |
|
|
235 |
|
|
|
119 |
|
|
|
117 |
|
|
|
236 |
|
|
|
100 |
% |
|
09/16 |
|
Whispering Pines Village |
Columbiana, OH |
|
|
68 |
|
|
|
24 |
|
|
|
88 |
|
|
|
112 |
|
|
|
100 |
% |
|
07/15 |
|
Whitcomb House |
Milford, MA |
|
|
87 |
|
|
|
— |
|
|
|
87 |
|
|
|
87 |
|
|
|
100 |
% |
|
10/13 |
|
Woodlands of Columbus |
Columbus, OH |
|
|
116 |
|
|
|
— |
|
|
|
117 |
|
|
|
117 |
|
|
|
100 |
% |
|
10/12 |
|
Woodlands of Hamilton |
Hamilton, OH |
|
|
77 |
|
|
|
— |
|
|
|
100 |
|
|
|
100 |
|
|
|
100 |
% |
|
10/12 |
|
Woodlands of Shaker Heights |
Shaker Heights, OH |
|
|
66 |
|
|
|
— |
|
|
|
85 |
|
|
|
85 |
|
|
|
100 |
% |
|
10/12 |
|
Woodview Assisted Living |
Fort Wayne, IN |
|
|
88 |
|
|
|
— |
|
|
|
153 |
|
|
|
153 |
|
|
|
100 |
% |
|
12/13 |
|
Wynnfield Crossing Assisted Living |
Rochester, IN |
|
|
50 |
|
|
|
— |
|
|
|
79 |
|
|
|
79 |
|
|
|
100 |
% |
|
07/11 |
|
|
|
|
|
8,475 |
|
|
|
4,474 |
|
|
|
6,293 |
|
|
|
10,767 |
|
|
|
|
|
|
|
|
Leased: |
|
|
|
|
|
|
|
|
|
|
|
|
|
|
|
|
|
|
|
|
|
|
|
|
Ventas: |
|
|
|
|
|
|
|
|
|
|
|
|
|
|
|
|
|
|
|
|
|
|
|
|
Amberleigh |
Buffalo, NY |
|
|
267 |
|
|
|
387 |
|
|
|
66 |
|
|
|
453 |
|
|
N/A |
|
|
01/92 |
|
|
Crown Pointe |
Omaha, NE |
|
|
136 |
|
|
|
85 |
|
|
|
80 |
|
|
|
165 |
|
|
N/A |
|
|
08/00 |
|
|
Independence Village of East Lansing |
East Lansing, MI |
|
|
146 |
|
|
|
161 |
|
|
|
— |
|
|
|
161 |
|
|
N/A |
|
|
08/00 |
|
|
Independence Village of Olde Raleigh |
Raleigh, NC |
|
|
167 |
|
|
|
177 |
|
|
|
— |
|
|
|
177 |
|
|
N/A |
|
|
08/00 |
|
|
Villa Santa Barbara |
Santa Barbara, CA |
|
|
125 |
|
|
|
64 |
|
|
|
62 |
|
|
|
126 |
|
|
N/A |
|
|
08/00 |
|
|
West Shores |
Hot Springs, AR |
|
|
137 |
|
|
|
131 |
|
|
|
42 |
|
|
|
173 |
|
|
N/A |
|
|
08/00 |
|
|
Whitley Place |
Keller, TX |
|
|
47 |
|
|
|
— |
|
|
|
65 |
|
|
|
65 |
|
|
N/A |
|
|
02/08 |
|
|
HCN: |
|
|
|
|
|
|
|
|
|
|
|
|
|
|
|
|
|
|
|
|
|
|
|
|
Azalea Trails Assisted Living |
Tyler, TX |
|
|
56 |
|
|
|
— |
|
|
|
70 |
|
|
|
70 |
|
|
N/A |
|
|
09/10 |
|
|
Buffalo Creek Assisted Living |
Waxahachie, TX |
|
|
56 |
|
|
|
— |
|
|
|
70 |
|
|
|
70 |
|
|
N/A |
|
|
09/10 |
|
|
Dogwood Trails Assisted Living |
Palestine, TX |
|
|
65 |
|
|
|
— |
|
|
|
75 |
|
|
|
75 |
|
|
N/A |
|
|
09/10 |
|
|
Hawkins Creek Assisted Living |
Longview, TX |
|
|
56 |
|
|
|
— |
|
|
|
70 |
|
|
|
70 |
|
|
N/A |
|
|
09/10 |
|
|
Hearth at Prestwick |
Avon, IN |
|
|
132 |
|
|
|
— |
|
|
|
150 |
|
|
|
150 |
|
|
N/A |
|
|
08/06 |
|
|
Hearth at Windermere |
Fishers, IN |
|
|
128 |
|
|
|
— |
|
|
|
150 |
|
|
|
150 |
|
|
N/A |
|
|
08/06 |
|
|
Heritage Oaks Assisted Living |
Conroe, TX |
|
|
75 |
|
|
|
— |
|
|
|
90 |
|
|
|
90 |
|
|
N/A |
|
|
09/10 |
|
|
Keepsake Village of Columbus |
Columbus, IN |
|
|
42 |
|
|
|
— |
|
|
|
48 |
|
|
|
48 |
|
|
N/A |
|
|
08/06 |
|
|
Magnolia Court Assisted Living |
Nacogdoches, TX |
|
|
56 |
|
|
|
— |
|
|
|
70 |
|
|
|
70 |
|
|
N/A |
|
|
09/10 |
|
|
Martin Crest Assisted Living |
Weatherford, TX |
|
|
56 |
|
|
|
— |
|
|
|
86 |
|
|
|
86 |
|
|
N/A |
|
|
09/10 |
|
|
Pecan Point Assisted Living |
Sherman, TX |
|
|
56 |
|
|
|
— |
|
|
|
70 |
|
|
|
70 |
|
|
N/A |
|
|
09/10 |
|
|
Santa Fe Trails Assisted Living |
Cleburne, TX |
|
|
56 |
|
|
|
— |
|
|
|
86 |
|
|
|
86 |
|
|
N/A |
|
|
09/10 |
|
|
Spring Lake Assisted Living |
Paris, TX |
|
|
56 |
|
|
|
— |
|
|
|
70 |
|
|
|
70 |
|
|
N/A |
|
|
09/10 |
|
|
Spring Meadows Libertyville |
Libertyville, IL |
|
|
198 |
|
|
|
208 |
|
|
|
45 |
|
|
|
253 |
|
|
N/A |
|
|
04/11 |
|
|
Spring Meadows Naperville |
Naperville, IL |
|
|
193 |
|
|
|
186 |
|
|
|
45 |
|
|
|
231 |
|
|
N/A |
|
|
04/11 |
|
|
Spring Meadows at Summit |
Summit, NJ |
|
|
89 |
|
|
|
— |
|
|
|
98 |
|
|
|
98 |
|
|
N/A |
|
|
04/11 |
|
|
Spring Meadows at Trumbull |
Trumbull, CT |
|
|
152 |
|
|
|
182 |
|
|
|
56 |
|
|
|
238 |
|
|
N/A |
|
|
04/11 |
|
|
Stonefield Assisted Living |
McKinney, TX |
|
|
75 |
|
|
|
— |
|
|
|
90 |
|
|
|
90 |
|
|
N/A |
|
|
09/10 |
|
9
|
|
|
|
|
|
|
|
Resident Capacity1 |
|
|
|
|
|
|
Commencement |
|||||||||
|
Community |
Location |
|
Units |
|
|
IL |
|
|
AL |
|
|
Total |
|
|
Ownership |
|
|
of Operations2 |
|||||
|
Mansfield, TX |
|
|
56 |
|
|
|
— |
|
|
|
70 |
|
|
|
70 |
|
|
N/A |
|
|
09/10 |
||
|
Waterford at Ames |
Ames, IA |
|
|
49 |
|
|
|
— |
|
|
|
122 |
|
|
|
122 |
|
|
N/A |
|
|
02/06 |
|
|
Waterford at Miracle Hills |
Omaha, NE |
|
|
54 |
|
|
|
— |
|
|
|
70 |
|
|
|
70 |
|
|
N/A |
|
|
03/06 |
|
|
Waterford at Roxbury Park |
Omaha, NE |
|
|
55 |
|
|
|
— |
|
|
|
70 |
|
|
|
70 |
|
|
N/A |
|
|
02/06 |
|
|
Waterford at Van Dorn |
Lincoln, NE |
|
|
63 |
|
|
|
— |
|
|
|
84 |
|
|
|
84 |
|
|
N/A |
|
|
02/06 |
|
|
Waterford at Woodbridge |
Plattsmouth, NE |
|
|
40 |
|
|
|
— |
|
|
|
45 |
|
|
|
45 |
|
|
N/A |
|
|
02/06 |
|
|
HCP: |
|
|
|
|
|
|
|
|
|
|
|
|
|
|
|
|
|
|
|
|
|
|
|
|
Atrium of Carmichael |
Sacramento, CA |
|
|
151 |
|
|
|
155 |
|
|
|
— |
|
|
|
155 |
|
|
N/A |
|
|
01/92 |
|
|
Charlotte Square |
Charlotte, NC |
|
|
118 |
|
|
|
— |
|
|
|
150 |
|
|
|
150 |
|
|
N/A |
|
|
12/06 |
|
|
Chesapeake Place |
Chesapeake, VA |
|
|
103 |
|
|
|
— |
|
|
|
153 |
|
|
|
153 |
|
|
N/A |
|
|
12/06 |
|
|
Covenant Place of Abilene |
Abilene, TX |
|
|
50 |
|
|
|
— |
|
|
|
55 |
|
|
|
55 |
|
|
N/A |
|
|
08/04 |
|
|
Covenant Place of Burleson |
Burleson, TX |
|
|
74 |
|
|
|
— |
|
|
|
80 |
|
|
|
80 |
|
|
N/A |
|
|
08/04 |
|
|
Covenant Place of Waxahachie |
Waxahachie, TX |
|
|
50 |
|
|
|
— |
|
|
|
55 |
|
|
|
55 |
|
|
N/A |
|
|
08/04 |
|
|
Crescent Place |
Cedar Hill, TX |
|
|
80 |
|
|
|
— |
|
|
|
85 |
|
|
|
85 |
|
|
N/A |
|
|
11/05 |
|
|
Crescent Point |
Cedar Hill, TX |
|
|
111 |
|
|
|
134 |
|
|
|
— |
|
|
|
134 |
|
|
N/A |
|
|
08/04 |
|
|
Crosswood Oaks |
Sacramento, CA |
|
|
121 |
|
|
|
127 |
|
|
|
— |
|
|
|
127 |
|
|
N/A |
|
|
01/92 |
|
|
Good Place |
North Richland Hills, TX |
|
|
72 |
|
|
|
— |
|
|
|
80 |
|
|
|
80 |
|
|
N/A |
|
|
08/04 |
|
|
Greenville Place |
Greenville, SC |
|
|
85 |
|
|
|
— |
|
|
|
153 |
|
|
|
153 |
|
|
N/A |
|
|
12/06 |
|
|
Meadow Lakes |
North Richland Hills, TX |
|
|
118 |
|
|
|
145 |
|
|
|
— |
|
|
|
145 |
|
|
N/A |
|
|
08/04 |
|
|
Myrtle Beach Estates |
Myrtle Beach, SC |
|
|
101 |
|
|
|
— |
|
|
|
156 |
|
|
|
156 |
|
|
N/A |
|
|
12/06 |
|
|
Tesson Heights |
St. Louis, MO |
|
|
182 |
|
|
|
134 |
|
|
|
72 |
|
|
|
206 |
|
|
N/A |
|
|
10/98 |
|
|
Veranda Club |
Boca Raton, FL |
|
|
186 |
|
|
|
129 |
|
|
|
97 |
|
|
|
226 |
|
|
N/A |
|
|
01/92 |
|
|
|
|
|
|
4,541 |
|
|
|
2,405 |
|
|
|
3,351 |
|
|
|
5,756 |
|
|
|
|
|
|
|
|
Total |
|
|
|
13,016 |
|
|
|
6,879 |
|
|
|
9,644 |
|
|
|
16,523 |
|
|
|
|
|
|
|
|
(1) |
Independent living (IL) residences and assisted living (AL) residences based on community licensure. |
|
(2) |
Indicates the date on which the Company acquired or commenced operating the community. The Company operated certain of its communities pursuant to management agreements prior to acquiring interests in or leasing the communities. |
10
The Company believes that the fragmented nature of the senior living industry and the limited capital resources available to many small, private operators provide an attractive opportunity for the Company to expand its existing base of senior living operations. The Company believes that its current operations with geographic concentrations throughout the United States serve as the foundation on which the Company can build senior living networks in targeted geographic markets and thereby provide a broad range of high quality care in a cost-efficient manner.
The following are the principal elements of the Company’s clear and differentiated growth strategy:
Organic Growth
The Company intends to continue to focus on its occupancy, rents and operating margins of its stabilized communities. The Company continually seeks to improve occupancy rates and increase average rents by: (i) retaining residents as they “age in place” by extending optional care and service programs and converting existing units to higher levels of care; (ii) attracting new residents through the use of technology to enhance Internet marketing and on-site marketing programs focused on residents and family members; (iii) aggressively seeking referrals from senior care referral services, professional community outreach sources, including area religious organizations, senior social service programs, civic and business networks, as well as the medical community; and (iv) continually refurbishing and renovating its communities.
Expansion and Conversions of Existing Communities
The Company intends to increase levels of care and capacity at certain of its existing communities through expansion and/or conversions of certain units. Increasing our levels of care and capacity is expected to increase revenue and operating income while meeting the needs of our residents who have an average age of 85 years.
Pursue Strategic Acquisitions
The Company intends to continue to pursue acquisitions of senior housing communities. Through strategic acquisitions, joint venture investments, or facility leases, the Company seeks to acquire communities in existing geographically concentrated regions as a means to increase market share, augment existing clusters, strengthen its ability to provide a broad range of care, and create operating efficiencies. As the industry continues to consolidate, the Company believes that opportunities will arise to acquire other senior living companies. The Company believes that the current fragmented nature of the senior living industry, combined with the Company’s financial resources, geographically concentrated regions, and extensive contacts within the industry, should provide it with the opportunity to evaluate a number of potential acquisition opportunities in the future. In reviewing acquisition opportunities, the Company will consider, among other things, geographic location, competitive climate, reputation and quality of management and communities, and the need for renovation or improvement of the communities.
Expand Referral Networks
The Company intends to continue to develop relationships with local and regional hospital systems, managed care organizations and other referral sources to attract new residents to the Company’s communities. In certain circumstances these relationships may involve strategic alliances or joint ventures. The Company believes that such arrangements or alliances, which could range from joint marketing arrangements to priority transfer agreements, will enable it to be strategically positioned within the Company’s markets if, as the Company believes, senior living programs become an integral part of the evolving health care delivery system.
11
Centralized Management
The Company centralizes its corporate and other administrative functions so that the community-based management and staff can focus their efforts on resident care. The Company maintains centralized accounting, finance, human resources, training and other operational functions at its national corporate office in Dallas, Texas. The Company also has a corporate office in New York, New York. The Company’s corporate offices are generally responsible for: (i) establishing Company-wide policies and procedures relating to, among other things, resident care and operations; (ii) performing accounting functions; (iii) developing employee training programs and materials; (iv) coordinating human resources; (v) coordinating marketing functions; and (vi) providing strategic direction. In addition, financing, development, construction and acquisition activities, including feasibility and market studies, and community design, development, and construction management are conducted at the Company’s corporate offices.
The Company seeks to control operational expenses for each of its communities through proprietary expense management systems, standardized management reporting and centralized controls of capital expenditures, asset replacement tracking, and purchasing for larger and more frequently used supplies and food inventories through group purchasing programs. Community expenditures are monitored by regional and district managers who are accountable for the resident satisfaction and financial performance of the communities in their region.
Regional Management
The Company provides oversight and support to each of its senior housing communities through experienced regional and district managers. A district manager will generally oversee the marketing and operations of three to seven communities clustered in a small geographic area. A regional manager will generally cover a larger geographic area consisting of eight to thirteen communities. In most cases, the district and regional managers will office out of the Company’s senior housing communities. Currently, there are district and regional managers based in the East, Central Plains, South Central, Dallas, Indiana, Midwest, Texas, Southwest, and West regions.
The executive director at each community reports to a regional or district manager. The regional and district managers report on the operations of each community directly to senior management at the Company’s corporate office. The district and regional managers make regular site visits to each of their assigned communities. The site visits involve a physical plant inspection, quality assurance review, staff training, financial and systems audits, regulatory compliance, and team building.
Community-Based Management
An executive director manages the day-to-day operations at each senior housing community, including oversight of the quality of care, delivery of resident services, and monitoring of financial performance. The executive director is also responsible for all personnel, including food service, maintenance, activities, security, assisted living, housekeeping, and, where applicable, nursing or care services. In most cases, each community also has department managers who direct the environmental services, nursing or care services, business management functions, dining services, activities, transportation, housekeeping, and marketing functions.
The assisted living component of the senior housing communities is managed by licensed professionals, such as a nurse and/or a licensed administrator. These licensed professionals have many of the same operational responsibilities as the Company’s executive directors, but their primary responsibility is to oversee resident care. Many of the Company’s senior housing communities are part of a campus setting, which may include independent living and/or memory care. This campus arrangement allows for cross-utilization of certain support personnel and services, including administrative functions that result in greater operational efficiencies and lower costs than freestanding facilities.
The Company actively recruits personnel to maintain adequate staffing levels at its existing communities and hires new staff for new or acquired communities prior to opening. The Company has adopted comprehensive recruiting and screening programs for management positions that utilize corporate office team interviews and thorough background and reference checks. The Company offers system-wide training and orientation for all of its employees at the community level through a combination of Company-sponsored seminars and conferences.
12
Quality assurance programs are coordinated and implemented by the Company’s corporate and regional staff. The Company’s quality assurance is targeted to achieve maximum resident and resident family member satisfaction with the care and services delivered by the Company. The Company’s primary focus in quality control monitoring includes routine in-service training and performance evaluations of caregivers and other support employees. The Company has established a Corporate Quality Assurance Committee which consists of the Executive Vice-President, Senior Vice-President, and Vice-President of Operations, Quality and Clinical Directors, and General Counsel. The purpose of the committee is to monitor and evaluate the processes by which care is delivered to our residents and the appropriateness and quality of care provided within each of our communities. Additional quality assurance measures include:
Resident and Resident’s Family Input. On a routine basis, the Company provides residents and their family members the opportunity to provide valuable input regarding the day-to-day delivery of services. On-site management at each community has fostered and encouraged active resident councils and resident committees who meet independently. These resident bodies meet with on-site management on a monthly basis to offer input and suggestions as to the quality and delivery of services. Additionally, at each community the Company conducts annual resident satisfaction surveys to further monitor the satisfaction levels of both residents and their family members. These surveys are sent directly to a third party firm for tabulation, then to the Company’s corporate headquarters for distribution to onsite staff. In each of fiscal 2017 and 2016, the Company achieved 94.6% approval ratings from its residents. For any departmental area of service scoring below 90%, a corrective action plan is developed jointly by on-site, regional and corporate staff for immediate implementation. In addition, the Company ranked third among senior living operators nationally in 2018 according to J.D. Powers 2018 Senior Living Satisfaction Study. The study measured resident and family overall satisfaction across factors important to them including community staff, convenience of location, food and beverage, room, building and grounds, senior service and activities among others.
Regular Community Inspections. Each community is inspected, on at least a quarterly basis, by regional and/or corporate staff. Included as part of this inspection is the monitoring of the overall appearance and maintenance of the community interiors and grounds. The inspection also includes monitoring staff professionalism and departmental reviews of maintenance, housekeeping, activities, transportation, marketing, administration and food and health care services, if applicable. The inspections also include observing residents in their daily activities and the community’s compliance with government regulations.
Independent Service Evaluations. The Company engages the services of outside professional independent consulting firms to evaluate various components of the community operations. These services include mystery shops, competing community analysis, pricing recommendations and product positioning. This provides management with valuable unbiased product and service information. A plan of action regarding any areas requiring improvement or change is implemented based on information received. At communities where health care is delivered, these consulting service reviews include the on-site handling of medications, recordkeeping and general compliance with all applicable governmental regulations.
Sales and Marketing
Most communities are staffed by on-site sales directors and additional marketing/sales staff depending on the community size and occupancy status. The primary focus of the on-site marketing staff is to create awareness of the Company and its services among prospective residents and family members, professional referral sources and other key decision makers. These efforts incorporate an aggressive marketing plan to include monthly, quarterly and annual goals for leasing, new lead generation, prospect follow up, community outreach and resident and family referrals. Additionally, the marketing plan includes a calendar of promotional events and a comprehensive media program. On-site marketing departments perform a competing community assessment quarterly.
13
Corporate and regional sales directors monitor the on-site sales departments’ effectiveness and productivity on a weekly basis. Routine detailed marketing department audits are performed on a quarterly basis or more frequently if deemed necessary. Corporate and regional personnel assist in the development of marketing strategies for each community to address the continuously changing resident profile and maintain a focus on building brand awareness and increasing Internet website traffic and leads. The marketing strategies developed utilize the implementation of application program interface systems with certain website and Internet referral partners and the production of creative media and necessary marketing collateral. The Company has also implemented numerous Internet web-based initiatives to attract prospects including certain e-mail and website triggers prompting interactive invitations with on-going follow-ups, as well as a nurturing program to actively engage prospects throughout the marketing/sales cycle. Ongoing sales training of on-site marketing/sales staff is implemented by corporate and regional marketing directors as well as third party professionals.
Government Regulation
Changes in existing laws and regulations, adoption of new laws and regulations, and new interpretations of existing laws and regulations could have a material effect on the Company’s operations. Failure by the Company to comply with applicable regulatory requirements could have a material adverse effect on the Company’s business, financial condition, cash flows, and results of operations. Accordingly, the Company monitors legal and regulatory developments on local and national levels.
The health care industry is subject to extensive regulation and frequent regulatory change. At this time, no federal laws or regulations specifically regulate assisted or independent living residences. While a number of states have not yet enacted specific assisted living regulations, certain of the Company’s assisted living communities are subject to regulation, licensing, CON and permitting by state and local health care and social service agencies and other regulatory authorities. While such requirements vary from state to state, they typically relate to staffing, training, physical design, patient privacy, required services and the quality thereof and resident characteristics. The Company believes that such regulation will increase in the future. In addition, health care providers are receiving increased scrutiny under anti-trust laws as integration and consolidation of health care delivery increases and affects competition. Moreover, robust state and federal enforcement of fraud and abuse laws continues. Because some of the Company’s communities receive a portion of their funds from Medicaid, such communities are also subject to state and federal Medicaid standards, the noncompliance with which may result in the imposition of penalties or sanctions or suspension or exclusion from participation in the Medicaid program. The Company’s communities are also subject to various zoning restrictions, local building codes, and other ordinances, such as fire safety codes. Failure by the Company to comply with applicable regulatory requirements could have a material adverse effect on the Company’s business, financial condition, and results of operations. Regulation of the assisted living industry is evolving. The Company is unable to predict the content of new regulations and their effect on its business. There can be no assurance that the Company’s operations will not be adversely affected by regulatory developments.
The Company believes that its communities are in substantial compliance with applicable regulatory requirements. However, unannounced surveys or inspections may occur annually or bi-annually, or following a regulator’s receipt of a complaint about a community. In the ordinary course of business, one or more of the Company’s communities could be cited for deficiencies resulting from such inspections or surveys. Most inspection deficiencies are resolved through an agreed upon plan of corrective action relating to the community’s operations, but the reviewing agency typically has the authority to take further action against a licensed or certified community, which could result in the imposition of fines, repayment of amounts previously paid, imposition of a provisional or conditional license, suspension or revocation of a license, suspension or denial of admissions, loss of certification as a provider under federal health care programs or imposition of other sanctions, including criminal penalties. Loss, suspension or modification of a license may also cause us to default under our loan or lease agreements and/or trigger cross-defaults. Sanctions may be taken against providers or facilities without regard to the providers’ or facilities’ history of compliance. We may also expend considerable resources to respond to federal and state investigations or other enforcement action under applicable laws or regulations. To date, none of the deficiency reports received by us has resulted in a suspension, fine or other disposition that has had a material adverse effect on our revenues. However, any future substantial failure to comply with any applicable legal and regulatory requirements could result in a material adverse effect to our business as a whole. In addition, states’ Attorneys General vigorously enforce consumer protection laws as those laws relate to the senior living industry. State Medicaid Fraud and Abuse Units may also investigate assisted living communities even if the community or any of its residents do not receive federal or state funds.
14
Under the Americans with Disabilities Act of 1990, all places of public accommodation are required to meet certain federal requirements related to access and use by disabled persons. A number of additional federal, state and local laws exist that also may require modifications to existing and planned properties to permit access to the properties by disabled persons. While the Company believes that its communities are substantially in compliance with present requirements or are exempt therefrom, if required changes involve a greater expenditure than anticipated or must be made on a more accelerated basis than anticipated, additional costs would be incurred by the Company. Further legislation may impose additional burdens or restrictions with respect to access by disabled persons, the costs of compliance with which could be substantial.
The Health Insurance Portability and Accountability Act of 1996 (“HIPAA”), in conjunction with the federal regulations promulgated thereunder by the Department of Health and Human Services, has established, among other requirements, standards governing the privacy and security of certain protected and individually identifiable health information that is created, received or maintained by a range of covered entities. HIPAA has also established standards governing uniform health care transactions, the codes and identifiers to be used by the covered entities and standards governing the security of certain electronic transactions conducted by covered entities. Penalties for violations can range from civil money penalties for errors and negligent acts to criminal fines and imprisonment for knowing and intentional misconduct. In addition, the Company may be subject to a corrective action plan, the cost of compliance of which could be significant.
In addition, the Company is subject to various federal, state and local environmental laws and regulations. Such laws and regulations often impose liability whether or not the owner or operator knew of, or was responsible for, the presence of hazardous or toxic substances. The costs of any required remediation or removal of these substances could be substantial and the liability of an owner or operator as to any property is generally not limited under such laws and regulations and could exceed the property’s value and the aggregate assets of the owner or operator. The presence of these substances or failure to remediate such contamination properly may also adversely affect the owner’s ability to sell or rent the property, or to borrow using the property as collateral. Under these laws and regulations, an owner, operator or an entity that arranges for the disposal of hazardous or toxic substances, such as asbestos-containing materials, at a disposal site may also be liable for the costs of any required remediation or removal of the hazardous or toxic substances at the disposal site. In connection with the ownership or operation of its properties, the Company could be liable for these costs, as well as certain other costs, including governmental fines and injuries to persons or properties. The Company has completed Phase I environmental audits of substantially all of the communities in which the Company owns interests, typically at the time of acquisition, and such audits have not revealed any material environmental liabilities that exist with respect to these communities.
Under various federal, state and local environmental laws, ordinances and regulations, a current or previous owner or operator of real estate may be required to investigate and clean up hazardous or toxic substances or petroleum product releases at such property, and may be held liable to a governmental entity or to third parties for property damage and for investigation and clean-up costs. The Company is not aware of any environmental liability with respect to any of its owned, leased or managed communities that the Company believes would have a material adverse effect on its business, financial condition, or results of operations. The Company believes that its communities are in compliance in all material respects with all federal, state and local laws, ordinances and regulations regarding hazardous or toxic substances or petroleum products. The Company has not been notified by any governmental authority, and is not otherwise aware of any material non-compliance, liability or claim relating to hazardous or toxic substances or petroleum products in connection with any of the communities the Company currently operates.
The Company believes that the structure and composition of government and, specifically, health care regulations will continue to change and, as a result, regularly monitors developments in the law. The Company expects to modify its agreements and operations from time to time as the business and regulatory environments change. While the Company believes it will be able to structure all its agreements and operations in accordance with applicable law, there can be no assurance that its arrangements will not be successfully challenged.
15
The senior living industry is highly competitive, and the Company expects that all segments of the industry will become increasingly competitive in the future. Although there are a number of substantial companies active in the senior living industry and in the markets in which the Company operates, the industry continues to be very fragmented and characterized by numerous small operators. The Company primarily competes with national operators such as Brookdale Senior Living Inc. and Five Star Quality Care, Inc. and other regional and local independent operators. The Company believes that the primary competitive factors in the senior living industry are: (i) quality on-site staff; (ii) location; (iii) reputation for and commitment to a high quality of service; (iv) support service offerings (such as food services); (v) fair price for services provided; and (vi) physical appearance and amenities associated with the communities. The Company competes with other companies providing independent living, assisted living, skilled nursing, home health care, and other similar service and care alternatives, some of whom may have greater financial resources than the Company. Because seniors tend to choose senior housing communities near their homes, the Company’s principal competitors are other senior living and long-term care communities in the same geographic areas as the Company’s communities. The Company also competes with other health care businesses with respect to attracting and retaining nurses, technicians, aides and other high quality professional and non-professional employees and managers.
Employees
As of December 31, 2017, the Company employed 7,426 persons (101 of whom are employed at the Company’s corporate offices), of which 4,413 were full-time employees and 3,013 were part-time employees. None of the Company’s employees are currently represented by a labor union and the Company is not aware of any union organizing activity among its employees. The Company believes that its relationship with its employees is good.
Executive Officers and Other Key Employees of the Registrant
The following table sets forth certain information concerning each of the Company’s executive officers and other key employees as of February 23, 2018:
|
Name |
|
Age |
|
Position(s) with the Company |
|
Lawrence A. Cohen |
|
64 |
|
Chief Executive Officer and Vice Chairman of the Board |
|
Brett D. Lee |
|
43 |
|
Executive Vice President and Chief Operating Officer |
|
Carey P. Hendrickson |
|
55 |
|
Senior Vice President and Chief Financial Officer |
|
David R. Brickman |
|
59 |
|
Senior Vice President, Secretary and General Counsel |
|
Jeremy D. Falke |
|
44 |
|
Senior Vice President – Human Resources |
|
David W. Beathard, Sr. |
|
70 |
|
Senior Vice President — Operations |
|
Kevin E. Wilbur |
|
53 |
|
Vice President — Operations |
|
Joseph G. Solari |
|
53 |
|
Vice President — Corporate Development |
|
Gloria M. Holland |
|
50 |
|
Vice President — Finance |
|
Glen H. Campbell |
|
73 |
|
Vice President — Asset Management |
|
Christopher H. Lane |
|
46 |
|
Vice President — Financial Reporting |
|
Robert F. Hollister |
|
62 |
|
Property Controller |
|
Donald S. Beasley |
|
42 |
|
Director of Human Resources |
16
Lawrence A. Cohen has served as one of our directors since November 1996 and as Vice Chairman of the Board since November 1996. He has served as our Chief Executive Officer since May 1999 and was our Chief Financial Officer from November 1996 to May 1999. From 1991 to 1996, Mr. Cohen served as President and Chief Executive Officer of Paine Webber Properties Incorporated. Mr. Cohen serves on the boards of various charitable organizations and is active in several industry associations. Mr. Cohen was a founding member and a former Chairman of the American Seniors Housing Association and serves on the Operator Advisory Board of the National Investment Center for the Seniors Housing & Care Industry. He received an LL.M. in Taxation from New York University School of Law, a JD from St. John’s University School of Law, and a BBA in Accounting from The George Washington University. Mr. Cohen has had positions with businesses involved in senior living for 33 years.
Brett D. Lee joined the Company as Executive Vice President and Chief Operating Officer in August 2017. Prior to joining the Company, Mr. Lee served as the Chief Executive Officer of the North Texas and Dallas Markets of Tenet Healthcare Corporation. His experience also includes serving in senior leadership positions in four of the nation's top 10 children's hospitals. Mr. Lee served as Chief Operating Officer at Children's Healthcare of Atlanta, Chief Operating Officer at Riley Hospital for Children in Indianapolis, Vice President of Operations and Clinical Services at Children's Medical Center in Dallas and Vice President of Operations at Cook Children's Medical Center in Fort Worth. Mr. Lee received a BS in Physical Therapy from the University of Oklahoma College of Allied Health, a Master of Health Science, Health Finance and Management from the Johns Hopkins School of Public Health, a Master of Science in Leadership Development from the University of Pennsylvania, and a Doctorate in Allied Health and Physical Therapy from Massachusetts General Hospital Institute of Health Sciences.
Carey P. Hendrickson joined the Company as Senior Vice President and Chief Financial Officer in May 2014. From 2010 through 2014, he served as the Senior Vice President/Chief Financial Officer and Treasurer of Belo Corp., a television company that owned and operated network-affiliated television stations and their associated websites (“Belo”). Prior to serving in such capacity, Mr. Hendrickson served Belo in various roles including Senior Vice President/Chief Accounting Officer, Vice President/Human Resources, Vice President/Investor Relations and Corporate Communications, and Vice President/Strategic & Financial Planning. He began his career with KPMG LLP and was the director of financial planning for Republic Financial Services before joining Belo in 1992. Mr. Hendrickson received a BBA in Accounting from Baylor University and a Master of Business Administration in Finance from the University of Texas in Arlington.
David R. Brickman is currently the Senior Vice President, Secretary, and General Counsel of the Company. He served as Vice President and General Counsel of the Company and its predecessors since July 1992 and has served as Secretary of the Company since May 2007. From 1989 to 1992, Mr. Brickman served as in-house counsel with LifeCo Travel Management Company, a corporation that provided travel services to U.S. corporations. Mr. Brickman earned a Juris Doctor and Masters of Business Administration from the University of South Carolina and a Masters in Health Administration from Duke University. He currently serves on the Board of Advisors for the Southern Methodist University Corporate Counsel Symposium. He is also a member of the National Center for Assisted Living In-house Counsel Roundtable Task Force, as well as the Long-Term Care Risk Legal Forum. Mr. Brickman has either practiced law or performed in-house counsel functions for 31 years.
Jeremy D. Falke joined the Company as Senior Vice President – Human Resources. Mr. Falke held various positions within Tenet Healthcare Corporation (“Tenet”) from November 2004 to February 2018, serving most recently as the Vice President, Talent, Culture and Performance Systems in Dallas. In this role, he was responsible for all talent planning, development, and cultural programming and transformation for an organization with over 75 acute-care hospitals and 450 outpatient facilities, employing more than 125,000 people. Prior to this role, Mr. Falke served as the Senior Director, Strategic Operations, Analytics and Reporting in Dallas and as the Chief Human Resources Officer for Creighton University Medical Center, which was then owned by Tenet in Omaha, Nebraska. Mr. Falke received a Bachelor of Science in Business Management from University of Phoenix in Scottsdale, and a Masters of Business Administration with a concentration in Healthcare Management from the University of Nebraska in Omaha.
17
David W. Beathard, Sr. is currently the Senior Vice President — Operations of the Company. He served as Vice President — Operations of the Company and its predecessors from August 1996 to June 2013. Mr. Beathard joined Life Care Services Corporation in 1977 where he served in various roles including Vice President and Director of Operations Management. From 1992 to 1996, he owned and operated a consulting firm, which provided operational, marketing, and feasibility consulting regarding senior housing communities. Mr. Beathard has served as an Advisory Board Member of the Texas Assisted Living Association. He earned a BA degree from Miami University where he also attended graduate school with a focus in business administration. Mr. Beathard has been active in the operational, sales and marketing, and construction oversight aspects of senior housing for 43 years.
Kevin E. Wilbur joined the Company in February 2000 as an Executive Director and served in that capacity until being promoted to a District Manager role and then to a Regional Manager of Operations role. He was promoted to his current position of Vice President — Operations in September 2016. Prior to joining the Company in 2000, Mr. Wilbur was employed by Lantis Enterprises as an Executive Director. He is a graduate of the Nebraska College of Business and also attended Bellevue University. Mr. Wilbur has been active in the operational and marketing aspects of senior housing for over 22 years.
Joseph G. Solari joined the Company as Vice President — Corporate Development in September 2010. Mr. Solari has more than 19 years of experience originating, structuring, negotiating and executing the acquisition, sale and divestiture of healthcare real estate and real estate operating companies. Prior to joining the Company, from 2007 to 2009, Mr. Solari was Managing Director, Acquisitions for Ventas, Inc., where he was responsible for the firm’s real estate investment activities in the seniors housing and skilled nursing industries. Prior to Ventas, Inc., from 1999 to 2007, Mr. Solari spent eight years in the healthcare investment banking group of Houlihan Lokey, where he was responsible for the origination and execution of merger and acquisition, private placement and financial restructuring engagements for the firm’s healthcare clients, with particular focus on facility-based, healthcare services companies. Mr. Solari earned his Masters in Business Administration degree from Virginia Commonwealth University.
Gloria M. Holland has served as Vice President — Finance of the Company since June 2004. From 2001 to 2004, Ms. Holland served as Assistant Treasurer and a corporate officer for Aurum Technology, Inc., a privately held company that provided technology and outsourcing to community banks. From 1996 to 2001, Ms. Holland held positions in Corporate Finance and Treasury at Brinker International, an owner and operator of casual dining restaurants. From 1989 to 1996, Ms. Holland was a Vice President in the Corporate Banking division of NationsBank and predecessor banks. Ms. Holland received a BBA in Finance from the University of Mississippi in 1989.
Glen H. Campbell has served as Vice President — Asset Management of the Company since September 1997. From 1990 to 1997 Mr. Campbell served as Vice President of Development for Greenbrier Corporation, an assisted living development and management company. From 1985 to 1990 Mr. Campbell served as Director of Facility Management for Retirement Corporation of America. Mr. Campbell has been active in the design and development of retirement communities for 45 years.
Christopher H. Lane, a Certified Public Accountant, joined the Company in December 2008 and currently serves as Vice President — Financial Reporting. Prior to joining the Company, Mr. Lane served as a Senior Manager in the financial services audit practice of KPMG LLP. Mr. Lane earned a Masters in Accounting from Texas Tech University and is a member of the American Institute of Certified Public Accountants, Texas Society of Certified Public Accountants and Institute of Management Accountants.
Robert F. Hollister, a Certified Public Accountant, has served as Property Controller for the Company and its predecessors since April 1992. From 1985 to 1992, Mr. Hollister was Chief Financial Officer and Controller of Kavanaugh Securities, Inc., a National Association of Securities Dealers broker dealer. Mr. Hollister is a member of the American Institute of Certified Public Accountants.
18
Donald S. Beasley, joined the Company in August 2011 as Director of Employee Relations and has served as the Director of Human Resources since May, 2013. Prior to joining the Company, Mr. Beasley served as Vice President and Director of Human Resources at ASAlliances Biofuels as well as Carillon, Inc, a large senior housing provider. He has also held several positions within Motorola, Inc. serving their supply chain/logistics business as well as Corporate Human Resources. Mr. Beasley earned a bachelor’s degree in Psychology and Master of Business Administration in HR, and is currently certified as a Senior Professional in Human Resources as well as Senior Certified Professional by the Society for Human Resource Management.
Subsidiaries
Capital Senior Living Corporation is the parent company of several direct and indirect subsidiaries. Although Capital Senior Living Corporation and its subsidiaries are referred to collectively for ease of reference in this Form 10-K as the Company, these subsidiaries are separately incorporated and maintain their legal existence separate and apart from the parent, Capital Senior Living Corporation.
19
Our business involves various risks and uncertainties. When evaluating our business the following information should be carefully considered in conjunction with the other information contained in our periodic filings with the SEC. Additional risks and uncertainties not known to us currently or that currently we deem to be immaterial also may impair our business operations. If we are unable to prevent events that have a negative effect from occurring, then our business may suffer. Negative events are likely to decrease our revenue, increase our costs, make our financial results poorer and/or decrease our financial strength, and may cause our stock price to decline.
Risks Related to Our Business, Industry, and Operations
We have significant debt and our failure to generate cash flow sufficient to cover required interest and principal payments could result in defaults of the related debt.
As of December 31, 2017, we had mortgage and other indebtedness, excluding deferred loan costs, totaling approximately $967.3 million. We cannot assure you that we will generate cash flow from operations or receive proceeds from refinancings, other financings or the sales of assets sufficient to cover required interest and principal payments. Any payment or other default could cause the applicable lender to foreclose upon the communities securing the indebtedness with a consequent loss of income and asset value to us. Further, because some of our mortgages contain cross-default and cross-collateralization provisions, a payment or other default by us with respect to one community could affect a significant number of our other communities.
We have significant lease obligations and our failure to generate cash flows sufficient to cover these lease obligations could result in defaults under the lease agreements.
As of December 31, 2017, we leased 46 communities with future lease obligations totaling approximately $433.3 million, with minimum lease obligations of $63.6 million in fiscal 2018. We cannot assure you that we will generate cash flow from operations or receive proceeds from refinancings, other financings or the sales of assets sufficient to cover these required operating lease obligations. Any payment or other default under any such lease could result in the termination of the lease, with a consequent loss of income and asset value to us. Further, because our leases contain cross-default provisions, a payment or other default by us with respect to one leased community could affect all of our other leased communities with related lessors. Certain of our leases contain various financial and other restrictive covenants, which could limit our flexibility in operating our business. Failure to maintain compliance with the lease obligations as set forth in our lease agreements could have a material adverse impact on us. The termination of a significant portion of our facility lease agreements could have a material adverse effect on our business, financial condition, cash flows, and results of operations.
Our failure to comply with financial covenants and other restrictions contained in debt instruments and lease agreements could result in the acceleration of the related debt or lease or in the exercise of other remedies.
Our outstanding indebtedness and leases are secured by our communities, and, in certain cases, a guaranty by our Company or by one or more of our subsidiaries. Therefore, an event of default under the outstanding indebtedness or leases, subject to cure provisions in certain instances, would give the respective lenders or lessors, as applicable, the right to declare all amounts outstanding to be immediately due and payable, terminate the lease, or foreclose on collateral securing the outstanding indebtedness and leases.
There are various financial covenants and other restrictions in certain of our debt instruments and lease agreements, including provisions which:
|
|
• |
require us to meet specified financial tests at the subsidiary company level, which include, but are not limited to, tangible net worth requirements; |
|
|
• |
require us to meet specified financial tests at the community level, which include, but are not limited to, lease coverage tests; and |
|
|
• |
require consent for changes in control of us. |
20
If we fail to comply with any of these requirements, then the related indebtedness or lease obligations could become due and payable prior to their stated dates. We cannot assure that we could pay these debt or lease obligations if they became due prior to their stated dates.
We will require additional financing and/or refinancings in the future and may issue equity securities.
Our ability to obtain such financing or refinancing on terms acceptable to us could have a material adverse effect on our business, financial condition, cash flows, and results of operations. Our ability to meet our long-term capital requirements, including the repayment of certain long-term debt obligations, will depend, in part, on our ability to obtain additional financing or refinancings on acceptable terms from available financing sources, including through the use of mortgage financing, joint venture arrangements, by accessing the debt and/or equity markets and possibly through operating leases or other types of financing, such as lines of credit. Turmoil in the financial markets can severely restrict the availability of funds for borrowing and may make it more difficult or costly for us to raise capital. There can be no assurance that financing or refinancings will be available or that, if available, will be on terms acceptable to us. Moreover, raising additional funds through the issuance of equity securities could cause existing stockholders to experience dilution and could adversely affect the market price of our common stock. Disruptions in the financial markets may have a significant adverse effect on the market value of our common stock and other adverse effects on us and our business. Our inability to obtain additional financing or refinancings on terms acceptable to us could delay or eliminate some or all of our growth plans, necessitate the sales of assets at unfavorable prices or both, and would have a material adverse effect on our business, financial condition, cash flows, and results of operations.
Increases in market interest rates and/or the Consumer Price Index (“CPI”) could significantly increase the costs of our floating rate debt and lease obligations, which could adversely affect our liquidity and earnings.
Our floating rate debt and lease obligations and any future indebtedness and lease obligations, if applicable, exposes us to interest rate and CPI risk. Therefore, any increase in prevailing interest rates or CPI could increase our future interest and/or lease payment obligations, which could in the future have a material adverse effect on our business, financial condition, cash flows, and results of operations.
We cannot assure that we will be able to effectively manage our growth.
We intend to expand our operations, directly or indirectly, through the acquisition of existing senior housing communities and/or the expansion of some of our existing senior housing communities. The success of our growth strategy will depend, in large part, on our ability to implement these plans and to effectively operate these communities. If we are unable to manage our growth effectively, our business, financial condition, cash flows, and results of operations may be adversely affected.
We cannot assure that we will attempt to, or be able to, acquire additional senior housing communities.
The acquisition of existing communities or other businesses involves a number of risks. Existing communities available for acquisition frequently serve or target different markets than those presently served by us. We may also determine that renovations of acquired communities and changes in staff and operations management personnel are necessary to successfully integrate those communities or businesses into our existing operations. The costs incurred to reposition or renovate newly acquired communities may not be recovered by us. In undertaking acquisitions, we also may be adversely impacted by unforeseen liabilities attributable to the prior operators of those communities or businesses, against whom we may have little or no recourse. The success of our acquisition strategy will be determined by numerous factors, including our ability to identify suitable acquisition candidates; the competition for those acquisitions; the purchase price; the requirement to make operational or structural changes and improvements; the financial performance of the communities or businesses after acquisition; our ability to finance the acquisitions; and our ability to integrate effectively any acquired communities or businesses into our management, information, and operating systems. Additionally, there is competition among potential acquirers of communities in the senior housing industry, including real estate investment trusts (“REITs”) and private equity firms, and there can be no assurance that we will be able to successfully complete acquisitions, which could limit our ability to grow our business effectively. We cannot assure that our acquisition of senior housing communities or other businesses will be completed at the rate currently expected, if at all, or if completed, that any acquired communities or businesses will be successfully integrated into our operations which could have an adverse impact on our liquidity, revenues, results of operations, and cash flows.
21
If we are unable to renovate, reposition, or redevelop our communities in accordance with our plans, our anticipated revenues, results of operations, and cash flows could be adversely affected.
We are currently working on projects that will renovate, reposition, or redevelop a number of our existing senior housing communities. These projects are in various stages of development and are subject to a number of factors, some of which we have little or no control. Our ability to successfully renovate, reposition, or redevelop our senior housing communities will depend on a number of factors, including, but not limited to, our ability to acquire suitable sites at reasonable prices; our success in obtaining necessary zoning, licensing, and other required governmental permits and authorizations; and our ability to control construction costs and accurately project completion schedules. We anticipate that the renovation, repositioning, or redevelopment of existing senior housing communities may involve a substantial commitment of capital for a period of time of two years or more until completion and are operating and producing revenue. In addition, we may incur substantial costs prior to achieving stabilized occupancy for each project and cannot assure you that the costs will not be greater than we have anticipated. Our failure to achieve our renovation, repositioning, and redevelopment plans could adversely impact our anticipated revenues, results of operations, and cash flows.
Termination of resident agreements and resident attrition could affect adversely our revenues and earnings.
State regulations governing assisted living facilities require written resident agreements with each resident. Most of these regulations also require that each resident have the right to terminate the resident agreement for any reason on reasonable notice. Consistent with these regulations, the resident agreements signed by us allow residents to terminate their lease upon 0 to 30 days’ notice. Thus, we cannot contract with residents to stay for longer periods of time, unlike typical apartment leasing arrangements that involve lease agreements with specified leasing periods of up to a year or longer. Our resident agreements generally provide for termination of the lease upon death or allow a resident to terminate their lease upon the need for a higher level of care not provided at the community. In addition, the advanced age of our average resident means that the resident turnover rate in our senior living facilities may be difficult to predict. If a large number of residents elected to or otherwise terminate their resident agreements at or around the same time, then our revenues and earnings could be adversely affected.
We largely rely on private pay residents and circumstances that adversely affect the ability of the elderly to pay for our services could have a material adverse effect on us.
Approximately 94.4% of our total revenues from communities that we operated were attributable to private pay sources and approximately 5.6% of our revenues from these communities were attributable to reimbursements from Medicaid, in each case, during fiscal 2017. We expect to continue to rely primarily on the ability of residents to pay for our services from their own or family financial resources. Unfavorable economic conditions in the housing, financial, and credit markets, inflation, or other circumstances that adversely affect the ability of the elderly to pay for our services could have a material adverse effect on our business, financial condition, cash flows, and results of operations.
The senior living services industry is very competitive and some competitors may have substantially greater financial resources than us.
The senior living services industry is highly competitive, and we expect that all segments of the industry will become increasingly competitive in the future. We compete with other companies providing independent living, assisted living, home health care and other similar services and care alternatives. We also compete with other health care businesses with respect to attracting and retaining nurses, technicians, aides and other high quality professional and non-professional employees and managers. Although we believe there is a need for senior housing communities in the markets where we operate residences, we expect that competition will increase from existing competitors and new market entrants, some of whom may have substantially greater financial resources than us. In addition, some of our competitors operate on a not-for-profit basis or as charitable organizations and have the ability to finance capital expenditures on a tax-exempt basis or through the receipt of charitable contributions, neither of which are available to us. Furthermore, if the development of new senior housing communities outpaces the demand for those communities in the markets in which we have senior housing communities, those markets may become saturated. Regulation in the independent and assisted living industry is not substantial. Consequently, development of new senior housing communities could outpace demand. An oversupply of those communities in our markets could cause us to experience decreased occupancy, reduced operating margins and lower profitability.
22
We rely on the services of key executive officers and the loss of these officers or their services could have a material adverse effect on us.
We depend on the services of our executive officers for our management. The loss of some of our executive officers and the inability to attract and retain qualified management personnel could affect our ability to manage our business and could adversely affect our business, financial condition, cash flows, and results of operations.
A significant increase in our labor costs could have a material adverse effect on us.
We compete with other providers of senior living services with respect to attracting and retaining qualified management personnel responsible for the day-to-day operations of each of our communities and skilled personnel responsible for providing resident care. A shortage of nurses or trained personnel may require us to enhance our wage and benefits package in order to compete in the hiring and retention of these personnel or to hire more expensive temporary personnel. We also will be dependent on the available labor pool of semi-skilled and unskilled employees in each of the markets in which we operate. No assurance can be given that our labor costs will not increase, or that, if they do increase, they can be matched by corresponding increases in rates charged to residents. Any significant failure by us to control our labor costs or to pass on any increased labor costs to residents through rate increases could have a material adverse effect on our business, financial condition, cash flows, and results of operations.
We are subject to risks related to the provision for employee health care benefits and recent health care reform legislation.
We use a combination of insurance and self-insurance for employee health care plans. We record expenses under these plans based on estimates of the costs of expected claims, administrative costs and stop-loss premiums. These estimates are then adjusted to reflect actual costs incurred. Actual costs under these plans are subject to variability depending primarily upon participant enrollment and demographics, the actual costs of claims and whether stop-loss insurance covers these claims. In the event that our cost estimates differ from actual costs, we could incur additional unplanned health care costs which could have a material adverse effect on our business, financial condition, cash flows, and results of operations.
In March 2010, comprehensive health care reform legislation under the Patient Protection and Affordable Care Act (HR 3590) and the Health Care Education and Affordability Reconciliation Act (HR 4872) was passed and signed into law. This legislation expands health care coverage to many uninsured individuals and expands health care coverage to those already insured under existing plans. The health care reform legislation includes, among other things, guaranteed coverage requirements, eliminates pre-existing condition exclusions and annual and lifetime maximum limits, restricts the extent to which policies can be rescinded, and imposes new and significant taxes on health insurers and health care benefits. Provisions of the health care reform legislation become effective at various dates over the next several years. The United States Department of Health and Human Services, National Association of Insurance Commissioners, Department of Labor and Treasury Department continue to issue necessary enabling regulations and guidance with respect to the health care reform legislation. Due to the breadth and complexity of the health care reform legislation, the lack of implementing regulations and interpretative guidance, and the phased-in nature of the implementation, it is difficult to predict the overall impact this legislation will have over the coming years; however, this legislation could have a material adverse effect on our business, financial condition, cash flows, and results of operations.
23
There is an inherent risk of liability in the provision of personal and health care services, not all of which may be covered by insurance.
The provision of personal and health care services in the long-term care industry entails an inherent risk of liability. In recent years, participants in the long-term care industry have become subject to an increasing number of lawsuits alleging negligence or related legal theories, many of which involve large claims and result in the incurrence of significant defense costs. Moreover, senior housing communities offer residents a greater degree of independence in their daily living. This increased level of independence may subject the resident and, therefore, us to risks that would be reduced in more institutionalized settings. We currently maintain insurance in amounts we believe are comparable to those maintained by other senior living companies based on the nature of the risks, our historical experience and industry standards, and we believe that this insurance coverage is adequate. However, we may become subject to claims in excess of our insurance or claims not covered by our insurance, such as claims for punitive damages, terrorism and natural disasters. A claim against us not covered by, or in excess of, our insurance could have a material adverse effect upon us.
In addition, our insurance policies must be renewed annually. Based upon poor loss experience, insurers for the long-term care industry have become increasingly wary of liability exposure. A number of insurance carriers have stopped writing coverage to this market, and those remaining have increased premiums and deductibles substantially. Therefore, we cannot assure that we will be able to obtain liability insurance in the future or that, if that insurance is available, it will be available on acceptable economic terms.
We are subject to government regulations and compliance, some of which are burdensome and some of which may change to our detriment in the future.
Federal and state governments regulate various aspects of our business. The development and operation of senior housing communities and the provision of health care services are subject to federal, state and local licensure, certification and inspection laws that regulate, among other matters, the number of licensed beds, the provision of services, the distribution of pharmaceuticals, billing practices and policies, equipment, staffing (including professional licensing), operating policies and procedures, fire prevention measures, environmental matters, and compliance with building and safety codes. Failure to comply with these laws and regulations could result in the denial of reimbursement, the imposition of fines, temporary suspension of admission of new residents, suspension or decertification from the Medicaid program, restrictions on the ability to acquire new communities or expand existing communities and, in extreme cases, the revocation of a community’s license or closure of a community. We believe that such regulation will increase in the future and we are unable to predict the content of new regulations or their effect on our business, any of which could materially adversely affect us.
Various states, including several of the states in which we currently operate, control the supply of licensed beds and assisted living communities through CON or other programs. In those states, approval is required for the addition of licensed beds and some capital expenditures at those communities. To the extent that a CON or other similar approval is required for the acquisition or construction of new communities, the expansion of the number of licensed beds, services, or existing communities, we could be adversely affected by our failure or inability to obtain that approval, changes in the standards applicable for that approval, and possible delays and expenses associated with obtaining that approval. In addition, in most states, the reduction of the number of licensed beds or the closure of a community requires the approval of the appropriate state regulatory agency and, if we were to seek to reduce the number of licensed beds at, or to close, a community, we could be adversely affected by a failure to obtain or a delay in obtaining that approval.
Federal and state anti-remuneration laws, such as “anti-kickback” laws, govern some financial arrangements among health care providers and others who may be in a position to refer or recommend patients to those providers. These laws prohibit, among other things, some direct and indirect payments that are intended to induce the referral of patients to, the arranging for services by, or the recommending of, a particular provider of health care items or services. Federal anti-kickback laws have been broadly interpreted to apply to some contractual relationships between health care providers and sources of patient referral. Similar state laws vary, are sometimes vague, and seldom have been interpreted by courts or regulatory agencies. Violation of these laws can result in loss of licensure, civil and criminal penalties, and exclusion of health care providers or suppliers from participation in the Medicaid program. There can be no assurance that those laws will be interpreted in a manner consistent with our practices.
24
Under the Americans with Disabilities Act of 1990, all places of public accommodation are required to meet federal requirements related to access and use by disabled persons. A number of additional federal, state and local laws exist that also may require modifications to existing and planned communities to create access to the properties by disabled persons. Although we believe that our communities are substantially in compliance with present requirements or are exempt therefrom, if required changes involve a greater expenditure than anticipated or must be made on a more accelerated basis than anticipated, additional costs would be incurred by us. Further legislation may impose additional burdens or restrictions with respect to access by disabled persons, the costs of compliance with which could be substantial.
The Health Insurance Portability and Accountability Act of 1996, in conjunction with the federal regulations promulgated thereunder by the Department of Health and Human Services, has established, among other requirements, standards governing the privacy of certain protected and individually identifiable health information that is created, received or maintained by a range of covered entities. HIPAA has also established standards governing uniform health care transactions, the codes and identifiers to be used by the covered entities and standards governing the security of certain electronic transactions conducted by covered entities. Penalties for violations can range from civil money penalties for errors and negligent acts to criminal fines and imprisonment for knowing and intentional misconduct. HIPAA is a complex set of regulations and many unanswered questions remain with respect to the manner in which HIPAA applies to businesses such as those operated by us.
An increasing number of legislative initiatives have been introduced or proposed in recent years that would result in major changes in the health care delivery system on a national or a state level. Among the proposals that have been introduced are price controls on hospitals, insurance market reforms to increase the availability of group health insurance to small businesses, requirements that all businesses offer health insurance coverage to their employees and the creation of government health insurance plans that would cover all citizens and increase payments by beneficiaries. We cannot predict whether any of the above proposals or other proposals will be adopted and, if adopted, no assurances can be given that their implementation will not have a material adverse effect on our business, financial condition or results of operations.
We may be subject to liability for environmental damages.
Under various federal, state and local environmental laws, ordinances and regulations, a current or previous owner or operator of real estate may be required to investigate and clean up hazardous or toxic substances or petroleum product releases at the property, and may be held liable to a governmental entity or to third parties for property damage and for investigation and clean-up costs incurred by those parties in connection with the contamination. These laws typically impose clean-up responsibility and liability without regard to whether the owner knew of or caused the presence of the contaminants, and liability under these laws has been interpreted to be joint and several unless the harm is divisible and there is a reasonable basis for allocation of responsibility. The costs of investigation, remediation or removal of the substances may be substantial, and the presence of the substances, or the failure to properly remediate the property, may adversely affect the owner’s ability to sell or lease the property or to borrow using the property as collateral. In addition, some environmental laws create a lien on the contaminated site in favor of the government for damages and costs it incurs in connection with the contamination. Persons who arrange for the disposal or treatment of hazardous or toxic substances also may be liable for the costs of removal or remediation of the substances at the disposal or treatment facility, whether or not the facility is owned or operated by the person. Finally, the owner of a site may be subject to common law claims by third parties based on damages and costs resulting from environmental contamination emanating from a site. If we become subject to any of these claims the costs involved could be significant and could have a material adverse effect on our business, financial condition, cash flows, and results of operations.
Damage from catastrophic weather and other natural events could result in losses.
A certain number of our properties are located in areas that have experienced and may experience in the future catastrophic weather and other natural events from time to time, including snow or ice storms, windstorm, tornados, hurricanes, fires, earthquakes, flooding or other severe weather. The Company maintains insurance policies, including coverage for business interruption, designed to mitigate financial losses resulting from such adverse weather and natural events; however, there can be no assurance that adverse weather or natural events will not cause substantial damages or losses to our communities that could exceed our insurance coverage. In the event of a loss in excess of insured limits, such loss could have a material adverse effect on our business, financial condition, cash flows, and results of operations.
25
We rely on information technology in our operations, and any material failure, inadequacy, interruption or security failure of that technology could harm our business.
We rely on information technology networks and systems, including the Internet, to process, transmit and store electronic information and to manage or support a variety of our business processes, including medical records, financial transactions and maintenance of records, which may include personally identifiable information of residents and other customers and payroll data. We rely on commercially available systems, software, tools and monitoring to provide security for processing, transmitting and storing confidential information, such as personally identifiable information relating to health and financial accounts. Although we have taken steps to protect the security of the data maintained in our information systems, it is possible that our security measures will not be able to prevent the systems’ improper functioning, or the improper disclosure of personally identifiable information such as in the event of cyber-attacks. Security breaches, including physical or electronic break-ins, computer viruses, attacks by hackers and similar breaches, can create system disruptions, shutdowns or unauthorized disclosure of confidential information; however, no instances of these potential threats have been identified by the Company. The Company maintains cyber and data privacy-related insurance coverage which provides liability protection associated with network security, privacy and sensitive electronic-data, and privacy breach expenses. Any failure to maintain proper function, security and availability of our information systems could interrupt our operations, damage our reputation, subject us to liability claims or regulatory penalties and could materially and adversely affect our business, financial condition, or results of operations.
Risks Related to Our Common Stock
Anti-takeover provisions in our governing documents, governing law and material agreements may discourage, delay or prevent a merger or acquisition that our stockholders may consider favorable or prevent the removal of our current board of directors and management.
Certain provisions of our amended and restated certificate of incorporation and our amended and restated by-laws may discourage, delay or prevent a merger or acquisition that our stockholders may consider favorable or prevent the removal of our current board of directors and management. We have a number of anti-takeover devices in place that will hinder takeover attempts, including: a staggered board of directors consisting of three classes of directors, each of whom serve three-year terms; removal of directors only for cause, and only with the affirmative vote of at least a majority of the voting interest of stockholders entitled to vote; right of our directors to issue preferred stock from time to time with voting, economic and other rights superior to those of our common stock without the consent of our stockholders; provisions in our amended and restated certificate of incorporation and amended and restated by-laws limiting the right of our stockholders to call special meetings of stockholders; advance notice requirements for stockholders with respect to director nominations and actions to be taken at annual meetings; requirement for two-thirds stockholder approval for amendment of our by-laws and certain provisions of our certificate of incorporation; and no provision in our amended and restated certificate of incorporation for cumulative voting in the election of directors, which means that the holders of a majority of the outstanding shares of our common stock can elect all the directors standing for election.
Several of our leases, loan documents and other material agreements require approval in case of a change of control of our company. These provisions may have the effect of delaying or preventing a change of control of our company even if this change of control would benefit our stockholders.
In addition to the anti-takeover provisions described above, we are subject to Section 203 of the Delaware General Corporation Law. Section 203 generally prohibits a person beneficially owning, directly or indirectly, 15% or more of our outstanding common stock from engaging in a business combination with us for three years after the person acquired the stock. However, this prohibition does not apply if (A) our directors approve in advance the person’s ownership of 15% or more of the shares or the business combination or (B) the business combination is approved by our stockholders by a vote of at least two-thirds of the outstanding shares not owned by the acquiring person.
26
Because we do not presently have plans to pay dividends on our common stock, stockholders must look solely to appreciation of our common stock to realize a gain on their investment.
It is the policy of our Board of Directors to retain any future earnings to finance the operation and expansion of the Company’s business. Accordingly, the Company has not and does not currently anticipate declaring or paying cash dividends on your common stock in the foreseeable future. The payment of cash dividends in the future will be at the sole discretion of our Board of Directors and will depend on, among other things, the Company’s earnings, operations, capital requirements, financial condition, restrictions in then existing financing agreements and other factors deemed relevant by our Board of Directors. Accordingly, stockholders must look solely to appreciation of our common stock to realize a gain on their investment. This appreciation may not occur.
The price of our common stock has fluctuated substantially over the past several years and may continue to fluctuate substantially in the future.
Our stock price may continue to be subject to significant fluctuations as a result of a variety of factors, which are described throughout this Annual report on Form 10-K, including those factors discussed under this section entitled “Risk Factors.” Some of these factors are beyond our control. We may fail to meet the expectations of our stockholders or securities analysts at some point in the future, and our stock price could decline as a result.
Future offerings of equity securities by us may adversely affect the market price of our common stock.
In the future, we may attempt to increase our capital resources by offering additional equity securities. Additional equity offerings may dilute the economic and voting rights of our existing stockholders and/or reduce the market price of our common stock. Our decision to issue equity securities in a future offering will depend on market conditions and other factors, some of which are beyond our control, we cannot predict or estimate the amount, timing, or nature of our future offerings. Thus, holders of our common stock bear the risk of our future offerings reducing the market price of our common stock and diluting their holdings in our Company.
None.
The executive and administrative offices of the Company are located at 14160 Dallas Parkway, Suite 300, Dallas, Texas 75254, and consist of approximately 26,000 square feet. The lease on the premises currently extends through September 2020. The Company believes that its corporate office facilities are adequate to meet its requirements through at least fiscal 2018 and that suitable additional space will be available, as needed, to accommodate further physical expansion of corporate operations. The Company also leases executive office space in New York, New York pursuant to a two-year lease agreement.
As of December 31, 2017, the Company owned or leased and managed the senior housing communities referred to in Item 1 above under the caption “Operating Communities.”
The Company has claims incurred in the normal course of its business. Most of these claims are believed by management to be covered by insurance, subject to normal reservations of rights by the insurance companies and possibly subject to certain exclusions in the applicable insurance policies. Whether or not covered by insurance, these claims, in the opinion of management, based on advice of legal counsel, should not have a material effect on the consolidated financial statements of the Company if determined adversely to the Company.
Not applicable.
27
|
ITEM 5. |
MARKET FOR REGISTRANT’S COMMON EQUITY, RELATED STOCKHOLDER MATTERS AND ISSUER PURCHASES OF EQUITY SECURITIES. |
(a) Market Price of and Dividends on the Registrant’s Common Equity and Related Stockholder Matters.
Market Information and Holders
The Company’s shares of common stock are listed for trading on the New York Stock Exchange (“NYSE”) under the symbol “CSU”. The following table sets forth, for the periods indicated, the high and low sales prices for the Company’s common stock, as reported on the NYSE. At February 23, 2018, there were approximately 213 stockholders of record of the Company’s common stock.
|
|
|
2017 |
|
|
2016 |
|
||||||||||
|
Year |
|
High |
|
|
Low |
|
|
High |
|
|
Low |
|
||||
|
First Quarter |
|
$ |
17.66 |
|
|
$ |
13.09 |
|
|
$ |
20.71 |
|
|
$ |
14.58 |
|
|
Second Quarter |
|
|
16.08 |
|
|
|
13.21 |
|
|
|
20.85 |
|
|
|
15.89 |
|
|
Third Quarter |
|
|
15.30 |
|
|
|
11.60 |
|
|
|
19.92 |
|
|
|
15.70 |
|
|
Fourth Quarter |
|
|
16.72 |
|
|
|
12.09 |
|
|
|
17.89 |
|
|
|
12.65 |
|
Dividends
It is the policy of the Company’s Board of Directors to retain all future earnings to finance the operation and expansion of the Company’s business. Accordingly, the Company did not declare or pay cash dividends on its common stock during fiscal 2017 or 2016 and does not anticipate declaring or paying cash dividends on the common stock in the foreseeable future. The payment of cash dividends in the future will be at the sole discretion of the Company’s Board of Directors and will depend on, among other things, the Company’s earnings, operations, capital requirements, financial condition, restrictions in then existing financing agreements, and other factors deemed relevant by the Board of Directors.
Securities Authorized for Issuance Under Equity Compensation Plans
The following table presents information relating to the Company’s equity compensation plans as of December 31, 2017:
|
Plan Category |
|
Number of Securities to be Issued Upon Exercise of Outstanding Options, Warrants and Rights |
|
|
Weighted-Average Exercise Price of the Outstanding Options, Warrants and Rights |
|
|
Number of Securities Remaining Available for Future Issuance Under Equity Compensation Plans (Excluding Securities Reflected in First Column) |
|
|||
|
Equity compensation plans approved by security holders |
|
|
— |
|
|
$ |
— |
|
|
|
1,053,077 |
|
|
Equity compensation plans not approved by security holders |
|
|
— |
|
|
|
— |
|
|
|
— |
|
|
Total |
|
|
— |
|
|
$ |
— |
|
|
|
1,053,077 |
|
28
The following Performance Graph shows the cumulative total return for the five-year period ended December 31, 2017, in the value of $100 invested in: (1) the Company’s common stock; (2) the Standard & Poor’s Broad Market Index (the “S&P 500”); and (3) the common stock of the Peer Group (as defined below) of companies, whose returns represent the arithmetic average of such companies. The values with each investment as of the beginning of each year are based on share price appreciation and the reinvestment of any dividends on the respective ex-dividend dates.
COMPARISON OF 5 YEAR CUMULATIVE TOTAL RETURN*
Among Capital Senior Living Corporation, the S&P 500 Index,
and a Peer Group
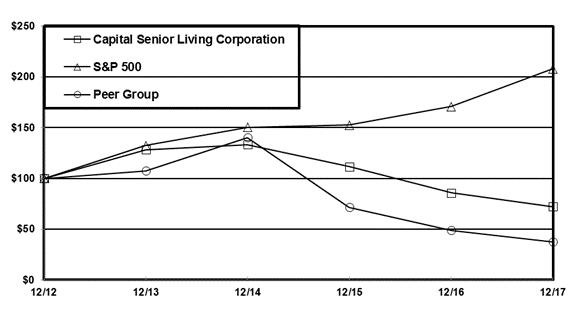
The preceding graph assumes $100 invested at the beginning of the measurement period, including reinvestment of any dividends, in the Company’s common stock, the S&P 500, and the Peer Group and was plotted using the following data:
|
|
|
Cumulative Total Returns |
|
|||||||||||||||||||||
|
|
|
12/12 |
|
|
12/13 |
|
|
12/14 |
|
|
12/15 |
|
|
12/16 |
|
|
12/17 |
|
||||||
|
Capital Senior Living Corporation |
|
|
100.00 |
|
|
|
128.36 |
|
|
|
133.28 |
|
|
|
111.61 |
|
|
|
85.87 |
|
|
|
72.18 |
|
|
S&P 500 |
|
|
100.00 |
|
|
|
132.39 |
|
|
|
150.51 |
|
|
|
152.59 |
|
|
|
170.84 |
|
|
|
208.14 |
|
|
Peer Group |
|
|
100.00 |
|
|
|
107.51 |
|
|
|
140.38 |
|
|
|
71.75 |
|
|
|
48.83 |
|
|
|
37.53 |
|
The Company’s Peer Group, which was selected in good faith on an industry basis, consists of Brookdale Senior Living, Inc. and Five Star Quality Care, Inc.
(b) Recent Sales of Unregistered Securities; Use of Proceeds from Registered Securities.
Not applicable.
29
(c) Purchases of Equity Securities by the Issuer and Affiliated Purchasers.
The following information is provided pursuant to Item 703 of Regulation S-K. The information set forth in the table below reflects information regarding the aggregate shares repurchased by the Company pursuant to its share repurchase program (as described below) as of December 31, 2017.
|
Period |
|
Total Number of Shares Purchased |
|
|
Average Price Paid per Share |
|
|
Total Number of Shares Purchased as Part of Publicly Announced Plans or Programs |
|
|
Approximate Dollar Value of Shares that May Yet Be Purchased Under the Plans or Programs (1) |
|
||||
|
Total at September 30, 2017 |
|
|
494,115 |
|
|
$ |
6.94 |
|
|
|
494,115 |
|
|
$ |
6,570,222 |
|
|
October 1 – October 31, 2017 |
|
|
— |
|
|
|
— |
|
|
|
— |
|
|
|
6,570,222 |
|
|
November 1 – November 30, 2017 |
|
|
— |
|
|
|
— |
|
|
|
— |
|
|
|
6,570,222 |
|
|
December 1 – December 31, 2017 |
|
|
— |
|
|
|
— |
|
|
|
— |
|
|
|
6,570,222 |
|
|
Total at December 31, 2017 |
|
|
494,115 |
|
|
$ |
6.94 |
|
|
|
494,115 |
|
|
$ |
6,570,222 |
|
|
(1) |
On January 22, 2009, the Company’s board of directors approved a share repurchase program that authorized the Company to purchase up to $10.0 million of the Company’s common stock. The repurchase program does not obligate the Company to acquire any particular amount of common stock and the share repurchase authorization has no stated expiration date. On January 14, 2016, the Company announced that its board of directors approved a continuation of the share repurchase program. All shares that have been acquired by the Company under this program were purchased in open-market transactions. |
30
The following table presents selected financial data of the Company which has been derived from the audited consolidated financial statements of the Company. The selected financial data should be read in conjunction with “Management’s Discussion and Analysis of Financial Condition and Results of Operations” and the consolidated financial statements and related notes thereto included in this Annual Report.
|
|
|
At and for the Year Ended December 31, |
|
|||||||||||||||||
|
|
|
2017 |
|
|
2016 |
|
|
2015 |
|
|
2014 |
|
|
2013 |
|
|||||
|
|
|
(In thousands, except per share and other data) |
|
|||||||||||||||||
|
Consolidated Statements of Operations and Comprehensive Loss Data: |
|
|
|
|
|
|
|
|
|
|
|
|
|
|
|
|
|
|
|
|
|
Total revenues |
|
$ |
466,997 |
|
|
$ |
447,448 |
|
|
$ |
412,177 |
|
|
$ |
383,925 |
|
|
$ |
350,362 |
|
|
Income from operations |
|
|
7,842 |
|
|
|
14,390 |
|
|
|
18,835 |
|
|
|
13,900 |
|
|
|
11,250 |
|
|
Net loss |
|
|
(44,168 |
) |
|
|
(28,017 |
) |
|
|
(14,284 |
) |
|
|
(24,126 |
) |
|
|
(16,504 |
) |
|
Net loss per share: |
|
|
|
|
|
|
|
|
|
|
|
|
|
|
|
|
|
|
|
|
|
Basic net loss per share |
|
$ |
(1.50 |
) |
|
$ |
(0.97 |
) |
|
$ |
(0.50 |
) |
|
$ |
(0.83 |
) |
|
$ |
(0.58 |
) |
|
Diluted net loss per share |
|
$ |
(1.50 |
) |
|
$ |
(0.97 |
) |
|
$ |
(0.50 |
) |
|
$ |
(0.83 |
) |
|
$ |
(0.58 |
) |
|
Balance Sheet Data: |
|
|
|
|
|
|
|
|
|
|
|
|
|
|
|
|
|
|
|
|
|
Cash and cash equivalents (excluding restricted cash) |
|
$ |
17,646 |
|
|
$ |
34,026 |
|
|
$ |
56,087 |
|
|
$ |
39,209 |
|
|
$ |
13,611 |
|
|
Working capital (deficit)(1) |
|
|
(22,954 |
) |
|
|
638 |
|
|
|
26,726 |
|
|
|
13,113 |
|
|
|
(5,892 |
) |
|
Total assets(1) |
|
|
1,182,671 |
|
|
|
1,145,781 |
|
|
|
1,019,033 |
|
|
|
891,370 |
|
|
|
745,549 |
|
|
Long-term debt, excluding current portion(1) |
|
|
938,206 |
|
|
|
882,504 |
|
|
|
754,949 |
|
|
|
592,884 |
|
|
|
467,376 |
|
|
Shareholders’ equity |
|
$ |
80,433 |
|
|
$ |
116,918 |
|
|
$ |
135,746 |
|
|
$ |
141,174 |
|
|
$ |
157,950 |
|
|
Other Data: |
|
|
|
|
|
|
|
|
|
|
|
|
|
|
|
|
|
|
|
|
|
Communities (at end of period) |
|
|
|
|
|
|
|
|
|
|
|
|
|
|
|
|
|
|
|
|
|
Owned or leased |
|
|
129 |
|
|
|
129 |
|
|
|
121 |
|
|
|
117 |
|
|
|
109 |
|
|
Joint ventures & managed |
|
|
— |
|
|
|
— |
|
|
|
— |
|
|
|
— |
|
|
|
3 |
|
|
Total |
|
|
129 |
|
|
|
129 |
|
|
|
121 |
|
|
|
117 |
|
|
|
112 |
|
|
Resident capacity: |
|
|
|
|
|
|
|
|
|
|
|
|
|
|
|
|
|
|
|
|
|
Owned or leased |
|
|
16,523 |
|
|
|
16,523 |
|
|
|
15,416 |
|
|
|
15,149 |
|
|
|
13,939 |
|
|
Joint ventures & managed |
|
|
— |
|
|
|
— |
|
|
|
— |
|
|
|
— |
|
|
|
674 |
|
|
Total |
|
|
16,523 |
|
|
|
16,523 |
|
|
|
15,416 |
|
|
|
15,149 |
|
|
|
14,613 |
|
|
(1) |
Working capital (deficit), total assets, and long-term debt, excluding current portion, for fiscal 2017, 2016 and 2015 excludes $9,398, $9,841 and $8,532, respectively, in debt issuance costs, net of accumulated amortization, and fiscal 2014 was revised from amounts previously reported to reflect the impact of reclassifying $6,331 in debt issuance costs, net of accumulated amortization, from other assets to notes payable. This revision was due to the Company’s adoption of ASU 2015-03, Interest—Imputation of Interest- Simplifying the Presentation of Debt Issuance Costs, during the fourth quarter of fiscal 2015 which required current and retrospective application to the Company’s Consolidated Balance Sheets for all periods presented. |
31
Certain information contained in this report constitutes “Forward-Looking Statements” within the meaning of Section 27A of the Securities Act of 1933, as amended, and Section 21E of the Securities Exchange Act of 1934, as amended, which can be identified by the use of forward-looking terminology such as “may,” “will,” “would,” “intend,” “could,” “believe,” “expect,” “anticipate,” “estimate” or “continue” or the negative thereof or other variations thereon or comparable terminology. The Company cautions readers that forward-looking statements, including, without limitation, those relating to the Company’s future business prospects, revenues, working capital, liquidity, capital needs, interest costs, and income, are subject to certain risks and uncertainties that could cause actual results to differ materially from those indicated in the forward-looking statements, due to several important factors herein identified. These factors include the Company’s ability to find suitable acquisition properties at favorable terms, financing, licensing, business conditions, risks of downturn in economic conditions generally, satisfaction of closing conditions such as those pertaining to licensure, availability of insurance at commercially reasonable rates, and changes in accounting principles and interpretations, among others, and other risks and factors identified from time to time in the Company’s reports filed with the SEC.
Overview
The following discussion and analysis addresses (i) the Company’s results of operations on a historical consolidated basis for the years ended December 31, 2017, 2016, and 2015, and (ii) liquidity and capital resources of the Company and should be read in conjunction with the Company’s historical consolidated financial statements and the selected financial data contained elsewhere in this report.
The Company is one of the largest operators of senior housing communities in the United States. The Company’s operating strategy is to provide value to its senior living residents by providing quality senior living services at reasonable prices, while achieving and sustaining a strong, competitive position within its geographically concentrated regions, as well as continuing to enhance the performance of its operations. The Company provides senior living services to the elderly, including independent living, assisted living, and memory care services at reasonable prices. Many of the Company’s communities offer a continuum of care to meet its residents’ needs as they change over time. This continuum of care, which integrates independent living, assisted living, and memory care, and is bridged by home care through independent home care agencies, sustains residents’ autonomy and independence based on their physical and mental abilities.
As of December 31, 2017, the Company operated 129 senior housing communities in 23 states with an aggregate capacity of approximately 16,500 residents, including 83 senior housing communities which the Company owned and 46 senior housing communities the Company leased.
Significant Financial and Operational Highlights
The Company primarily derives its revenue by providing senior living housing and services to the elderly. When comparing fiscal 2017 to fiscal 2016, the Company generated total revenues of approximately $467.0 million compared to total revenues of approximately $447.4 million, respectively, representing an increase of approximately $19.5 million, or 4.4%. The increase in revenues primarily results from a full year of activity for the senior housing communities acquired by the Company during fiscal 2016 which resulted in an increase in revenue of approximately $15.3 million and we experienced an increase in revenue at our same-store communities of approximately $4.3 million. The increase in revenue at our same-store communities during fiscal 2017 was negatively impacted by Hurricane Harvey which resulted in the full evacuation of our residents at two of our senior housing communities located in southeast Texas. Both of these communities are undergoing repairs and remain fully vacated which resulted in a decrease of approximately $3.5 million in our same-store revenue during fiscal 2017.
32
Excluding the two senior housing communities impacted by Hurricane Harvey, the weighted average financial occupancy rate for each of our consolidated and same-store communities for the fiscal years ended December 31, 2017 and 2016 was 86.8% and 87.9%, respectively. Although each of our consolidated and same-store occupancies declined, we achieved an increase in average monthly rental rates at our consolidated and same-store communities when comparing fiscal 2017 to fiscal 2016 of 3.3% and 2.8%, respectively. The increase in average monthly rental rates during fiscal 2017 was primarily the result of our recent senior housing community acquisitions, annual rent increases for our existing residents, and the capital improvements we have invested in our communities for unit conversions which enable us to provide a broader range of senior living services at higher levels of care.
On December 15, 2017, the Company completed supplemental mortgage financing of approximately $4.1 million from Fannie Mae at a fixed interest rate of 5.71% on one community located in Oneonta, New York. The supplemental mortgage loan is coterminous, cross-collateralized and cross-defaulted with the original existing mortgage debt maturing in June 2025.
On November 30, 2017, the Company completed supplemental mortgage financing of approximately $3.0 million from Fannie Mae at a fixed interest rate of 5.49% on one community located in Rocky River, Ohio. The supplemental mortgage loan is coterminous, cross-collateralized and cross-defaulted with the original existing mortgage debt maturing in January 2023.
The Company had two of its senior housing communities located in southeast Texas impacted by Hurricane Harvey during the third quarter of fiscal 2017. Both of these communities remain fully vacated and are undergoing repairs. We maintain insurance coverage on these communities which includes damage caused by flooding. The insurance claim for this incident required a deductible of $100,000 that was expensed as a component of operating expenses in the Company’s Consolidated Statement of Operations and Comprehensive Loss in the third quarter of fiscal 2017. Through December 31, 2017, we have incurred approximately $3.9 million in clean-up and physical repair costs and we expect to incur additional repair costs which we believe are probable of being recovered through insurance proceeds. In addition to the repairs of physical damage to the buildings, the Company’s insurance coverage includes loss of business income (“Business Interruption”). Business Interruption includes reimbursement for lost revenue as well as incremental expenses incurred as a result of the hurricane. The Company received payments from our insurance underwriters during fiscal 2017 totaling approximately $2.7 million of which approximately $2.2 million related to Business Interruption through December 31, 2017, which has been included as a reduction to operating expenses in the Company’s Consolidated Statement of Operations and Comprehensive Loss in fiscal 2017. Based upon our initial assessment of the physical damages and insurance coverage, the Company currently estimates insurance proceeds will be sufficient to reimburse the Company for all damages and repair costs to fully restore the communities to their condition prior to the incident.
Effective January 31, 2017, the Company acquired the underlying real estate associated with four of the senior housing communities previously leased from Ventas, Inc. (“Ventas”) for an acquisition price of $85.0 million (the “Four Property Lease Transaction”). The Company obtained interest only, bridge financing from Berkadia Commercial Mortgage LLC (“Berkadia”) for $65.0 million of the acquisition price with an initial variable interest rate of LIBOR plus 4.0% and a 36-month term, with the balance of the acquisition price paid from the Company’s existing cash resources. For additional information refer to Note 3, “Acquisitions”, within the notes to consolidated financial statements.
Facility Leases
As of December 31, 2017, the Company leased 46 senior housing communities from certain real estate investment trusts (“REITs”). The lease terms are generally for 10-15 years with renewal options for 5-20 years at the Company’s option. Under these lease agreements, the Company is responsible for all operating costs, maintenance and repairs, insurance and property taxes. No new facility leases were entered into by the Company during fiscal 2017.
33
As of December 31, 2017, the Company leased 7 senior housing communities (collectively the “Ventas Lease Agreements”) from Ventas, Inc. (“Ventas”). Effective January 31, 2017, the Company closed the Four Property Lease Transaction and acquired from Ventas the underlying real estate associated with four of its operating leases for a total acquisition price of $85.0 million. The Company obtained interim, interest only, bridge financing from Berkadia for $65.0 million of the acquisition price with an initial variable interest rate of LIBOR plus 4.0% and a 36-month term, with the balance of the acquisition price paid from the Company’s existing cash resources. For additional information refer to Note 3, “Acquisitions”, within the notes to consolidated financial statements. Prior to the Four Property Lease Transaction, the Company previously leased 11 senior housing communities from Ventas.
During the second quarter of fiscal 2015, the Company executed amendments to the master lease agreements with Ventas to facilitate up to $24.5 million of leasehold improvements for 10 communities within the Ventas lease portfolio and extend the lease terms until September 30, 2025, with two five-year renewal extensions available at the Company’s option. During the second quarter of fiscal 2016, the Company executed amendments to the master lease agreements with Ventas to increase the Special Project Funds for leasehold improvements from $24.5 million to $28.5 million and extend the date for completion of the leasehold improvements to June 30, 2017. During fiscal 2017, the Company executed amendments to the master lease agreements with Ventas to decrease the Special Project Funds for leasehold improvements from $28.5 million to approximately $17.0 million due to the Four Property Lease Transaction and extend the date for completion of the leasehold improvements to June 30, 2018. The initial lease rates under each of the Ventas Lease Agreements ranged from 6.75% to 8% and are subject to certain conditional escalation clauses which will be recognized when probable or incurred. The Company initially incurred $11.4 million in lease acquisition and modification costs related to the Ventas Lease Agreements, of which a portion of these costs were written-off upon closing the Four Property Lease Transaction leaving $8.7 million in lease acquisition and modification costs associated with the remaining properties. These deferred lease acquisition and modification costs are being amortized over the lease terms and are included in facility lease expense in the Company’s Consolidated Statement of Operations and Comprehensive Loss. The Company accounts for five of the Ventas Lease Agreements as an operating lease and two as a capital lease and financing obligation.
As of December 31, 2017, the Company leased 15 senior housing communities (collectively the “HCP Lease Agreements”) from HCP, Inc. (“HCP”). During the fourth quarter of fiscal 2013, the Company executed an amendment to the master lease agreement with HCP to facilitate up to $3.3 million of leasehold improvements for one community within the HCP lease portfolio and extend the initial lease terms for nine communities until October 31, 2020, with two 10-year renewal extensions available at the Company’s option. During the second quarter of fiscal 2015, the Company exercised its right to extend the lease term with HCP for the remaining six communities in the HCP lease portfolio until April 30, 2026, with one 10-year renewal extension available at the Company’s option. The initial lease rates under the HCP Lease Agreements ranged from 7.25% to 8% and are subject to certain conditional escalation clauses, which will be recognized when probable or incurred. The Company incurred $1.6 million in lease acquisition and modification costs related to the HCP Lease Agreements. These deferred lease acquisition and modification costs are being amortized over the lease terms and are included in facility lease expense in the Company’s Consolidated Statements of Operations and Comprehensive Loss. The Company accounts for each of the HCP Lease Agreements as an operating lease.
As of December 31, 2017, the Company leased 24 senior housing communities (collectively the “Welltower Lease Agreements”) from Welltower, Inc., formerly Health Care REIT, Inc. (“Welltower”). The Welltower Lease Agreements each have an initial term of 15 years, with one 15-year renewal extension available at the Company’s option. The initial lease rates under the Welltower Lease Agreements ranged from 7.25% to 8.5% and are subject to certain conditional escalation clauses, which will be recognized when probable or incurred. The initial terms on the Welltower Lease Agreements expire on various dates through April 2026. The Company incurred $2.1 million in lease acquisition costs related to the Welltower Lease Agreements. These deferred lease acquisition costs are being amortized over the lease terms and are included in facility lease expense in the Company’s Consolidated Statements of Operations and Comprehensive Loss. The Company accounts for each of the Welltower Lease Agreements as an operating lease.
34
The following table summarizes each of the Company’s facility lease agreements as of December 31, 2017 (dollars in millions):
|
Landlord |
|
Initial Date of Lease |
|
Number of Communities |
|
|
Value of Transaction |
|
|
Current Expiration and Renewal Term |
|
Initial Lease Rate(1) |
|
|
Lease Acquisition and Modification Costs(2) |
|
|
Deferred Gains / Lease Concessions(3) |
|
|||||
|
Ventas |
|
September 30, 2005 |
|
|
4 |
|
|
$ |
61.4 |
|
|
September 30, 2025 (4) (Two five-year renewals) |
|
|
8 |
% |
|
$ |
7.7 |
|
|
$ |
4.2 |
|
|
Ventas |
|
January 31, 2008 |
|
|
1 |
|
|
|
5.0 |
|
|
September 30, 2025 (4) (Two five-year renewals) |
|
|
7.75 |
% |
|
|
0.2 |
|
|
|
— |
|
|
Ventas |
|
June 27, 2012 |
|
|
2 |
|
|
|
43.3 |
|
|
September 30, 2025 (4) (Two five-year renewals) |
|
|
6.75 |
% |
|
|
0.8 |
|
|
|
— |
|
|
HCP |
|
May 1, 2006 |
|
|
3 |
|
|
|
54.0 |
|
|
October 31, 2020 (5) (Two 10-year renewals) |
|
|
8 |
% |
|
|
0.3 |
|
|
|
12.8 |
|
|
HCP |
|
May 31, 2006 |
|
|
6 |
|
|
|
43.0 |
|
|
April 30, 2026 (6) (One 10-year renewal) |
|
|
8 |
% |
|
|
0.2 |
|
|
|
0.6 |
|
|
HCP |
|
December 1, 2006 |
|
|
4 |
|
|
|
51.0 |
|
|
October 31, 2020 (5) (Two 10-year renewals) |
|
|
8 |
% |
|
|
0.7 |
|
|
|
— |
|
|
HCP |
|
December 14, 2006 |
|
|
1 |
|
|
|
18.0 |
|
|
October 31, 2020 (5) (Two 10-year renewals) |
|
|
7.75 |
% |
|
|
0.3 |
|
|
|
— |
|
|
HCP |
|
April 11, 2007 |
|
|
1 |
|
|
|
8.0 |
|
|
October 31, 2020 (5) (Two 10-year renewals) |
|
|
7.25 |
% |
|
|
0.1 |
|
|
|
— |
|
|
Welltower |
|
April 16, 2010 |
|
|
5 |
|
|
|
48.5 |
|
|
April 30, 2025 (15 years) (One 15-year renewal) |
|
|
8.25 |
% |
|
|
0.6 |
|
|
|
0.8 |
|
|
Welltower |
|
May 1, 2010 |
|
|
3 |
|
|
|
36.0 |
|
|
April 30, 2025 (15 years) (One 15-year renewal) |
|
|
8.25 |
% |
|
|
0.2 |
|
|
|
0.4 |
|
|
Welltower |
|
September 10, 2010 |
|
|
12 |
|
|
|
104.6 |
|
|
September 30, 2025 (15 years) (One 15-year renewal) |
|
|
8.50 |
% |
|
|
0.4 |
|
|
|
2.0 |
|
|
Welltower |
|
April 8, 2011 |
|
|
4 |
|
|
|
141.0 |
|
|
April 30, 2026 (15 years) (One 15-year renewal) |
|
|
7.25 |
% |
|
|
0.9 |
|
|
|
16.3 |
|
|
Subtotal |
|
|
|
|
|
|
|
|
|
|
|
|
|
|
|
|
|
|
12.4 |
|
|
|
37.1 |
|
|
Accumulated amortization through December 31, 2017 |
|
|
|
|
|
|
(7.2 |
) |
|
|
— |
|
||||||||||||
|
Accumulated deferred gains / lease concessions recognized through December 31, 2017 |
|
|
|
— |
|
|
|
(24.2 |
) |
|||||||||||||||
|
Net lease acquisition costs / deferred gains / lease concessions as of December 31, 2017 |
|
|
$ |
5.2 |
|
|
$ |
12.9 |
|
|||||||||||||||
|
(1) |
Initial lease rates are measured against agreed upon fair market values and are subject to conditional lease escalation provisions as set forth in each respective lease agreement. |
|
(2) |
Lease acquisition and modification costs are being amortized over the respective lease terms. |
|
(3) |
Deferred gains of $34.5 million and lease concessions of $2.6 million are being recognized in the Company’s Consolidated Statements of Operations and Comprehensive Loss as a reduction in facility lease expense over the respective initial lease term. Lease concessions of $0.6 million relate to the transaction with HCP on May 31, 2006, and $2.0 million relate to the transaction with Welltower on September 10, 2010. |
|
(4) |
Effective June 17, 2015, the Company executed amendments to the master lease agreements with Ventas to facilitate leasehold improvements for 10 of the leased communities, of which the underlying real estate associated with four of its operating leases was acquired by the Company upon closing the Four Property Lease Transaction on January 31, 2017, and extend the lease terms through September 30, 2025, with two five-year renewal extensions available at the Company’s option. |
35
|
(6) |
On April 24, 2015, the Company exercised its right to extend the lease terms with HCP through April 30, 2026, with one 10-year renewal extension remaining available at the Company’s option. |
Facility lease expense in the Company’s Consolidated Statements of Operations and Comprehensive Loss includes rent expense plus amortization expense relating to leasehold acquisition costs offset by the amortization of deferred gains and lease incentives. There are various financial covenants and other restrictions in the Company’s lease agreements. The Company was in compliance with all of its lease covenants at December 31, 2017 and 2016.
Debt Transactions
On December 15, 2017, the Company completed supplemental mortgage financing of approximately $4.1 million from Fannie Mae at a fixed interest rate of 5.71% on one community located in Oneonta, New York. The supplemental mortgage loan is coterminous, cross-collateralized and cross-defaulted with the original existing mortgage debt maturing in June 2025.
On December 1, 2017, the Company renewed certain insurance policies and entered into a finance agreement totaling approximately $3.5 million. The finance agreement has a fixed interest rate of 3.04% with the principal being repaid over an 11-month term.
On November 30, 2017, the Company completed supplemental mortgage financing of approximately $3.0 million from Fannie Mae at a fixed interest rate of 5.49% on one community located in Rocky River, Ohio. The supplemental mortgage loan is coterminous, cross-collateralized and cross-defaulted with the original existing mortgage debt maturing in January 2023.
On May 31, 2017, the Company renewed certain insurance policies and entered into a finance agreement totaling approximately $1.6 million. The finance agreement has a fixed interest rate of 2.76% with the principal being repaid over an 11-month term.
On January 31, 2017, in conjunction with the Four Property Lease Transaction, the Company obtained $65.0 million of mortgage debt from Berkadia. The new mortgage loan is interest-only and has a three-year term with an initial variable interest rate of LIBOR plus 4.00%.
The Company issued standby letters of credit with Wells Fargo Bank (“Wells Fargo”), totaling approximately $3.9 million, for the benefit of Hartford Financial Services (“Hartford”) associated with the administration of workers compensation.
The Company issued standby letters of credit with JPMorgan Chase Bank (“Chase”), totaling approximately $6.7 million, for the benefit of Welltower, on certain leases between Welltower and the Company.
The Company issued standby letters of credit with Chase, totaling approximately $2.9 million, for the benefit of HCP on certain leases between HCP and the Company.
Critical Accounting Policies
The preparation of financial statements in conformity with accounting principles generally accepted in the United States requires management to make estimates and assumptions that affect the amounts reported in the accompanying financial statements and related notes. Management bases its estimates and assumptions on historical experience, observance of industry trends and various other sources of information and factors, the results of which form the basis for making judgments about the carrying value of assets and liabilities that are not readily apparent from other sources. Actual results could differ from these estimates. Critical accounting policies are defined as those that are reflective of significant judgments and uncertainties, and potentially could result in materially different results under different assumptions and conditions. The Company believes the following are our most critical accounting policies and/or typically require management’s most difficult, subjective and complex judgments.
36
Resident revenue is recognized at estimated net realizable amounts, based on historical experiences, due from residents in the period to which the rental and other services are provided. Additionally, substantially all community fees received from residents are non-refundable and are recorded initially by the Company as deferred revenue. The deferred amounts are amortized over the respective residents’ initial lease term which is consistent with the contractual obligation associated with the estimated stay of the resident.
Revenues from the Medicaid program accounted for approximately 5.6% of the Company’s revenue in fiscal 2017, 5.5% of the Company’s revenue in fiscal 2016, and 4.6% of the Company’s revenue in fiscal 2015. During fiscal 2017, 2016, and 2015, 41, 40, and 34, respectively, of the Company’s communities were providers of services under Medicaid programs. Accordingly, these communities were entitled to reimbursement under the foregoing program at established rates that were lower than private pay rates. Patient service revenue for Medicaid patients was recorded at the reimbursement rates as the rates were set prospectively by the applicable state upon the filing of an annual cost report. None of the Company’s communities were providers of services under the Medicare program during fiscal 2017, 2016, or 2015.
Laws and regulations governing the Medicaid program are complex and subject to interpretation. The Company believes that it is in compliance with all applicable laws and regulations and is not aware of any pending or threatened investigations involving allegations of potential wrongdoing. While no such regulatory inquiries have been made, compliance with such laws and regulations can be subject to future government review and interpretation as well as significant regulatory action including fines, penalties, and exclusion from the Medicaid program.
Purchase Accounting
In determining the allocation of the purchase price of senior housing communities acquired to net tangible and identified intangible assets acquired and liabilities assumed, if any, the Company makes estimates of fair value using information obtained as a result of pre-acquisition due diligence, leasing activities and/or independent appraisals. The Company assigns the purchase price for senior living communities to assets acquired and liabilities assumed based on their estimated fair values which are determined in accordance with the provisions of ASC 805, Business Combinations. The determination of fair value involves the use of significant judgments and estimates which is generally assessed as follows:
The Company allocates the fair values of buildings acquired on an as-if-vacant basis and depreciates the building values over the estimated remaining lives of the buildings, not to exceed 40 years. The Company determines the allocated values of other fixed assets, such as site improvements and furniture, fixtures and equipment, based upon the replacement cost and depreciates such values over the assets’ estimated remaining useful lives as determined at the acquisition date. The Company determines the value of land by considering the sales prices of similar properties in recent transactions.
The fair value of acquired lease-related intangibles reflects the estimated fair value of existing resident in-place leases as represented by the cost to obtain residents and an estimated absorption period to reflect the value of the rent and recovery costs foregone during a reasonable lease-up period as if the property acquired was vacant. The Company amortizes any acquired resident in-place lease intangibles to depreciation and amortization expense over the estimated remaining useful life of the respective resident operating leases.
Credit Risk and Allowance for Doubtful Accounts
The Company’s resident receivables are generally due within 30 days from the date billed. Accounts receivable are reported net of an allowance for doubtful accounts of $4.9 million and $4.3 million at December 31, 2017 and 2016, respectively, and represent the Company’s estimate of the amount that ultimately will be collected. The adequacy of the Company’s allowance for doubtful accounts is reviewed on an ongoing basis, using historical payment trends, write-off experience, analyses of receivable portfolios by payor source and aging of receivables, as well as a review of specific accounts, and adjustments are made to the allowance as necessary. Credit losses on resident receivables have historically been within management’s estimates, and management believes that the allowance for doubtful accounts adequately provides for expected losses.
37
Off-Balance Sheet Arrangements
The Company had no material off-balance sheet arrangements at December 31, 2017.
Lease Accounting
The Company determines whether to account for its leases as operating, capital or financing leases depending on the underlying terms of each lease agreement. This determination of classification requires significant judgment relating to certain information, including the estimated fair value and remaining economic life of the community, the Company’s cost of funds, minimum lease payments and other lease terms. The lease rates under the Company’s lease agreements are subject to certain conditional escalation clauses which are recognized when probable or incurred and are based on changes in the consumer price index or certain operational performance measures. As of December 31, 2017 and 2016, the Company leased 46 and 50 communities, respectively, two of which the Company classified as capital lease and financing obligations with the remaining classified as operating leases. The Company incurs lease acquisition costs and amortizes these costs over the term of the respective lease agreement. Certain leases entered into by the Company qualified as sale/leaseback transactions, and as such, any related gains have been deferred and are being amortized over the respective lease term. No new communities were leased by the Company during fiscal 2017 or 2016. Effective January 31, 2017, the Company acquired from Ventas the underlying real estate associated with four of its operating leases. For additional information refer to Note 3, “Acquisitions”, within the notes to consolidated financial statements.
Facility lease expense in the Company’s Consolidated Statements of Operations and Comprehensive loss includes rent expense plus amortization expense relating to leasehold acquisition costs offset by the amortization of deferred gains and lease incentives.
Employee Health and Dental Benefits, Workers’ Compensation, and Insurance Reserves
The Company offers certain full-time employees an option to participate in its health and dental plans. The Company is self-insured up to certain limits and is insured if claims in excess of these limits are incurred. The cost of employee health and dental benefits, net of employee contributions, is shared between the corporate office and the senior housing communities based on the respective number of plan participants. Funds collected are used to pay the actual program costs including estimated annual claims, third-party administrative fees, network provider fees, communication costs, and other related administrative costs incurred by the plans. Claims are paid as they are submitted to the Company’s third-party administrator. The Company records a liability for outstanding claims and claims that have been incurred but not yet reported. This liability is based on the historical claim reporting lag and payment trends of health insurance claims. Management believes that the liability for outstanding losses and expenses is adequate to cover the ultimate cost of losses and expenses incurred at December 31, 2017; however, actual claims and expenses may differ. Any subsequent changes in estimates are recorded in the period in which they are determined.
The Company uses a combination of insurance and self-insurance for workers’ compensation. Determining the reserve for workers’ compensation losses and costs that the Company has incurred as of the end of a reporting period involves significant judgments based on projected future events, including potential settlements for pending claims, known incidents which may result in claims, estimates of incurred but not yet reported claims, changes in insurance premiums, estimated litigation costs and other factors. The Company regularly adjusts these estimates to reflect changes in the foregoing factors. However, since this reserve is based on estimates, the actual expenses incurred may differ from the amounts reserved. Any subsequent changes in estimates are recorded in the period in which they are determined.
Long-Lived Assets
Property and equipment are stated at cost and depreciated on a straight-line basis over the estimated useful lives of the assets. At each balance sheet date, the Company reviews the carrying value of its property and equipment to determine if facts and circumstances suggest that they may be impaired or that the depreciation period may need to be changed. The Company considers internal factors such as net operating losses along with external factors relating to each asset, including contract changes, local market developments, and other publicly available information. If an indicator of impairment is identified, the carrying value of a long-lived asset is considered impaired when the anticipated undiscounted cash flows from such asset is separately identifiable and is less than its carrying value. In that event, a loss is recognized based on the amount the carrying value exceeds the fair market value, generally based on discounted cash
38
flows, of the long-lived asset. The Company does not believe there are any indicators of impairment that would require an adjustment to the carrying value of the property and equipment or their remaining useful lives as of December 31, 2017 and 2016.
Income Taxes
Income taxes are computed using the asset and liability method and current income taxes are recorded based on amounts refundable or payable in the current year. Deferred income taxes are recorded based on the estimated future tax effects of loss carryforwards and temporary differences between financial statement carrying amounts of existing assets and liabilities and their respective tax basis. Deferred tax assets and liabilities are measured using enacted tax rates that are expected to apply to taxable income in the years in which we expect those carryforwards and temporary differences to be recovered or settled. Management regularly evaluates the future realization of deferred tax assets and provides a valuation allowance, if considered necessary, based on such evaluation. As part of the evaluation, management has evaluated taxable income in carryback years, future reversals of taxable temporary differences, feasible tax planning strategies, and future expectations of income. Based upon this evaluation, a valuation allowance has been recorded to reduce the Company’s net deferred tax assets to the amount that is more likely than not to be realized. However, in the event that we were to determine that it would be more likely than not that the Company would realize the benefit of deferred tax assets in the future in excess of their net recorded amounts, adjustments to deferred tax assets would increase net income in the period we made such a determination. The benefits of the net deferred tax assets might not be realized if actual results differ from expectations. The effective tax rates for fiscal 2017 and 2016 differ from the statutory tax rates due to state income taxes, permanent tax differences, and changes in the deferred tax asset valuation allowance. The Company is impacted by the Texas Margin Tax (“TMT”), which effectively imposes tax on modified gross revenues for communities within the State of Texas. During each of fiscal 2017 and 2016, the Company consolidated 38 Texas communities and the TMT increased the overall provision for income taxes.
The Company evaluates uncertain tax positions through consideration of accounting and reporting guidance on criteria, measurement, derecognition, classification, interest and penalties, accounting in interim periods, disclosure, and transition that is intended to provide better financial-statement comparability among different companies. The Company is required to recognize a tax benefit in its financial statements for an uncertain tax position only if management’s assessment is that its position is “more likely than not” (i.e., a greater than 50 percent likelihood) to be upheld on audit based only on the technical merits of the tax position. The Company’s policy is to recognize interest related to unrecognized tax benefits as interest expense and penalties as income tax expense. The Company is generally no longer subject to federal and state income tax audits for years prior to 2014.
Recently Issued Accounting Guidance
In January 2017, the Financial Accounting Standards Board (“FASB”) issued Accounting Standards Update (“ASU”) 2017-01, Business Combinations – Clarifying the Definition of a Business. ASU 2017-01 provides guidance in accounting for business combinations when determining if the transaction represents acquisitions or disposals of assets or of a business. Under ASU 2017-01, when determining whether an integrated set of assets and activities constitutes a business, entities must compare the fair value of gross assets acquired to the fair value of a single identifiable asset or group of similar identifiable assets. If substantially all of the fair value of the gross assets acquired (or disposed of) is concentrated in the single identifiable assets or group of similar identifiable assets, the integrated set of assets and activities is not characterized as a business. ASU 2017-01 is applied prospectively and is effective for fiscal years beginning after December 15, 2017, and interim periods within those fiscal years. Early application is permitted. Management does not expect the adoption of ASU 2017-01 to have a material impact on the Company’s financial position, results of operations or cash flows.
39
In November 2016, the FASB issued ASU 2016-18, Statement of Cash Flows (Topic 230): Restricted Cash (a consensus of the FASB Emerging Issues Task Force). ASU 2016-18 requires an entity to include in its cash and cash-equivalent balances in the statement of cash flows those amounts that are deemed to be restricted cash and restricted cash equivalents. ASU 2016-18 is effective for interim and annual reporting periods beginning after December 15, 2017. Management does not expect the adoption of ASU 2016-18 to have a material impact on the Company’s cash flows.
In August 2016, the FASB issued ASU 2016-15, Classification of Certain Cash Receipts and Cash Payments. ASU 2016-15 amends the guidance in Accounting Standards Codification (“ASC”) 230, which often requires judgment to determine the appropriate classification of cash flows as operating, investing or financing activities and has resulted in diversity in practice in how certain cash receipts and cash payments are classified. ASU 2016-15 is effective for interim and annual reporting periods beginning after December 15, 2017 and should be applied on a retrospective basis. Management does not expect the adoption of ASU 2016-15 to have a material impact on the Company’s cash flows.
In March 2016, the FASB issued ASU 2016-09, Improvements to Employee Share-based Payment Accounting. ASU 2016-09 simplifies several aspects of the accounting for share-based payment transactions, including the income tax consequences, classification of awards as either equity or liabilities, and classification on the statement of cash flows. The amendments in ASU 2016-09 are effective for annual periods beginning after December 15, 2016, and interim periods within those annual periods. The Company adopted the provisions of ASU 2016-09 on January 1, 2017, and incorporated the provisions of this update into its consolidated financial statements upon adoption. Upon adoption, the Company elected to change its accounting policy to account for forfeitures as they occur. This change was applied on a modified retrospective basis with a cumulative effect adjustment to retained earnings of $0.2 million. Additionally, the adoption of ASU 2016-09 resulted in the Company recording an adjustment of $5.3 million, which resulted in an increase to the Company’s deferred tax asset valuation allowance, to recognize net operating loss carryforwards attributable to excess tax benefits on stock compensation that had not been previously recognized to additional paid in capital. Excess tax benefits for share-based payments are now included in net operating activities rather than net financing activities within the Company’s Consolidated Statements of Cash Flows. As a result of the adoption of ASU 2016-09, these reporting changes have been applied prospectively and prior periods have not been adjusted.
In February 2016, the FASB issued ASU 2016-02, Leases. ASU 2016-02 amends the existing accounting standards for lease accounting, including requiring lessees to recognize most leases on their balance sheets and making targeted changes to lessor accounting. ASU 2016-02 will be effective beginning in 2019. Early adoption of ASU 2016-02 as of its issuance is permitted. The new leases standard requires a modified retrospective transition approach for all leases existing at, or entered into after, the date of initial application, with an option to use certain transition relief. The Company is currently evaluating the impact of adopting the new leases standard on the Company’s consolidated financial statements.
In May 2014, the FASB issued ASU 2014-09, Revenue from Contracts with Customers. ASU 2014-09 affects any entity that either enters into contracts with customers to transfer goods or services or enters into contracts for the transfer of nonfinancial assets. Under ASU 2014-09, an entity will recognize revenue when it transfers promised goods or services to customers in an amount that reflects what it expects in exchange for the goods or services. ASU 2014-09 is effective for annual periods beginning after December 15, 2017. The Company has evaluated the impact the adoption of ASU 2014-09 will have on the Company’s consolidated financial statements and disclosures. Based on our assessment, we do not believe it will have a significant impact on the Company’s consolidated financial statements. The Company is planning to adopt the standard under the modified retrospective adoption.
40
The following tables set forth, for the periods indicated, selected historical Consolidated Statements of Operations and Comprehensive Loss data in thousands of dollars and expressed as a percentage of total revenues.
|
|
|
Year Ended December 31, |
|
|||||||||||||||||||||
|
|
|
2017 |
|
|
2016 |
|
|
2015 |
|
|||||||||||||||
|
|
|
$ |
|
|
% |
|
|
$ |
|
|
% |
|
|
$ |
|
|
% |
|
||||||
|
Revenues: |
|
|
|
|
|
|
|
|
|
|
|
|
|
|
|
|
|
|
|
|
|
|
|
|
|
Resident revenue |
|
$ |
466,997 |
|
|
|
100.0 |
% |
|
$ |
447,448 |
|
|
|
100.0 |
% |
|
$ |
412,177 |
|
|
|
100.0 |
% |
|
Expenses: |
|
|
|
|
|
|
|
|
|
|
|
|
|
|
|
|
|
|
|
|
|
|
|
|
|
Operating expenses (exclusive of facility lease expense and depreciation and amortization expense shown below) |
|
|
290,662 |
|
|
|
62.2 |
|
|
|
273,899 |
|
|
|
61.2 |
|
|
|
248,736 |
|
|
|
60.3 |
|
|
General and administrative expenses |
|
|
23,574 |
|
|
|
5.0 |
|
|
|
23,671 |
|
|
|
5.3 |
|
|
|
20,351 |
|
|
|
4.9 |
|
|
Facility lease expense |
|
|
56,432 |
|
|
|
12.1 |
|
|
|
61,718 |
|
|
|
13.8 |
|
|
|
61,213 |
|
|
|
14.9 |
|
|
Loss on facility lease termination |
|
|
12,858 |
|
|
|
2.8 |
|
|
|
— |
|
|
|
— |
|
|
|
— |
|
|
|
— |
|
|
Provision for bad debts |
|
|
1,748 |
|
|
|
0.4 |
|
|
|
1,727 |
|
|
|
0.4 |
|
|
|
1,192 |
|
|
|
0.3 |
|
|
Stock-based compensation expense |
|
|
7,682 |
|
|
|
1.6 |
|
|
|
11,645 |
|
|
|
2.6 |
|
|
|
8,833 |
|
|
|
2.1 |
|
|
Depreciation and amortization expense |
|
|
66,199 |
|
|
|
14.2 |
|
|
|
60,398 |
|
|
|
13.5 |
|
|
|
53,017 |
|
|
|
12.9 |
|
|
Total expenses |
|
|
459,155 |
|
|
|
98.3 |
|
|
|
433,058 |
|
|
|
96.8 |
|
|
|
393,342 |
|
|
|
95.4 |
|
|
Income from operations |
|
|
7,842 |
|
|
|
1.7 |
|
|
|
14,390 |
|
|
|
3.2 |
|
|
|
18,835 |
|
|
|
4.6 |
|
|
Other income (expense): |
|
|
|
|
|
|
|
|
|
|
|
|
|
|
|
|
|
|
|
|
|
|
|
|
|
Interest income |
|
|
73 |
|
|
|
0.0 |
|
|
|
67 |
|
|
|
0.0 |
|
|
|
53 |
|
|
|
0.0 |
|
|
Interest expense |
|
|
(49,471 |
) |
|
|
(10.6 |
) |
|
|
(42,207 |
) |
|
|
(9.4 |
) |
|
|
(35,732 |
) |
|
|
(8.7 |
) |
|
Write-off of deferred loan costs and prepayment premium |
|
|
— |
|
|
|
— |
|
|
|
— |
|
|
|
— |
|
|
|
(2,766 |
) |
|
|
(0.7 |
) |
|
(Loss) Gain on disposition of assets, net |
|
|
(123 |
) |
|
|
(0.0 |
) |
|
|
(65 |
) |
|
|
(0.0 |
) |
|
|
6,225 |
|
|
|
1.5 |
|
|
Other income |
|
|
7 |
|
|
|
0.0 |
|
|
|
233 |
|
|
|
0.0 |
|
|
|
1 |
|
|
|
0.0 |
|
|
Loss before provision for income taxes |
|
|
(41,672 |
) |
|
|
(8.9 |
) |
|
|
(27,582 |
) |
|
|
(6.2 |
) |
|
|
(13,384 |
) |
|
|
(3.3 |
) |
|
Provision for income taxes |
|
|
(2,496 |
) |
|
|
(0.5 |
) |
|
|
(435 |
) |
|
|
(0.1 |
) |
|
|
(900 |
) |
|
|
(0.2 |
) |
|
Net loss and comprehensive loss |
|
$ |
(44,168 |
) |
|
|
(9.4 |
)% |
|
$ |
(28,017 |
) |
|
|
(6.3 |
)% |
|
$ |
(14,284 |
) |
|
|
(3.5 |
)% |
Year Ended December 31, 2017 Compared to the Year Ended December 31, 2016
Revenues
Resident revenue was $467.0 million for the year ended December 31, 2017, compared to $447.4 million for the year ended December 31, 2016, representing an increase of $19.5 million, or 4.4%. The increase in resident revenue primarily results from an increase of $15.3 million from a full year of activity for the senior housing communities acquired by the Company during fiscal 2016 and an increase of $4.3 million due to a 2.8% increase in average monthly rental rates at the Company’s same-store communities which was primarily the result of annual rent increases for our existing residents and recent capital improvements we have invested in our communities for unit conversions which enable us to provide a broader range of senior living services at higher levels of care. The increase in resident revenue at our same-store communities was negatively impacted by Hurricane Harvey which resulted in the full evacuation of our residents at two of our communities located in southeast Texas. Both of these communities are undergoing repairs and remain fully vacated which resulted in a decrease in our same-store resident revenue of approximately $3.5 million.
41
Total expenses were $459.2 million during fiscal 2017 compared to $433.1 million during fiscal 2016, representing an increase of $26.1 million, or 6.0%. This increase is primarily the result of a $16.8 million increase in operating expenses, a $12.9 million loss on facility lease termination, and a $5.8 million increase in depreciation and amortization expense, slightly offset by a $5.3 million decrease in facility lease expense and a $4.0 million decrease in stock-based compensation expense.
|
|
• |
The increase in operating expenses primarily results from an increase of $11.6 million from a full year of activity for the senior housing communities acquired by the Company during fiscal 2016 and an increase of $5.2 million at the Company’s same-store communities primarily due to increased wages and benefits to employees for annual merit increases and incremental costs, including increased labor costs for additional staffing required for newly licensed memory care and assisted living units, to support changes in occupancy with more of our residents at higher levels of care. The increase in operating expenses at our same-store communities included a reduction of $2.2 million for insurance proceeds the Company received to cover Business Interruption through December 31, 2017, for the period the two communities located in southeast Texas were unoccupied due to Hurricane Harvey. |
|
|
• |
The $12.9 million loss on facility lease termination is due to the Four Property Lease Transaction that closed on January 31, 2017, whereby the Company acquired the underlying real estate associated with four of the senior housing communities previously leased from Ventas. For additional information, refer to Note 3, “Acquisitions”, within the notes to consolidated financial statements. |
|
|
• |
The increase in depreciation and amortization expense primarily results from an increase of $3.4 million from a full year of activity for the senior housing communities acquired by the Company during fiscal 2016 and an increase of $8.7 million due to an increase in depreciable assets at the Company’s same-store communities, partially offset by a decrease in in-place lease amortization of $6.3 million from senior housing communities acquired by the Company prior to fiscal 2016. |
|
|
• |
The decrease in facility lease expense primarily results from the Four Property Lease Transaction that closed on January 31, 2017. |
|
|
• |
The decrease in stock-based compensation expense results from the accelerated vesting of restricted stock awards for severance benefits associated with the passing of the Company’s Chief Operating Officer in the fourth quarter of fiscal 2016, the Company granting fewer shares of restricted stock to certain employees of the Company during fiscal 2017. |
Other income and expense
|
|
• |
Interest income generally reflects interest earned on the investment of cash balances and escrowed funds or interest associated with certain income tax refunds or property tax settlements. |
|
|
• |
Interest expense increased $7.3 million in fiscal 2017 when compared to fiscal 2016 primarily due to an increase of $2.0 million from a full year of activity for the additional mortgage debt associated with the senior housing communities acquired by the Company during fiscal 2016 and an increase of $5.2 million at the Company’s same-store communities due to the Four Property Lease Transaction that closed on January 31, 2017, additional mortgage debt for supplemental loans obtained by the Company during fiscal 2017, and a full year of activity for certain refinancings and supplemental loans obtained by the Company during fiscal 2016. |
|
|
• |
Other income in fiscal 2016 represents payments received by the Company associated with certain legal settlements. |
42
Provision for income taxes for fiscal 2017 was $2.5 million, or 6.0% of loss before income taxes, compared to a provision for income taxes of $0.4 million, or 1.6% of loss before income taxes, for fiscal 2016. The effective tax rates for fiscal 2017 and 2016 differ from the statutory tax rates due to state income taxes, permanent tax differences, and changes in the deferred tax asset valuation allowance. The Company is impacted by the Texas Margin Tax (“TMT”), which effectively imposes tax on modified gross revenues for communities within the State of Texas. During each of fiscal 2017 and 2016, the Company consolidated 38 Texas communities and the TMT increased the overall provision for income taxes. The increase in provision for income taxes for fiscal 2017 was attributable to an increase of $0.2 million for higher state income taxes with the remaining $1.9 million due to recent tax legislation changes associated with the Tax Cuts and Jobs Act (“TCJA”), which was enacted on December 22, 2017.
Management regularly evaluates the future realization of deferred tax assets and provides a valuation allowance, if considered necessary, based on such evaluation. As part of the evaluation, management has evaluated taxable income in carryback years, future reversals of taxable temporary differences, feasible tax planning strategies, and future expectations of income. Based upon this evaluation, adjustments to the deferred tax asset valuation allowance of $5.9 million and $8.6 million were recorded during fiscal 2017 and 2016, respectively, to reduce the Company’s net deferred tax assets to the amount that is more likely than not to be realized.
Net loss and comprehensive loss
As a result of the foregoing factors, the Company reported net loss and comprehensive loss of $(44.2 million) for the fiscal year ended December 31, 2017, compared to net loss and comprehensive loss of $(28.0 million) for the fiscal year ended December 31, 2016.
Year Ended December 31, 2016 Compared to the Year Ended December 31, 2015
Revenues
Resident revenue was $447.4 million for the fiscal year ended December 31, 2016, compared to $412.2 million for the fiscal year ended December 31, 2015, representing an increase of $35.3 million, or 8.6%. The increase in resident revenue primarily results from an increase of $31.0 million from the senior housing communities acquired by the Company during fiscal 2016 and a full year of activity for the senior housing communities acquired by the Company during fiscal 2015 and an increase of $6.8 million due to a 2.0% increase in average monthly rental rates at the Company’s same-store communities, slightly offset by a decrease of $2.6 million due to the Company’s sale of one of its senior housing communities located in Wichita, Kansas, (the “Sedgwick Sale Transaction”) and the Company’s sale of four senior housing communities located in Oklahoma City, Oklahoma, Shreveport, Louisiana, Southfield, Michigan, and Winston-Salem, North Carolina (the “Four Property Sale Transaction”), each of which closed in fiscal 2015.
Expenses
Total expenses were $433.1 million during fiscal 2016 compared to $393.3 million during fiscal 2015, representing an increase of $39.7 million, or 10.1%. This increase in expenses is primarily the result of a $25.2 million increase in operating expenses, a $7.4 million increase in depreciation and amortization expense, a $3.3 million increase in general and administrative expenses, a $2.8 million increase in stock-based compensation expense, a $0.5 million increase in provision for bad debts, and a $0.5 million increase in facility lease expense.
|
|
• |
The increase in operating expenses primarily results from an increase of $21.2 million from the senior housing communities acquired by the Company during fiscal 2016, a full year of activity for the senior housing communities acquired by the Company during fiscal 2015, and an increase of $6.0 million at the Company’s same-store communities primarily due to increased wages and benefits to employees for annual merit increases as well as the incremental costs to support changes in occupancy mix with more of our residents at higher levels of care, partially offset by a decrease of $2.0 million due to the Sedgwick Sale Transaction and Four Property Sale Transaction each of which closed in fiscal 2015. |
43
|
|
• |
The increase in general and administrative expenses primarily results from an increase of $1.8 million in employee insurance benefits and claims paid, which resulted in higher health insurance costs to the Company, an increase of $1.1 million for severance benefits associated with the passing of the Company’s Chief Operating Officer in the fourth quarter of fiscal 2016, and an increase of $0.4 million in wages and benefits for existing employee annual merit increases and additional employees hired during fiscal 2016. |
|
|
• |
The increase in stock-based compensation expense results from the accelerated vesting of restricted stock awards for severance benefits associated with the passing of the Company’s Chief Operating Officer in the fourth quarter of fiscal 2016, the Company granting additional shares of restricted stock and restricted stock units to certain employees and directors of the Company during fiscal 2016, some of which required accelerated expense recognition, and a full year of amortization for restricted stock awards and units granted during fiscal 2015. |
|
|
• |
The increase in facility lease expense primarily results from contingent annual rental rate escalations for certain existing facility leases. |
Other income and expense
|
|
• |
Interest income generally reflects interest earned on the investment of cash balances and escrowed funds or interest associated with certain income tax refunds or property tax settlements. |
|
|
• |
Interest expense increased $6.5 million in fiscal 2016 when compared to fiscal 2015 primarily due to an increase of $5.0 million from the additional mortgage debt associated with the senior housing communities acquired by the Company during fiscal 2016 and a full year of interest for the senior housing communities acquired by the Company during fiscal 2015 and an increase of $1.7 million at the Company’s consolidated same-store communities due to additional mortgage debt added by the Company associated with supplemental loans that occurred during fiscal 2016 and a full year of activity for certain refinancing’s and supplemental loans that occurred during fiscal 2015, slightly offset by a decrease of $0.2 million due to the Sedgwick Sale Transaction and Four Property Sale Transaction each of which closed in fiscal 2015. |
|
|
• |
Write-off of deferred loan costs and prepayment premiums in fiscal 2015 is primarily attributable to the early repayment of certain mortgage debt on the Company’s owned senior housing communities due to scheduled maturities and the opportunity to replace interim variable interest rate debt with long-term fixed interest rate financing. |
|
|
• |
Gain on disposition of assets in fiscal 2015 is primarily attributable to the Sedgwick Sale Transaction, slightly offset with final closing cost adjustments associated with the Four Property Sale Transaction. |
|
|
• |
Other income in fiscal 2016 primarily represents payments received by the Company associated with certain legal settlements. |
44
Provision for income taxes for fiscal 2016 was $0.4 million, or 1.6% of loss before provision for income taxes, compared to a provision for income taxes of $0.9 million, or 6.7% of loss before provision for income taxes, for fiscal 2015. The effective tax rates for fiscal 2016 and 2015 differ from the statutory tax rates due to state income taxes, permanent tax differences, and changes in the deferred tax asset valuation allowance. During fiscal 2015, the Company incurred $0.3 million in additional income taxes due to the taxable gain realized from the Four Property Sale Transaction. For income tax purposes, in conjunction with the Sedgwick Sale Transaction that closed in fiscal 2015 the Company executed a like-kind exchange and acquired a replacement property shortly after the sale which resulted in deferral of the gain without the Company incurring any current federal or state income tax liabilities. The Company is impacted by the TMT, which effectively imposes tax on modified gross revenues for communities within the State of Texas. During fiscal 2016 and 2015, the Company consolidated 38 and 37 Texas communities, respectively, and the TMT increased the overall provision for income taxes. Management regularly evaluates the future realization of deferred tax assets and provides a valuation allowance, if considered necessary, based on such evaluation. As part of the evaluation, management has evaluated taxable income in carryback years, future reversals of taxable temporary differences, feasible tax planning strategies, and future expectations of income. Based upon this evaluation, adjustments to the deferred tax asset valuation allowance of $8.6 million and $5.0 million were recorded during fiscal 2016 and 2015, respectively, to reduce the Company’s net deferred tax assets to the amount that is more likely than not to be realized.
Net loss and comprehensive loss
As a result of the foregoing factors, the Company reported net loss and comprehensive loss of $(28.0 million) for the fiscal year ended December 31, 2016, compared to net loss and comprehensive loss of $(14.3 million) for the fiscal year ended December 31, 2015.
Quarterly Results
The following table presents certain unaudited quarterly financial information for each of the four quarters ended December 31, 2017 and 2016. This information has been prepared on the same basis as the audited consolidated financial statements of the Company appearing elsewhere in this report and include, in the opinion of the Company’s management, all adjustments (consisting of normal recurring adjustments) necessary to present fairly the quarterly results when read in conjunction with the audited consolidated financial statements of the Company and the related notes thereto.
|
|
|
2017 Calendar Quarters |
|
|||||||||||||
|
|
|
First |
|
|
Second |
|
|
Third |
|
|
Fourth |
|
||||
|
|
|
(In thousands, except per share amounts) |
|
|||||||||||||
|
Total revenues |
|
$ |
115,990 |
|
|
$ |
116,718 |
|
|
$ |
117,318 |
|
|
$ |
116,971 |
|
|
(Loss) Income from operations |
|
|
(9,610 |
) |
|
|
4,691 |
|
|
|
4,513 |
|
|
|
8,248 |
|
|
Net loss and comprehensive loss |
|
|
(21,842 |
) |
|
|
(7,835 |
) |
|
|
(8,132 |
) |
|
|
(6,359 |
) |
|
Net loss per share, basic |
|
$ |
(0.75 |
) |
|
$ |
(0.27 |
) |
|
$ |
(0.28 |
) |
|
$ |
(0.22 |
) |
|
Net loss per share, diluted |
|
$ |
(0.75 |
) |
|
$ |
(0.27 |
) |
|
$ |
(0.28 |
) |
|
$ |
(0.22 |
) |
|
Weighted average shares outstanding, basic |
|
|
29,288 |
|
|
|
29,478 |
|
|
|
29,512 |
|
|
|
29,531 |
|
|
Weighted average shares outstanding, fully diluted |
|
|
29,288 |
|
|
|
29,478 |
|
|
|
29,512 |
|
|
|
29,531 |
|
|
|
|
2016 Calendar Quarters |
|
|||||||||||||
|
|
|
First |
|
|
Second |
|
|
Third |
|
|
Fourth |
|
||||
|
|
|
(In thousands, except per share amounts) |
|
|||||||||||||
|
Total revenues |
|
$ |
109,173 |
|
|
$ |
111,034 |
|
|
$ |
111,436 |
|
|
$ |
115,805 |
|
|
Income from operations |
|
|
4,153 |
|
|
|
5,793 |
|
|
|
3,686 |
|
|
|
758 |
|
|
Net loss and comprehensive loss |
|
|
(5,984 |
) |
|
|
(4,446 |
) |
|
|
(7,077 |
) |
|
|
(10,510 |
) |
|
Net loss per share, basic |
|
$ |
(0.21 |
) |
|
$ |
(0.15 |
) |
|
$ |
(0.24 |
) |
|
$ |
(0.36 |
) |
|
Net loss per share, diluted |
|
$ |
(0.21 |
) |
|
$ |
(0.15 |
) |
|
$ |
(0.24 |
) |
|
$ |
(0.36 |
) |
|
Weighted average shares outstanding, basic |
|
|
28,751 |
|
|
|
28,926 |
|
|
|
28,959 |
|
|
|
29,000 |
|
|
Weighted average shares outstanding, fully diluted |
|
|
28,751 |
|
|
|
28,926 |
|
|
|
28,959 |
|
|
|
29,000 |
|
45
Liquidity and Capital Resources
In addition to approximately $17.6 million of unrestricted cash balances on hand as of December 31, 2017, the Company’s principal sources of liquidity are expected to be cash flows from operations, supplemental debt financings, additional proceeds from debt refinancings, equity issuances, and/or proceeds from the sale of assets. The Company expects its available cash and cash flows from operations, supplemental debt financings, additional proceeds from debt refinancings, and proceeds from the sale of assets to be sufficient to fund its short-term working capital requirements. The Company’s long-term capital requirements, primarily for acquisitions and other corporate initiatives, could be dependent on its ability to access additional funds through joint ventures and the debt and/or equity markets. The Company from time to time considers and evaluates transactions related to its portfolio including supplemental debt financings, debt refinancings, equity issuances, purchases and sales of assets, reorganizations and other transactions. There can be no assurance that the Company will continue to generate cash flows at or above current levels or that the Company will be able to obtain the capital necessary to meet the Company’s short and long-term capital requirements.
Changes in the current economic environment could result in decreases in the fair value of assets, slowing of transactions, and tightening liquidity and credit markets. These impacts could make securing debt for acquisitions or refinancings for the Company, its joint ventures, or buyers of the Company’s properties more difficult or on terms not acceptable to the Company. Additionally, the Company may be more susceptible to being negatively impacted by operating or performance deficits based on the exposure associated with certain lease coverage requirements.
In summary, the Company’s cash flows were as follows (in thousands):
|
|
|
Year Ended December 31, |
|
|||||||||
|
|
|
2017 |
|
|
2016 |
|
|
2015 |
|
|||
|
Net cash provided by operating activities |
|
$ |
55,594 |
|
|
$ |
52,279 |
|
|
$ |
48,895 |
|
|
Net cash used in investing activities |
|
|
(124,940 |
) |
|
|
(201,049 |
) |
|
|
(161,427 |
) |
|
Net cash provided by financing activities |
|
|
52,966 |
|
|
|
126,709 |
|
|
|
129,410 |
|
|
(Decrease) Increase in cash and cash equivalents |
|
$ |
(16,380 |
) |
|
$ |
(22,061 |
) |
|
$ |
16,878 |
|
Operating Activities
The Company had net cash provided by operating activities of $55.6 million, $52.3 million, and $48.9 million in fiscal 2017, 2016, and 2015, respectively. The net cash provided by operating activities for fiscal 2017 primarily results from net non-cash charges of $96.0 million, a decrease in other assets of $4.1 million, an increase in other liabilities of $5.0 million, and an increase in accounts payable of $2.8 million, and in increase in accrued expenses of $1.7 million, partially offset by net loss of $(44.2 million), an increase in accounts receivable of $8.2 million, and a decrease in deferred resident revenue of $1.9 million. The net cash provided by operating activities for fiscal 2016 primarily results from net non-cash charges of $82.1 million, an increase in accrued expenses of $4.8 million and an increase in accounts payable of $1.7 million, partially offset by net loss of $(28.0 million), an increase in accounts receivable of $2.5 million, an increase in other assets of $2.2 million, an increase in prepaid expenses of $2.0 million, and a decrease in deferred resident revenue of $1.1 million. The net cash provided by operating activities for fiscal 2015 primarily results from net non-cash charges of $63.8 million, a decrease in prepaid expenses of $2.4 million, an increase in accounts payable and accrued expenses of $3.0 million, and an increase in deferred resident rent and customer deposits of $0.5 million, partially offset by net loss of $(14.3 million), an increase in accounts receivable of $2.9 million, an increase in property tax and insurance deposits of $2.2 million, and an increase in other assets of $1.3 million.
46
The Company had net cash used in investing activities of $124.9 million, $201.0 million, and $161.4 million in fiscal 2017, 2016, and 2015, respectively. The net cash used in investing activities for fiscal 2017 primarily results from capital expenditures of $40.0 million associated with ongoing capital renovations and refurbishments at the Company’s senior housing communities and the acquisition of senior housing communities by the Company of $85.0 million. The net cash used in investing activities for fiscal 2016 primarily results from capital expenditures of $62.4 million and acquisitions of senior housing communities by the Company of $138.8 million. The net cash used in investing activities for fiscal 2015 primarily results from capital expenditures of $42.4 million and acquisitions of senior housing communities by the Company of $162.5 million, partially offset by proceeds from the Sedgwick Sale Transaction and Four Property Sale Transaction of $43.5 million.
Financing Activities
The Company had net cash provided by financing activities of $53.0 million, $126.7 million, and $129.4 million in fiscal 2017, 2016, and 2015, respectively. The net cash provided by financing activities for fiscal 2017 primarily results from notes payable proceeds of $77.2 million, of which $65.0 million is related to new mortgage debt associated with the acquisition of senior housing communities by the Company, approximately $7.1 million related to supplemental mortgage debt obtained on the Company’s existing owned senior housing communities, and approximately $5.1 million related to insurance premium financing, partially offset by repayments of notes payable of $20.1 million, payments on capital lease and financing obligations of $2.9 million, and deferred financing charges paid of $1.2 million associated with the acquisition of senior housing communities by the Company. The net cash provided by financing activities for fiscal 2016 primarily results from notes payable proceeds of $150.8 million, of which approximately $101.5 million is related to new mortgage debt associated with the acquisition of senior housing communities by the Company, approximately $44.4 million related to supplemental mortgage debt obtained on existing senior housing communities, and approximately $4.9 million related to insurance premium financing, partially offset by repayments of notes payable of $17.7 million, purchases of treasury stock of $2.5 million, deferred financing charges paid of $2.5 million, and payments on capital lease and financing obligations of $1.3 million. The net cash provided by financing activities for fiscal 2015 primarily results from notes payable proceeds of $250.9 million, of which approximately $118.1 million is related to new mortgage debt associated with the acquisition of senior housing communities by the Company, approximately $2.2 million related to insurance premium financing, and the remaining $130.6 million resulted from supplemental financings, mortgage refinancings, or new mortgage debt obtained on existing unencumbered senior housing communities, partially offset by repayments of notes payable of $115.9 million, deferred financing charges paid of $3.8 million, payments on capital lease and financing obligations of $1.0 million, and additions to restricted cash of $0.9 million.
Disclosures About Contractual Obligations
The following table provides the amounts due under specified contractual obligations for the periods indicated as of December 31, 2017 (in thousands):
|
|
|
Less Than One Year |
|
|
One to Three Years |
|
|
Three to Five Years |
|
|
More Than Five Years |
|
|
Total |
|
|||||
|
Long-term debt, including interest expense(1) |
|
$ |
66,705 |
|
|
$ |
196,492 |
|
|
$ |
249,901 |
|
|
$ |
718,234 |
|
|
$ |
1,231,332 |
|
|
Operating and capital leases(2) |
|
|
64,391 |
|
|
|
126,246 |
|
|
|
100,584 |
|
|
|
144,241 |
|
|
|
435,462 |
|
|
Total contractual cash obligations |
|
$ |
131,096 |
|
|
$ |
322,738 |
|
|
$ |
350,485 |
|
|
$ |
862,475 |
|
|
$ |
1,666,794 |
|
|
(1) |
Amounts due associated with our variable rate mortgage debt is projected by applying the variable interest rates effective at December 31, 2017. |
|
(2) |
Reflects future minimum lease commitments under the Company’s various property and equipment lease agreements at current rental rates. |
Long-term debt relates to the aggregate maturities of the Company’s notes payable. As of December 31, 2017, the Company leases its corporate headquarters in Dallas, an executive office in New York, 46 senior housing communities and certain equipment used at the Company’s communities.
47
To date, inflation has not had a significant impact on the Company. However, inflation could affect the Company’s future revenues and results of operations because of, among other things, the Company’s dependence on senior residents, many of whom rely primarily on fixed incomes to pay for the Company’s services. As a result, during inflationary periods, the Company may not be able to increase resident service fees to account fully for increased operating expenses. In structuring its fees, the Company attempts to anticipate inflation levels, but there can be no assurance that the Company will be able to anticipate fully or otherwise respond to any future inflationary pressures.
The Company’s primary market risk is exposure to changes in interest rates on debt and lease instruments. As of December 31, 2017, the Company had $967.3 million in outstanding debt comprised of various fixed and variable interest rate debt instruments of $890.8 million and $76.5 million, respectively. In addition, as of December 31, 2017, the Company had $433.3 million in future facility lease obligations with contingent rent increases on certain leases based on changes in the consumer price index or certain operational performance measures.
Changes in interest rates would affect the fair market value of the Company’s fixed interest rate debt instruments, but would not have an impact on the Company’s earnings or cash flows. Fluctuations in interest rates on the Company’s variable interest rate debt instruments, which are tied to LIBOR, would affect the Company’s earnings and cash flows but would not affect the fair market values of the variable interest rate debt. Each percentage point increase in interest rates would impact the Company’s annual interest expense by approximately $0.8 million based on the Company’s outstanding variable interest rate debt as of December 31, 2017. Increases in the consumer price index could have an effect on future facility lease expense if the leased community exceeds the contingent rent escalation thresholds set forth in each of the Company’s lease agreements.
The following table summarizes information on the Company’s debt instruments outstanding as of December 31, 2017. The table presents the principal due and weighted average interest rates by expected maturity date for the Company’s debt instruments by fiscal year.
Principal Amount, which excludes deferred loan costs, and Average Interest Rate by Expected Maturity Date at December 31, 2017 ($ in thousands):
|
|
|
2018 |
|
|
2019 |
|
|
2020 |
|
|
2021 |
|
|
2022 |
|
|
Thereafter |
|
|
Total |
|
|
Fair Value |
|
||||||||
|
Long-term debt: |
|
|
|
|
|
|
|
|
|
|
|
|
|
|
|
|
|
|
|
|
|
|
|
|
|
|
|
|
|
|
|
|
|
Fixed rate debt |
|
$ |
21,168 |
|
|
$ |
17,742 |
|
|
$ |
18,482 |
|
|
$ |
72,706 |
|
|
$ |
106,161 |
|
|
$ |
654,568 |
|
|
$ |
890,827 |
|
|
$ |
852,495 |
|
|
Average interest rate |
|
|
4.6 |
% |
|
|
4.6 |
% |
|
|
4.6 |
% |
|
|
4.6 |
% |
|
|
4.6 |
% |
|
|
4.6 |
% |
|
|
|
|
|
|
|
|
|
Variable rate debt |
|
|
253 |
|
|
|
11,252 |
|
|
|
65,000 |
|
|
|
|
|
|
|
|
|
|
|
|
|
|
|
76,505 |
|
|
|
76,505 |
|
|
Average interest rate |
|
|
5.5 |
% |
|
|
5.4 |
% |
|
|
5.4 |
% |
|
|
|
|
|
|
|
|
|
|
|
|
|
|
|
|
|
|
|
|
|
Total debt |
|
|
|
|
|
|
|
|
|
|
|
|
|
|
|
|
|
|
|
|
|
|
|
|
|
$ |
967,332 |
|
|
$ |
929,000 |
|
The consolidated financial statements of the Company are included under Item 15 of this Annual Report on Form 10-K.
The Company had no disagreements on accounting or financial disclosure matters with its independent accountants to report under this Item 9.
48
Effectiveness of Controls and Procedures
The Company’s management, with the participation of the Company’s Chief Executive Officer (“CEO”) and Chief Financial Officer (“CFO”), has evaluated the effectiveness of the Company’s disclosure controls and procedures (as such term is defined in Rules 13a-15(e) and 15d-15(e) under the Securities Exchange Act of 1934, as amended (the “Exchange Act”)) as of the end of the period covered by this report. The Company’s disclosure controls and procedures are designed to ensure that information required to be disclosed by the Company in the reports that it files or submits under the Exchange Act is recorded, processed, summarized and reported within the time periods specified in the SEC’s rules and forms. Disclosure controls and procedures are also designed to ensure that such information is accumulated and communicated to the Company’s management, including the CEO and CFO, as appropriate to allow timely decisions regarding required disclosure.
Based upon the controls evaluation, the Company’s CEO and CFO have concluded that, as of the end of the period covered by this report, the Company’s disclosure controls and procedures are effective.
There have not been any changes in the Company’s internal control over financial reporting (as such term is defined in Rules 13a-15(f) and 15d-15(f) under the Exchange Act) during the Company’s fiscal quarter ended December 31, 2017 that have materially affected, or are reasonably likely to materially affect, the Company’s internal control over financial reporting.
Internal Controls Over Financial Reporting
Management’s Report On Internal Control Over Financial Reporting
Management of the Company, including the Chief Executive Officer and the Chief Financial Officer, is responsible for establishing and maintaining adequate internal control over financial reporting, as defined in Rules 13a-15(f) under the Exchange Act. The Company’s internal controls were designed to provide reasonable assurance to the Company’s management and board of directors regarding the preparation and fair presentation of published financial statements.
Because of its inherent limitations, internal control over financial reporting may not prevent or detect misstatements. Therefore, even those systems determined to be effective can provide only reasonable assurance with respect to financial statement preparation and presentation.
Management assessed the effectiveness of the Company’s internal control over financial reporting as of December 31, 2017. In making this assessment, management used the criteria set forth by the Committee of Sponsoring Organizations of the Treadway Commission (“COSO”) in Internal Control – Integrated Framework (2013 framework). Based on our assessment, we believe that, as of December 31, 2017, the Company’s internal control over financial reporting is effective based on those criteria.
The effectiveness of our internal control over financial reporting as of December 31, 2017, has been audited by Ernst & Young LLP, the independent registered public accounting firm that audited our consolidated financial statements included in this Annual Report on Form 10-K, as stated in their report which is included as part of this Annual Report on Form 10-K. The Ernst & Young LLP report is on page F-33 of this report.
None.
49
|
ITEM 12. |
SECURITY OWNERSHIP OF CERTAIN BENEFICIAL OWNERS AND MANAGEMENT AND RELATED STOCKHOLDER MATTERS.* |
|
* |
Information required by Items 10, 11, 12, 13 and 14 will be set forth in the definitive proxy statement relating to the 2018 Annual Meeting of Stockholders of Capital Senior Living Corporation, which will be filed with SEC pursuant to Regulation 14A under the Exchange Act. This definitive proxy statement relates to a meeting of stockholders involving the election of directors and the portions therefrom required to be set forth in this Form 10-K by Items 10, 11, 12, 13 and 14 are incorporated herein by reference pursuant to General Instruction G(3) to Form 10-K. |
50
The following documents are filed as part of this Report:
|
|
(1) |
Financial Statements: |
The response to this portion of Item 15 is submitted as a separate section of this Report. See “Index to Financial Statements” at page F-1.
|
|
(2) |
Financial Statement Schedules: |
All schedules have been omitted as the required information is inapplicable or the information is presented in the financial statements or related notes.
|
|
(3) |
Exhibits: |
The following documents are filed as a part of this report. Those exhibits previously filed and incorporated herein by reference are identified below. Exhibits not required for this report have been omitted.
|
Exhibit Number |
|
|
Description |
|
|
3.1 |
|
|
||
|
|
|
|||
|
3.1.1 |
|
|
||
|
|
|
|||
|
3.2 |
|
|
||
|
|
|
|||
|
4.1 |
|
|
||
|
|
|
|||
|
4.2 |
|
|
||
|
|
|
|||
|
4.3 |
|
|
||
|
|
|
|||
|
10.1 |
|
|
||
|
|
|
|||
|
10.2 |
|
|
||
|
|
|
|||
|
10.3 |
|
|
||
|
|
|
|||
51
|
Exhibit Number |
|
|
Description |
|
|
|
|
|||
|
|
|
|||
|
10.5 |
|
|
||
|
|
|
|
|
|
|
10.6 |
|
|
||
|
|
|
|||
|
10.6.1 |
|
|
||
|
|
|
|||
|
10.7 |
|
|
||
|
|
|
|||
|
10.8 |
|
|
||
|
|
|
|||
|
10.9 |
|
|
||
|
|
|
|||
|
10.10 |
|
|
||
|
|
|
|||
|
10.11 |
|
|
||
|
|
|
|||
|
10.12 |
|
|
||
|
|
|
|||
|
10.13 |
|
|
||
|
|
|
|||
|
10.14 |
|
|
||
|
|
|
|||
|
10.15 |
|
|
||
|
|
|
|||
|
|
|
|||
52
|
Exhibit Number |
|
|
Description |
|
|
|
|
|||
|
|
|
|||
|
10.17 |
|
|
||
|
|
|
|||
|
10.18 |
|
|
||
|
|
|
|||
|
10.19 |
|
|
||
|
|
|
|||
|
10.20 |
|
|
||
|
|
|
|||
|
10.21 |
|
|
||
|
|
|
|
|
|
|
10.22 |
|
|
||
|
|
|
|
|
|
|
*21.1 |
|
|
||
|
|
|
|
|
|
|
*23.1 |
|
|
||
|
|
|
|
|
|
|
*31.1 |
|
|
Certification of Chief Executive Officer required by Rule 13a-14(a) or Rule 15d-14(a) |
|
|
|
|
|
|
|
|
*31.2 |
|
|
Certification of Chief Financial Officer required by Rule 13a-14(a) or Rule 15d-14(a) |
|
|
|
|
|
|
|
|
*32.1 |
|
|
Certification of Lawrence A. Cohen pursuant to Section 906 of the Sarbanes-Oxley Act of 2002. |
|
|
|
|
|
|
|
|
*32.2 |
|
|
Certification of Carey P. Hendrickson pursuant to Section 906 of the Sarbanes-Oxley Act of 2002. |
|
|
|
|
|
|
|
|
*101.INS |
|
|
XBRL Instance Document |
|
|
|
|
|
|
|
|
*101.SCH |
|
|
XBRL Taxonomy Extension Schema Document |
|
|
|
|
|
|
|
|
*101.CAL |
|
|
XBRL Taxonomy Extension Calculation Linkbase Document |
|
|
|
|
|
|
|
|
*101.LAB |
|
|
XBRL Taxonomy Extension Label Linkbase Document |
|
|
|
|
|
|
|
|
*101.PRE |
|
|
XBRL Taxonomy Extension Presentation Linkbase Document |
|
|
|
|
|
|
|
|
*101.DEF |
|
|
XBRL Taxonomy Extension Definition Linkbase Document |
|
|
* |
Filed herewith. |
53
Pursuant to the requirements of Section 13 or 15(d) of the Securities Exchange Act of 1934, the Registrant has duly caused this report to be signed on its behalf by the undersigned, thereunto duly authorized.
|
CAPITAL SENIOR LIVING CORPORATION |
|
|
|
|
|
By: |
/s/ LAWRENCE A. COHEN |
|
|
Lawrence A. Cohen |
|
|
Vice Chairman of the Board and Chief Executive Officer |
|
|
|
|
Date: March 2, 2018 |
|
Pursuant to the requirements of the Securities Exchange Act of 1934, this report has been signed by the following persons on behalf of the Registrant and in the capacities and on the dates indicated. Each person whose signature to this report appears below hereby appoints Lawrence A. Cohen and Carey P. Hendrickson and each of them, any one of whom may act without the joinder of the other, as his or her attorney-in-fact to sign on his behalf, individually and in each capacity stated below, and to file all amendments to this report, which amendment or amendments may make such changes in and additions to the report as any such attorney-in-fact may deem necessary or appropriate.
|
Signature |
|
Title |
|
Date |
|
|
|
|
||
|
/s/ LAWRENCE A. COHEN |
|
Chief Executive Officer and Vice |
|
March 2, 2018 |
|
Lawrence A. Cohen |
|
Chairman of the Board (Principal |
|
|
|
|
|
Executive Officer) |
|
|
|
|
|
|
||
|
/s/ CAREY P. HENDRICKSON |
|
Senior Vice President and |
|
March 2, 2018 |
|
Carey P. Hendrickson |
|
Chief Financial Officer (Principal |
|
|
|
|
|
Financial and Accounting Officer) |
|
|
|
|
|
|
||
|
/s/ MICHAEL W. REID |
|
Chairman of the Board |
|
March 2, 2018 |
|
Michael W. Reid |
|
|
|
|
|
|
|
|
||
|
/s/ PHILIP A. BROOKS |
|
Director |
|
March 2, 2018 |
|
Philip A. Brooks |
|
|
|
|
|
|
|
|
||
|
/s/ ED A. GRIER |
|
Director |
|
March 2, 2018 |
|
Ed A. Grier |
|
|
|
|
|
|
|
|
||
|
/s/ E. RODNEY HORNBAKE |
|
Director |
|
March 2, 2018 |
|
E. Rodney Hornbake |
|
|
|
|
|
|
|
|
||
|
/s/ PAUL J. ISAAC |
|
Director |
|
March 2, 2018 |
|
Paul J. Isaac |
|
|
|
|
|
|
|
|
||
|
/s/ JILL M. KRUEGER |
|
Director |
|
March 2, 2018 |
|
Jill M. Krueger |
|
|
|
|
|
|
|
|
||
|
/s/ ROSS B. LEVIN |
|
Director |
|
March 2, 2018 |
|
Ross B. Levin |
|
|
|
|
|
|
|
|
||
|
/s/ KIMBERLY S. LODY |
|
Director |
|
March 2, 2018 |
|
Kimberly S. Lody |
|
|
|
|
|
|
|
|
||
|
/s/ RONALD A. MALONE |
|
Director |
|
March 2, 2018 |
|
Ronald A. Malone |
|
|
|
|
54
|
|
Page |
|
Consolidated Financial Statements of Capital Senior Living Corporation |
|
|
Report of Independent Registered Public Accounting Firm, Ernst & Young LLP |
F-2 |
|
F-3 |
|
|
F-4 |
|
|
F-5 |
|
|
Consolidated Statements of Cash Flows — For the years ended December 31, 2017, 2016 and 2015 |
F-6 |
|
F-7 |
|
|
F-33 |
F-1
Report of Independent Registered Public Accounting Firm
To the Shareholders and the Board of Directors of Capital Senior Living Corporation
Opinion on the Financial Statements
We have audited the accompanying consolidated balance sheets of Capital Senior Living Corporation (the Company) as of December 31, 2017 and 2016, and the related consolidated statements of operations and comprehensive loss, shareholders' equity, and cash flows for each of the three years in the period ended December 31, 2017, and the related notes (collectively referred to as the “financial statements”). In our opinion, the financial statements present fairly, in all material respects, the consolidated financial position of the Company at December 31, 2017 and 2016, and the consolidated results of its operations and its cash flows for each of the three years in the period ended December 31, 2017, in conformity with U.S. generally accepted accounting principles.
We also have audited, in accordance with the standards of the Public Company Accounting Oversight Board (United States) (PCAOB), the Company’s internal control over financial reporting as of December 31, 2017, based on criteria established in Internal Control-Integrated Framework issued by the Committee of Sponsoring Organizations of the Treadway Commission (2013 framework), and our report dated March 2, 2018, expressed an unqualified opinion thereon.
Basis for Opinion
These financial statements are the responsibility of the Company‘s management. Our responsibility is to express an opinion on the Company‘s financial statements based on our audits. We are a public accounting firm registered with the PCAOB and are required to be independent with respect to the Company in accordance with the U.S. federal securities laws and the applicable rules and regulations of the Securities and Exchange Commission and the PCAOB.
We conducted our audits in accordance with the standards of the PCAOB. Those standards require that we plan and perform the audit to obtain reasonable assurance about whether the financial statements are free of material misstatement, whether due to error or fraud. Our audits included performing procedures to assess the risk of material misstatement of the financial statements, whether due to error or fraud, and performing procedures that respond to those risks. Such procedures included examining, on a test basis, evidence regarding the amounts and disclosures in the financial statements. Our audits also included evaluating the accounting principles used and significant estimates made by management, as well as evaluating the overall presentation of the financial statements. We believe that our audits provide a reasonable basis for our opinion.
/s/ Ernst & Young LLP
We have served as the Company’s auditors since 2006.
Dallas, Texas
March 2, 2018
F-2
CAPITAL SENIOR LIVING CORPORATION
|
|
|
December 31, |
|
|||||
|
|
|
2017 |
|
|
2016 |
|
||
|
|
|
(In thousands) |
|
|||||
|
ASSETS |
|
|||||||
|
Current assets: |
|
|
|
|
|
|
|
|
|
Cash and cash equivalents |
|
$ |
17,646 |
|
|
$ |
34,026 |
|
|
Restricted cash |
|
|
13,378 |
|
|
|
13,297 |
|
|
Accounts receivable, net |
|
|
12,307 |
|
|
|
13,675 |
|
|
Property tax and insurance deposits |
|
|
14,386 |
|
|
|
14,665 |
|
|
Prepaid expenses and other |
|
|
6,332 |
|
|
|
6,365 |
|
|
Total current assets |
|
|
64,049 |
|
|
|
82,028 |
|
|
Property and equipment, net |
|
|
1,099,786 |
|
|
|
1,032,430 |
|
|
Other assets, net |
|
|
18,836 |
|
|
|
31,323 |
|
|
Total assets |
|
$ |
1,182,671 |
|
|
$ |
1,145,781 |
|
|
LIABILITIES AND SHAREHOLDERS’ EQUITY |
|
|||||||
|
Current liabilities: |
|
|
|
|
|
|
|
|
|
Accounts payable |
|
$ |
7,801 |
|
|
$ |
5,051 |
|
|
Accrued expenses |
|
|
40,751 |
|
|
|
39,064 |
|
|
Current portion of notes payable, net of deferred loan costs |
|
|
19,728 |
|
|
|
17,889 |
|
|
Current portion of deferred income |
|
|
13,840 |
|
|
|
16,284 |
|
|
Current portion of capital lease and financing obligations |
|
|
3,106 |
|
|
|
1,339 |
|
|
Federal and state income taxes payable |
|
|
383 |
|
|
|
218 |
|
|
Customer deposits |
|
|
1,394 |
|
|
|
1,545 |
|
|
Total current liabilities |
|
|
87,003 |
|
|
|
81,390 |
|
|
Deferred income |
|
|
10,033 |
|
|
|
12,205 |
|
|
Capital lease and financing obligations, net of current portion |
|
|
48,805 |
|
|
|
37,439 |
|
|
Deferred taxes |
|
|
1,941 |
|
|
|
— |
|
|
Other long-term liabilities |
|
|
16,250 |
|
|
|
15,325 |
|
|
Notes payable, net of deferred loan costs and current portion |
|
|
938,206 |
|
|
|
882,504 |
|
|
Commitments and contingencies |
|
|
|
|
|
|
|
|
|
Shareholders’ equity: |
|
|
|
|
|
|
|
|
|
Preferred stock, $.01 par value: |
|
|
— |
|
|
|
— |
|
|
Authorized shares — 15,000; no shares issued or outstanding |
|
|
|
|
|
|
|
|
|
Common stock, $.01 par value: |
|
|
|
|
|
|
|
|
|
Authorized shares — 65,000; issued and outstanding shares 30,505 and 30,012 in 2017 and 2016, respectively |
|
|
310 |
|
|
|
305 |
|
|
Additional paid-in capital |
|
|
179,459 |
|
|
|
171,599 |
|
|
Retained deficit |
|
|
(95,906 |
) |
|
|
(51,556 |
) |
|
Treasury stock, at cost – 494 shares in 2017 and 2016 |
|
|
(3,430 |
) |
|
|
(3,430 |
) |
|
Total shareholders’ equity |
|
|
80,433 |
|
|
|
116,918 |
|
|
Total liabilities and shareholders’ equity |
|
$ |
1,182,671 |
|
|
$ |
1,145,781 |
|
See accompanying notes to consolidated financial statements.
F-3
CAPITAL SENIOR LIVING CORPORATION
CONSOLIDATED STATEMENTS OF OPERATIONS AND COMPREHENSIVE LOSS
|
|
|
Year Ended December 31, |
|
|||||||||
|
|
|
2017 |
|
|
2016 |
|
|
2015 |
|
|||
|
|
|
(In thousands, except per share data) |
|
|||||||||
|
Revenues: |
|
|
|
|
|
|
|
|
|
|
|
|
|
Resident revenue |
|
$ |
466,997 |
|
|
$ |
447,448 |
|
|
$ |
412,177 |
|
|
Expenses: |
|
|
|
|
|
|
|
|
|
|
|
|
|
Operating expenses (exclusive of facility lease expense and depreciation and amortization expense shown below) |
|
|
290,662 |
|
|
|
273,899 |
|
|
|
248,736 |
|
|
General and administrative expenses |
|
|
23,574 |
|
|
|
23,671 |
|
|
|
20,351 |
|
|
Facility lease expense |
|
|
56,432 |
|
|
|
61,718 |
|
|
|
61,213 |
|
|
Loss on facility lease termination |
|
|
12,858 |
|
|
|
— |
|
|
|
— |
|
|
Provision for bad debts |
|
|
1,748 |
|
|
|
1,727 |
|
|
|
1,192 |
|
|
Stock-based compensation expense |
|
|
7,682 |
|
|
|
11,645 |
|
|
|
8,833 |
|
|
Depreciation and amortization expense |
|
|
66,199 |
|
|
|
60,398 |
|
|
|
53,017 |
|
|
Total expenses |
|
|
459,155 |
|
|
|
433,058 |
|
|
|
393,342 |
|
|
Income from operations |
|
|
7,842 |
|
|
|
14,390 |
|
|
|
18,835 |
|
|
Other income (expense): |
|
|
|
|
|
|
|
|
|
|
|
|
|
Interest income |
|
|
73 |
|
|
|
67 |
|
|
|
53 |
|
|
Interest expense |
|
|
(49,471 |
) |
|
|
(42,207 |
) |
|
|
(35,732 |
) |
|
Write-off of deferred loan costs and prepayment premiums |
|
|
— |
|
|
|
— |
|
|
|
(2,766 |
) |
|
(Loss) Gain on disposition of assets, net |
|
|
(123 |
) |
|
|
(65 |
) |
|
|
6,225 |
|
|
Other income |
|
|
7 |
|
|
|
233 |
|
|
|
1 |
|
|
Loss before provision for income taxes |
|
|
(41,672 |
) |
|
|
(27,582 |
) |
|
|
(13,384 |
) |
|
Provision for income taxes |
|
|
(2,496 |
) |
|
|
(435 |
) |
|
|
(900 |
) |
|
Net loss |
|
$ |
(44,168 |
) |
|
$ |
(28,017 |
) |
|
$ |
(14,284 |
) |
|
Per share data: |
|
|
|
|
|
|
|
|
|
|
|
|
|
Basic net loss per share |
|
$ |
(1.50 |
) |
|
$ |
(0.97 |
) |
|
$ |
(0.50 |
) |
|
Diluted net loss per share |
|
$ |
(1.50 |
) |
|
$ |
(0.97 |
) |
|
$ |
(0.50 |
) |
|
Weighted average shares outstanding — basic |
|
|
29,453 |
|
|
|
28,909 |
|
|
|
28,688 |
|
|
Weighted average shares outstanding — diluted |
|
|
29,453 |
|
|
|
28,909 |
|
|
|
28,688 |
|
|
Comprehensive loss |
|
$ |
(44,168 |
) |
|
$ |
(28,017 |
) |
|
$ |
(14,284 |
) |
See accompanying notes to consolidated financial statements.
F-4
CAPITAL SENIOR LIVING CORPORATION
CONSOLIDATED STATEMENTS OF SHAREHOLDERS’ EQUITY
|
|
|
Common Stock |
|
|
Additional Paid-In |
|
|
Retained |
|
|
Treasury |
|
|
|
|
|
||||||||
|
|
|
Shares |
|
|
Amount |
|
|
Capital |
|
|
Deficit |
|
|
Stock |
|
|
Total |
|
||||||
|
|
|
(In thousands) |
|
|||||||||||||||||||||
|
Balance at January 1, 2015 |
|
|
29,097 |
|
|
$ |
294 |
|
|
$ |
151,069 |
|
|
$ |
(9,255 |
) |
|
$ |
(934 |
) |
|
$ |
141,174 |
|
|
Exercise of stock options |
|
|
3 |
|
|
|
1 |
|
|
|
37 |
|
|
|
— |
|
|
|
— |
|
|
|
38 |
|
|
Restricted stock awards |
|
|
439 |
|
|
|
4 |
|
|
|
— |
|
|
|
— |
|
|
|
— |
|
|
|
4 |
|
|
Stock-based compensation |
|
|
— |
|
|
|
— |
|
|
|
8,833 |
|
|
|
— |
|
|
|
— |
|
|
|
8,833 |
|
|
Excess tax benefits on stock options exercised |
|
|
— |
|
|
|
— |
|
|
|
(19 |
) |
|
|
— |
|
|
|
— |
|
|
|
(19 |
) |
|
Net loss |
|
|
— |
|
|
|
— |
|
|
|
— |
|
|
|
(14,284 |
) |
|
|
— |
|
|
|
(14,284 |
) |
|
Balance at December 31, 2015 |
|
|
29,539 |
|
|
$ |
299 |
|
|
$ |
159,920 |
|
|
$ |
(23,539 |
) |
|
$ |
(934 |
) |
|
$ |
135,746 |
|
|
Exercise of stock options |
|
|
6 |
|
|
|
— |
|
|
|
60 |
|
|
|
— |
|
|
|
— |
|
|
|
60 |
|
|
Restricted stock awards |
|
|
611 |
|
|
|
6 |
|
|
|
1 |
|
|
|
— |
|
|
|
— |
|
|
|
7 |
|
|
Stock-based compensation |
|
|
— |
|
|
|
— |
|
|
|
11,645 |
|
|
|
— |
|
|
|
— |
|
|
|
11,645 |
|
|
Excess tax benefits on stock options exercised |
|
|
— |
|
|
|
— |
|
|
|
(27 |
) |
|
|
— |
|
|
|
— |
|
|
|
(27 |
) |
|
Treasury stock |
|
|
(144 |
) |
|
|
— |
|
|
|
— |
|
|
|
— |
|
|
|
(2,496 |
) |
|
|
(2,496 |
) |
|
Net loss |
|
|
— |
|
|
|
— |
|
|
|
— |
|
|
|
(28,017 |
) |
|
|
— |
|
|
|
(28,017 |
) |
|
Balance at December 31, 2016 |
|
|
30,012 |
|
|
$ |
305 |
|
|
$ |
171,599 |
|
|
$ |
(51,556 |
) |
|
$ |
(3,430 |
) |
|
$ |
116,918 |
|
|
Restricted stock unit conversions |
|
|
3 |
|
|
|
— |
|
|
|
— |
|
|
|
— |
|
|
|
— |
|
|
|
— |
|
|
Restricted stock awards |
|
|
490 |
|
|
|
5 |
|
|
|
(4 |
) |
|
|
— |
|
|
|
— |
|
|
|
1 |
|
|
Stock-based compensation |
|
|
— |
|
|
|
— |
|
|
|
7,864 |
|
|
|
(182 |
) |
|
|
— |
|
|
|
7,682 |
|
|
Net loss |
|
|
— |
|
|
|
— |
|
|
|
— |
|
|
|
(44,168 |
) |
|
|
— |
|
|
|
(44,168 |
) |
|
Balance at December 31, 2017 |
|
|
30,505 |
|
|
$ |
310 |
|
|
$ |
179,459 |
|
|
$ |
(95,906 |
) |
|
$ |
(3,430 |
) |
|
$ |
80,433 |
|
See accompanying notes to consolidated financial statements.
F-5
CAPITAL SENIOR LIVING CORPORATION
CONSOLIDATED STATEMENTS OF CASH FLOWS
|
|
|
Year Ended December 31, |
|
|||||||||
|
|
|
2017 |
|
|
2016 |
|
|
2015 |
|
|||
|
|
|
(in thousands) |
|
|||||||||
|
Operating Activities |
|
|
|
|
|
|
|
|
|
|
|
|
|
Net loss |
|
$ |
(44,168 |
) |
|
$ |
(28,017 |
) |
|
$ |
(14,284 |
) |
|
Adjustments to reconcile net loss to net cash provided by operating activities: |
|
|
|
|
|
|
|
|
|
|
|
|
|
Depreciation and amortization |
|
|
66,199 |
|
|
|
60,398 |
|
|
|
53,017 |
|
|
Amortization of deferred financing charges |
|
|
1,626 |
|
|
|
1,193 |
|
|
|
1,029 |
|
|
Amortization of deferred lease costs and lease intangibles, net |
|
|
859 |
|
|
|
679 |
|
|
|
1,555 |
|
|
Amortization of lease incentives |
|
|
(1,336 |
) |
|
|
(710 |
) |
|
|
(134 |
) |
|
Deferred income |
|
|
(1,397 |
) |
|
|
(414 |
) |
|
|
(677 |
) |
|
Deferred taxes |
|
|
1,941 |
|
|
|
— |
|
|
|
— |
|
|
Lease incentives |
|
|
5,673 |
|
|
|
7,530 |
|
|
|
2,464 |
|
|
Loss on facility lease termination |
|
|
12,858 |
|
|
|
— |
|
|
|
— |
|
|
Write-off of deferred loan costs and prepayment premiums |
|
|
— |
|
|
|
— |
|
|
|
2,766 |
|
|
Loss (Gain) on disposition of assets, net |
|
|
123 |
|
|
|
65 |
|
|
|
(6,225 |
) |
|
Provision for bad debts |
|
|
1,748 |
|
|
|
1,727 |
|
|
|
1,192 |
|
|
Stock-based compensation expense |
|
|
7,682 |
|
|
|
11,645 |
|
|
|
8,833 |
|
|
Changes in operating assets and liabilities: |
|
|
|
|
|
|
|
|
|
|
|
|
|
Accounts receivable |
|
|
(8,159 |
) |
|
|
(14,519 |
) |
|
|
(6,605 |
) |
|
Property tax and insurance deposits |
|
|
279 |
|
|
|
(267 |
) |
|
|
(2,200 |
) |
|
Prepaid expenses and other |
|
|
33 |
|
|
|
(1,995 |
) |
|
|
2,427 |
|
|
Other assets |
|
|
4,061 |
|
|
|
(2,228 |
) |
|
|
(1,289 |
) |
|
Accounts payable |
|
|
2,750 |
|
|
|
1,695 |
|
|
815 |
|
|
|
Accrued expenses |
|
|
1,689 |
|
|
|
4,798 |
|
|
|
2,146 |
|
|
Other liabilities |
|
|
5,017 |
|
|
|
12,014 |
|
|
|
3,677 |
|
|
Federal and state income taxes receivable/payable |
|
|
165 |
|
|
|
107 |
|
|
|
(108 |
) |
|
Deferred resident revenue |
|
|
(1,898 |
) |
|
|
(1,148 |
) |
|
176 |
|
|
|
Customer deposits |
|
|
(151 |
) |
|
|
(274 |
) |
|
320 |
|
|
|
Net cash provided by operating activities |
|
|
55,594 |
|
|
|
52,279 |
|
|
|
48,895 |
|
|
Investing Activities |
|
|
|
|
|
|
|
|
|
|
|
|
|
Capital expenditures |
|
|
(39,959 |
) |
|
|
(62,371 |
) |
|
|
(42,430 |
) |
|
Cash paid for acquisitions |
|
|
(85,000 |
) |
|
|
(138,750 |
) |
|
|
(162,460 |
) |
|
Proceeds from disposition of assets |
|
|
19 |
|
|
|
72 |
|
|
|
43,463 |
|
|
Net cash used in investing activities |
|
|
(124,940 |
) |
|
|
(201,049 |
) |
|
|
(161,427 |
) |
|
Financing Activities |
|
|
|
|
|
|
|
|
|
|
|
|
|
Proceeds from notes payable |
|
|
77,197 |
|
|
|
150,798 |
|
|
|
250,944 |
|
|
Repayments of notes payable |
|
|
(20,099 |
) |
|
|
(17,680 |
) |
|
|
(115,896 |
) |
|
Cash payments for capital lease and financing obligations |
|
|
(2,869 |
) |
|
|
(1,314 |
) |
|
|
(978 |
) |
|
Increase in restricted cash |
|
|
(81 |
) |
|
|
(138 |
) |
|
|
(918 |
) |
|
Cash proceeds from the issuance of common stock |
|
|
— |
|
|
|
67 |
|
|
42 |
|
|
|
Excess tax benefits on stock options exercised |
|
|
— |
|
|
|
(27 |
) |
|
|
(19 |
) |
|
Purchases of treasury stock |
|
|
— |
|
|
|
(2,496 |
) |
|
— |
|
|
|
Deferred financing charges paid |
|
|
(1,182 |
) |
|
|
(2,501 |
) |
|
|
(3,765 |
) |
|
Net cash provided by financing activities |
|
|
52,966 |
|
|
|
126,709 |
|
|
|
129,410 |
|
|
(Decrease) Increase in cash and cash equivalents |
|
|
(16,380 |
) |
|
|
(22,061 |
) |
|
|
16,878 |
|
|
Cash and cash equivalents at beginning of year |
|
|
34,026 |
|
|
|
56,087 |
|
|
|
39,209 |
|
|
Cash and cash equivalents at end of year |
|
$ |
17,646 |
|
|
$ |
34,026 |
|
|
$ |
56,087 |
|
|
Supplemental Disclosures |
|
|
|
|
|
|
|
|
|
|
|
|
|
Cash paid during the year for: |
|
|
|
|
|
|
|
|
|
|
|
|
|
Interest |
|
$ |
47,022 |
|
|
$ |
40,585 |
|
|
$ |
33,642 |
|
|
Income taxes |
|
$ |
543 |
|
|
$ |
582 |
|
|
$ |
1,039 |
|
|
Non-cash operating, investing, and financing activities: |
|
|
|
|
|
|
|
|
|
|
|
|
|
Notes payable assumed by purchaser through disposition of assets |
|
$ |
— |
|
|
$ |
— |
|
|
$ |
6,764 |
|
See accompanying notes to consolidated financial statements.
F-6
CAPITAL SENIOR LIVING CORPORATION
NOTES TO CONSOLIDATED FINANCIAL STATEMENTS
December 31, 2017
|
1. |
Organization |
Capital Senior Living Corporation, a Delaware corporation (together with its subsidiaries, the “Company”), is one of the largest operators of senior housing communities in the United States in terms of resident capacity. The Company owns, operates, develops and manages senior housing communities throughout the United States. As of December 31, 2017, the Company operated 129 senior housing communities in 23 states with an aggregate capacity of approximately 16,500 residents, including 83 senior housing communities which the Company owned and 46 senior housing communities that the Company leased. The accompanying consolidated financial statements include the financial statements of Capital Senior Living Corporation and its wholly owned subsidiaries. All material intercompany balances and transactions have been eliminated in consolidation.
|
2. |
Summary of Significant Accounting Policies |
Cash and Cash Equivalents and Restricted Cash
The Company considers all highly liquid investments with original maturities of three months or less at the date of acquisition to be cash equivalents. The Company has deposits in banks that exceed Federal Deposit Insurance Corporation insurance limits. Management believes that credit risk related to these deposits is minimal. Restricted cash consists of deposits required by certain lenders as collateral pursuant to letters of credit. The deposit must remain so long as the letter of credit is outstanding which is subject to renewal annually.
Long-Lived Assets
Property and equipment are stated at cost and depreciated on a straight-line basis over the estimated useful lives of the assets. At each balance sheet date, the Company reviews the carrying value of its property and equipment to determine if facts and circumstances suggest that they may be impaired or that the depreciation period may need to be changed. The Company considers internal factors such as net operating losses along with external factors relating to each asset, including contract changes, local market developments, and other publicly available information. If an indicator of impairment is identified, the carrying value of a long-lived asset is considered impaired when the anticipated undiscounted cash flows from such asset is separately identifiable and is less than its carrying value. In that event, a loss is recognized based on the amount the carrying value exceeds the fair market value, generally based on discounted cash flows, of the long-lived asset. The Company does not believe there are any indicators of impairment that would require an adjustment to the carrying value of the property and equipment or their remaining useful lives as of December 31, 2017 and 2016.
Off-Balance Sheet Arrangements
The Company had no material off-balance sheet arrangements at December 31, 2017.
Income Taxes
Income taxes are computed using the asset and liability method and current income taxes are recorded based on amounts refundable or payable in the current year. Deferred income taxes are recorded based on the estimated future tax effects of loss carryforwards and temporary differences between financial statement carrying amounts of existing assets and liabilities and their respective tax basis. Deferred tax assets and liabilities are measured using enacted tax rates that are expected to apply to taxable income in the years in which we expect those carryforwards and temporary differences to be recovered or settled. Management regularly evaluates the future realization of deferred tax assets and provides a valuation allowance, if considered necessary, based on such evaluation. As part of the evaluation, management has evaluated taxable income in carryback years, future reversals of taxable temporary differences, feasible tax planning strategies, and future expectations of income.
F-7
CAPITAL SENIOR LIVING CORPORATION
NOTES TO CONSOLIDATED FINANCIAL STATEMENTS
December 31, 2017
The Company evaluates uncertain tax positions through consideration of accounting and reporting guidance on criteria, measurement, derecognition, classification, interest and penalties, accounting in interim periods, disclosure, and transition that is intended to provide better financial-statement comparability among different companies. The Company is required to recognize a tax benefit in its financial statements for an uncertain tax position only if management’s assessment is that its position is “more likely than not” (i.e., a greater than 50 percent likelihood) to be upheld on audit based only on the technical merits of the tax position. The Company’s policy is to recognize interest related to unrecognized tax benefits as interest expense and penalties as income tax expense.
Revenue Recognition
Resident revenue is recognized at estimated net realizable amounts, based on historical experiences, due from residents in the period in which the rental and other services are provided. Additionally, substantially all community fees received from residents are non-refundable and are recorded initially by the Company as deferred revenue. The deferred amounts are amortized over the respective residents’ initial lease term which is consistent with the contractual obligation associated with the estimated stay of the resident.
Revenues from the Medicaid program accounted for approximately 5.6% of the Company’s revenue in fiscal 2017, 5.5% of the Company’s revenue in fiscal 2016, and 4.6% of the Company’s revenue in fiscal 2015. During fiscal 2017, 2016, and 2015, 41, 40, and 34, respectively, of the Company’s communities were providers of services under the Medicaid program. Accordingly, these communities were entitled to reimbursement under the foregoing program at established rates that were lower than private pay rates. Patient service revenue for Medicaid patients was recorded at the reimbursement rates as the rates were set prospectively by the applicable state upon the filing of an annual cost report. None of the Company’s communities were providers of services under the Medicare program during fiscal 2017, 2016, or 2015.
Laws and regulations governing the Medicaid program are complex and subject to interpretation. The Company believes that it is in compliance with all applicable laws and regulations and is not aware of any pending or threatened investigations involving allegations of potential wrongdoing. While no such regulatory inquiries have been made, compliance with such laws and regulations can be subject to future government review and interpretation as well as significant regulatory action including fines, penalties, and exclusion from the Medicaid program.
Purchase Accounting
In determining the allocation of the purchase price of senior housing communities acquired to net tangible and identified intangible assets acquired and liabilities assumed, if any, the Company makes estimates of fair value using information obtained as a result of pre-acquisition due diligence, leasing activities and/or independent appraisals. The Company assigns the purchase price for senior living communities to assets acquired and liabilities assumed based on their estimated fair values which are determined in accordance with the provisions of ASC 805, Business Combinations. The determination of fair value involves the use of significant judgments and estimates which is generally assessed as follows:
The Company allocates the fair values of buildings acquired on an as-if-vacant basis and depreciates the building values over the estimated remaining lives of the buildings, not to exceed 40 years. The Company determines the allocated values of other fixed assets, such as site improvements and furniture, fixtures and equipment, based upon the replacement cost and depreciates such values over the assets’ estimated remaining useful lives as determined at the acquisition date. The Company determines the value of land by considering the sales prices of similar properties in recent transactions.
F-8
CAPITAL SENIOR LIVING CORPORATION
NOTES TO CONSOLIDATED FINANCIAL STATEMENTS
December 31, 2017
The fair value of acquired lease-related intangibles reflects the estimated fair value of existing resident in-place leases as represented by the cost to obtain residents and an estimated absorption period to reflect the value of the rent and recovery costs foregone during a reasonable lease-up period as if the property acquired was vacant. The Company amortizes any acquired resident in-place lease intangibles to depreciation and amortization expense over the estimated remaining useful life of the respective resident operating leases.
Credit Risk and Allowance for Doubtful Accounts
The Company’s resident receivables are generally due within 30 days from the date billed. Accounts receivable are reported net of an allowance for doubtful accounts of $4.9 million and $4.3 million at December 31, 2017 and 2016, respectively, and represent the Company’s estimate of the amount that ultimately will be collected. The adequacy of the Company’s allowance for doubtful accounts is reviewed on an ongoing basis, using historical payment trends, write-off experience, analyses of receivable portfolios by payor source and aging of receivables, as well as a review of specific accounts, and adjustments are made to the allowance as necessary. Credit losses on resident receivables have historically been within management’s estimates, and management believes that the allowance for doubtful accounts adequately provides for expected losses.
Lease Accounting
The Company determines whether to account for its leases as operating, capital or financing leases depending on the underlying terms of the lease agreement. This determination of classification requires significant judgment relating to certain information, including the estimated fair value and remaining economic life of the community, the Company’s cost of funds, minimum lease payments and other lease terms. The lease rates under the Company’s lease agreements are subject to certain conditional escalation clauses which are recognized when probable or incurred and are based on changes in the consumer price index or certain operational performance measures. As of December 31, 2017 and 2016, the Company leased 46 and 50 communities, respectively, two of which the Company classified as capital lease and financing obligations with the remaining classified as operating leases. The Company incurs lease acquisition costs and amortizes these costs over the term of the lease agreement. Certain leases entered into by the Company qualified as sale/leaseback transactions, and as such, any related gains have been deferred and are being amortized over the respective lease term. No new communities were leased by the Company during fiscal 2017 or 2016. Effective January 31, 2017, the Company acquired from Ventas the underlying real estate associated with four of its operating leases. For additional information refer to Note 3, “Acquisitions”.
Facility lease expense in the Company’s Consolidated Statements of Operations and Comprehensive loss includes rent expense plus amortization expense relating to leasehold acquisition costs offset by the amortization of deferred gains and lease incentives.
Employee Health and Dental Benefits, Workers’ Compensation, and Insurance Reserves
The Company offers certain full-time employees an option to participate in its health and dental plans. The Company is self-insured up to certain limits and is insured if claims in excess of these limits are incurred. The cost of employee health and dental benefits, net of employee contributions, is shared between the corporate office and the senior housing communities based on the respective number of plan participants. Funds collected are used to pay the actual program costs, including estimated annual claims, third-party administrative fees, network provider fees, communication costs, and other related administrative costs incurred by the plans. Claims are paid as they are submitted to the Company’s third-party administrator. The Company records a liability for outstanding claims and claims that have been incurred but not yet reported. This liability is based on the historical claim reporting lag and payment trends of health insurance claims. Management believes that the liability for outstanding losses and expenses is adequate to cover the ultimate cost of losses and expenses incurred at December 31, 2017; however, actual claims and expenses may differ. Any subsequent changes in estimates are recorded in the period in which they are determined.
F-9
CAPITAL SENIOR LIVING CORPORATION
NOTES TO CONSOLIDATED FINANCIAL STATEMENTS
December 31, 2017
The Company uses a combination of insurance and self-insurance for workers’ compensation. Determining the reserve for workers’ compensation losses and costs that the Company has incurred as of the end of a reporting period involves significant judgments based on projected future events, including potential settlements for pending claims, known incidents which may result in claims, estimates of incurred but not yet reported claims, changes in insurance premiums, estimated litigation costs and other factors. The Company regularly adjusts these estimates to reflect changes in the foregoing factors. However, since this reserve is based on estimates, the actual expenses incurred may differ from the amounts reserved. Any subsequent changes in estimates are recorded in the period in which they are determined.
Advertising
Advertising is expensed as incurred. Advertising expenses for the years ended December 31, 2017, 2016, and 2015 were $16.7 million, $15.0 million, and $13.9 million, respectively, and are included as a component of operating expenses within the Consolidated Statements of Operations and Comprehensive Loss.
Net Loss Per Share
Basic net loss per common share is computed by dividing net loss by the weighted average number of common shares outstanding for the period. Potentially dilutive securities consist of unvested restricted shares and shares that could be issued under outstanding stock options. Potentially dilutive securities are excluded from the computation of net loss per common share if their effect is antidilutive.
The following table sets forth the computation of basic and diluted net loss per share (in thousands, except for per share amounts):
|
|
|
Year Ended December 31, |
|
|||||||||
|
|
|
2017 |
|
|
2016 |
|
|
2015 |
|
|||
|
Net loss |
|
$ |
(44,168 |
) |
|
$ |
(28,017 |
) |
|
$ |
(14,284 |
) |
|
Net loss allocated to unvested restricted shares |
|
|
— |
|
|
|
— |
|
|
|
— |
|
|
Undistributed net loss allocated to common shares |
|
$ |
(44,168 |
) |
|
$ |
(28,017 |
) |
|
$ |
(14,284 |
) |
|
Weighted average shares outstanding — basic |
|
|
29,453 |
|
|
|
28,909 |
|
|
|
28,688 |
|
|
Effects of dilutive securities: |
|
|
|
|
|
|
|
|
|
|
|
|
|
Employee equity compensation plans |
|
|
— |
|
|
|
— |
|
|
|
— |
|
|
Weighted average shares outstanding — diluted |
|
|
29,453 |
|
|
|
28,909 |
|
|
|
28,688 |
|
|
Basic net loss per share |
|
$ |
(1.50 |
) |
|
$ |
(0.97 |
) |
|
$ |
(0.50 |
) |
|
Diluted net loss per share |
|
$ |
(1.50 |
) |
|
$ |
(0.97 |
) |
|
$ |
(0.50 |
) |
Awards of unvested restricted stock representing approximately 0.9 million, 0.8 million, and 0.8 million shares were outstanding for the fiscal years ended December 31, 2017, 2016, and 2015, respectively, and are antidilutive. Beginning in fiscal 2015, the unvested restricted stock did not meet all of the requirements to be deemed participating securities and therefore, are calculated under the treasury method.
Treasury Stock
The Company accounts for treasury stock under the cost method and includes treasury stock as a component of shareholders’ equity until it is canceled. There were no repurchases of the Company’s common stock during fiscal 2017. The Company repurchased 144,315 shares of its common stock during fiscal 2016, pursuant to a share repurchase program approved by the Company’s board of directors. All shares acquired by the Company have been purchased in open-market transactions.
F-10
CAPITAL SENIOR LIVING CORPORATION
NOTES TO CONSOLIDATED FINANCIAL STATEMENTS
December 31, 2017
The Company recognizes compensation expense for share-based payment awards to certain employees and directors, including grants of stock options and awards of restricted stock, in the Consolidated Statements of Operations and Comprehensive Loss based on their fair values.
On May 8, 2007, the Company’s stockholders approved the 2007 Omnibus Stock and Incentive Plan for Capital Senior Living Corporation (as amended, the “2007 Plan”) which provides for, among other things, the grant of restricted stock awards and stock options to purchase shares of the Company’s common stock. The 2007 Plan authorizes the Company to issue up to 4.6 million shares of common stock and the Company currently has 1.1 million shares of common stock reserved for future issuance pursuant to awards under the 2007 Plan.
Segment Information
The Company evaluates the performance and allocates resources of its senior living facilities based on current operations and market assessments on a property-by-property basis. The Company does not have a concentration of operations geographically or by product or service as its management functions are integrated at the property level. The Company has determined that all of its operating units meet the criteria in Accounting Standards Codification (“ASC”) Topic 280, Segment Reporting, to be aggregated into one reporting segment. As such, the Company operates in one segment.
Recently Issued Accounting Guidance
In January 2017, the Financial Accounting Standards Board (“FASB”) issued Accounting Standards Update (“ASU”) 2017-01, Business Combinations – Clarifying the Definition of a Business. ASU 2017-01 provides guidance in accounting for business combinations when determining if the transaction represents acquisitions or disposals of assets or of a business. Under ASU 2017-01, when determining whether an integrated set of assets and activities constitutes a business, entities must compare the fair value of gross assets acquired to the fair value of a single identifiable asset or group of similar identifiable assets. If substantially all of the fair value of the gross assets acquired (or disposed of) is concentrated in the single identifiable assets or group of similar identifiable assets, the integrated set of assets and activities is not characterized as a business. ASU 2017-01 is applied prospectively and is effective for fiscal years beginning after December 15, 2017, and interim periods within those fiscal years. Early application is permitted. Management does not expect the adoption of ASU 2017-01 to have a material impact on the Company’s financial position, results of operations or cash flows.
In November 2016, the FASB issued ASU 2016-18, Statement of Cash Flows (Topic 230): Restricted Cash (a consensus of the FASB Emerging Issues Task Force). ASU 2016-18 requires an entity to include in its cash and cash-equivalent balances in the statement of cash flows those amounts that are deemed to be restricted cash and restricted cash equivalents. ASU 2016-18 is effective for interim and annual reporting periods beginning after December 15, 2017. Management does not expect the adoption of ASU 2016-18 to have a material impact on the Company’s cash flows.
In August 2016, the FASB issued ASU 2016-15, Classification of Certain Cash Receipts and Cash Payments. ASU 2016-15 amends the guidance in ASC 230, which often requires judgment to determine the appropriate classification of cash flows as operating, investing or financing activities and has resulted in diversity in practice in how certain cash receipts and cash payments are classified. ASU 2016-15 is effective for interim and annual reporting periods beginning after December 15, 2017 and should be applied on a retrospective basis. Management does not expect the adoption of ASU 2016-15 to have a material impact on the Company’s cash flows.
F-11
CAPITAL SENIOR LIVING CORPORATION
NOTES TO CONSOLIDATED FINANCIAL STATEMENTS
December 31, 2017
In March 2016, the FASB issued ASU 2016-09, Improvements to Employee Share-based Payment Accounting. ASU 2016-09 simplifies several aspects of the accounting for share-based payment transactions, including the income tax consequences, classification of awards as either equity or liabilities, and classification on the statement of cash flows. The amendments in ASU 2016-09 are effective for annual periods beginning after December 15, 2016, and interim periods within those annual periods. The Company adopted the provisions of ASU 2016-09 on January 1, 2017, and incorporated the provisions of this update into its consolidated financial statements upon adoption. Upon adoption, the Company elected to change its accounting policy to account for forfeitures as they occur. This change was applied on a modified retrospective basis with a cumulative effect adjustment to retained earnings of $0.2 million. Additionally, the adoption of ASU 2016-09 resulted in the Company recording an adjustment of $5.3 million, which resulted in an increase to the Company’s deferred tax asset valuation allowance, to recognize net operating loss carryforwards attributable to excess tax benefits on stock compensation that had not been previously recognized to additional paid in capital. Excess tax benefits for share-based payments are now included in net operating activities rather than net financing activities within the Company’s Consolidated Statements of Cash Flows. As a result of the adoption of ASU 2016-09, these reporting changes have been applied prospectively and prior periods have not been adjusted.
In February 2016, the FASB issued ASU 2016-02, Leases. ASU 2016-02 amends the existing accounting standards for lease accounting, including requiring lessees to recognize most leases on their balance sheets and making targeted changes to lessor accounting. ASU 2016-02 will be effective beginning in 2019. Early adoption of ASU 2016-02 as of its issuance is permitted. The new leases standard requires a modified retrospective transition approach for all leases existing at, or entered into after, the date of initial application, with an option to use certain transition relief. The Company is currently evaluating the impact of adopting the new leases standard on the Company’s consolidated financial statements.
In May 2014, the FASB issued ASU 2014-09, Revenue from Contracts with Customers. ASU 2014-09 affects any entity that either enters into contracts with customers to transfer goods or services or enters into contracts for the transfer of nonfinancial assets. Under ASU 2014-09, an entity will recognize revenue when it transfers promised goods or services to customers in an amount that reflects what it expects in exchange for the goods or services. ASU 2014-09 is effective for annual periods beginning after December 15, 2017. The Company has evaluated the impact the adoption of ASU 2014-09 will have on the Company’s consolidated financial statements and disclosures. Based on our assessment, we do not believe it will have a significant impact on the Company’s consolidated financial statements. The Company is planning to adopt the standard under the modified retrospective adoption.
Use of Estimates and Critical Accounting Policies
The preparation of financial statements in conformity with U.S. generally accepted accounting principles requires management to make estimates and assumptions that affect the amounts reported in the accompanying financial statements and related footnotes. Management bases its estimates and assumptions on historical experience, observance of industry trends and various other sources of information and factors, the results of which form the basis for making judgments about the carrying value of assets and liabilities that are not readily apparent from other sources. Actual results could differ from these estimates. Critical accounting policies are defined as those that are reflective of significant judgments and uncertainties, and potentially could result in materially different results under different assumptions and conditions. The Company believes revenue recognition, purchase accounting, credit risk and allowance for doubtful accounts, lease accounting, employee health and dental benefits, workers’ compensation and insurance reserves, long-lived assets, and income taxes are its most critical accounting policies and/or require management’s most difficult and subjective judgments.
Reclassifications
Certain reclassifications have been made to prior period amounts to conform to current period presentation.
F-12
CAPITAL SENIOR LIVING CORPORATION
NOTES TO CONSOLIDATED FINANCIAL STATEMENTS
December 31, 2017
Fiscal 2017
Effective January 31, 2017 (the “Closing Date”), the Company acquired the underlying real estate through an asset acquisition associated with four of the senior housing communities previously leased from Ventas, Inc. (“Ventas”) for an acquisition price of $85.0 million (the “Four Property Lease Transaction”). The Company obtained interest only, bridge financing from Berkadia Commercial Mortgage LLC (“Berkadia”) for $65.0 million of the acquisition price with an initial variable interest rate of LIBOR plus 4.0% and a 36-month term, with the balance of the acquisition price paid from the Company’s existing cash resources. Additionally, the Company agreed to continue paying $2.3 million of the annual rents associated with the four communities acquired over the remaining lease term of the seven communities remaining in the Ventas Lease Portfolio. As such, the total additional lease payments to be paid over the remaining lease term were discounted back to the Closing Date utilizing a credit-adjusted risk-free rate to determine the fair value of the lease termination financing obligation of $16.0 million. The fair value of the four communities acquired was determined to approximate $88.1 million. The fair values of the property, plant, and equipment of the acquired communities were determined utilizing a direct capitalization method considering facility net operating income and market capitalization rates. These fair value measurements were based on current market conditions as of the acquisition date and are considered Level 3 measurements (fair value measurements using significant unobservable inputs) within the fair value hierarchy of ASC 820-10, Fair Value Measurement. The range of capitalization rates utilized was 7.25% to 8.50%, depending upon the property type, geographical location, and overall quality of each respective community. The acquisition price of $85.0 million and lease termination obligation of $16.0 million resulted in total aggregate consideration by the Company for the acquisition of the four communities of $101.0 million. The Company recorded the difference between the total aggregate consideration ($101.0 million) and the estimated fair value of the four communities acquired ($88.1 million) of $12.9 million as a loss on facility lease termination during the first quarter of fiscal 2017. Additionally, the Company incurred approximately $0.4 million in transaction costs related to this acquisition which have been capitalized as a component of the cost of the assets acquired.
As a result of this asset acquisition, the Company recorded additions to property and equipment of approximately $88.1 million within the Company’s Consolidated Balance Sheets which will be depreciated or amortized over the estimated useful lives.
The purchase accounting for the Springfield Transaction and Cincinnati Transaction, as defined below, which closed during fiscal 2016, was finalized during the first quarter of fiscal 2017 and valuation adjustments resulted in the Company reclassifying approximately $1.3 million from property and equipment to other assets to reflect the final purchase price allocation.
Fiscal 2016
Effective November 2, 2016, the Company closed the acquisition of one senior housing community located in Cincinnati, Ohio, for $29.0 million (the “Cincinnati Acquisition”). The community consists of 45 independent living units and 77 assisted living units. The Company incurred approximately $0.2 million in transaction costs related to this acquisition which have been included in general and administrative expenses within the Company’s Consolidated Statements of Operations and Comprehensive Loss. The Company obtained financing from Fannie Mae for approximately $22.0 million of the acquisition price at a fixed interest rate of 4.24% with a 10-year term with the balance of the acquisition price paid from the Company’s existing cash resources.
Effective September 30, 2016, the Company closed the acquisition of one senior housing community located in Springfield, Massachusetts, for $27.0 million (the “Springfield Transaction”). The community consists of 97 independent living units and 90 assisted living units. The Company incurred approximately $0.3 million in transaction costs related to this acquisition which have been included in general and administrative expenses within the Company’s Consolidated Statements of Operations and Comprehensive Loss. The Company obtained financing from Fannie Mae for $20.3 million of the acquisition price at a fixed interest rate of 4.10% with a 10-year term with the balance of the acquisition price paid from the Company’s existing cash resources.
F-13
CAPITAL SENIOR LIVING CORPORATION
NOTES TO CONSOLIDATED FINANCIAL STATEMENTS
December 31, 2017
Effective September 27, 2016, the Company closed the acquisition of one senior housing community located in Kingwood, Texas for $18.0 million (the “Kingwood Transaction”). The community consists of 96 assisted living units. The Company incurred approximately $0.2 million in transaction costs related to this acquisition which have been included in general and administrative expenses within the Company’s Consolidated Statements of Operations and Comprehensive Loss. The Company obtained financing from Protective Life Insurance Company (“Protective Life”) for $13.0 million of the acquisition price at a fixed interest rate of 4.13% with a 15-year term with the balance of the acquisition price paid from the Company’s existing cash resources.
Effective February 16, 2016, the Company closed the acquisition of two senior housing communities located in Pensacola, Florida, for $48.0 million (the “Pensacola Transaction”). The two communities consist of 179 assisted living units. The Company incurred approximately $0.3 million in transaction costs related to this acquisition which have been included in general and administrative expenses within the Company’s Consolidated Statements of Operations and Comprehensive Loss. The Company obtained financing from Protective Life for $35.0 million of the acquisition price at a fixed interest rate of 4.38% with a 10-year term with the balance of the acquisition price paid from the Company’s existing cash resources.
Effective January 26, 2016, the Company closed the acquisition of three senior housing communities located in Colby, Park Falls, and Wisconsin Rapids, Wisconsin, for approximately $16.8 million (the “Pine Ridge Transaction”). The three communities consist of 138 assisted living units. The Company incurred approximately $0.1 million in transaction costs related to this acquisition which have been included in general and administrative expenses within the Company’s Consolidated Statements of Operations and Comprehensive Loss. The Company obtained financing from Protective Life for $11.3 million of the acquisition price at a fixed interest rate of 4.50% with a 10-year term with the balance of the acquisition price paid from the Company’s existing cash resources.
As a result of these acquisitions, the Company recorded additions to property and equipment of approximately $126.0 million and other assets of approximately $12.8 million, primarily consisting of in-place lease intangibles, within the Company’s Consolidated Balance Sheets which will be depreciated or amortized over the estimated useful lives. During fiscal 2016, final valuation adjustments associated with 2015 senior housing community acquisitions resulted in the Company reclassifying approximately $1.3 million from other assets to property and equipment. As a result of adoption of ASU 2015-16, prior periods were not adjusted and recast to reflect this reclassification within the Company’s Consolidated Balance Sheets.
During fiscal 2016, these acquisitions generated $15.5 million of revenue and $(7.7) million of losses before income taxes which are included in the Company’s Consolidated Statements of Operations and Comprehensive Loss from the dates of acquisition. Losses before income taxes primarily result from the amortization of in-place lease intangibles associated with acquisitions during fiscal 2016 and 2015. The unaudited pro forma combined results of operations have been prepared as if the acquisitions had occurred on January 1, 2015, as follows (in thousands):
|
|
|
December 31, |
|
|||||
|
|
|
2016 |
|
|
2015 |
|
||
|
Total revenues |
|
$ |
461,653 |
|
|
$ |
434,967 |
|
|
Loss before income taxes |
|
$ |
(19,389 |
) |
|
$ |
(27,374 |
) |
The unaudited pro forma consolidated amounts are presented for informational purposes only and do not necessarily reflect the results of operations of the Company that would have actually resulted had the acquisitions occurred on January 1, 2015.
F-14
CAPITAL SENIOR LIVING CORPORATION
NOTES TO CONSOLIDATED FINANCIAL STATEMENTS
December 31, 2017
Property and equipment consists of the following (in thousands):
|
|
|
|
|
December 31, |
|
|||||
|
|
|
Asset Lives |
|
2017 |
|
|
2016 |
|
||
|
Land |
|
|
|
$ |
69,842 |
|
|
$ |
66,755 |
|
|
Land improvements |
|
5 to 20 years |
|
|
24,665 |
|
|
|
21,644 |
|
|
Buildings and building improvements |
|
10 to 40 years |
|
|
1,148,816 |
|
|
|
1,030,676 |
|
|
Furniture and equipment |
|
5 to 10 years |
|
|
62,614 |
|
|
|
51,471 |
|
|
Automobiles |
|
5 to 7 years |
|
|
6,236 |
|
|
|
5,776 |
|
|
Leasehold improvements |
|
(1) |
|
|
85,384 |
|
|
|
77,364 |
|
|
Construction in progress |
|
NA |
|
|
5,711 |
|
|
|
23,906 |
|
|
|
|
|
|
|
1,403,268 |
|
|
|
1,277,592 |
|
|
Less accumulated depreciation and amortization |
|
|
|
|
(303,482 |
) |
|
|
(245,162 |
) |
|
Property and equipment, net |
|
|
|
$ |
1,099,786 |
|
|
$ |
1,032,430 |
|
|
(1) |
Leasehold improvements are amortized over the shorter of the useful life of the asset or the remaining lease term. |
At December 31, 2017 and 2016, furniture and equipment included $3.2 million of capitalized computer software development costs of which $3.0 million and $2.8 million, respectively, has been amortized and is included as a component of accumulated depreciation and amortization. During fiscal 2017, final valuation adjustments associated with senior housing community acquisitions in fiscal 2016 resulted in the Company reclassifying approximately $1.3 million from property and equipment to other assets; however, as a result of adoption of ASU 2015-16, the Consolidated Balance Sheet for the year ended December 31, 2016, has not been adjusted and recast to reflect these reclassification adjustments.
Property and equipment includes $31.8 million of assets under capital lease in connection with the Ventas Lease Transaction, as discussed at Note 15, “Leases,” of which $15.4 million and $14.6 million has been amortized and is included as a component of accumulated depreciation and amortization at December 31, 2017 and 2016, respectively.
|
5. |
Other Assets |
Other assets consist of the following (in thousands):
|
|
|
December 31, |
|
|||||
|
|
|
2017 |
|
|
2016 |
|
||
|
Deferred lease costs, net |
|
$ |
5,555 |
|
|
$ |
7,538 |
|
|
Security and other deposits |
|
|
10,234 |
|
|
|
14,274 |
|
|
In-place lease intangibles, net |
|
|
— |
|
|
|
6,301 |
|
|
Other |
|
|
3,047 |
|
|
|
3,210 |
|
|
|
|
$ |
18,836 |
|
|
$ |
31,323 |
|
In connection with the Company’s acquisitions and certain of its lease transactions, subject to final valuation adjustments, the Company records additions to in-place lease intangibles in order to reflect the value associated with the resident operating leases acquired. In-place lease intangibles are being amortized over the estimated remaining useful life of the respective resident operating leases. The value of in-place leases includes lost revenue that would be realized if the resident operating leases were to be replaced by the Company.
F-15
CAPITAL SENIOR LIVING CORPORATION
NOTES TO CONSOLIDATED FINANCIAL STATEMENTS
December 31, 2017
During fiscal 2017, final valuation adjustments associated with senior housing community acquisitions in 2016 resulted in the Company reclassifying approximately $1.3 million from property and equipment to other assets; however, as a result of adoption of ASU 2015-16, the Consolidated Balance Sheet for the year ended December 31, 2016, has not been adjusted and recast to reflect these reclassification adjustments.
At December 31, 2016, the Company had gross in-place lease intangibles of approximately $86.5 million of which approximately $80.2 million had been amortized. The unamortized ending balance of approximately $6.3 million at December 31, 2016, was fully amortized during fiscal 2017.
|
6. |
Accrued Expenses |
Accrued expenses consist of the following (in thousands):
|
|
|
December 31, |
|
|||||
|
|
|
2017 |
|
|
2016 |
|
||
|
Accrued salaries, bonuses and related expenses |
|
$ |
13,015 |
|
|
$ |
12,465 |
|
|
Accrued property taxes |
|
|
14,208 |
|
|
|
14,244 |
|
|
Accrued interest |
|
|
3,757 |
|
|
|
3,288 |
|
|
Accrued health claims and workers comp |
|
|
4,547 |
|
|
|
3,998 |
|
|
Accrued professional fees |
|
|
763 |
|
|
|
792 |
|
|
Other |
|
|
4,461 |
|
|
|
4,277 |
|
|
|
|
$ |
40,751 |
|
|
$ |
39,064 |
|
F-16
CAPITAL SENIOR LIVING CORPORATION
NOTES TO CONSOLIDATED FINANCIAL STATEMENTS
December 31, 2017
Notes payable consists of the following (in thousands):
|
|
|
Average Monthly |
|
|
Net Book Value |
|
|
Interest |
|
|
Maturity |
|
Notes Payable December 31, |
|
||||||||
|
Lender |
|
Payment |
|
|
Of Collateral(1) |
|
|
Rate |
|
|
Date |
|
2017 |
|
|
2016 |
|
|||||
|
Fannie Mae |
|
$ |
78 |
|
|
$ |
14,534 |
|
|
|
5.69 |
|
|
August 2021 |
|
$ |
12,283 |
|
|
$ |
12,507 |
|
|
Fannie Mae |
|
|
26 |
|
|
|
5,675 |
|
|
|
4.97 |
|
|
October 2021 |
|
|
4,331 |
|
|
|
4,419 |
|
|
Fannie Mae |
|
|
101 |
|
|
|
20,586 |
|
|
|
4.92 |
|
|
October 2021 |
|
|
17,097 |
|
|
|
17,448 |
|
|
Fannie Mae |
|
|
27 |
|
|
|
20,586 |
|
|
|
5.19 |
|
|
October 2021 |
|
|
4,839 |
|
|
|
4,911 |
|
|
Fannie Mae |
|
|
117 |
|
|
|
22,981 |
|
|
|
4.92 |
|
|
November 2021 |
|
|
19,886 |
|
|
|
20,291 |
|
|
Fannie Mae |
|
|
27 |
|
|
|
5,990 |
|
|
|
4.38 |
|
|
March 2022 |
|
|
4,831 |
|
|
|
4,936 |
|
|
Fannie Mae |
|
|
60 |
|
|
|
11,700 |
|
|
|
4.76 |
|
|
April 2022 |
|
|
10,403 |
|
|
|
10,614 |
|
|
Fannie Mae |
|
|
19 |
|
|
|
11,700 |
|
|
|
4.85 |
|
|
April 2022 |
|
|
3,470 |
|
|
|
3,522 |
|
|
Fannie Mae |
|
|
135 |
|
|
|
26,638 |
|
|
|
4.69 |
|
|
April 2022 |
|
|
23,637 |
|
|
|
24,123 |
|
|
Fannie Mae |
|
|
11 |
|
|
|
4,178 |
|
|
|
4.97 |
|
|
April 2022 |
|
|
2,022 |
|
|
|
2,051 |
|
|
Fannie Mae |
|
|
60 |
|
|
|
15,214 |
|
|
|
4.48 |
|
|
May 2022 |
|
|
10,699 |
|
|
|
10,926 |
|
|
Fannie Mae |
|
|
20 |
|
|
|
15,214 |
|
|
|
4.85 |
|
|
May 2022 |
|
|
3,697 |
|
|
|
3,752 |
|
|
Fannie Mae |
|
|
144 |
|
|
|
34,196 |
|
|
|
4.34 |
|
|
November 2022 |
|
|
26,382 |
|
|
|
26,935 |
|
|
Fannie Mae |
|
|
33 |
|
|
|
7,384 |
|
|
|
4.50 |
|
|
November 2022 |
|
|
5,881 |
|
|
|
6,000 |
|
|
Fannie Mae |
|
|
43 |
|
|
|
26,135 |
|
|
|
5.49 |
|
|
November 2022 |
|
|
7,403 |
|
|
|
7,504 |
|
|
Fannie Mae |
|
|
84 |
|
|
|
17,197 |
|
|
|
4.32 |
|
|
January 2023 |
|
|
15,532 |
|
|
|
15,856 |
|
|
Fannie Mae |
|
|
49 |
|
|
|
17,197 |
|
|
|
5.39 |
|
|
January 2023 |
|
|
8,453 |
|
|
|
8,572 |
|
|
Fannie Mae |
|
|
39 |
|
|
|
8,311 |
|
|
|
4.58 |
|
|
January 2023 |
|
|
6,953 |
|
|
|
7,092 |
|
|
Fannie Mae |
|
|
17 |
|
|
|
8,311 |
|
|
|
5.49 |
|
|
January 2023 |
|
|
3,029 |
|
|
|
— |
|
|
Fannie Mae |
|
|
85 |
|
|
|
17,613 |
|
|
|
4.66 |
|
|
April 2023 |
|
|
15,131 |
|
|
|
15,423 |
|
|
Fannie Mae |
|
|
18 |
|
|
|
5,242 |
|
|
|
5.46 |
|
|
April 2023 |
|
|
3,068 |
|
|
|
3,110 |
|
|
Fannie Mae |
|
|
45 |
|
|
|
8,560 |
|
|
|
5.93 |
|
|
October 2023 |
|
|
7,205 |
|
|
|
7,312 |
|
|
Fannie Mae |
|
|
67 |
|
|
|
13,398 |
|
|
|
5.50 |
|
|
November 2023 |
|
|
11,180 |
|
|
|
11,359 |
|
|
Fannie Mae |
|
|
67 |
|
|
|
12,634 |
|
|
|
5.38 |
|
|
November 2023 |
|
|
11,236 |
|
|
|
11,419 |
|
|
Fannie Mae |
|
|
282 |
|
|
|
52,384 |
|
|
|
5.56 |
|
|
January 2024 |
|
|
46,662 |
|
|
|
47,390 |
|
|
Fannie Mae |
|
|
632 |
|
|
|
113,697 |
|
|
|
4.24 |
|
|
July 2024 |
|
|
121,141 |
|
|
|
123,465 |
|
|
Fannie Mae |
|
|
120 |
|
|
|
26,087 |
|
|
|
4.48 |
|
|
July 2024 |
|
|
22,394 |
|
|
|
22,806 |
|
|
Fannie Mae |
|
|
81 |
|
|
|
20,645 |
|
|
|
4.30 |
|
|
July 2024 |
|
|
15,462 |
|
|
|
15,756 |
|
|
Fannie Mae |
|
|
91 |
|
|
|
68,299 |
|
|
|
4.98 |
|
|
July 2024 |
|
|
16,579 |
|
|
|
16,822 |
|
|
Fannie Mae |
|
|
134 |
|
|
|
27,541 |
|
|
|
4.59 |
|
|
September 2024 |
|
|
24,805 |
|
|
|
25,247 |
|
|
Fannie Mae |
|
|
22 |
|
|
|
13,867 |
|
|
|
5.72 |
|
|
September 2024 |
|
|
3,682 |
|
|
|
3,724 |
|
|
Fannie Mae |
|
|
54 |
|
|
|
10,711 |
|
|
|
4.70 |
|
|
September 2024 |
|
|
9,864 |
|
|
|
10,037 |
|
|
Fannie Mae |
|
|
53 |
|
|
|
12,277 |
|
|
|
4.50 |
|
|
January 2025 |
|
|
9,915 |
|
|
|
10,091 |
|
|
Fannie Mae |
|
|
95 |
|
|
|
6,313 |
|
|
|
4.46 |
|
|
January 2025 |
|
|
18,023 |
|
|
|
18,345 |
|
|
Fannie Mae |
|
|
70 |
|
|
|
15,660 |
|
|
|
4.35 |
|
|
February 2025 |
|
|
13,434 |
|
|
|
13,678 |
|
|
Fannie Mae |
|
|
109 |
|
|
|
8,913 |
|
|
|
3.85 |
|
|
March 2025 |
|
|
22,086 |
|
|
|
22,522 |
|
|
Fannie Mae |
|
|
102 |
|
|
|
24,411 |
|
|
|
3.84 |
|
|
April 2025 |
|
|
20,749 |
|
|
|
21,157 |
|
|
Fannie Mae |
|
|
31 |
|
|
|
24,411 |
|
|
|
5.53 |
|
|
April 2025 |
|
|
5,372 |
|
|
|
5,435 |
|
|
Fannie Mae |
|
|
47 |
|
|
|
9,822 |
|
|
|
4.55 |
|
|
June 2025 |
|
|
8,794 |
|
|
|
8,944 |
|
|
Fannie Mae |
|
|
59 |
|
|
|
12,332 |
|
|
|
4.79 |
|
|
June 2025 |
|
|
10,753 |
|
|
|
10,929 |
|
|
Fannie Mae |
|
|
81 |
|
|
|
15,898 |
|
|
|
5.30 |
|
|
June 2025 |
|
|
13,580 |
|
|
|
13,811 |
|
|
Fannie Mae |
|
|
24 |
|
|
|
12,332 |
|
|
|
5.71 |
|
|
June 2025 |
|
|
4,079 |
|
|
|
— |
|
|
Fannie Mae |
|
|
58 |
|
|
|
12,968 |
|
|
|
4.69 |
|
|
October 2025 |
|
|
10,780 |
|
|
|
10,956 |
|
F-17
CAPITAL SENIOR LIVING CORPORATION
NOTES TO CONSOLIDATED FINANCIAL STATEMENTS
December 31, 2017
|
|
|
Average Monthly |
|
|
Net Book Value |
|
|
Interest |
|
|
Maturity |
|
Notes Payable December 31, |
|
||||||||
|
Lender |
|
Payment |
|
|
Of Collateral(1) |
|
|
Rate |
|
|
Date |
|
2017 |
|
|
2016 |
|
|||||
|
|
|
44 |
|
|
|
9,648 |
|
|
|
4.70 |
|
|
October 2025 |
|
|
8,147 |
|
|
|
8,280 |
|
|
|
Fannie Mae |
|
|
273 |
|
|
|
39,692 |
|
|
|
4.68 |
|
|
December 2025 |
|
|
51,163 |
|
|
|
51,991 |
|
|
Fannie Mae |
|
|
9 |
|
|
|
9,229 |
|
|
|
5.81 |
|
|
December 2025 |
|
|
1,445 |
|
|
|
1,461 |
|
|
Fannie Mae |
|
|
62 |
|
|
|
11,382 |
|
|
|
5.43 |
|
|
April 2026 |
|
|
10,443 |
|
|
|
10,607 |
|
|
Fannie Mae |
|
|
29 |
|
|
|
11,382 |
|
|
|
5.84 |
|
|
April 2026 |
|
|
4,903 |
|
|
|
4,957 |
|
|
Fannie Mae |
|
|
98 |
|
|
|
22,563 |
|
|
|
4.10 |
|
|
October 2026 |
|
|
19,854 |
|
|
|
20,195 |
|
|
Fannie Mae |
|
|
108 |
|
|
|
25,235 |
|
|
|
4.24 |
|
|
December 2026 |
|
|
21,617 |
|
|
|
21,975 |
|
|
Protective Life |
|
|
96 |
|
|
|
24,806 |
|
|
|
3.55 |
|
|
April 2025 |
|
|
20,234 |
|
|
|
20,665 |
|
|
Protective Life |
|
|
49 |
|
|
|
11,429 |
|
|
|
4.25 |
|
|
August 2025 |
|
|
9,535 |
|
|
|
9,713 |
|
|
Protective Life |
|
|
78 |
|
|
|
18,092 |
|
|
|
4.25 |
|
|
September 2025 |
|
|
15,163 |
|
|
|
15,444 |
|
|
Protective Life |
|
|
138 |
|
|
|
33,301 |
|
|
|
4.25 |
|
|
November 2025 |
|
|
26,993 |
|
|
|
27,447 |
|
|
Protective Life |
|
|
57 |
|
|
|
14,070 |
|
|
|
4.50 |
|
|
February 2026 |
|
|
10,959 |
|
|
|
11,149 |
|
|
Protective Life |
|
|
187 |
|
|
|
42,753 |
|
|
|
4.38 |
|
|
March 2026 |
|
|
33,705 |
|
|
|
34,396 |
|
|
Protective Life |
|
|
70 |
|
|
|
15,505 |
|
|
|
4.13 |
|
|
October 2031 |
|
|
12,645 |
|
|
|
12,950 |
|
|
Berkadia |
|
|
78 |
|
|
|
19,476 |
|
|
|
(3 |
) |
|
April 2019(5) |
|
|
11,505 |
|
|
|
11,742 |
|
|
Berkadia |
|
|
298 |
|
|
|
96,952 |
|
|
|
(4 |
) |
|
February 2020 |
|
|
65,000 |
|
|
|
— |
|
|
HUD |
|
|
16 |
|
|
|
5,622 |
|
|
|
4.48 |
|
|
September 2045 |
|
|
2,989 |
|
|
|
3,042 |
|
|
Insurance Financing |
|
|
146 |
|
|
|
— |
|
|
|
2.76 |
|
|
May 2018 |
|
|
725 |
|
|
|
— |
|
|
Insurance Financing |
|
|
324 |
|
|
|
— |
|
|
|
3.04 |
|
|
November 2018 |
|
|
3,505 |
|
|
|
— |
|
|
Insurance Financing |
|
|
— |
|
|
|
— |
|
|
|
1.73 |
|
|
October 2017 |
|
|
— |
|
|
|
756 |
|
|
Insurance Financing |
|
|
— |
|
|
|
— |
|
|
|
1.73 |
|
|
May 2017 |
|
|
— |
|
|
|
691 |
|
|
Insurance Financing |
|
|
— |
|
|
|
— |
|
|
|
1.79 |
|
|
September 2017 |
|
|
— |
|
|
|
1,576 |
|
|
|
|
$ |
5,677 |
|
|
|
|
|
|
4.60%(2) |
|
|
|
|
$ |
967,332 |
|
|
$ |
910,234 |
|
|
|
Less deferred loan costs, net |
|
|
|
|
|
|
|
|
|
|
|
|
|
|
|
|
9,398 |
|
|
|
9,841 |
|
|
|
|
|
|
|
|
|
|
|
|
|
|
|
|
|
|
$ |
957,934 |
|
|
$ |
900,393 |
|
|
Less current portion |
|
|
|
|
|
|
|
|
|
|
|
|
|
|
|
|
19,728 |
|
|
|
17,889 |
|
|
|
|
|
|
|
|
|
|
|
|
|
|
|
|
|
|
$ |
938,206 |
|
|
$ |
882,504 |
|
|
(1) |
81 of the facilities owned by the Company are encumbered by mortgage debt and are provided as collateral under their respective loan agreements. |
|
(2) |
Weighted average interest rate on current fixed interest rate debt outstanding. |
|
(3) |
Variable interest rate of LIBOR plus 4.50%, which was 5.93% at December 31, 2017. |
|
(4) |
Variable interest rate of LIBOR plus 4.00%, which was 5.43% at December 31, 2017. |
|
(5) |
Effective July 31, 2017, the Company extended the maturity date with Berkadia to April 1, 2019. |
F-18
CAPITAL SENIOR LIVING CORPORATION
NOTES TO CONSOLIDATED FINANCIAL STATEMENTS
December 31, 2017
The aggregate scheduled maturities of notes payable at December 31, 2017 are as follows (in thousands):
|
2018 |
|
$ |
21,421 |
|
|
2019 |
|
|
28,994 |
|
|
2020 |
|
|
83,482 |
|
|
2021 |
|
|
72,706 |
|
|
2022 |
|
|
106,161 |
|
|
Thereafter |
|
|
654,568 |
|
|
|
|
$ |
967,332 |
|
On December 15, 2017, the Company completed supplemental mortgage financing of approximately $4.1 million from Fannie Mae at a fixed interest rate of 5.71% on one community located in Oneonta, New York. The supplemental mortgage loan is coterminous, cross-collateralized and cross-defaulted with the original existing mortgage debt maturing in June 2025. The Company incurred approximately $0.2 million in deferred financing costs related to this loan, which are being amortized over the remaining initial loan term.
On December 1, 2017, the Company renewed certain insurance policies and entered into a finance agreement totaling approximately $3.5 million. The finance agreement has a fixed interest rate of 3.04% with the principal being repaid over an 11-month term.
On November 30, 2017, the Company completed supplemental mortgage financing of approximately $3.0 million from Fannie Mae at a fixed interest rate of 5.49% on one community located in Rocky River, Ohio. The supplemental mortgage loan is coterminous, cross-collateralized and cross-defaulted with the original existing mortgage debt maturing in January 2023. The Company incurred approximately $0.1 million in deferred financing costs related to this loan, which are being amortized over the remaining initial loan term.
On May 31, 2017, the Company renewed certain insurance policies and entered into a finance agreement totaling approximately $1.6 million. The finance agreement has a fixed interest rate of 2.76% with the principal being repaid over an 11-month term.
On January 31, 2017, in conjunction with the Four Property Lease Transaction, the Company obtained $65.0 million of mortgage debt from Berkadia. The new mortgage loan is interest-only and has a three-year term with an initial variable interest rate of LIBOR plus 4.00%. The Company incurred approximately $0.9 million in deferred financing costs related to this loan, which are being amortized over three years.
On December 22, 2016, the Company completed supplemental mortgage financing of approximately $5.0 million from Fannie Mae at a fixed interest rate of 5.84% on one community located in Lamberville, Michigan. The supplemental mortgage loan is coterminous, cross-collateralized and cross-defaulted with the original existing mortgage debt maturing in April 2026. The Company incurred approximately $0.1 million in deferred financing costs related to this loan, which are being amortized over the remaining initial loan term.
On December 22, 2016, the Company completed supplemental mortgage financing of approximately $1.5 million from Fannie Mae at a fixed interest rate of 5.81% on one community located in Mishawaka, Indiana. The supplemental mortgage loan is coterminous, cross-collateralized and cross-defaulted with the original existing mortgage debt maturing in December 2025. The Company incurred approximately $45,000 in deferred financing costs related to this loan, which are being amortized over the remaining initial loan term.
F-19
CAPITAL SENIOR LIVING CORPORATION
NOTES TO CONSOLIDATED FINANCIAL STATEMENTS
December 31, 2017
On December 22, 2016, the Company completed supplemental mortgage financing of approximately $3.7 million from Fannie Mae at a fixed interest rate of 5.72% on one community located in Roanoke, Virginia. The supplemental mortgage loan is coterminous, cross-collateralized and cross-defaulted with the original existing mortgage debt maturing in September 2024. The Company incurred approximately $0.1 million in deferred financing costs related to this loan, which are being amortized over the remaining initial loan term.
On December 15, 2016, the Company completed supplemental mortgage financing of approximately $5.4 million from Fannie Mae at a fixed interest rate of 5.53% on one community located in Toledo, Ohio. The supplemental mortgage loan is coterminous, cross-collateralized and cross-defaulted with the original existing mortgage debt maturing in April 2025. The Company incurred approximately $0.1 million in deferred financing costs related to this loan, which are being amortized over the remaining initial loan term.
On December 1, 2016, the Company renewed certain insurance policies and entered into a finance agreement totaling approximately $0.8 million. The finance agreement has a fixed interest rate of 1.66% with principal amortized over a 10-month term.
On November 2, 2016, in conjunction with the Cincinnati Transaction, the Company obtained $22.0 million of mortgage debt from Fannie Mae. The new mortgage loan has a 10-year term with a 4.24% fixed interest rate and the principal amortized over a 30-year term. The Company incurred approximately $0.2 million in deferred financing costs related to this loan, which are being amortized over 10 years.
On September 30, 2016, in conjunction with the Springfield Transaction, the Company obtained $20.3 million of mortgage debt from Fannie Mae. The new mortgage loan has a 10-year term with a 4.10% fixed interest rate and the principal amortized over a 30-year term. The Company incurred approximately $0.2 million in deferred financing costs related to this loan, which are being amortized over 10 years.
On September 27, 2016, in conjunction with the Kingwood Transaction, the Company obtained $13.0 million of mortgage debt from Protective Life. The new mortgage loan has a 15-year term with a 4.13% fixed interest rate and the principal amortized over a 30-year term. The Company incurred approximately $0.2 million in deferred financing costs related to this loan, which are being amortized over 15 years.
On September 23, 2016, the Company completed supplemental mortgage financing of approximately $3.5 million from Fannie Mae at a fixed interest rate of 4.85% on one community located in Jeffersonville, Indiana, with existing mortgage debt maturing in April 2022. The supplemental mortgage loan is cross-collateralized and cross-defaulted with the original mortgage debt. The Company incurred approximately $0.1 million in deferred financing costs related to this loan, which are being amortized over the remaining initial loan term.
On September 23, 2016, the Company completed supplemental mortgage financing of approximately $3.8 million from Fannie Mae at a fixed interest rate of 4.85% on one community located in Irving, Texas, with existing mortgage debt maturing in May 2022. The supplemental mortgage loan is cross-collateralized and cross-defaulted with the original mortgage debt. The Company incurred approximately $0.1 million in deferred financing costs related to this loan, which are being amortized over the remaining initial loan term.
On August 2, 2016, the Company completed supplemental mortgage financing of approximately $2.1 million from Fannie Mae at a fixed interest rate of 4.97% on one senior housing community located in Conroe, Texas. The supplemental mortgage loan is coterminous, cross-collateralized and cross-defaulted with the original mortgage debt maturing in April 2022. The Company incurred approximately $0.1 million in deferred financing costs related to this loan, which are being amortized over the remaining initial loan term.
F-20
CAPITAL SENIOR LIVING CORPORATION
NOTES TO CONSOLIDATED FINANCIAL STATEMENTS
December 31, 2017
Effective July 31, 2016, the Company extended the maturity of its mortgage loan with Berkadia on one of its senior housing communities located in Canton, Ohio. The maturity date was extended from July 10, 2017 to July 10, 2018 with an initial variable interest rate of LIBOR plus 4.50% with principal amortized over 25 years. In conjunction with the loan extension, the Company incurred an extension fee of approximately $30,000 which will be amortized over the new loan term.
On June 15, 2016, the Company completed supplemental mortgage financing of approximately $16.9 million from Fannie Mae at a fixed interest rate of 4.98% on four senior housing communities located in Texas, two senior housing communities located in Ohio, and one senior housing community located in Missouri. The supplemental mortgage loans are coterminous, cross-collateralized and cross-defaulted with the original mortgage debt maturing in July 2024. The Company incurred approximately $0.5 million in deferred financing costs related to these loans, which are being amortized over the remaining initial loan terms.
On May 31, 2016, the Company renewed certain insurance policies and entered into a finance agreement totaling approximately $2.6 million. The finance agreement has a fixed interest rate of 2.16% with principal amortized over a 15-month term.
On May 31, 2016, the Company renewed certain insurance policies and entered into a finance agreement totaling approximately $1.5 million. The finance agreement has a fixed interest rate of 2.16% with principal amortize over an 11-month term.
On May 3, 2016, the Company drew down approximately $2.6 million of supplemental funding proceeds from Protective Life associated with the previous acquisition of one senior housing community located in Indianapolis, Indiana, during fiscal 2015, at a fixed interest rate of 4.25% with a 10-year term and principal amortized over a 30-year term. The loan commitment was based on certain funding requirements being met and was available to the Company through February 28, 2018.
On February 16, 2016, in conjunction with the Pensacola Transaction, the Company obtained $35.0 million of mortgage debt from Protective Life. The new mortgage loan has a 10-year term with a 4.38% fixed interest rate and the principal amortized over a 30-year term. The Company incurred approximately $0.4 million in deferred financing costs related to this loan, which are being amortized over 10 years.
On January 26, 2016, in conjunction with the Pine Ridge Transaction, the Company obtained approximately $11.3 million of mortgage debt from Protective Life. The new mortgage loan has a 10-year term with a 4.50% fixed interest rate and the principal amortized over a 30-year term. The Company incurred approximately $0.2 million in deferred financing costs related to this loan, which are being amortized over 10 years.
The Company issued standby letters of credit with Wells Fargo Bank (“Wells Fargo”), totaling approximately $3.9 million, for the benefit of Hartford Financial Services (“Hartford”) associated with the administration of workers compensation which remain outstanding as of December 31, 2017.
The Company issued standby letters of credit with JPMorgan Chase Bank (“Chase”), totaling approximately $6.7 million, for the benefit of Welltower, Inc. (“Welltower”), formerly Healthcare REIT, Inc. on certain leases between Welltower and the Company which remain outstanding as of December 31, 2017.
The Company issued standby letters of credit with Chase, totaling approximately $2.9 million, for the benefit of HCP, Inc. (“HCP”) on certain leases between HCP and the Company which remain outstanding as of December 31, 2017.
F-21
CAPITAL SENIOR LIVING CORPORATION
NOTES TO CONSOLIDATED FINANCIAL STATEMENTS
December 31, 2017
In connection with the Company’s loan commitments described above, the Company incurred financing charges that were deferred and amortized over the life of the notes. At December 31, 2017 and 2016, the Company had gross deferred loan costs of $14.0 million and $12.8 million, respectively. Accumulated amortization was $4.6 million and $3.0 million at December 31, 2017 and 2016, respectively. Amortization expense is expected to be approximately $1.7 million in each of the next five fiscal years. The Company was in compliance with all aspects of its outstanding indebtedness at December 31, 2017 and 2016.
|
8. |
Equity |
Preferred Stock
The Company is authorized to issue preferred stock in series and to fix and state the voting powers and such designations, preferences and relative participating, optional or other special rights of the shares of each such series and the qualifications, limitations and restrictions thereof. Such action may be taken by the Board without stockholder approval. The rights, preferences and privileges of holders of common stock are subject to the rights of the holders of preferred stock. No preferred stock was outstanding as of December 31, 2017 and 2016.
Share Repurchases
On January 22, 2009, the Company’s board of directors approved a share repurchase program that authorized the Company to purchase up to $10.0 million of the Company’s common stock. Purchases may be made from time to time using a variety of methods, which may include open market purchases, privately negotiated transactions or block trades, or by any combination of such methods, in accordance with applicable insider trading and other securities laws and regulations. The size, scope and timing of any purchases will be based on business, market and other conditions and factors, including price, regulatory and contractual requirements or consents, and capital availability. The repurchase program does not obligate the Company to acquire any particular amount of common stock and the share repurchase authorization has no stated expiration date. Shares of stock repurchased under the program will be held as treasury shares. Pursuant to this authorization, during fiscal 2009, the Company purchased 349,800 shares at an average cost of $2.67 per share for a total cost to the Company of approximately $0.9 million. On January 14, 2016, the Company announced that its board of directors approved a continuation of the share repurchase program. Pursuant to this authorization, during fiscal 2016, the Company purchased 144,315 shares of its common stock at an average cost of $17.29 per share for a total cost to the Company of approximately $2.5 million. All such purchases were made in open market transactions. There were no repurchases of the Company’s common stock during fiscal 2017.
|
9. |
Stock-Based Compensation |
Stock Options
Although the Company has not granted stock options in recent years, the Company’s stock option program is a long-term retention program that is intended to attract, retain and provide incentives for employees, officers and directors and to more closely align stockholder and employee interests. The Company’s stock options generally vest over one to five years and the related expense is amortized on a straight-line basis over the vesting period.
F-22
CAPITAL SENIOR LIVING CORPORATION
NOTES TO CONSOLIDATED FINANCIAL STATEMENTS
December 31, 2017
A summary of the Company’s stock option activity and related information for the years ended December 31, 2017, 2016, and 2015 is presented below:
|
|
|
Outstanding at Beginning of Year |
|
|
Granted |
|
|
Exercised |
|
|
Forfeited |
|
|
Outstanding End of Year |
|
|
Options Exercisable |
|
||||||
|
December 31, 2017 |
|
|
|
|
|
|
|
|
|
|
|
|
|
|
|
|
|
|
|
|
|
|
|
|
|
Shares |
|
|
— |
|
|
|
— |
|
|
|
— |
|
|
|
— |
|
|
|
— |
|
|
|
— |
|
|
Weighted average price |
|
$ |
— |
|
|
|
— |
|
|
$ |
— |
|
|
|
— |
|
|
$ |
— |
|
|
$ |
— |
|
|
December 31, 2016 |
|
|
|
|
|
|
|
|
|
|
|
|
|
|
|
|
|
|
|
|
|
|
|
|
|
Shares |
|
|
3,000 |
|
|
|
— |
|
|
|
3,000 |
|
|
|
— |
|
|
|
— |
|
|
|
— |
|
|
Weighted average price |
|
$ |
10.97 |
|
|
|
— |
|
|
$ |
10.97 |
|
|
|
— |
|
|
$ |
— |
|
|
$ |
— |
|
|
December 31, 2015 |
|
|
|
|
|
|
|
|
|
|
|
|
|
|
|
|
|
|
|
|
|
|
|
|
|
Shares |
|
|
6,000 |
|
|
|
— |
|
|
|
3,000 |
|
|
|
— |
|
|
|
3,000 |
|
|
|
3,000 |
|
|
Weighted average price |
|
$ |
8.44 |
|
|
|
— |
|
|
$ |
5.90 |
|
|
|
— |
|
|
$ |
10.97 |
|
|
$ |
10.97 |
|
No stock options were outstanding at December 31, 2017 and 2016, as all outstanding options have fully vested and have been exercised or forfeited. The options outstanding and the options exercisable at December 31, 2015 had an aggregate intrinsic value of $30,000.
Restricted Stock
The Company may grant restricted stock awards and units to employees, officers, and directors in order to attract, retain, and provide incentives for such individuals and to more closely align stockholder and employee interests. For restricted stock awards and units without performance and market-based vesting conditions, the Company records compensation expense for the entire award on a straight-line basis over the requisite service period, which is generally a period of one to four years, unless the award is subject to certain accelerated vesting requirements. Restricted stock awards are considered outstanding at the time of grant since the holders thereof are entitled to dividends, upon vesting, and voting rights. For restricted stock awards with performance and market-based vesting conditions, total compensation expense is recognized over the requisite service period once the performance target is deemed probable of achievement. Performance goals are evaluated periodically and if such goals are not ultimately met or it is not probable the goals will be achieved, no compensation expense is recognized and any previously recognized compensation expense is reversed. If the achievement of a market condition varies from initial estimates on the date of grant, compensation expense will not be adjusted to reflect the difference since the grant date fair value of the performance award gave consideration to the probability of market condition achievement.
The Company recognizes compensation expense of a restricted stock award over its respective vesting or performance period based on the fair value of the award on the grant date, net of actual forfeitures. A summary of the Company’s restricted common stock awards activity and related information for the years ended December 31, 2017, 2016, and 2015 is presented below:
|
|
|
Outstanding at Beginning of Year |
|
|
Issued |
|
|
Vested |
|
|
Forfeited |
|
|
Outstanding End of Year |
|
|||||
|
December 31, 2017 |
|
|
|
|
|
|
|
|
|
|
|
|
|
|
|
|
|
|
|
|
|
Shares |
|
|
829,766 |
|
|
|
565,745 |
|
|
|
(355,400 |
) |
|
|
(75,627 |
) |
|
|
964,484 |
|
|
December 31, 2016 |
|
|
|
|
|
|
|
|
|
|
|
|
|
|
|
|
|
|
|
|
|
Shares |
|
|
783,310 |
|
|
|
666,883 |
|
|
|
(565,224 |
) |
|
|
(55,203 |
) |
|
|
829,766 |
|
|
December 31, 2015 |
|
|
|
|
|
|
|
|
|
|
|
|
|
|
|
|
|
|
|
|
|
Shares |
|
|
702,718 |
|
|
|
467,944 |
|
|
|
(358,716 |
) |
|
|
(28,636 |
) |
|
|
783,310 |
|
F-23
CAPITAL SENIOR LIVING CORPORATION
NOTES TO CONSOLIDATED FINANCIAL STATEMENTS
December 31, 2017
The restricted stock outstanding at December 31, 2017, 2016, and 2015, had an aggregate intrinsic value of $13.0 million, $13.3 million, and $16.3 million, respectively.
During fiscal 2017, the Company awarded 565,745 shares of restricted common stock to certain employees and directors of the Company, of which 194,652 shares were subject to performance and market-based vesting conditions. The average market value of the common stock on the date of grant was $13.75. These awards of restricted shares vest over a one to four-year period, unless the award is subject to certain accelerated vesting requirements, and had an intrinsic value of $7.8 million on the date of grant. Additionally, during fiscal 2017, the Company awarded 26,787 restricted stock units to certain directors of the Company with average market value of $13.44 on the date of grant. These awards of restricted units vest over a one-year period and had an intrinsic value of approximately $0.4 million on the date of grant.
Stock Based Compensation
The Company uses the Black-Scholes option pricing model to estimate the grant date fair value of its stock options. The Black-Scholes model requires the input of certain assumptions including expected volatility, expected dividend yield, expected life of the option and the risk free interest rate. The expected volatility used by the Company is based primarily on an analysis of historical prices of the Company’s common stock. The expected term of options granted is based primarily on historical exercise patterns on the Company’s outstanding stock options. The risk free rate is based on zero-coupon U.S. Treasury yields in effect at the date of grant with the same period as the expected option life. The Company does not expect to pay dividends on its common stock and therefore has used a dividend yield of zero in determining the fair value of its awards. The option forfeiture rate assumption used by the Company is based primarily on the Company’s historical option forfeiture patterns. The Company currently has no stock options outstanding.
The Company uses the Monte-Carlo simulation model to determine the fair value of performance awards which include market-based vesting conditions. The Monte-Carlo simulation model uses the same input assumptions as the Black-Scholes model, however, it also further incorporates into the fair-value determination the possibility that the market condition may not be satisfied. Compensation costs related to awards with a market-based condition are recognized regardless of whether the market condition is satisfied, provided that the requisite service has been provided. During fiscal 2017, in accordance with the Company’s long-term incentive compensation plan, the Company granted 194,652 shares of restricted common stock with performance and market-based vesting conditions to certain employees of the Company. These performance awards are subject to a market-based condition that may increase or decrease the number of shares vested if the Company’s 2019 Total Stockholder Return (“TSR”) exceeds or falls below certain achievement level parameters when ranked against the Company’s designated Peer Group. These restricted performance shares vest over a three-year period based on the Company’s Earnings before Interest, Taxes, Depreciation, Amortization, and Rent (“EBITDAR”) financial performance target set by the Company’s compensation committee for the fiscal year ending December 31, 2019. The number of shares of restricted common stock ultimately issued will be prorated between performance level targets achieved.
The Company recognized $7.7 million, $11.6 million, and $8.8 million in stock-based compensation expense during fiscal 2017, 2016, and 2015, respectively. Unrecognized stock-based compensation expense is $9.1 million for the year ended December 31, 2017. The Company expects stock-based compensation expense to be recognized over a one to three-year period for performance restricted stock awards and a one to four-year period for nonperformance-based restricted stock awards and units.
F-24
CAPITAL SENIOR LIVING CORPORATION
NOTES TO CONSOLIDATED FINANCIAL STATEMENTS
December 31, 2017
The provision for income taxes consists of the following (in thousands):
|
|
|
Year Ended December 31, |
|
|||||||||
|
|
|
2017 |
|
|
2016 |
|
|
2015 |
|
|||
|
Current: |
|
|
|
|
|
|
|
|
|
|
|
|
|
Federal |
|
$ |
6 |
|
|
$ |
— |
|
|
$ |
— |
|
|
State |
|
|
550 |
|
|
|
435 |
|
|
|
900 |
|
|
Deferred: |
|
|
|
|
|
|
|
|
|
|
|
|
|
Federal |
|
|
1,940 |
|
|
|
— |
|
|
|
— |
|
|
State |
|
|
— |
|
|
|
— |
|
|
|
— |
|
|
|
|
$ |
2,496 |
|
|
$ |
435 |
|
|
$ |
900 |
|
The provision (benefit) for income taxes differed from the amounts of income tax provision (benefit) determined by applying the U.S. federal statutory income tax rate to income before provision (benefit) for income taxes as a result of the following (in thousands):
|
|
|
Year Ended December 31, |
|
|||||||||
|
|
|
2017 |
|
|
2016 |
|
|
2015 |
|
|||
|
Tax (benefit) provision at federal statutory rates |
|
$ |
(14,168 |
) |
|
$ |
(9,335 |
) |
|
$ |
(4,515 |
) |
|
State income tax expense, net of federal effects |
|
|
(648 |
) |
|
|
(550 |
) |
|
|
64 |
|
|
Change in deferred tax asset valuation allowance |
|
|
7,857 |
|
|
|
8,569 |
|
|
|
4,986 |
|
|
Tax reform impact on deferred income taxes |
|
|
13,959 |
|
|
|
— |
|
|
|
— |
|
|
Share based compensation ASU 2016-09 adoption |
|
|
(5,326 |
) |
|
|
— |
|
|
|
— |
|
|
Other |
|
|
822 |
|
|
|
1,751 |
|
|
|
365 |
|
|
|
|
$ |
2,496 |
|
|
$ |
435 |
|
|
$ |
900 |
|
A summary of the Company’s deferred tax assets and liabilities, are as follows (in thousands):
|
|
|
December 31, |
|
|||||
|
|
|
2017 |
|
|
2016 |
|
||
|
Deferred tax assets: |
|
|
|
|
|
|
|
|
|
Deferred gains on sale/leaseback transactions |
|
$ |
2,890 |
|
|
$ |
5,416 |
|
|
Net operating loss carryforward (expiring up to 2037) |
|
|
25,441 |
|
|
|
23,206 |
|
|
Compensation costs |
|
|
2,245 |
|
|
|
3,707 |
|
|
Depreciation and amortization |
|
|
4,367 |
|
|
|
— |
|
|
Other |
|
|
2,099 |
|
|
|
3,221 |
|
|
Total deferred tax assets |
|
|
37,042 |
|
|
|
35,550 |
|
|
Deferred tax asset valuation allowance |
|
|
(36,737 |
) |
|
|
(30,821 |
) |
|
Total deferred tax assets, net |
|
|
305 |
|
|
|
4,729 |
|
|
Deferred tax liabilities: |
|
|
|
|
|
|
|
|
|
Depreciation and amortization |
|
|
(2,246 |
) |
|
|
(4,729 |
) |
|
Total deferred tax liabilities |
|
$ |
(2,246 |
) |
|
$ |
(4,729 |
) |
|
Net deferred tax (liabilities) assets |
|
$ |
(1,941 |
) |
|
$ |
— |
|
F-25
CAPITAL SENIOR LIVING CORPORATION
NOTES TO CONSOLIDATED FINANCIAL STATEMENTS
December 31, 2017
Income taxes are computed using the asset and liability method and current income taxes are recorded based on amounts refundable or payable in the current year. Deferred income taxes are recorded based on the estimated future tax effects of loss carryforwards and temporary differences between financial statement carrying amounts of existing assets and liabilities and their respective tax basis. Deferred tax assets and liabilities are measured using enacted tax rates that are expected to apply to taxable income in the years in which we expect those carryforwards and temporary differences to be recovered or settled. Management regularly evaluates the future realization of deferred tax assets and provides a valuation allowance, if considered necessary, based on such evaluation. As part of the evaluation, management has evaluated taxable income in carryback years, future reversals of taxable temporary differences, feasible tax planning strategies, and future expectations of income. Based upon this evaluation, a valuation allowance has been recorded to reduce the Company’s net deferred tax assets to the amount that is more likely than not to be realized. A significant component of objective evidence evaluated was the cumulative losses before income taxes incurred by the Company over the past several fiscal years. Such objective evidence severely limits the ability to consider other subjective evidence such as the Company’s ability to generate sufficient taxable income in future periods to fully recover the deferred tax assets. However, in the event that we were to determine that it would be more likely than not that the Company would realize the benefit of deferred tax assets in the future in excess of their net recorded amounts, adjustments to deferred tax assets would increase net income in the period we made such a determination. The benefits of the net deferred tax assets might not be realized if actual results differ from expectations.
The Company completed an analysis determining its best estimate for provisional tax adjustments based on the revised tax legislation associated with the Tax Cuts and Jobs Act (“TCJA”), which was enacted on December 22, 2017. Additionally, the Securities and Exchange Commission issued Staff Accounting Bulletin 118 (“SAB 118”), to address the accounting and reporting of the Act. SAB 118 allows companies to take a reasonable period, which should not extent beyond one year from enactment of the TCJA, to measure and recognize the effects of the new tax law. The Company is still analyzing certain aspects of the TCJA and refining its calculations, which could potentially affect the measurement of these balances or potentially give rise to new deferred tax amounts; however, based upon the Company’s analysis of the TCJA and consideration of SAB 118, the Company remeasured its deferred income taxes on a provisional basis as of December 31, 2017, which resulted in a net $14.0 million reduction in the Company’s deferred tax assets and liabilities. The remeasurement consisted of a $15.9 million reduction to the Company’s deferred tax assets for the change in the corporate statutory tax rate from 34% to 21% and a $0.3 million reduction to the Company’s deferred tax asset valuation allowance for the repeal of the corporate Alternative Minimum Tax (“AMT”), partially offset by a $2.2 million increase to the Company’s deferred tax asset valuation allowance for maximum deduction limits for future net operating loss (“NOL”) carryforwards to 80% of taxable income for losses arising in tax years beginning after December 31, 2017.
As of December 31, 2017, the Company has federal and state NOL carryforwards of $108.5 million and $91.6 million and related deferred tax assets of $22.8 million and $5.3 million, respectively, and a federal AMT credit carryforward of $0.3 million. The federal and state NOL carryforwards in the income tax returns filed included unrecognized tax benefits. The deferred tax assets recognized for those NOLs are presented net of the unrecognized benefits. If not used, the federal NOL will expire during fiscal 2033 to 2037 and state NOL’s will expire during fiscal 2018 to 2037.
The Company evaluates uncertain tax positions through consideration of accounting and reporting guidance on criteria, measurement, derecognition, classification, interest and penalties, accounting in interim periods, disclosure, and transition that is intended to provide better financial-statement comparability among different companies. The Company is required to recognize a tax benefit in its financial statements for an uncertain tax position only if management’s assessment is that its position is “more likely than not” (i.e., a greater than 50 percent likelihood) to be upheld on audit based only on the technical merits of the tax position. The Company’s policy is to recognize interest related to unrecognized tax benefits as interest expense and penalties as income tax expense. As of December 31, 2017, the Company has unrecognized tax benefits of $3.4 million for an uncertain tax position associated with a change in accounting method. The unrecognized tax benefits as of December 31, 2017 are timing-related uncertainties that if recognized would not impact the effective tax rate of the Company.
F-26
CAPITAL SENIOR LIVING CORPORATION
NOTES TO CONSOLIDATED FINANCIAL STATEMENTS
December 31, 2017
A summary of the Company’s unrecognized tax benefits activity and related information for the years ended December 31, 2017, 2016, and 2015 is presented below (in thousands):
|
|
|
2017 |
|
|
2016 |
|
|
2015 |
|
|||
|
Beginning balance, January 1 |
|
$ |
3,786 |
|
|
$ |
— |
|
|
$ |
— |
|
|
Gross increases – tax positions in prior period |
|
|
— |
|
|
|
2,451 |
|
|
|
— |
|
|
Gross decreases – tax positions in prior period |
|
|
(370 |
) |
|
|
— |
|
|
|
— |
|
|
Gross increases – tax positions in current period |
|
|
— |
|
|
|
1,335 |
|
|
|
— |
|
|
Settlements |
|
|
— |
|
|
|
— |
|
|
|
— |
|
|
Lapse of statute of limitations |
|
|
— |
|
|
|
— |
|
|
|
— |
|
|
Ending balance, December 31 |
|
$ |
3,416 |
|
|
$ |
3,786 |
|
|
$ |
— |
|
The effective tax rates for fiscal 2017 and 2016 differ from the statutory tax rates due to state income taxes, permanent tax differences, and changes in the deferred tax asset valuation allowance. The Company is impacted by the Texas Margin Tax (“TMT”), which effectively imposes tax on modified gross revenues for communities within the State of Texas and accounts for the majority of the Company’s current state tax expense. During each of fiscal 2017 and 2016 the Company consolidated 38 Texas communities and the TMT increased the overall provision for income taxes. The Company is generally no longer subject to federal and state tax audits for years before 2014.
|
11. |
Employee Benefit Plans |
The Company has a 401(k) salary deferral plan (the “Plan”) in which all employees of the Company meeting minimum service and age requirements are eligible to participate. Contributions to the Plan are in the form of employee salary deferrals, which are subject to employer matching contributions of 50% of up to 4% of the employee’s annual salary. The Company’s contributions are funded semi-monthly to the Plan administrator. Matching contributions of $0.5 million were contributed to the Plan in each of fiscal 2017, 2016 and 2015. The Company incurred administrative expenses related to the Plan of $21,300, $24,600, and $20,900 in fiscal 2017, 2016, and 2015, respectively.
|
12. |
Contingencies |
The Company has claims incurred in the normal course of its business. Most of these claims are believed by management to be covered by insurance, subject to normal reservations of rights by the insurance companies and possibly subject to certain exclusions in the applicable insurance policies. Whether or not covered by insurance, these claims, in the opinion of management, based on advice of legal counsel, should not have a material effect on the consolidated financial statements of the Company if determined adversely to the Company.
The Company had two of its senior housing communities located in southeast Texas impacted by Hurricane Harvey during the third quarter of fiscal 2017. Both of these communities remain fully vacated and are undergoing repairs. We maintain insurance coverage on these communities which includes damage caused by flooding. The insurance claim for this incident required a deductible of $100,000 that was expensed as a component of operating expenses in the Company’s Consolidated Statement of Operations and Comprehensive Loss in the third quarter of fiscal 2017. Through December 31, 2017, we have incurred approximately $3.9 million in clean-up and physical repair costs and we expect to incur additional repair costs which we believe are probable of being recovered through insurance proceeds. In addition to the repairs of physical damage to the buildings, the Company’s insurance coverage includes loss of business income (“Business Interruption”). Business Interruption includes reimbursement for lost revenue as well as incremental expenses incurred as a result of the hurricane. The Company received payments from our insurance underwriters during fiscal 2017 totaling approximately $2.7 million of which approximately $2.2 million related to Business Interruption through December 31, 2017, which has been included as a reduction to operating expenses in the Company’s Consolidated Statement of Operations and Comprehensive Loss in fiscal 2017. Based upon our initial assessment of the physical damages and insurance coverage, the Company currently estimates insurance proceeds will be sufficient to reimburse the Company for all damages and repair costs to fully restore the communities to their condition prior to the incident.
F-27
CAPITAL SENIOR LIVING CORPORATION
NOTES TO CONSOLIDATED FINANCIAL STATEMENTS
December 31, 2017
The carrying amounts and fair values of financial instruments at December 31, 2017 and 2016 are as follows (in thousands):
|
|
|
2017 |
|
|
2016 |
|
||||||||||
|
|
|
Carrying Amount |
|
|
Fair Value |
|
|
Carrying Amount |
|
|
Fair Value |
|
||||
|
Cash and cash equivalents |
|
$ |
17,646 |
|
|
$ |
17,646 |
|
|
$ |
34,026 |
|
|
$ |
34,026 |
|
|
Restricted cash |
|
|
13,378 |
|
|
|
13,378 |
|
|
|
13,297 |
|
|
|
13,297 |
|
|
Notes payable, excluding deferred loan costs |
|
|
967,332 |
|
|
|
929,000 |
|
|
|
910,234 |
|
|
|
879,448 |
|
The following methods and assumptions were used in estimating its fair value disclosures for financial instruments:
Cash and cash equivalents and Restricted cash: The carrying amounts reported in the balance sheet for cash and cash equivalents and restricted cash equal fair value, which represent level 1 inputs as defined in the accounting standards codification.
Notes payable: The fair value of notes payable is estimated using discounted cash flow analysis, based on current incremental borrowing rates for similar types of borrowing arrangements, which represent level 2 inputs as defined in the accounting standards codification.
The estimated fair value of these assets and liabilities could be affected by market changes and this effect could be material.
|
14. |
Allowance for Doubtful Accounts |
The components of the allowance for doubtful accounts are as follows (in thousands):
|
|
|
December 31, |
|
|||||||||
|
|
|
2017 |
|
|
2016 |
|
|
2015 |
|
|||
|
Balance at beginning of year |
|
$ |
4,253 |
|
|
$ |
3,188 |
|
|
$ |
2,321 |
|
|
Provision for bad debts, net of recoveries |
|
|
1,748 |
|
|
|
1,727 |
|
|
|
1,192 |
|
|
Write-offs and other |
|
|
(1,120 |
) |
|
|
(662 |
) |
|
|
(325 |
) |
|
Balance at end of year |
|
$ |
4,881 |
|
|
$ |
4,253 |
|
|
$ |
3,188 |
|
|
15. |
Leases |
As of December 31, 2017, the Company leased 46 senior housing communities from certain real estate investment trusts (“REITs”). The lease terms are generally for 10-15 years with renewal options for 5-20 years at the Company’s option. Under these lease agreements, the Company is responsible for all operating costs, maintenance and repairs, insurance and property taxes. No new facility leases were entered into by the Company during fiscal 2017.
F-28
CAPITAL SENIOR LIVING CORPORATION
NOTES TO CONSOLIDATED FINANCIAL STATEMENTS
December 31, 2017
The following table summarizes each of the Company’s facility lease agreements as of December 31, 2017 (dollars in millions):
|
Landlord |
|
Initial Date of Lease |
|
Number of Communities |
|
|
Value of Transaction |
|
|
Current Expiration and Renewal Term |
|
Initial Lease Rate (1) |
|
|
Lease Acquisition and Modification Costs (2) |
|
|
Deferred Gains /Lease Concessions (3) |
|
|||||
|
Ventas |
|
September 30, 2005 |
|
|
4 |
|
|
$ |
61.4 |
|
|
September 30, 2025 (4) (Two five-year renewals) |
|
|
8 |
% |
|
$ |
7.7 |
|
|
$ |
4.2 |
|
|
Ventas |
|
January 31, 2008 |
|
|
1 |
|
|
|
5.0 |
|
|
September 30, 2025 (4) (Two five-year renewals) |
|
|
7.75 |
% |
|
|
0.2 |
|
|
|
— |
|
|
Ventas |
|
June 27, 2012 |
|
|
2 |
|
|
|
43.3 |
|
|
September 30, 2025 (4) (Two five-year renewals) |
|
|
6.75 |
% |
|
|
0.8 |
|
|
|
— |
|
|
HCP |
|
May 1, 2006 |
|
|
3 |
|
|
|
54.0 |
|
|
October 31, 2020 (5) (Two 10-year renewals) |
|
|
8 |
% |
|
|
0.3 |
|
|
|
12.8 |
|
|
HCP |
|
May 31, 2006 |
|
|
6 |
|
|
|
43.0 |
|
|
April 30, 2026 (6) (One 10-year renewal) |
|
|
8 |
% |
|
|
0.2 |
|
|
|
0.6 |
|
|
HCP |
|
December 1, 2006 |
|
|
4 |
|
|
|
51.0 |
|
|
October 31, 2020 (5) (Two 10-year renewals) |
|
|
8 |
% |
|
|
0.7 |
|
|
|
— |
|
|
HCP |
|
December 14, 2006 |
|
|
1 |
|
|
|
18.0 |
|
|
October 31, 2020 (5) (Two 10-year renewals) |
|
|
7.75 |
% |
|
|
0.3 |
|
|
|
— |
|
|
HCP |
|
April 11, 2007 |
|
|
1 |
|
|
|
8.0 |
|
|
October 31, 2020 (5) (Two 10-year renewals) |
|
|
7.25 |
% |
|
|
0.1 |
|
|
|
— |
|
|
Welltower |
|
April 16, 2010 |
|
|
5 |
|
|
|
48.5 |
|
|
April 30, 2025 (15 years) (One 15-year renewal) |
|
|
8.25 |
% |
|
|
0.6 |
|
|
|
0.8 |
|
|
Welltower |
|
May 1, 2010 |
|
|
3 |
|
|
|
36.0 |
|
|
April 30, 2025 (15 years) (One 15-year renewal) |
|
|
8.25 |
% |
|
|
0.2 |
|
|
|
0.4 |
|
|
Welltower |
|
September 10, 2010 |
|
|
12 |
|
|
|
104.6 |
|
|
September 30, 2025 (15 years) (One 15-year renewal) |
|
|
8.50 |
% |
|
|
0.4 |
|
|
|
2.0 |
|
|
Welltower |
|
April 8, 2011 |
|
|
4 |
|
|
|
141.0 |
|
|
April 30, 2026 (15 years) (One 15-year renewal) |
|
|
7.25 |
% |
|
|
0.9 |
|
|
|
16.3 |
|
|
Subtotal |
|
|
|
12.4 |
|
|
|
37.1 |
|
|||||||||||||||
|
Accumulated amortization through December 31, 2017 |
|
|
|
(7.2 |
) |
|
|
— |
|
|||||||||||||||
|
Accumulated deferred gains / lease concessions recognized through December 31, 2017 |
|
|
|
— |
|
|
|
(24.2 |
) |
|||||||||||||||
|
Net lease acquisition costs / deferred gains / lease concessions as of December 31, 2017 |
|
|
$ |
5.2 |
|
|
$ |
12.9 |
|
|||||||||||||||
|
(1) |
Initial lease rates are measured against agreed upon fair market values and are subject to conditional lease escalation provisions as set forth in each respective lease agreement. |
|
(2) |
Lease acquisition and modification costs are being amortized over the respective lease terms. |
|
(3) |
Deferred gains of $34.5 million and lease concessions of $2.6 million are being recognized in the Company’s Consolidated Statements of Operations and Comprehensive Loss as a reduction in facility lease expense over the respective initial lease terms. Lease concessions of $0.6 million relate to the transaction with HCP on May 31, 2006, and $2.0 million relate to the transaction with Welltower on September 10, 2010. |
|
(4) |
Effective June 17, 2015, the Company executed amendments to the master lease agreements with Ventas to facilitate leasehold improvements for 10 of the leased communities, of which the underlying real estate associated with four of its operating leases was acquired by the Company upon closing the Four Property Lease Transaction on January 31, 2017, and extend the lease terms through September 30, 2025, with two five-year renewal extensions available at the Company’s option. |
|
(5) |
On November 11, 2013, the Company executed a third amendment to the master lease agreement associated with nine of its leased communities with HCP to facilitate leasehold improvements for one of the leased communities and extend the respective lease terms through October 31, 2020, with two 10-year renewal extensions available at the Company’s option. |
F-29
CAPITAL SENIOR LIVING CORPORATION
NOTES TO CONSOLIDATED FINANCIAL STATEMENTS
December 31, 2017
|
(6) |
On April 24, 2015, the Company exercised its right to extend the lease term with HCP through April 30, 2026, with one 10-year renewal extension remaining available at the Company’s option. |
Ventas
As of December 31, 2017, the Company leased 7 senior housing communities from Ventas. Effective January 31, 2017, the Company closed the Four Property Lease Transaction and acquired four of the senior housing communities leased from Ventas for a total acquisition price of $85.0 million. The Company obtained interim, interest only, bridge financing from Berkadia for $65.0 million of the acquisition price with an initial variable interest rate of LIBOR plus 4.0% and a 36-month term, with the balance of the acquisition price paid from the Company’s existing cash resources. For additional information refer to Note 3, “Acquisitions.” Prior to the Four Property Lease Transaction, the Company previously leased 11 senior housing communities from Ventas. During the second quarter of fiscal 2015, the Company executed amendments to the master lease agreements with Ventas to facilitate up to $24.5 million of leasehold improvements for 10 communities within the Ventas lease portfolio and extend the lease terms until September 30, 2025, with two five-year renewal extension available at the Company’s option. Additionally, during the second quarter of fiscal 2016, the Company executed amendments to the master lease agreements with Ventas to increase the Special Project Funds for leasehold improvements from $24.5 million to $28.5 million and extend the date for completion of the leasehold improvements to June 30, 2017. During fiscal 2017, the Company executed amendments to the master lease agreements with Ventas to decrease the Special Project Funds for leasehold improvements from $28.5 million to approximately $17.0 million due to the Four Property Lease Transaction and extend the date for completion of the leasehold improvements to June 30, 2018. The initial lease rates under each of the Ventas Lease Agreements range from 6.75% to 8% and are subject to certain conditional escalation clauses that will be recognized when probable or incurred. The Company initially incurred $11.4 million in lease acquisition and modification costs related to the Ventas Lease Agreements, of which a portion of these costs were written-off upon closing the Four Property Lease Transaction leaving $8.7 million in lease acquisition and modification costs associated with the remaining properties. These deferred lease acquisition and modification costs are being amortized over the lease terms and are included in facility lease expense in the Company’s Consolidated Statement of Operations and Comprehensive loss. The Company accounts for five of the Ventas Lease Agreements as an operating lease and two as a Capital lease and financing obligation.
Effective June 27, 2012, the Company closed a lease modification transaction with Ventas which resulted in the Company exchanging two of its owned communities for one of the communities in the existing Ventas lease portfolio and simultaneously leasing back the two communities exchanged (the “Ventas Lease Transaction”). This transaction was the result of negotiations for a solution to the anticipation of the Company not meeting certain lease coverage ratio requirements for its lease portfolio of ten properties with Ventas. The two communities previously owned by the Company are located in East Lansing, Michigan (the “East Lansing Community”) and Raleigh, North Carolina (the “Raleigh Community”) and were exchanged for a community located in Merrillville, Indiana (the “Towne Centre Community”). All three communities continue to be operated by the Company. In conjunction with this transaction, Ventas assumed approximately $18.3 million of existing mortgage debt from Berkadia and the Company received the Towne Centre Community unencumbered. All of the leased communities in the Ventas lease portfolio were modified to be coterminous with the East Lansing and Raleigh Community leases expiring on September 30, 2020, which were extended to September 30, 2025 during fiscal 2015, with two 5-year renewal extensions available at the Company’s option, eliminate property-level lease covenants, and contain substantially similar terms and conditions. These leases were re-evaluated by the Company at the modification date and continue to be treated as operating leases. Under the terms of the original lease agreements with Ventas, the Company had previously deposited additional cash collateral of approximately $3.4 million, which was returnable to the Company once certain performance targets were reached. However, due to the rebalanced lease portfolio meeting the lease coverage ratio requirements, the Company negotiated the return of these deposits as a condition to the lease modification. Additionally, due to the extension of the lease terms for the Ventas lease portfolio to fiscal 2020, the rights of Ventas to reset the underlying values of the leased communities were deferred for five years.
F-30
CAPITAL SENIOR LIVING CORPORATION
NOTES TO CONSOLIDATED FINANCIAL STATEMENTS
December 31, 2017
Pursuant to ASC 840, Leases, the Company performed a sale/leaseback analysis to determine whether the East Lansing Community and Raleigh Community could be removed from its Consolidated Balance Sheets. Based upon the analysis performed, the Company concluded certain aspects of the lease modification would be considered forms of “continuing involvement” which precludes the Company from derecognizing these assets from its Consolidated Balance Sheets under sale/leaseback accounting criteria. Therefore, the Company recorded financing obligations equal to the fair market value of the communities exchanged and the mortgage debt assumed by Ventas. At the end of the lease term, including exercise of any renewal options, the net remaining financing obligation less the net carrying value of the leased assets will be recognized as a non-cash gain on sale of the East Lansing Community and Raleigh Community. Rental payments under these leases will not be reflected as a component of facility lease expense but will be recognized as a reduction of the financing obligation and interest expense based upon the Company’s incremental borrowing rate at the time the transaction was closed. As a result of this transaction, the Company recorded additions to property and equipment of approximately $13.2 million and other assets, primarily consisting of lease intangibles, of approximately $11.8 million within the Company’s Consolidated Balance Sheets, which will be depreciated or amortized over the estimated useful lives. The additions to property and equipment were reduced by approximately $4.9 million, which represented the unamortized portion of the deferred gain previously recognized by the Company when the Towne Centre Community had been sold in fiscal 2006. Lease intangibles consist of the fair value of in-place leases associated with the Towne Centre Community and the fair value attributable to Ventas deferring its right to reset the underlying values of the lease portfolio five years until fiscal 2020.
HCP
As of December 31, 2017, the Company leased 15 senior housing communities from HCP. During the fourth quarter of fiscal 2013, the Company executed an amendment to the master lease agreement with HCP to facilitate up to $3.3 million of leasehold improvements for one community within the HCP lease portfolio and extend the initial lease terms for nine communities until October 31, 2020, with two 10-year renewal extensions available at the Company’s option. During the second quarter of fiscal 2015, the Company exercised its right to extend the lease term with HCP for the remaining six communities in the HCP lease portfolio until April 30, 2026, with one 10-year renewal extension available at the Company’s option. The initial lease rates under the HCP Lease Agreements range from 7.25% to 8% and are subject to certain conditional escalation clauses, which will be recognized when probable or incurred. The Company incurred $1.6 million in lease acquisition and modification costs related to the HCP Lease Agreements. These deferred lease acquisition and modification costs are being amortized over the lease terms and are included in facility lease expense in the Company’s Consolidated Statements of Operations and Comprehensive Loss. The Company accounts for each of the HCP Lease Agreements as an operating lease.
Welltower
As of December 31, 2017, the Company leased 24 senior housing communities from Welltower. The Welltower Lease Agreements each have an initial term of 15 years, with one 15-year renewal extension available at the Company’s option. The initial lease rates under the Welltower Lease Agreements range from 7.25% to 8.5% and are subject to certain conditional escalation clauses, which will be recognized when probable or incurred. The initial terms on the Welltower Lease Agreements expire on various dates through April 2026. The Company incurred $2.1 million in lease acquisition costs related to the Welltower Lease Agreements. These deferred lease acquisition costs are being amortized over the lease terms and are included in facility lease expense in the Company’s Consolidated Statements of Operations and Comprehensive Loss. The Company accounts for each of the Welltower Lease Agreements as an operating lease.
Facility lease expense in the Company’s Consolidated Statements of Operations and Comprehensive Loss includes rent expense plus amortization expense relating to leasehold acquisition costs offset by the amortization of deferred gains and lease incentives. The Company leases its corporate headquarters in Dallas, Texas, and an office in New York City and has various lease contracts for a duration of 5 years or less on automobiles, buses and office equipment. The lease on the corporate headquarters currently expires on September 30, 2020.
F-31
CAPITAL SENIOR LIVING CORPORATION
NOTES TO CONSOLIDATED FINANCIAL STATEMENTS
December 31, 2017
The Company incurred $59.7 million, $64.5 million, and $62.8 million in lease expense during fiscal 2017, 2016, and 2015, respectively. Future minimum lease commitments as of December 31, 2017, are as follows (in thousands):
|
2018 |
|
$ |
64,391 |
|
|
2019 |
|
|
64,366 |
|
|
2020 |
|
|
61,880 |
|
|
2021 |
|
|
50,307 |
|
|
2022 |
|
|
50,277 |
|
|
Thereafter |
|
|
144,241 |
|
|
|
|
$ |
435,462 |
|
At December 31, 2017 and 2016, the Company had gross deferred lease costs of $12.4 million and $15.1 million, respectively. Accumulated amortization at December 31, 2017 and 2016 was $7.2 million and $8.0 million, respectively, and amortization expense is expected to be approximately $0.9 million in each of the next five fiscal years. The reduction in deferred lease costs and corresponding accumulated amortization was due to the Four Property Lease Transaction that closed on January 31, 2017. There are various financial covenants and other restrictions in the Company’s lease agreements. The Company was in compliance with all of its lease covenants at December 31, 2017 and 2016.
|
16. |
Quarterly Financial Information (Unaudited) |
The following table presents certain unaudited quarterly financial information for each of the four quarters ended December 31, 2017 and 2016. This information has been prepared on the same basis as the audited consolidated financial statements of the Company and include, in the opinion of the Company’s management, all adjustments (consisting of normal recurring adjustments) necessary to present fairly the quarterly results when read in conjunction with the audited consolidated financial statements of the Company.
|
|
|
2017 Calendar Quarters |
|
|||||||||||||
|
|
|
First |
|
|
Second |
|
|
Third |
|
|
Fourth |
|
||||
|
|
|
(In thousands, except per share amounts) |
|
|||||||||||||
|
Total revenues |
|
$ |
115,990 |
|
|
$ |
116,718 |
|
|
$ |
117,318 |
|
|
$ |
116,971 |
|
|
(Loss) Income from operations |
|
|
(9,610 |
) |
|
|
4,691 |
|
|
|
4,513 |
|
|
|
8,248 |
|
|
Net loss and comprehensive loss |
|
|
(21,842 |
) |
|
|
(7,835 |
) |
|
|
(8,132 |
) |
|
|
(6,359 |
) |
|
Net loss per share, basic |
|
$ |
(0.75 |
) |
|
$ |
(0.27 |
) |
|
$ |
(0.28 |
) |
|
$ |
(0.22 |
) |
|
Net loss per share, diluted |
|
$ |
(0.75 |
) |
|
$ |
(0.27 |
) |
|
$ |
(0.28 |
) |
|
$ |
(0.22 |
) |
|
Weighted average shares outstanding, basic |
|
|
29,288 |
|
|
|
29,478 |
|
|
|
29,512 |
|
|
|
29,531 |
|
|
Weighted average shares outstanding, fully diluted |
|
|
29,288 |
|
|
|
29,478 |
|
|
|
29,512 |
|
|
|
29,531 |
|
|
|
|
2016 Calendar Quarters |
|
|||||||||||||
|
|
|
First |
|
|
Second |
|
|
Third |
|
|
Fourth |
|
||||
|
|
|
(In thousands, except per share amounts) |
|
|||||||||||||
|
Total revenues |
|
$ |
109,173 |
|
|
$ |
111,034 |
|
|
$ |
111,436 |
|
|
$ |
115,805 |
|
|
Income from operations |
|
|
4,153 |
|
|
|
5,793 |
|
|
|
3,686 |
|
|
|
758 |
|
|
Net loss and comprehensive loss |
|
|
(5,984 |
) |
|
|
(4,446 |
) |
|
|
(7,077 |
) |
|
|
(10,510 |
) |
|
Net loss per share, basic |
|
$ |
(0.21 |
) |
|
$ |
(0.15 |
) |
|
$ |
(0.24 |
) |
|
$ |
(0.36 |
) |
|
Net loss per share, diluted |
|
$ |
(0.21 |
) |
|
$ |
(0.15 |
) |
|
$ |
(0.24 |
) |
|
$ |
(0.36 |
) |
|
Weighted average shares outstanding, basic |
|
|
28,751 |
|
|
|
28,926 |
|
|
|
28,959 |
|
|
|
29,000 |
|
|
Weighted average shares outstanding, fully diluted |
|
|
28,751 |
|
|
|
28,926 |
|
|
|
28,959 |
|
|
|
29,000 |
|
F-32
Report of Independent Registered Public Accounting Firm
To the Shareholders and the Board of Directors of Capital Senior Living Corporation
Opinion on Internal Control over Financial Reporting
We have audited Capital Senior Living Corporation’s internal control over financial reporting as of December 31, 2017, based on criteria established in Internal Control-Integrated Framework issued by the Committee of Sponsoring Organizations of the Treadway Commission (2013 framework) (the COSO criteria). In our opinion, Capital Senior Living Corporation maintained, in all material respects, effective internal control over financial reporting as of December 31, 2017, based on the COSO criteria.
We also have audited, in accordance with the standards of the Public Company Accounting Oversight Board (United States) (PCAOB), the consolidated balance sheets of Capital Senior Living Corporation as of December 31, 2017 and 2016, and the related consolidated statements of operations and comprehensive loss, shareholders’ equity, and cash flows for each of the three years in the period ended December 31, 2017 and the related notes (collectively referred to as the “financial statements”) of Capital Senior Living Corporation, and our report dated March 2, 2018 expressed an unqualified opinion thereon.
Basis for Opinion
Capital Senior Living Corporation’s management is responsible for maintaining effective internal control over financial reporting and for its assessment of the effectiveness of internal control over financial reporting included in the accompanying Management’s Report on Internal Control Over Financial Reporting. Our responsibility is to express an opinion on Capital Senior Living Corporation’s internal control over financial reporting based on our audit. We are a public accounting firm registered with the PCAOB and are required to be independent with respect to Capital Senior Living Corporation in accordance with the U.S. federal securities laws and the applicable rules and regulations of the Securities and Exchange Commission and the PCAOB.
We conducted our audit in accordance with the standards of the PCAOB. Those standards require that we plan and perform the audit to obtain reasonable assurance about whether effective internal control over financial reporting was maintained in all material respects.
Our audit included obtaining an understanding of internal control over financial reporting, assessing the risk that a material weakness exists, testing and evaluating the design and operating effectiveness of internal control based on the assessed risk, and performing such other procedures as we considered necessary in the circumstances. We believe that our audit provides a reasonable basis for our opinion.
Definition and Limitations of Internal Control Over Financial Reporting
A company’s internal control over financial reporting is a process designed to provide reasonable assurance regarding the reliability of financial reporting and the preparation of financial statements for external purposes in accordance with generally accepted accounting principles. A company’s internal control over financial reporting includes those policies and procedures that (1) pertain to the maintenance of records that, in reasonable detail, accurately and fairly reflect the transactions and dispositions of the assets of the company; (2) provide reasonable assurance that transactions are recorded as necessary to permit preparation of financial statements in accordance with generally accepted accounting principles, and that receipts and expenditures of the company are being made only in accordance with authorizations of management and directors of the company; and (3) provide reasonable assurance regarding prevention or timely detection of unauthorized acquisition, use, or disposition of the company’s assets that could have a material effect on the financial statements.
F-33
Because of its inherent limitations, internal control over financial reporting may not prevent or detect misstatements. Also, projections of any evaluation of effectiveness to future periods are subject to the risk that controls may become inadequate because of changes in conditions, or that the degree of compliance with the policies or procedures may deteriorate.
/s/ Ernst & Young LLP
Dallas, Texas
March 2, 2018
F-34