Attached files
| file | filename |
|---|---|
| 8-K - 8-K - ILG, LLC | a17-20971_18k.htm |
Exhibit 99.1
Investor Presentation August 2017 The Westin Los Cabos Resort Villas & Spa, Los Cabos, Mexico
Safe Harbor This presentation may contain “forward–looking statements” within the meaning of the Private Securities Litigation Reform Act of 1995. These forward–looking statements include statements relating to the anticipated financial performance, business prospects, new developments, and similar matters of/relating to ILG, Inc., and/or statements that use words such as “anticipates,” “estimates,” “expects,” “intends,” “plans,” “believes,” and similar expressions. These forward-looking statements are based on management’s current expectations and assumptions, which are inherently subject to uncertainties, risks, and changes in circumstances that are difficult to predict. Actual results could differ materially from those contained in the forward-looking statements included herein for a variety of reasons, including, among others: (1) adverse trends in economic conditions generally or in the vacation ownership, vacation rental and travel industries, or adverse events or trends in key vacation destinations, (2) lack of available financing for, or insolvency or consolidation of developers, including availability of receivables financing for our business, (3) adverse changes to, or interruptions in, relationships with third parties, (4) our ability to compete effectively and successfully and to add new products and services, (5) our ability to market VOIs successfully and efficiently, (6) our ability to source sufficient inventory to support VOI sales and risks related to development of inventory in accordance with applicable brand standards, (7) the occurrence of a termination event under the master license agreement with Starwood or Hyatt, (8) actions of Starwood, Hyatt or any successor that affect the reputation of the licensed marks, the offerings of or access to these brands and programs, (9) decreased demand from prospective purchasers of vacation interests, (10) travel-related health concerns, (11) significant increase in defaults on our vacation ownership mortgage receivables, (12) the restrictive covenants in our revolving credit facility and indenture and our ability to refinance our debt on acceptable terms, (13) our ability to successfully manage and integrate acquisitions, including Vistana Signature Experiences, (14) impairment of ILG’s assets or other adverse changes to estimates and assumptions underlying our financial results, (15) our ability to expand successfully in international markets and manage risks specific to international operations, (16) fluctuations in currency exchange rates, (17) the ability of managed homeowners’ associations to collect sufficient maintenance fees, (18) business interruptions in connection with technology systems, and (19) regulatory changes. Discussions of additional risks and uncertainties are contained in ILG’s filings with the U.S. Securities Exchange Commission. ILG is not under any obligation, and expressly disclaims any obligation, to update, alter, or otherwise revise any forward-looking statements, whether written or oral, that may be made from time to time, whether as a result of new information, future events, or otherwise. Persons reading this presentation are cautioned not to place undue reliance on these forward-looking statements which speak only as of the date hereof. The “Hyatt Vacation Ownership” business or “HVO” refers to the group of businesses using the Hyatt® brand in the shared ownership business pursuant to an exclusive, global master license agreement with a subsidiary of Hyatt Hotels Corporation (“Hyatt”). The Vistana™ Signature Experiences business or “Vistana” uses the Westin® and Sheraton® brands (and to a limited extent the St. Regis® and The Luxury Collection® brands) in vacation ownership pursuant to an exclusive global license agreement with Starwood Hotels & Resorts Worldwide, LLC (“Starwood”). All brand trademarks, service marks or trade names, including without limitation World of Hyatt, World of Hyatt Points, SPG, Starpoints,, and ILG’s brands cited in this report, are the property of their respective holders. 2
Company Overview & Strategy 3 The Westin Desert Willow Villas, Palm Desert, California

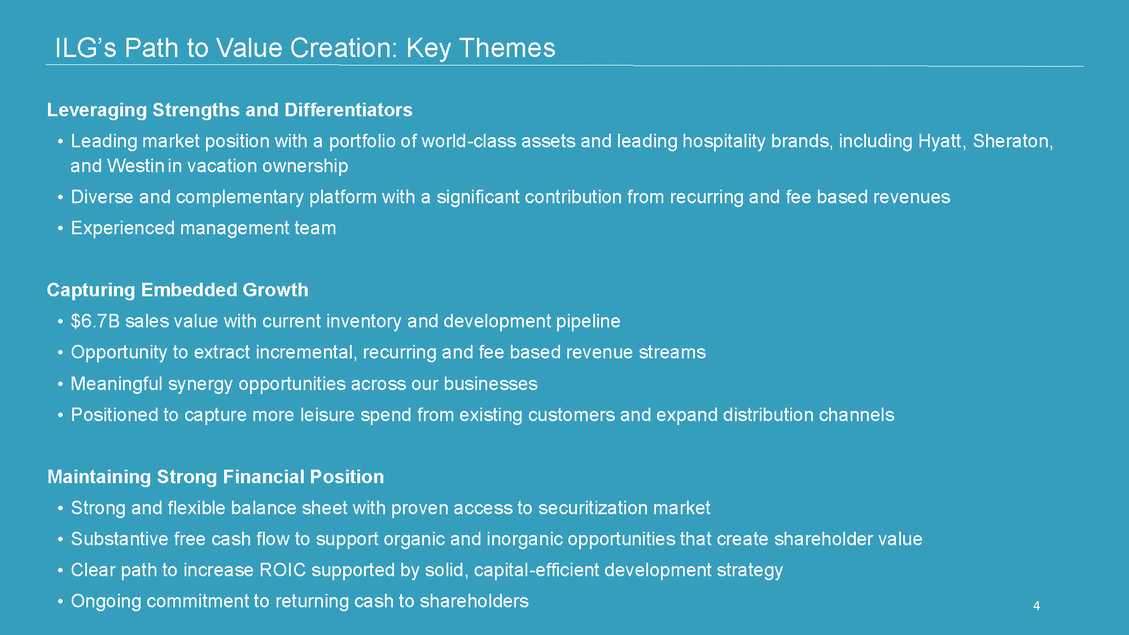
ILG’s Path to Value Creation: Key Themes Leveraging Strengths and Differentiators • Leading market position with a portfolio of world-class assets and leading hospitality brands, including Hyatt, Sheraton, and Westin in vacation ownership • Diverse and complementary platform with a significant contribution from recurring and fee based revenues • Experienced management team Capturing Embedded Growth • $6.7B sales value with current inventory and development pipeline • Opportunity to extract incremental, recurring and fee based revenue streams • Meaningful synergy opportunities across our businesses • Positioned to capture more leisure spend from existing customers and expand distribution channels Maintaining Strong Financial Position • Strong and flexible balance sheet with proven access to securitization market • Substantive free cash flow to support organic and inorganic opportunities that create shareholder value • Clear path to increase ROIC supported by solid, capital-efficient development strategy • Ongoing commitment to returning cash to shareholders 4
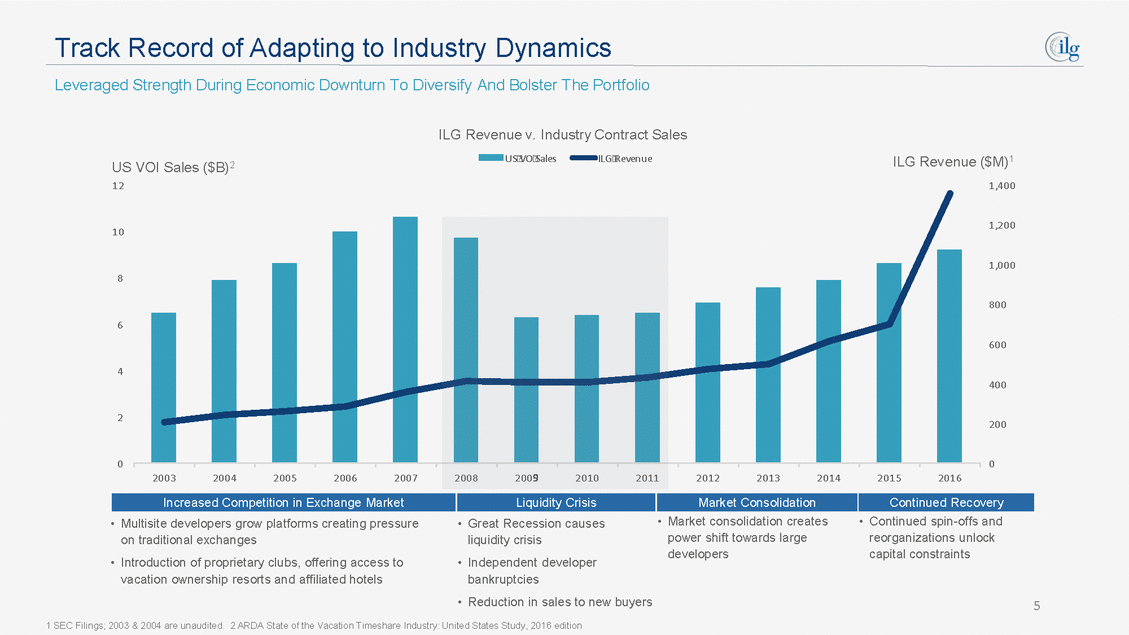
Track Record of Adapting to Industry Dynamics Leveraged Strength During Economic Downturn To Diversify And Bolster The Portfolio 7.9 8.6 10 10.6 9.7 6.3 6.4 6.5 6.9 7.6 7.9 8.6 9.2 ILG Revenue v. Industry Contract Sales US VO Sales ILG Revenue ILG Revenue ($M)1 1,400 US VOI Sales ($B)2 12 1,200 10 1,000 8 800 6 600 4 400 2 200 0 0 • Market consolidation creates power shift towards large developers • Continued spin-offs and reorganizations unlock capital constraints • Multisite developers grow platforms creating pressure on traditional exchanges • Introduction of proprietary clubs, offering access to vacation ownership resorts and affiliated hotels • Great Recession causes liquidity crisis • Independent developer bankruptcies • Reduction in sales to new buyers 5 1 SEC Filings; 2003 & 2004 are unaudited. 2 ARDA State of the Vacation Timeshare Industry: United States Study, 2016 edition Increased Competition in Exchange Market Liquidity Crisis Market ConsolidationContinued Recovery 2008200920102011 20122013201420152016 20032004200520062007
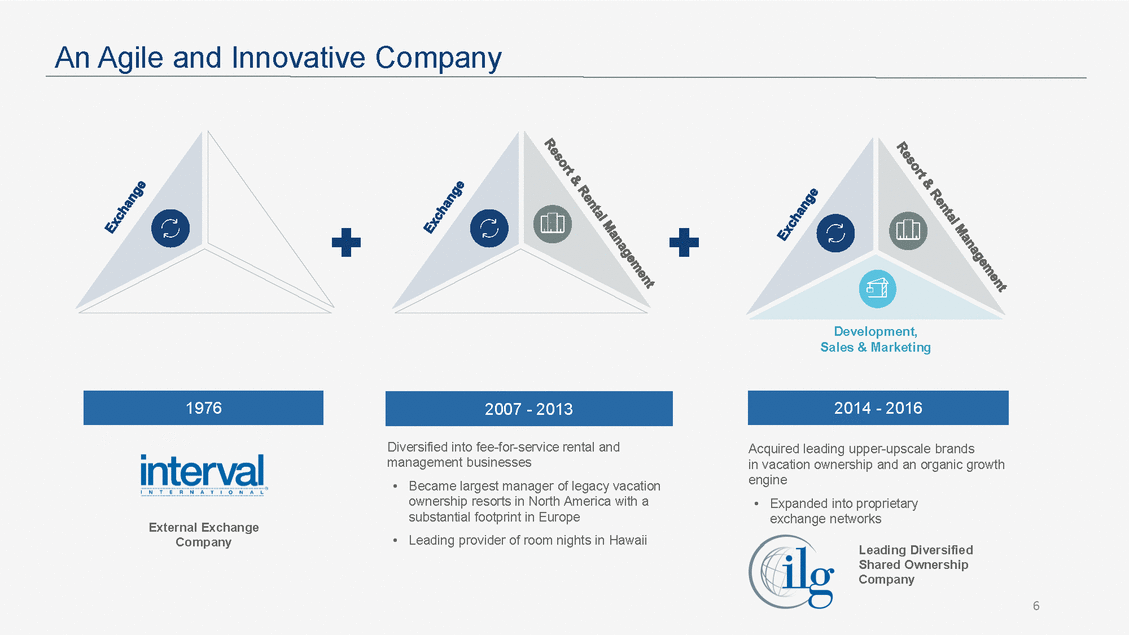
An Agile and Innovative Company Development, Sales & Marketing Diversified into fee-for-service rental and management businesses • Became largest manager of legacy vacation ownership resorts in North America with a substantial footprint in Europe • Leading provider of room nights in Hawaii Acquired leading upper-upscale brands in vacation ownership and an organic growth engine • Expanded into proprietary exchange networks External Exchange Company Leading Diversified Shared Ownership Company 6 2014 - 2016 2007 - 2013 1976
Leisure Products Built With Leading Hospitality Brands Distinct Experiences Delivered With Genuine Care Rich History of High Standards That Go Beyond A Leader in Wellness and Design 7

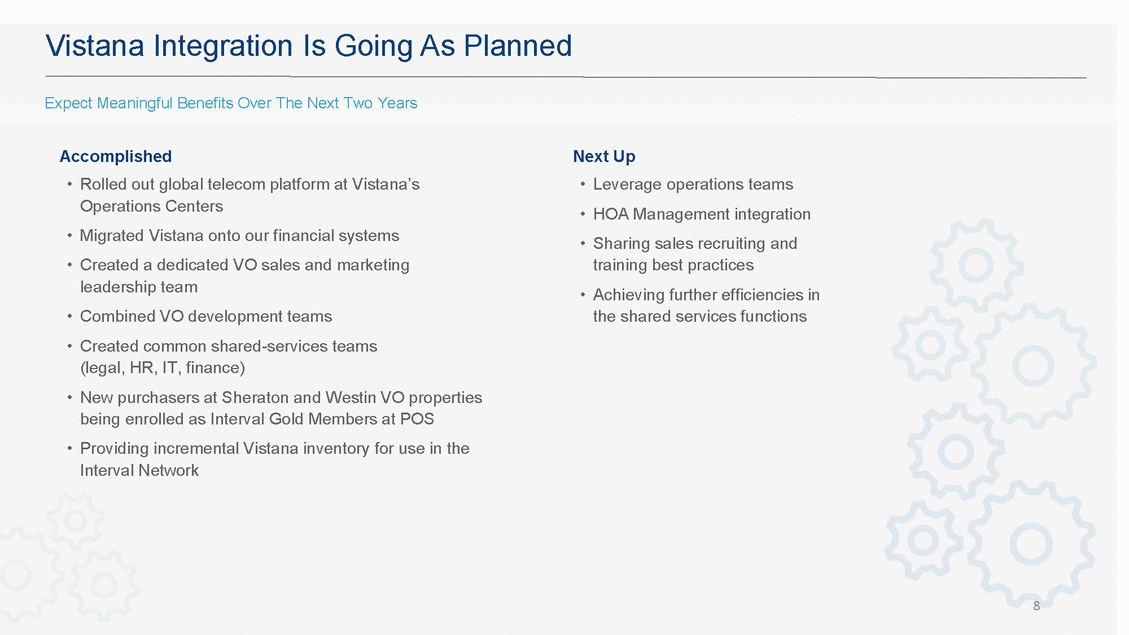
Vistana Integration Is Going As Planned Expect Meaningful Benefits Over The Next Two Years Accomplished • Rolled out global telecom platform at Vistana’s Operations Centers • Migrated Vistana onto our financial systems • Created a dedicated VO sales and marketing leadership team • Combined VO development teams • Created common shared-services teams (legal, HR, IT, finance) • New purchasers at Sheraton and Westin VO properties being enrolled as Interval Gold Members at POS • Providing incremental Vistana inventory for use in the Interval Network Next Up • Leverage operations teams • HOA Management integration • Sharing sales recruiting and training best practices • Achieving further efficiencies in the shared services functions 8
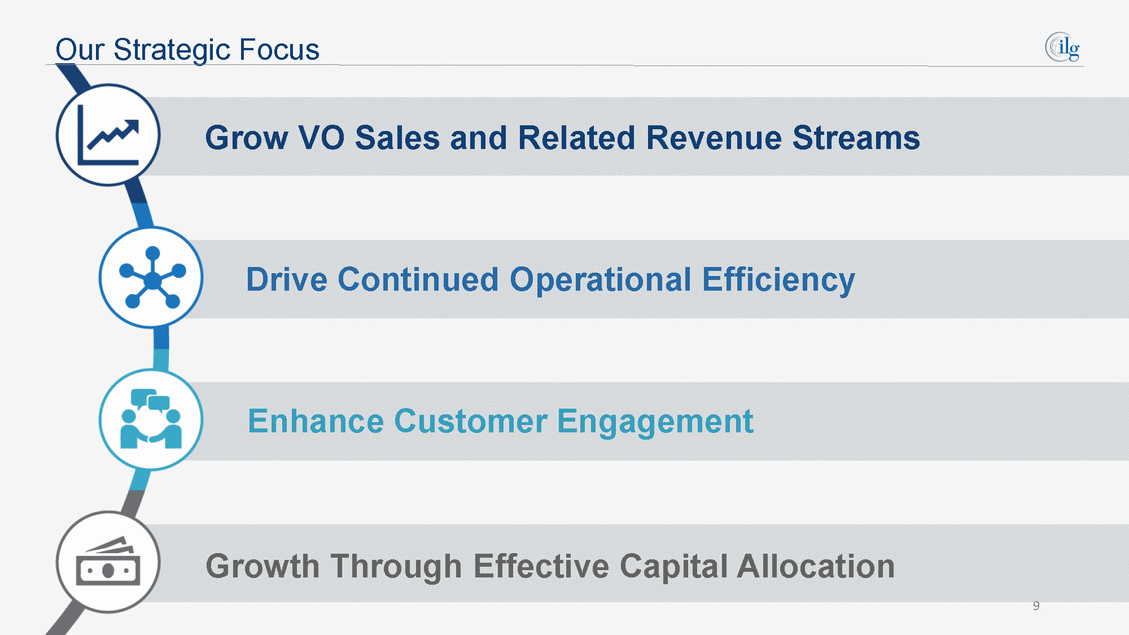
Our Strategic Focus Grow VO Sales and Related Revenue Streams Drive Continued Operational Efficiency Enhance Customer Engagement Growth Through Effective Capital Allocation 9
Exchange & Rental Hyatt Residence Club Carmel, Highlands Inn, Carmel, California 10

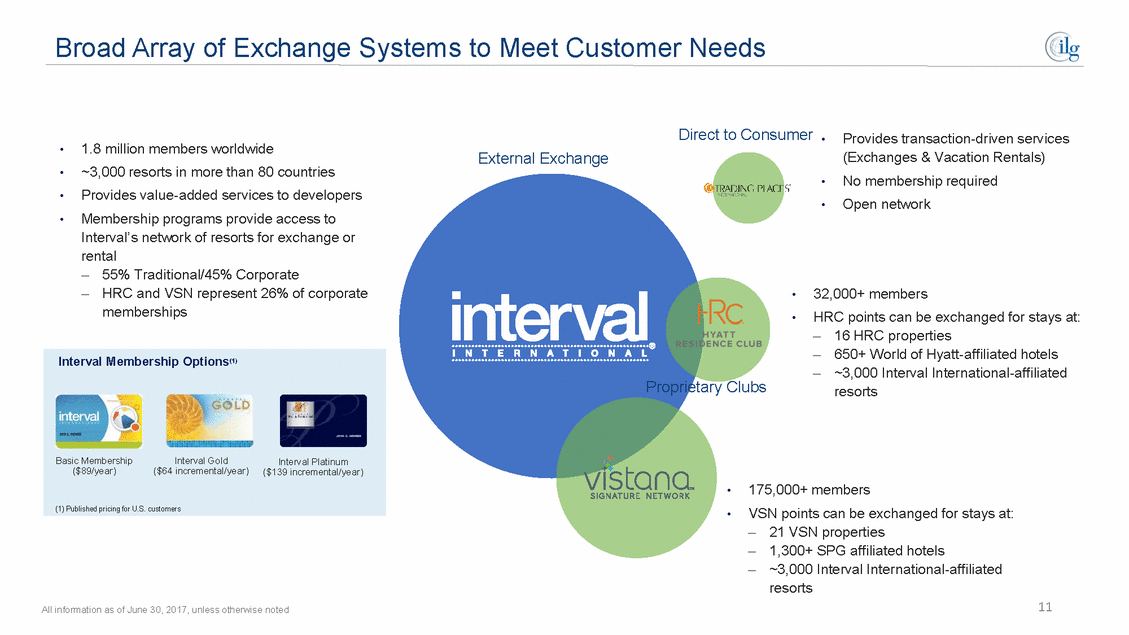
Broad Array of Exchange Systems to Meet Customer Needs Direct to Consumer Provides transaction-driven services (Exchanges & Vacation Rentals) No membership required Open network • 1.8 million members worldwide ~3,000 resorts in more than 80 countries Provides value-added services to developers Membership programs provide access to Interval’s network of resorts for exchange or rental • External Exchange • • • • • 55% Traditional/45% Corporate HRC and VSN represent 26% of corporate memberships • 32,000+ members • HRC points can be exchanged for stays at: 16 HRC properties 650+ World of Hyatt-affiliated hotels ~3,000 Interval International-affiliated resorts Proprietary Clubs • 175,000+ members • VSN points can be exchanged for stays at: 21 VSN properties 1,300+ SPG affiliated hotels ~3,000 Interval International-affiliated resorts 11 All information as of June 30, 2017, unless otherwise noted Interval Membership Options(1) Basic MembershipInterval GoldInterval Platinum ($89/year)($64 incremental/year) ($139 incremental/year) (1) Published pricing for U.S. customers
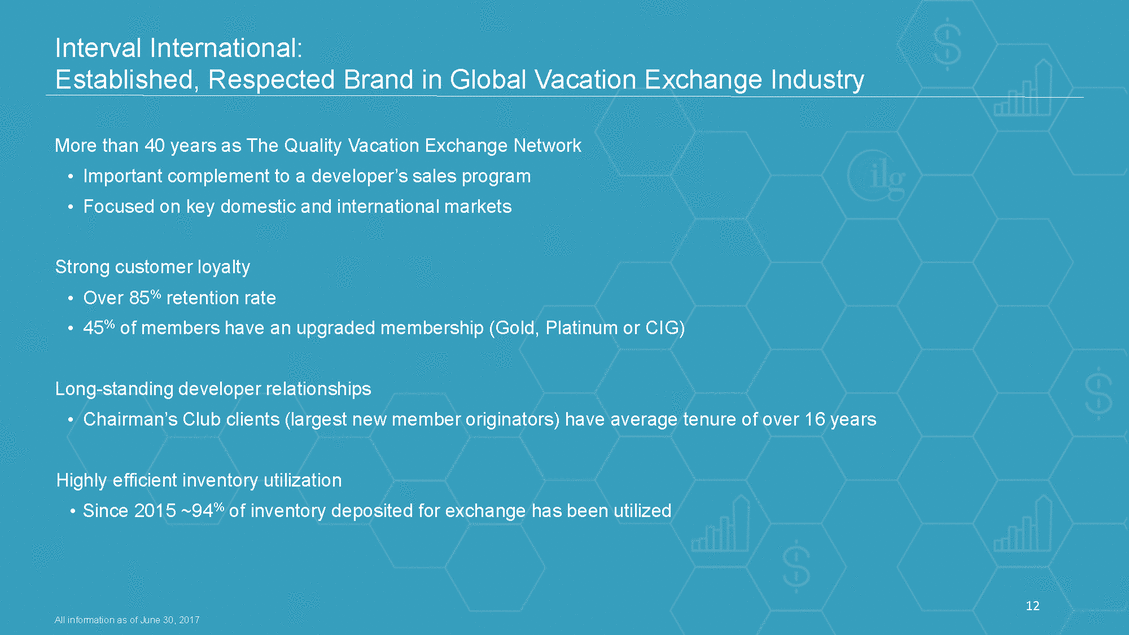
Interval International: Established, Respected Brand in Global Vacation Exchange Industry More than 40 years as The Quality Vacation Exchange Network • Important complement to a developer’s sales program • Focused on key domestic and international markets Strong customer loyalty • Over 85% retention rate • 45% of members have an upgraded membership (Gold, Platinum or CIG) Long-standing developer relationships • Chairman’s Club clients (largest new member originators) have average tenure of over 16 years Highly efficient inventory utilization • Since 2015 ~94% of inventory deposited for exchange has been utilized 12 All information as of June 30, 2017
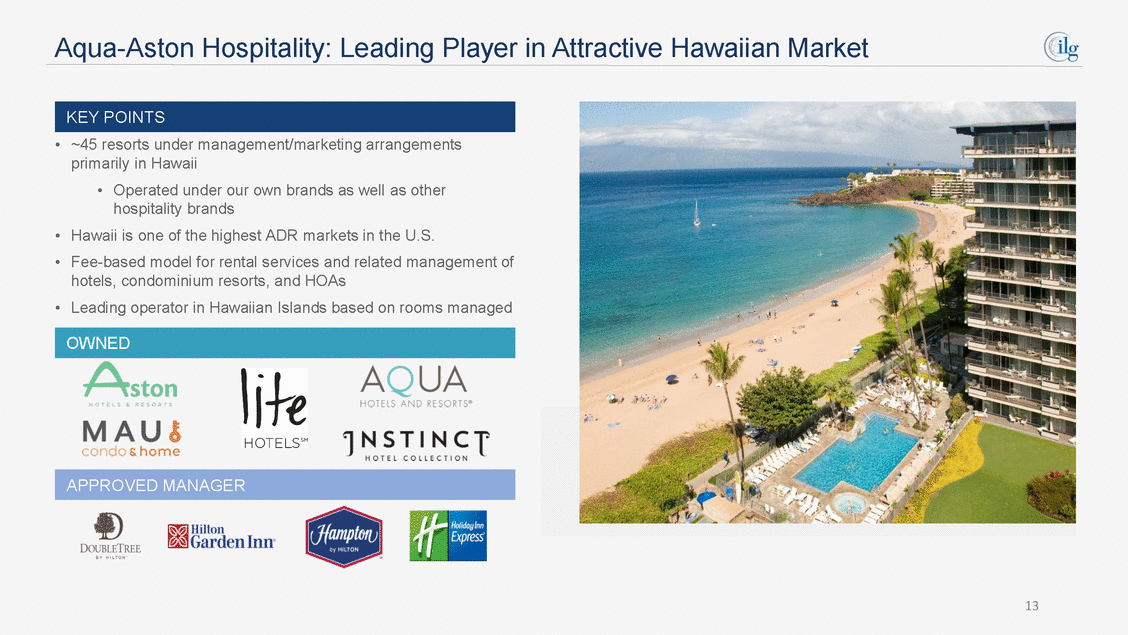
Aqua-Aston Hospitality: Leading Player in Attractive Hawaiian Market • ~45 resorts under management/marketing arrangements primarily in Hawaii • Operated under our own brands as well as other hospitality brands Hawaii is one of the highest ADR markets in the U.S. Fee-based model for rental services and related management of hotels, condominium resorts, and HOAs Leading operator in Hawaiian Islands based on rooms managed • • • 13 APPROVED MANAGER OWNED KEY POINTS
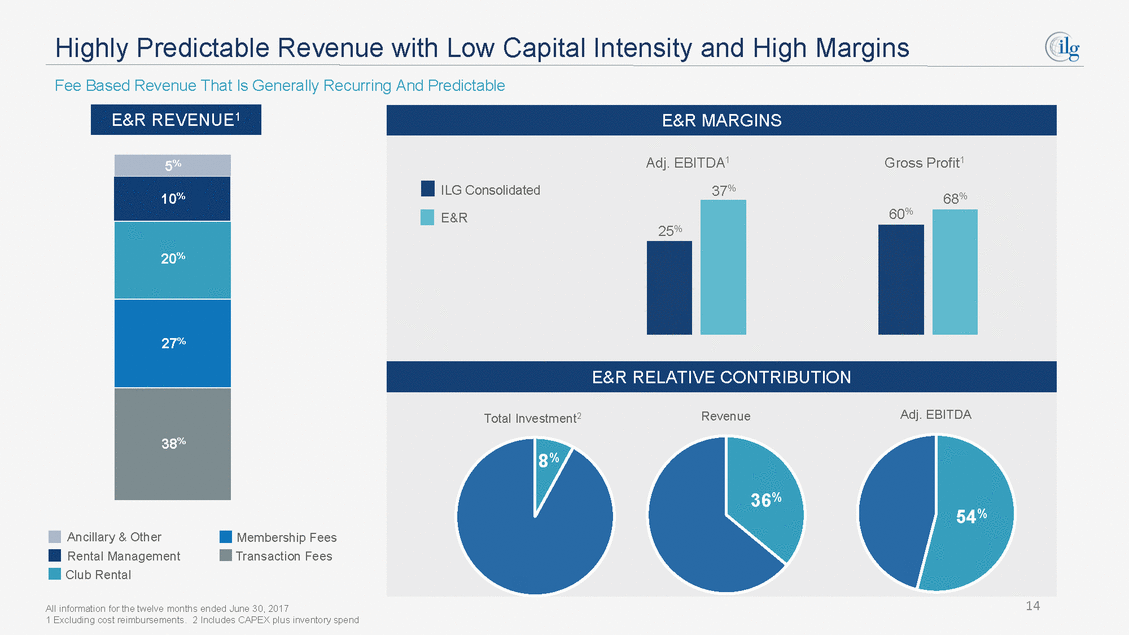
Highly Predictable Revenue with Low Capital Intensity and High Margins Fee Based Revenue That Is Generally Recurring And Predictable 5% 25% 54% 54% Ancillary & Other Rental Management Club Rental Membership Fees Transaction Fees 14 All information for the twelve months ended June 30, 2017 1 Excluding cost reimbursements. 2 Includes CAPEX plus inventory spend 10% 20% 27% 38% E&R REVENUE1 E&R MARGINS Adj. EBITDA1Gross Profit1 ILG Consolidated 37%68% E&R 60% E&R RELATIVE CONTRIBUTION Total Investment2 RevenueAdj. EBITDA 8% 36%
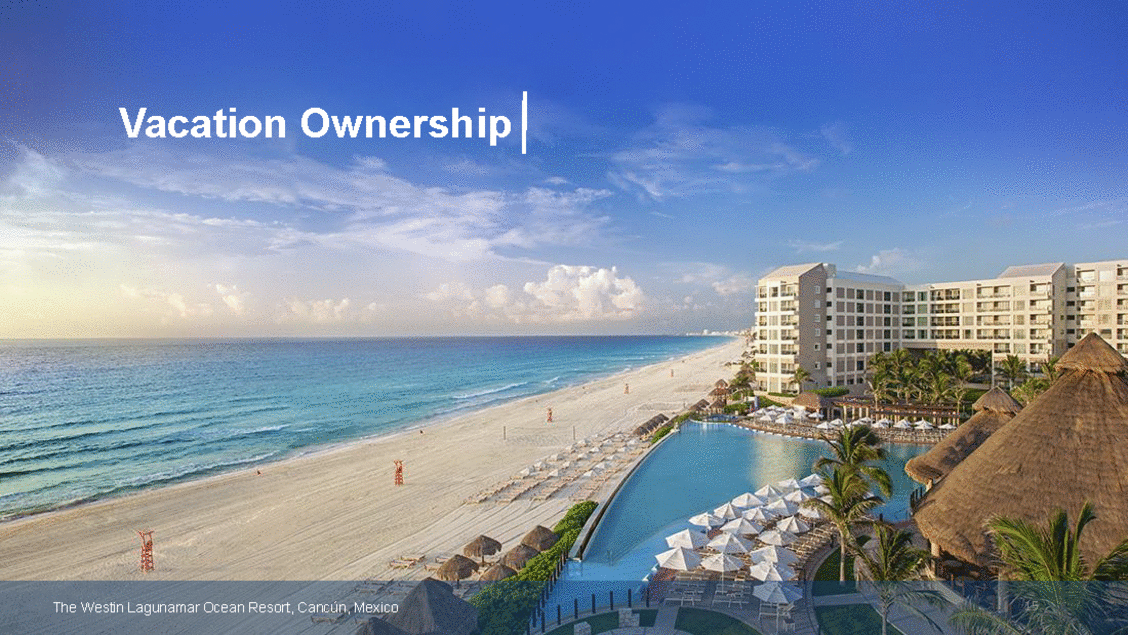
Vacation Ownership The Westin Lagunamar Ocean Resort, Cancún, Mexico 15
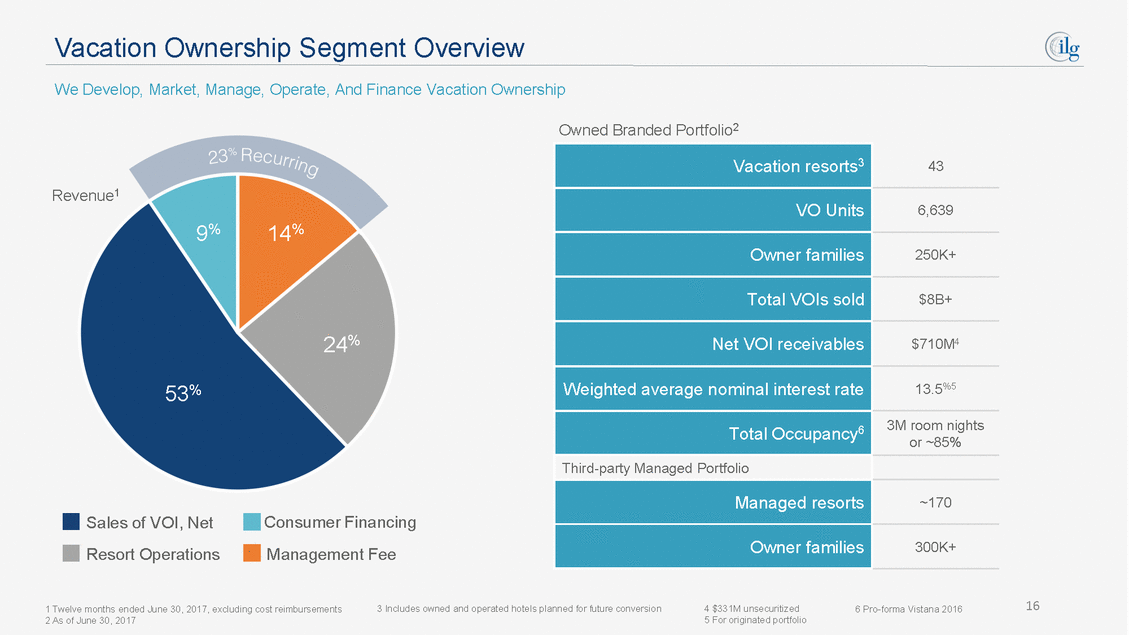
Vacation Ownership Segment Overview We Develop, Market, Manage, Operate, And Finance Vacation Ownership Owned Branded Portfolio2 Revenue1 9% 14% 24% 53% or ~85% Sales of VOI, Net Resort Operations Consumer Financing Management Fee 16 1 Twelve months ended June 30, 2017, excluding cost reimbursements 2 As of June 30, 2017 3 Includes owned and operated hotels planned for future conversion 4 $331M unsecuritized 5 For originated portfolio 6 Pro-forma Vistana 2016 Vacation resorts3 43 VO Units 6,639 Owner families 250K+ Total VOIs sold $8B+ Net VOI receivables $710M4 Weighted average nominal interest rate 13.5%5 Total Occupancy6 3M room nights Third-party Managed Portfolio Managed resorts ~170 Owner families 300K+
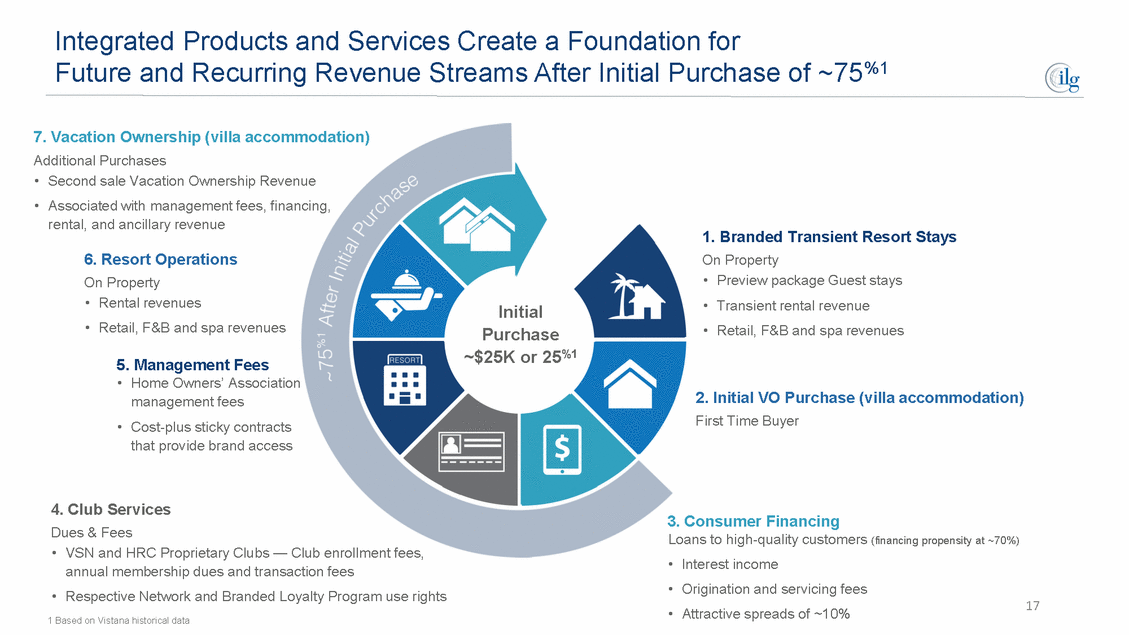
Integrated Products and Services Create a Foundation for Future and Recurring Revenue Streams After Initial Purchase of ~75%1 7. Vacation Ownership (villa accommodation) Additional Purchases • • Second sale Vacation Ownership Revenue Associated with management fees, financing, rental, and ancillary revenue 1. Branded Transient Resort Stays On Property 6. Resort Operations On Property • Rental revenues • Retail, F&B and spa revenues • • • Preview package Guest stays Transient rental revenue Retail, F&B and spa revenues Initial Purchase ~$25K or 25%1 5. Management Fees • Home Owners’ Association management fees • Cost-plus sticky contracts that provide brand access 2. Initial VO Purchase (villa accommodation) First Time Buyer 4. Club Services Dues & Fees • VSN and HRC Proprietary Clubs — Club enrollment fees, annual membership dues and transaction fees • Respective Network and Branded Loyalty Program use rights 1 Based on Vistana historical data 3. Consumer Financing Loans to high-quality customers (financing propensity at ~70%) • • • Interest income Origination and servicing fees Attractive spreads of ~10% 17
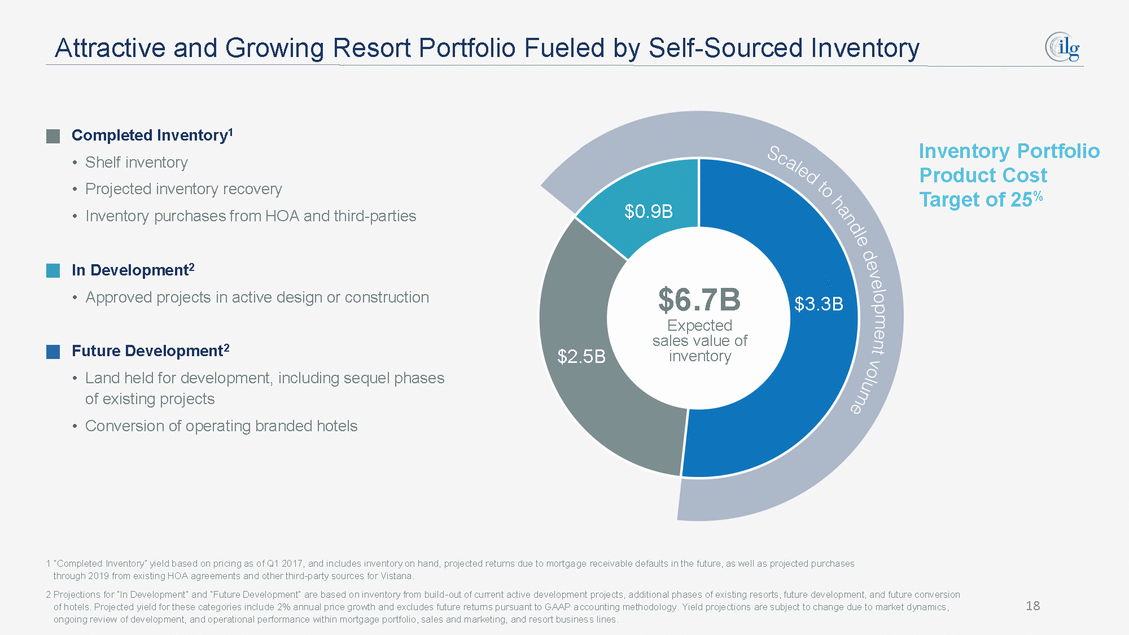
Attractive and Growing Resort Portfolio Fueled by Self-Sourced Inventory Completed Inventory1 Inventory Portfolio Product Cost Target of 25% • • • Shelf inventory Projected inventory recovery Inventory purchases from HOA and third-parties $0.9B In Development2 • Approved projects in active design or construction $6.7B Expected sales value of inventory $3.3B Future Development2 • Land held for development, including sequel phases of existing projects • Conversion of operating branded hotels $2.5B 1 “Completed Inventory” yield based on pricing as of Q1 2017, and includes inventory on hand, projected returns due to mortga ge receivable defaults in the future, as well as projected purchases through 2019 from existing HOA agreements and other third-party sources for Vistana. 2 Projections for “In Development” and “Future Development” are based on inventory from build -out of current active development projects, additional phases of existing resorts, future development, and future conversion of hotels. Projected yield for these categories include 2% annual price growth and excludes future returns pursuant to GAAP a ccounting methodology. Yield projections are subject to change due to market dynamics, ongoing review of development, and operational performance within mortgage portfolio, sales and marketing, and resort busines s lines. 18
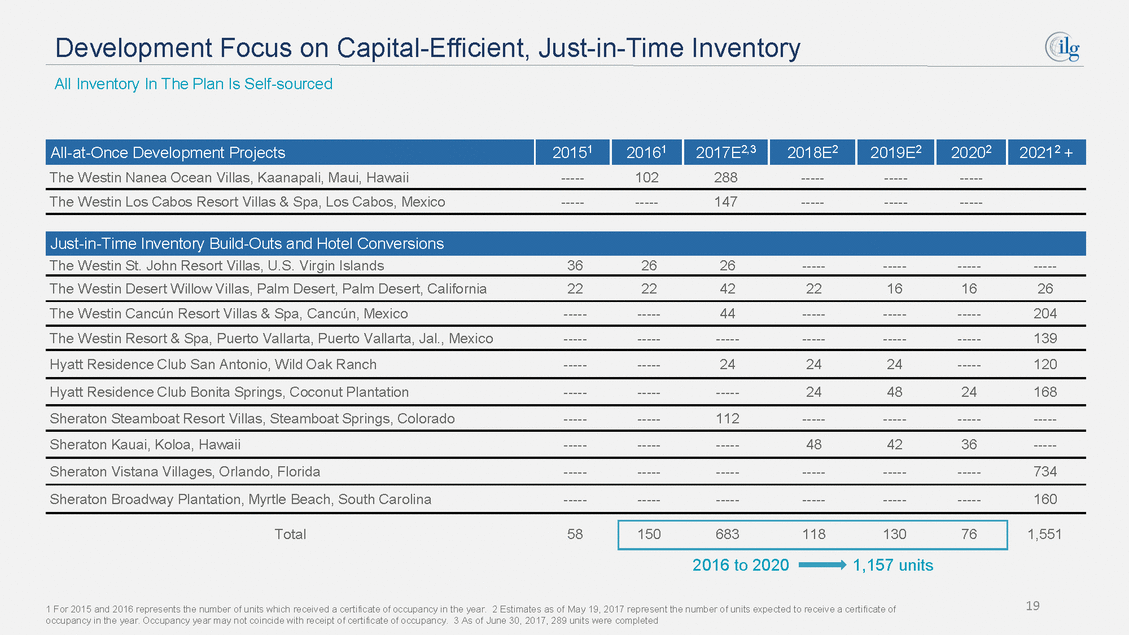
Development Focus on Capital-Efficient, Just-in-Time Inventory All Inventory In The Plan Is Self-sourced The Westin Nanea Ocean Villas, Kaanapali, Maui, Hawaii -----102 288 ---------------The Westin Los Cabos Resort Villas & Spa, Los Cabos, Mexico ----------147 ---------------The Westin St. John Resort Villas, U.S. Virgin Islands 36 26 26 --------------------The Westin Desert Willow Villas, Palm Desert, Palm Desert, California 22 22 42 22 16 16 26 The Westin Cancún Resort Villas & Spa, Cancún, Mexico ----------44 ---------------204 The Westin Resort & Spa, Puerto Vallarta, Puerto Vallarta, Jal., Mexico ------------------------------139 Hyatt Residence Club San Antonio, Wild Oak Ranch ----------24 24 24 -----120 Hyatt Residence Club Bonita Springs, Coconut Plantation ---------------24 48 24 168 Sheraton Steamboat Resort Villas, Steamboat Springs, Colorado ----------112 --------------------Sheraton Kauai, Koloa, Hawaii ---------------48 42 36 -----Sheraton Vistana Villages, Orlando, Florida ------------------------------734 Sheraton Broadway Plantation, Myrtle Beach, South Carolina ------------------------------160 Total 58 1,551 2016 to 2020 1,157 units 19 1 For 2015 and 2016 represents the number of units which received a certificate of occupancy in the year. 2 Estimates as of May 19, 2017 represent the number of units expected to receive a certificate of occupancy in the year. Occupancy year may not coincide with receipt of certificate of occupancy. 3 As of June 30, 2017, 289 units were completed 15068311813076 Just-in-Time Inventory Build-Outs and Hotel Conversions All-at-Once Development Projects 20151 20161 2017E2,3 2018E2 2019E2 20202 20212 +
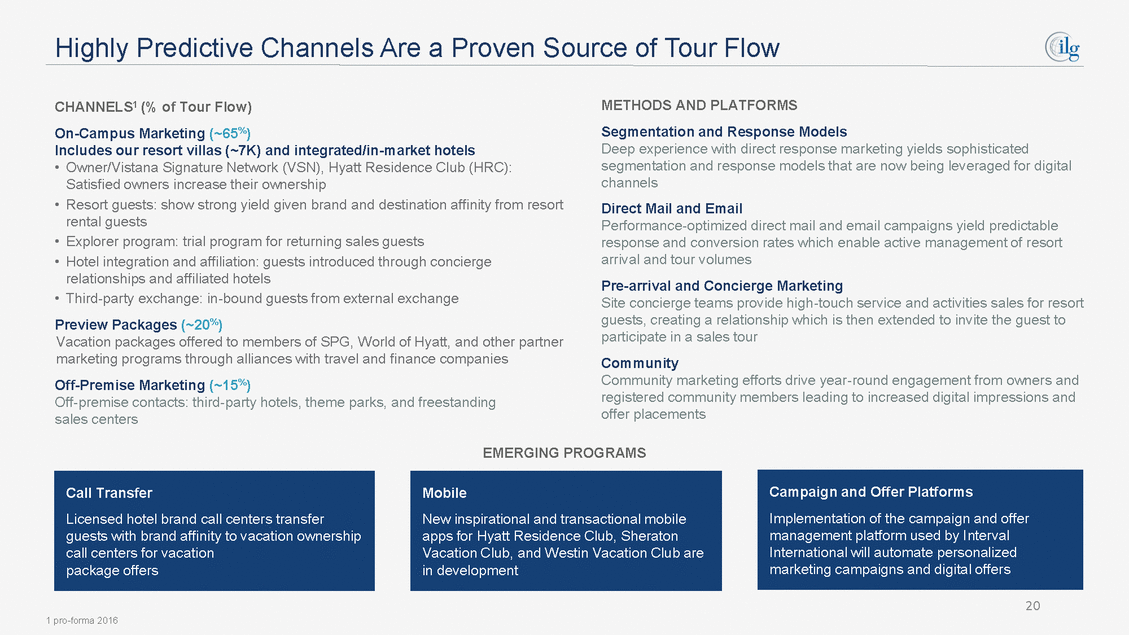
Highly Predictive Channels Are a Proven Source of Tour Flow METHODS AND PLATFORMS Segmentation and Response Models Deep experience with direct response marketing yields sophisticated segmentation and response models that are now being leveraged for digital channels Direct Mail and Email Performance-optimized direct mail and email campaigns yield predictable response and conversion rates which enable active management of resort arrival and tour volumes Pre-arrival and Concierge Marketing Site concierge teams provide high-touch service and activities sales for resort guests, creating a relationship which is then extended to invite the guest to participate in a sales tour Community Community marketing efforts drive year-round engagement from owners and registered community members leading to increased digital impressions and offer placements CHANNELS1 (% of Tour Flow) On-Campus Marketing (~65%) Includes our resort villas (~7K) and integrated/in-market hotels • Owner/Vistana Signature Network (VSN), Hyatt Residence Club (HRC): Satisfied owners increase their ownership • Resort guests: show strong yield given brand and destination affinity from resort rental guests • Explorer program: trial program for returning sales guests • Hotel integration and affiliation: guests introduced through concierge relationships and affiliated hotels • Third-party exchange: in-bound guests from external exchange Preview Packages (~20%) Vacation packages offered to members of SPG, World of Hyatt, and other partner marketing programs through alliances with travel and finance companies Off-Premise Marketing (~15%) Off-premise contacts: third-party hotels, theme parks, and freestanding sales centers EMERGING PROGRAMS 20 1 pro-forma 2016 Mobile New inspirational and transactional mobile apps for Hyatt Residence Club, Sheraton Vacation Club, and Westin Vacation Club are in development Call Transfer Licensed hotel brand call centers transfer guests with brand affinity to vacation ownership call centers for vacation package offers Campaign and Offer Platforms Implementation of the campaign and offer management platform used by Interval International will automate personalized marketing campaigns and digital offers
Financial Overview Hyatt Residence Club San Antonio, Wild Oak Ranch 21

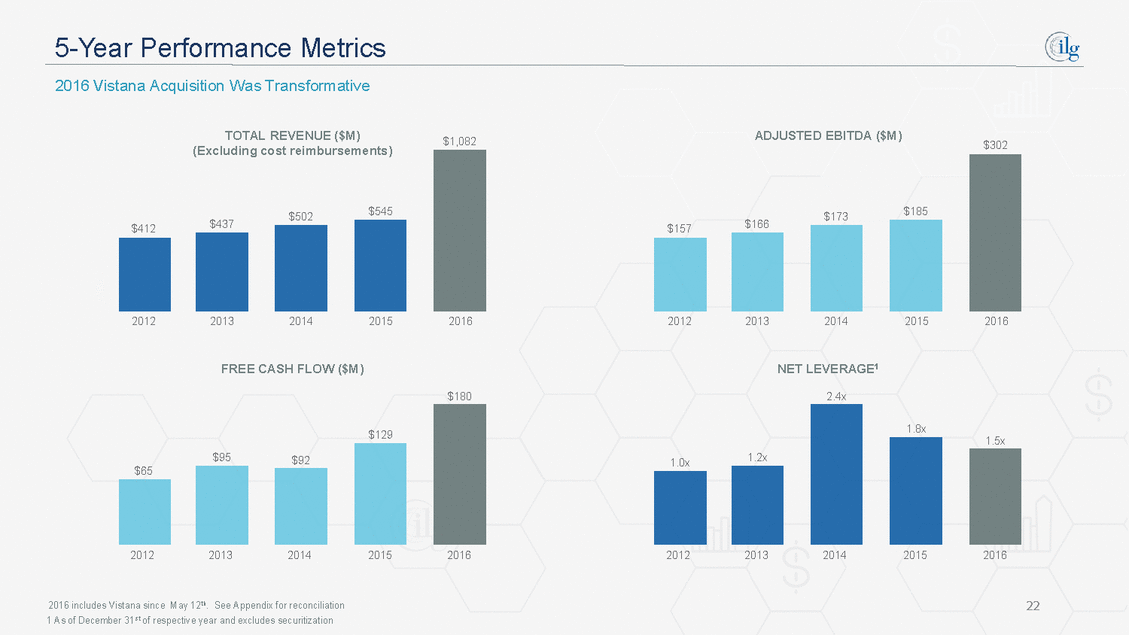
5-Year Performance Metrics 2016 Vistana Acquisition Was Transformative TOTAL REVENUE ($M) (Excluding cost reimbursements) ADJUSTED EBITDA ($M) $1,082 $302 $545 $185 $502 $173 $437 $166 $412 $157 2012 2013 2014 2015 2016 2012 2013 2014 2015 2016 FREE CASH FLOW ($M) NET LEVERAGE1 $180 2.4x 1.8x $129 1.5x $95 1.2x $92 1.0x $65 2012 2013 2014 2015 2016 2012 2013 2014 2015 2016 2016 includes Vistana since May 12th. See Appendix for reconciliation 1 As of December 31st of respective year and excludes securitization 22
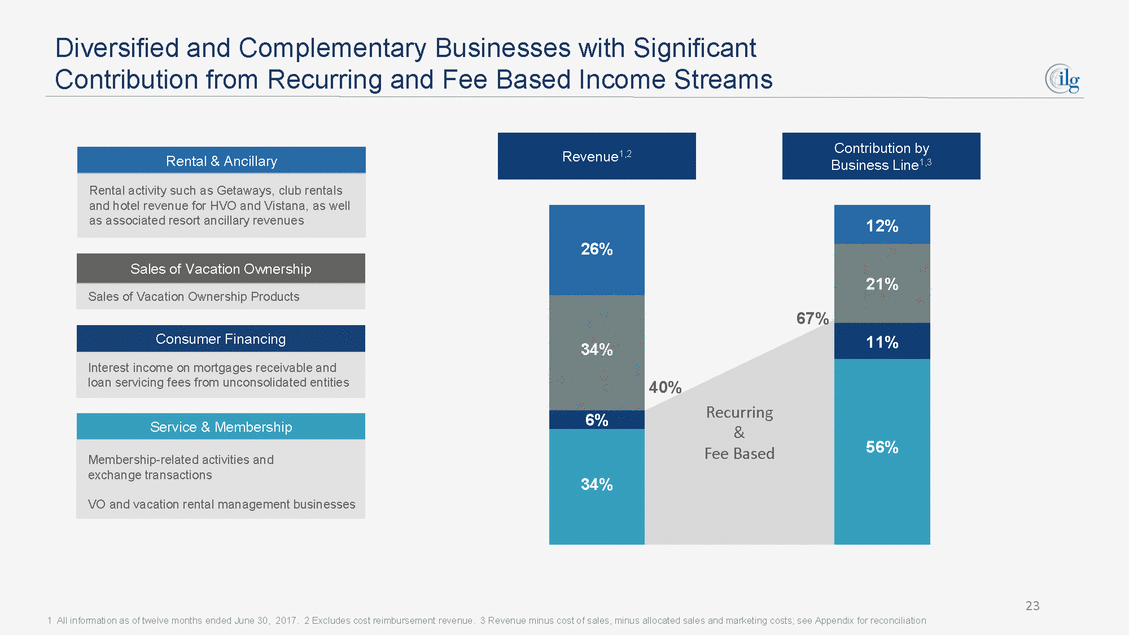
Diversified and Complementary Businesses with Significant Contribution from Recurring and Fee Based Income Streams 67% 40% Recurring & Fee Based 23 1 All information as of twelve months ended June 30, 2017. 2 Excludes cost reimbursement revenue. 3 Revenue minus cost of sales, minus allocated sales and marketing costs; see Appendix for reconciliation Service & Membership Membership-related activities and exchange transactions VO and vacation rental management businesses Consumer Financing Interest income on mortgages receivable and loan servicing fees from unconsolidated entities Sales of Vacation Ownership Sales of Vacation Ownership Products 26% 34% 6% 34% 12% 21% 11% 56% Rental & Ancillary Rental activity such as Getaways, club rentals and hotel revenue for HVO and Vistana, as well as associated resort ancillary revenues Contribution by Business Line1,3 Revenue1,2
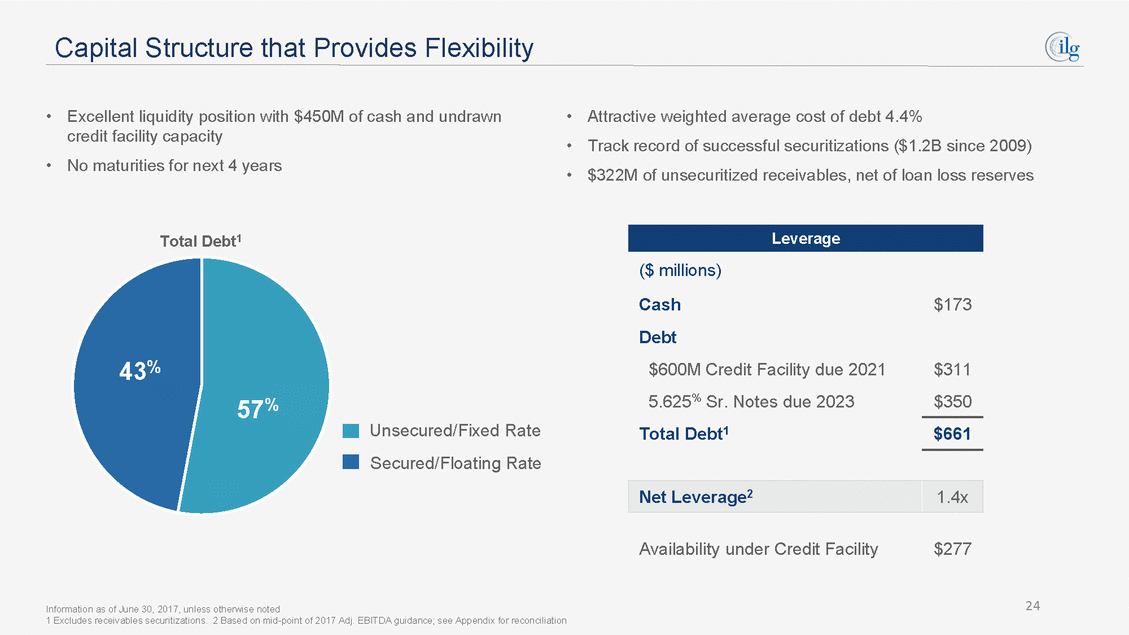
Capital Structure that Provides Flexibility • Excellent liquidity position with $450M of cash and undrawn credit facility capacity No maturities for next 4 years • • • Attractive weighted average cost of debt 4.4% Track record of successful securitizations ($1.2B since 2009) $322M of unsecuritized receivables, net of loan loss reserves • Total Debt1 ($ millions) Cash Debt $600M Credit Facility due 2021 5.625% Sr. Notes due 2023 Total Debt1 $173 43% $311 $350 57% Unsecured/Fixed Rate Secured/Floating Rate $661 Availability under Credit Facility $277 24 Information as of June 30, 2017, unless otherwise noted 1 Excludes receivables securitizations. 2 Based on mid-point of 2017 Adj. EBITDA guidance; see Appendix for reconciliation Net Leverage2 1.4x Leverage
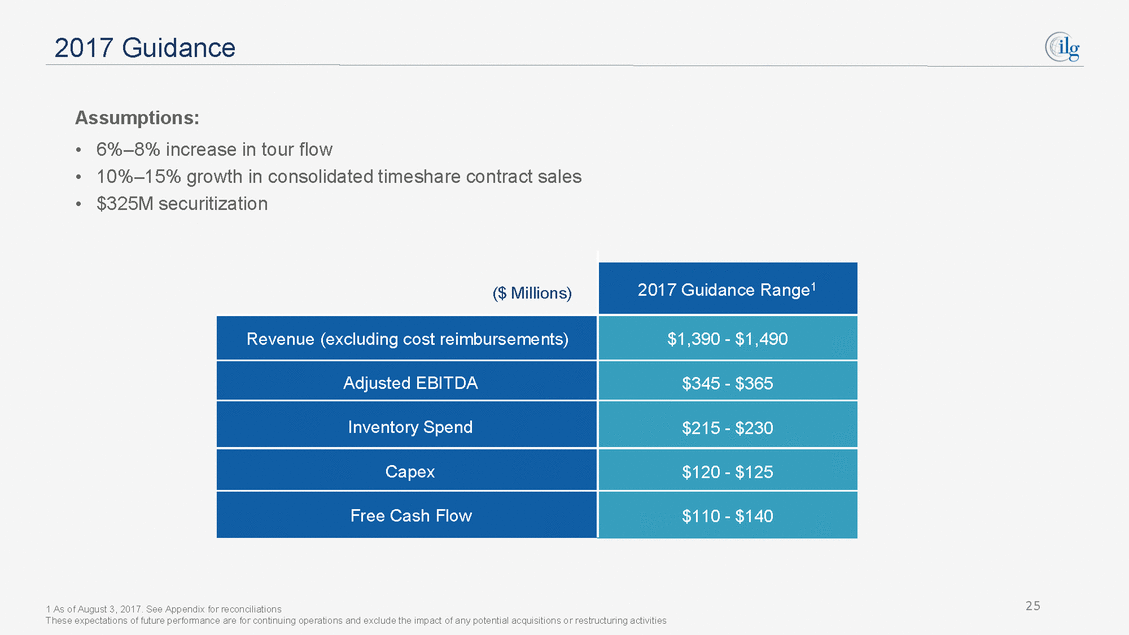
2017 Guidance Assumptions: • • • 6%–8% increase in tour flow 10%–15% growth in consolidated timeshare contract sales $325M securitization ($ Millions) 25 1 As of August 3, 2017. See Appendix for reconciliations These expectations of future performance are for continuing operations and exclude the impact of any potential acquisitions o r restructuring activities 2017 Guidance Range1 Revenue (excluding cost reimbursements) $1,390 - $1,490 Adjusted EBITDA $345 - $365 Inventory Spend $215 - $230 Capex $120 - $125 Free Cash Flow $110 - $140
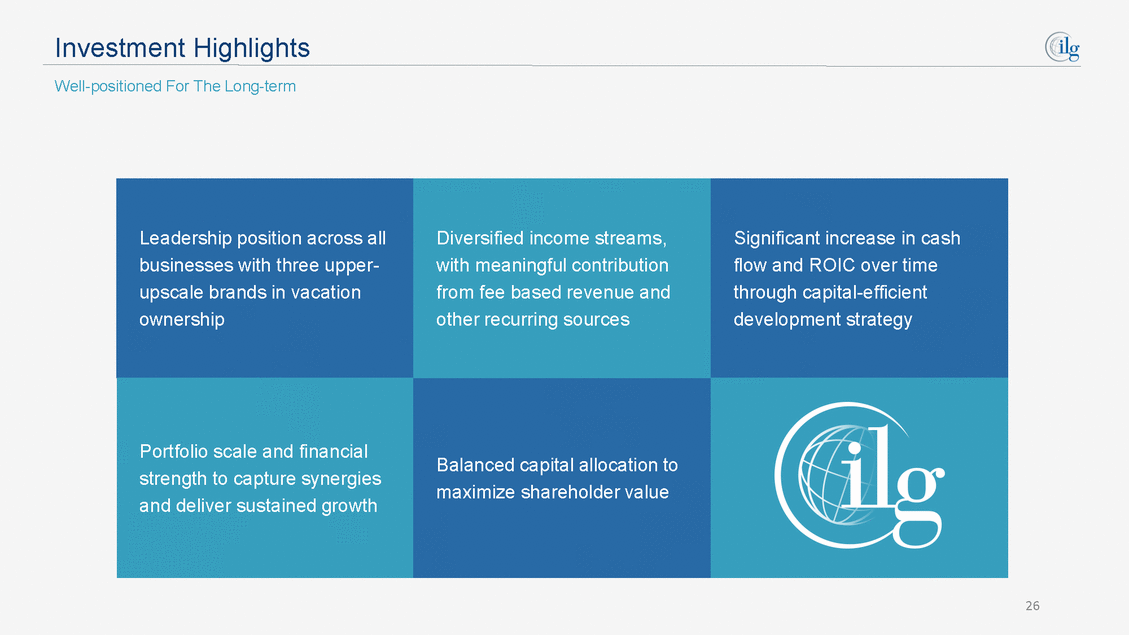
Investment Highlights Well-positioned For The Long-term 26 Leadership position across all businesses with three upper-upscale brands in vacation ownership Diversified income streams, with meaningful contribution from fee based revenue and other recurring sources Significant increase in cash flow and ROIC over time through capital-efficient development strategy Portfolio scale and financial strength to capture synergies and deliver sustained growth Balanced capital allocation to maximize shareholder value
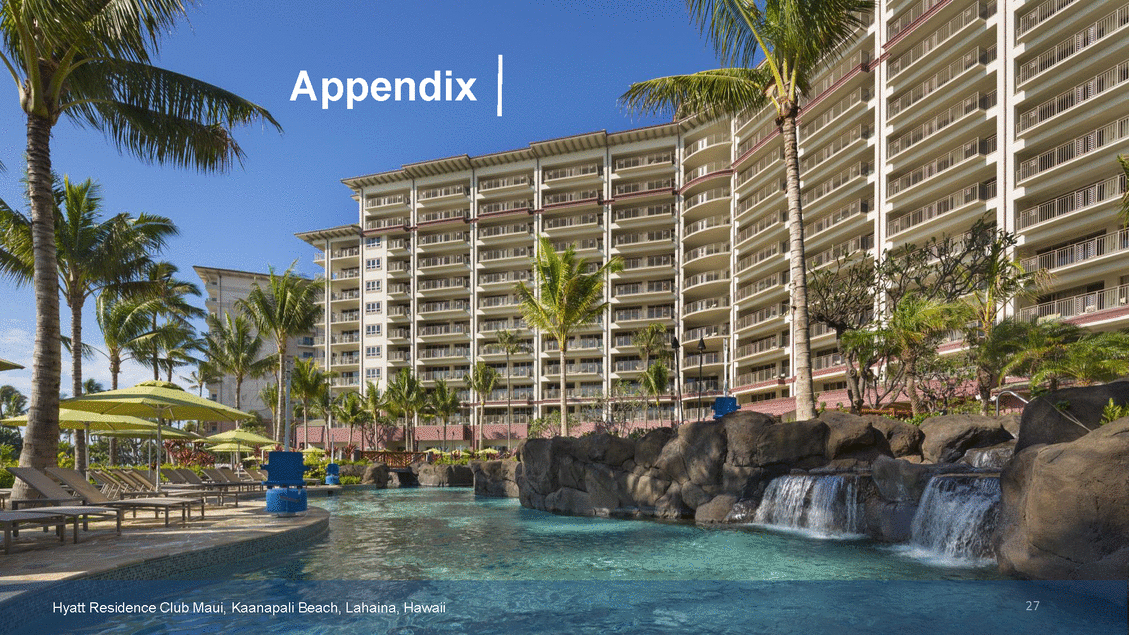
Appendix Hyatt Residence Club Maui, Kaanapali Beach, Lahaina, Hawaii 27
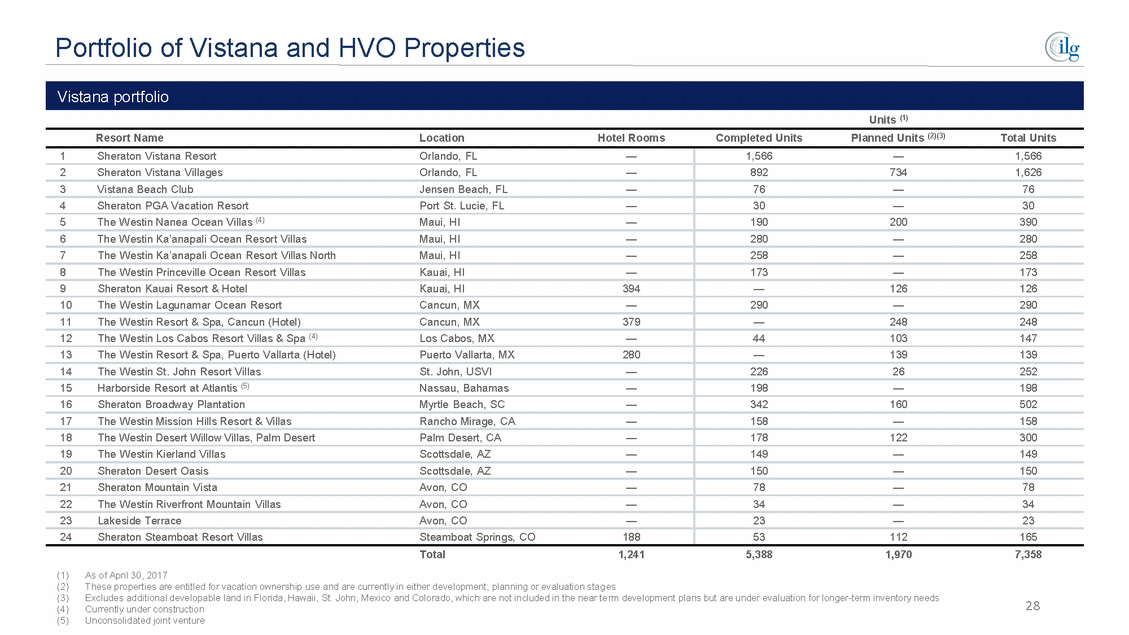
Portfolio of Vistana and HVO Properties Units (1) Resort Name Location Hotel Rooms Completed Units Planned Units (2)(3) Total Units (1) (2) (3) (4) (5) As of April 30, 2017 These properties are entitled for vacation ownership use and are currently in either development, planning or evaluation stag es Excludes additional developable land in Florida, Hawaii, St. John, Mexico and Colorado, which are not included in the near te rm development plans but are under evaluation for longer-term inventory needs Currently under construction Unconsolidated joint venture 28 1Sheraton Vistana ResortOrlando, FL— 1,566—1,566 2Sheraton Vistana VillagesOrlando, FL— 8927341,626 3Vistana Beach ClubJensen Beach, FL— 76—76 4Sheraton PGA Vacation ResortPort St. Lucie, FL— 30—30 5The Westin Nanea Ocean Villas (4) Maui, HI— 190200390 6The Westin Ka’anapali Ocean Resort VillasMaui, HI— 280—280 7The Westin Ka’anapali Ocean Resort Villas NorthMaui, HI— 258—258 8The Westin Princeville Ocean Resort VillasKauai, HI— 173—173 9Sheraton Kauai Resort & HotelKauai, HI394 —126126 10The Westin Lagunamar Ocean ResortCancun, MX— 290—290 11The Westin Resort & Spa, Cancun (Hotel)Cancun, MX379 —248248 12The Westin Los Cabos Resort Villas & Spa (4) Los Cabos, MX— 44103147 13The Westin Resort & Spa, Puerto Vallarta (Hotel)Puerto Vallarta, MX280 —139139 14The Westin St. John Resort VillasSt. John, USVI— 22626252 15Harborside Resort at Atlantis (5) Nassau, Bahamas— 198—198 16Sheraton Broadway PlantationMyrtle Beach, SC— 342160502 17The Westin Mission Hills Resort & VillasRancho Mirage, CA— 158—158 18The Westin Desert Willow Villas, Palm DesertPalm Desert, CA— 178122300 19The Westin Kierland VillasScottsdale, AZ— 149—149 20Sheraton Desert OasisScottsdale, AZ— 150—150 21Sheraton Mountain VistaAvon, CO— 78—78 22The Westin Riverfront Mountain VillasAvon, CO— 34—34 23Lakeside TerraceAvon, CO— 23—23 24Sheraton Steamboat Resort VillasSteamboat Springs, CO188 53112165 Total1,241 5,3881,9707,358 Vistana portfolio
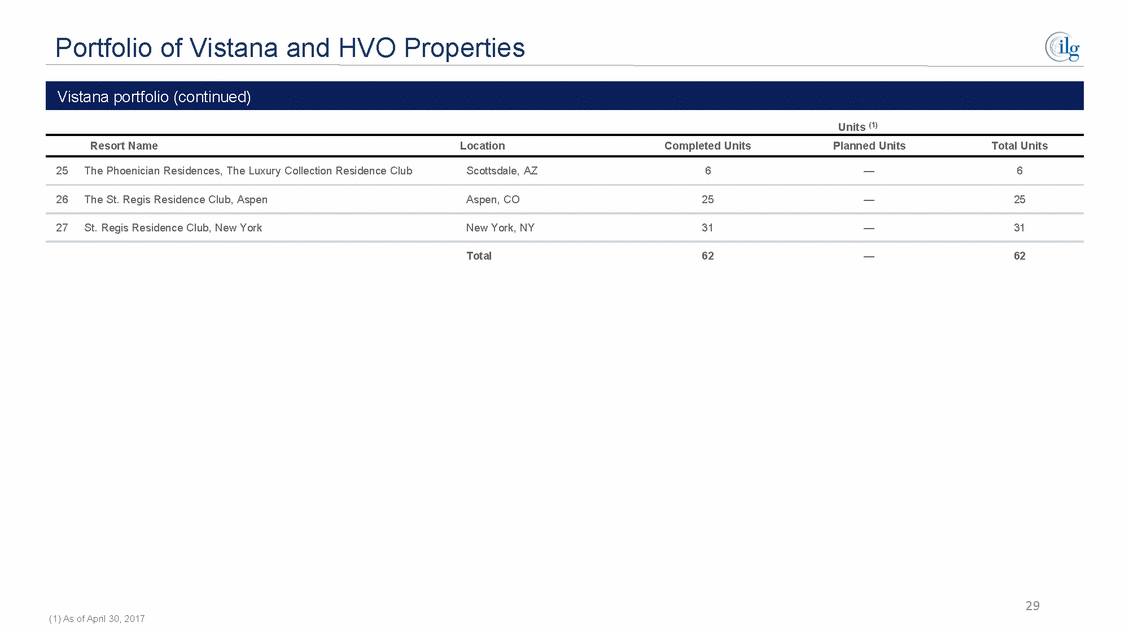
Portfolio of Vistana and HVO Properties Units (1) Resort Name Location Completed Units Planned Units Total Units 25 The Phoenician Residences, The Luxury Collection Residence Club Scottsdale, AZ 6 — 6 26 The St. Regis Residence Club, Aspen Aspen, CO 25 — 25 27 St. Regis Residence Club, New York New York, NY 31 — 31 Total 62 — 62 29 (1) As of April 30, 2017 Vistana portfolio (continued)
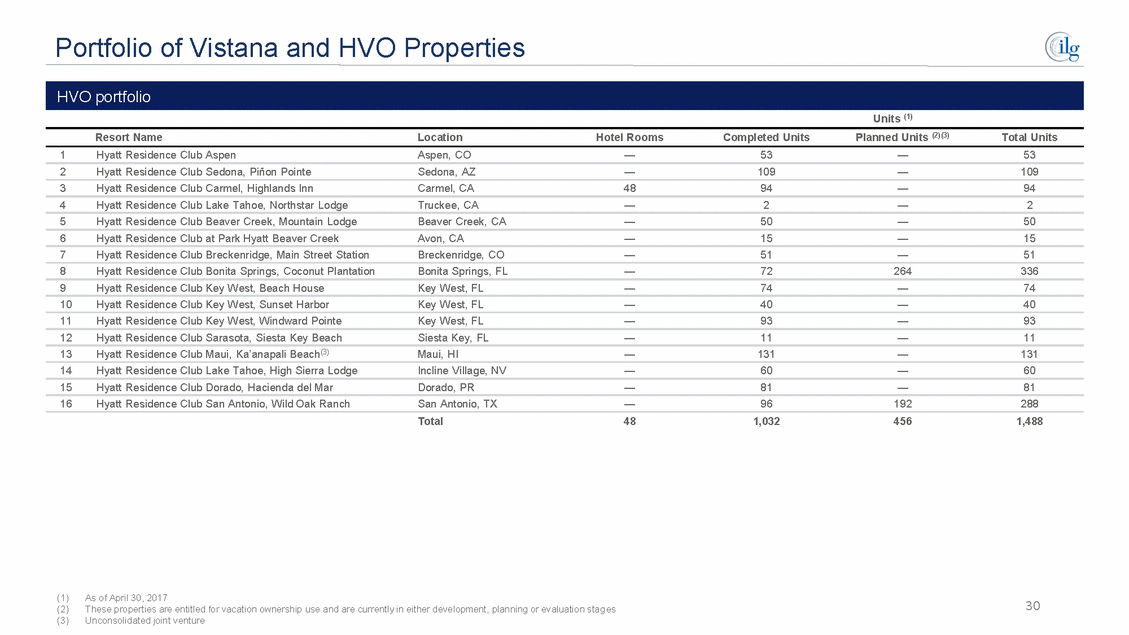
Portfolio of Vistana and HVO Properties Units (1) Resort Name Location Hotel Rooms Completed Units Planned Units (2)(3) Total Units 1 Hyatt Residence Club Aspen Aspen, CO — 53 — 53 2 Hyatt Residence Club Sedona, Piñon Pointe Sedona, AZ — 109 — 109 3 Hyatt Residence Club Carmel, Highlands Inn Carmel, CA 48 94 — 94 4 Hyatt Residence Club Lake Tahoe, Northstar Lodge Truckee, CA — 2 — 2 5 Hyatt Residence Club Beaver Creek, Mountain Lodge Beaver Creek, CA — 50 — 50 6 Hyatt Residence Club at Park Hyatt Beaver Creek Avon, CA — 15 — 15 7 Hyatt Residence Club Breckenridge, Main Street Station Breckenridge, CO — 51 — 51 8 Hyatt Residence Club Bonita Springs, Coconut Plantation Bonita Springs, FL — 72 264 336 9 Hyatt Residence Club Key West, Beach House Key West, FL — 74 — 74 10 Hyatt Residence Club Key West, Sunset Harbor Key West, FL — 40 — 40 11 Hyatt Residence Club Key West, Windward Pointe Key West, FL — 93 — 93 12 Hyatt Residence Club Sarasota, Siesta Key Beach Siesta Key, FL — 11 — 11 Hyatt Residence Club Maui, Ka’anapali Beach(3) 13 Maui, HI — 131 — 131 14 Hyatt Residence Club Lake Tahoe, High Sierra Lodge Incline Village, NV — 60 — 60 15 Hyatt Residence Club Dorado, Hacienda del Mar Dorado, PR — 81 — 81 16 Hyatt Residence Club San Antonio, Wild Oak Ranch San Antonio, TX — 96 192 288 Total 48 1,032 456 1,488 (1) (2) (3) As of April 30, 2017 These properties are entitled for vacation ownership use and are currently in either development, planning or evaluation stag es Unconsolidated joint venture 30 HVO portfolio
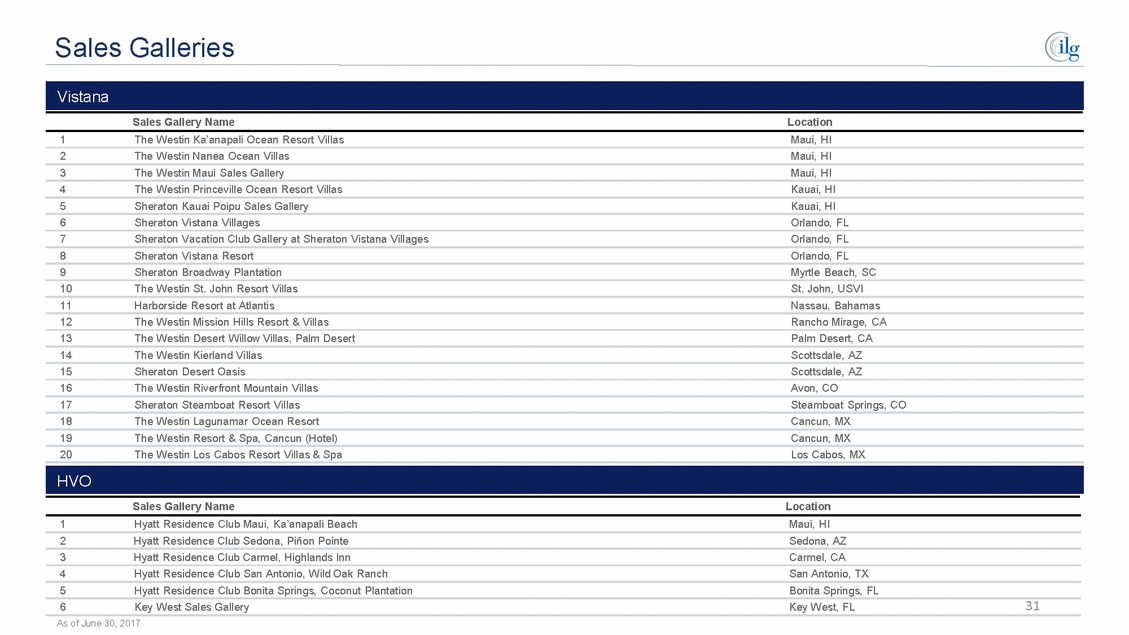
Sales Galleries Sales Gallery Name Location 1 The Westin Ka’anapali Ocean Resort Villas Maui, HI 2 The Westin Nanea Ocean Villas Maui, HI 3 The Westin Maui Sales Gallery Maui, HI 4 The Westin Princeville Ocean Resort Villas Kauai, HI 5 Sheraton Kauai Poipu Sales Gallery Kauai, HI 6 Sheraton Vistana Villages Orlando, FL 7 Sheraton Vacation Club Gallery at Sheraton Vistana Villages Orlando, FL 8 Sheraton Vistana Resort Orlando, FL 9 Sheraton Broadway Plantation Myrtle Beach, SC 10 The Westin St. John Resort Villas St. John, USVI 11 Harborside Resort at Atlantis Nassau, Bahamas 12 The Westin Mission Hills Resort & Villas Rancho Mirage, CA 13 The Westin Desert Willow Villas, Palm Desert Palm Desert, CA 14 The Westin Kierland Villas Scottsdale, AZ 15 Sheraton Desert Oasis Scottsdale, AZ 16 The Westin Riverfront Mountain Villas Avon, CO 17 Sheraton Steamboat Resort Villas Steamboat Springs, CO 18 The Westin Lagunamar Ocean Resort Cancun, MX 19 The Westin Resort & Spa, Cancun (Hotel) Cancun, MX 20 The Westin Los Cabos Resort Villas & Spa Los Cabos, MX Sales Gallery Name Location 1 Hyatt Residence Club Maui, Ka’anapali Beach Maui, HI 2 Hyatt Residence Club Sedona, Piñon Pointe Sedona, AZ 3 Hyatt Residence Club Carmel, Highlands Inn Carmel, CA 4 Hyatt Residence Club San Antonio, Wild Oak Ranch San Antonio, TX 5 Hyatt Residence Club Bonita Springs, Coconut Plantation Bonita Springs, FL 31 6 Key West Sales Gallery Key West, FL As of June 30, 2017 HVO Vistana
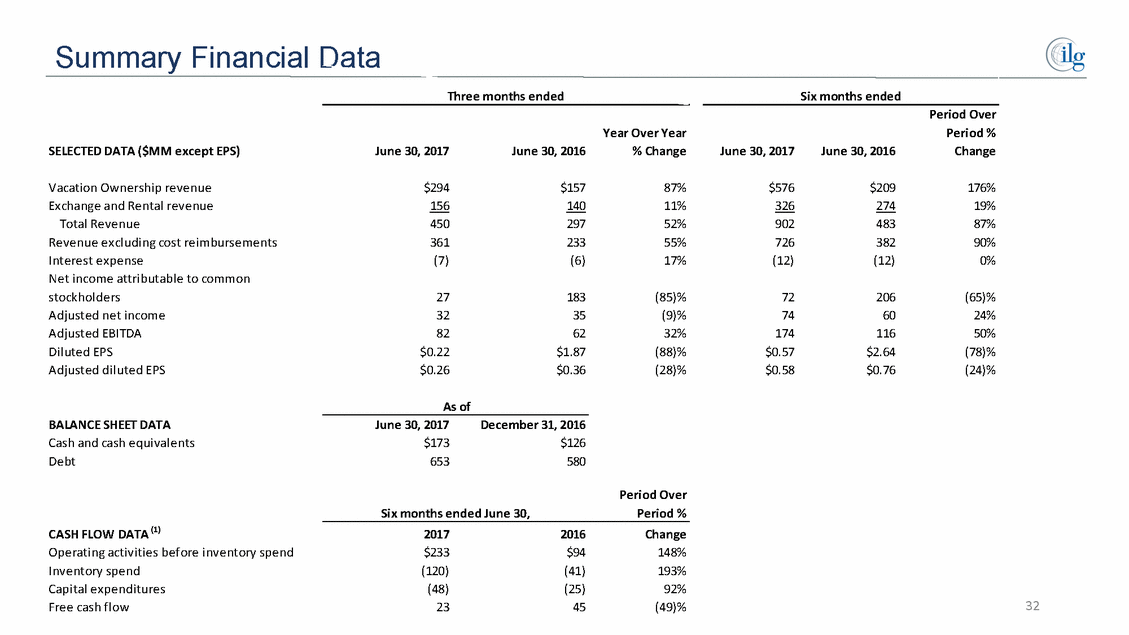
Summary Financial Data Three months ended Six months ended Period Over Period % Change Year Over Year % Change SELECTED DATA ($MM except EPS) June 30, 2017 June 30, 2016 June 30, 2017 June 30, 2016 Vacation Ownership revenue Exchange and Rental revenue Total Revenue Revenue excluding cost reimbursements Interest expense Net income attributable to common stockholders Adjusted net income Adjusted EBITDA Diluted EPS Adjusted diluted EPS $294 156 450 361 (7) $157 140 297 233 (6) 87% 11% 52% 55% 17% $576 326 902 726 (12) $209 274 483 382 (12) 176% 19% 87% 90% 0% 27 32 82 $0.22 $0.26 183 35 62 $1.87 $0.36 (85)% (9)% 32% (88)% (28)% 72 74 174 $0.57 $0.58 206 60 116 $2.64 $0.76 (65)% 24% 50% (78)% (24)% As of BALANCE SHEET DATA June 30, 2017 December 31, 2016 Cash and cash equivalents Debt $173 653 $126 580 Period Over Period % Six months ended June 30, CASH FLOW DATA (1) 2017 2016 Change Operating activities before inventory spend Inventory spend Capital expenditures Free cash flow $233 (120) (48) 23 $94 (41) (25) 45 148% 193% 92% (49)% 32
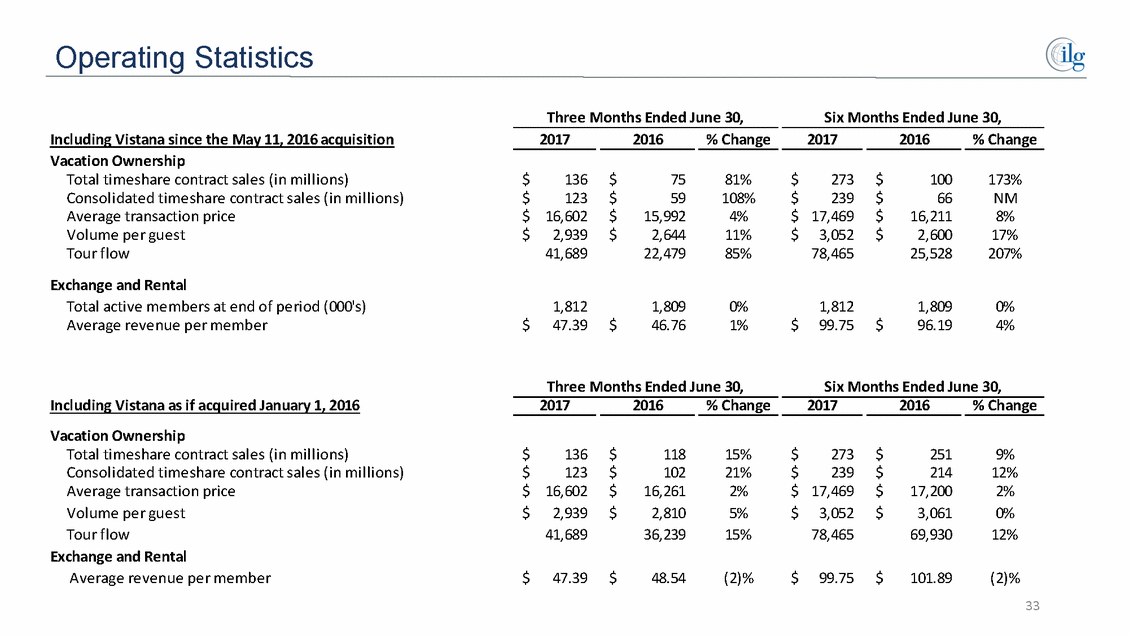
Operating Statistics Three Months Ended June 30, Six Months Ended June 30, Including Vistana since the May 11, 2016 acquisition 2017 2016 % Change 2017 2016 % Change Vacation Ownership Total timeshare contract sales (in millions) Consolidated timeshare contract sales (in millions) Average transaction price Volume per guest Tour flow Exchange and Rental Total active members at end of period (000's) Average revenue per member $ $ $ $ 136 123 16,602 2,939 41,689 $ $ $ $ 75 59 15,992 2,644 22,479 81% 108% 4% 11% 85% $ $ $ $ 273 239 17,469 3,052 78,465 $ $ $ $ 100 66 16,211 2,600 25,528 173% NM 8% 17% 207% 1,812 47.39 1,809 46.76 0% 1% 1,812 99.75 1,809 96.19 0% 4% $ $ $ $ Three Months Ended June 30, Six Months Ended June 30, Including Vistana as if acquired January 1, 2016 2017 2016 % Change 2017 2016 % Change Vacation Ownership Total timeshare contract sales (in millions) Consolidated timeshare contract sales (in millions) Average transaction price Volume per guest Tour flow Exchange and Rental Average revenue per member $ $ $ $ 136 123 16,602 2,939 41,689 $ $ $ $ 118 102 16,261 2,810 36,239 15% 21% 2% 5% 15% $ $ $ $ 273 239 17,469 3,052 78,465 $ $ $ $ 251 214 17,200 3,061 69,930 9% 12% 2% 0% 12% $ 47.39 $ 48.54 (2)% $ 99.75 $ 101.89 (2)% 33
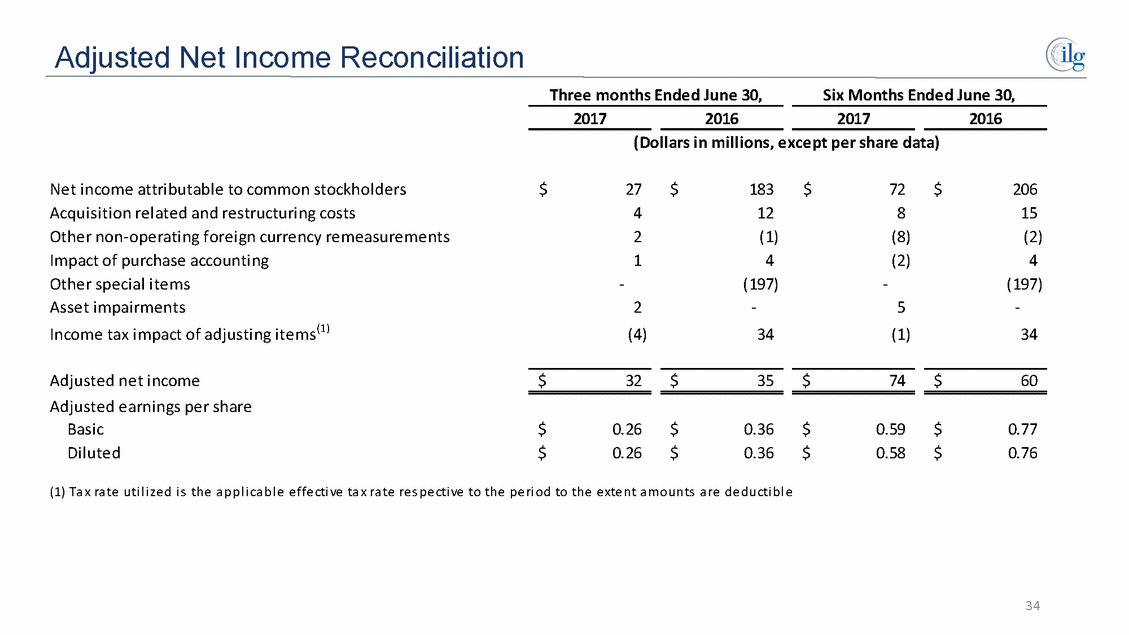
Adjusted Net Income Reconciliation Three months Ended June 30, Six Months Ended June 30, 2017 2016 2017 2016 (Dollars in millions, except per share data) Net income attributable to common stockholders Acquisition related and restructuring costs Other non-operating foreign currency remeasurements Impact of purchase accounting Other special items Asset impairments Income tax impact of adjusting items(1) $ 27 4 2 1 $ 183 12 (1) 4 (197) - 34 $ 72 8 (8) (2) $ 206 15 (2) 4 (197) - 34 - - 2 (4) 5 (1) Adjusted net income Adjusted earnings per share Basic Diluted $ 32 $ 35 $ 74 $ 60 $ $ 0.26 0.26 $ $ 0.36 0.36 $ $ 0.59 0.58 $ $ 0.77 0.76 (1) Ta x ra te uti l i ze d i s the a ppl i ca bl e e ffe cti ve ta x ra te re s pe cti ve to the pe ri od to the e xte nt a mounts a re de ducti bl e 34
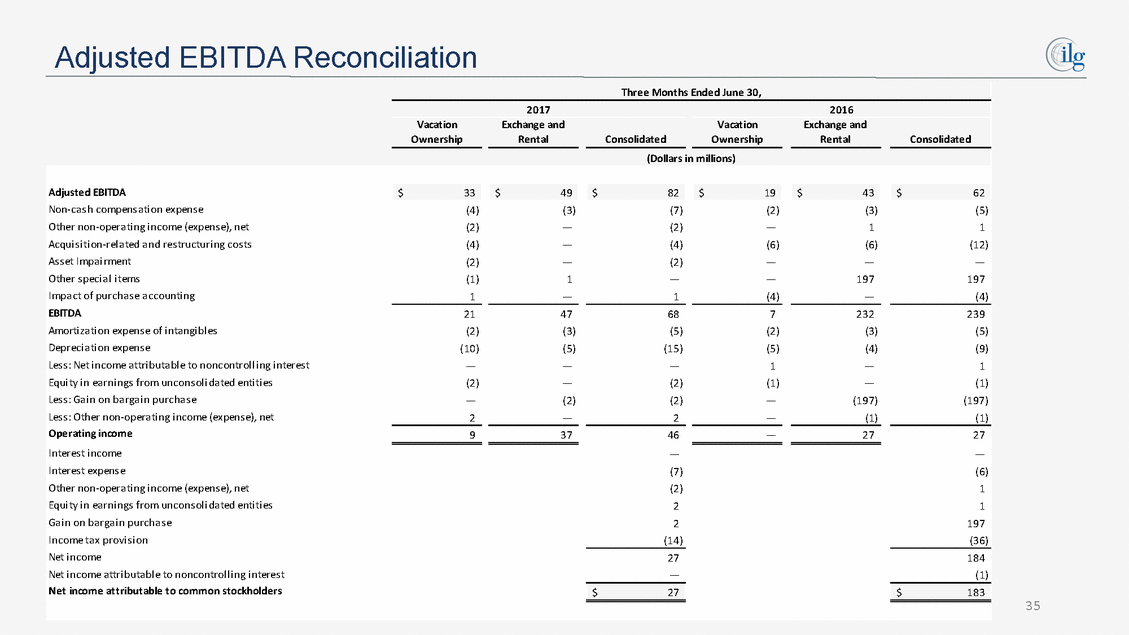
Adjusted EBITDA Reconciliation Three Months Ended June 30, 2017 2016 Vacation Ownership Exchange and Rental Vacation Ownership Exchange and Rental Consolidated Consolidated (Dollars in millions) 35 Adjusted EBITDA $ 33 $ 49 $ 82 $ 19 $ 43 $ 62 Non-ca s h compens a ti on expens e (4) (3) (7) (2) (3) (5) Other non-opera ti ng i ncome (expens e), net (2) — (2) — 1 1 Acqui s i ti on-rel a ted a nd res tructuri ng cos ts (4) — (4) (6) (6) (12) As s et Impa i rment (2) — (2) — — — Other s peci a l i tems (1) 1 — — 197 197 Impa ct of purcha s e a ccounti ng 1 — 1 (4) — (4) EBITDA 21 47 68 7 232 239 Amorti za ti on expens e of i nta ngi bl es (2) (3) (5) (2) (3) (5) Depreci a ti on expens e (10) (5) (15) (5) (4) (9) Les s : Net i ncome a ttri buta bl e to noncontrol l i ng i nteres t — — — 1 — 1 Equi ty i n ea rni ngs from uncons ol i da ted enti ti es (2) — (2) (1) — (1) Les s : Ga i n on ba rga i n purcha s e — (2) (2) — (197) (197) Les s : Other non-opera ti ng i ncome (expens e), net 2 — 2 — (1) (1) Operating income 9 37 46 — 27 27 Interes t i ncome — — Interes t expens e (7) (6) Other non-opera ti ng i ncome (expens e), net (2) 1 Equi ty i n ea rni ngs from uncons ol i da ted enti ti es 2 1 Ga i n on ba rga i n purcha s e 2 197 Income ta x provi s i on (14) (36) Net i ncome 27 184 Net i ncome a ttri buta bl e to noncontrol l i ng i nteres t — (1) Net income attributable to common stockholders $ 27 $ 183
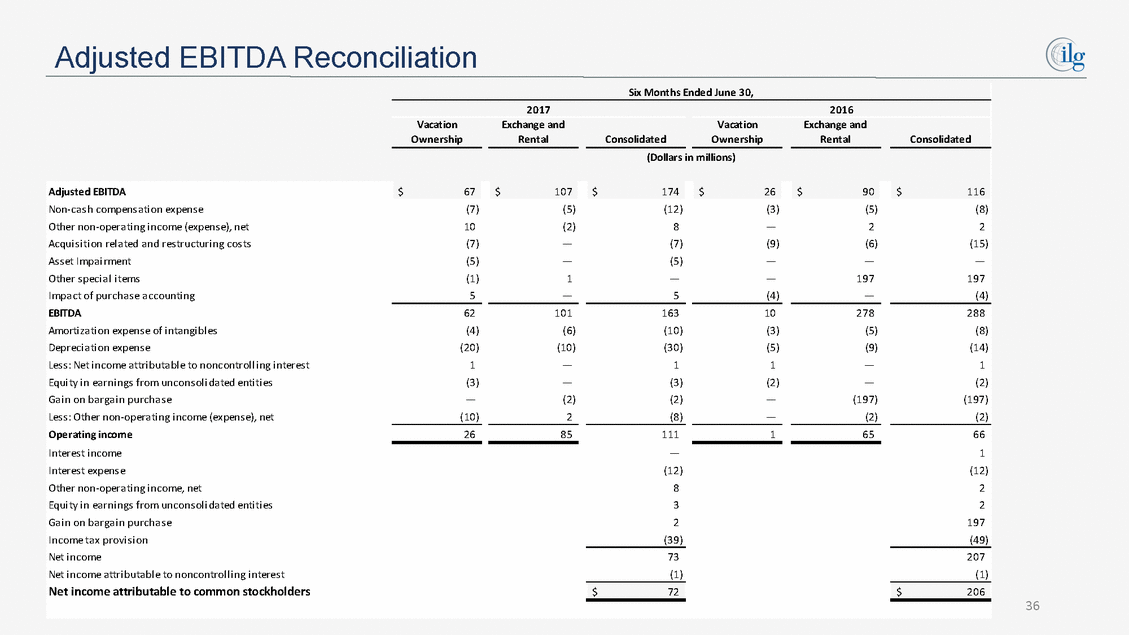
Adjusted EBITDA Reconciliation Six Months Ended June 30, 2017 2016 Vacation Ownership Exchange and Rental Vacation Ownership Exchange and Rental Consolidated Consolidated (Dollars in millions) 36 Adjusted EBITDA $ 67 $ 107 $ 174 $ 26 $ 90 $ 116 Non-ca s h compens a ti on expens e (7) (5) (12) (3) (5) (8) Other non-opera ti ng i ncome (expens e), net 10 (2) 8 — 2 2 Acqui s i ti on rel a ted a nd res tructuri ng cos ts (7) — (7) (9) (6) (15) As s et Impa i rment (5) — (5) — — — Other s peci a l i tems (1) 1 — — 197 197 Impa ct of purcha s e a ccounti ng 5 — 5 (4) — (4) EBITDA 62 101 163 10 278 288 Amorti za ti on expens e of i nta ngi bl es (4) (6) (10) (3) (5) (8) Depreci a ti on expens e (20) (10) (30) (5) (9) (14) Les s : Net i ncome a ttri buta bl e to noncontrol l i ng i nteres t 1 — 1 1 — 1 Equi ty i n ea rni ngs from uncons ol i da ted enti ti es (3) — (3) (2) — (2) Ga i n on ba rga i n purcha s e — (2) (2) — (197) (197) Les s : Other non-opera ti ng i ncome (expens e), net (10) 2 (8) — (2) (2) Operating income 26 85 111 1 65 66 Interes t i ncome — 1 Interes t expens e (12) (12) Other non-opera ti ng i ncome, net 8 2 Equi ty i n ea rni ngs from uncons ol i da ted enti ti es 3 2 Ga i n on ba rga i n purcha s e 2 197 Income ta x provi s i on (39) (49) Net i ncome 73 207 Net i ncome a ttri buta bl e to noncontrol l i ng i nteres t (1) (1) Net income attributable to common stockholders $ 72 $ 206
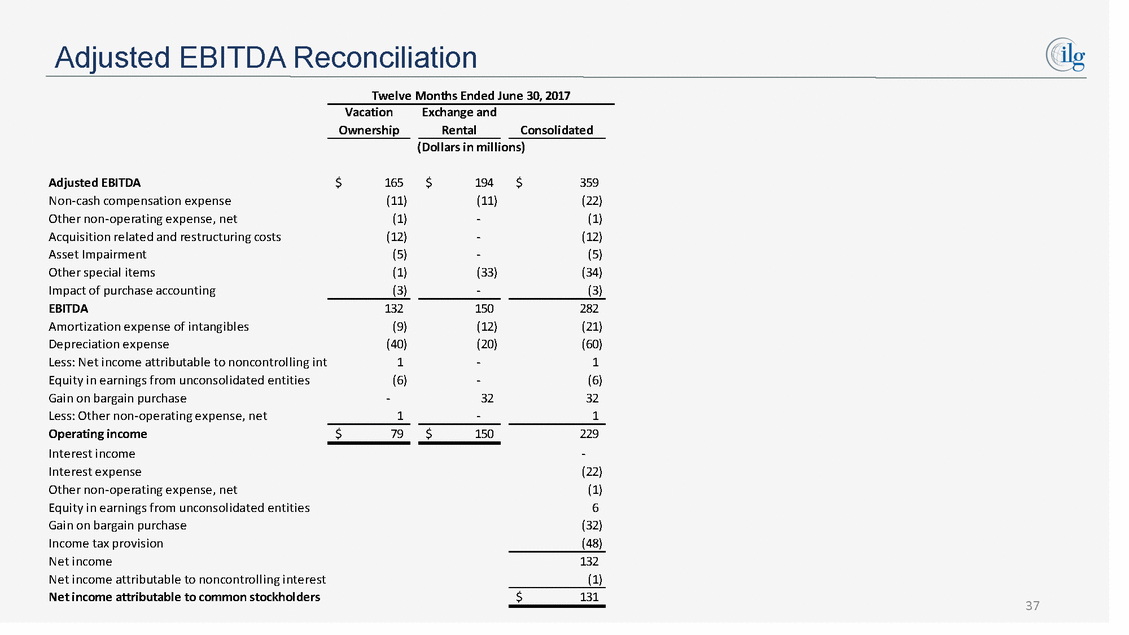
Adjusted EBITDA Reconciliation Twelve Months Ended June 30, 2017 VacationExchange and Ownership Rental Consolidated (Dollars in millions) Adjusted EBITDA Non-cash compensation expense Other non-operating expense, net Acquisition related and restructuring costs Asset Impairment Other special items Impact of purchase accounting EBITDA Amortization expense of intangibles Depreciation expense Less: Net income attributable to noncontrolling int Equity in earnings from unconsolidated entities Gain on bargain purchase Less: Other non-operating expense, net Operating income Interest income Interest expense Other non-operating expense, net Equity in earnings from unconsolidated entities Gain on bargain purchase Income tax provision Net income Net income attributable to noncontrolling interest Net income attributable to common stockholders $ 165 (11) (1) (12) (5) (1) (3) $ 194 (11) - - - (33) - $ 359 (22) (1) (12) (5) (34) (3) 132 (9) (40) 1 (6) - 1 150 (12) (20) - - 32 - 282 (21) (60) 1 (6) 32 1 $ 79 $ 150 229 - (22) (1) 6 (32) (48) 132 (1) $ 131 37
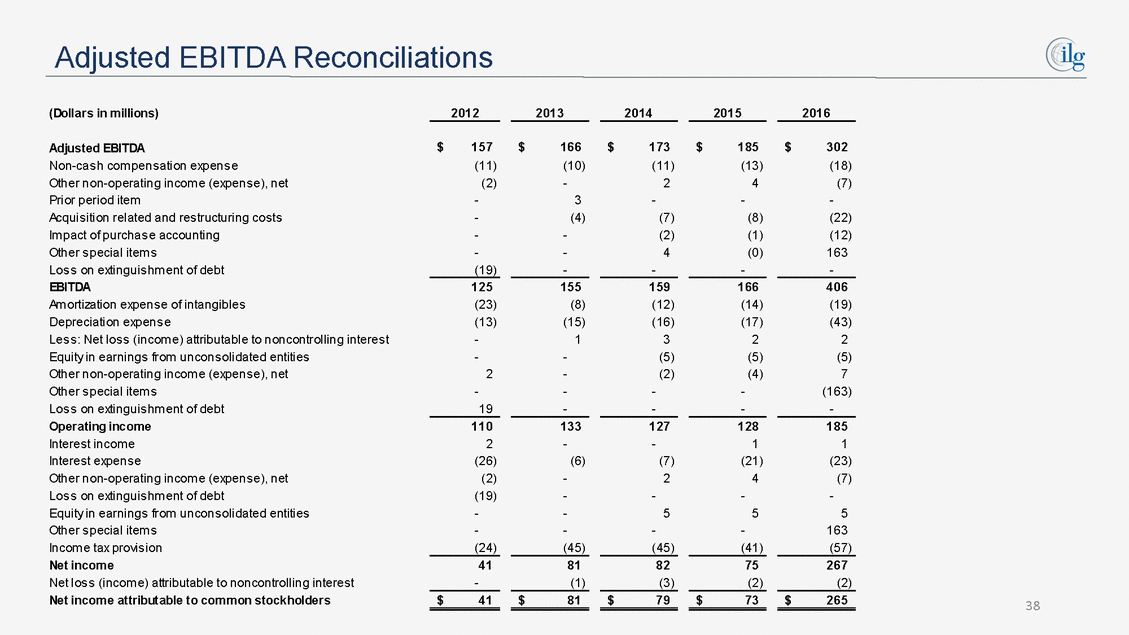
Adjusted EBITDA Reconciliations (Dollars in millions) 2012 2013 2014 2015 2016 $ 157 (11) (2) - - - - (19) $ 166 (10) - 3 (4) - - - $ 173 (11) 2 - (7) (2) 4 - $ 185 (13) 4 - (8) (1) (0) - $ 302 (18) (7) - (22) (12) 163 - Adjusted EBITDA Non-cas h com pens ation expens e Other non-operating incom e (expens e), net Prior period item Acquis ition related and res tructuring cos ts Im pact of purchas e accounting Other s pecial item s Los s on extinguis hm ent of debt EBITDA Am ortization expens e of intangibles Depreciation expens e Les s : Net los s (incom e) attributable to noncontrolling interes t Equity in earnings from uncons olidated entities Other non-operating incom e (expens e), net Other s pecial item s Los s on extinguis hm ent of debt Operating income Interes t incom e Interes t expens e Other non-operating incom e (expens e), net Los s on extinguis hm ent of debt Equity in earnings from uncons olidated entities Other s pecial item s Incom e tax provis ion Net income Net los s (incom e) attributable to noncontrolling interes t Net income attributable to common stockholders 125 (23) (13) - - 2 - 19 155 (8) (15) 1 - - - - 159 (12) (16) 3 (5) (2) - - 166 (14) (17) 2 (5) (4) - - 406 (19) (43) 2 (5) 7 (163) - 110 2 (26) (2) (19) - - (24) 133 - (6) - - - - (45) 127 - (7) 2 - 5 - (45) 128 1 (21) 4 - 5 - (41) 185 1 (23) (7) - 5 163 (57) 41 - 81 (1) 82 (3) 75 (2) 267 (2) $ 41 $ 81 $ 79 $ 73 $ 265 38
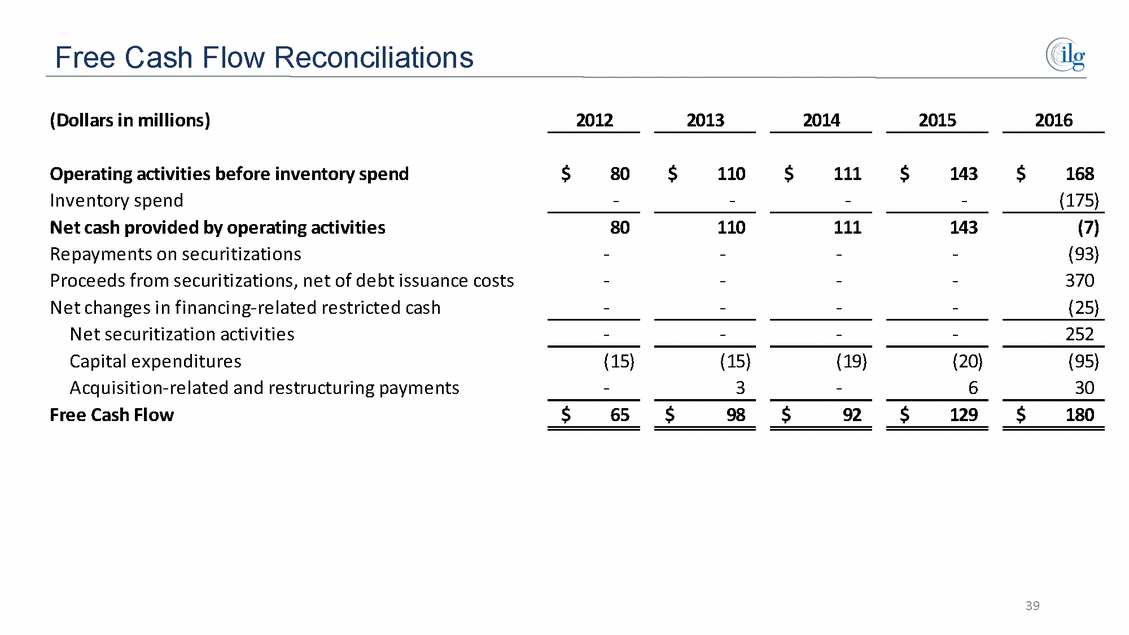
Free Cash Flow Reconciliations (Dollars in millions) 2012 2013 2014 2015 2016 Operating activities before inventory spend Inventory spend Net cash provided by operating activities Repayments on securitizations Proceeds from securitizations, net of debt issuance costs Net changes in financing-related restricted cash Net securitization activities Capital expenditures Acquisition-related and restructuring payments Free Cash Flow $ 80 $ 110 $ 111 $ 143 $ 168 - - - - (175) 80 110 - - - 111 - - - 143 - - - (7) (93) 370 (25) - - - - - - - 252 (15) - (15) 3 (19) - (20) 6 (95) 30 $ 65 $ 98 $ 92 $ 129 $ 180 39
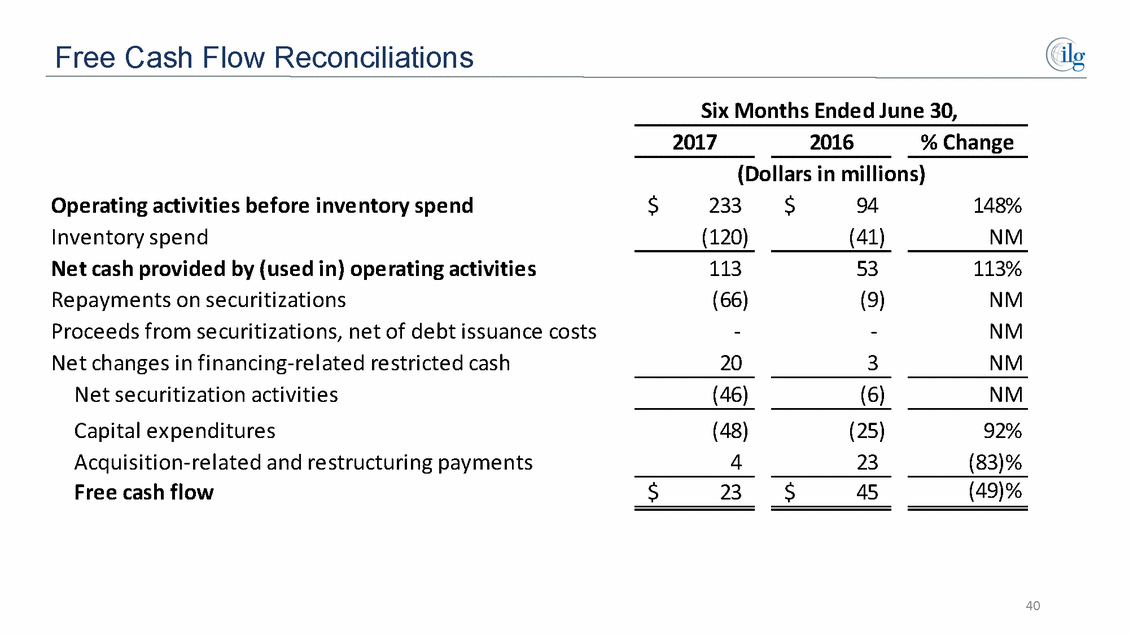
Free Cash Flow Reconciliations Six Months Ended June 30, 2017 2016 % Change (Dollars in millions) Operating activities before inventory spend Inventory spend Net cash provided by (used in) operating activities Repayments on securitizations Proceeds from securitizations, net of debt issuance costs Net changes in financing-related restricted cash Net securitization activities Capital expenditures Acquisition-related and restructuring payments Free cash flow $ 233 (120) $ 94 (41) 148% NM 113 (66) - 20 53 (9) - 3 113% NM NM NM (46) (6) NM (48) 4 (25) 23 92% (83)% (49)% $ 23 $ 45 40
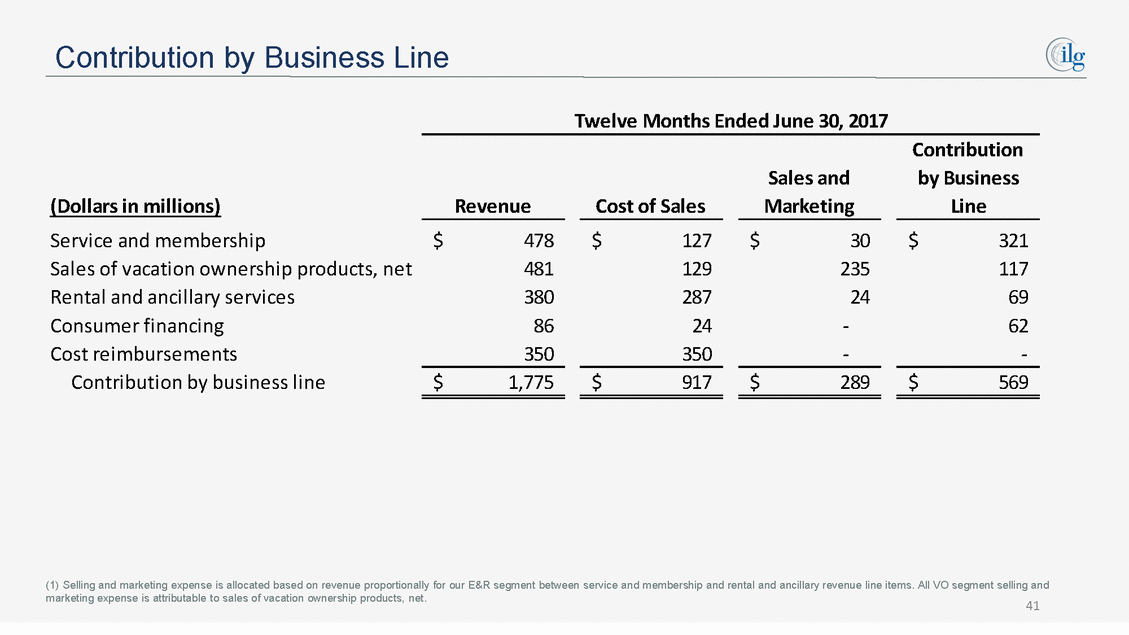
Contribution by Business Line Twelve Months Ended June 30, 2017 Contribution by Business Line Sales and Marketing (Dollars in millions) Revenue Cost of Sales Service and membership Sales of vacation ownership products, net Rental and ancillary services Consumer financing Cost reimbursements Contribution by business line $ 478 481 380 86 $ 127 129 287 24 $ 30 235 24 - $ 321 117 69 62 350 350 - - $ 1,775 $ 917 $ 289 $ 569 (1) Selling and marketing expense is allocated based on revenue proportionally for our E&R segment between service and membership and rental and ancillary revenue line items. All VO segment selling and marketing expense is attributable to sales of vacation ownership products, net. 41
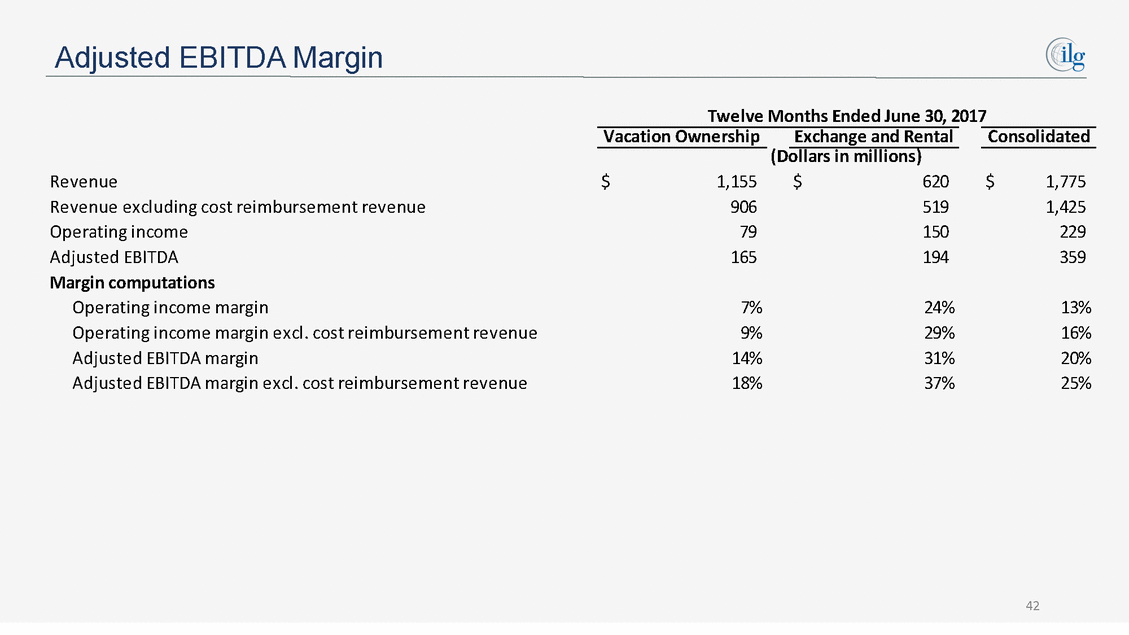
Adjusted EBITDA Margin Twelve Months Ended June 30, 2017 Vacation Ownership Exchange and Rental Consolidated (Dollars in millions) Revenue Revenue excluding cost reimbursement revenue Operating income Adjusted EBITDA Margin computations Operating income margin Operating income margin excl. cost reimbursement revenue Adjusted EBITDA margin Adjusted EBITDA margin excl. cost reimbursement revenue $ 1,155 906 79 165 $ 620 519 150 194 $ 1,775 1,425 229 359 7% 9% 14% 18% 24% 29% 31% 37% 13% 16% 20% 25% 42
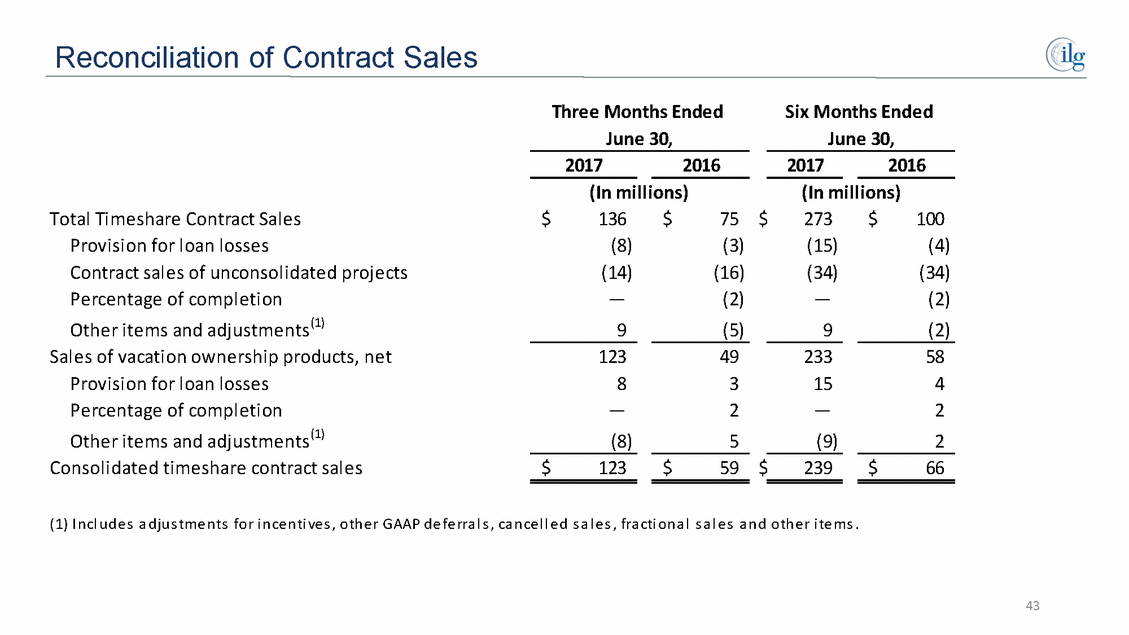
Reconciliation of Contract Sales Three Months Ended June 30, Six Months Ended June 30, 2017 2016 2017 2016 (In millions) (In millions) Total Timeshare Contract Sales Provision for loan losses Contract sales of unconsolidated projects Percentage of completion Other items and adjustments(1) Sales of vacation ownership products, net Provision for loan losses Percentage of completion Other items and adjustments(1) Consolidated timeshare contract sales $ 136 (8) (14) — 9 $ 75 (3) (16) (2) (5) $ 273 (15) (34) — 9 $ 100 (4) (34) (2) (2) 123 8 — (8) 49 3 2 5 233 15 — (9) 58 4 2 2 $ 123 $ 59 $ 239 $ 66 (1) I n cl u d e s a d ju s tme n ts for i n ce n ti ve s , othe r GAAP d e fe rra l s , ca n ce l l e d s a l e s , fra cti on a l s a l e s a n d othe r i te ms . 43
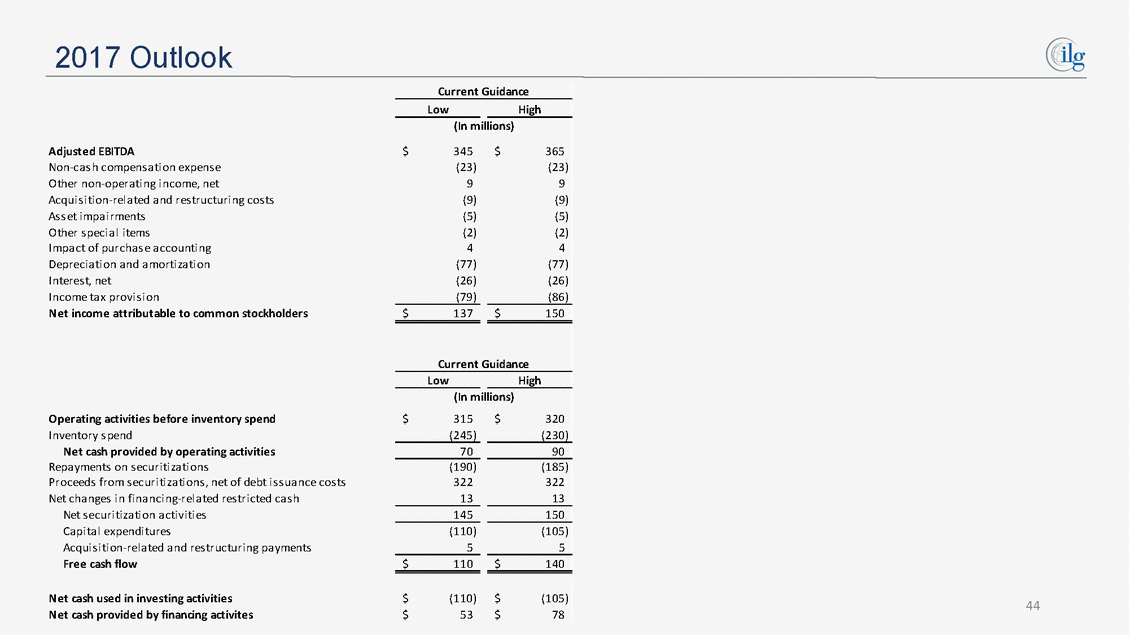
2017 Outlook Current Guidance Low High (In millions) Adjusted EBITDA Non-ca s h compens a ti on expens e Other non-opera ti ng i ncome, net Acqui s i ti on-rel a ted a nd res tructuri ng cos ts As s et i mpa i rments Other s peci a l i tems Impa ct of purcha s e a ccounti ng Depreci a ti on a nd a morti za ti on Interes t, net Income ta x provi s i on Net income attributable to common stockholders $ 345 (23) 9 (9) (5) (2) 4 (77) (26) $ 365 (23) 9 (9) (5) (2) 4 (77) (26) (86) (79) $ 137 $ 150 Current Guidance Low High (In millions) Operating activities before inventory spend Inventory s pend Net cash provided by operating activities Repa yments on s ecuri ti za ti ons Proceeds from s ecuri ti za ti ons , net of debt i s s ua nce cos ts Net cha nges i n fi na nci ng-rel a ted res tri cted ca s h Net s ecuri ti za ti on a cti vi ti es Ca pi ta l expendi tures Acqui s i ti on-rel a ted a nd res tructuri ng pa yments Free cash flow $ 315 $ 320 (230) (245) 70 90 (190) 322 13 (185) 322 13 145 150 (110) 5 (105) 5 $ 110 $ 140 Net cash used in investing activities Net cash provided by financing activites $ $ (110) 53 $ $ (105) 78 44
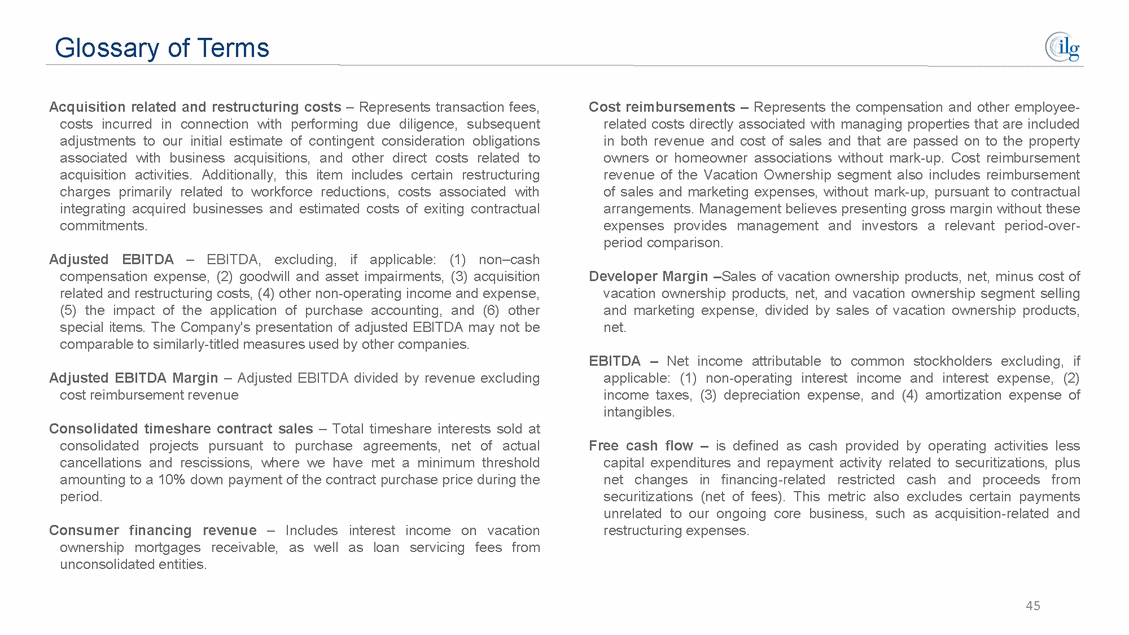
Glossary of Terms Acquisition related and restructuring costs – Represents transaction fees, costs incurred in connection with performing due diligence, subsequent adjustments to our initial estimate of contingent consideration obligations associated with business acquisitions, and other direct costs related to acquisition activities. Additionally, this item includes certain restructuring charges primarily related to workforce reductions, costs associated with integrating acquired businesses and estimated costs of exiting contractual commitments. Cost reimbursements – Represents the compensation and other employee-related costs directly associated with managing properties that are included in both revenue and cost of sales and that are passed on to the property owners or homeowner associations without mark-up. Cost reimbursement revenue of the Vacation Ownership segment also includes reimbursement of sales and marketing expenses, without mark-up, pursuant to contractual arrangements. Management believes presenting gross margin without these expenses provides management and investors a relevant period-over-period comparison. Adjusted EBITDA – EBITDA, excluding, if applicable: (1) non–cash compensation expense, (2) goodwill and asset impairments, (3) acquisition related and restructuring costs, (4) other non-operating income and expense, (5) the impact of the application of purchase accounting, and (6) other special items. The Company's presentation of adjusted EBITDA may not be comparable to similarly-titled measures used by other companies. Developer Margin –Sales of vacation ownership products, net, minus cost of vacation ownership products, net, and vacation ownership segment selling and marketing expense, divided by sales of vacation ownership products, net. EBITDA – Net income attributable to common stockholders excluding, if applicable: (1) non-operating interest income and interest expense, (2) income taxes, (3) depreciation expense, and (4) amortization expense of intangibles. Adjusted EBITDA Margin – Adjusted EBITDA divided by revenue excluding cost reimbursement revenue Consolidated timeshare contract sales – Total timeshare interests sold at consolidated projects pursuant to purchase agreements, net of actual cancellations and rescissions, where we have met a minimum threshold amounting to a 10% down payment of the contract purchase price during the period. Free cash flow – is defined as cash provided by operating activities less capital expenditures and repayment activity related to securitizations, plus net changes in financing-related restricted cash and proceeds from securitizations (net of fees). This metric also excludes certain payments unrelated to our ongoing core business, such as acquisition-related and restructuring expenses. Consumer financing revenue – Includes interest income on vacation ownership mortgages receivable, as well as loan servicing fees from unconsolidated entities. 45
Glossary of Terms (continued) Impact of the application of purchase accounting – represents the difference between amounts derived from the fair value remeasurement of assets and liabilities acquired in a business combination versus the historical basis. We believe generally this is most meaningful through the first year subsequent to an acquisition. Resort operations revenue – Pertains to our revenue generating activities from rentals of owned vacation ownership inventory (exclusive of lead– generation) along with ancillary resort services, in addition to rental and ancillary revenue generated by owned hotels. Return on Invested Capital (“ROIC”) – Adjusted EBITDA, less depreciation and amortization, divided by average net assets less cash in excess of $50M, non-interest bearing current liabilities, and goodwill. Both numerator and denominator exclude the impact of securitizations. Management fee revenue – Represents vacation ownership property management revenue earned by our Vacation Ownership segment exclusive of cost reimbursements. Membership fee revenue – Represents fees paid for membership in the Interval Network, Vistana Signature Network and Hyatt Residence Club. Sales of vacation ownership products, net – Includes sales of vacation ownership products, net, for HVO and Vistana. Net leverage – Long term debt (excluding issuance costs) minus cash and cash equivalents divided by Adjusted EBITDA. Service and membership revenue – Revenue associated with providing services including membership-related activities and exchange transactions, as well vacation ownership and vacation rental management businesses. Other special items – consist of other items that we believe are not related to our core business operations. For the three and six months ended June 30, 2016 and 2017, such items include the gain on bargain purchase price recognized as part of the Vistana acquisition and costs related to non-ordinary course litigation matters described in the notes to our financial statements. Tour flow – Represents the number of sales presentations given at sales centers (other than at unconsolidated properties) during the period. Transaction revenue – Interval Network, Vistana Signature Network and Hyatt Residence Club transactional and service fees paid primarily for exchanges, Getaways, reservation servicing and related transactions. Rental and ancillary services revenue – Includes our rental activities such as Getaways, club rentals and owned hotel revenues, as well as associated resort ancillary revenues. Volume per guest – Consolidated timeshare contract sales divided by tour flow during the period. Rental management revenue – Represents rental management revenue earned by our vacation rental businesses within our Exchange and Rental segment, exclusive of cost reimbursement revenue. 46
