Attached files
| file | filename |
|---|---|
| EX-4.4 - EX-4.4 - ILG, LLC | a2202488zex-4_4.htm |
| EX-31.3 - EX-31.3 - ILG, LLC | a2202488zex-31_3.htm |
| EX-32.1 - EX-32.1 - ILG, LLC | a2202488zex-32_1.htm |
| EX-32.3 - EX-32.3 - ILG, LLC | a2202488zex-32_3.htm |
| EX-31.2 - EX-31.2 - ILG, LLC | a2202488zex-31_2.htm |
| EX-31.1 - EX-31.1 - ILG, LLC | a2202488zex-31_1.htm |
| EX-23.1 - EX-23.1 - ILG, LLC | a2202488zex-23_1.htm |
| EX-21.1 - EX-21.1 - ILG, LLC | a2202488zex-21_1.htm |
| EX-32.2 - EX-32.2 - ILG, LLC | a2202488zex-32_2.htm |
Use these links to rapidly review the document
TABLE OF CONTENTS
UNITED STATES
SECURITIES AND EXCHANGE COMMISSION
WASHINGTON, D.C. 20549
FORM 10-K
| (Mark One) | ||
| ý | ANNUAL REPORT PURSUANT TO SECTION 13 OR 15(d) OF THE SECURITIES EXCHANGE ACT OF 1934 | |
For the fiscal year ended December 31, 2010 |
||
OR |
||
o |
TRANSITION REPORT PURSUANT TO SECTION 13 OR 15(d) OF THE SECURITIES EXCHANGE ACT OF 1934 |
|
For the transition period from to |
||
Commission file number: 001-34062
INTERVAL LEISURE GROUP, INC.
(Exact name of registrant as specified in its charter)
| Delaware (State or other jurisdiction of incorporation or organization) |
26-2590997 (I.R.S. Employer Identification No.) |
|
6262 Sunset Drive, Miami, Florida (Address of principal executive offices) |
33143 (Zip Code) |
(305) 666-1861
(Registrant's telephone number, including area code)
Securities registered pursuant to Section 12(b) of the Act:
| Title of each class | Name of each exchange on which registered | |
|---|---|---|
| Common Stock, $0.01 par value per share | The NASDAQ Stock Market |
Securities registered pursuant to Section 12(g) of the Act: None
Indicate by check mark if the registrant is a well-known seasoned issuer, as defined in Rule 405 of the Securities Act. Yes o No ý
Indicate by check mark if the registrant is not required to file reports pursuant to Section 13 or Section 15(d) of the Exchange Act. Yes o No ý
Indicate by check mark whether the registrant (1) has filed all reports required to be filed by Section 13 or 15(d) of the Securities Exchange Act of 1934 during the preceding 12 months (or for such shorter period that the registrant was required to file such reports), and (2) has been subject to such filing requirements for the past 90 days. Yes ý No o
Indicate by check mark whether the registrant has submitted electronically and posted on its corporate Web site, if any, every Interactive Data File required to be submitted and posted pursuant to Rule 405 of Regulation S-T (§232.405 of this chapter) during the preceding 12 months (or for such shorter period that the registrant was required to submit and post such files). Yes o No o
Indicate by check mark if disclosure of delinquent filers pursuant to Item 405 of Regulation S-K is not contained herein, and will not be contained, to the best of registrant's knowledge, in definitive proxy or information statements incorporated by reference in Part III of this Form 10-K or any amendment to this Form 10-K. ý
Indicate by check mark whether the registrant is a large accelerated filer, an accelerated filer, a non-accelerated filer, or a smaller reporting company. See the definitions of "large accelerated filer," "accelerated filer" and "smaller reporting company" in Rule 12b-2 of the Exchange Act. (Check one):
| Large accelerated filer o | Accelerated filer ý | Non-accelerated filer o (Do not check if a smaller reporting company) |
Smaller reporting company o |
Indicate by check mark whether the registrant is a shell company (as defined in Rule 12b-2 of the Exchange Act). Yes o No ý
As of June 30, 2010, the aggregate market value of the registrant's common stock held by non-affiliates of the registrant was $497,065,291. As of March 7, 2011, there were 57,278,498 shares outstanding of the issuer's common stock.
DOCUMENTS INCORPORATED BY REFERENCE
Portions of the Registrant's proxy statement for its 2011 Annual Meeting of Stockholders are incorporated by reference into Part III herein.
i
Overview
Interval Leisure Group, Inc., or ILG, is a leading global provider of membership and leisure services to the vacation industry. ILG operates two business segments, Membership and Exchange, previously called the Interval segment, and Management and Rental, previously called the Aston segment. During the fourth quarter of 2010, we changed the names of our operating segments to better describe the underlying business operations. The historical segment financial information and operating activity did not change. Membership and Exchange, ILG's principal business segment, offers travel and leisure related products and services to owners of vacation interests and others mostly through various membership programs, as well as related services to resort developer clients. As of December 31, 2010, approximately 2,600 resorts located in more than 75 countries participated in Interval's primary exchange network, the Interval Network. At that date, the Membership and Exchange segment had approximately two million members enrolled in its various membership programs including approximately 1.8 million in the Interval Network. The Membership and Exchange segment represented approximately 84% of ILG's consolidated revenue for the fiscal year ended December 31, 2010 and approximately 85% of ILG's consolidated revenue for the fiscal year ended December 31, 2009.
Management and Rental, our other business segment, provides hotel, condominium resort, timeshare resort and homeowners association management, and vacation rental services to both vacationers and vacation property owners. As of December 31, 2010, the Management and Rental segment provided hotel and resort management services to over 45 resorts and hotels, as well as other more limited management services to certain additional properties. The Management and Rental segment represented approximately 16% of ILG's consolidated revenue for the fiscal year ended December 31, 2010 and approximately 15% of ILG's consolidated revenue for the fiscal year ended December 31, 2009. For information regarding the results of operations of ILG and its segments on a historical basis, see Note 11 to the Consolidated Financial Statements of ILG and the disclosure set forth under the caption "Management's Discussion and Analysis of Financial Condition and Results of Operations."
History
ILG was incorporated as a Delaware corporation in May 2008 in connection with a plan by IAC/InterActiveCorp, or IAC, to separate into five publicly traded companies, referred to as the "spin-off." ILG was formed to hold the membership and exchange and management and rental businesses and commenced trading on The NASDAQ Stock Market in August 2008 under the symbol "IILG."
The businesses operated by ILG's subsidiaries have extensive operating histories. ILG's Interval International vacation ownership exchange business was founded in 1976, its Aston Hotels & Resorts management and rental business traces its roots in lodging back over 60 years, and its Trading Places International subsidiary was founded in 1973.
Except as otherwise indicated or unless the context otherwise requires, in this report "ILG," "we," "our" or "us" refers to Interval Leisure Group, Inc. together with its subsidiaries.
Industry Overview and Trends
The hospitality industry is a major component of the travel industry, which is affected by the performance of the global economy. Travel expenditures are sensitive to business and personal discretionary spending levels and tend to decline during general economic downturns. Various factors, including decreased disposable income, increased costs of transportation and the overall financial
1
instability of the airline industry, adversely impact consumers' decisions to use and consume travel services. During 2010, the hospitality industry as a whole began to recover from the lows experienced during 2009.
Vacation ownership is the segment of the hospitality industry that encompasses the development, operation and sale of vacation interests in traditional timeshare regimes, fractional products, private residence clubs, condo hotels and other forms of shared ownership, and vacation home ownership. Vacation ownership sales (excluding sales of fractional, private residence club, destination club and whole ownership products) in the U.S. for 2009, the last year for which data is available, were approximately $6.3 billion, as compared to $9.7 billion in 2008, reflecting the economic downturn that began affecting the industry during the second half of 2008. We believe that 2010 U.S. sales will be in a similar range as 2009. U.S. sales of fractional products, private residences and destination club products were approximately $860 million in 2009, the last year for which data is available, as compared to $1.5 billion in 2008. Although sales declined from 2008 through 2010 due to the economic conditions, leisure travelers continue to use their vacation ownership interests as demonstrated by significantly higher average occupancy rates at U.S. timeshare resorts than at U.S. hotels.
Most U.S.-based developers of vacation ownership resorts rely on receivables financing to fund sales and marketing efforts. Beginning at the end of the third quarter of 2008, developers were unable to obtain either receivables financing or commitments for future receivables financings. As a result, many resort developers greatly reduced their sales and marketing expenditures and as a consequence reduced sales of new vacation ownership interests. The tightening of credit available to both vacation property developers and purchasers also resulted in the development of fewer vacation ownership and vacation rental resorts (and in the case of existing vacation ownership and vacation rental resorts, fewer potential purchasers). These factors may continue to have a material adverse effect on the vacation ownership and vacation rental industries. During 2010, access to the credit markets returned for securitization transactions available to certain large developers and activity by regional banks working with independent developers has increased slightly. Financing standards for consumers remain higher than those required several years ago and developers are continuing to modify their business models to reduce reliance on receivables financing. As developers with greater debt obligations continue to work with their lenders, we anticipate additional bankruptcies, reorganizations and consolidation within the industry.
Membership and Exchange Services
The membership and exchange services industry provides owners of vacation interests with flexibility and choice by providing them access to alternative accommodations through exchange networks encompassing a wide variety of resorts. There are two principal providers of vacation ownership membership and exchange services in the global vacation membership services industry, Interval International, an ILG subsidiary, and RCI, LLC, a subsidiary of Wyndham Worldwide Corp. Trading Places International, which ILG acquired in November 2010, and several third parties also operate in this industry with a significantly more limited scope of available accommodations. In addition, many vacation ownership resort developers and managers provide exchange services to owners within their related resorts.
Future growth in the membership and exchange services industry will be driven primarily by the number of vacation interests sold to new purchasers (including those who acquire vacation interests in the secondary market) and by increasing services provided directly to existing owners of vacation interests. At the end of 2009, 7.2 million weekly equivalent intervals were owned at U.S. timeshare resorts. Because of the difficulties obtaining receivables financing, as discussed above, reduced sales and marketing expenditures by resort developers have led to fewer new sales of vacation ownership interests and fewer new members over the past couple of years. Cutbacks in development of new resorts by
2
resort developers may reduce sales and potential new members in the longer term. Growth is expected to be driven by:
- •
- increased consumer awareness and acceptance of the value and benefits of the ownership of vacation interests;
- •
- adoption of constructive legislation and regulations internationally that improve consumer protection and allow businesses
to operate profitably;
- •
- the entry of additional developers into the vacation ownership industry, which will increase the number of vacation
interests available for sale;
- •
- development and offering of alternative vacation ownership products, such as shorter-term products;
- •
- demand for vacation ownership products in the U.S. and elsewhere; and
- •
- development of new resorts and conversion of existing properties to vacation ownership.
Management and Rental Services
The vacation rental market in the United States consists of vacation homes, condominiums, villas, condo hotels, timeshare units and fractional units. This fragmented market includes both managed properties and those offered by owners. In general, the managed properties are better able to engage in market-based pricing and offer hotel-like services. Vacation rental accommodations generally offer value to travelers seeking more than a nightly stay by providing greater space and convenience than traditional hotel rooms and offering separate living, sleeping and eating quarters. Management and rental companies facilitate the rental process by handling most, if not all, aspects of interaction with vacationers. Improved product awareness and consumer convenience through direct and indirect online distribution channels are expected to drive long-term growth in this market. Management and rental companies also manage the homeowners associations that are responsible for operation, maintenance and improvements to condominium and shared ownership resorts.
Currently, ILG offers management and rental services for condominium, hotel and timeshare properties and their homeowner associations in the United States and Mexico. A majority of our managed resorts are located in Hawaii, which during 2010 began to recover from the global economic crisis that began in late 2008. According to the Hawaii Tourism Authority, the number of visitors who traveled to Hawaii by air grew approximately 8.8% from approximately 6.5 million in 2009 to approximately 7.0 million in 2010.
DESCRIPTION OF BUSINESS SEGMENTS
Membership and Exchange
Membership and Exchange Programs. We offer travel and leisure related products and services to owners of vacation interests and others mostly through various membership programs.
Exchange Networks. These programs provide participants with the right to exchange their occupancy rights in their vacation interest (typically, for periods of one week) for comparable, alternative accommodations at another resort or at the same resort during a different occupancy period.
- •
- Interval Network. The Interval Network is a membership-based exchange program which also provides a comprehensive package of value-added products and services. Generally, individuals are enrolled by resort developers in connection with their purchase of vacation interests from such resort developers, with initial membership fees being paid on behalf of members by the
3
resort developers. Members may also enroll directly, for instance, when they purchase a vacation interest through resale at a resort that participates in the Interval Network. The resorts participating in Interval's exchange networks primarily include resorts with which Interval has an effective affiliation agreement in place, as well as resorts at which Interval continues to provide exchange services following the affiliation agreement's term.
- •
- Trading Places International. This network provides
exchange services to owners at timeshare properties managed by Trading Places International as well as other direct-to-consumer exchanges that do not require a membership.
Vacation owners may deposit and exchange through the website or call center. In addition, they may choose to become members to be eligible for discounts.
- •
- Preferred Residences Program. This hospitality-branded membership program for luxury shared ownership resorts and condo hotels is renewed annually throughout the period of each resort's participation in the Preferred Residences exchange network. Members have access to additional travel-related benefits including special rates at Preferred Hotel Group properties.
Following their period of initial enrollment, Interval Network members generally have the option of renewing their memberships for terms ranging from one to five years and paying their own membership fees directly to us. Alternatively, some resort developers incorporate the Interval Network membership fee into certain annual fees they charge to owners of vacation interests at their resorts after the initial enrollment period, which results in these owners having their membership in the Interval Network and, where applicable, the Interval Gold program (as described below), automatically renewed through the period of their resort's participation in the Interval Network.
How Exchange Works. We provide members and participants of our exchange networks with two primary methods of exchange, "Deposit First" and for the Interval Network and Preferred Residences Program, "Request First." With Deposit First, participants immediately transfer the use and occupancy of vacation interests at their home resort in return for the right to request an exchange. Under this method, members are not required to select a location or travel date at the time of deposit, but can request an exchange at any time during the period of the deposit's availability for exchange. All deposits expire two years after the occupancy date of the week deposited, unless extended by members through the purchase of a deposit extension. With Request First, members of the Interval Network and Preferred Residences Program may request an exchange prior to relinquishing the occupancy right in their vacation interest to the applicable exchange network. Using this method, the use and occupancy of the vacation interest is relinquished when a confirmation occurs. This method requires the participant to be confirmed to an exchange and travel prior to the occupancy period of the vacation interest relinquished.
All vacation ownership accommodations relinquished to the Interval Network or the Preferred Residences Program exchange programs are assigned a trading value at the time of deposit (under the Deposit First method) or at the time of request (under the Request First method) based on multiple factors, including location, quality, seasonality, unit attributes and time of relinquishment prior to occupancy to determine the relinquished accommodations' relative exchange value to the exchange network. Members are offered an exchange to accommodations which are generally of comparable value to those relinquished. Exchanges in the Trading Places International network are based on like value and upgrades are available upon payment of additional fees.
Some members also are able to exchange the use and occupancy of their vacation interests on the Interval Network and the Preferred Residences Program on a points basis. In these circumstances, points are relinquished to the applicable exchange network by the member and the exchange network receives accommodations from the operator of the points program on behalf of the member.
4
Participants in the Trading Places International network must first reserve a week with the points program before depositing it for exchange.
Related Products and Services.
- •
- Getaways. We also offer additional vacation rental
opportunities to members of the Interval Network, Preferred Residences Program and certain other membership programs at attractive rates through Getaways. Getaways allow members to rent resort
accommodations for a fee, plus applicable taxes. Resort accommodations available as Getaways consist of seasonal oversupply of vacation ownership accommodations within the applicable exchange network,
as well as resort accommodations we source specifically for use in Getaways.
- •
- Interval Gold. We also offer Interval Gold, an enhanced membership program, to Interval Network members to provide them with year-round access to value-added benefits and services for an additional annual fee. These benefits and services vary by country of residence, but generally consist of discounts on Getaways, a concierge service, a hotel discount program and Interval Options, a service that allows members to relinquish annual occupancy rights in their vacation interests towards the purchase of various travel products, including cruise, golf and spa vacations. Interval Gold members may also access the ShortStay program which allows weeks-based members to trade a week for two shorter stays of two to six nights and allows points-based members to make as many ShortStay exchanges as their available points allow. Members are enrolled in the Interval Gold program either by resort developers in connection with the initial purchase of their vacation interests or by upgrading their membership directly. Renewal procedures and responsibility for fees are generally the same as those for basic membership in the Interval Network. In March 2011, we launched Interval Platinum, our premier membership level. It targets discerning travelers and offers them high-value benefits and services in addition to those included in the Interval Gold membership.
Other Membership Programs
- •
- Leisure Time Passport. In addition, we operate a
membership program, Leisure Time Passport, which provides participants with many of the benefits of the Interval Gold program, as well as the opportunity to experience vacationing in condominium-style
accommodations.
- •
- Private-label Membership Programs. We also provide travel and leisure membership programs on a private-label basis.
Relationships with Developers
Resort Affiliations. The Interval Network has established multi-year relationships with numerous resort developers, including leading independent and brand name developers, under exclusive affiliation agreements. Pursuant to these agreements, resort developers are obligated to enroll all purchasers of vacation interests at their resorts in the applicable exchange membership program and, in some circumstances, are obligated to renew these memberships for the term of their affiliation agreement. We do not consider our overall business to be dependent on any one of these resort developers, provided, that the loss of a few large developers (particularly those from which Interval receives membership renewal fees directly) could materially impact our business.
Products and Services. A primary basis on which resort developers choose us as a partner is the comprehensive array of products and services that we offer to resort developers, such as sales and marketing support and operational support, including custom vacation program design services.
- •
- Sales and Marketing Support. We offer our developers a selection of sales and marketing materials. These materials, many of which are available in multiple languages, include brochures, publications, sales-office displays, videos and resort directories. Resort developers also promote
5
membership in our exchange programs and related value-added services as an important benefit of owning a vacation interest. In addition, we offer programs, including our Leisure Time Passport program, that resort developers use as an exit or trial membership program for potential purchasers of vacation interests.
- •
- Operational Support. We also make available a comprehensive array of back-office servicing solutions to resort developers and resorts. For example, for an additional fee, we provide reservation services and billing and collection of maintenance fees and other amounts due to developers or homeowner's associations.
The Interval Network's resort recognition program recognizes eligible Interval Network resorts as either a "Select Resort" or a "Premier Resort," based upon the satisfaction of qualifying criteria. In 2010, we launched a new category within the highest recognition tier, "Premier Boutique Resort." Approximately 39% of Interval Network resorts available for exchange were recognized as either a Select or Premier Resort for 2010. Resorts achieved the rating based on the quality rating we assigned the resort following an inspection at the time of affiliation and by member feedback following vacations at the resort as well as participation in our prior recognition programs and other resort-specific factors. As of December 31, 2010, nearly one-third of the recognized resorts had been inspected since program inspections began. Recognized resorts are then subject to periodic inspection and customer evaluations and must comply with the program's service and quality criteria to retain their status.
In addition, through consulting arrangements, we assist resort developers in the design of vacation programs for owners of vacation interests. Such programs, which may include a wide range of flexible-use plans, as well as point-based programs and vacation clubs, are tailored to the specific needs of the relevant developer and/or resort. We undertake a comprehensive analysis of the existing operations and intended growth plan of the relevant developer or resort, and then work closely with the developer or resort to design and implement a tailored program.
Revenue
Our Membership and Exchange segment earns most of its revenue from (1) fees paid for membership in the Interval Network and (2) transactional and service fees paid for Interval Network exchanges, Getaways, reservation servicing and related transactions, collectively referred to as "transaction revenue." Revenue is also derived from fees for ancillary products and services provided to members, fees from other membership and exchange programs and other products and services sold to developers.
Management and Rental
We also provide management and rental services to hotels as well as condominium and timeshare resorts and their homeowners associations through Aston Hotels & Resorts, Trading Places International and Maui Condo and Home. Aston Hotels and Resorts is based in Hawaii and concentrates on condominium and hotel management primarily in Hawaii, as well as vacation property rental and related services (including common area and owner association management services for condominium projects). During the fourth quarter of 2010, we acquired Trading Places International which provides property management, vacation rental and homeowners association management services to timeshare resorts in the United States and Mexico. Maui Condo and Home provides more limited management and rental services to owners of vacation properties in Maui, Hawaii.
6
Management Services
We provide hotel and resort management services for owners of condominium hotels, timeshare resorts and traditional hotels. Condominium resorts and timeshare resorts generally offer the same type of services offered by hotels and resorts, plus certain comforts of home, such as kitchens or kitchenettes, separate seating or living room areas and in suite, private bedrooms, with actual services and features varying by property. Generally, property and homeowners association management services are provided pursuant to exclusive agreements with terms typically ranging from one to five years, many of which are automatically renewable. With respect to timeshare resorts, we provide these services to resorts that are under the control of an owners association and not the developer. The loss of one or more of our largest management agreements could materially impact our Management and Rental business.
Rental Services
We also provide vacation property rental services for condominium owners, timeshare owners and homeowners associations. The condominium rental properties are generally investment properties, and, to a lesser extent, second homes, owned by individuals who contract with Aston Hotels & Resorts or Maui Condo and Home directly to manage, market and rent their properties, generally pursuant to short-term agreements. They also offer such owners a comprehensive package of marketing, management and rental services designed to enhance rental income and profitability. Trading Places International offers vacation rental services to individual timeshare owners and homeowners associations.
Distribution
We secure guests for both managed hotels and vacation rentals primarily through long-standing relationships with travel partners, including wholesalers, retail travel agents and online travel intermediaries. We also conduct online marketing initiatives to reach consumers directly through our websites, www.astonhotels.com, www.ResortQuestHawaii.com, www.tradingplaces.com and www.mauicondo.com. As an additional distribution channel, Aston also rents units to Interval for use as Getaways.
Revenue
Management and Rental segment revenue is derived principally from fees for hotel, condominium resort, timeshare resort and homeowners association management and rental services. Management fees consist of a base management fee and, in some instances for hotels or condominium resorts, an incentive management fee which is generally a percentage of operating profits or improvement in operating profits. Service fee revenue is based on the services provided to owners including reservations, sales and marketing, property accounting and information technology services either internally or through third party providers. A majority of the hotel and condominium resort management agreements provide that owners receive either specified percentages of the revenue generated under our management or guaranteed dollar amounts. In these cases, the operating expenses for the rental operation are paid from the revenue generated by the rentals, the owners are then paid their contractual percentages or guaranteed amounts, and we either retain the balance (if any) as our management fee or make up the deficit.
7
Business Strategy
To grow our business and expand our presence within the vacation industry, we are pursuing the following strategic initiatives:
- •
- leveraging our strategic developer relationships to provide additional services;
- •
- increasing non-vacation exchange related revenue;
- •
- expanding our product and service offerings;
- •
- supporting continued growth of online transactions;
- •
- continuing to expand internationally; and
- •
- pursuing strategic acquisitions and joint ventures opportunistically.
Marketing and Technology
Membership and Exchange
Membership and Exchange maintains corporate and consumer marketing departments, both of which are based in ILG's global headquarters in Miami, Florida as well as a managed owner and consumer marketing department in Laguna Niguel, California. International marketing expertise is provided primarily by London-based employees, with input and local expertise being provided by employees in local and regional offices worldwide. These departments are responsible for implementing our overall marketing strategy and developing the materials that are necessary to secure new relationships with resort developers and resorts and obtain new members and participants, as well as promote membership renewals, exchange opportunities and other value-added services to existing members.
We market our products and services to resort developers and other parties in the vacation ownership industry through a series of business development initiatives. For over ten years, we have organized and co-sponsored a proprietary, multi-day informational seminar, known as the Shared Ownership Investment Conference, previously the Vacation Ownership Investment Conference, where real estate developers, hospitality companies and others contemplating entry into the vacation ownership industry can meet and network with industry leaders, as well as participate in educational panels on various vacation ownership issues, such as property and program planning, financing and regulatory requirements. This seminar is offered annually in the U.S. with additional conferences held periodically at locations in regions that Interval views as potential market opportunities for vacation ownership development. In 2010, we held one-day conferences throughout South Africa. Through these programs, we work to strengthen and expand the vacation ownership industry through the education and support of viable new entrants. We have also maintained leadership roles in various industry trade organizations throughout the world since their inception, through which we have been a driving force in the promotion of constructive legislation, both in the U.S. and abroad, principally aimed at creating or enhancing consumer protection in the vacation ownership industry. In addition we operate a business to business website, www.resortdeveloper.com, for developers, industry partners and those interested in learning more about the shared ownership industry and our services.
Given that our growth is dependent, in significant part, on our ability to secure vacation ownership accommodations and attract new members and participants to our exchange programs, our corporate marketing department targets its efforts directly at resort developers and indirectly at prospective owners of vacation ownership interests. In doing so, we not only promote the benefits of our networks and value-added services, but also market ourselves to resort developers as a provider of operational and sales and marketing support services. Our sales and services personnel proactively seek to establish strong relationships with developers during the early stages of the development of a particular resort by
8
providing input on consumer preferences based upon years of experience. In addition, given our long-standing relationships with others within the vacation ownership industry, we are often able to refer resort developers to quality providers of a wide range of planning and operational resources. We believe that we have established a strong reputation within the vacation ownership industry as being highly responsive to the needs of resort developers and owners of vacation interests.
Our consumer marketing efforts revolve around the deepening of new and existing customer relationships globally, focusing on the strategic design of consumer marketing and product development initiatives across the customer lifecycle. The design, development and execution of programs, promotions, online and offline communications, cross-sell initiatives, new technology tools and overall enhancements to both membership and product value propositions are all aimed at increasing acquisition, usage, loyalty, retention and overall engagement of members and non-members. The online channel remains a strategic focus of growth with new technology for our online booking tools and communications created to increase the overall user experience, member service and engagement. In 2010, we focused on expanding social networking and mobile access. We introduced Interval Community, a platform for Interval Network members to share their experiences and communicate with each other about vacation ownership, travel, and ways to utilize and maximize their membership. Also in 2010, we launched apps for iPhone and Blackberry mobile devices to access the Interval Network resort directory. An iPad app became available in early 2011.
Our success also depends, in part, on our ability to provide prompt, accurate and complete service to our members through voice and data networks and proprietary and third party information systems. The technology platform for the Interval Network is a proprietary, custom developed enterprise application and database that manages all aspects of membership, exchange and Getaway transaction processing and inventory management. During the fourth quarter of 2010, we launched a new proprietary membership platform and web-based call center application using a service oriented architecture which is designed to provide us with increased flexibility for future enhancements and more user-friendly interfaces to improve member services efficiency. We also use advanced telecommunications systems and technologies to promptly respond and efficiently route member calls. In addition, we operate consumer websites for our members and participants, such as www.IntervalWorld.com, www.tradingplaces.com and www.PreferredResidences.com.
Management and Rental
Important to the success and continued growth of the Management and Rental business is our ability to source vacationers interested in booking vacation properties made available through our management and rental services. We also market to tour operators and other travel distribution channels such as online travel intermediaries, field sales personnel, international representatives and Interval. Our Management and Rental businesses offer hotel and resort accommodations and vacation rentals to vacationers through www.AstonHotels.com, www.ResortQuestHawaii.com, www.tradingplaces.com and www.mauicondo.com. Our marketing efforts also are focused on both developers and owners of hotels, condominium resorts and vacation rental properties, as well as homeowners associations and individual owners of timeshare resorts.
9
International Operations
We maintain operations in the United States, the United Kingdom and other international locations. Geographic information on revenue, based on sourcing, and long-lived assets, based on physical location, is presented below (in thousands):
| |
Year Ended December 31, | |||||||||
|---|---|---|---|---|---|---|---|---|---|---|
| |
2010 | 2009 | 2008 | |||||||
Revenue |
||||||||||
United States |
$ | 346,289 | $ | 340,420 | $ | 347,699 | ||||
All other countries |
63,151 | 64,566 | 68,099 | |||||||
Total |
$ | 409,440 | $ | 404,986 | $ | 415,798 | ||||
| |
December 31, | ||||||||||
|---|---|---|---|---|---|---|---|---|---|---|---|
| |
2010 | 2009 | 2008 | ||||||||
Long-lived assets (excluding goodwill and intangible assets) |
|||||||||||
United States |
$ | 49,663 | $ | 43,156 | $ | 37,886 | |||||
All other countries |
$ | 1,237 | 1,244 | 1,203 | |||||||
Total |
$ | 50,900 | $ | 44,400 | $ | 39,089 | |||||
Competition
Membership and Exchange
The two principal companies in the global vacation ownership membership and exchange industry, our Interval International subsidiary and RCI, aggressively compete for developer and consumer market share. Trading Places International, which ILG acquired in November 2010, and several third parties operate in this industry with a significantly more limited scope of available accommodations. Our Membership and Exchange segment also faces increasing competition from points-based vacation clubs and large resort developers, which may elect to operate their own internal exchange systems to facilitate exchanges for owners of vacation interests at their resorts as they increase in size and scope. In addition, vacation clubs and resort developers may have direct exchange relationships with other developers.
We believe that developers and homeowners associations generally choose to affiliate with an exchange network based on:
- •
- the quality of resorts participating in the network;
- •
- the level of service provided to members;
- •
- the range and level of support services;
- •
- the flexibility of the exchange program;
- •
- the demographics of the membership base;
- •
- the costs for annual membership and exchanges; and
- •
- the continuity of management and its strategic relationships within the industry.
Based on the most recent disclosure statements filed by RCI and Interval for the year ended December 31, 2009, RCI had more than 3.8 million points and weeks members and its network for weeks included a total of approximately 4,300 resorts while the Interval Network had more than 1.8 million members and included over 2,500 resorts. Accordingly, RCI is the larger provider of
10
vacation ownership member services with a larger exchange network. Through the resources of its corporate affiliates, particularly Wyndham Vacation Ownership, Inc., itself engaged in vacation ownership sales, RCI may have greater access to a significant segment of new purchasers of vacation interests.
While overall, the Interval Network's primary competitor has a greater number of resorts in its exchange network and reports a larger number of owners of vacation interests participating in its vacation ownership membership programs, we believe that the Interval Network has distinguished itself as the membership and exchange provider of choice with developers of high quality vacation ownership properties and their owners. This belief is based primarily on the quality of the resorts in the Interval Network and related services provided by these resorts, coupled with a continued commitment to attract distinctive resorts to the network and foster memorable vacation experiences for its members.
Management and Rental
The Management and Rental businesses are also highly competitive and face competition from other suppliers of travel products and services, hotel operators and local rental agents. We compete for vacationers on the basis of our range of available accommodations, price, locations, and amenities. The principal competitive factors in attracting hotel, condominium and timeshare resort and other vacation property owners and homeowners associations are the ability to provide comprehensive management services at competitive prices and, in many cases, to generate rental income. In addition, there are low barriers to entry for new competitors.
Seasonality
Revenue at ILG is influenced by the seasonal nature of travel. The Membership and Exchange businesses recognize exchange and Getaway revenue based on confirmation of the vacation, with the first quarter generally experiencing higher revenue and the fourth quarter generally experiencing lower revenue. The Management and Rental businesses recognize revenue based on occupancy, with the first and third quarters generally generating higher revenue and the second and fourth quarters generally generating lower revenue.
Employees
As of December 31, 2010, ILG had approximately 2,900 employees worldwide. With the exception of a limited number of housekeeping employees at one property in Hawaii and employees in Argentina, Italy, Mexico and Spain, employees are not represented by unions or collective bargaining agreements. ILG believes that relationships with its employees are generally good.
Intellectual Property
We regard our intellectual property rights, including service marks, trademarks and domain names, copyrights, trade secrets and similar intellectual property (as applicable), as critical to our success. Our businesses also rely heavily upon proprietary software, informational databases and other components that make up their products and services.
We rely on a combination of laws and contractual restrictions with employees, customers, suppliers, affiliates and others to establish and protect these proprietary rights. Despite these precautions, it may be possible for a third party to copy or otherwise obtain and use trade secret or copyrighted intellectual property without authorization which, if discovered, might require legal action to correct. In addition, third parties may independently and lawfully develop substantially similar intellectual properties.
We have generally registered and continue to apply to register, or secure by contract when appropriate, our trademarks and service marks as they are developed and used, and reserve and
11
register domain names as we deem appropriate. We generally consider the protection of our trademarks to be important for purposes of brand maintenance and reputation. While we protect our trademarks, service marks and domain names, effective trademark protection may not be available or may not be sought in every country in which products and services are made available, and contractual disputes may affect the use of marks governed by private contract. Similarly, not every variation of a domain name may be available or be registered, even if available. Our failure to protect our intellectual property rights in a meaningful manner or challenges to related contractual rights could result in erosion of brand names and limit our ability to control marketing on or through the internet using our various domain names or otherwise, which could adversely affect our business, financial condition and results of operations.
From time to time, we are subject to legal proceedings and claims in the ordinary course of business, including claims of alleged infringement of the trademarks, copyrights, patents and other intellectual property rights of third parties. In addition, litigation may be necessary in the future to enforce our intellectual property rights, protect trade secrets or to determine the validity and scope of proprietary rights claimed by others. Any litigation of this nature, regardless of outcome or merit, could result in substantial costs and diversion of management and technical resources, any of which could adversely affect our business, financial condition and results of operations.
Government Regulation
Our businesses are subject to and affected by international, federal, state and local laws, regulations and policies, which are subject to change. The descriptions of the laws, regulations and policies that follow are summaries of those which we believe to be most relevant to our business and do not purport to cover all of the laws, regulations and policies that affect our businesses. We believe that we are in material compliance with these laws, regulations and policies.
Regulations Generally Applicable to Our Business
Privacy and Data Collection. The collection and use of personal data of our customers, as well as the sharing of our customer data with affiliates and third parties, are governed by privacy laws and regulations enacted in the United States and in other jurisdictions around the world. For instance, several states have introduced legislation or enacted laws and regulations that require compliance with standards for data collection and protection of privacy and, in some instances, provide for penalties for failure to notify customers when the security of a company's electronic/computer systems designed to protect such standards are breached, even by third parties. Other states, such as California, have enacted legislation that requires enhanced disclosure on Internet web sites regarding consumer privacy and information sharing among affiliated entities or have such legislation pending. In addition, the European Union Directive on Data Protection requires that, unless the use of data is "necessary" for certain specified purposes, including, for example, the performance of a contract with the individual concerned, consent must be obtained to use the data (other than in accordance with our stipulated privacy policies) or to transfer it outside of the European Union. We believe that we are in material compliance with the laws and regulations applicable to privacy and data collection as such are relevant to our business.
Marketing Operations. The products and services offered by our various businesses are marketed through a number of distribution channels, each of which is regulated at the federal and state level. Such regulations may limit our ability to solicit new customers or to market additional products or services to existing customers. For example, to comply with state and federal regulations on telemarketing, our affected businesses have adopted processes to routinely identify and remove phone numbers listed on the various "do not call" registries from our calling lists and have instituted procedures for preventing unsolicited or otherwise unauthorized telemarketing calls. In addition, where appropriate, our business has registered as a telemarketer and has adopted calling practices compliant
12
with requirements of the applicable jurisdiction, such as restrictions on the methods and timing of telemarketing calls and limitations on the percentage of abandoned calls generated through the use of automated telephone-dialing equipment or software.
Similarly, state and federal regulations may place limitations on our ability to engage our consumers in electronic mail marketing campaigns. Most notably, the CAN-SPAM Act imposes various requirements on the transmission of e-mail messages whose primary purpose is to advertise or promote a commercial product or service. Some foreign jurisdictions in which we operate have similar regulations. Our affected businesses have adopted e-mail messaging practices responsive to the requirements of such regulations.
Internet. A number of laws and regulations have been adopted to regulate the Internet, particularly in the areas of privacy and data collection. In addition, it is possible that existing laws may be interpreted to apply to the Internet in ways that the existing laws are not currently applied, particularly with respect to the imposition of state and local taxes on transactions through the Internet. Regulatory and legal requirements are particularly subject to change with respect to the Internet. We cannot predict with certainty whether such new requirements will affect our practices or impact our ability to market our products and services online.
Travel Agency Services. The travel agency products and services that we provide are subject to various federal, state and local regulations. We must comply with laws and regulations that relate to our marketing and sales of such products and services, including laws and regulations that prohibit unfair and deceptive advertising or practices and laws that require us to register as a "seller of travel" to comply with disclosure requirements. In addition, we are indirectly affected by the regulation of our travel suppliers, many of which are heavily regulated by the United States and other jurisdictions.
Regulations Applicable to the Vacation Exchange Business
Our vacation exchange business is subject to, among other laws and regulations, statutes in certain jurisdictions that regulate vacation ownership, including exchange services, and we must prepare and file annually disclosure guides with regulators in jurisdictions where such filings are required.
Although our vacation exchange business is not generally subject to laws and regulations that govern the development of vacation ownership properties and the sale of vacation ownership interests, these laws and regulations directly affect the members of our vacation exchange programs and resorts with units that participate in our vacation exchanges. These laws and regulations, therefore, indirectly affect our vacation exchange business. Vacation ownership resorts are subject to various regulatory requirements including state and local approvals or regulations required by the country of the resort. The laws of most states require resort developers to file a detailed offering statement describing their business and all material aspects of the project and sale of vacation interests with a designated state authority. Laws in many jurisdictions where our resort developers sell vacation interests generally grant the purchaser of a vacation interest the right to cancel a contract of purchase at any time within a specified rescission period following the earlier of the date the contract was signed or the date the purchaser has received the last of the documents required to be provided by the resort developer. In addition, several jurisdictions in the future may enact regulations that would impose or increase taxes on members that complete exchanges, similar to local transient occupancy taxes. In the European Union, a Timeshare Directive has recently been implemented by member states. This directive imposes new requirements on businesses offering timeshare exchange relating to disclosures, rescission and timing of acceptance of payment. We are implementing compliance measures as national laws are adopted by member states pursuant to this directive.
13
Regulations Applicable to the Management and Rental Businesses
Our Management and Rental business is subject to, among others, laws and regulations that relate to health and sanitation, the sale of alcoholic beverages, facility operation and fire safety. We believe that we are in material compliance with these laws and regulations as such are relevant to our business. These requirements are summarized below:
Health and Sanitation. Lodging and restaurant businesses often require licensing by applicable authorities, and sometimes these licenses are obtainable only after the business passes health inspections to assure compliance with health and sanitation codes. Health inspections are performed on a recurring basis. Health-related laws affect the food and beverage establishments. They also govern swimming pool use and operation and require the posting of notices, availability of certain rescue equipment and limitations on the number of persons allowed to use the pool at any time. These regulations typically impose civil fines or penalties for violations, which may lead to operating restrictions if uncorrected or in extreme cases of violations.
Sale of Alcoholic Beverages. Alcoholic beverage service is subject to licensing and extensive regulations that govern virtually all aspects of service. Compliance with these regulations at managed locations may impose obligations on the owners of managed hotels, the property manager or both. Managed hotel operations may be adversely affected by delays in transfers or issuances of alcoholic beverage licenses necessary for food and beverage services.
Facility Operation. The operation of lodging facilities is subject to various innkeepers' laws. Federal and state laws applicable to places of public accommodation prohibit discrimination in lodging services on the basis of the race, sex, color, religion, ancestry or disability of the guest. Hawaiian state law prohibits smoking in guest rooms and all enclosed areas.
Other. Our Management and Rental business is subject to state and local regulation, including fire safety and applicable real estate brokerage licensing statutes.
Internet Address and SEC Filings
Our Internet address is www.iilg.com. On our Web site, we provide a link to our electronic SEC filings, including our annual report on Form 10-K, our quarterly reports on Form 10-Q, our current reports on Form 8-K and any amendments to these reports. All such filings are available free of charge and are available as soon as reasonably practicable after filing. The information found on our Web site is not part of this or any other report we file with or furnish to the United States Securities and Exchange Commission.
Adverse Events and Trends—Adverse events and trends in the vacation ownership, vacation rental and travel industries could adversely affect our business, financial condition and results of operations.
The success of ILG and our businesses depends, in substantial part, upon the health of the worldwide vacation ownership, vacation rental and travel industries. Travel expenditures are sensitive to business and personal discretionary spending levels and tend to decline during general economic downturns. Also, inclement weather and/or natural disasters, such as earthquakes, hurricanes, fires, floods and tsunamis may result in the inability of consumers to travel to and vacation in certain destinations and regions in which participating resorts operate and/or vacation rental properties are located. Similarly, significant damage to resorts and/or vacation rental properties could result in a decrease in the number of resort accommodations or vacation rentals available for use in our membership and exchange programs or as vacation rentals. Our businesses are also sensitive to travel health concerns, such as H1N1, SARS, bird flu and other pandemics, as well as concerns related to terrorism, enhanced travel security measures and/or geopolitical conflicts. These could result in a decrease and/or delay in demand for travel to our managed hotels and resorts and for exchanges and Getaways to and purchases of vacation ownership interests in affected regions. This decrease and/or delay in demand, depending on its scope and duration, could adversely affect our business and financial performance.
14
Accordingly, downturns or weaknesses in the vacation and travel industries or price increases for travel related services, including economic factors adversely impacting consumers' decisions to use and consume travel services, the overall financial instability of the airline industry and associated air carrier bankruptcies, decreased airlift to relevant markets, job actions and strikes, and increased costs of transportation based on increased fuel prices, could adversely affect our business, financial condition and results of operations, as could inclement weather, natural disasters, epidemics, pandemics or other health concerns, terrorism, regional violence, enhanced travel security measures and/or geopolitical conflicts. These factors could lead to changes in deposit and demand patterns causing a significant number of members to relinquish well in advance of intended travel times. Economic conditions may continue to cause decreased demand for purchases of vacation ownership interests, may increase default rates among current owners, and may increase refund requests from our members. The matters described above could result in a decrease in the number of Interval Network members and could have a material adverse effect on the vacation ownership and vacation rental industries, which in turn could have a material adverse effect on our business, financial condition and results of operations.
Availability of Financing, Developer Insolvency and Potential for Consolidation—Lack of available financing for vacation property developers and consumers and the resultant potential for insolvency, bankruptcy and consolidation of developers could adversely affect our ability to maintain and grow our exchange networks membership and could adversely affect our business, financial condition and results of operations.
Vacation property developers rely on the credit markets for receivables financing used to fund their sales and marketing efforts and for financing new development. If the availability of receivables financing or financing for development of resorts remains limited or is only available on unacceptable terms, developers may continue to scale back or even cease operations, including sales and marketing efforts and development of resorts, sources of new members for our exchange networks. In addition, developers may seek to extend or adjust payment terms with us.
Inability to obtain financing on acceptable terms or at all has led to and may continue to lead to insolvency of resort developers affiliated with our exchange networks, which in turn could reduce or stop the flow of new members from their resorts and also could adversely affect the operations and desirability of exchange with those resorts if the developer's insolvency impacts the management of the resorts. In some cases a developer in bankruptcy could terminate its existing relationship with us. The weak financial condition of some developers may lead to increased consolidation in the industry. If we are unable to obtain or retain business relationships with the resultant resort developers, our results of operations may be materially adversely affected.
Insolvency of one or more developers that in the aggregate have significant obligations owed to us could cause impairments to certain receivables and assets which could have a material adverse effect on our results of operations. Insolvency of a number of properties managed or marketed by Aston, particularly managed hotels, could materially adversely affect that segment's business, financial condition and results of operations.
In addition, the lack of available credit for consumers also could result in a decrease in potential purchasers of vacation interests who would otherwise become members or participants in our exchange networks and a decrease in potential purchasers of vacation properties in Hawaii or other locations where we manage properties. This could have a material adverse effect on our business, financial condition and results of operations.
Competition—The industries in which our businesses operate are highly competitive and these businesses are subject to risks relating to competition that may adversely affect our performance.
Our businesses will be adversely impacted if they cannot compete effectively in their respective industries, each of which is highly competitive. Our continued success depends upon our ability to
15
compete effectively. Some of our competitors have significantly greater financial, marketing and other resources than we have. In particular, in the case of our Interval Network, its primary competitor, RCI, is larger. Through the resources of its corporate affiliates, particularly, Wyndham Vacation Ownership, Inc., itself engaged in vacation ownership sales, RCI may have greater access to a significant segment of new vacation ownership purchasers and a broader platform for participating in industry consolidation. Our Management and Rental businesses compete with other vacation properties and managers including larger management companies and their managed properties. Competitive pressures may cause us to reduce our fee structure or potentially modify our business models, which could adversely affect our business, financial condition and results of operations.
Third Party Relationships—We depend on relationships with developers, members and other vacation property owners and any adverse changes in these relationships could adversely affect our business, financial condition and results of operations.
Our Interval Network business is dependent upon vacation ownership developers for new members and supply of resort accommodations for use in exchanges and Getaways, and our Membership and Exchange businesses are dependent upon members and participants to renew their existing memberships and otherwise engage in transactions. Our Management and Rental businesses are dependent upon vacation property and hotel owners and homeowners associations for vacation properties to manage and rent to vacationers.
The Interval Network has established multi-year relationships with numerous developers pursuant to exclusive affiliation agreements and we believe that relationships with these entities are generally strong, but these historical relationships may not continue in the future. During each year, the affiliation agreements for several of the Interval Network's largest new member-producing developers are scheduled to renew. The non-renewal of an affiliation agreement will adversely affect our ability to secure new members for our programs from the non-renewing resort or developer, and will result in the loss of existing Interval Network members (and their vacation interests) at the end of their current membership to the extent that we do not secure membership renewals directly from such members. In addition, we may be unable to negotiate new affiliation agreements with resort developers or secure renewals with existing members in our exchange programs, and our failure to do so would result in decreases in the number of new and/or existing members, the supply of resort accommodations available through our exchange networks and related revenue. If we are unable to obtain sufficient renewals of affiliations with resorts and memberships with consumers or to enter into new affiliation agreements, this could have a material adverse effect on our business, financial condition and results of operations. Also, the loss of a few large developers (particularly those from which Interval receives membership renewal fees directly) could materially impact our business, financial condition and results of operations.
We believe that developers will continue to create and operate internal reservation and exchange systems, which decreases their reliance on vacation ownership membership programs, including those offered by us, and could adversely impact the supply of resort accommodations available through our exchange networks. The vacation ownership industry has experienced consolidation through the acquisition of vacation ownership developers by other developers, which may result in the diversion of exchange membership and other business. Our ability to maintain existing or negotiate new affiliation agreements may be adversely impacted by the continued creation and operation of internal reservation and exchange systems by developers, as well as by consolidation in the vacation ownership industry.
Similarly, the failure of our Management and Rental businesses to maintain existing or negotiate new hotel, resort and homeowners association management agreements and/or rental services arrangements with vacation property owners, as a result of the sale of property to third parties, contract dispute or otherwise, or the failure of vacationers to book vacation rentals through these businesses would result in a decrease in related revenue, which would have an adverse effect on our business,
16
financial condition and results of operations. The loss of one or more of our largest management agreements could materially impact the business, financial condition and results of operations of our Management and Rental business.
Vacation Rental Revenue—Our success is dependent, in part, on revenue from vacation rentals and, if consumer demand for vacation rentals falls materially below historic levels, our business, financial condition and results of operations could be adversely affected.
The macroeconomic downturn negatively affected demand for our rentals of vacation accommodations to our members and other vacationers, leading us to decrease pricing and resulting in reduced revenue from vacation rentals. While the situation has improved, failure of our management and rental business to secure a sufficient number of vacationers for accommodations we manage or market could also result in increased obligations under guaranteed dollar amount or specified percentage provisions of certain hotel and resort management agreements and, ultimately, could affect our ability to obtain and maintain management agreements with vacation property owners. We also actively seek to provide vacation rental services to resorts participating in our exchange networks. Any additional or prolonged decrease in demand and/or pricing for vacation rentals would further impact our revenue and, if materially below historical levels, could have a material adverse effect on our business, financial condition and results of operations.
We have a substantial amount of indebtedness, which could adversely affect our financial position.
We have a substantial amount of indebtedness. As of December 31, 2010, we had total debt of approximately $357.6 million, consisting of $300.0 million of senior notes with an unamortized balance of original issue discount of $18.4 million and $76.0 million of borrowings under our senior secured credit facilities. We also had an additional $50.0 million, net of any letters of credit usage, available for borrowing under the revolving portion of our senior secured credit facilities at that date. We may also incur significant additional indebtedness in the future. Our substantial indebtedness may:
- •
- limit our ability to borrow additional funds for working capital, capital expenditures, acquisitions or other general
business purposes;
- •
- limit our ability to use our cash flow or obtain additional financing for future working capital, capital expenditures,
acquisitions or other general business purposes;
- •
- require us to use a substantial portion of our cash flow from operations to make debt service payments;
- •
- limit our flexibility to plan for, or react to, changes in our business and industry;
- •
- place us at a competitive disadvantage compared to less leveraged competitors; and
- •
- increase our vulnerability to the impact of adverse economic and industry conditions.
We may not be able to generate sufficient cash to service our debt obligations.
Our ability to make payments on and to refinance our indebtedness will depend on our financial and operating performance, which is subject to prevailing economic and competitive conditions and to certain financial, business and other factors beyond our control. We may be unable to maintain a level of cash flows from operating activities sufficient to permit us to pay the principal, premium, if any, and interest on our indebtedness.
If our cash flows and capital resources are insufficient to fund our debt service obligations, we may be forced to reduce or delay investments and capital expenditures, or to sell assets, seek additional capital or restructure or refinance our indebtedness. These alternative measures may not be successful and may not permit us to meet our scheduled debt service obligations. In the absence of such operating
17
results and resources, we could face substantial liquidity problems and might be required to dispose of material assets or operations to meet our debt service and other obligations. Our senior secured credit agreement and the indenture governing our senior notes restrict our ability to dispose of assets, use the proceeds from any disposition of assets and to refinance our indebtedness. We may not be able to consummate those dispositions or to obtain the proceeds that we could realize from them and these proceeds may not be adequate to meet any debt service obligations then due.
Key Personnel—Loss of one or more of our key personnel could adversely affect our relationships with third parties, business, financial condition and results of operations.
Our operations require managerial and operational expertise as well as the maintenance of relationships with resort developers and other third parties. In particular, we are dependent upon the management skills and continued services of several members of our senior management team, including Craig M. Nash, our Chief Executive Officer and Jeanette E. Marbert, our Chief Operating Officer; with respect to the Membership and Exchange business, David C. Gilbert, Interval International's Executive Vice President—Resort Sales and Marketing; and with respect to the Management and Rental business, Kelvin M. Bloom, President of Aston Hotels & Resorts. The failure of such key personnel to continue to be active in management of our businesses could have a material adverse effect on relationships with third parties, business, financial condition and results of operations. In addition, our agreements with a few developers allow the developer a limited termination right in the event that two or more of these individuals who are involved in the Interval Network are no longer with our company, generally in association with a material adverse impact. We do not maintain key employee insurance for any of our officers and employees.
Adverse Events and Trends in Key Vacation Destinations—Events and trends in key vacation destinations could adversely affect our business, financial condition and results of operations.
A substantial percentage of the vacation ownership resorts currently participating in Interval's exchange networks are located in Florida, Hawaii, Las Vegas, Mexico and Southern California, and a majority of the vacation properties for which we provide management and rental services are located in Hawaii. Approximately $111.0 million of 2010 revenue, which excludes pass-through revenue, was generated from travel to properties located in all of these locations as well as property management services performed in these locations. As a result, our ongoing ability to successfully process confirmed vacations for members, as well as our ability to find vacationers for accommodations managed or marketed by us, is largely dependent on the continued desirability of these areas as key vacation destinations. Any significant shift in travel demand for one or more of these key destinations or any adverse impact on transportation to them, such as decreased airlift, natural disasters, regional violence, terrorism or increased travel costs, could have a material adverse effect on our business, financial condition and results of operations.
In addition, hurricanes, earthquakes or other adverse events impacting one or more of these key destinations could significantly reduce the number of accommodations available for exchanges, Getaways or rental to vacationers, as well as the need for vacation rental and property management services generally. Accordingly, any such event could have a material adverse effect on our business, financial condition and results of operations, the impact of which could be prolonged. The effects of climate change may cause these locations to become less appealing to vacation owners as a result of temperature changes, more severe weather or changes to coastal areas which could adversely affect our business.
18
International Operations—We operate in a number of international markets, which exposes us to additional risks that could adversely affect our business, financial condition and results of operations.
Revenue from international operations represented approximately 15.4%, 15.9% and 16.4% of our consolidated revenue in 2010, 2009 and 2008, respectively. We continue to seek to expand and invest in our Membership and Exchange business in various international markets.
In order to achieve widespread acceptance in international markets, we must continue to successfully tailor our services to the unique customs and cultures of relevant countries and markets. Learning the customs and cultures of various countries and markets can be difficult and costly, and the failure to do so could slow international growth. Operating in international markets also exposes us to additional risks, including, among others, changes in regulatory requirements, including taxation, limits on our ability to sell products and services and enforce intellectual property rights and difficulties in managing operations due to distance, language and cultural differences, including issues associated with staffing and managing foreign operations. Also, in particular, significant fluctuations in the value of the U.S. dollar relative to certain foreign currencies could have an adverse effect on our results of operations due to the effects of translation of local currency results into U.S. dollars. We do not currently engage in hedging transactions designed to reduce our exposure to foreign currency risk.
We are also exposed to risks associated with the repatriation of cash from certain of our foreign operations to the United States. Currently, we conduct business in Venezuela where currency restrictions exist limiting our ability to immediately access cash through repatriations at the government official exchange rate. As of December 31, 2010, we had $5.1 million of unrealized loss in other comprehensive income within stockholders' equity pertaining to our Venezuela entity until such time we sell or liquidate our investment. Furthermore, other countries in which we maintain operations may impose limitations on the repatriation of cash from such countries now or in the future. Any limitation on us to transfer significant cash across borders from our international operations pertaining to intercompany debt or intercompany trade payables, if any, could have a material adverse effect on our business, financial condition and results of operations.
Acquisitions and Strategic Arrangements—We may experience financial and operational risks in connection with acquisitions and strategic arrangements. In addition, businesses acquired by us may incur significant losses from operations or experience impairment of carrying value.
We acquired Trading Places International in November 2010 and intend to selectively pursue other acquisitions. However, we may be unable to identify attractive acquisition candidates or complete transactions on favorable terms. In addition, in the case of acquired businesses, we will need to:
- •
- successfully integrate the operations, as well as the accounting, financial controls, management information, technology,
human resources and other administrative systems, of acquired businesses with existing operations and systems;
- •
- maintain third party relationships previously established by acquired companies;
- •
- retain senior management and other key personnel at acquired businesses; and
- •
- successfully manage acquisition-related strain on our and/or the acquired businesses' management, operations and financial resources.
We may not be successful in addressing these challenges or any others encountered in connection with historical and future acquisitions. In addition, the anticipated benefits of one or more acquisitions may not be realized and future acquisitions could result in potentially dilutive issuances of equity securities and/or the assumption of contingent liabilities. Also, the value of goodwill and other intangible assets acquired could be impacted by one or more unfavorable events or trends, which could result in impairment charges in addition to that taken with respect to the Aston Hotels & Resorts
19
business for the year ended December 31, 2008. The occurrence of any of these events could adversely affect our business, financial condition and results of operations.
We also intend to selectively enter into joint ventures and other strategic arrangements to provide new products and services complementary to those currently offered by our businesses. However, we may be unable to successfully enter into these arrangements on favorable terms or launch related products and services or such products and services may not gain market acceptance or be profitable. The failure to develop and execute any such initiatives on a cost-effective basis could have an adverse effect on our business, financial condition and results of operations.
New Products and Services—We may not be able to achieve our strategic objectives through new products and initiatives.
In order to support our strategic objectives, we expect to introduce new products and services during 2011 and in the future. Launching new products and services involves a number of risks including the ability to achieve the anticipated level of market acceptance and to manage the costs and timeliness of rolling-out the product or service. If we are unable to gain market acceptance, experience substantial delays or are required to expend significantly more than expected, our business and results of operations may be materially adversely affected.
Property Renovations—A significant decrease in the supply of available vacation rental accommodations due to ongoing property renovations could adversely affect our business, financial condition and results of operations.
Several of the vacation rental properties for which we provide management and rental services are expected to undergo significant renovations over the next few years. These renovations may result in a decrease in the supply of vacation rental accommodations available to vacationers during the applicable renovation periods. Furthermore, ongoing renovations at a particular property may negatively impact the desirability of the property as a vacation destination. A significant decrease in the supply of available vacation rental accommodations and the need for vacation rental services during renovation periods, coupled with the inability to attract vacationers to properties undergoing renovations, could have an adverse effect on our business, financial condition and results of operations.
Compliance and Changing Laws, Rules and Regulations—The failure of our businesses to comply with extensive regulatory requirements, or to obtain and maintain required licenses and rights, could adversely affect our business, financial condition and results of operations.
Our businesses are subject to various laws, rules and regulations on a global basis, including those specific to the vacation ownership industry, as well as those applicable to businesses generally, such as consumer protection, securities and sales, use, value-added and other tax laws, rules and regulations. While we believe that the operations and practices of our businesses have been structured in a manner to ensure material compliance with applicable laws, rules and regulations, the relevant regulatory authorities may take a contrary position. The failure of our businesses to comply with applicable laws, rules and regulations, or to obtain required licenses or rights, could have a material adverse effect on our business, financial condition and results of operations. In addition, unfavorable changes in the laws, rules and regulations applicable to our businesses, including those related to the imposition of taxes, could decrease demand for the services offered by our businesses, increase costs and/or subject us to additional liabilities, which could have an adverse effect on our business, financial condition and results of operations.
The vacation ownership industry is subject to extensive regulation in the United States and elsewhere, which generally requires vacation ownership resort developers to follow certain procedures in connection with the sale and marketing of vacation interests, including the filing of offering
20
statements with relevant governmental authorities for approval and the delivery to prospective purchasers of certain information relating to the terms of the purchase and use, including rescission rights. Although not all of these regulations affect us directly, such regulations indirectly affect us because of the requirements placed on resort developers that participate in our exchange networks. As a result, any negative change in the regulatory environment within the vacation ownership industry could have a material adverse effect on our business, financial condition and results of operations. For instance, the European Union has recently implemented a timeshare directive to augment existing regulations applicable to timeshare developers and exchange companies.
Our vacation rental operations are directly subject to a number of licensing requirements, as well as certain laws and regulations relating to consumer protection, particularly, those associated with hotel and resort management, including those relating to the preparation and sale of food and beverages, liquor service and health and safety of managed premises. The failure of our Management and Rental businesses to comply with applicable laws, rules and regulations, or to obtain required licenses or rights, could have a material adverse effect on our business, financial condition and results of operations.
Maintenance of Systems and Infrastructure—Our success depends, in part, on the integrity of our systems and infrastructure. System interruption and the lack of integration and redundancy in these systems and infrastructure may have an adverse impact on our business, financial condition and results of operations.
Our success depends, in part, on our ability to maintain the integrity of our systems and infrastructure, including websites, information and related systems, call centers and distribution and fulfillment facilities. System interruption and the lack of integration and redundancy in our information systems and infrastructure may adversely affect our ability to operate websites, process and fulfill transactions, respond to customer inquiries and generally maintain cost-efficient operations. We may experience occasional system interruptions that make some or all systems or data unavailable or prevent our businesses from efficiently providing services or fulfilling orders. We also rely on third-party computer systems, broadband and other communications systems and service providers in connection with the provision of services generally, as well as to facilitate, process and fulfill transactions. Any interruptions, outages or delays in the systems and infrastructures of our businesses and/or third parties, or deterioration in the performance of these systems and infrastructure, could impair the ability of our businesses to provide services, fulfill orders and/or process transactions. Fire, flood, power loss, telecommunications failure, hurricanes, tornadoes, earthquakes, acts of war or terrorism, acts of God and similar events or disruptions may damage or interrupt computer, broadband or other communications systems and infrastructure at any time. Any of these events could cause system interruption, delays and loss of critical data, and could prevent our businesses from providing services, fulfilling orders and/or processing transactions. While our businesses have backup systems for certain aspects of their operations, these systems are not fully redundant and disaster recovery planning is not sufficient for all eventualities. In addition, we may not have adequate insurance coverage to compensate for losses from a major interruption. If any of these adverse events were to occur, it could adversely affect our business, financial conditions and results of operations.
In addition, any penetration of network security or other misappropriation or misuse of personal consumer information could cause interruptions in the operations of our businesses and subject us to increased costs, litigation and other liabilities. Claims could also be made against us for other misuse of personal information, such as for unauthorized purposes or identity theft, which could result in litigation and financial liabilities, as well as administrative action from governmental authorities. Security breaches could also significantly damage our reputation with consumers and third parties with whom we do business. It is possible that advances in computer capabilities, new discoveries, undetected fraud, inadvertent violations of company policies or procedures or other developments could result in a compromise of information or a breach of the technology and security processes that are used to protect consumer transaction data. As a result, current security measures may not prevent any or all
21
security breaches. We may be required to expend significant capital and other resources to protect against and remedy any potential or existing security breaches and their consequences. We also face risks associated with security breaches affecting third parties with which we are affiliated or otherwise conduct business online. Consumers are generally concerned with security and privacy of the Internet, and any publicized security problems affecting our businesses and/or those of third parties may discourage consumers from doing business with us, which could have an adverse effect on our business, financial condition and results of operations.
Business interruptions, cost overruns or project delays in connection with the rearchitecture of our proprietary technology infrastructure may materially adversely affect our business.
We are in the process of developing a rearchitecture of our proprietary technology. We have committed significant resources to this rearchitecture project, which is expected to be phased in over several years. This rearchitecture is extremely complex, in part, because of the wide range of processes and the legacy systems involved. The first phase was launched in the fourth quarter of 2010 and we experienced system instability which impacted the business operations. As we continue this process, we are using a controlled project plan and change control process that we believe will provide for the adequate allocation of resources. However, a divergence from these may result in cost overruns or project delays. If the systems do not operate as expected, this could impact our ability to perform necessary business operations, which could materially adversely affect our business.
Privacy—The processing, storage, use and disclosure of personal data could give rise to liabilities as a result of governmental regulation or conflicting legal requirements.
In the processing of consumer transactions, our businesses receive, transmit and store a large volume of personally identifiable information and other user data. The sharing, use, disclosure and protection of this information are governed by the privacy and data security policies maintained by us and our businesses. Moreover, there are federal, state and international laws regarding privacy and the storing, sharing, use, disclosure and protection of personally identifiable information and user data. Specifically, personally identifiable information is increasingly subject to legislation and regulations in numerous jurisdictions around the world, the intent of which is to protect the privacy of personal information that is collected, processed and transmitted in or from the governing jurisdiction. We could be adversely affected if legislation or regulations are expanded to require changes in business practices or privacy policies, or if governing jurisdictions interpret or implement their legislation or regulations in ways that negatively affect our business, financial condition and results of operations.
Our failure, and/or the failure by the various third party vendors and service providers with which we do business, to comply with applicable privacy policies or federal, state or similar international laws and regulations or any compromise of security that results in the unauthorized release of personally identifiable information or other user data could damage the reputation of these businesses, discourage potential users from trying our products and services and/or result in fines and/or proceedings by governmental agencies and/or consumers, one or all of which could adversely affect our business, financial condition and results of operations.
A company processing, storing, or transmitting payment card data must be compliant with Payment Card Industry-Data Security Standards, or PCI-DSS, or risk losing its ability to process credit card payments and being audited and/or fined. As of December 31, 2010, we are working to become fully compliant. Failure to obtain or maintain PCI-DSS compliance could result in our inability to accept credit card payments or subject us to penalties and thus could have a material negative effect on our operations. Changes in these security standards may cause us to incur significant unanticipated expenses to meet new requirements.
22
Intellectual Property—We may fail to adequately protect our intellectual property rights or may be accused of infringing intellectual property rights of third parties.
We may fail to adequately protect our intellectual property rights or may be accused of infringing intellectual property rights of third parties. Our failure to protect our intellectual property rights in a meaningful manner or challenges to related contractual rights could result in erosion of brand names and limit our ability to control marketing, which could adversely affect our business, financial condition and results of operations.
From time to time, we are subject to legal proceedings and claims in the ordinary course of business, including claims of alleged infringement of the trademarks, copyrights, patents and other intellectual property rights of third parties. In addition, litigation may be necessary in the future to enforce our intellectual property rights, protect trade secrets or to determine the validity and scope of proprietary rights claimed by others. Any litigation of this nature, regardless of outcome or merit, will likely be protracted and expensive and could result in substantial costs and diversion of management and technical resources, any of which could adversely affect our business, financial condition and results of operations.
Our rights plan, charter provisions and terms of our debt agreements may affect the likelihood of a takeover or change of control of ILG.
We have in place a stockholders' rights plan and certain charter provisions that may have the effect of deterring hostile takeovers or delaying or preventing changes in control or management of our company that are not approved by our board. In particular, our charter provides that stockholders may not act by written consent and that the board has the power to issue shares of preferred stock with such designation, powers, preferences, and rights as the board shall determine. The transactions that may be deterred, delayed or prevented might have allowed our stockholders to receive a premium for their shares over then-current market prices. In addition, under our senior credit facility, a change of control (as defined in the credit agreement) constitutes an event of default, entitling our lenders to terminate the facility and require us to repay outstanding borrowings. A change of control (as defined in the indenture) is also a termination event under our senior notes and generally would require us to offer to repurchase our outstanding senior notes. As a result, the provisions of the agreements governing our debt also may affect the likelihood of a takeover or other change of control.
Item 1B. Unresolved Staff Comments.
None.
As of the date hereof, ILG conducts operations through 26 offices in 25 cities in 14 countries, of which 10 offices are within the U.S. and 16 offices are outside of the United States. ILG's global headquarters is located in Miami, Florida and occupies approximately 100,000 square feet of office space under a long-term lease expiring in December 2020. We also operate a call center in Miami with approximately 60,000 square feet under a long-term lease expiring in December 2020. Our Membership and Exchange business' European headquarters is located in London, England and occupies approximately 33,000 square feet of office space under a long-term lease which expires in May 2016, while its Asian headquarters is located in Singapore and occupies approximately 5,500 square feet of office space expiring in August 2012.
The Management and Rental segment is based in Honolulu, Hawaii with approximately 18,000 square feet of office space under a lease expiring in October 2019.
23
On December 2, 2010, RHAC, LLC filed a demand for arbitration with the AAA in New York City and served upon Aston its Notice of Intent to Arbitrate in connection with the Management Agreement between RHAC and Aston for the Aston Waikiki Beach Hotel, one of Aston's largest managed resorts. In the demand, RHAC sought declaratory relief regarding the appropriate standards for specified performance criteria required of Aston in the agreement, whether Aston failed to meet such performance criteria or had defenses for any such failure and RHAC's prospective right to terminate the agreement. Also, on December 2, 2010, Aston initiated an action in Circuit Court of the First Circuit, State of Hawaii, captioned as Aston Hotels & Resorts, LLC v. RHAC, LLC, Index No. 10-1-2600-12 (PWB) (the "Hawaii Action"), in which Aston sought specific enforcement of the agreement and other declaratory relief. In the Hawaii Action, RHAC has filed a motion to compel arbitration of Aston's claims as part of RHAC's AAA arbitration in New York and to dismiss the complaint, and Aston has filed a motion to permanently stay RHAC's AAA arbitration in New York, citing RHAC's agreement to arbitrate all disputes (other than claims involving, or exceeding, a stated dollar threshold) regarding the construction of the Agreement before Dispute, Prevention & Resolution, Inc., in Hawaii and noting that RHAC's demand seeks declaratory relief that does not involve a claim meeting the specified threshold. A hearing was held for both RHAC's and Aston's motions in the Hawaii Action on February 9, 2011. The Court has not yet ruled on either motion. In the ordinary course of business, ILG and its subsidiaries are parties to litigation involving property, personal injury, contract, intellectual property and other claims. The amounts that may be recovered in such matters may be subject to insurance coverage.
Rules of the Securities and Exchange Commission require the description of material pending legal proceedings, other than ordinary, routine litigation incidental to ILG's business, and advise that proceedings ordinarily need not be described if they primarily involve damages for claims in amounts (exclusive of interest and costs) not exceeding 10% of the current assets of the registrant and its subsidiaries on a consolidated basis. In the judgment of management, none of the pending litigation matters which ILG and its subsidiaries are defending, involves or is likely to involve amounts of that magnitude.
Item 4. (Removed and Reserved)
Executive Officers of the Registrant
See Part III, Item 10 of this report for information about our executive officers.
24
Item 5. Market For Registrant's Common Equity, Related Stockholder Matters and Issuer Purchases of Equity Securities.
Market for Registrant's Common Equity and Related Stockholder Matters
Our common stock has been listed on The NASDAQ Stock Market Global Select Market under the ticker symbol "IILG" since August 2008. Prior to that time there was no public market for our common stock. The table below sets forth the high and low sales prices per share for ILG common stock as reported on NASDAQ, for the calendar periods indicated.
| |
High | Low | ||||||
|---|---|---|---|---|---|---|---|---|
Year Ended December 31, 2010 |
||||||||
Fourth Quarter |
$ | 17.54 | $ | 13.18 | ||||
Third Quarter |
$ | 14.42 | $ | 11.61 | ||||
Second Quarter |
$ | 15.19 | $ | 12.37 | ||||
First Quarter |
$ | 15.66 | $ | 12.01 | ||||
| |
High | Low | ||||||
|---|---|---|---|---|---|---|---|---|
Year Ended December 31, 2009 |
||||||||
Fourth Quarter |
$ | 13.99 | $ | 10.76 | ||||
Third Quarter |
$ | 12.90 | $ | 9.15 | ||||
Second Quarter |
$ | 10.00 | $ | 5.00 | ||||
First Quarter |
$ | 6.13 | $ | 3.19 | ||||
As of March 7, 2011, there were approximately 1,970 holders of record of our common stock and the closing price of ILG common stock was $16.46. Because many of the outstanding shares of ILG common stock are held by brokers and other institutions on behalf of stockholders, ILG is not able to estimate the total number of beneficial stockholders represented by these record holders.
Dividend Policy
We have not historically paid cash dividends on our common stock. Declaration and payment of future dividends, if any, will be at the discretion of our board of directors and will depend on our results of operations, cash requirements and surplus, financial condition, legal requirements, capital requirements relating to business initiatives, investments and acquisitions and other factors that our board of directors may deem relevant. In addition, our senior secured credit agreement and indenture limit the amount and our ability to pay cash dividends under certain circumstances.
Unregistered Sales of Equity Securities
During the year ended December 31, 2010, we did not issue or sell any shares of our common stock or other equity securities pursuant to unregistered transactions in reliance upon an exemption from the registration requirements of the Securities Act of 1933, as amended.
Issuer Purchases of Equity Securities
We did not make any purchases of our common stock during the year ended December 31, 2010.
Performance Comparison Graph
The performance graph is not deemed filed with the SEC and shall not be deemed incorporated by reference into any of our prior or future filings made with the SEC.
25
The following graph covers the period from August 12, 2008 to December 31, 2010, assuming $100 was invested on August 12, 2008 in ILG common stock, and in each of the S&P SmallCap 600 in which our stock has been included since August 2008, the Russell 2000 in which our stock has been included since June 2009 and a peer group consisting of Bluegreen Corporation, Expedia, Inc., Starwood Hotels & Resorts Worldwide, Inc. and Wyndham Worldwide Corporation. The graph assumes that all dividends were reinvested on the date of payment without payment of any commissions. The stock price performance shown in the graph is not necessarily indicative of future price performance.
COMPARISON OF CUMULATIVE TOTAL RETURN
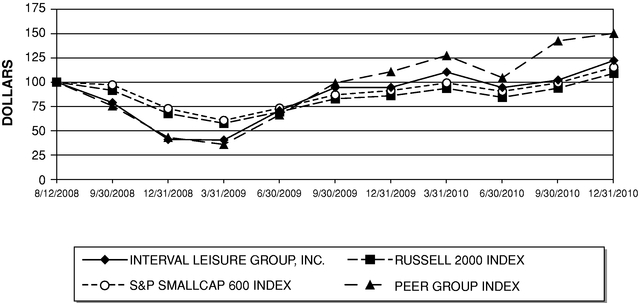
ASSUMES
$100 INVESTED ON AUGUST 12, 2008
ASSUMES DIVIDEND REINVESTED
FISCAL YEAR ENDING DECEMBER 31, 2010
Company/Index/Market
|
3/31/2010 | 6/30/2010 | 9/30/2010 | 12/31/2010 | |||||||||
|---|---|---|---|---|---|---|---|---|---|---|---|---|---|
Interval Leisure Group, Inc |
$ | 110.30 | $ | 94.32 | $ | 105.05 | $ | 122.27 | |||||
Russell 2000 Index |
$ | 93.52 | $ | 84.24 | $ | 93.75 | $ | 108.99 | |||||
S&P Smallcap 600 Index |
$ | 99.13 | $ | 90.47 | $ | 99.18 | $ | 115.28 | |||||
Peer Group Index |
$ | 127.45 | $ | 104.50 | $ | 142.52 | $ | 150.34 | |||||
Company/Index/Market
|
8/12/2008 | 9/30/2008 | 12/31/2008 | 3/31/2009 | 6/30/2009 | 9/30/2009 | 12/31/2009 | |||||||||||||||
|---|---|---|---|---|---|---|---|---|---|---|---|---|---|---|---|---|---|---|---|---|---|---|
Interval Leisure Group, Inc. |
$ | 100.00 | $ | 78.79 | $ | 40.83 | $ | 40.15 | $ | 70.61 | $ | 94.39 | $ | 94.47 | ||||||||
Russell 2000 Index |
$ | 100.00 | $ | 91.44 | $ | 67.56 | $ | 57.46 | $ | 69.34 | $ | 82.71 | $ | 85.91 | ||||||||
S&P Smallcap 600 Index |
$ | 100.00 | $ | 97.14 | $ | 72.69 | $ | 60.44 | $ | 73.18 | $ | 86.83 | $ | 91.27 | ||||||||
Peer Group Index |
$ | 100.00 | $ | 75.40 | $ | 42.89 | $ | 35.66 | $ | 66.17 | $ | 99.08 | $ | 110.71 | ||||||||
26
Item 6. Selected Financial Data
The following Selected Financial Data should be read in conjunction with the consolidated financial statements and notes thereto in Item 8 of this report and "Management's Discussion and Analysis of Financial Condition and Results of Income" in Item 7 of this report.
Financial Information:
| |
Year Ended December 31, | ||||||||||||||||
|---|---|---|---|---|---|---|---|---|---|---|---|---|---|---|---|---|---|
| |
2010 | 2009 | 2008 | 2007(1) | 2006 | ||||||||||||
| |
(In thousands, except per share data) |
||||||||||||||||
Statement of Income Data |
|||||||||||||||||
Revenue |
$ | 409,440 | $ | 404,986 | $ | 415,798 | $ | 364,168 | $ | 288,646 | |||||||
Operating income |
104,477 | 101,846 | 76,291 | 106,566 | 86,128 | ||||||||||||
Net income attributable to common stockholders |
42,418 | 38,213 | 45,264 | 71,056 | 58,043 | ||||||||||||
Earnings per Share Data(2) |
|||||||||||||||||
Basic |
$ | 0.75 | $ | 0.68 | $ | 0.81 | $ | 1.26 | $ | 1.03 | |||||||
Diluted |
0.73 | 0.67 | 0.80 | 1.26 | 1.03 | ||||||||||||
| |
December 31, | |||||||||||||||
|---|---|---|---|---|---|---|---|---|---|---|---|---|---|---|---|---|
| |
2010 | 2009 | 2008 | 2007(1) | 2006 | |||||||||||
| |
(In thousands) |
|||||||||||||||
Balance Sheet Data |
||||||||||||||||
Total assets |
$ | 983,048 | $ | 958,581 | $ | 937,208 | $ | 922,617 | $ | 767,677 | ||||||
Long-term debt, net of current portion |
357,576 | 395,290 | 412,242 | — | — | |||||||||||
Stockholders' equity |
224,735 | 176,376 | 129,139 | 513,367 | 408,887 | |||||||||||
Operating Statistics:
| |
Year Ended December 31, | ||||||||||||||||
|---|---|---|---|---|---|---|---|---|---|---|---|---|---|---|---|---|---|
| |
2010 | 2009 | 2008 | 2007(1) | 2006 | ||||||||||||
Membership and Exchange |
|||||||||||||||||
Total active members (000's)(3) |
1,803 | 1,836 | 1,998 | 1,961 | 1,850 | ||||||||||||
Average revenue per member(4) |
$ | 181.36 | $ | 175.56 | $ | 164.83 | $ | 156.75 | $ | 149.55 | |||||||
Management and Rental |
|||||||||||||||||
Available room nights (000's)(5) |
1,613 | 1,580 | 1,594 | 955 | |||||||||||||
RevPAR(6) |
$ | 95.79 | $ | 91.47 | $ | 117.08 | $ | 127.14 | |||||||||
27
Additional Data:
| |
Year Ended December 31, | |||||||||||||||||
|---|---|---|---|---|---|---|---|---|---|---|---|---|---|---|---|---|---|---|
| |
2010 | 2009 | 2008 | 2007(1) | 2006 | |||||||||||||
| |
(In thousands, except percentage data) |
|||||||||||||||||
Membership and Exchange |
||||||||||||||||||
Transaction revenue(7) |
$ | 190,954 | $ | 189,777 | $ | 185,782 | $ | 170,152 | $ | 150,923 | ||||||||
Membership fee revenue(8) |
129,818 | 132,076 | 133,703 | 123,465 | 112,140 | |||||||||||||
Ancillary member revenue(9) |
8,709 | 8,430 | 8,641 | 8,090 | 9,352 | |||||||||||||
Total member revenue |
329,481 | 330,283 | 328,126 | 301,707 | 272,415 | |||||||||||||
Other revenue |
15,747 | 15,684 | 18,793 | 16,663 | 16,231 | |||||||||||||
Total revenue |
$ | 345,228 | $ | 345,967 | $ | 346,919 | $ | 318,370 | $ | 288,646 | ||||||||
Management and Rental |
||||||||||||||||||
Management fee and rental revenue |
$ | 22,694 | $ | 21,417 | $ | 28,561 | $ | 19,193 | ||||||||||
Pass-through revenue(10) |
41,518 | 37,602 | 40,318 | 26,605 | ||||||||||||||
Total revenue |
$ | 64,212 | $ | 59,019 | $ | 68,879 | $ | 45,798 | ||||||||||
Management and Rental gross margin |
21.3 | % | 20.9 | % | 26.0 | % | 27.2 | % | ||||||||||
Management and Rental gross margin without pass-through |
60.1 | % | 57.5 | % | 62.7 | % | 65.0 | % | ||||||||||
- (1)
- Includes
the results of Aston for the seven month period from its acquisition on May 31, 2007.
- (2)
- For
the year ended December 31, 2008, basic weighted average shares outstanding were computed using the number of shares of common stock outstanding
immediately following the spin-off, as if such shares were outstanding for the entire period prior to the spin-off plus the weighted average of such shares outstanding
following the spin-off date through December 31, 2008. For the years ended December 31, 2007 and 2006, basic and diluted weighted average shares outstanding were computed
using the number of shares of common stock outstanding immediately following the spin-off, as if such shares were outstanding for the entire period.
- (3)
- Represents
active members of the Interval Network as of the end of the period. Active members are members in good standing that have paid membership fees
and any other applicable charges in full as of the end of the period or are within the allowed grace period.
- (4)
- Represents
membership fee revenue, transaction revenue and ancillary member revenue for the Interval Network for the applicable period divided by the
monthly weighted average number of active members during the applicable period.
- (5)
- Represents
number of nights available for rental by Aston at managed vacation properties during the period.
- (6)
- Represents
Gross Lodging Revenue divided by Available Room Nights during the period. Gross Lodging Revenue is total room revenue collected from all
Aston-managed occupied rooms during the period. Available Room Nights is the number of nights available at Aston managed vacation properties during the period.
- (7)
- Represents
transactional and service fees paid for Interval Network exchanges, Getaways, reservation servicing, and related transactions.
- (8)
- Represents
fees paid for membership in the Interval Network.
- (9)
- Includes revenue related to insurance and travel related services provided to Interval Network members.
28
- (10)
- Represents the compensation and other employee-related costs directly associated with management of the properties that are included in both revenue and cost of sales and that are passed on to the property owners or homeowners associations without mark-up. Management believes presenting gross margin without these expenses provides management and investors a relevant period-over-period comparison.
Item 7. Management's Discussion and Analysis of Financial Condition and Results of Operations
Cautionary Statement Regarding Forward-Looking Information
This annual report on Form 10-K contains "forward looking statements" within the meaning of the Private Securities Litigation Reform Act of 1995. The use of words such as "anticipates," "estimates," "expects," "intends," "plans" and "believes," and similar expressions or future or conditional verbs such as "will," "should," "would," "may" and "could" among others, generally identify forward-looking statements. These forward-looking statements include, among others, statements relating to: our future financial performance, our business prospects and strategy, anticipated financial position, liquidity and capital needs and other similar matters. These forward looking statements are based on management's current expectations and assumptions about future events, which are inherently subject to uncertainties, risks and changes in circumstances that are difficult to predict.
Actual results could differ materially from those contained in the forward looking statements included in this annual report for a variety of reasons, including, among others: adverse trends in economic conditions generally or in the vacation ownership, vacation rental and travel industries; adverse changes to, or interruptions in, relationships with third parties; lack of available financing for, or insolvency or consolidation of developers; decreased demand from prospective purchasers of vacation interests; travel related health concerns, such as pandemics; changes in our senior management; regulatory changes; our ability to compete effectively and successfully add new products and services; the effects of our significant indebtedness and our compliance with the terms thereof; adverse events or trends in key vacation destinations; business interruptions in connection with the rearchitecture of our technology systems; and our ability to expand successfully in international markets and manage risks specific to international operations. Certain of these and other risks and uncertainties are discussed in our filings with the SEC, including in Item 1A "Risk Factors" of this annual report. In light of these risks and uncertainties, the forward looking statements discussed in this report may not prove to be accurate. Accordingly, you should not place undue reliance on these forward looking statements, which only reflect the views of our management as of the date of this report. Except as required by applicable law, we do not undertake to update these forward-looking statements.
Management Overview
History
Interval Leisure Group, Inc., or ILG, was incorporated as a Delaware corporation in May 2008 in connection with a plan by IAC/InterActiveCorp, or IAC, to separate into five publicly traded companies, referred to as the "spin-off." In connection with the spin-off, we entered into an indenture pursuant to which we issued $300.0 million of senior unsecured notes due 2016 and entered into a senior secured credit facility with a maturity in 2013, including a term loan in the original principal amount of $150.0 million and a $50.0 million revolving credit facility. ILG was formed to hold the Membership and Exchange and Management and Rental businesses, and commenced trading on The NASDAQ Stock Market in August 2008 under the symbol "IILG."
29
ILG consists of two operating segments. During the fourth quarter of 2010, we changed the names of our two operating segments from Interval to Membership and Exchange and from Aston to Management and Rental, in order to better describe the underlying business operations in the segments. The historical segments' financial information and underlying operational activity did not change, other than the addition of the operations of Trading Places International, or TPI, upon completion of the acquisition on November 30, 2010.
The Membership and Exchange segment consists of Interval International Inc.'s businesses, referred to as Interval, and TPI's membership and exchange related line of business. The Management and Rental segment consists of Aston Hotels & Resorts, LLC and Maui Condo and Home, LLC, referred to as Aston, and TPI's management and rental related line of business. The businesses operated by ILG following the spin-off are referred to herein as the "ILG Businesses."
Basis of Presentation
The historical consolidated financial statements of ILG and its subsidiaries and the disclosure set forth in this Management's Discussion and Analysis of Financial Condition and Results of Operations reflect the contribution or other transfer to ILG of all of the subsidiaries and assets and the assumption by ILG of all of the liabilities relating to the ILG Businesses in connection with the spin-off, and the allocation to ILG of certain IAC corporate expenses relating to the ILG Businesses prior to the spin-off. Accordingly, the historical consolidated financial statements of ILG prior to the spin-off reflect the historical financial position, results of operations and cash flows of the ILG Businesses since their respective dates of acquisition by IAC, based on the historical consolidated financial statements and accounting records of IAC and using the historical results of operations and historical basis of the assets and liabilities of the ILG Businesses with the exception of accounting for income taxes. For purposes of these financial statements, income taxes have been computed for ILG on an as if stand-alone, separate tax return basis. Intercompany transactions and accounts have been eliminated.
In the opinion of ILG's management, the assumptions underlying the historical consolidated financial statements of ILG and its subsidiaries are reasonable. However, this financial information, prior to the spin-off, does not reflect what the historical financial position, results of operations and cash flows of ILG would have been had ILG been a stand-alone company during the periods presented prior to the spin-off.
General Description of our Business
ILG is a leading global provider of membership and leisure services to the vacation industry. We operate in two business segments: Membership and Exchange and Management and Rental. Our principal business segment, Membership and Exchange, offers travel and leisure related products and services to owners of vacation interests and others mostly through various membership programs, as well as related services to resort developer clients. Management and Rental, our other business segment, provides hotel, resort and homeowners association management and vacation rental services to both vacationers and vacation property owners.
Membership and Exchange Services
Interval, the principal business comprising our Membership and Exchange segment, has been a leader in the membership and exchange services industry since its founding in 1976. As of December 31, 2010, Interval's primary operation is the Interval Network, a quality global vacation ownership membership exchange network with:
- •
- a large and diversified base of participating resorts consisting of approximately 2,600 resorts located in over 75 countries, including both leading independent resort developers and branded hospitality companies; and
30
- •
- approximately 1.8 million vacation ownership interest owners enrolled as members of the Interval Network.
Interval typically enters into multi-year contracts with developers of vacation ownership resorts, pursuant to which the resort developers agree to enroll all purchasers of vacation interests at the applicable resort as members of an Interval exchange program. In return, Interval provides enrolled purchasers with the ability to exchange the use and occupancy of their vacation interest at the home resort (generally for a period of one week) for the right to occupy accommodations at a different resort participating in an Interval exchange network. Through Interval's Getaways, members may rent resort accommodations for a fee without relinquishing the use of their vacation interest. In addition, Interval offers sales, marketing and operational support, consulting and back-office services, including reservation servicing, to certain resort developers participating in the Interval Network, upon their request and for additional consideration.
The Membership and Exchange segment earns most of its revenue from (i) fees paid for membership in the Interval Network and (ii) transactional and service fees paid for Interval Network exchanges, Getaways, reservation servicing, and related transactions collectively referred to as "transaction revenue."
Management and Rental Services
We also provide management and rental services to hotels as well as condominium and timeshare resorts and their homeowners associations through Aston and TPI. Such vacation properties and hotels are not owned by us. Aston is based in Hawaii and concentrates largely on hotel and condominium resort management primarily in Hawaii, as well as vacation property rental and related services (including common area and owner association management services for condominium projects). During the fourth quarter of 2010, we acquired TPI which provides vacation rentals and timeshare resort and homeowners association management services in the United States and Mexico.
As of December 31, 2010, the businesses that comprise our Management and Rental segment provided management and rental services to over 45 vacation properties and hotels, mostly in Hawaii, as well as more limited management services to certain additional properties.
Revenue from the Management and Rental segment is derived principally from fees for hotel, condominium resort, timeshare resort and homeowners association management and rental services. Management fees consist of a base management fee and, in some instances for hotels or condominium resorts, an incentive management fee which is generally a percentage of operating profits or improvement in operating profits. Service fee revenue is based on the services provided to owners including reservations, sales and marketing, property accounting and information technology services either internally or through third party providers. A majority of Aston's hotel and condominium resort management agreements provide that owners receive either specified percentages of the revenue generated under our management or guaranteed dollar amounts. In these cases, the operating expenses for the rental operation are paid from the revenue generated by the rentals, the owners are then paid their contractual percentages or amounts, and the Management and Rental segment either retains the balance (if any) as its management fee or makes up the deficit.
International Operations
International revenue decreased 2.2% in 2010 compared to 2009 and decreased 5.2% in 2009 compared to 2008. As a percentage of our total revenue, international revenue decreased to 15.4% in 2010, from 15.9% in 2009, and from 16.4% in 2008.
In October 2010, we communicated to the employees a plan to close one of our offices in Spain, which included a call center, in an effort to better align resources and reduce future operating costs.
31
We recorded a restructuring charge of approximately $0.5 million in the fourth quarter 2010 primarily related to one-time termination benefits and certain professional services and administrative costs.
Other Factors Affecting Results
Membership and Exchange
The reduction in sales and marketing expenditures by resort developers spurred by the lack of receivables financing has continued, leading to a decrease in the flow of new members to our exchange networks. During 2010, access to credit markets returned for securitization transactions available to certain large developers and activity by regional banks working with independent developers has increased slightly. Financing standards for consumers remain higher than those required several years ago and developers are continuing to modify their business models to reduce reliance on receivables financing. As developers with greater debt loads continue to work with their lenders, we anticipate additional bankruptcies, reorganizations and consolidation within the industry. In addition, our fourth quarter 2010 results were negatively affected by system downtime in connection with the launch of our new proprietary membership platform as well as changes in travel patterns and inventory availability.
Management and Rental
Our Management and Rental segment is susceptible to variations in overall macroeconomic conditions, particularly in its predominant geographic market, Hawaii. According to the Hawaii Tourism Authority, visitor arrivals by air in Hawaii have increased 13.4% and 8.8% for the fourth quarter 2010 and the year ended December 31, 2010, respectively. This is consistent with Aston's managed properties in Hawaii experiencing increases in occupancy, partly related to a decrease in available room nights, leading to an overall increase of 7.6% in RevPAR in Hawaii in 2010 compared to 2009. As of February 2011, the Hawaii State Department of Business, Economic Development & Tourism, forecasts increases of 4.0% in visitors to Hawaii and 9.2% in visitor expenditures in 2011 over 2010. Beginning in the fourth quarter of 2009, Aston expanded beyond the Hawaiian islands adding certain mainland locations. Consequently, in the first half of 2010, the Management and Rental segment was adversely impacted by ramp-up and seasonality related to these mainland properties. However, for the second half of 2010, we realized a positive contribution from the Aston properties on the mainland.
Business Acquisition
On November 30, 2010, we acquired TPI which offers exchange and leisure services to vacation owners, including on-site management at 20 resorts located throughout the mainland United States, Hawaii, and Mexico. This acquisition expands our fee-for-service, asset light offerings in several areas including, direct-to-consumer vacation ownership exchange and specialty lodging property management. TPI was consolidated into our financial statements as of the acquisition date and the financial effect of this acquisition was not material to our consolidated financial statements as of and for the year ended December 31, 2010.
Outlook
Throughout 2009, we saw sustained pressures in the U.S. and global economy related to the global economic downturn, the credit crisis, investment returns, travel health concerns and general negative consumer sentiment, all of which impacted consumer discretionary spending in travel and leisure services. In 2010, we continued to operate, for the most part, in a challenging business environment resulting from the carryover effects of the global economic downturn experienced in 2009. In 2011, we anticipate the vacation ownership industry will remain in a period of transition that may result in the bankruptcy, restructuring and consolidation of developers as well as continued modifications to their business models.
32
CRITICAL ACCOUNTING POLICIES AND ESTIMATES
The preparation of financial statements in conformity with accounting principles generally accepted in the United States requires management to make estimates, judgments and assumptions that affect the amounts reported in our consolidated financial statements and accompanying notes. On an ongoing basis, we evaluate our estimates which are based on historical experience and on various other judgments and assumptions that we believe are reasonable under the circumstances. Actual outcomes could differ from those estimates.
Our significant accounting policies are discussed in Note 2, Significant Accounting Policies, to the accompanying consolidated financial statements and should be reviewed in connection with the following discussion. Set forth below are the policies and estimates that we have identified as critical to our business operations and an understanding of our results of operations, based on the high degree of judgment or complexity in their application.
Revenue Recognition
Revenue, net of sales incentives, from membership fees from our Membership and Exchange segment is deferred and recognized over the terms of the applicable memberships, typically ranging from one to five years, on a straight-line basis. Generally, memberships are cancelable and refundable on a pro-rata basis. Direct costs of acquiring members and direct costs of sales related to deferred membership revenue are also deferred and amortized on a straight-line basis over the terms of the applicable memberships. These costs relate to various commissions and initial fulfillment costs. The recognition of previously deferred revenue and expense is based on estimates derived from an aggregation of member-level data. Revenue from exchange and Getaway transactions is recognized when confirmation of the transaction is provided as the earnings process is complete. Reservation servicing revenue is recognized when service is performed or on a straight-line basis over the applicable service period. All taxable revenue transactions are presented on a net-of-tax basis.
The Management and Rental segment's revenue is derived principally from fees for hotel, condominium resort, timeshare resort and homeowners association management and rental services. Management fees consist of base management fees, which are either fixed amounts or range from 1% to 5% of adjusted gross lodging revenue, various revenue sharing arrangements with condominium owners based on stated formulas or a percentage of adjusted gross lodging revenue, and incentive management fees for certain hotels and condominium resorts which are generally a percentage of operating profits or improvement in operating profits. Service fee revenue is based on the services provided to owners including reservations, sales and marketing, property accounting and information technology services either internally or through third party providers. Service fee revenue is recognized when the service is provided. In certain instances we arrange services which are provided directly to property owners. Transactions for these services do not impact our consolidated financial statements as they are not included in our results of operations. Additionally, in most cases, we employ on-site personnel to provide services such as housekeeping, maintenance and administration to property owners and homeowner associations under our management agreements. For such services, we recognize revenue in an amount equal to the expenses incurred.
Accounting for Business Combinations
In accordance with ASC Topic 805, "Business Combinations," when accounting for business combinations we are required to recognize the assets acquired, liabilities assumed, contractual contingencies, and contingent consideration at their fair value as of the acquisition date. The purchase price allocation process requires management to make significant estimates and assumptions with respect to intangible assets, estimated contingent consideration payments and/or pre-acquisition contingencies, all of which ultimately affect the fair value of goodwill established as of the acquisition
33
date. Goodwill acquired in business combinations is assigned to the reporting unit(s) expected to benefit from the combination as of the acquisition date and is then subsequently tested for impairment at least annually.
Although we believe the assumptions and estimates we have made have been reasonable and appropriate, they are based in part on historical experience and information obtained from the management of the acquired entity and are inherently uncertain. Examples of critical estimates in accounting for acquisitions include but are not limited to:
- •
- the estimated fair value of the acquisition-related contingent consideration, which is performed using a
probability-weighted income approach based upon the forecasted achievement of post-acquisition pre-determined targets;
- •
- the future expected cash flows from product sales and related contracts and agreements; and
- •
- discount and long-term growth rates.
Unanticipated events and circumstances may occur which could affect the accuracy or validity of our assumptions, estimates or actual results. Additionally, any change in the fair value of the acquisition-related contingent consideration subsequent to the acquisition date, including changes resulting from events that occur after the acquisition date, such as changes in our estimated fair value of the targets that are expected to be achieved, will be recognized in earnings in the period of the change in estimated fair value.
Recoverability of Goodwill and Other Intangible Assets
Our Policy
Goodwill and other intangible assets are significant components of our consolidated balance sheets. Our policies regarding the valuation of intangible assets affect the amount of future amortization and possible impairment charges we may incur. Assumptions and estimates about future values and remaining useful lives of our intangible and other long-lived assets are complex and subjective. They can be affected by a variety of factors, including external factors such as consumer spending habits and general economic trends, and internal factors such as changes in our business strategy and our internal forecasts.
In accordance with ASC Topic 350, "Intangibles—Goodwill and Other," we review the carrying value of goodwill and other intangible assets of each of our reporting units on an annual basis as of October 1, or more frequently upon the occurrence of certain events or substantive changes in circumstances, based on a two-step impairment test. We consider our Membership and Exchange and Management and Rental segments to be individual reporting units which are also individual operating segments of ILG. Goodwill acquired in business combinations is assigned to the reporting unit(s) expected to benefit from the combination as of the acquisition date. The first step of the impairment test compares the fair value of each reporting unit with its carrying amount including goodwill. The fair value of each reporting unit is calculated using the average of an income approach and a market comparison approach which utilizes similar companies as the basis for the valuation. If the carrying amount exceeds fair value, then the second step of the impairment test is performed to measure the amount of any impairment loss. The impairment loss is determined by comparing the implied fair value of goodwill to the carrying value of goodwill. The implied fair value of goodwill represents the excess of the fair value of the reporting unit over amounts assigned to its net assets.
The determination of fair value utilizes an evaluation of historical and forecasted operating results and other estimates. Fair value measurements are generally determined through the use of valuation techniques that may include a discounted cash flow approach, which reflects our own assumptions of what market participants would use in pricing the asset or liability.
34
During the year, we monitor the actual performance of our reporting units relative to the fair value assumptions used in our annual goodwill impairment test, including potential events and changes in circumstance affecting our key estimates and assumptions.
2010 Interim Goodwill Impairment Test
During the first quarter 2010, we determined the Management and Rental reporting unit's actual performance was negatively tracking the fair value assumptions used in our then most current annual goodwill impairment test as of October 1, 2009, as evidenced by notable declines in RevPAR relative to the prior projections. Based on this, we concluded that indicators of impairment were present and could result in a reduction in the fair value of our Management and Rental reporting unit below its carrying amount. There were no indicators of impairment pertaining to our Membership and Exchange reporting unit.
Consequently, we performed an interim impairment test for our Management and Rental reporting unit as of March 31, 2010. The first step of the two step impairment test concluded that the carrying value of the reporting unit exceeded its fair value by approximately 5%. As a result, we performed the second step of the impairment test to measure the amount of any impairment loss, which concluded that the reporting unit's implied fair value of goodwill exceeded the carrying value of goodwill by a marginal amount and, therefore, no impairment loss was recorded. The excess of the implied fair value of goodwill over its carrying value, computed in the second step, was primarily attributable to net declines in the fair value of an asset group consisting of Aston's property management contracts and wholesaler agreements definite-lived intangible assets, certain real estate assets owned by Aston and used in the purveyance of revenue generating services pursuant to the aforementioned property management contracts and wholesaler agreements, and Aston's tradename definite-lived intangible asset. As a result of the decline in fair value of these long-lived assets, we performed a recoverability test pursuant to ASC Topic 360, "Property Plant and Equipment," ("ASC 360") as subsequently discussed in the Recoverability of Long-Lived Assets section below.
2010 Annual Impairment Test
As of October 1, 2010, we reviewed the carrying value of goodwill and other intangible assets of each of our reporting units. As of October 1, 2010, the Membership and Exchange and Management and Rental reporting units' goodwill were $474.7 million and $5.2 million, respectively. We performed the first step of the impairment test on both our reporting units and concluded that each reporting unit's fair value exceeded its carrying value and, therefore, the second step of the impairment test was not necessary. As of December 31, 2010, we did not identify any triggering events which required an interim impairment test subsequent to our annual impairment test on October 1, 2010.
Key Estimates and Assumptions
The determination of fair value utilizes an evaluation of historical and forecasted operating results and other key assumptions made by management, including discount rates, utilized in the valuation of certain identifiable assets. Deterioration in macroeconomic conditions or in our results of operations or unforeseen negative events could adversely affect either of our reporting units and lead to a revision of the estimates used to calculate fair value. These key estimates and forecasted operating results may or may not occur or may be revised by management which may require us to recognize impairment losses in the future.
With respect to our Membership and Exchange reporting unit's step one analysis, the primary examples of key estimates include our discount rate and forecasted sales growth rates. As previously noted, we use the average of an income approach and a market comparison approach to calculate the fair value of our reporting units. As a measure of sensitivity on the income approach, as of the date of
35
our last annual impairment test, a hypothetical 10% change in both our discount and long-term growth rates would result in a change of $500 million in the income approach fair value of the reporting unit, or approximately 31% of the excess of the fair value of the reporting unit over its carrying value. In regards to the market comparison approach, a change in our selected EBITDA multiple by 10% would result in a change of approximately $100 million in the Membership and Exchange reporting unit's market comparison approach fair value, or approximately 6% of the excess of the reporting unit's fair value over its carrying value.
With respect to our Management and Rental reporting unit's step one analysis, the primary examples of key estimates include forecasted available and occupied room nights, average daily rates and long-term growth rates. As a measure of sensitivity on the income approach, as of the date of our last annual impairment test, a hypothetical 10% change to all four forecasted key estimates would result in a change of approximately $11 million in our Management and Rental's income approach fair value, or approximately 290% of the excess of the fair value of the reporting unit over its carrying value. In regards to the market comparison approach, a change in our selected EBITDA multiple by 10% would result in a change of approximately $2 million in the reporting unit's market comparison approach fair value, or approximately 141% of the excess of the reporting unit's fair value over its carrying value. If either of these hypothetical changes occur, it is possible that the reporting unit's fair value could fail to exceed its carrying value in step one of the impairment test and, consequently, we would proceed to step two of the impairment test where an impairment of goodwill could be recorded.
Key estimates and assumptions for both our reporting units can be impacted by certain potential events and changes in circumstances, as follows:
- •
- Declines in discretionary spending levels during general economic downturns.
- •
- Inclement weather and/or natural disasters.
- •
- Travel health concerns such as the H1N1 influenza outbreak and other pandemics.
- •
- Concerns related to terrorism, enhanced travel security measures and/or geographical conflicts.
Events and trends in the vacation ownership, vacation rental and travel industries that could adversely affect consumers travel to and vacation in certain destinations and regions in which vacation rental properties are located, including events such as:
Additionally, key estimates and assumptions for both our reporting units can be impacted by certain potential events and changes in circumstances specific to each reporting unit, such as:
- •
- A downturn or a further weakening of the economy may cause decreased demand for purchases of vacation ownership interests,
may increase default rates among current owners and may increase refund requests from our members.
- •
- Lack of available financing for vacation property developers and consumers or the potential insolvency or consolidation of
developers could adversely affect our ability to maintain and grow our exchange network membership which could adversely affect our business, financial condition and results of operations.
- •
- Our ability to maintain relationships and renew contractual relationships with vacation ownership developers that provide
new members and supply of resort accommodations for use in exchanges or Getaways.
- •
- Our ability to motivate members to renew their existing memberships and/or otherwise engage in transactions.
Membership and Exchange
36
- •
- A downturn or a further weakening of the economy may cause decreased demand for vacation rentals.
- •
- The failure to maintain existing hotel, condominium resort and timeshare resort management and/or rental services
arrangements with vacation property owners and/or insolvency of several properties managed by or marketed by the Management and Rental segment, particularly managed hotels.
- •
- A significant decrease in the supply of available vacation rental accommodations due to ongoing property renovations.
Management and Rental
Recoverability of Long-Lived Assets
Our Policy
We review the carrying value of all long-lived assets, primarily property and equipment and definite-lived intangible assets, for impairment whenever events or changes in circumstances indicate that the carrying value of a long-lived asset (asset group) may be impaired. In accordance with guidance included within ASC 360, recoverability of assets to be held and used is measured by a comparison of the carrying amount of an asset (asset group) to future undiscounted cash flows expected to be generated by the asset (asset group). An asset group is the lowest level of assets and liabilities for which identifiable cash flows are largely independent of the cash flows of other assets and liabilities. When estimating future cash flows, we consider:
- •
- only the future cash flows that were directly associated with and that are expected to arise as a direct result of the use
and eventual disposition of the asset group;
- •
- our own assumptions about our use of the asset group and all available evidence when estimating future cash flows;
- •
- potential events and changes in circumstance affecting our key estimates and assumptions;
- •
- the existing service potential of the asset (asset group) at the date tested.
If an asset (asset group) is considered to be impaired, the impairment to be recognized is measured by the amount by which the carrying amount of the asset (asset group) exceeds its fair value. When determining the fair value of the asset (asset group), we consider the highest and best use of the assets from a market-participant perspective. The fair value measurement is generally determined through the use of independent third party appraisals or an expected present value technique, both of which may include a discounted cash flow approach, which reflects our own assumptions of what market participants would utilize to price the asset (asset group).
Assets to be disposed of are reported at the lower of the carrying amount or fair value less costs to sell. Assets to be abandoned, or from which no further benefit is expected, are written down to zero at the time that the determination is made and the assets are removed entirely from service.
2010 Recoverability Test
As of March 31, 2010, as a consequence of the Management and Rental reporting unit failing step one of the two step process for testing goodwill for impairment, we performed a recoverability test on an asset group within our Management and Rental reporting unit. The asset group at the time consisted of Aston's property management contracts and wholesaler agreements definite-lived intangible assets, certain real estate assets owned by Aston and used in the purveyance of revenue generating services pursuant to the aforementioned property management contracts and wholesaler agreements, and Aston's tradename definite-lived intangible asset. The resulting recoverability analysis concluded
37
that the undiscounted estimated future cash flows of the asset group exceeded its carrying value by approximately 19% of the asset group's carrying value. Accordingly, the asset group was not considered impaired. The measurement period used for the recoverability analysis was 11 years, the remaining useful life of the property management contracts asset (the asset group's primary asset). The fact that the asset group's cash flows exceeded their carrying amounts in our recoverability test is largely because, pursuant to U.S. GAAP, this analysis utilizes an undiscounted cash flow approach. This method differs from the manner in which the fair value of the asset group is calculated as part of our step two goodwill and other intangibles impairment analysis previously discussed.
Our assumptions on key estimates utilized in the recoverability analysis related largely to Aston's forecasted available and occupied room nights, average daily rates and long-term growth rates (collectively "key estimates"). We believe there is a low-to-moderate level of uncertainty associated with the assumptions utilized in the development of these key estimates. In order to evaluate the sensitivity of the assumptions used in determining the undiscounted estimated future cash flows of the asset group, we applied a hypothetical 10% decrease to each of the forecasted key estimates. This hypothetical 10% decrease would have resulted in the asset group's carrying value exceeding the undiscounted estimated future cash flows by approximately 9%.
The carrying value of consolidated long-lived assets that is subject to assessment for impairment in accordance with ASC 360 is $133.8 million and $148.4 million at December 31, 2010 and 2009, respectively. From the date of our last recoverability test, March 31, 2010, through December 31, 2010, we did not identify any events or changes in circumstances indicating that the carrying value of a long lived asset (asset group) may be impaired.
Useful Life of the Management and Rental Asset Group
Additionally, as part of our recoverability analysis, we consider whether the existing service potential (useful life) of the assets within the Management and Rental asset group remain appropriate or require adjustment. Specifically, we consider the impact of the expected use of the assets and the effects of obsolescence, demand, competition and other economic factors, among other considerations. For the year ended December 31, 2010, and as of the date of our Management and Rental asset group recoverability test, we concluded no adjustment was necessary.
When determining the existing service potential of the asset group, we concluded the remaining useful life of the property management contracts intangible asset (i.e. the asset group's primary asset) was the appropriate remaining useful to use for the asset group. Consequently, as of March 31, 2010, the remaining useful life of the asset group used for the recoverability test was 11 years.
Stock-Based Compensation
We measure compensation cost for stock awards at fair value on date of grant and recognize the expense as compensation over the service period for awards expected to vest. The fair value of restricted stock and restricted stock units ("RSUs") is determined based on the number of shares granted and the quoted price of our common stock. For certain cliff vesting awards with performance criteria, we also use anticipated future results in determining the fair value of the award. Such value is recognized as expense over the service period, net of estimated forfeitures, using the straight-line recognition method. We grant awards subject to graded vesting (i.e. portions of the award vest at different times during the vesting period) or to cliff vesting (i.e. all awards vest at the end of the vesting period). Any performance criteria attached to an award subject to graded vesting simply affects whether or not the award will vest.
Management must make certain estimates and assumptions regarding stock awards that will ultimately vest, and to the extent actual results or updated estimates differ from our current estimates, such amounts will be recorded as a cumulative adjustment in the period estimates are revised. We
38
consider many factors when estimating expected forfeitures, including types of awards, employee class, and historical experience. The forfeiture rate is estimated at the grant date based on historical experience and revised, if necessary, in subsequent periods for any changes to the estimated forfeiture rate from that previously estimated. For any vesting tranche of an award, the cumulative amount of compensation cost recognized is equal to the portion of the grant-date value of the award tranche that is actually vested at that date. Actual results and future estimates may differ substantially from our current estimates.
As of December 31, 2010, ILG had approximately $18.1 million of unrecognized compensation cost, net of estimated forfeitures, related to all equity-based awards, which is currently expected to be recognized over a weighted average period of approximately 1.8 years. Of the $18.1 million of unrecognized compensation cost, 67.7% relates to an employee class group comprised of certain key employees for which we do not expect RSUs to be forfeited. For awards in which we expect forfeitures to occur, a 10% change to our estimated forfeiture rate would have an impact of less than $100,000 to our unrecognized compensation cost as of December 31, 2010.
Income Taxes
Accounting for our income taxes requires significant judgment in the evaluation of our uncertain tax positions and in the calculation of our provision for income taxes. Pursuant to ASC Topic 740 "Income Taxes" ("ASC 740"), we adopted a two-step approach to recognizing and measuring uncertain tax positions. The first step is to evaluate available evidence to determine if it appears more likely than not that an uncertain tax position will be sustained on an audit by a taxing authority, based solely on the technical merits of the tax position. The second step is to measure the tax benefit as the largest amount that is more than 50% likely of being realized upon settling the uncertain tax position.
Although we believe we have adequately reserved for our uncertain tax positions, the ultimate outcome of these tax matters may differ from our expectations. We adjust our reserves in light of changing facts and circumstances, such as the completion of a tax audit, expiration of the applicable statute of limitations, the refinement of an estimate, and interest accruals associated with uncertain tax positions until they are resolved. To the extent that the final tax outcome of these matters is different than the amounts recorded, such differences will impact the provision for income taxes in the period in which such determination is made. See Note 10, "Income Taxes."
Our future effective tax rates could be affected by changes in our deferred tax assets or liabilities, the valuation of our uncertain tax positions, or by changes in tax laws, regulations, accounting principles, or interpretations thereof.
Revenue
| |
Year Ended December 31, | |||||||||||||||
|---|---|---|---|---|---|---|---|---|---|---|---|---|---|---|---|---|
| |
2010 | % Change | 2009 | % Change | 2008 | |||||||||||
| |
(Dollars in thousands) |
|||||||||||||||
Membership and Exchange |
$ | 345,228 | (0.2 | ) | $ | 345,967 | (0.3 | ) | $ | 346,919 | ||||||
Management and Rental |
64,212 | 8.8 | 59,019 | (14.3 | ) | 68,879 | ||||||||||
Total revenue |
$ | 409,440 | 1.1 | $ | 404,986 | (2.6 | ) | $ | 415,798 | |||||||
2010 Compared to 2009
Revenue in 2010 increased $4.5 million, or 1.1%, from 2009.
39
Membership and Exchange segment revenue remained relatively flat decreasing by $0.7 million from the prior year period. Total member revenue, which primarily consists of Interval Network membership fees and transactional and service fees, decreased $0.8 million, or 0.2%. Total active members in the Interval Network at December 31, 2010 decreased to approximately 1.80 million members as compared to approximately 1.84 million members at the end of the prior year, a decrease of 1.8%. Overall Interval Network average revenue per member increased 3.3% to $181.36 in 2010 from $175.56 in 2009. Membership fee revenue decreased $2.3 million, or 1.7%, primarily due a decrease of 3.4% in average active members and unfavorable foreign currency translations of $0.2 million resulting from the strengthening U.S. dollar when compared to 2009, partially offset by a 1.8% increase in average membership fees per member. Transaction revenue increased $1.2 million, or 0.6%, due to a $1.4 million increase in transaction revenue from exchanges and Getaways primarily due to a 3.5% increase in average transaction fees per member, offset by a decrease of $0.3 million in other transaction related fees.
Management and Rental segment revenue increased 8.8%, or $5.2 million, which included a 10.4% increase in reimbursed compensation and other employee-related costs directly associated with managing properties that are included in both revenue and expenses and that are passed on to the property owners or homeowners association without mark-up ("pass-through revenue"). The increase in pass-through revenue is due to an increase in average operational headcount resulting primarily from the addition of new Aston properties in the mainland, employing existing personnel at another managed property for the full year 2010 and to our acquisition of TPI during the fourth quarter 2010. Fee income earned from managed hotel and condominium resort properties at Aston increased $0.7 million, or 3.2%, due to an increase of 4.7% in revenue per available room ("RevPAR") to $95.79 in 2010 due to an increase in occupancy, offset by slightly lower average daily rate. These results include Aston's new mainland hotel properties not included prior to the fourth quarter 2009. Aston's occupancy rate in Hawaii has shown sustained improvement throughout the year, increasing 9.4% in 2010 as compared to 2009. RevPAR in Hawaii has also shown continued improvement, increasing 7.6% from the comparable period of 2009 to $99.65, primarily due to an increase in occupancy partly related to a decrease in available room nights. This was offset by a decrease of 1.6% in average daily rate due to continued competitive pricing pressures experienced in 2010. Aston has been generally tracking the results of comparable properties in the Hawaii market.
2009 Compared to 2008
Revenue in 2009 decreased $10.8 million, or 2.6%, from 2008.
Membership and Exchange segment revenue decreased by $1.0 million, or 0.3%, from the prior year period. Total member revenue, which primarily consists of Interval Network membership fees and transactional and service fees, increased $2.2 million, or 0.7%. Total active members in the Interval Network at December 31, 2009 decreased to approximately 1.8 million members as compared to approximately 2.0 million members at prior year end, a decrease of 8.1% due primarily to Disney members leaving the system. Overall Interval Network average revenue per member increased 6.5% to $175.56 in 2009 from $164.83 in 2008. Transaction revenue increased $4.0 million, or 2.2%, primarily due to a $2.9 million increase in reservation servicing fees related to additional activity from existing and new servicing arrangements as compared to the prior year end and a $1.0 million increase in transaction revenue from exchanges and Getaways primarily due to a 0.4% increase in volume for exchange and Getaway transactions. Membership fee revenue decreased $1.6 million, or 1.2%, primarily due to unfavorable foreign currency translations of $2.6 million and a decrease of 5.5% in average active members, partially offset by a 4.5% increase in average membership fees.
Membership and Exchange segment revenue in 2009 was affected by unfavorable foreign currency translation of $7.1 million resulting from the strengthening of the U.S. dollar when compared to 2008.
40
In constant currency, the Membership and Exchange segment revenue would have increased $6.2 million, resulting in a 1.8% increase in 2009 compared to 2008.
Management and Rental segment revenue decreased 14.3%, or $9.9 million, which included a 6.7% decrease in pass-through revenue. Fee income earned from managed vacation properties at Aston decreased $7.1 million, or 25.0%, due to a reduction of 21.9% in RevPAR to $91.47 in 2009. Lower occupancy and lower average daily rate led to the reduction in RevPAR. Occupancy rates during 2009 were negatively impacted by overall macroeconomic conditions contracting consumer discretionary spending. During 2009, Aston generally tracked the results of comparable properties in the Hawaii market.
Cost of Sales
| |
Year Ended December 31, | |||||||||||||||
|---|---|---|---|---|---|---|---|---|---|---|---|---|---|---|---|---|
| |
2010 | % Change | 2009 | % Change | 2008 | |||||||||||
| |
(Dollars in thousands) |
|||||||||||||||
Membership and Exchange |
$ | 77,741 | (3.7 | ) | $ | 80,703 | (5.2 | ) | $ | 85,105 | ||||||
Management and Rental |
50,563 | 8.3 | 46,703 | (8.4 | ) | 50,970 | ||||||||||
Total cost of sales |
$ | 128,304 | 0.7 | $ | 127,406 | (6.4 | ) | $ | 136,075 | |||||||
As a percentage of total revenue |
31.3 | % | (0.4 | ) | 31.5 | % | (3.9 | ) | 32.7 | % | ||||||
Gross margin |
68.7 | % | 0.2 | 68.5 | % | 1.9 | 67.3 | % | ||||||||
Cost of sales consists primarily of compensation and other employee-related costs (including stock-based compensation) for personnel engaged in servicing members of the Membership and Exchange segment and providing services to property owners and/or guests of the Management and Rental segment's managed vacation properties, as well as cost of rental inventory used primarily for Getaways included within the Membership and Exchange segment.
2010 Compared to 2009
Cost of sales in 2010 increased $0.9 million from 2009, consisting of an increase of $3.9 million from our Management and Rental segment, offset by a decrease of $3.0 million from Membership and Exchange segment. Overall gross margin remained relatively flat, increasing by 0.2% to 68.7% in 2010 compared to 2009.
Gross margin for the Membership and Exchange segment increased by 1.1% as compared to the prior year. Cost of sales for this segment decreased $3.0 million primarily due to a decrease in compensation and other employee-related costs of $2.0 million and a decrease in membership fulfillment related expenses, offset by an increase of $1.1 million in the cost of purchased rental inventory for use primarily in Getaways. The decrease in Interval's compensation and other employee-related costs is due primarily to a decrease in average operational headcount.
The increase of $3.9 million in cost of sales from the Management and Rental segment was primarily attributable to an increase in pass-through revenue due to an increase in average operational headcount resulting from the addition of new properties in the mainland, employing existing personnel at another managed property for the full year 2010, and our acquisition of TPI during the fourth quarter 2010. Gross margin for this segment increased 1.9% in 2010 compared to 2009. The Management and Rental segment has lower gross margins than our Membership and Exchange segment largely due to the compensation and other employee-related costs of $41.5 million and $37.6 million for 2010 and 2009, respectively, directly associated with managing properties that are included in both revenue and expenses and that are passed on to the property owners without mark-up.
41
2009 Compared to 2008
Cost of sales in 2009 decreased $8.7 million from 2008, of which the Membership and Exchange and the Management and Rental segments contributed $4.4 million and $4.3 million, respectively, of the decrease. Overall gross margin increased 1.9% to 68.5%.
Gross margin for the Membership and Exchange segment increased 1.6% as compared to the prior year. Cost of sales for this segment decreased primarily due to decreases of $3.5 million in compensation and other employee-related costs, $0.4 million in the cost of rental inventory for use primarily in Getaways and $0.2 million in call center related expenses. The decrease in compensation and other employee-related costs is due primarily to a decrease of 1.9% in average operational headcount.
The decrease of $4.3 million in cost of sales from the Management and Rental segment was primarily attributable to a decrease of 9.3% in average operational headcount servicing the segment's managed vacation properties. Gross margin for this segment decreased 19.7% as compared to the prior year. The Management and Rental segment has lower gross margins than the Membership and Exchange segment primarily due to the compensation and other employee-related costs of $37.6 million and $40.3 million for the year ended December 31, 2009 and 2008, respectively, directly associated with managing properties that are included in both revenue and expenses and that are passed on to the property owners without mark-up. The 2009 decrease in reimbursed compensation and other employee-related costs compared to 2008 was not proportional to the decrease in the Management and Rental segment's revenue, excluding such reimbursed costs.
Selling and Marketing Expense
| |
Year Ended December 31, | |||||||||||||||
|---|---|---|---|---|---|---|---|---|---|---|---|---|---|---|---|---|
| |
2010 | % Change | 2009 | % Change | 2008 | |||||||||||
| |
(Dollars in thousands) |
|||||||||||||||
Selling and marketing expense |
$ | 50,755 | (2.4 | ) | $ | 52,029 | 1.1 | $ | 51,463 | |||||||
As a percentage of total revenue |
12.4 | % | (3.5 | ) | 12.9 | % | 3.8 | 12.4 | % | |||||||
Selling and marketing expense consists primarily of advertising and promotional expenditures and compensation and other employee-related costs (including stock-based compensation) for personnel engaged in sales and sales support functions. Advertising and promotional expenditures primarily include printing costs of directories and magazines, promotions, tradeshows, agency fees, marketing fees and related commissions.
2010 Compared to 2009
Selling and marketing expense in 2010 decreased $1.3 million from 2009, primarily due to decreases in printing costs related to cost efficiencies in the printing of directories and, to a lesser extent, magazines, and a decrease in compensation and other employee-related expenses, partially offset by an increase in advertising and promotional expenses related to certain sales incentives and an increase in travel related expenses.
2009 Compared to 2008
Selling and marketing expense in 2009 increased $0.6 million from 2008, primarily due to an increase in advertising and promotional expenses due to certain marketing fees related to agreements entered into during the first quarter 2009, offset by decreases in compensation and other employee-related costs of $2.0 million and decreases in printing costs of $0.8 million. The decrease in compensation and other employee-related costs is due primarily to a decrease of 11.4% in average selling and marketing related headcount.
42
General and Administrative Expense
| |
Year Ended December 31, | |||||||||||||||
|---|---|---|---|---|---|---|---|---|---|---|---|---|---|---|---|---|
| |
2010 | % Change | 2009 | % Change | 2008 | |||||||||||
| |
(Dollars in thousands) |
|||||||||||||||
General and administrative expense |
$ | 88,980 | 1.2 | $ | 87,893 | 6.6 | $ | 82,474 | ||||||||
As a percentage of total revenue |
21.7 | % | NM | 21.7 | % | 9.4 | 19.8 | % | ||||||||
General and administrative expense consists primarily of compensation and other employee-related costs (including stock-based compensation) for personnel engaged in finance, legal, tax, human resources, information technology and executive management functions, facilities costs and fees for professional services.
2010 Compared to 2009
General and administrative expense in 2010 increased $1.1 million from 2009, primarily due to an increase of $3.3 million in overall compensation and other employee-related costs principally due to an increase in health and welfare related expenses, and increases in IT maintenance and support services of $1.0 million, partially offset by a decrease of $2.2 million in expense incurred in 2009 related to Value Added Tax ("VAT") in Europe based on a judgment issued against an unrelated party by the European Court of Justice, further described below, decreases of $0.4 million in certain tax expenses incurred in 2009, and net gains of $0.3 million in foreign currency remeasurements of operating assets and liabilities denominated in a currency other than the functional currency.
General and administrative related non-cash compensation expense in 2010 was $9.0 million, relatively flat compared to 2009. As of December 31, 2010, ILG had approximately $18.1 million of unrecognized compensation cost, net of estimated forfeitures, related to all equity-based awards, which is currently expected to be recognized over a weighted average period of approximately 1.8 years.
2009 Compared to 2008
General and administrative expense in 2009 increased $5.4 million from 2008. The increase was due in part to a $2.3 million accrual, of which $2.2 million was charged to general and administrative expense, related to VAT in Europe. This accrual was made based on a judgment issued against an unrelated party by the European Court of Justice. The judgment affects companies who transact within the European Union ("EU"), specifically providers of vacation interest exchange services, and alters the manner in which the Membership and Exchange segment will account for VAT on its revenues as well as to which EU country VAT is owed. Also contributing to the increase in general and administrative expense is an increase in professional fees and additional expenses associated with being a stand-alone and public company for a full year, partially offset by decreases in non-public company headcount resulting in lower employee compensation expense and other decreases as part of our overall cost cutting measures. Overall incremental stand-alone and public company costs, excluding non-cash compensation expense, were $2.9 million.
General and administrative related non-cash compensation expense in 2009 increased $1.7 million from 2008. Non-cash compensation expense included in general and administrative expense for 2009 was $9.1 million compared to $7.4 million. The increase in non-cash compensation is primarily attributable to an increase of $2.0 million for awards issued in connection with the spin-off for which 2009 included a full year of expense, a $1.1 million charge related to the impact of a change in estimated forfeiture rate during the fourth quarter 2009 and an increase of $0.4 million related to awards granted to our ILG directors for which 2009 included a full year of expense, offset by a $1.8 million non-recurring charge recorded in 2008 related to the accelerated vesting of certain restricted stock units in connection with the spin-off. The change in estimate of the forfeiture rate was the result of a revised expectation of RSUs that will ultimately vest. As of December 31, 2009, ILG had
43
approximately $20.5 million of unrecognized compensation cost, net of estimated forfeitures, related to all equity-based awards, expected to be recognized over a weighted average period of approximately 2.4 years.
Goodwill Impairment
On October 1, 2008, we performed our required annual impairment test and determined there was no impairment with respect to our Membership and Exchange and Management and Rental reporting units. Subsequent to the time of our annual impairment test as of October 1, 2008, we determined the Management and Rental's business climate was experiencing an overall significant adverse change, as evidenced by declines in RevPAR. In addition, we noted deteriorating economic conditions during the fourth quarter of 2008 as reflected in the declines in risk-free interest rates and general market trading multiples, which impacts market capitalization. ILG's market capitalization over its book value declined during this time period from 4.1x to 2.3x. Based on these changes, we concluded that this change in business climate could result in a reduction in the fair value of our Management and Rental reporting unit below its carrying amount. Consequently, we performed an interim impairment test for our Management and Rental reporting unit as of December 31, 2008. Unlike the results of our annual impairment test, our interim impairment test confirmed that an impairment existed in our Management and Rental reporting unit as of December 31, 2008. As a result, during the fourth quarter 2008, we recorded a non-cash goodwill impairment charge of $34.3 million related to the Management and Rental segment. Prior to the impairment, our total goodwill was $514.1 million of which $39.4 million, or 7.7%, pertained to the Management and Rental reporting unit.
Amortization Expense of Intangibles
| |
Year Ended December 31, | |||||||||||||||
|---|---|---|---|---|---|---|---|---|---|---|---|---|---|---|---|---|
| |
2010 | % Change | 2009 | % Change | 2008 | |||||||||||
| |
(Dollars in thousands) |
|||||||||||||||
Amortization expense of intangibles |
$ | 26,387 | 1.6 | $ | 25,961 | 0.2 | $ | 25,906 | ||||||||
As a percentage of total revenue |
6.4 | % | NM | 6.4 | % | 2.9 | 6.2 | % | ||||||||
2010 Compared to 2009
Amortization expense of intangibles in 2010 was generally consistent with the 2009 period for both the Membership and Exchange and Management and Rental segments.
2009 Compared to 2008
Amortization expense of intangibles for 2009 was generally consistent with the 2008 period for both the Membership and Exchange and Management and Rental segments.
Depreciation Expense
| |
Year Ended December 31, | |||||||||||||||
|---|---|---|---|---|---|---|---|---|---|---|---|---|---|---|---|---|
| |
2010 | % Change | 2009 | % Change | 2008 | |||||||||||
| |
(Dollars in thousands) |
|||||||||||||||
Depreciation expense |
$ | 10,537 | 7.0 | $ | 9,851 | 5.5 | $ | 9,335 | ||||||||
As a percentage of total revenue |
2.6 | % | 5.8 | 2.4 | % | 8.3 | 2.3 | % | ||||||||
2010 Compared to 2009
Depreciation expense for 2010 as compared to 2009 increased $0.7 million primarily due to depreciable assets related to IT initiatives, placed in service subsequent to December 31, 2009.
44
2009 Compared to 2008
Depreciation expense for 2009 as compared to 2008 increased $0.5 million primarily due to depreciable assets related to IT initiatives, placed in service subsequent to December 31, 2008.
Operating Income
| |
Year Ended December 31, | |||||||||||||||
|---|---|---|---|---|---|---|---|---|---|---|---|---|---|---|---|---|
| |
2010 | % Change | 2009 | % Change | 2008 | |||||||||||
| |
(Dollars in thousands) |
|||||||||||||||
Membership and Exchange |
$ | 105,634 | 2.2 | $ | 103,396 | (3.4 | ) | $ | 107,032 | |||||||
Management and Rental |
(1,157 | ) | (25.4 | ) | (1,550 | ) | (95.0 | ) | (30,741 | ) | ||||||
Total operating income |
$ | 104,477 | 2.6 | $ | 101,846 | 33.5 | $ | 76,291 | ||||||||
As a percentage of total revenue |
25.5 | % | 1.5 | 25.2 | % | 37.1 | 18.3 | % | ||||||||
2010 Compared to 2009
Operating income in 2010 increased $2.6 million from the comparable period in 2009 primarily due to an increase in gross profit of $3.6 million attributable to an increase in revenue of $4.5 million and improved margin excluding pass-through revenue, and a decrease of $1.3 million in selling and marketing expense due to cost efficiencies. This was partially offset by increases of $1.1 million in general and administrative expense and $1.1 million of depreciation and amortization expense.
Operating income for our Membership and Exchange segment increased $2.2 million to $105.6 million in 2010 from $103.4 million in 2009 largely due to improved margin. The decrease in operating losses of $0.4 million at our Management and Rental segment is primarily due to an increase in gross profit, offset by increases in selling and marketing, general and administrative and depreciation expense. In the first half of 2010, Aston was adversely impacted by ramp-up and seasonality related to the mainland properties acquired subsequent to September 30, 2009.
2009 Compared to 2008
Operating income in 2009 increased $25.6 million from 2008, primarily due to a fourth quarter 2008 goodwill impairment charge of $34.3 million in our Management and Rental segment. Excluding this 2008 impairment charge, operating income decreased $8.7 million in 2009 due to increases of $1.8 million in non-cash compensation expense, as discussed above, and $2.9 million of stand-alone and public company costs, and a decrease in gross profit of $2.1 million. The remaining difference mainly relates to increased sales and marketing and general and administrative expenses.
Operating income for our Membership and Exchange segment decreased $3.6 million to $103.4 million in 2009 from $107.0 million in 2008. Excluding the effect of the unfavorable foreign currency translation of $1.7 million resulting from the strengthening of the U.S. dollar, the Membership and Exchange segment operating income in constant currency would have decreased by $1.9 million, or 1.8%, in 2009 compared to 2008.
The change in operating income at the Management and Rental segment is due to the $34.3 million goodwill impairment charge in 2008 and a decrease in gross profit, offset by a decrease in selling and marketing expense.
45
Earnings Before Interest, Taxes, Depreciation and Amortization
Earnings Before Interest, Taxes, Depreciation and Amortization ("EBITDA") is a non-GAAP measure and is defined in "ILG's Principles of Financial Reporting."
| |
Year Ended December 31, | |||||||||||||||
|---|---|---|---|---|---|---|---|---|---|---|---|---|---|---|---|---|
| |
2010 | % Change | 2009 | % Change | 2008 | |||||||||||
| |
(Dollars in thousands) |
|||||||||||||||
Membership and Exchange |
$ | 145,753 | 1.7 | $ | 143,281 | (1.2 | ) | $ | 145,058 | |||||||
Management and Rental |
5,763 | 16.4 | 4,950 | (48.2 | ) | 9,548 | ||||||||||
Total EBITDA |
$ | 151,516 | 2.2 | $ | 148,231 | (4.1 | ) | $ | 154,606 | |||||||
As a percentage of total revenue |
37.0 | % | 1.1 | 36.6 | % | (1.6 | ) | 37.2 | % | |||||||
2010 Compared to 2009
EBITDA in 2010 increased $3.3 million from 2009, or 2.2%, consisting of increases of $2.5 million and $0.8 million from our Membership and Exchange and Management and Rental segments, respectively.
EBITDA from our Membership and Exchange segment increased $2.5 million to $145.8 million in 2010 from $143.3 million in 2009. The increase in this segment is due to an increase in operating income of $2.5 million, excluding depreciation, amortization and non-cash compensation expense. The overall increase in operating income from our Membership and Exchange segment is primarily due to lower operating expenses resulting from lower compensation and other employee related costs due to lower operational headcount, lower membership fulfillment related expenses, and lower selling and marketing costs related to cost efficiencies in the printing of directories, partly offset by an increase in general and administrative expenses.
EBITDA from our Management and Rental segment increased $0.8 million to $5.8 million in 2010 from $5.0 million in 2009. The increase in this segment is due to an increase in operating income of $0.8 million, excluding depreciation, amortization and non-cash compensation expense. The overall increase in operating income from our Management and Rental segment is primarily due to an increase in gross profit, partly offset by increases in operating expenses.
2009 Compared to 2008
EBITDA in 2009 decreased $6.4 million, or 4.1% from 2008, of which the Management and Rental segment contributed $4.6 million of the decrease.
EBITDA from our Membership and Exchange segment decreased $1.8 million to $143.3 million in 2009 from $145.1 million in 2008. The decrease in the Membership and Exchange segment is primarily due to increases of $5.2 million in selling and marketing and general and administrative expenses combined, excluding non-cash compensation, offset by an increase of $3.5 million in gross profit. Increases in general and administrative expenses include $3.0 million of incremental stand-alone and public company costs. In 2009, excluding the effect of the unfavorable currency translations of $1.8 million resulting from the strengthening of the U.S. dollar, the Membership and Exchange segment EBITDA in constant currency would have been consistent with 2008.
EBITDA from our Management and Rental segment decreased $4.6 million to $5.0 million in 2009 from $9.5 million in 2008. The decrease in this segment is due to a decrease in operating income of $4.6 million, excluding the goodwill impairment, depreciation, amortization, and non-cash compensation expense. The Management and Rental segment continues to be adversely impacted by general consumer macroeconomic conditions which have caused a reduction in demand.
46
Other Income (Expense)
| |
Year Ended December 31, | |||||||||||||||
|---|---|---|---|---|---|---|---|---|---|---|---|---|---|---|---|---|
| |
2010 | % Change | 2009 | % Change | 2008 | |||||||||||
| |
(Dollars in thousands) |
|||||||||||||||
Interest income |
$ | 448 | (52.9 | ) | $ | 952 | (91.7 | ) | $ | 11,532 | ||||||
Interest expense |
(35,782 | ) | (4.0 | ) | (37,281 | ) | 135.2 | (15,851 | ) | |||||||
Other income (expense), net |
(271 | ) | (78.3 | ) | (1,250 | ) | (131.1 | ) | 4,022 | |||||||
2010 Compared to 2009
Interest income decreased $0.5 million in 2010 compared to 2009, primarily due to generally lower interest rates in 2010, partially offset by higher average cash balances in 2010.
Interest expense in 2010 primarily relates to interest and amortization of debt costs on the indebtedness incurred in connection with the spin-off. The senior notes were initially recorded with an original issue discount of $23.5 million based on the prevailing interest rate at the time of pricing, estimated at 11.0%, of which $2.3 million and $2.0 million was amortized in 2010 and 2009, respectively. Lower interest expense in 2010 is due to the lower principal balance outstanding on the term loan and slightly lower interest rates.
Other expense, net primarily relates to losses on foreign currency exchange related to cash held in certain countries in currencies other than their local currency. The unfavorable fluctuations in 2010 were principally driven by U.S. dollar positions held at December 31, 2010 affected by the weaker dollar compared to the Colombian peso and the Mexican peso, partly offset by the stronger dollar compared to the British pound. The unfavorable fluctuations in 2009 were principally driven by the weaker dollar compared to the Colombian peso, the Mexican peso and the British pound.
2009 Compared to 2008
Interest income decreased $10.6 million in 2009 compared to 2008, primarily due to $8.2 million of interest earned on the receivable from IAC and subsidiaries in 2008 which was extinguished in connection with the spin-off and generally lower interest rates, somewhat offset by higher average cash balances in 2009.
Interest expense in 2009 primarily relates to interest and the amortization of debt costs on the $300.0 million face value 9.5% senior notes issued and the senior secured credit facility, which includes a $150.0 million term loan and a $50.0 million revolving credit facility, entered into in connection with the spin-off on August 20, 2008. The senior notes were initially recorded with original issue discount of $23.5 million based on the prevailing interest rate at the time of pricing, estimated at 11.0%, of which $2.0 million was amortized in 2009.
Other income (expense) primarily relates to gain (loss) on foreign currency exchange related to cash held in certain countries in currencies other than their local currency. Unfavorable fluctuations in currency exchange rates caused a net loss in 2009 and favorable fluctuations in currency exchange rates caused a net gain in 2008. As noted above, the unfavorable fluctuations in 2009 were principally driven by the weaker dollar compared to the Colombian peso, Mexican peso and the British pound. The favorable fluctuations in 2008 were principally driven by the stronger dollar compared to the Columbian peso, Mexican peso and the British pound.
47
Income Tax Provision
2010 Compared to 2009
For the years ended December 31, 2010 and 2009, ILG recorded tax provisions of $26.5 million and $26.1 million, respectively, which represent effective tax rates of 38.4% and 40.5%, respectively. These tax rates are higher than the federal statutory rate of 35% due to state and local income taxes partially offset by foreign income taxed at lower rates. In addition, as it relates to 2010, ILG recorded income taxes associated with non-deductible non-cash compensation of $0.5 million, partially offset by $0.1 million of U.S. tax consequences of certain of ILG's foreign operations and other income tax items. As it relates to 2009, ILG recorded income taxes associated with non-deductible non-cash compensation expense of $1.2 million as well as other income tax items of $0.3 million.
As of December 31, 2010 and 2009, ILG had unrecognized tax benefits of $1.0 million and $0.1 million, respectively. Included in the balance of unrecognized tax benefits as of December 31, 2010 and 2009, are $0.3 million and $0.1 million, respectively, of tax benefits that, if recognized, would affect the effective tax rate. Also included in the balance of unrecognized tax benefits as of December 31, 2010 is $0.7 million that represents unrecognized tax benefits related to the acquisition of TPI. In connection with our acquisition of TPI, the former shareholders have agreed to indemnify us for all tax liabilities and related interest and penalties for the pre-acquisition period. The net increase of $0.9 million in 2010 in unrecognized tax benefits is due principally to the increase of $0.7 million in foreign taxes as a result of ILG's acquisition of TPI and an increase of $0.2 million related to other income tax items. There were no material increases or decreases in unrecognized tax benefits during 2009.
ILG recognizes interest and, if applicable, penalties related to unrecognized tax benefits in income tax expense. During 2010, $0.7 million in interest and penalties was accrued primarily related to foreign taxes as a result of the acquisition of TPI. There were no material accruals for interest during 2009. At December 31, 2010 and 2009, ILG has accrued $0.9 million and $0.2 million, respectively, for the payment of interest and, if applicable, penalties.
ILG believes that it is reasonably possible that its unrecognized tax benefits could decrease by approximately $0.1 million within twelve months of the current reporting date due primarily to the expiration of the statute of limitations related to foreign taxes. An estimate of other changes in unrecognized tax benefits cannot be made, but is not expected to be significant.
By virtue of previously filed separate company and consolidated tax returns with IAC, ILG is routinely under audit by federal, state, local and foreign taxing authorities. These audits include questioning the timing and the amount of deductions and the allocation of income among various tax jurisdictions. Income taxes payable include amounts considered sufficient to pay assessments that may result from examination of prior year returns; however, the amount paid upon resolution of issues raised may differ from the amount provided. Differences between the reserves for tax contingencies and the amounts owed by ILG are recorded in the period they become known. Under the Tax Sharing Agreement, IAC indemnifies ILG for all consolidated tax liabilities and related interest and penalties for the pre-spin period. During the fourth quarter 2010, the IRS also began its examination of ILG's Federal consolidated tax return for the short period following the spin-off and ended December 31, 2008. This examination is still in its initial phase and is expected to be completed prior to the expiration of the statute of limitations in 2012.
During 2010, the U.K. Finance Act of 2010 was enacted, which reduced the U.K. corporate income tax rate from 28% to 27%, effective April 1, 2011. The impact of the U.K. rate reduction, which was not significant to ILG's effective tax rate, has been reflected in the current reporting period. It reduced our U.K. net deferred tax asset and increased income tax expense. The change in the corporate tax rate initially negatively impacts income tax expense as the future benefit expected to be realized from our
48
U.K. net deferred tax assets decreases; however, going forward, the lower corporate tax rate will decrease income tax expense and favorably impact our effective tax rate.
The U.K. government has also indicated that it intends to enact future reductions in the corporate tax rate of 1% each year until the rate reaches 24% on April 1, 2014. The future 1% corporate income tax rate reductions are expected to have a similar impact on our financial statements as outlined above; however, the actual impact will be dependent on our deferred tax position at that time.
2009 Compared to 2008
For the years ended December 31, 2009 and 2008, ILG recorded tax provisions of $26.1 million and $30.8 million, respectively, which represent effective tax rates of 40.5% and 40.6%, respectively. These tax rates are higher than the federal statutory rate of 35% due to state and local income taxes partially offset by foreign income taxed at lower rates. In addition, as it relates to 2009, ILG recorded income taxes associated with non-deductible non-cash compensation expense of $1.2 million as well as other income tax items of $0.3 million. As it relates to 2008, ILG recorded income taxes associated with the U.S. tax consequences of certain of ILG's foreign operations of $2.4 million and other income tax items of $0.5 million.
As of December 31, 2009 and 2008, ILG had unrecognized tax benefits of $0.1 million. There were no material increases or decreases in unrecognized tax benefits during 2009. ILG recognizes interest and, if applicable, penalties related to unrecognized tax benefits in income tax expense. There were no material accruals for interest during 2009. At December 31, 2009 and 2008, ILG has accrued $0.2 million and $0.3 million, respectively, for the payment of interest and penalties. The amount of unrecognized tax benefits and accrued interest and penalties at December 31, 2008, is net of consolidated tax liabilities and related interest and penalties that were indemnified by IAC as a result of the spin-off and the associated Tax Sharing Agreement.
FINANCIAL POSITION, LIQUIDITY AND CAPITAL RESOURCES
As of December 31, 2010, we had $184.6 million of cash and cash equivalents and restricted cash and cash equivalents, including $56.4 million of U.S. dollar equivalent cash deposits held in foreign jurisdictions, principally the U.K. which are subject to changes in foreign exchange rates. Earnings of foreign subsidiaries, except Venezuela, are permanently reinvested. Additional tax provisions would be required should such earnings be repatriated to the U.S. Cash generated by operations is used as our primary source of liquidity. We believe that our cash on hand along with our anticipated operating future cash flows and availability under our $50.0 million revolving credit facility are sufficient to fund our operating needs, capital expenditures, development and expansion of our operations, debt service, investments and other commitments and contingencies for at least the next twelve months. However, our operating cash flow may be impacted by macroeconomic factors outside of our control.
Cash Flows Discussion
Net cash provided by operating activities increased to $91.4 million in 2010 from $87.3 million in 2009, a decrease from $103.9 million in 2008. The increase of $4.1 million in 2010 from 2009 was principally due to a $5.0 million payment made in the 2009 period in connection with a long-term service agreement entered into in 2009 and a $2.4 million decrease of interest payments, excluding capitalized interest, all partially offset by payments of $1.3 million made in 2010 in connection with long-term service agreements, lower interest income of $0.5 million in 2010 and overall higher cash expenses. Lower interest payments in 2010 are due to the lower principal balance outstanding, slightly lower interest rates and to the timing of certain interest payments in 2009. The decrease of $16.6 million in 2009 from 2008 was principally due to an increase in interest payments of $31.7 million, lower interest income of $10.6 million and a reduction in cash receipts, partially offset by lower income taxes paid, net of refunds, of $29.6 million and lower cash expenses.
49
Net cash used in investing activities of $28.4 million in 2010 resulted from capital expenditures of $16.4 million and the TPI acquisition, net of cash acquired, of $12.9 million, slightly offset by a $1.0 million decrease in restricted cash, related to a collateral agreement for merchant transactions in the United Kingdom that was no longer required. In 2009, net cash used in investing activities of $13.8 million resulted from capital expenditures of $15.2 million, slightly offset by a decrease in the restricted cash of $1.4 million related to a collateral agreement for merchant transactions in the United Kingdom. In 2008, net cash used in investing activities was $85.5 million of which $68.6 million related to cash transfers to IAC and $13.6 million related to capital expenditures and $2.2 million related to an increase in restricted cash related to the collateral agreement in the United Kingdom. The cash transfers to IAC related to IAC's centrally managed U.S. treasury function through the spin-off. The increase in capital expenditures is primarily related to IT initiatives.
Net cash used in financing activities of $41.2 million was principally due to voluntary principal prepayments of $40.0 million on the term loan and vesting of restricted stock units net of withholding taxes, net of excess tax benefits from stock-based awards and proceeds from the exercise of warrants and stock options. In 2009, net cash used in financing activities of $34.7 million was principally due to principal payments of $34.0 million on the term loan and the vesting of restricted stock units, net of withholding taxes. In 2008, net cash provided by financing activities of $50.0 million was principally due to the proceeds of the issuance of the term loan of $150.0 million offset by the divided payment to IAC in connection with the spin-off of $89.4 million and debt issuance costs of $10.6 million.
We have a senior secured credit facility which matures on July 25, 2013 and consists of a $50.0 million revolving credit facility (the "Revolver") and $150.0 million term loan (the "Term Loan"). During 2009, we paid $34.0 million of principal payments on the Term Loan, which included scheduled principal payments through December 31, 2010 and $4.0 million which was applied pro rata to the remaining scheduled principal payments. During 2010, we paid $40.0 million of principal payments on the Term Loan which included voluntary prepayments of scheduled principal payments through December 31, 2011 and $18.3 million which was applied pro rata to the remaining scheduled principal payments. As of December 31, 2010, we had $76.0 million outstanding on the Term Loan. There have been no borrowings under the Revolver through December 31, 2010. In addition, on August 19, 2008, we issued $300.0 million of aggregate principal amounts of 9.5% Senior Notes due 2016 (the "Interval Senior Notes"), reduced by the original issue discount of $23.5 million of which $18.4 million remains unamortized at December 31, 2010. The secured credit facility effectively ranks prior to the Interval Senior Notes to the extent of the value of the assets that secure it.
The Interval Senior Notes and senior secured credit facility have various financial and operating covenants that place significant restrictions on us, including our ability to incur additional indebtedness, to incur additional liens, issue redeemable stock and preferred stock, pay dividends or distributions or redeem or repurchase capital stock, prepay, redeem or repurchase debt, make loans and investments, enter into agreements that restrict distributions from our subsidiaries, sell assets and capital stock of our subsidiaries, enter into certain transactions with affiliates and consolidate or merge with or into or sell substantially all of our assets to another person. The senior secured credit facility requires us to meet certain financial covenants, requiring the maintenance of a maximum consolidated leverage ratio of consolidated debt over consolidated EBITDA, as defined in the credit agreement (3.90 through December 31, 2009, 3.65 from January 1, 2010 through December 31, 2010 and 3.40 thereafter), and a minimum consolidated interest coverage ratio of consolidated EBITDA over consolidated interest expense, as defined in the credit agreement (2.75 through December 31, 2009 and 3.00 thereafter). In addition, we may be required to use a portion of our consolidated excess cash flow (as defined in the credit agreement) to prepay the senior secured credit facility based on our consolidated leverage ratio at the end of each fiscal year. If our consolidated leverage ratio equals or exceeds 3.5, we must prepay 50% of consolidated excess cash flow, if our consolidated leverage ratio equals or exceeds 2.85 but is less than 3.5, we must prepay 25% of consolidated excess cash flow, and if our consolidated leverage
50
ratio is less than 2.85, then no prepayment is required. As of December 31, 2010, we were in compliance in all material respects with the requirements of all applicable financial and operating covenants and our consolidated leverage ratio and consolidated interest coverage ratio under the credit agreement were 2.47 and 4.61, respectively.
We have funding commitments that could potentially require our performance in the event of demands by third parties or contingent events. At December 31, 2010, guarantees, surety bonds and letters of credit totaled $21.2 million. Guarantees represent $18.4 million of this total and primarily relate to the Management and Rental segment's hotel and resort management agreements of Aston, including those with guaranteed dollar amounts, and accommodation leases supporting the Aston management activities, entered into on behalf of the property owners for which either party may terminate such leases upon 60 days prior written notice to the other. In addition, certain of the Management and Rental segment's hotel and resort management agreements of Aston provide that owners receive specified percentages of the revenue generated under Aston management. In these cases, the operating expenses for the rental operations are paid from the revenue generated by the rentals, the owners are then paid their contractual percentages, and the Management and Rental segment either retains the balance (if any) as its management fee or makes up the deficit. Although such deficits are reasonably possible in a few of these agreements, as of December 31, 2010, amounts are not expected to be significant, individually or in the aggregate. Aston also enters into agreements, as principal, for services purchased on behalf of property owners for which it is subsequently reimbursed. As such, Aston is the primary obligor and may be liable for unreimbursed costs. As of December 31, 2010, amounts pending reimbursements are not significant.
Venezuela Operations
We conduct business in Venezuela where currency restrictions exist limiting our ability to immediately access cash through repatriations at the government's official exchange rate. These funds remain available for use within this jurisdiction and are not restricted.
During 2009, the process of exchanging Venezuelan bolivars to U.S. dollars became increasingly challenging as the government's approval process significantly slowed and became more rigorous. Due to the currency restrictions, a "parallel" market existed whereby entities could exchange Venezuelan bolivars into U.S. dollars through a series of market transactions at a specified, and less favorable, parallel market rate. At December 31, 2009, we determined the parallel market rate was the appropriate rate to use for translating the financial statements of our Venezuelan entity for purposes of consolidation based on the then current facts and circumstances of operating in Venezuela. In April 2010, we transferred U.S. dollar equivalent cash of $1.7 million from our Venezuelan entity's Bolivar denominated bank account in Venezuela to our Venezuelan entity's U.S. dollar denominated bank account in the U.S., utilizing the parallel market.
Effective January 1, 2010, Venezuela is considered to be highly inflationary. Under U.S. GAAP, an economy is considered to be highly inflationary when the three-year cumulative rate of inflation meets or exceeds 100%. Under the highly inflationary basis of accounting, the financial statements of our Venezuelan entity are remeasured as if its functional currency were the reporting currency (U.S. dollars), with remeasurement gains and losses recognized in earnings, rather than in the cumulative translation adjustment component of other comprehensive income within our stockholders' equity.
In May 2010, the Venezuelan government enacted reforms to its exchange regulations which increased the control that can be exerted by the Central Bank of Venezuela (BCV) over currency trading and effectively halted the use of the parallel market pending additional regulations. In June 2010, the government introduced additional regulations under a newly regulated foreign currency exchange system (the "SITME") controlled by the BCV. After the enactment of the amended exchange regulations (and cessation of the parallel market), the only foreign currency exchange processes legally
51
available to entities operating in Venezuela are (1) the exchange of currency through Venezuela's Commission for the Administration of Currency Exchange (CADIVI) at one of the two official rates for exchange or (2) the exchange of currency through the SITME at the exchange rate specified by the BCV. Given our historical difficulties in repatriating U.S. dollars at the government's official exchange rate through CADIVI and the closure in May 2010 of the parallel market, effective June 2010 we determined the exchange rate specified by the BCV to transact through the SITME (the "SITME rate") was the most appropriate rate to use for remeasurement purposes at this time. Consequently, in June 2010, we commenced utilizing the SITME rate which was 5.3 bolivars per U.S. dollar at the inception of the SITME and through September 30, 2010. The last available parallel market rate utilized prior to our conversion to the SITME rate was 8.3 bolivars per U.S. dollar. Our change to the SITME rate during June 2010 resulted in a gain on foreign currency exchange of $0.3 million in that month. This gain was partially offset by previous losses during the second quarter, and fully offset during the six month period ended June 30, 2010, due to the weakening parallel market rate utilized throughout 2010 prior to our change to the SITME rate. The use of the SITME is subject to restrictions, including the requirement of domicile in Venezuela and volume restrictions on an entity's trading activity.
Because our Venezuelan entity operates in a highly inflationary economy, and given the uncertainty surrounding future BCV regulations or changes to the SITME rate, future remeasurements could increase the volatility of our results of operations. However, since the majority of the cash is now held in U.S. dollars, our exposure to this volatility is reduced.
Additionally, during the second quarter 2010, we restructured the operations of our Venezuelan entity to address the increasing challenges of physically operating in the country. As a result, we incurred certain immaterial restructuring and severance costs during the second and third quarters of 2010. However, we have not sold or substantially liquidated our Venezuelan entity as it continues to operate.
As of December 31, 2010, we had $5.1 million of unrealized loss in other comprehensive income within stockholders' equity pertaining to our Venezuelan entity until such time we sell or substantially liquidate our investment. For the year ended December 31, 2010, our Venezuelan entity generated less than 0.5% of our consolidated net revenues and as of December 31, 2010 represented less than 0.5% of our consolidated assets.
Contractual obligations and commercial commitments
Contractual obligations and commercial commitments at December 31, 2010 are as follows:
| |
Payments Due by Period | ||||||||||||||||
|---|---|---|---|---|---|---|---|---|---|---|---|---|---|---|---|---|---|
Contractual Obligations
|
Total | Up to 1 year |
1-3 years | 3-5 years | More than 5 years |
||||||||||||
| |
(Dollars in thousands) |
||||||||||||||||
Debt principal(a) |
$ | 376,000 | $ | — | $ | 76,000 | $ | — | $ | 300,000 | |||||||
Debt interest(a) |
166,939 | 30,881 | 60,058 | 57,000 | 19,000 | ||||||||||||
Purchase obligations(b) |
26,673 | 10,669 | 6,628 | 8,850 | 526 | ||||||||||||
Operating leases |
59,190 | 10,240 | 16,359 | 12,247 | 20,344 | ||||||||||||
Total contractual obligations |
$ | 628,802 | $ | 51,790 | $ | 159,045 | $ | 78,097 | $ | 339,870 | |||||||
- (a)
- Debt principal and debt interest represent principal and interest to be paid on our Term Loan, Interval Senior Notes and certain fees associated with our credit facility. Interest on the Term Loan is calculated using the prevailing rates as of December 31, 2010.
52
- (b)
- The purchase obligations primarily relate to future guaranteed purchases of rental inventory, operational support services and membership fulfillment benefits.
| |
Amount of Commitment Expiration Per Period | |||||||||||||||
|---|---|---|---|---|---|---|---|---|---|---|---|---|---|---|---|---|
Other Commercial Commitments(c)
|
Total Amounts Committed |
Less than 1 year |
1-3 years | 3-5 years | More than 5 years |
|||||||||||
| |
(Dollars in thousands) |
|||||||||||||||
Guarantees, surety bonds and letters of credit |
$ | 21,238 | $ | 8,828 | $ | 4,815 | $ | 3,493 | $ | 4,102 | ||||||
- (c)
- Commercial commitments include minimum revenue guarantees related to Aston's hotel and resort management agreements, Aston's accommodation leases entered into on behalf of the property owners, and funding commitments that could potentially require performance in the event of demands by third parties or contingent events, such as under a letter of credit extended or under guarantees.
Off-Balance Sheet Arrangements
Except as disclosed above related to guarantees, as of December 31, 2010, we did not have any significant off-balance sheet arrangements, as defined in Item 303(a) (4) (ii) of SEC Regulation S-K.
Recent Accounting Pronouncements
Refer to Note 2 in the consolidated financial statements for a description of recent accounting pronouncements.
Seasonality
Refer to Note 1 in the consolidated financial statements for a discussion on the impact of seasonality.
ILG'S PRINCIPLES OF FINANCIAL REPORTING
Definition of ILG's Non-GAAP Measures
Earnings Before Interest, Taxes, Depreciation and Amortization is defined as net income excluding, if applicable: (1) non-cash compensation expense, (2) depreciation expense, (3) amortization expense of intangibles, (4) goodwill and asset impairments, (5) income taxes, (6) interest income and interest expense and (7) other non-operating income and expense. Our presentation of EBITDA may not be comparable to similarly-titled measures used by other companies. We believe this measure is useful to investors because it represents the consolidated operating results from our segments, excluding the effects of any non-cash expenses. We also believe this non-GAAP financial measure improves the transparency of our disclosures, provides a meaningful presentation of our results from our business operations, excluding the impact of certain items not related to our core business operations and improves the period to period comparability of results from business operations. EBITDA has certain limitations in that it does not take into account the impact to our statement of operations of certain expenses, including non-cash compensation. We endeavor to compensate for the limitations of the non-GAAP measure presented by also providing the comparable GAAP measure with equal or greater prominence and descriptions of the reconciling items, including quantifying such items, to derive the non-GAAP measure.
We report EBITDA as a supplemental measure to generally accepted accounting principles ("GAAP"). This measure is one of the primary metrics by which we evaluate the performance of our businesses, on which our internal budgets are based and by which management is compensated. We
53
believe that investors should have access to the same set of tools that we use in analyzing our results. This non-GAAP measure should be considered in addition to results prepared in accordance with GAAP, but should not be considered a substitute for or superior to GAAP results. We provide and encourage investors to examine the reconciling adjustments between the GAAP and non-GAAP measure which are discussed below.
Constant currency represents current period results of operations determined by translating our functional currency results to U.S. dollars (our reporting currency) using the actual blended rate of translation from the comparable prior period. We believe that the presentation of our results of operations excluding the effect of foreign currency translations serves to enhance the understanding of our performance, improves transparency of our disclosures, provides meaningful presentations of our results from our business operations by excluding this effect not related to our core business operations and improves the period to period comparability of results from business operations.
Pro Forma Results
We will only present EBITDA on a pro forma basis if we view a particular transaction as significant in size or transformational in nature. For the periods presented in this report, there are no transactions that we have included on a pro forma basis.
Non-Cash Expenses That Are Excluded From ILG's Non-GAAP Measure
Non-cash compensation expense consists principally of expense associated with the grants, including unvested grants assumed in acquisitions, of restricted stock, restricted stock units and stock options. These expenses are not paid in cash, and we will include the related shares in our future calculations of diluted shares of stock outstanding. Upon vesting of restricted stock and restricted stock units and the exercise of certain stock options, the awards will be settled, at our discretion, on a net basis, with us remitting the required tax withholding amount from our current funds.
Goodwill and asset impairments are non-cash expenses relating to adjustments to goodwill and long-lived assets whereby the carrying value exceeds the fair value of the related assets, and are infrequent in nature.
Amortization expense of intangibles is a non-cash expense relating primarily to acquisitions. At the time of an acquisition, the intangible assets of the acquired company, such as customer relationships, purchase agreements and resort management agreements are valued and amortized over their estimated lives. We believe that since intangibles represent costs incurred by the acquired company to build value prior to acquisition, they were part of transaction costs.
Depreciation expense is a non-cash expense relating to our property and equipment and does not relate to our core business operations. Depreciation expense is recorded on a straight-line basis to allocate the cost of depreciable assets to operations over their estimated service lives.
54
The following tables reconcile EBITDA to operating income for our operating segments and to net income attributable to common stockholders in total for the years ended December 31, 2010, 2009 and 2008 (in thousands). The noncontrolling interest relates to the Management and Rental segment.
| |
Year Ended December 31, 2010 | |||||||||||||||
|---|---|---|---|---|---|---|---|---|---|---|---|---|---|---|---|---|
| |
EBITDA | Non-Cash Compensation Expense |
Amortization Expense of Intangibles |
Depreciation Expense |
Operating Income (Loss) |
|||||||||||
Membership and Exchange |
$ | 145,753 | $ | (9,346 | ) | $ | (21,083 | ) | $ | (9,690 | ) | $ | 105,634 | |||
Management and Rental |
5,763 | (769 | ) | (5,304 | ) | (847 | ) | (1,157 | ) | |||||||
Total |
$ | 151,516 | $ | (10,115 | ) | $ | (26,387 | ) | $ | (10,537 | ) | 104,477 | ||||
Interest expense, net |
(35,334 | ) | ||||||||||||||
Other expense, net |
(271 | ) | ||||||||||||||
Earnings before income taxes and noncontrolling interest |
68,872 | |||||||||||||||
Income tax provision |
(26,457 | ) | ||||||||||||||
Net income |
42,415 | |||||||||||||||
Net loss attributable to noncontrolling interest |
3 | |||||||||||||||
Net income attributable to common stockholders |
$ | 42,418 | ||||||||||||||
| |
Year Ended December 31, 2009 | |||||||||||||||
|---|---|---|---|---|---|---|---|---|---|---|---|---|---|---|---|---|
| |
EBITDA | Non-Cash Compensation Expense |
Amortization Expense of Intangibles |
Depreciation Expense |
Operating Income (Loss) |
|||||||||||
Membership and Exchange |
$ | 143,281 | $ | (9,811 | ) | $ | (21,017 | ) | $ | (9,057 | ) | $ | 103,396 | |||
Management and Rental |
4,950 | (762 | ) | (4,944 | ) | (794 | ) | (1,550 | ) | |||||||
Total |
$ | 148,231 | $ | (10,573 | ) | $ | (25,961 | ) | $ | (9,851 | ) | 101,846 | ||||
Interest expense, net |
(36,329 | ) | ||||||||||||||
Other expense, net |
(1,250 | ) | ||||||||||||||
Earnings before income taxes and noncontrolling interest |
64,267 | |||||||||||||||
Income tax provision |
(26,058 | ) | ||||||||||||||
Net income |
38,209 | |||||||||||||||
Net loss attributable to noncontrolling interest |
4 | |||||||||||||||
Net income attributable to common stockholders |
$ | 38,213 | ||||||||||||||
55
| |
Year Ended December 31, 2008 | ||||||||||||||||||
|---|---|---|---|---|---|---|---|---|---|---|---|---|---|---|---|---|---|---|---|
| |
EBITDA | Non-Cash Compensation Expense |
Goodwill Impairment |
Amortization Expense of Intangibles |
Depreciation Expense |
Operating Income (Loss) |
|||||||||||||
Membership and Exchange |
$ | 145,058 | $ | (8,474 | ) | $ | — | $ | (20,960 | ) | $ | (8,592 | ) | $ | 107,032 | ||||
Management and Rental |
9,548 | (346 | ) | (34,254 | ) | (4,946 | ) | (743 | ) | (30,741 | ) | ||||||||
Total |
$ | 154,606 | $ | (8,820 | ) | $ | (34,254 | ) | $ | (25,906 | ) | $ | (9,335 | ) | 76,291 | ||||
Interest expense, net |
(4,319 | ) | |||||||||||||||||
Other income, net |
4,022 | ||||||||||||||||||
Earnings before income taxes and noncontrolling interest |
75,994 | ||||||||||||||||||
Income tax provision |
(30,816 | ) | |||||||||||||||||
Net income |
45,178 | ||||||||||||||||||
Net loss attributable to noncontrolling interest |
86 | ||||||||||||||||||
Net income attributable to common stockholders |
$ | 45,264 | |||||||||||||||||
Item 7A. Quantitative and Qualitative Disclosures about Market Risk
Foreign Currency Exchange Risk
We conduct business in certain foreign markets, primarily in the United Kingdom and the European Union. Our foreign currency risk primarily relates to our investments in foreign subsidiaries that transact business in a functional currency other than the U.S. Dollar. This exposure is mitigated as we have generally reinvested profits in our international operations. As currency exchange rates change, translation of the income statements of our international businesses into U.S. dollars affects year-over-year comparability of operating results.
In addition, we are exposed to foreign currency risk related to transactions and/or assets and liabilities denominated in a currency other than the functional currency. Historically, we have not hedged currency risks. For the year ended December 31, 2010, operating foreign exchange attributable to foreign currency remeasurements of operating assets and liabilities denominated in a currency other than their functional currency, primarily related to Euro denominated Value Added Tax liabilities, resulted in a net gain of $0.2 million. Non-operating foreign exchange included net losses of $0.3 million and $1.3 million for the years ended December 31, 2010 and 2009, respectively, and a net gain of $4.0 million for the year ended December 31, 2008. These net gain and losses were attributable to cash held in certain countries in currencies other than their functional currency. This was principally driven by U.S. dollar positions held at December 31, 2010 and 2009 affected by the shift in the value of the dollar primarily to the British pound, Mexican peso, and Colombian peso. The Venezuelan Bolivar cash held impacted our foreign exchange net loss in 2010 given our change to the U.S. dollar as the functional currency for that entity due to highly inflationary accounting, partially offset by a gain realized in June 2010 due to our change from the parallel market rate to the SITME rate for remeasurement purposes, as more fully discussed in our Financial Position, Liquidity and Capital Resources section. However, in April 2010, we transferred the majority of the cash from our Venezuelan entity's Bolivar denominated bank account in Venezuela to our Venezuelan entity's U.S. dollar denominated bank account in the U.S. and consequently reduced the exposure going forward.
As we increase our operations in international markets we become increasingly exposed to potentially volatile movements in currency exchange rates. The economic impact of currency exchange rate movements on us is often linked to variability in real growth, inflation, interest rates, governmental actions and other factors. These changes, if material, could cause us to adjust our financing, operating and hedging strategies. A hypothetical 10% weakening/strengthening in foreign exchange rates to the U.S. dollar for the twelve months ended December 31, 2010 would result in an approximate change to
56
revenue of $3.3 million. There have been no material quantitative changes in market risk exposures since December 31, 2009.
Interest Rate Risk
At December 31, 2010, we had $76.0 million outstanding under the term loan facility. Based on the amount outstanding, a 100 basis point change in interest rates would result in an approximate change to interest expense of $0.8 million. Additionally, at December 31, 2010, we had $300.0 million (face amount) of Interval Senior Notes that bear interest at a fixed amount. As market rates have declined, the required payments on the fixed rate debt have exceeded those based on market rates. Based on our mix of fixed rate and floating rate debt and cash balances, we do not currently hedge our interest rate exposure. There have been no material quantitative changes in market risk exposures since December 31, 2009.
57
Item 8. Financial Statements and Supplementary Data
INTERVAL LEISURE GROUP, INC. AND SUBSIDIARIES
CONSOLIDATED FINANCIAL STATEMENTS
TABLE OF CONTENTS
58
Report of Independent Registered Public Accounting Firm
The Board of Directors and Stockholders of Interval Leisure Group, Inc.
We have audited the accompanying consolidated balance sheets of Interval Leisure Group, Inc. and subsidiaries as of December 31, 2010 and 2009, and the related consolidated statements of income, stockholders' equity, and cash flows for each of the three years in the period ended December 31, 2010. Our audits also included the financial statement schedule listed in the Index at Item 15(a). These financial statements and schedule are the responsibility of the Company's management. Our responsibility is to express an opinion on these financial statements and schedule based on our audits.
We conducted our audits in accordance with the standards of the Public Company Accounting Oversight Board (United States). Those standards require that we plan and perform the audit to obtain reasonable assurance about whether the financial statements are free of material misstatement. An audit includes examining, on a test basis, evidence supporting the amounts and disclosures in the financial statements. An audit also includes assessing the accounting principles used and significant estimates made by management, as well as evaluating the overall financial statement presentation. We believe that our audits provide a reasonable basis for our opinion.
In our opinion, the financial statements referred to above present fairly, in all material respects, the consolidated financial position of Interval Leisure Group, Inc. and subsidiaries at December 31, 2010 and 2009, and the consolidated results of their operations and their cash flows for each of the three years in the period ended December 31, 2010, in conformity with U.S. generally accepted accounting principles. Also, in our opinion, the related financial statement schedule, when considered in relation to the basic consolidated financial statements taken as a whole, presents fairly in all material respects the information set forth therein.
We have also audited, in accordance with the standards of the Public Company Accounting Oversight Board (United States), Interval Leisure Group, Inc. and subsidiaries' internal control over financial reporting as of December 31, 2010, based on criteria established in Internal Control-Integrated Framework issued by the Committee of Sponsoring Organizations of the Treadway Commission and our report dated March 8, 2011 expressed an unqualified opinion thereon.
/s/ ERNST & YOUNG LLP Certified Public Accountants |
Miami,
Florida
March 8, 2011
59
INTERVAL LEISURE GROUP, INC. AND SUBSIDIARIES
CONSOLIDATED STATEMENTS OF INCOME
(In thousands, except per share data)
| |
Year Ended December 31, | ||||||||||
|---|---|---|---|---|---|---|---|---|---|---|---|
| |
2010 | 2009 | 2008 | ||||||||
Revenue |
$ | 409,440 | $ | 404,986 | $ | 415,798 | |||||
Cost of sales (exclusive of depreciation and amortization shown separately below) |
128,304 | 127,406 | 136,075 | ||||||||
Gross profit |
281,136 | 277,580 | 279,723 | ||||||||
Selling and marketing expense |
50,755 | 52,029 | 51,463 | ||||||||
General and administrative expense |
88,980 | 87,893 | 82,474 | ||||||||
Goodwill impairment |
— | — | 34,254 | ||||||||
Amortization expense of intangibles |
26,387 | 25,961 | 25,906 | ||||||||
Depreciation expense |
10,537 | 9,851 | 9,335 | ||||||||
Operating income |
104,477 | 101,846 | 76,291 | ||||||||
Other income (expense): |
|||||||||||
Interest income |
448 | 952 | 11,532 | ||||||||
Interest expense |
(35,782 | ) | (37,281 | ) | (15,851 | ) | |||||
Other income (expense), net |
(271 | ) | (1,250 | ) | 4,022 | ||||||
Total other expense, net |
(35,605 | ) | (37,579 | ) | (297 | ) | |||||
Earnings before income taxes and noncontrolling interest |
68,872 | 64,267 | 75,994 | ||||||||
Income tax provision |
(26,457 | ) | (26,058 | ) | (30,816 | ) | |||||
Net income |
42,415 | 38,209 | 45,178 | ||||||||
Net loss attributable to noncontrolling interest |
3 | 4 | 86 | ||||||||
Net income attributable to common stockholders |
$ | 42,418 | $ | 38,213 | $ | 45,264 | |||||
Earnings per share attributable to common stockholders: |
|||||||||||
Basic |
$ | 0.75 | $ | 0.68 | $ | 0.81 | |||||
Diluted |
$ | 0.73 | $ | 0.67 | $ | 0.80 | |||||
Weighted average number of shares of common stock outstanding: |
|||||||||||
Basic |
56,898 | 56,411 | 56,189 | ||||||||
Diluted |
57,756 | 57,015 | 56,370 | ||||||||
The accompanying Notes to Consolidated Financial Statements are an integral part of these statements.
60
INTERVAL LEISURE GROUP, INC. AND SUBSIDIARIES
CONSOLIDATED BALANCE SHEETS
(In thousands, except share and per share data)
| |
December 31, 2010 |
December 31, 2009 |
||||||
|---|---|---|---|---|---|---|---|---|
ASSETS |
||||||||
Cash and cash equivalents |
$ | 180,502 | $ | 160,014 | ||||
Restricted cash and cash equivalents |
4,118 | 5,243 | ||||||
Accounts receivable, net of allowance of $213 and $431, respectively |
24,420 | 24,219 | ||||||
Deferred income taxes |
19,219 | 20,052 | ||||||
Deferred membership costs |
13,874 | 14,433 | ||||||
Prepaid income taxes |
8,539 | 5,221 | ||||||
Prepaid expenses and other current assets |
23,527 | 17,566 | ||||||
Total current assets |
274,199 | 246,748 | ||||||
Property and equipment, net |
50,900 | 44,400 | ||||||
Goodwill |
488,027 | 479,867 | ||||||
Intangible assets, net |
120,470 | 139,324 | ||||||
Deferred membership costs |
19,599 | 21,411 | ||||||
Deferred income taxes |
5,487 | 6,162 | ||||||
Other non-current assets |
24,366 | 20,669 | ||||||
TOTAL ASSETS |
$ | 983,048 | $ | 958,581 | ||||
LIABILITIES AND EQUITY |
||||||||
LIABILITIES: |
||||||||
Accounts payable, trade |
$ | 11,302 | $ | 11,672 | ||||
Deferred revenue |
94,651 | 96,541 | ||||||
Interest payable |
9,745 | 9,748 | ||||||
Accrued compensation and benefits |
14,941 | 15,283 | ||||||
Member deposits |
9,692 | 9,521 | ||||||
Accrued expenses and other current liabilities |
38,787 | 31,522 | ||||||
Current portion of long-term debt |
— | — | ||||||
Total current liabilities |
179,118 | 174,287 | ||||||
Long-term debt, net of current portion |
357,576 | 395,290 | ||||||
Other long-term liabilities |
11,697 | 1,746 | ||||||
Deferred revenue |
124,928 | 134,236 | ||||||
Deferred income taxes |
84,575 | 76,224 | ||||||
Total liabilities |
757,894 | 781,783 | ||||||
Redeemable noncontrolling interest |
419 | 422 | ||||||
Commitments and contingencies |
||||||||
STOCKHOLDERS' EQUITY: |
||||||||
Preferred stock $.01 par value; authorized 25,000,000 shares, of which 100,000 shares are designated Series A Junior Participating Preferred Stock, none issued and outstanding |
— | — | ||||||
Common stock $.01 par value; authorized 300,000,000 shares, 57,099,615 and 56,543,016 issued and outstanding shares at December 31, 2010 and 2009, respectively |
571 | 565 | ||||||
Additional paid-in capital |
164,162 | 156,260 | ||||||
Retained earnings |
72,205 | 29,787 | ||||||
Accumulated other comprehensive loss |
(12,203 | ) | (10,236 | ) | ||||
Total stockholders' equity |
224,735 | 176,376 | ||||||
TOTAL LIABILITIES AND EQUITY |
$ | 983,048 | $ | 958,581 | ||||
The accompanying Notes to Consolidated Financial Statements are an integral part of these statements.
61
INTERVAL LEISURE GROUP, INC. AND SUBSIDIARIES
CONSOLIDATED STATEMENTS OF STOCKHOLDERS' EQUITY
| |
|
Common Stock | |
|
Receivables from IAC and Subsidiaries |
|
Accumulated Other Comprehensive Income (Loss) |
|||||||||||||||||||
|---|---|---|---|---|---|---|---|---|---|---|---|---|---|---|---|---|---|---|---|---|---|---|---|---|---|---|
| |
|
Additional Paid-in Capital |
Invested Capital |
Retained Earnings (Deficit) |
||||||||||||||||||||||
| |
Total | Amount | Shares | |||||||||||||||||||||||
| |
(In thousands, except share data) |
|||||||||||||||||||||||||
Balance as of December 31, 2007 |
$ | 513,367 | $ | — | — | $ | — | $ | 726,919 | $ | (436,475 | ) | $ | 222,484 | $ | 439 | ||||||||||
Comprehensive income: |
||||||||||||||||||||||||||
Net income attributable to common stockholders prior to spin-off |
53,690 | — | — | — | — | — | 53,690 | — | ||||||||||||||||||
Net loss attributable to common stockholders after spin-off |
(8,426 | ) | — | — | — | — | — | (8,426 | ) | — | ||||||||||||||||
Foreign currency translation loss, net |
(10,973 | ) | — | — | — | — | — | — | (10,973 | ) | ||||||||||||||||
Comprehensive income |
34,291 | |||||||||||||||||||||||||
Non-cash compensation expense |
2,774 | — | — | 2,774 | — | — | — | — | ||||||||||||||||||
Deferred restricted stock units |
(1,055 | ) | — | — | (1,055 | ) | — | — | — | — | ||||||||||||||||
Net change in receivables from IAC and subsidiaries |
(59,544 | ) | — | — | — | — | (59,544 | ) | — | — | ||||||||||||||||
Net transfers to IAC |
5,195 | — | — | — | 5,195 | — | — | — | ||||||||||||||||||
Dividends to IAC in connection with the spin-off |
(365,931 | ) | — | — | — | (365,931 | ) | — | — | — | ||||||||||||||||
Extinguishment of receivable from IAC in connection with spin-off |
496,019 | — | — | — | — | 496,019 | — | — | ||||||||||||||||||
Capitalization as a result of the spin-off from IAC |
— | — | — | 642,357 | (366,183 | ) | — | (276,174 | ) | — | ||||||||||||||||
Issuance of common stock at spin-off |
(496,019 | ) | 562 | 56,179,572 | (496,581 | ) | — | — | — | — | ||||||||||||||||
Issuance of common stock upon exercise of stock options |
42 | — | 5,929 | 42 | — | — | — | — | ||||||||||||||||||
Issuance of common stock in escrow for IAC warrants |
— | — | 24,133 | — | — | — | — | — | ||||||||||||||||||
Balance as of December 31, 2008 |
$ | 129,139 | $ | 562 | 56,209,634 | $ | 147,537 | $ | — | $ | — | $ | (8,426 | ) | $ | (10,534 | ) | |||||||||
Comprehensive income: |
||||||||||||||||||||||||||
Net income attributable to common stockholders |
38,213 | — | — | — | — | — | 38,213 | — | ||||||||||||||||||
Foreign currency translation gains, net |
298 | — | — | — | — | — | — | 298 | ||||||||||||||||||
Comprehensive income |
38,511 | |||||||||||||||||||||||||
Non-cash compensation expense |
10,573 | — | — | 10,573 | — | — | — | — | ||||||||||||||||||
Deferred restricted stock units released, net of withholding taxes |
607 | 1 | 115,144 | 606 | — | — | — | — | ||||||||||||||||||
Issuance of common stock upon exercise of stock options |
448 | — | 66,005 | 448 | — | — | — | — | ||||||||||||||||||
Issuance of common stock upon vesting of restricted stock units, net of withholding taxes |
(689 | ) | 2 | 178,507 | (691 | ) | — | — | — | — | ||||||||||||||||
Deferred stock compensation expense |
(44 | ) | — | — | (44 | ) | — | — | — | — | ||||||||||||||||
Adjustment to issuance of common stock at spin-off |
(11 | ) | — | (26,274 | ) | (11 | ) | — | — | — | — | |||||||||||||||
Adjustment to dividends to IAC in connection with the spin-off(a) |
(2,158 | ) | — | — | (2,158 | ) | — | — | — | — | ||||||||||||||||
Balance as of December 31, 2009 |
$ | 176,376 | $ | 565 | 56,543,016 | $ | 156,260 | $ | — | $ | — | $ | 29,787 | $ | (10,236 | ) | ||||||||||
- (a)
- Due to a reconciliation of federal and state income taxes for the 2008 period prior to the spin-off and as provided for in the Tax Sharing Agreement entered into with IAC, we recorded a $2.2 million increase to the amount distributed to IAC in connection with a reduced income tax liability.
62
INTERVAL LEISURE GROUP, INC. AND SUBSIDIARIES
CONSOLIDATED STATEMENTS OF STOCKHOLDERS' EQUITY (Continued)
| |
|
Common Stock | |
|
Receivables from IAC and Subsidiaries |
|
Accumulated Other Comprehensive Income (Loss) |
|||||||||||||||||||
|---|---|---|---|---|---|---|---|---|---|---|---|---|---|---|---|---|---|---|---|---|---|---|---|---|---|---|
| |
|
Additional Paid-in Capital |
Invested Capital |
Retained Earnings (Deficit) |
||||||||||||||||||||||
| |
Total | Amount | Shares | |||||||||||||||||||||||
| |
(In thousands, except share data) |
|||||||||||||||||||||||||
Balance as of December 31, 2009 |
$ | 176,376 | $ | 565 | 56,543,016 | $ | 156,260 | $ | — | $ | — | $ | 29,787 | $ | (10,236 | ) | ||||||||||
Comprehensive income: |
||||||||||||||||||||||||||
Net income attributable to common stockholders |
42,418 | 42,418 | ||||||||||||||||||||||||
Foreign currency translation gains, net |
(1,967 | ) | (1,967 | ) | ||||||||||||||||||||||
Comprehensive income |
40,451 | |||||||||||||||||||||||||
Non-cash compensation expense |
10,115 | 10,115 | ||||||||||||||||||||||||
Issuance of common stock upon exercise of stock options |
509 | 59,913 | 509 | |||||||||||||||||||||||
Release of common stock in escrow upon exercise of IAC warrants |
249 | 249 | ||||||||||||||||||||||||
Issuance of common stock upon vesting of restricted stock units, net of withholding taxes |
(3,006 | ) | 6 | 496,686 | (3,012 | ) | ||||||||||||||||||||
Deferred stock compensation expense |
41 | 41 | ||||||||||||||||||||||||
Balance as of December 31, 2010 |
$ | 224,735 | $ | 571 | 57,099,615 | $ | 164,162 | $ | — | $ | — | $ | 72,205 | $ | (12,203 | ) | ||||||||||
The accompanying Notes to Consolidated Financial Statements are an integral part of these statements.
63
INTERVAL LEISURE GROUP, INC. AND SUBSIDIARIES
CONSOLIDATED STATEMENTS OF CASH FLOWS
| |
Year Ended December 31, | ||||||||||
|---|---|---|---|---|---|---|---|---|---|---|---|
| |
2010 | 2009 | 2008 | ||||||||
| |
(In thousands) |
||||||||||
Cash flows from operating activities: |
|||||||||||
Net income |
$ | 42,415 | $ | 38,209 | $ | 45,178 | |||||
Adjustments to reconcile net income to net cash provided by operating activities: |
|||||||||||
Goodwill impairment |
— | — | 34,254 | ||||||||
Amortization expense of intangibles |
26,387 | 25,961 | 25,906 | ||||||||
Amortization of debt issuance costs |
2,389 | 2,745 | 1,097 | ||||||||
Depreciation expense |
10,537 | 9,851 | 9,335 | ||||||||
Accretion of original issue discount |
2,286 | 2,048 | 742 | ||||||||
Non-cash compensation expense |
10,115 | 10,573 | 8,820 | ||||||||
Deferred income taxes |
7,677 | 22,819 | (28,331 | ) | |||||||
Excess tax benefits from stock-based awards |
(966 | ) | — | — | |||||||
Changes in current assets and liabilities: |
|||||||||||
Accounts receivable |
808 | (6,730 | ) | (1,973 | ) | ||||||
Prepaid expenses and other current assets |
(2,389 | ) | 3,348 | (1,699 | ) | ||||||
Accounts payable and other current liabilities |
2,443 | 6,031 | 14,463 | ||||||||
Income taxes payable |
(3,187 | ) | (20,595 | ) | 1,190 | ||||||
Deferred revenue |
(9,085 | ) | (2,973 | ) | (724 | ) | |||||
Other, net |
1,973 | (3,939 | ) | (4,317 | ) | ||||||
Net cash provided by operating activities |
91,403 | 87,348 | 103,941 | ||||||||
Cash flows from investing activities: |
|||||||||||
Acquisitions, net of cash acquired |
(12,942 | ) | — | (1,001 | ) | ||||||
Changes in restricted cash |
954 | 1,386 | (2,184 | ) | |||||||
Transfers to IAC |
— | — | (68,635 | ) | |||||||
Capital expenditures |
(16,443 | ) | (15,162 | ) | (13,637 | ) | |||||
Net cash used in investing activities |
(28,431 | ) | (13,776 | ) | (85,457 | ) | |||||
Cash flows from financing activities: |
|||||||||||
Proceeds from issuance of term loan facility |
— | — | 150,000 | ||||||||
Principal payments on term loan facility |
(40,000 | ) | (34,000 | ) | — | ||||||
Payments of debt issuance costs |
— | — | (10,569 | ) | |||||||
Dividend payment to IAC in connection with spin-off |
— | — | (89,431 | ) | |||||||
Proceeds from the exercise of stock options |
509 | 436 | 42 | ||||||||
Release of deferred restricted stock units, net of withholding taxes |
— | (430 | ) | — | |||||||
Vesting of restricted stock units, net of withholding taxes |
(2,946 | ) | (691 | ) | — | ||||||
Excess tax benefits from stock-based awards |
966 | — | — | ||||||||
Exercise of warrants |
249 | — | — | ||||||||
Other, net |
— | — | (15 | ) | |||||||
Net cash provided by (used in) financing activities |
(41,222 | ) | (34,685 | ) | 50,027 | ||||||
Effect of exchange rate changes on cash and cash equivalents |
(1,262 | ) | 850 | (15,347 | ) | ||||||
Net increase in cash and cash equivalents |
20,488 | 39,737 | 53,164 | ||||||||
Cash and cash equivalents at beginning of period |
160,014 | 120,277 | 67,113 | ||||||||
Cash and cash equivalents at end of period |
$ | 180,502 | $ | 160,014 | $ | 120,277 | |||||
See Note 14 for supplemental cash flow information.
The accompanying Notes to Consolidated Financial Statements are an integral part of these statements.
64
INTERVAL LEISURE GROUP, INC. AND SUBSIDIARIES
NOTES TO CONSOLIDATED FINANCIAL STATEMENTS
DECEMBER 31, 2010
NOTE 1—ORGANIZATION AND BASIS OF PRESENTATION
Company Overview
Interval Leisure Group, Inc., or ILG, is a leading global provider of membership and leisure services to the vacation industry. ILG consists of two operating segments. During the fourth quarter of 2010, we changed the names of our two operating segments from Interval to Membership and Exchange and from Aston to Management and Rental, in order to better describe the underlying business operations in the segments. The historical segments' financial information and underlying operational activity did not change, other than the addition of the operations of Trading Places International, or TPI, upon completion of the acquisition on November 30, 2010. Membership and Exchange, our principal business segment, offers travel and leisure related products and services to owners of vacation interests and others mostly through various membership programs, as well as related services to resort developer clients. Management and Rental, our other business segment, provides hotel, condominium resort, timeshare resort and homeowners association management, and vacation rental services to both vacationers and vacation property owners.
ILG was incorporated as a Delaware corporation in May 2008 in connection with a plan by IAC/InterActiveCorp, or IAC, to separate into five publicly traded companies, referred to as the "spin-off." In connection with the spin-off, we entered into an indenture pursuant to which we issued $300.0 million of senior unsecured notes due 2016 and entered into a senior secured credit facility with a maturity in 2013, including a term loan in the original principal amount of $150.0 million and a $50.0 million revolving credit facility. ILG was formed to hold the Membership and Exchange and Management and Rental businesses, and commenced trading on The NASDAQ Stock Market in August 2008 under the symbol "IILG."
The Membership and Exchange segment consists of Interval International Inc.'s businesses, referred to as Interval, and TPI's membership and exchange related line of business. The Management and Rental segment consists of Aston Hotels & Resorts, LLC and Maui Condo and Home, LLC, referred to as Aston, and TPI's management and rental related line of business. TPI offers exchange and leisure services to vacation owners, including on-site management at 20 resorts located throughout the mainland United States, Hawaii, and Mexico. The businesses operated by ILG following the spin-off are referred to herein as the "ILG Businesses."
Basis of Presentation
The historical consolidated financial statements of ILG and its subsidiaries reflect the contribution or other transfer to ILG of all of the subsidiaries and assets and the assumption by ILG of all of the liabilities relating to the ILG Businesses in connection with the spin-off, and the allocation to ILG of certain IAC corporate expenses relating to the ILG Businesses prior to the spin-off. Accordingly, the historical consolidated financial statements of ILG prior to the spin-off reflect the historical financial position, results of operations and cash flows of the ILG Businesses since their respective dates of acquisition by IAC, based on the historical consolidated financial statements and accounting records of IAC and using the historical results of operations and historical basis of the assets and liabilities of the ILG Businesses with the exception of accounting for income taxes. For purposes of these financial statements, income taxes have been computed for ILG on an as if stand-alone, separate tax return basis. Intercompany transactions and accounts have been eliminated in the consolidated financial statements.
65
INTERVAL LEISURE GROUP, INC. AND SUBSIDIARIES
NOTES TO CONSOLIDATED FINANCIAL STATEMENTS (Continued)
DECEMBER 31, 2010
NOTE 1—ORGANIZATION AND BASIS OF PRESENTATION (Continued)
In the opinion of ILG's management, the assumptions underlying the historical consolidated financial statements of ILG and its subsidiaries are reasonable. However, this financial information, prior to the spin-off, does not reflect what the historical financial position, results of operations and cash flows of ILG would have been had ILG been a stand-alone company during the periods presented prior to the spin-off.
Seasonality
Revenue at ILG is influenced by the seasonal nature of travel. The Membership and Exchange businesses recognize exchange and Getaway revenue based on confirmation of the vacation, with the first quarter generally experiencing higher revenue and the fourth quarter generally experiencing lower revenue. The Management and Rental businesses recognize revenue based on occupancy, with the first and third quarters generally generating higher revenue and the second and fourth quarters generally generating lower revenue.
NOTE 2—SIGNIFICANT ACCOUNTING POLICIES
Principles of Consolidation
The accompanying consolidated financial statements include the accounts of ILG and its consolidated entities and are presented in accordance with U.S. generally accepted accounting principles ("GAAP"). The consolidated financial statements reflect the financial position and operating results of ILG, including wholly-owned subsidiaries. All significant intercompany balances and transactions have been eliminated in the consolidated financial statements.
Revenue Recognition
Revenue, net of sales incentives, from membership fees from our Membership and Exchange segment is deferred and recognized over the terms of the applicable memberships, typically ranging from one to five years, on a straight-line basis. Generally, memberships are cancelable and refundable on a pro-rata basis. Direct costs of acquiring members and direct costs of sales related to deferred membership revenue are also deferred and amortized on a straight-line basis over the terms of the applicable memberships. These costs relate to various commissions and initial fulfillment costs. The recognition of previously deferred revenue and expense is based on estimates derived from an aggregation of member-level data. Revenue from exchange and Getaway transactions is recognized when confirmation of the transaction is provided as the earnings process is complete. Reservation servicing revenue is recognized when service is performed or on a straight-line basis over the applicable service period. All taxable revenue transactions are presented on a net-of-tax basis.
The Management and Rental segment's revenue is derived principally from fees for hotel, condominium resort, timeshare resort and homeowners association management, and vacation rental services. Management fees consist of base management fees, which are either fixed amounts or range from 1% to 5% of adjusted gross lodging revenue, various revenue sharing arrangements with condominium owners based on stated formulas or a percentage of adjusted gross lodging revenue, and incentive management fees for certain hotels and condominium resorts which are generally a percentage of operating profits or improvement in operating profits. Service fee revenue is based on
66
INTERVAL LEISURE GROUP, INC. AND SUBSIDIARIES
NOTES TO CONSOLIDATED FINANCIAL STATEMENTS (Continued)
DECEMBER 31, 2010
NOTE 2—SIGNIFICANT ACCOUNTING POLICIES (Continued)
the services provided to owners including reservations, sales and marketing, property accounting and information technology services either internally or through third party providers. Service fee revenue is recognized when the service is provided. In certain instances we arrange services which are provided directly to property owners. Transactions for these services do not impact our consolidated financial statements as they are not included in our results of operations. Additionally, in most cases we employ on-site personnel to provide services such as housekeeping, maintenance and administration to property owners under our management agreements. For such services, we recognize revenue in an amount equal to the expenses incurred.
Cash and Cash Equivalents
Cash and cash equivalents include cash and highly liquid investments with original maturities of three months or less.
Restricted Cash
Restricted cash at December 31, 2010 and 2009 primarily includes amounts held in trust and lock box accounts in connection with certain transactions related to the Management and Rental segment's managed properties. Additionally, restricted cash at December 31, 2009 includes amounts required for certain merchant transactions in the United Kingdom.
Accounts Receivable
Accounts receivable are stated at amounts due from customers, principally resort developers, members and managed properties, net of an allowance for doubtful accounts. Accounts receivable outstanding longer than the contractual payment terms are considered past due. ILG determines its allowance by considering a number of factors, including the length of time accounts receivable are past due, ILG's previous loss history, our judgment as to the specific customer's current ability to pay its obligation to ILG and the condition of the general economy. The allowance for bad debt is included within general and administrative expense within our consolidated statements of income. ILG writes off accounts receivable when they become uncollectible once we have exhausted all means of collection.
Property and Equipment
Property and equipment, including capitalized improvements, are recorded at cost. Repairs and maintenance and any gains or losses on dispositions are included in results of operations.
Depreciation is recorded on a straight-line basis to allocate the cost of depreciable assets to operations over their estimated useful lives. The following table summarizes depreciable life by asset category.
Asset Category
|
Depreciation Period | |
|---|---|---|
Computer equipment |
3 to 5 Years | |
Capitalized software |
3 to 7 Years | |
Buildings and leasehold improvements |
1 to 40 Years | |
Furniture and other equipment |
3 to 10 Years |
67
INTERVAL LEISURE GROUP, INC. AND SUBSIDIARIES
NOTES TO CONSOLIDATED FINANCIAL STATEMENTS (Continued)
DECEMBER 31, 2010
NOTE 2—SIGNIFICANT ACCOUNTING POLICIES (Continued)
In accordance with ASC Topic 350, "Intangibles-Goodwill and Other" ("ASC 350"), we capitalize certain qualified costs incurred in connection with the development of internal use software. Capitalization of internal use software costs begins when the preliminary project stage is completed, management with the relevant authority authorizes and commits to the funding of the software project, and it is probable that the project will be completed and the software will be used to perform the function intended. Capitalized internal software costs, net of accumulated amortization, totaled $28.3 million and $21.6 million at December 31, 2010 and 2009, respectively, and are included in "Property and equipment, net" in the accompanying consolidated balance sheets.
Goodwill and Other Intangible Assets
Goodwill and other intangible assets are significant components of our consolidated balance sheets. Our policies regarding the valuation of intangible assets affect the amount of future amortization and possible impairment charges we may incur. Assumptions and estimates about future values and remaining useful lives of our intangible and other long-lived assets are complex and subjective. They can be affected by a variety of factors, including external factors such as consumer spending habits and general economic trends, and internal factors such as changes in our business strategy and our internal forecasts.
In accordance with ASC 350, we review the carrying value of goodwill and other intangible assets of each of our reporting units on an annual basis as of October 1, or more frequently upon the occurrence of certain events or substantive changes in circumstances, based on a two-step impairment test. We consider our Membership and Exchange and Management and Rental segments to be individual reporting units which are also individual operating segments of ILG. Goodwill acquired in business combinations is assigned to the reporting unit(s) expected to benefit from the combination as of the acquisition date. The first step of the impairment test compares the fair value of each reporting unit with its carrying amount including goodwill. The fair value of each reporting unit is calculated using the average of an income approach and a market comparison approach which utilizes similar companies as the basis for the valuation. If the carrying amount exceeds fair value, then the second step of the impairment test is performed to measure the amount of any impairment loss. The impairment loss is determined by comparing the implied fair value of goodwill to the carrying value of goodwill. The implied fair value of goodwill represents the excess of the fair value of the reporting unit over amounts assigned to its net assets.
The determination of fair value utilizes an evaluation of historical and forecasted operating results and other estimates. Fair value measurements are generally determined through the use of valuation techniques that may include a discounted cash flow approach, which reflects our own assumptions of what market participants would use in pricing the asset or liability.
During the year, we monitor the actual performance of our reporting units relative to the fair value assumptions used in our annual goodwill impairment test, including potential events and changes in circumstance affecting our key estimates and assumptions.
68
INTERVAL LEISURE GROUP, INC. AND SUBSIDIARIES
NOTES TO CONSOLIDATED FINANCIAL STATEMENTS (Continued)
DECEMBER 31, 2010
NOTE 2—SIGNIFICANT ACCOUNTING POLICIES (Continued)
Long-Lived Assets and Intangible Assets with Definite Lives
We review the carrying value of all long-lived assets, primarily property and equipment and definite-lived intangible assets, for impairment whenever events or changes in circumstances indicate that the carrying value of a long-lived asset (asset group) may be impaired. In accordance with guidance included within ASC 360, recoverability of assets to be held and used is measured by a comparison of the carrying amount of an asset (asset group) to future undiscounted cash flows expected to be generated by the asset (asset group). An asset group is the lowest level of assets and liabilities for which identifiable cash flows are largely independent of the cash flows of other assets and liabilities. When estimating future cash flows, we consider:
- •
- only the future cash flows that were directly associated with and that are expected to arise as a direct result of the use
and eventual disposition of the asset group;
- •
- our own assumptions about our use of the asset group and all available evidence when estimating future cash flows;
- •
- potential events and changes in circumstance affecting our key estimates and assumptions; and
- •
- the existing service potential of the asset (asset group) at the date tested.
If an asset (asset group) is considered to be impaired, the impairment to be recognized is measured by the amount by which the carrying amount of the asset (asset group) exceeds its fair value. When determining the fair value of the asset (asset group), we consider the highest and best use of the assets from a market-participant perspective. The fair value measurement is generally determined through the use of independent third party appraisals or an expected present value technique, both of which may include a discounted cash flow approach, which reflects our own assumptions of what market participants would utilize to price the asset (asset group).
Assets to be disposed of are reported at the lower of the carrying amount or fair value less costs to sell. Assets to be abandoned, or from which no further benefit is expected, are written down to zero at the time that the determination is made and the assets are removed entirely from service.
Advertising
Advertising and promotional expenditures primarily include printing and postage costs of directories and magazines, promotions, tradeshows, agency fees, marketing fees and related commissions. Direct-response advertising consists primarily of printing, postage, and freight costs related to our member resort directories. Advertising costs are expensed in the period incurred, except for magazine related costs that are expensed at time of mailing when the advertising takes place, and direct-response advertising, which are amortized ratably over the twelve-month period following the mailing of the directories.
Advertising expense was $15.5 million, $18.3 million and $20.2 million for the years ended December 31, 2010, 2009 and 2008, respectively, of which $3.8 million, $5.5 million and $5.5 million, respectively, pertained to expenses related to our direct-response advertising. As of December 31, 2010 and 2009, we had $4.1 million and $3.3 million, respectively, of capitalized advertising costs recorded in prepaid expenses and other current assets on our consolidated balance sheets.
69
INTERVAL LEISURE GROUP, INC. AND SUBSIDIARIES
NOTES TO CONSOLIDATED FINANCIAL STATEMENTS (Continued)
DECEMBER 31, 2010
NOTE 2—SIGNIFICANT ACCOUNTING POLICIES (Continued)
Income Taxes
ILG accounts for income taxes under the liability method, and deferred tax assets and liabilities are recognized for the future tax consequences attributable to differences between the financial statement carrying amounts of existing assets and liabilities and their respective tax bases. Deferred tax assets and liabilities are measured using enacted tax rates in effect for the year in which those temporary differences are expected to be recovered or settled. A valuation allowance is provided on deferred tax assets if it is determined that it is more likely than not that the deferred tax asset will not be realized. ILG records interest on potential tax contingencies as a component of income tax expense and records interest net of any applicable related income tax benefit.
Pursuant to ASC Topic 740 "Income Taxes," ILG recognizes liabilities for uncertain tax positions based on the two-step process prescribed by the interpretation. The first step is to evaluate the tax position for recognition by determining if the weight of available evidence indicates it is more likely than not that the position will be sustained on audit, including resolution of related appeals or litigation processes, if any. The second step is to measure the tax benefit as the largest amount that is more than 50% likely of being realized upon settling the uncertain tax position.
Foreign Currency Translation and Transaction Gains and Losses
The financial position and operating results of substantially all foreign operations are consolidated using the local currency as the functional currency. Local currency assets and liabilities are translated at the rates of exchange as of the balance sheet date, and local currency revenue and expenses are translated at average rates of exchange during the period. Resulting translation gains or losses are included as a component of accumulated other comprehensive income (loss), a separate component of stockholders' equity. Accumulated other comprehensive income (loss) is solely related to foreign currency translation. Only the accumulated other comprehensive income (loss) exchange rate adjustment related to Venezuela is tax effected as required by FASB guidance codified in ASC Topic 740, "Income Taxes" ("ASC 740") since the earnings in Venezuela are not indefinitely reinvested in that jurisdiction. See Note 13 for additional discussion pertaining to our Venezuelan operations.
Transaction gains and losses arising from transactions and/or assets and liabilities denominated in a currency other than the functional currency of the entity involved are included in the consolidated statements of income. For the year ended December 31, 2010, operating foreign exchange attributable to foreign currency remeasurement of operating assets and liabilities denominated in a currency other than their functional currency, primarily related to Euro denominated Value Added Tax liabilities, resulted in a net gain of $0.2 million, which is included in general and administrative expenses. Non-operating foreign exchange included net losses of $0.3 million and $1.3 million for the years ended December 31, 2010 and 2009, respectively, and a net gain of $4.0 million for the year ended December 31, 2008, included in "Other income (expense)" in the accompanying consolidated statements of income.
Stock-Based Compensation
Stock-based compensation is accounted for under ASC Topic 718, "Compensation-Stock Compensation" ("ASC 718"). Compensation cost for stock awards is measured at fair value on date of
70
INTERVAL LEISURE GROUP, INC. AND SUBSIDIARIES
NOTES TO CONSOLIDATED FINANCIAL STATEMENTS (Continued)
DECEMBER 31, 2010
NOTE 2—SIGNIFICANT ACCOUNTING POLICIES (Continued)
grant and recognized over the service period for awards expected to vest. The fair value of restricted stock and restricted stock units ("RSUs") is determined based on the number of shares granted and the quoted price of our common stock. For certain cliff vesting awards with performance criteria, we also use anticipated future results in determining the fair value of the award. Such value is recognized as expense over the service period, net of estimated forfeitures, using the straight-line recognition method. We grant awards subject to graded vesting (i.e. portions of the award vest at different times during the vesting period) or to cliff vesting (i.e. all awards vest at the end of the vesting period). Any performance criteria attached to an award subject to graded vesting simply affects whether or not the award will vest. The amount of stock-based compensation expense recognized in the consolidated statements of income is reduced by estimated forfeitures, as the amount recorded is based on awards ultimately expected to vest.
Management must make certain estimates and assumptions regarding stock awards that will ultimately vest, and to the extent actual results or updated estimates differ from our current estimates, such amounts will be recorded as a cumulative adjustment in the period estimates are revised. We consider many factors when estimating expected forfeitures, including types of awards, employee class, and historical experience. The forfeiture rate is estimated at the grant date based on historical experience and revised, if necessary, in subsequent periods for any changes to the estimated forfeiture rate from that previously estimated. For any vesting tranche of an award, the cumulative amount of compensation cost recognized is at least equal to the portion of the grant-date value of the award tranche that is actually vested at that date. Tax benefits resulting from tax deductions in excess of the stock-based compensation expense recognized in the consolidated statements of income are reported as a component of financing cash flows. For the year ended December 31, 2010, gross excess tax benefits from stock-based compensation reported as a component of financing cash flows was $1.0 million. For the years ended December 31, 2009 and 2008, gross excess tax benefits from stock-based compensation were not material.
Noncontrolling Interest
Noncontrolling interest in 2010, 2009 and 2008 represents a noncontrolling ownership in Aston. In connection with the acquisition of Aston by ILG in May 2007, a member of senior management of this business purchased an ownership interest at the same per share price as ILG and was granted an additional interest vesting over four and a half years. ILG is party to a fair value put and call arrangement with respect to this individual's holdings. This put and call arrangement allows this member of management to require ILG to purchase their interest or allows ILG to acquire such interest at fair value. This put and call arrangement becomes exercisable by ILG and the counter-party, respectively, at a date no earlier than 2013. Upon such exercise of the put or call, the consideration payable can be denominated in ILG shares, cash or a combination thereof at ILG's option. This put arrangement is exercisable by the counter-party outside the control of ILG and is accounted for in accordance with the ASC Topic 480, "Distinguishing Liabilities from Equity" ("ASC 480"). Accordingly, to the extent that the fair value of this interest exceeds the value determined by standard noncontrolling interest accounting, the value of such interest is adjusted to fair value with a corresponding adjustment to retained earnings. ILG did not record such an adjustment to this interest during any of the years presented.
71
INTERVAL LEISURE GROUP, INC. AND SUBSIDIARIES
NOTES TO CONSOLIDATED FINANCIAL STATEMENTS (Continued)
DECEMBER 31, 2010
NOTE 2—SIGNIFICANT ACCOUNTING POLICIES (Continued)
The balance of redeemable noncontrolling interest as of December 31, 2010 and 2009 was $0.4 million. Changes during the years then ended are as follows (in thousands):
| |
December 31, | ||||||
|---|---|---|---|---|---|---|---|
| |
2010 | 2009 | |||||
Balance, beginning of period |
$ | 422 | $ | 426 | |||
Net loss attributable to noncontrolling interest |
3 | 4 | |||||
Balance, end of period |
$ | 419 | $ | 422 | |||
Earnings per Share
Basic earnings per share attributable to common stockholders is computed by dividing the net income attributable to common stockholders by the weighted average number of shares of common stock outstanding for the period. Diluted earnings per share attributable to common stockholders is computed based on the weighted average number of shares of common stock and dilutive securities outstanding during the period. Dilutive securities are common stock equivalents that are freely exercisable into common stock at less than market prices or otherwise dilute earnings if converted. The net effect of common stock equivalents is based on the incremental common stock that would be issued upon the assumed exercise of common stock options and the vesting of RSUs using the treasury stock method. Common stock equivalents are not included in diluted earnings per share when their inclusion is antidilutive. The computations of diluted earnings per share available to common stockholders do not include approximately 1.3 million options and 0.1 million RSUs for the year ended December 31, 2010, 1.8 million options and 1.3 million RSUs for the year ended December 31, 2009, and 2.0 million options and 1.4 million RSUs for the year ended December 31, 2008, as the effect of their inclusion would have been antidilutive to earnings per share.
The computation of weighted average common and common equivalent shares used in the calculation of basic and diluted earnings per share is as follows (in thousands):
| |
Year Ended December 31, | |||||||||
|---|---|---|---|---|---|---|---|---|---|---|
| |
2010 | 2009 | 2008 | |||||||
Basic weighted average shares outstanding |
56,898 | 56,411 | 56,189 | |||||||
Net effect of common stock equivalents assumed to be exercised related to RSUs |
806 | 557 | 148 | |||||||
Net effect of common stock equivalents assumed to be exercised related to stock options held by non-employees |
52 | 47 | 33 | |||||||
Diluted weighted average shares outstanding |
57,756 | 57,015 | 56,370 | |||||||
For year ended December 31, 2008, basic and diluted weighted average shares of common stock outstanding were computed using the number of shares of common stock outstanding immediately following the spin-off, as if such shares were outstanding for the entire period prior to the spin-off plus the weighted average of such shares outstanding following the spin-off date through December 31, 2008.
72
INTERVAL LEISURE GROUP, INC. AND SUBSIDIARIES
NOTES TO CONSOLIDATED FINANCIAL STATEMENTS (Continued)
DECEMBER 31, 2010
NOTE 2—SIGNIFICANT ACCOUNTING POLICIES (Continued)
Accounting Estimates
ILG's management is required to make certain estimates and assumptions during the preparation of its consolidated financial statements in accordance with U.S. GAAP. These estimates and assumptions impact the reported amounts of assets and liabilities and disclosures of contingent assets and liabilities as of the date of the consolidated financial statements. They also impact the reported amount of net earnings during any period. Actual results could differ from those estimates.
Significant estimates underlying the accompanying consolidated financial statements include: the recovery of goodwill and long-lived and other intangible assets; purchase price allocations; the determination of deferred income taxes including related valuation allowances; the determination of deferred revenue and membership costs; and the determination of stock-based compensation.
Certain Risks and Concentrations
A substantial percentage of the vacation ownership resorts in the Interval Network are located in Florida, Hawaii, Las Vegas, Mexico and Southern California and most of the vacation properties for which the Management and Rental segment provides hotel and resort management and vacation rental services are located in Hawaii. Approximately $111.0 million and $108.6 million of 2010 and 2009 revenue, respectively, which excludes the Management and Rental segment pass-through revenue, was generated from travel to properties located in all of these locations as well as hotel and resort management services performed in these locations in 2010. ILG also depends on relationships with developers and vacation property owners, as well as third party service providers for processing certain fulfillment services. We do not consider our overall business to be dependent on any one of these resort developers, provided, that the loss of a few large developers (particularly those from which Interval receives membership renewal fees directly) could materially impact our business. The loss of one or more of our largest management agreements could materially impact our Management and Rental business.
Financial instruments, which potentially subject ILG to concentration of credit risk, consist primarily of cash and cash equivalents which are maintained with high quality financial institutions.
ILG's business also is subject to certain risks and concentrations including exposure to risks associated with online commerce security and credit card fraud.
Recent Accounting Pronouncements
With the exception of those discussed below, there have been no recent accounting pronouncements or changes in accounting pronouncements during the year ended December 31, 2010 that are of significance, or potential significance, to ILG based on our current operations. The following summary of recent accounting pronouncements is not intended to be an exhaustive description of the respective pronouncement.
In December 2010, the Financial Accounting Standards Board ("FASB") issued Accounting Standards Update ("ASU") 2010-29, "Disclosure of Supplementary Pro Forma Information for Business Combinations" ("ASU 2010-29"). ASU 2010-29 requires public entities that present comparative financial statements to disclose revenue and earnings of the combined entity as though the business
73
INTERVAL LEISURE GROUP, INC. AND SUBSIDIARIES
NOTES TO CONSOLIDATED FINANCIAL STATEMENTS (Continued)
DECEMBER 31, 2010
NOTE 2—SIGNIFICANT ACCOUNTING POLICIES (Continued)
combination(s) that occurred during the year had occurred as of the beginning of the comparable prior annual reporting period only. The ASU also expands the supplemental pro forma disclosures under Topic 805 to include a description of the nature and amount of material, nonrecurring pro forma adjustments directly attributable to the business combination included in the reported pro forma revenue and earnings. The ASU is effective prospectively for business combinations for which the acquisition date is on or after the beginning of the first annual reporting period beginning on or after December 15, 2010, with early adoption permitted. We adopted this guidance as of January 1, 2011. The adoption did not have a material impact on our consolidated financial position, results of operations, cash flows or related disclosures.
In October 2009, the FASB issued ASU 2009-13, "Multiple-Deliverable Revenue Arrangements," (amendments to ASC Topic 605, "Revenue Recognition") ("ASU 2009-13"). ASU 2009-13 updates the existing multiple-element revenue arrangements guidance currently included under ASC 605-25. The revised guidance modifies the criteria for recognizing revenue in multiple element arrangements and expands the disclosure requirements for revenue recognition. ASU 2009-13 will be effective for the first annual reporting period beginning on or after June 15, 2010, with early adoption permitted provided that the revised guidance is retroactively applied to the beginning of the year of adoption. We adopted this guidance as of January 1, 2011. The adoption did not have a material impact on our consolidated financial position, results of operations, cash flows or related disclosures.
Adopted Accounting Pronouncements
In July 2010, the FASB issued ASU 2010-20, "Disclosures about the Credit Quality of Financing Receivables and the Allowance for Credit Losses" ("ASU 2010-20"). ASU 2010-20 requires enhanced disclosures about the credit quality of financing receivables and the allowance for credit losses. These enhanced disclosures include, but are not limited to, a greater level of disaggregated and qualitative information about the credit quality of their financing receivables and their allowances for credit losses. The required disclosures as of the end of a reporting period are effective for interim and annual reporting periods ending on or after December 15, 2010. The required disclosures about activity that occurs during a reporting period are effective for interim and annual reporting periods beginning on or after December 15, 2010. We adopted this guidance as of December 31, 2010. The adoption did not have a material impact on our consolidated financial position, results of operations, cash flows or related disclosures.
In February 2010, the FASB issued ASU 2010-08, "Technical Corrections to Various Topics" ("ASU 2010-08"). ASU 2010-08 is the result of the FASB's review of its standards to determine if any provisions are outdated, contain inconsistencies, or need clarifications to reflect the FASB's original intent. The FASB believes the related changes to U.S. GAAP are generally nonsubstantive in nature and will not result in pervasive changes to current practice. However, the FASB notes it is possible that the application of the guidance may result in a change to existing practice. ASU 2010-08 provides certain clarifications on embedded derivatives and hedging within ASC Topic 815, "Derivatives and Hedging" ("ASC 815"), which caused a change in the application of that standard with respect to certain embedded derivatives. The clarifications of ASC 815 are effective for fiscal years beginning after December 15, 2009, and should be applied to existing contracts (hybrid instruments) containing embedded derivative features at the date of adoption. All other amendments are effective for the first
74
INTERVAL LEISURE GROUP, INC. AND SUBSIDIARIES
NOTES TO CONSOLIDATED FINANCIAL STATEMENTS (Continued)
DECEMBER 31, 2010
NOTE 2—SIGNIFICANT ACCOUNTING POLICIES (Continued)
reporting period (including interim periods) beginning after the date this ASU was issued. The adoption of this accounting update did not have a material impact on our consolidated financial position, results of operations, cash flows or related disclosures.
In January 2010, the FASB issued ASU 2010-06, "Improving Disclosures About Fair Value Measurements," (amendments to ASC Topic 820, "Fair Value Measurements and Disclosures") which requires reporting entities to make new disclosures about recurring or nonrecurring fair-value measurements including significant transfers into and out of Level 1 and Level 2 fair-value measurements and information on purchases, sales, issuances, and settlements on a gross basis in the reconciliation of Level 3 fair value measurements. The ASU also clarifies existing fair value disclosures about the level of disaggregation and about inputs and valuation techniques used to measure fair value. ASU 2010-06 is effective for annual reporting periods beginning after December 15, 2009, except for Level 3 reconciliation disclosures which are effective for annual periods beginning after December 15, 2010. We adopted this guidance as of January 1, 2010. The adoption did not have a material impact on our consolidated financial position, results of operations, cash flows or related disclosures.
NOTE 3—GOODWILL AND OTHER INTANGIBLE ASSETS
Goodwill
Pursuant to FASB guidance as codified within ASC 350, goodwill acquired in business combinations is assigned to the reporting unit(s) expected to benefit from the combination as of the acquisition date. ILG considers our Membership and Exchange and Management and Rental segments to be individual reporting units which are also individual operating segments of ILG. ILG tests goodwill and other indefinite-lived intangible assets for impairment annually as of October 1, or more frequently if events or changes in circumstances indicate that the assets might be impaired. If the carrying amount of a reporting unit's goodwill exceeds its implied fair value, an impairment loss equal to the excess is recorded. If the carrying amount of an indefinite-lived intangible asset exceeds its estimated fair value, an impairment loss equal to the excess is recorded.
2010 Interim Goodwill Impairment Test
During the first quarter 2010, we determined the Management and Rental reporting unit's actual performance was negatively tracking the fair value assumptions used in our latest (at that time) annual goodwill impairment test as of October 1, 2009, as evidenced by notable declines in RevPAR relative to the prior projections. Based on this, we concluded that indicators of impairment were present and could result in a reduction in the fair value of our Management and Rental reporting unit below its carrying amount. There were no indicators of impairment pertaining to our Membership and Exchange reporting unit.
Consequently, we performed an interim impairment test for our Management and Rental reporting unit as of March 31, 2010. The first step of the two step impairment test concluded that the carrying value of the reporting unit exceeded its fair value by approximately 5%. As a result, we performed the second step of the impairment test to measure the amount of any impairment loss, which concluded that the reporting unit's implied fair value of goodwill exceeded the carrying value of goodwill by a marginal amount and, therefore, no impairment loss was recorded. The excess of the implied fair value
75
INTERVAL LEISURE GROUP, INC. AND SUBSIDIARIES
NOTES TO CONSOLIDATED FINANCIAL STATEMENTS (Continued)
DECEMBER 31, 2010
NOTE 3—GOODWILL AND OTHER INTANGIBLE ASSETS (Continued)
of goodwill over its carrying value, computed in the second step, was primarily attributable to net declines in the fair value of an asset group consisting of Aston's property management contracts and wholesaler agreements definite-lived intangible assets, certain real estate assets owned by Aston and used in the purveyance of revenue generating services pursuant to the aforementioned property management contracts and wholesaler agreements, and Aston's tradename definite-lived intangible asset. As a result of the decline in fair value of these long-lived assets, we performed a recoverability test pursuant to ASC Topic 360, "Property Plant and Equipment," ("ASC 360") as subsequently discussed in the Recoverability of Long-Lived Assets section below.
To calculate the fair value of our reporting units, we used the average of an income approach and a market comparison approach. In our March 31, 2010 interim impairment test of our Management and Rental reporting unit, we continued to equally weigh the income approach and market comparison approach but also included in our valuation a comparable market transaction, weighed to a lesser extent, which occurred subsequent to our latest (at that time) annual impairment test as of October 1, 2009. With respect to our Management and Rental reporting unit's step one analysis, the primary examples of key estimates include forecasted available and occupied room nights, average daily rates, long-term growth rates, and our discount rate.
2010 Annual Impairment Test
As of October 1, 2010, we reviewed the carrying value of goodwill and other intangible assets of each of our reporting units. As of October 1, 2010, the Membership and Exchange and Management and Rental reporting units' goodwill was $474.7 million and $5.2 million, respectively. We performed the first step of the impairment test on both our reporting units and concluded that each reporting unit's fair value exceeded its carrying value and, therefore, the second step of the impairment test was not necessary. As of December 31, 2010, we did not identify any triggering events which required an interim impairment test subsequent to our annual impairment test on October 1, 2010.
2009 Annual Impairment Test
As of October 1, 2009, we performed our required annual impairment test by reviewing the carrying value of goodwill and indefinite-lived intangible assets of each of our reporting units. We performed the first step of the two step impairment test on both of our reporting units and concluded that the Membership and Exchange reporting unit's fair value significantly exceeded its carrying value, however, the carrying value of our Management and Exchange reporting unit exceeded its fair value by 6%. Consequently, we performed the second step of the impairment test for the Management and Rental reporting unit to measure the amount of any impairment loss. The resulting analysis concluded that the Management and Rental reporting unit's implied fair value of goodwill exceeded the carrying value of goodwill and, therefore, no impairment loss was recorded. The excess in the implied fair value of goodwill over its carrying value is attributable to declines in the fair value of other assets or group of assets.
76
INTERVAL LEISURE GROUP, INC. AND SUBSIDIARIES
NOTES TO CONSOLIDATED FINANCIAL STATEMENTS (Continued)
DECEMBER 31, 2010
NOTE 3—GOODWILL AND OTHER INTANGIBLE ASSETS (Continued)
The following tables present the balance of goodwill by reporting unit, including the changes in carrying amount of goodwill, for the years ended December 31, 2010 and 2009 (in thousands):
| |
Balance as of January 1, 2010 |
Additions | Deductions | Goodwill Impairment |
Balance as of December 31, 2010 |
||||||||||||
|---|---|---|---|---|---|---|---|---|---|---|---|---|---|---|---|---|---|
Membership and Exchange |
$ | 474,677 | $ | 5,920 | $ | — | $ | — | $ | 480,597 | |||||||
Management and Rental |
5,190 | 2,240 | — | — | 7,430 | ||||||||||||
Total |
$ | 479,867 | $ | 8,160 | $ | — | $ | — | $ | 488,027 | |||||||
| |
Balance as of January 1, 2009 |
Additions | Deductions | Goodwill Impairment |
Balance as of December 31, 2009 |
||||||||||||
|---|---|---|---|---|---|---|---|---|---|---|---|---|---|---|---|---|---|
Membership and Exchange |
$ | 474,677 | $ | — | $ | — | $ | — | $ | 474,677 | |||||||
Management and Rental |
5,190 | — | — | — | 5,190 | ||||||||||||
Total |
$ | 479,867 | $ | — | $ | — | $ | — | $ | 479,867 | |||||||
The $8.2 million change in goodwill during the year ended December 31, 2010 related to the goodwill acquired in connection with the acquisition of TPI. On November 30, 2010, we acquired all of the equity in TPI resulting in goodwill of $8.2 million and identifiable intangible assets of $7.5 million. Goodwill is assigned to reporting units of ILG that are expected to benefit from the synergies of the combination. The amount of goodwill assigned to a reporting unit is determined in a manner similar to how the amount of goodwill recognized in a business combination is determined, while using a reasonable methodology applied in a consistent manner. At the conclusion of this analysis, we assigned $5.9 million of goodwill to our Membership and Exchange reporting unit and $2.2 million of goodwill to our Management and Rental reporting unit. There were no changes in goodwill in either of our reporting units during the year ended December 31, 2009.
Accumulated goodwill impairment losses as of January 1, 2009 were $34.3 million for our Management and Rental segment. There were no impairments of goodwill for our Management and Rental segment during fiscal year 2010 and 2009 and there have been no impairments of goodwill for our Membership and Exchange segment.
77
INTERVAL LEISURE GROUP, INC. AND SUBSIDIARIES
NOTES TO CONSOLIDATED FINANCIAL STATEMENTS (Continued)
DECEMBER 31, 2010
NOTE 3—GOODWILL AND OTHER INTANGIBLE ASSETS
Other Intangible Assets
Intangible assets with indefinite lives relate principally to trade names and trademarks. The balance of intangible assets, net is as follows (in thousands):
| |
December 31, | |||||||
|---|---|---|---|---|---|---|---|---|
| |
2010 | 2009 | ||||||
Intangible assets with indefinite lives |
$ | 37,616 | $ | 35,300 | ||||
Intangible assets with definite lives, net |
82,854 | 104,024 | ||||||
Total intangible assets, net |
$ | 120,470 | $ | 139,324 | ||||
At December 31, 2010, intangible assets with definite lives relate to the following (in thousands):
| |
Cost | Accumulated Amortization |
Net | Weighted Average Remaining Amortization Life (Years) |
||||||||||
|---|---|---|---|---|---|---|---|---|---|---|---|---|---|---|
Customer relationships |
$ | 129,500 | $ | (107,116 | ) | $ | 22,384 | 1.7 | ||||||
Purchase agreements |
75,879 | (60,835 | ) | 15,044 | 2.5 | |||||||||
Resort management contracts |
48,166 | (11,738 | ) | 36,428 | 10.1 | |||||||||
Technology |
24,726 | (24,633 | ) | 93 | 2.9 | |||||||||
Other |
17,427 | (8,522 | ) | 8,905 | 5.6 | |||||||||
Total |
$ | 295,698 | $ | (212,844 | ) | $ | 82,854 | |||||||
2010 Recoverability Test
As of March 31, 2010, as a consequence of the Management and Rental reporting unit failing step one of the two step process for testing goodwill for impairment, we performed a recoverability test on an asset group within our Management and Rental reporting unit. The asset group at the time consisted of Aston's property management contracts and wholesaler agreements definite-lived intangible assets, certain real estate assets owned by Aston and used in the purveyance of revenue generating services pursuant to the aforementioned property management contracts and wholesaler agreements, and Aston's tradename definite-lived intangible asset. The resulting recoverability analysis concluded that the undiscounted estimated future cash flows of the asset group exceeded its carrying value by approximately 19% of the asset group's carrying value. Accordingly, the asset group was not considered impaired.
The measurement period used for the recoverability analysis was 11 years, the remaining useful life of the property management contracts asset (the asset group's primary asset). The asset group's cash flows exceeded their carrying amounts in our recoverability test largely because, pursuant to U.S. GAAP, this analysis utilizes an undiscounted cash flow approach. This method differs from the manner in which the fair value of the asset group is calculated as part of our step two goodwill and other intangibles impairment analysis previously discussed.
78
INTERVAL LEISURE GROUP, INC. AND SUBSIDIARIES
NOTES TO CONSOLIDATED FINANCIAL STATEMENTS (Continued)
DECEMBER 31, 2010
NOTE 3—GOODWILL AND OTHER INTANGIBLE ASSETS (Continued)
At December 31, 2009, intangible assets with definite lives relate to the following (in thousands):
| |
Cost | Accumulated Amortization |
Net | Weighted Average Remaining Amortization Life (Years) |
||||||||||
|---|---|---|---|---|---|---|---|---|---|---|---|---|---|---|
Customer relationships |
$ | 129,500 | $ | (94,161 | ) | $ | 35,339 | 2.7 | ||||||
Purchase agreements |
73,500 | (53,443 | ) | 20,057 | 2.7 | |||||||||
Resort management contracts |
45,700 | (8,433 | ) | 37,267 | 11.4 | |||||||||
Technology |
24,630 | (24,630 | ) | — | — | |||||||||
Other |
17,151 | (5,790 | ) | 11,361 | 6.2 | |||||||||
Total |
$ | 290,481 | $ | (186,457 | ) | $ | 104,024 | |||||||
Amortization of intangible assets with definite lives is computed on a straight-line basis. Total amortization expense for intangible assets subject to amortization was $26.4 million, $26.0 million and $25.9 million for the years ended December 31, 2010, 2009, and 2008, respectively. Based on the December 31, 2010 balances, such amortization for the next five years and thereafter is estimated to be as follows (in thousands):
Years Ending December 31,
|
|
|||
|---|---|---|---|---|
2011 |
$ | 27,184 | ||
2012 |
20,828 | |||
2013 |
5,447 | |||
2014 |
5,291 | |||
2015 |
5,183 | |||
2016 and thereafter |
18,921 | |||
|
$ | 82,854 | ||
NOTE 4—PROPERTY AND EQUIPMENT
The balance of property and equipment, net is as follows (in thousands):
| |
December 31, | |||||||
|---|---|---|---|---|---|---|---|---|
| |
2010 | 2009 | ||||||
Computer equipment |
$ | 18,189 | $ | 14,978 | ||||
Capitalized software |
67,054 | 45,423 | ||||||
Buildings and leasehold improvements |
21,222 | 21,080 | ||||||
Furniture and other equipment |
11,088 | 10,629 | ||||||
Projects in progress |
1,128 | 10,011 | ||||||
|
118,681 | 102,121 | ||||||
Less: accumulated depreciation and amortization |
(67,781 | ) | (57,721 | ) | ||||
Total property and equipment, net |
$ | 50,900 | $ | 44,400 | ||||
79
INTERVAL LEISURE GROUP, INC. AND SUBSIDIARIES
NOTES TO CONSOLIDATED FINANCIAL STATEMENTS (Continued)
DECEMBER 31, 2010
NOTE 5—LONG-TERM DEBT
The balance of long-term debt is as follows (in thousands):
| |
December 31, | |||||||
|---|---|---|---|---|---|---|---|---|
| |
2010 | 2009 | ||||||
9.5% Interval Senior Notes, net of unamortized discount of $18,424 and $20,710, respectively |
$ | 281,576 | $ | 279,290 | ||||
Term loan (interest rate of 2.76% at December 31, 2010 and 2.73% at December 31, 2009) |
76,000 | 116,000 | ||||||
Revolving credit facility |
— | — | ||||||
Total long-term debt |
357,576 | 395,290 | ||||||
Less: Current maturities |
— | — | ||||||
Total long-term debt, net of current maturities |
$ | 357,576 | $ | 395,290 | ||||
9.5% Interval Senior Notes
In connection with the spin-off of ILG, on July 17, 2008, Interval Acquisition Corp., a subsidiary of ILG, ("Issuer") agreed to issue $300.0 million of aggregate principal amount of 9.5% Senior Notes due 2016 ("Interval Senior Notes") to IAC, and IAC agreed to exchange such Interval Senior Notes for certain of IAC's 7% senior unsecured notes due 2013 pursuant to a notes exchange and consent agreement. The issuance occurred on August 19, 2008 with original issue discount of $23.5 million, based on the difference between the interest rate on the notes and the effective interest rate that would have been payable on the notes if issued in a market transaction based on market conditions existing on July 17, 2008, the date of pricing, estimated to be 11%. The exchange occurred on August 20, 2008. Interest on the Interval Senior Notes is payable semi-annually in cash in arrears on September 1 and March 1 of each year, commencing March 1, 2009. The Interval Senior Notes are guaranteed by all entities that are domestic subsidiaries of the Issuer and by ILG. The Interval Senior Notes are redeemable by the Issuer in whole or in part, on or after September 1, 2012, at a redemption price equal to 100% of the principal amount plus accrued and unpaid interest. In addition, in the event of a change of control (as defined in the indenture), the Issuer is obligated to make an offer to all holders to purchase the Interval Senior Notes at a price equal to 101% of the face amount. The change of control put option is a derivative that, upon adoption of ASU 2010-08, is not required to be bifurcated from the host instrument. Prior to the adoption of ASU 2010-08, this derivative was not bifurcated as the value of the derivative was not material to our financial position and results of operations. Subject to specified exceptions, the Issuer is required to make an offer to purchase Interval Senior Notes at a price equal to 100% of the face amount, in the event the Issuer or its restricted subsidiaries complete one or more asset sales and more than $25.0 million of the aggregate net proceeds are not invested (or committed to be invested) in the business or used to repay senior debt within one year after receipt of such proceeds. The original issue discount is being amortized to "Interest expense" using the effective interest method through maturity.
80
INTERVAL LEISURE GROUP, INC. AND SUBSIDIARIES
NOTES TO CONSOLIDATED FINANCIAL STATEMENTS (Continued)
DECEMBER 31, 2010
NOTE 5—LONG-TERM DEBT (Continued)
Senior Secured Credit Facility
In connection with the spin-off of ILG, on July 25, 2008, the Issuer entered into a senior secured credit facility with a maturity of five years, which consists of a $150.0 million term loan (the "Term Loan"), of which $76.0 million is outstanding at December 31, 2010, and a $50.0 million revolving credit facility.
As of December 31, 2010, the remaining principal amount of the Term Loan is payable quarterly through July 25, 2013 ($4.4 million quarterly for fiscal year 2012 and approximately $19.5 million quarterly thereafter). During 2009, we paid $34.0 million of principal payments on the Term Loan, which included scheduled principal payments through December 31, 2010 and $4.0 million which was applied pro rata to the remaining scheduled principal payments. During 2010, we paid $40.0 million of principal payments on the Term Loan, which included voluntary prepayments of scheduled principal payments through December 31, 2011 and $18.3 million applied pro rata to the remaining scheduled principal payments. Any principal amounts outstanding under the revolving credit facility are due at maturity. The interest rates per annum applicable to loans under the senior secured credit facility are, at the Issuer's option, equal to either a base rate or a LIBOR rate plus an applicable margin, which varies with the total leverage ratio of the Issuer. As of December 31, 2010, the applicable margin was 2.50% per annum for LIBOR term loans, 2.00% per annum for LIBOR revolving loans, 1.50% per annum for base rate term loans and 1.00% per annum for base rate revolving loans. The revolving credit facility has a facility fee of 0.50%.
We have a letter of credit sublimit as part of our revolving credit facility. The amount available to be borrowed under the revolving credit facility is reduced on a dollar-for-dollar basis by the cumulative amount of any outstanding letters of credit, which totaled $20,000 at December 31, 2010, leaving $50.0 million of borrowing capacity at December 31, 2010. There have been no borrowings under the revolving credit facility through December 31, 2010.
All obligations under the senior secured credit facilities are unconditionally guaranteed by ILG and each of the Issuer's existing and future direct and indirect domestic subsidiaries, subject to certain exceptions, and are secured by substantially all their assets. The secured credit facility ranks prior to the Interval Senior Notes to the extent of the value of the assets that secure it.
Restrictions and Covenants
The Interval Senior Notes and senior secured credit facility have various financial and operating covenants that place significant restrictions on us, including our ability to incur additional indebtedness, to incur additional liens, issue redeemable stock and preferred stock, pay dividends or distributions or redeem or repurchase capital stock, prepay, redeem or repurchase debt, make loans and investments, enter into agreements that restrict distributions from our subsidiaries, sell assets and capital stock of our subsidiaries, enter into certain transactions with affiliates and consolidate or merge with or into or sell substantially all of our assets to another person. The senior secured credit facility requires us to meet certain financial covenants requiring the maintenance of a maximum consolidated leverage ratio of consolidated debt over consolidated Earnings Before Interest, Taxes, Depreciation and Amortization ("EBITDA"), as defined in the credit agreement (3.90 through December 31, 2009, 3.65 from January 1, 2010 through December 31, 2010 and 3.40 thereafter), and a minimum consolidated interest
81
INTERVAL LEISURE GROUP, INC. AND SUBSIDIARIES
NOTES TO CONSOLIDATED FINANCIAL STATEMENTS (Continued)
DECEMBER 31, 2010
NOTE 5—LONG-TERM DEBT (Continued)
coverage ratio of consolidated EBITDA over consolidated interest expense, as defined in the credit agreement (2.75 through December 31, 2009 and 3.00 thereafter). In addition, we may be required to use a portion of our consolidated excess cash flow (as defined in the credit agreement) to prepay the senior secured credit facility based on our consolidated leverage ratio at the end of each fiscal year. If our consolidated leverage ratio equals or exceeds 3.5, we must prepay 50% of consolidated excess cash flow, if our consolidated leverage ratio equals or exceeds 2.85 but is less than 3.5, we must prepay 25% of consolidated excess cash flow, and if our consolidated leverage ratio is less than 2.85, then no prepayment is required. As of December 31, 2010, ILG was in compliance in all material respects with the requirements of all applicable financial and operating covenants and our consolidated leverage ratio and consolidated interest coverage ratio under the credit agreement were 2.47 and 4.61, respectively.
At December 31, 2010, aggregate maturities of long-term debt were as follows (in thousands):
Year Ending December 31,
|
|
|||
|---|---|---|---|---|
2011 |
$ | — | ||
2012 |
17,538 | |||
2013 |
58,462 | |||
2014 |
— | |||
2015 |
— | |||
Thereafter |
300,000 | |||
|
376,000 | |||
Unamortized discount of Interval Senior Notes |
(18,424 | ) | ||
Total |
$ | 357,576 | ||
Interest expense for the years ended December 31, 2010 and 2009 was $35.8 million and $37.3 million, respectively, net of capitalized interest of $1.1 million and $0.4 million, respectively, relating to internally capitalized software. Interest expense for the year ended December 31, 2008 was $15.9 million.
Debt Issuance Costs
At December 31, 2010 and 2009, total unamortized debt issue costs were $7.3 million, net of $6.2 million of accumulated amortization and $9.6 million, net of $3.8 million of accumulated amortization, respectively, which were included in "Other non-current assets." Debt issuance costs are amortized to "Interest expense" through maturity of the related debt using the effective interest method.
NOTE 6—FAIR VALUE MEASUREMENTS
In accordance with ASC Topic 820, "Fair Value Measurements and Disclosures," ("ASC 820") the fair value of an asset is considered to be the price at which the asset could be sold in an orderly transaction between unrelated knowledgeable and willing parties. A liability's fair value is defined as the amount that would be paid to transfer the liability to a new obligor, not the amount that would be paid to settle the liability with the creditor. Assets and liabilities recorded at fair value are measured
82
INTERVAL LEISURE GROUP, INC. AND SUBSIDIARIES
NOTES TO CONSOLIDATED FINANCIAL STATEMENTS (Continued)
DECEMBER 31, 2010
NOTE 6—FAIR VALUE MEASUREMENTS (Continued)
using a three-tier fair value hierarchy, which prioritizes the inputs used in measuring fair value. These tiers include:
Level 1—Observable inputs that reflect quoted prices in active markets
Level 2—Inputs other than quoted prices in active markets that are either directly or indirectly observable
Level 3—Unobservable inputs in which little or no market data exists, therefore requiring the company to develop its own assumptions
As part of the acquisition of TPI in fourth quarter 2010, we may be obligated to pay contingent consideration in an amount ranging from zero up to a total of $5.0 million to TPI's former owners during the three year period subsequent to the acquisition should TPI meet certain earnings targets. We calculated the fair value of the contingent consideration as of November 30, 2010, the acquisition date, to be $2.7 million using a probability-weighted income approach and based on significant inputs not observable in the market and thus represents a Level 3 measurement within the fair value hierarchy. There have been no subsequent changes in the fair value of this contingent consideration as of December 31, 2010 of which $0.9 million is included in other short-term liabilities and $1.9 million is included in other long-term liabilities in our consolidated balance sheet as of December 31, 2010. Changes in the fair value of the contingent consideration resulting from events after the acquisition date will be recognized in earnings in our consolidated statements of income, and may result from changes in discount periods and rates and changes in the timing and amount of financial estimates.
Fair Value of Financial Instruments
The estimated fair value of financial instruments below has been determined using available market information and appropriate valuation methodologies, as applicable. There have been no changes in the methods and significant assumptions used to estimate the fair value of financial instruments during the year other than using quoted prices for our Interval Senior Notes commencing in the second quarter 2009. Our financial instruments include guarantees, letters of credit and surety bonds. These commitments are in place to facilitate our commercial operations.
| |
December 31, 2010 | December 31, 2009 | |||||||||||
|---|---|---|---|---|---|---|---|---|---|---|---|---|---|
| |
Carrying Amount |
Fair Value |
Carrying Amount |
Fair Value |
|||||||||
| |
(In thousands) |
||||||||||||
Cash and cash equivalents |
$ | 180,502 | $ | 180,502 | $ | 160,014 | $ | 160,014 | |||||
Restricted cash and cash equivalents |
4,118 | 4,118 | 5,243 | 5,243 | |||||||||
Long-term debt |
(357,576 | ) | (403,000 | ) | (395,290 | ) | (443,000 | ) | |||||
Guarantees, surety bonds and letters of credit |
N/A | (21,238 | ) | N/A | (29,166 | ) | |||||||
The carrying amounts of cash and cash equivalents and restricted cash and cash equivalents reflected in the accompanying consolidated balance sheets approximate fair value as they are redeemable at par upon notice or maintained with various high-quality financial institutions and have original maturities of three months or less. Under the fair value hierarchy established in ASC 820, cash
83
INTERVAL LEISURE GROUP, INC. AND SUBSIDIARIES
NOTES TO CONSOLIDATED FINANCIAL STATEMENTS (Continued)
DECEMBER 31, 2010
NOTE 6—FAIR VALUE MEASUREMENTS (Continued)
and cash equivalents and restricted cash and cash equivalents are stated at fair value based on quoted prices in active markets for identical assets or liabilities.
Borrowings under our Interval Senior Notes and Term Loan are carried at historical cost and adjusted for amortization of the discount on our Interval Senior Notes and principal payments. The fair value of these borrowings was estimated using quoted prices for our Interval Senior Notes as of December 31, 2010 and 2009 and inputs other than quoted prices that are observable for the Term Loan as of December 31, 2010 and 2009, either directly or indirectly, which are intrinsic to the terms of the related agreement, such as interest rates and credit risk. Due to the infrequency at which trades occur on our Interval Senior Notes, we deem the quoted prices used to arrive at the fair value of our Interval Senior Notes to be from an inactive market and thus a Level 2 input pursuant to ASC 820.
The guarantees, surety bonds, and letters of credit represent liabilities that are carried on our balance sheet only when a future related contingent event becomes probable and reasonably estimable.
NOTE 7—STOCKHOLDERS' EQUITY
ILG has 300 million authorized shares of common stock, par value of $.01 per share. At December 31, 2010, there were 57.1 million shares of ILG common stock outstanding.
ILG has 25 million authorized shares of preferred stock, par value $.01 per share, none of which are issued or outstanding as of December 31, 2010. The Board of Directors has the authority to issue the preferred stock in one or more series and to establish the rights, preferences, and dividends.
In addition to the ordinary vesting of RSUs in 2009, we delivered 115,144 of deferred RSUs, net of withholding taxes, which represented RSUs accelerated to vest prior to the spin-off, but for which the issuance of shares of common stock was deferred until January 2, 2009.
Stockholder Rights Plan
In June 2009, ILG's Board of Directors approved the creation of a Series A Junior Participating Preferred Stock, adopted a stockholders rights plan and declared a dividend of one right for each outstanding share of common stock held by our stockholders of record as of the close of business on June 22, 2009. The rights attach to any additional shares of common stock issued after June 22, 2009. These rights, which trade with the shares of our common stock, currently are not exercisable. Under the rights plan, these rights will be exercisable if a person or group acquires or commences a tender or exchange offer for 15% or more of our common stock. The rights plan provides certain exceptions for acquisitions by Liberty Media Corporation in accordance with an agreement entered into with ILG in connection with its spin-off from IAC. If the rights become exercisable, each right will permit its holder, other than the "acquiring person," to purchase from us shares of common stock at a 50% discount to the then prevailing market price. As a result, the rights will cause substantial dilution to a person or group that becomes an "acquiring person" on terms not approved by our Board of Directors.
NOTE 8—BENEFIT PLANS
Prior to the spin-off and through December 31, 2008, ILG participated in a retirement saving plan sponsored by IAC. Effective January 1, 2009, the net assets available for benefits for the employees of
84
INTERVAL LEISURE GROUP, INC. AND SUBSIDIARIES
NOTES TO CONSOLIDATED FINANCIAL STATEMENTS (Continued)
DECEMBER 31, 2010
NOTE 8—BENEFIT PLANS (Continued)
ILG was transferred from the IAC plan to a newly created ILG plan. Under the new retirement savings plan sponsored by ILG that qualified under Section 401(k) of the Internal Revenue Code, participating employees may contribute up to 50.0% of their pre-tax earnings, but not more than statutory limits. ILG originally provided a discretionary match under the ILG plan of fifty cents for each dollar a participant contributed into the plan with a maximum contribution of 3% of a participant's eligible earnings, subject to IRS restrictions. Effective March 1, 2009, we suspended matching contributions. There were no matching contributions for the ILG plan for the year ended December 31, 2010 and matching contributions for the year ended December 31, 2009 pertaining to the first quarter 2009 period were $0.3 million. Matching contributions for the IAC plan were approximately $1.6 million for the year ended December 31, 2008. Matching contributions were invested in the same manner as each participant's voluntary contributions in the investment options provided under the plan.
During the three years ended December 31, 2010, 2009 and 2008, we also had or participated in various benefit plans, principally defined contribution plans, for non-U.S. employees. Our contributions for these plans were approximately $0.2 million in 2010 and $0.3 million in each of 2009 and 2008.
Effective August 20, 2008, a deferred compensation plan (the "Director Plan") was established to provide non-employee directors of ILG an option to defer director fees on a tax-deferred basis. Participants in the Director Plan are allowed to defer a portion or all of their compensation and are 100% vested in their respective deferrals and earnings. With respect to director fees earned for services performed after the date of such election, participants may choose from receiving cash or stock at the end of the deferral period. ILG has reserved 100,000 shares of common stock for issuance pursuant to this plan, of which 21,678 share units were outstanding at December 31, 2010. ILG does not provide matching or discretionary contributions to participants in the Director Plan. Any deferred compensation elected to be received in stock is included in diluted earnings per share.
NOTE 9—STOCK-BASED COMPENSATION
Prior to the spin-off, equity awards to ILG employees were granted under various IAC stock and annual incentive plans. In connection with the spin-off, all of IAC's existing RSUs and stock options were modified, either accelerated and vested, or converted accordingly, based on a conversion factor. All RSUs awarded prior to August 8, 2005 and all RSUs awarded on or after August 8, 2005 but scheduled to vest on or before February 28, 2009 were granted accelerated vesting, resulting in the recognition of $2.1 million of additional non-recurring non-cash compensation expense during the year ended December 31, 2008 related to the acceleration of previously unrecognized expense. RSUs not subject to accelerated vesting as discussed above, were converted to ILG RSUs under the 2008 Incentive Plan (defined below), based on a conversion factor, following the spin-off.
Each IAC option granted prior to January 1, 2008 converted in part into an option to purchase shares of ILG common stock, based on a conversion factor. No ILG employees or former employees held any options as of August 20, 2008. In connection with the spin-off, 2.1 million stock options to purchase ILG common stock were granted to non-ILG employees for which there is no future compensation expense to be recognized by ILG. To the extent that these stock options are dilutive, we have included them in the diluted earnings per share. As of December 31, 2010 and 2009, 1.3 million and 1.7 million, respectively, of stock options remained outstanding.
85
INTERVAL LEISURE GROUP, INC. AND SUBSIDIARIES
NOTES TO CONSOLIDATED FINANCIAL STATEMENTS (Continued)
DECEMBER 31, 2010
NOTE 9—STOCK-BASED COMPENSATION (Continued)
The modification of RSUs not subject to accelerated vesting resulted in an additional non-recurring non-cash compensation expense related to a step-up in basis modification of $1.3 million of which $0.3 million, $0.5 million and $0.2 million was recognized during the years ended December 31, 2010, 2009 and 2008, respectively and the remaining $0.3 million will be recognized over the vesting period of the associated modified unvested RSUs.
On August 20, 2008, ILG established the ILG 2008 Stock and Annual Incentive Plan (the "2008 Incentive Plan") which provides for the grant of stock options, stock appreciation rights, restricted stock, restricted stock units, and other stock-based awards. In connection with the spin-off, certain prior awards under IAC's plans were adjusted to convert, in whole or in part, to awards under the 2008 Incentive Plan under which RSUs and options relating to 2.9 million shares of common stock were issued. At the time of the spin-off, an additional 5.0 million shares of common stock were reserved for issuance under the 2008 Incentive Plan. As of December 31, 2010, 2.3 million shares remain available for future issuance under this plan.
RSUs are awards in the form of phantom shares or units, denominated in a hypothetical equivalent number of shares of ILG common stock and with the value of each award equal to the fair value of ILG common stock at the date of grant. All outstanding award agreements provide for settlement, upon vesting, in stock for U.S. employees. For non-U.S. employees, all grants issued prior to the spin-off provide for settlement upon vesting in cash, while grants since the spin-off provide for settlement upon vesting in stock. Each RSU is subject to service-based vesting, where a specific period of continued employment must pass before an award vests. Certain RSUs, in addition, are subject to attaining specific performance criteria. ILG recognizes non-cash compensation expense for all RSUs held by ILG's employees (including RSUs for stock of IAC or the other spun-off companies held by ILG employees) for which vesting is considered probable. For RSUs to be settled in stock, the accounting charge is measured at the grant date as the fair value of ILG common stock and expensed on a straight-line basis as non-cash compensation over the vesting term. The expense associated with RSU awards (including RSUs for stock of IAC or the other spun-off companies) to be settled in cash is initially measured at fair value at the grant date and expensed ratably over the vesting term, recording a liability subject to mark-to-market adjustments for changes in the price of the respective common stock, as compensation expense within general and administrative expense. The expense related to awards to international employees totaled $0.2 million, $0.2 million and $0.3 million for the years ended December 31, 2010, 2009 and 2008, respectively.
On August 20, 2008, in connection with the spin-off, non-employee members of the Board of Directors and certain ILG executive officers were awarded a total of 917,137 RSUs under the 2008 Incentive Plan. The aggregate estimated value of the awards is being amortized to expense on a straight-line basis over the applicable vesting period of the awards.
On March 24, 2009, the Compensation Committee granted 1.2 million RSUs, vesting over three to four years, to certain officers and employees of ILG and its subsidiaries. Of these RSUs, 183,391 were subject to 2009 performance criteria that could result between 0% and 200% of these awards being earned based on EBITDA targets. These performance RSUs were earned at 117.9% of target. However, vesting is subject to additional service requirements.
86
INTERVAL LEISURE GROUP, INC. AND SUBSIDIARIES
NOTES TO CONSOLIDATED FINANCIAL STATEMENTS (Continued)
DECEMBER 31, 2010
NOTE 9—STOCK-BASED COMPENSATION (Continued)
On March 2, 2010, the Compensation Committee granted approximately 460,000 RSUs, vesting over three to four years, to certain officers and employees of ILG and its subsidiaries. Of these RSUs, approximately 64,000 are subject to performance criteria that could result in between 0% and 200% of these awards being earned based on EBITDA targets.
Non-cash compensation expense related to RSUs for the years ended December 31, 2010, 2009 and 2008 was $10.1 million, $10.6 million and $8.8 million, respectively. Included in non-cash compensation expense for 2009 is a cumulative catch-up adjustment of $1.3 million related to the change in the estimated forfeiture rate in the fourth quarter of 2009. Included in non-cash compensation expense for 2008 is a non-recurring amount of $2.1 million related to the accelerated vesting of certain RSUs. Non-cash compensation expense for 2008 through the date of the spin-off was maintained by and allocated to us from IAC. At December 31, 2010, there was approximately $18.1 million of unrecognized compensation cost, net of forfeitures, related to RSUs, which is currently expected to be recognized over a weighted average period of approximately 1.8 years.
The amount of stock-based compensation expense recognized in the consolidated statements of income is reduced by estimated forfeitures, as the amount recorded is based on awards ultimately expected to vest. The forfeiture rate is estimated at the grant date based on historical experience and revised, if necessary, in subsequent periods for any changes to the estimated forfeiture rate from that previously estimated. For any vesting tranche of an award, the cumulative amount of compensation cost recognized is equal to the portion of the grant-date value of the award tranche that is actually vested at that date.
Non-cash stock-based compensation expense related to equity awards is included in the following line items in the accompanying consolidated statements of income for the years ended December 31, 2010, 2009 and 2008 (in thousands):
| |
Year Ended December 31, | |||||||||
|---|---|---|---|---|---|---|---|---|---|---|
| |
2010 | 2009 | 2008 | |||||||
Cost of sales |
$ | 448 | $ | 683 | $ | 660 | ||||
Selling and marketing expense |
627 | 789 | 722 | |||||||
General and administrative expense |
9,040 | 9,101 | 7,438 | |||||||
Non-cash stock based compensation expense before income taxes |
10,115 | 10,573 | 8,820 | |||||||
Income tax benefit |
(3,660 | ) | (3,765 | ) | (3,443 | ) | ||||
Non-cash stock based compensation expense after income taxes |
$ | 6,455 | $ | 6,808 | $ | 5,377 | ||||
Non-cash compensation related to the period before the spin-off was recorded in receivables from IAC and subsidiaries, which was extinguished at the time of the spin-off.
87
INTERVAL LEISURE GROUP, INC. AND SUBSIDIARIES
NOTES TO CONSOLIDATED FINANCIAL STATEMENTS (Continued)
DECEMBER 31, 2010
NOTE 9—STOCK-BASED COMPENSATION (Continued)
The following table summarizes RSU activity during the year ended December 31, 2010:
| |
Shares | Weighted-Average Grant Date Fair Value |
|||||
|---|---|---|---|---|---|---|---|
| |
(In thousands) |
|
|||||
Non-vested RSUs at January 1 |
2,643 | $ | 12.46 | ||||
Granted |
615 | 13.72 | |||||
Vested |
(733 | ) | 15.38 | ||||
Forfeited |
(15 | ) | 20.50 | ||||
Non-vested RSUs at December 31 |
2,510 | $ | 12.04 | ||||
The following table summarizes RSU activity during the year ended December 31, 2009:
| |
Shares | Weighted-Average Grant Date Fair Value |
|||||
|---|---|---|---|---|---|---|---|
| |
(In thousands) |
|
|||||
Non-vested RSUs at January 1 |
1,685 | $ | 18.72 | ||||
Granted |
1,282 | 5.40 | |||||
Vested |
(261 | ) | 16.13 | ||||
Forfeited |
(63 | ) | 20.26 | ||||
Non-vested RSUs at December 31 |
2,643 | $ | 12.46 | ||||
The following table summarizes RSU activity during the year ended December 31, 2008:
| |
Shares | Weighted-Average Grant Date Fair Value |
|||||
|---|---|---|---|---|---|---|---|
| |
(In thousands) |
|
|||||
Non-vested RSUs at January 1 |
— | $ | — | ||||
Transfer from IAC |
775 | 24.21 | |||||
Granted |
917 | 14.12 | |||||
Vested |
— | — | |||||
Forfeited |
(7 | ) | 24.74 | ||||
Non-vested RSUs at December 31 |
1,685 | $ | 18.72 | ||||
In connection with the acquisition of Aston by ILG in 2007, a member of Aston's management was granted non-voting restricted common equity in Aston. This award was granted on May 31, 2007 and was initially measured at fair value, which is being amortized over the vesting period. This award vests ratably over four and a half years, or earlier based upon the occurrence of certain prescribed events. These shares are subject to a put right by the holder and a call right by ILG, which are not exercisable until the first quarter of 2013 and annually thereafter. The value of these shares upon exercise of the put or call is equal to their fair market value, determined by negotiation or arbitration, reduced by the accreted value of the preferred interest that was taken by ILG upon the purchase of Aston. The initial
88
INTERVAL LEISURE GROUP, INC. AND SUBSIDIARIES
NOTES TO CONSOLIDATED FINANCIAL STATEMENTS (Continued)
DECEMBER 31, 2010
NOTE 9—STOCK-BASED COMPENSATION (Continued)
value of the preferred interest was equal to the acquisition price of Aston. The preferred interest accretes at a 10% annual rate. Upon exercise of the put or call, the consideration payable can be denominated in ILG shares, cash or a combination thereof at ILG's option. An additional put right by the holder and call right by ILG would require, upon exercise, the purchase of these non-voting common shares by ILG immediately prior to a registered public offering by Aston, at the public offering price. The unrecognized compensation cost related to this equity award is $0.1 million and $0.2 million at December 31, 2010 and 2009, respectively.
NOTE 10—INCOME TAXES
Prior to the spin-off, ILG was a member of IAC's consolidated federal and state tax returns. Subsequent to the spin-off ILG files its own consolidated federal and state tax returns. In all periods presented, current and deferred tax expense has been computed for ILG on a separate return basis. ILG's payments to IAC related to its share of IAC's consolidated federal and state tax return liabilities have been reflected within cash flows from operating activities in the accompanying consolidated statements of cash flows.
U.S. and foreign earnings from continuing operations before income taxes and noncontrolling interest are as follows (in thousands):
| |
Year Ended December 31, | |||||||||
|---|---|---|---|---|---|---|---|---|---|---|
| |
2010 | 2009 | 2008 | |||||||
U.S. |
$ | 58,421 | $ | 55,099 | $ | 56,996 | ||||
Foreign |
10,451 | 9,168 | 18,998 | |||||||
Total |
$ | 68,872 | $ | 64,267 | $ | 75,994 | ||||
The components of the provision for income taxes attributable to continuing operations are as follows (in thousands):
| |
Year Ended December 31, | |||||||||
|---|---|---|---|---|---|---|---|---|---|---|
| |
2010 | 2009 | 2008 | |||||||
Current income tax provision (benefit) |
||||||||||
Federal |
$ | 12,807 | $ | (777 | ) | $ | 57,222 | |||
State |
2,779 | (93 | ) | 9,921 | ||||||
Foreign |
3,194 | 3,366 | 5,776 | |||||||
Current income tax provision |
$ | 18,780 | $ | 2,496 | $ | 72,919 | ||||
Deferred income tax provision (benefit) |
||||||||||
Federal |
$ | 5,881 | $ | 19,753 | $ | (36,213 | ) | |||
State |
1,290 | 4,158 | (6,047 | ) | ||||||
Foreign |
506 | (349 | ) | 157 | ||||||
Deferred income tax provision (benefit) |
7,677 | 23,562 | (42,103 | ) | ||||||
Income tax provision |
$ | 26,457 | $ | 26,058 | $ | 30,816 | ||||
89
INTERVAL LEISURE GROUP, INC. AND SUBSIDIARIES
NOTES TO CONSOLIDATED FINANCIAL STATEMENTS (Continued)
DECEMBER 31, 2010
NOTE 10—INCOME TAXES (Continued)
There were no significant reductions in current income taxes payable for the years ended December 31, 2010, 2009, and 2008 for tax deductions attributable to stock-based compensation. The related income tax benefits of stock-based compensation are recorded as amounts charged or credited to additional paid in capital or a reduction in goodwill.
The tax effects of cumulative temporary differences that give rise to significant portions of the deferred tax assets and deferred tax liabilities at December 31, 2010 and 2009 are presented below (in thousands). The valuation allowance is related to items for which it is more likely than not that the tax benefit will not be realized.
| |
December 31, | ||||||
|---|---|---|---|---|---|---|---|
| |
2010 | 2009 | |||||
Deferred tax assets: |
|||||||
Deferred revenue |
$ | 51,114 | $ | 52,276 | |||
Provision for accrued expenses |
3,914 | 4,240 | |||||
Non-cash compensation |
3,861 | 4,164 | |||||
Net operating loss and tax credit carryforwards |
1,356 | 2,228 | |||||
Other |
487 | 2,635 | |||||
Total deferred tax assets |
60,732 | 65,543 | |||||
Less valuation allowance |
(679 | ) | (679 | ) | |||
Net deferred tax assets |
60,053 | 64,864 | |||||
Deferred tax liabilities: |
|||||||
Intangible and other assets |
(97,411 | ) | (97,623 | ) | |||
Deferred membership costs |
(12,607 | ) | (13,579 | ) | |||
Property and equipment |
(9,581 | ) | (3,193 | ) | |||
Other |
(322 | ) | (479 | ) | |||
Total deferred tax liabilities |
(119,921 | ) | (114,874 | ) | |||
Net deferred tax liability |
$ | (59,868 | ) | $ | (50,010 | ) | |
At December 31, 2010, ILG had utilized all of its U.S. federal and state net operating losses ("NOLs"). At December 31, 2010, ILG had foreign NOLs of approximately $2.0 million available to offset future income, virtually all of which can be carried forward indefinitely.
At December 31, 2010, ILG had tax credit carryforwards of approximately $0.7 million related to federal credits for foreign taxes. These tax credits can be carried forward between eight to ten years.
A valuation allowance for deferred tax assets is provided when it is more likely than not that certain deferred tax assets will not be realized. Realization is dependent upon the generation of future taxable income or the reversal of deferred tax liabilities during the periods in which those temporary differences become deductible. We consider the history of taxable income in recent years, the scheduled reversal of deferred tax liabilities, projected future taxable income and tax planning strategies to make this assessment. During 2010, ILG's valuation allowance did not significantly change. At December 31,
90
INTERVAL LEISURE GROUP, INC. AND SUBSIDIARIES
NOTES TO CONSOLIDATED FINANCIAL STATEMENTS (Continued)
DECEMBER 31, 2010
NOTE 10—INCOME TAXES (Continued)
2010, ILG had a valuation allowance of approximately $0.7 million related to virtually all of the foreign NOL carryforwards for which more likely than not the tax benefit will not be realized.
A reconciliation of total income tax provision to the amounts computed by applying the statutory federal income tax rate to earnings before income taxes and noncontrolling interest is shown as follows (in thousands):
| |
Year Ended December 31, | |||||||||
|---|---|---|---|---|---|---|---|---|---|---|
| |
2010 | 2009 | 2008 | |||||||
Income tax provision at the federal statutory rate of 35% |
$ | 24,105 | $ | 22,493 | $ | 26,598 | ||||
State income taxes, net of effect of federal tax benefit |
2,645 | 2,642 | 2,518 | |||||||
Foreign income taxed at a different statutory tax rate |
(616 | ) | (608 | ) | (1,184 | ) | ||||
U.S. tax consequences of foreign operations |
(65 | ) | 11 | 2,353 | ||||||
Non-deductible non-cash compensation expense |
454 | 1,203 | — | |||||||
Other, net |
(66 | ) | 317 | 531 | ||||||
Income tax provision |
$ | 26,457 | $ | 26,058 | $ | 30,816 | ||||
In accordance with ASC 740, no federal and state income taxes have been provided on permanently reinvested earnings of certain foreign subsidiaries aggregating approximately $36.7 million at December 31, 2010. If, in the future, these earnings are repatriated to the U.S., or if ILG determines such earnings will be repatriated to the U.S. in the foreseeable future, additional tax provisions would be required. Due to complexities in the tax laws and the assumptions that would have to be made, it is not practicable to estimate the amounts of income taxes that would have to be provided.
ASC 740 clarifies the accounting for income taxes by prescribing the minimum recognition threshold a tax position is required to meet before being recognized in the financial statements. ASC 740 provides guidance on derecognition, classification, interest and penalties, accounting in interim periods, disclosure and transition. A reconciliation of the beginning and ending amount of unrecognized tax benefits, excluding interest, is as follows:
| |
(In thousands) | |||||||||
|---|---|---|---|---|---|---|---|---|---|---|
| |
2010 | 2009 | 2008 | |||||||
Balance at beginning of year |
$ | 91 | $ | 142 | $ | 5,696 | ||||
Additions based on tax positions related to the current year |
226 | — | — | |||||||
Additions for tax positions of prior years |
705 | — | 2,203 | |||||||
Reductions for tax positions of prior years |
(33 | ) | (51 | ) | (6,938 | ) | ||||
Settlements |
(30 | ) | — | (819 | ) | |||||
Balance at end of year |
$ | 959 | $ | 91 | $ | 142 | ||||
As of December 31, 2010, 2009 and 2008, ILG had unrecognized tax benefits of $1.0 million, $0.1 million, and $0.1 million, respectively. Included in the balance of unrecognized tax benefits as of December 31, 2010, 2009, and 2008, are $0.3 million, $0.1 million and $0.1 million, respectively, of tax benefits that, if recognized, would affect the effective tax rate. Also included in the balance of unrecognized tax benefits as of December 31, 2010 is $0.7 million that represents unrecognized tax
91
INTERVAL LEISURE GROUP, INC. AND SUBSIDIARIES
NOTES TO CONSOLIDATED FINANCIAL STATEMENTS (Continued)
DECEMBER 31, 2010
NOTE 10—INCOME TAXES (Continued)
benefits related to the acquisition of TPI. In connection with our acquisition of TPI, the former shareholders have agreed to indemnify us for all tax liabilities and related interest and penalties for the pre-acquisition period. The net increase of $0.9 million in 2010 in unrecognized tax benefits is due principally to the increase of $0.7 million in foreign taxes as a result of ILG's acquisition of TPI and an increase of $0.2 million related to other income tax items. There were no material increases or decreases in unrecognized tax benefits during 2009. During 2008, unrecognized tax benefits for tax positions included in IAC's consolidated tax return filings increased by $2.2 million, due principally to the completion of a study related to certain U.S. tax consequences of certain of ILG's foreign operations. However, this increase was offset by a decrease of $7.8 million of unrecognized tax benefits during 2008 of which $0.8 million was a result of settlements with taxing authorities and $7.0 million was a result of the spin-off from IAC and the associated Tax Sharing Agreement, which provides that IAC indemnifies ILG for all consolidated tax liabilities and related interest and penalties for the pre-spin period.
ILG recognizes interest and, if applicable, penalties related to unrecognized tax benefits in income tax expense. During 2010, $0.7 million in interest and penalties was accrued primarily related to foreign taxes as a result of the acquisition of TPI. There were no material accruals for interest during 2009 and 2008. At December 31, 2010, 2009 and 2008, ILG has accrued $0.9 million, $0.2 million, and $0.3 million, respectively, for the payment of interest and, if applicable, penalties. The amount accrued for interest and penalties at December 31, 2008, is net of consolidated tax interest and penalties that were indemnified by IAC as a result of the spin-off and the associated Tax Sharing Agreement.
ILG believes that it is reasonably possible that its unrecognized tax benefits could decrease by approximately $0.1 million within twelve months of the current reporting date due primarily to the expiration of the statute of limitations related to foreign taxes. An estimate of other changes in unrecognized tax benefits cannot be made, but is not expected to be significant.
By virtue of previously filed separate company and consolidated tax returns with IAC, ILG is routinely under audit by federal, state, local and foreign taxing authorities. These audits include questioning the timing and the amount of deductions and the allocation of income among various tax jurisdictions. Income taxes payable include amounts considered sufficient to pay assessments that may result from examination of prior year returns; however, the amount paid upon resolution of issues raised may differ from the amount provided. Differences between the reserves for tax contingencies and the amounts owed by ILG are recorded in the period they become known. Under the Tax Sharing Agreement, IAC indemnifies ILG for all consolidated tax liabilities and related interest and penalties for the pre-spin period.
The Internal Revenue Service (IRS) is currently examining the IAC consolidated tax returns for the years ended December 31, 2001 through 2006, which includes our operations from September 24, 2002, our date of acquisition by IAC. The statute of limitations for these years has currently been extended to December 31, 2011, but is expected to be extended further. Various IAC consolidated tax returns that include our operations, filed with state and local jurisdictions, are currently under examination, the most significant of which are California, New York State and New York City, for various tax years beginning with December 31, 2003. During the fourth quarter 2010, the IRS also began its examination of ILG's Federal consolidated tax return for the short period following the
92
INTERVAL LEISURE GROUP, INC. AND SUBSIDIARIES
NOTES TO CONSOLIDATED FINANCIAL STATEMENTS (Continued)
DECEMBER 31, 2010
NOTE 10—INCOME TAXES (Continued)
spin-off and ended December 31, 2008. This examination is still in its initial phase and is expected to be completed prior to the expiration of the statute of limitations in 2012.
During 2010, the U.K. Finance Act of 2010 was enacted, which reduced the U.K. corporate income tax rate from 28% to 27%, effective April 1, 2011. The impact of the U.K. rate reduction, which was not significant to ILG's effective tax rate, has been reflected in the current reporting period. It reduced our U.K. net deferred tax asset and increased income tax expense. The change in the corporate tax rate initially negatively impacts income tax expense as the future benefit expected to be realized from our U.K. net deferred tax assets decreases; however, going forward, the lower corporate tax rate will decrease income tax expense and favorably impact our effective tax rate.
Tax Sharing Agreement
In connection with the spin-off, we entered into a Tax Sharing Agreement with members of the IAC group that were spun-off. As of September 21, 2010, various restrictions under the Tax Sharing Agreement lapsed.
NOTE 11—SEGMENT INFORMATION
The overall concept that ILG employs in determining its operating segments and related financial information is to present them in a manner consistent with how the chief operating decision maker views the businesses, how the businesses are organized as to segment management, and the focus of the businesses with regards to the types of products or services offered or the target market. ILG consists of two operating segments which are also reportable segments. During the fourth quarter of 2010, we changed the names of our two operating segments from Interval to Membership and Exchange and from Aston to Management and Rental, in order to better describe the underlying business operations in the segments. The historical segments' financial information and underlying operational activity did not change, other than the addition of the operations of TPI upon completion of the acquisition on November 30, 2010. Membership and Exchange, our principal business segment, offers travel and leisure related products and services to owners of vacation interests and others mostly through various membership programs, as well as related services to resort developer clients. Management and Rental, our other business segment, provides hotel, condominium resort, timeshare resort and homeowners association management, and vacation rental services to both vacationers and vacation property owners.
93
INTERVAL LEISURE GROUP, INC. AND SUBSIDIARIES
NOTES TO CONSOLIDATED FINANCIAL STATEMENTS (Continued)
DECEMBER 31, 2010
NOTE 11—SEGMENT INFORMATION (Continued)
Information on reportable segments and reconciliation to consolidated operating income is as follows (in thousands):
| |
Year Ended December 31, | |||||||||||
|---|---|---|---|---|---|---|---|---|---|---|---|---|
| |
2010 | 2009 | 2008 | |||||||||
Membership and Exchange |
||||||||||||
Revenue |
$ | 345,228 | $ | 345,967 | $ | 346,919 | ||||||
Cost of sales |
77,741 | 80,703 | 85,105 | |||||||||
Gross profit |
267,487 | 265,264 | 261,814 | |||||||||
Selling and marketing expense |
47,693 | 49,120 | 47,883 | |||||||||
General and administrative expense |
83,387 | 82,674 | 77,347 | |||||||||
Amortization expense |
21,083 | 21,017 | 20,960 | |||||||||
Depreciation expense |
9,690 | 9,057 | 8,592 | |||||||||
Segment operating income |
$ | 105,634 | $ | 103,396 | $ | 107,032 | ||||||
| |
Year Ended December 31, | |||||||||||
|---|---|---|---|---|---|---|---|---|---|---|---|---|
| |
2010 | 2009 | 2008 | |||||||||
Management and Rental |
||||||||||||
Revenue |
$ | 64,212 | $ | 59,019 | $ | 68,879 | ||||||
Cost of sales |
50,563 | 46,703 | 50,970 | |||||||||
Gross profit |
13,649 | 12,316 | 17,909 | |||||||||
Selling and marketing expense |
3,062 | 2,909 | 3,580 | |||||||||
General and administrative expense |
5,593 | 5,219 | 5,127 | |||||||||
Goodwill impairment |
— | — | 34,254 | |||||||||
Amortization expense |
5,304 | 4,944 | 4,946 | |||||||||
Depreciation expense |
847 | 794 | 743 | |||||||||
Segment operating loss |
$ | (1,157 | ) | $ | (1,550 | ) | $ | (30,741 | ) | |||
Consolidated |
||||||||||||
Revenue |
$ | 409,440 | $ | 404,986 | $ | 415,798 | ||||||
Cost of sales |
128,304 | 127,406 | 136,075 | |||||||||
Gross profit |
281,136 | 277,580 | 279,723 | |||||||||
Direct segment operating expenses |
176,659 | 175,734 | 203,432 | |||||||||
Operating income |
$ | 104,477 | $ | 101,846 | $ | 76,291 | ||||||
94
INTERVAL LEISURE GROUP, INC. AND SUBSIDIARIES
NOTES TO CONSOLIDATED FINANCIAL STATEMENTS (Continued)
DECEMBER 31, 2010
NOTE 11—SEGMENT INFORMATION (Continued)
Selected financial information by reporting segment is presented below (in thousands):
| |
December 31, | |||||||
|---|---|---|---|---|---|---|---|---|
| |
2010 | 2009 | ||||||
Total assets: |
||||||||
Membership and Exchange |
$ | 904,973 | $ | 882,777 | ||||
Management and Rental |
78,075 | 75,804 | ||||||
Total |
$ | 983,048 | $ | 958,581 | ||||
| |
Year Ended December 31, | ||||||||||
|---|---|---|---|---|---|---|---|---|---|---|---|
| |
2010 | 2009 | 2008 | ||||||||
Capital expenditures: |
|||||||||||
Membership and Exchange |
$ | 16,026 | $ | 14,268 | $ | 11,791 | |||||
Management and Rental |
417 | 894 | 1,846 | ||||||||
Total |
$ | 16,443 | $ | 15,162 | $ | 13,637 | |||||
ILG maintains operations in the United States and other international territories, primarily the United Kingdom. Geographic information on revenue, which is based on sourcing, and long-lived assets, which are based on physical location, is presented below (in thousands):
| |
Year Ended December 31, | ||||||||||
|---|---|---|---|---|---|---|---|---|---|---|---|
| |
2010 | 2009 | 2008 | ||||||||
Revenue: |
|||||||||||
United States |
$ | 346,289 | $ | 340,420 | $ | 347,699 | |||||
All other countries |
63,151 | 64,566 | 68,099 | ||||||||
Total |
$ | 409,440 | $ | 404,986 | $ | 415,798 | |||||
| |
December 31, | |||||||
|---|---|---|---|---|---|---|---|---|
| |
2010 | 2009 | ||||||
Long-lived assets (excluding goodwill and intangible assets): |
||||||||
United States |
$ | 49,663 | $ | 43,156 | ||||
All other countries |
1,237 | 1,244 | ||||||
Total |
$ | 50,900 | $ | 44,400 | ||||
NOTE 12—COMMITMENTS AND CONTINGENCIES
In the ordinary course of business, ILG is a party to various legal proceedings. ILG establishes reserves for specific legal matters when it determines that the likelihood of an unfavorable outcome is probable and the loss is reasonably estimable. ILG does not establish reserves for identified legal matters when ILG believes that the likelihood of an unfavorable outcome is not probable. Although management currently believes that an unfavorable resolution of claims against ILG, including claims
95
INTERVAL LEISURE GROUP, INC. AND SUBSIDIARIES
NOTES TO CONSOLIDATED FINANCIAL STATEMENTS (Continued)
DECEMBER 31, 2010
NOTE 12—COMMITMENTS AND CONTINGENCIES (Continued)
where an unfavorable outcome is reasonably possible, will not have a material impact on the liquidity, results of operations, or financial condition of ILG, these matters are subject to inherent uncertainties and management's view of these matters may change in the future. ILG also evaluates other contingent matters, including tax contingencies, to assess the probability and estimated extent of potential loss. See Note 10 for a discussion of income tax contingencies.
Lease Commitments
ILG leases office space, computers and equipment used in connection with its operations under various operating leases, many of which contain escalation clauses. We account for leases under ASC Topic 840, "Leases" ("ASC 840").
Future minimum payments under operating lease agreements are as follows (in thousands):
Years Ending December 31,
|
|
||||
|---|---|---|---|---|---|
2011 |
$ | 10,240 | |||
2012 |
8,692 | ||||
2013 |
7,667 | ||||
2014 |
6,513 | ||||
2015 |
5,734 | ||||
Thereafter through 2020 |
20,344 | ||||
Total |
$ | 59,190 | |||
Expense charged to operations under these agreements was $9.5 million, $9.6 million and $9.8 million for the years ended December 31, 2010, 2009 and 2008, respectively. Lease expense is recognized on a straight-line basis over the term of the lease, including any option periods, as appropriate. The same lease term is used for lease classification, the amortization period of related leasehold improvements, and the estimation of future lease commitments.
Included in other liabilities, both current and long-term, as presented in our consolidated balance sheet as of December 31, 2010, are certain unconditional recorded contractual obligations. These obligations and the future periods in which such obligations are expected to settle in cash are as follows (in thousands):
Years Ending December 31,
|
|
|||
|---|---|---|---|---|
2011 |
$ | 3,357 | ||
2012 |
$ | 3,357 | ||
2013 |
$ | 3,857 | ||
2014 |
— | |||
2015 |
— | |||
Thereafter |
— | |||
Total |
$ | 10,571 | ||
96
INTERVAL LEISURE GROUP, INC. AND SUBSIDIARIES
NOTES TO CONSOLIDATED FINANCIAL STATEMENTS (Continued)
DECEMBER 31, 2010
NOTE 12—COMMITMENTS AND CONTINGENCIES (Continued)