Attached files
| file | filename |
|---|---|
| EX-32.2 - EX-32.2 - CENTURY BANCORP INC | d388350dex322.htm |
| EX-32.1 - EX-32.1 - CENTURY BANCORP INC | d388350dex321.htm |
| EX-31.2 - EX-31.2 - CENTURY BANCORP INC | d388350dex312.htm |
| EX-31.1 - EX-31.1 - CENTURY BANCORP INC | d388350dex311.htm |
Table of Contents
UNITED STATES
SECURITIES AND EXCHANGE COMMISSION
Washington, D.C. 20549
FORM 10-Q
(Mark One)
| ☒ | QUARTERLY REPORT PURSUANT TO SECTION 13 OR 15 (d) OF THE SECURITIES EXCHANGE ACT OF 1934 |
For the quarterly period ended June 30, 2017.
or
| ☐ | TRANSITION REPORT PURSUANT TO SECTION 13 OR 15 (d) OF THE SECURITIES EXCHANGE ACT OF 1934 |
Commission file number: 0-15752
CENTURY BANCORP, INC.
(Exact name of registrant as specified in its charter)
| COMMONWEALTH OF MASSACHUSETTS | 04-2498617 | |
| (State or other jurisdiction of incorporation or organization) |
(I.R.S. Employer Identification No.) | |
| 400 MYSTIC AVENUE, MEDFORD, MA | 02155 | |
| (Address of principal executive offices) | (Zip Code) | |
(781) 391-4000
(Registrant’s telephone number, including area code)
Indicate by check mark whether the registrant (1) has filed all reports required to be filed by section 13 or 15 (d) of the Securities Exchange Act of 1934 during the preceding 12 months (or for such shorter period that the registrant was required to file such reports), (2) has been subject to such filing requirements for the past 90 days. ☒ Yes ☐ No
Indicate by check mark whether the registrant has submitted electronically and posted on its corporate Web site, if any, every Interactive Data File required to be submitted and posted pursuant to Rule 405 of Regulation S-T (§232.405 of this chapter) during the preceding 12 months (or for such shorter period that the registrant was required to submit and post such files). ☒ Yes ☐ No
Indicate by check mark whether the registrant is a large accelerated filer, an accelerated filer, a non-accelerated filer, smaller reporting company, or an emerging growth company. See the definitions of “large accelerated filer,” “accelerated filer,” “smaller reporting company,” and “emerging growth company” in Rule 12b-2 of the Exchange Act.
(Check one):
| Large accelerated filer | ☐ | Accelerated filer | ☒ | |||
| Non-accelerated filer | ☐ (Do not check if a smaller reporting company) | Smaller reporting company | ☐ | |||
| Emerging growth company | ☐ | |||||
If an emerging growth company, indicate by check mark if the registrant has elected not to use the extended transition period for complying with any new or revised financial accounting standards provided pursuant to Section 13(a) of the Exchange Act. ☐
Indicate by check mark whether the Registrant is a shell company (as defined in Rule 12b-2 of the Exchange Act). ☐ Yes ☒ No
As of July 31, 2017, the Registrant had outstanding:
| Class A Common Stock, $1.00 par value |
3,603,729 Shares | |||
| Class B Common Stock, $1.00 par value |
1,964,180 Shares |
Table of Contents
Index
| Page Number | ||||
| Part I | 3 | |||
| Financial Statements (unaudited) | ||||
| 4 | ||||
| 5 | ||||
| 6 | ||||
| 7 | ||||
| 8 | ||||
| 9 - 30 | ||||
| Management’s Discussion and Analysis of Financial Condition and Results of Operations |
30 - 42 | |||
| 42 | ||||
| 42 | ||||
| Part II. | ||||
| 43 | ||||
| 43 | ||||
| 43 | ||||
| 43 | ||||
| 43 | ||||
| 43 | ||||
| 43 | ||||
| Signatures | 44 | |||
| Exhibits | Ex-31.1 |
|||
| Ex-31.2 |
||||
| Ex-32.1 |
||||
| Ex-32.2 |
||||
| Ex-101 Instance Document |
||||
| Ex-101 Schema Document |
||||
| Ex-101 Calculation Linkbase Document |
||||
| Ex-101 Labels Linkbase Document |
||||
| Ex-101 Presentation Linkbase Document |
||||
| Ex-101 Definition Linkbase Document |
||||
Table of Contents
Except for the historical information contained herein, this Quarterly Report on Form 10-Q may contain forward-looking statements within the meaning of Section 27A of the Securities Act of 1933 as amended and Section 21E of the Securities Exchange Act of 1934 as amended. Investors are cautioned that forward-looking statements are inherently uncertain. Actual performance and results of operations may differ materially from those projected or suggested in the forward-looking statements due to certain risks and uncertainties, including, without limitation, (i) the fact that the Company’s success is dependent to a significant extent upon general economic conditions in New England, (ii) the fact that the Company’s earnings depend to a great extent upon the level of net interest income (the difference between interest income earned on loans and investments and the interest expense paid on deposits and other borrowings) generated by the Bank and thus the Bank’s results of operations may be adversely affected by increases or decreases in interest rates, (iii) the fact that the banking business is highly competitive and the profitability of the Company depends upon the Bank’s ability to attract loans and deposits within its market area, where the Bank competes with a variety of traditional banking and other institutions such as credit unions and finance companies, and (iv) the fact that a significant portion of the Company’s loan portfolio is comprised of commercial loans, exposing the Company to the risks inherent in loans based upon analyses of credit risk, the value of underlying collateral, including real estate, and other more intangible factors, which are considered in making commercial loans. Accordingly, the Company’s profitability may be negatively impacted by errors in risk analyses, and by loan defaults, and the ability of certain borrowers to repay such loans may be adversely affected by any downturn in general economic conditions. These factors, as well as general economic and market conditions, may materially and adversely affect the market price of shares of the Company’s common stock. Because of these and other factors, past financial performance should not be considered an indicator of future performance. The forward-looking statements contained herein represent the Company’s judgment as of the date of this Form 10-Q, and the Company cautions readers not to place undue reliance on such statements.
Page 3 of 44
Table of Contents
Century Bancorp, Inc.
Consolidated Balance Sheets (unaudited)
(In thousands, except share data)
| June 30, 2017 |
December 31, 2016 |
|||||||
| Assets | ||||||||
| Cash and due from banks |
$ | 74,787 | $ | 62,400 | ||||
| Federal funds sold and interest-bearing deposits in other banks |
153,374 | 173,751 | ||||||
|
|
|
|
|
|||||
| Total cash and cash equivalents |
228,161 | 236,151 | ||||||
| Short-term investments |
— | 3,183 | ||||||
| Securities available-for-sale, amortized cost $411,709 and $500,220, respectively |
411,340 | 499,297 | ||||||
| Securities held-to-maturity, fair value $1,706,840 and $ 1,635,808, respectively |
1,722,875 | 1,653,986 | ||||||
| Federal Home Loan Bank of Boston, stock at cost |
25,588 | 21,042 | ||||||
| Loans, net: |
||||||||
| Construction and land development |
14,159 | 14,928 | ||||||
| Commercial and industrial |
650,542 | 612,503 | ||||||
| Municipal |
127,259 | 135,418 | ||||||
| Commercial real estate |
736,603 | 696,173 | ||||||
| Residential real estate |
264,744 | 241,357 | ||||||
| Consumer |
10,700 | 11,013 | ||||||
| Home equity |
229,274 | 211,857 | ||||||
| Overdrafts |
518 | 684 | ||||||
|
|
|
|
|
|||||
| Total loans, net |
2,033,799 | 1,923,933 | ||||||
| Less: allowance for loan losses |
25,289 | 24,406 | ||||||
|
|
|
|
|
|||||
| Net loans |
2,008,510 | 1,899,527 | ||||||
| Bank premises and equipment |
23,177 | 23,417 | ||||||
| Accrued interest receivable |
10,309 | 9,645 | ||||||
| Goodwill |
2,714 | 2,714 | ||||||
| Other assets |
116,563 | 113,646 | ||||||
|
|
|
|
|
|||||
| Total assets |
$ | 4,549,237 | $ | 4,462,608 | ||||
|
|
|
|
|
|||||
| Liabilities | ||||||||
| Deposits: |
||||||||
| Demand deposits |
$ | 687,219 | $ | 689,286 | ||||
| Savings and NOW deposits |
1,409,327 | 1,304,394 | ||||||
| Money market accounts |
897,241 | 1,181,179 | ||||||
| Time deposits |
575,410 | 478,359 | ||||||
|
|
|
|
|
|||||
| Total deposits |
3,569,197 | 3,653,218 | ||||||
| Securities sold under agreements to repurchase |
167,340 | 182,280 | ||||||
| Other borrowed funds |
455,500 | 293,000 | ||||||
| Subordinated debentures |
36,083 | 36,083 | ||||||
| Due to broker |
6,854 | — | ||||||
| Other liabilities |
59,638 | 57,986 | ||||||
|
|
|
|
|
|||||
| Total liabilities |
4,294,612 | 4,222,567 | ||||||
| Stockholders’ Equity | ||||||||
| Preferred Stock – $1.00 par value; 100,000 shares authorized; no shares issued and outstanding |
— | — | ||||||
| Common stock, Class A, $1.00 par value per share; authorized 10,000,000 shares; issued 3,603,729 shares and 3,600,729 shares, respectively |
3,604 | 3,601 | ||||||
| Common stock, Class B, $1.00 par value per share; authorized 5,000,000 shares; issued 1,964,180 shares and 1,967,180 shares respectively |
1,964 | 1,967 | ||||||
| Additional paid-in capital |
12,292 | 12,292 | ||||||
| Retained earnings |
256,718 | 243,565 | ||||||
|
|
|
|
|
|||||
| 274,578 | 261,425 | |||||||
| Unrealized losses on securities available-for-sale, net of taxes |
(234 | ) | (567 | ) | ||||
| Unrealized losses on securities transferred to held-to-maturity, net of taxes |
(3,451 | ) | (4,084 | ) | ||||
| Pension liability, net of taxes |
(16,268 | ) | (16,733 | ) | ||||
|
|
|
|
|
|||||
| Total accumulated other comprehensive loss, net of taxes |
(19,953 | ) | (21,384 | ) | ||||
|
|
|
|
|
|||||
| Total stockholders’ equity |
254,625 | 240,041 | ||||||
|
|
|
|
|
|||||
| Total liabilities and stockholders’ equity |
$ | 4,549,237 | $ | 4,462,608 | ||||
|
|
|
|
|
|||||
See accompanying notes to unaudited consolidated interim financial statements.
Page 4 of 44
Table of Contents
Century Bancorp, Inc.
Consolidated Statements of Income (unaudited)
(In thousands, except share data)
| Three months ended June 30, | Six months ended June 30, | |||||||||||||||
| 2017 | 2016 | 2017 | 2016 | |||||||||||||
| Interest income |
||||||||||||||||
| Loans |
$ | 16,910 | $ | 14,163 | $ | 32,010 | $ | 28,335 | ||||||||
| Securities held-to-maturity |
9,824 | 8,128 | 19,359 | 15,940 | ||||||||||||
| Securities available-for-sale |
1,723 | 1,143 | 3,334 | 2,107 | ||||||||||||
| Federal funds sold and interest-bearing deposits in other banks |
349 | 308 | 742 | 623 | ||||||||||||
|
|
|
|
|
|
|
|
|
|||||||||
| Total interest income |
28,806 | 23,742 | 55,445 | 47,005 | ||||||||||||
|
|
|
|
|
|
|
|
|
|||||||||
| Interest expense |
||||||||||||||||
| Savings and NOW deposits |
1,500 | 938 | 2,727 | 1,776 | ||||||||||||
| Money market accounts |
1,234 | 781 | 2,508 | 1,576 | ||||||||||||
| Time deposits |
1,902 | 1,394 | 3,553 | 2,752 | ||||||||||||
| Securities sold under agreements to repurchase |
120 | 126 | 223 | 241 | ||||||||||||
| Other borrowed funds and subordinated debentures |
1,945 | 2,247 | 3,873 | 4,554 | ||||||||||||
|
|
|
|
|
|
|
|
|
|||||||||
| Total interest expense |
6,701 | 5,486 | 12,884 | 10,899 | ||||||||||||
|
|
|
|
|
|
|
|
|
|||||||||
| Net interest income |
22,105 | 18,256 | 42,561 | 36,106 | ||||||||||||
| Provision for loan losses |
490 | 350 | 890 | 800 | ||||||||||||
|
|
|
|
|
|
|
|
|
|||||||||
| Net interest income after provision for loan losses |
21,615 | 17,906 | 41,671 | 35,306 | ||||||||||||
| Other operating income |
||||||||||||||||
| Service charges on deposit accounts |
2,074 | 1,962 | 4,090 | 3,899 | ||||||||||||
| Lockbox fees |
861 | 883 | 1,632 | 1,672 | ||||||||||||
| Net gains on sales of securities |
— | 45 | — | 45 | ||||||||||||
| Gains on sales of mortgage loans |
269 | 798 | 370 | 798 | ||||||||||||
| Other income |
1,087 | 955 | 2,108 | 1,883 | ||||||||||||
|
|
|
|
|
|
|
|
|
|||||||||
| Total other operating income |
4,291 | 4,643 | 8,200 | 8,297 | ||||||||||||
|
|
|
|
|
|
|
|
|
|||||||||
| Operating expenses |
||||||||||||||||
| Salaries and employee benefits |
10,719 | 10,040 | 21,862 | 19,816 | ||||||||||||
| Occupancy |
1,495 | 1,551 | 3,236 | 3,130 | ||||||||||||
| Equipment |
757 | 679 | 1,463 | 1,315 | ||||||||||||
| FDIC assessments |
440 | 592 | 878 | 1,160 | ||||||||||||
| Other |
3,786 | 3,426 | 7,483 | 6,549 | ||||||||||||
|
|
|
|
|
|
|
|
|
|||||||||
| Total operating expenses |
17,197 | 16,288 | 34,922 | 31,970 | ||||||||||||
|
|
|
|
|
|
|
|
|
|||||||||
| Income before income taxes |
8,709 | 6,261 | 14,949 | 11,633 | ||||||||||||
| Provision for income taxes |
552 | 20 | 696 | 84 | ||||||||||||
|
|
|
|
|
|
|
|
|
|||||||||
| Net income |
$ | 8,157 | $ | 6,241 | $ | 14,253 | $ | 11,549 | ||||||||
|
|
|
|
|
|
|
|
|
|||||||||
| Share data: |
||||||||||||||||
| Weighted average number of shares outstanding, basic |
||||||||||||||||
| Class A |
3,603,729 | 3,600,729 | 3,602,229 | 3,600,729 | ||||||||||||
| Class B |
1,964,180 | 1,967,180 | 1,965,680 | 1,967,180 | ||||||||||||
| Weighted average number of shares outstanding, diluted |
||||||||||||||||
| Class A |
5,567,909 | 5,567,909 | 5,567,909 | 5,567,909 | ||||||||||||
| Class B |
1,964,180 | 1,967,180 | 1,965,680 | 1,967,180 | ||||||||||||
| Basic earnings per share: |
||||||||||||||||
| Class A |
$ | 1.78 | $ | 1.36 | $ | 3.11 | $ | 2.52 | ||||||||
| Class B |
$ | 0.89 | $ | 0.68 | $ | 1.55 | $ | 1.26 | ||||||||
| Diluted earnings per share |
||||||||||||||||
| Class A |
$ | 1.47 | $ | 1.12 | $ | 2.56 | $ | 2.07 | ||||||||
| Class B |
$ | 0.89 | $ | 0.68 | $ | 1.55 | $ | 1.26 | ||||||||
See accompanying notes to unaudited consolidated interim financial statements.
Page 5 of 44
Table of Contents
Century Bancorp, Inc.
Consolidated Statements of Comprehensive Income (unaudited)
(In thousands)
| Three months ended June 30, | ||||||||
| 2017 | 2016 | |||||||
| Net income |
$ | 8,157 | $ | 6,241 | ||||
| Other comprehensive income (loss), net of tax: |
||||||||
| Unrealized gains (losses) on securities: |
||||||||
| Unrealized (losses) gains arising during period |
198 | (325 | ) | |||||
| Less: reclassification adjustment for gains included in net income |
— | (27 | ) | |||||
|
|
|
|
|
|||||
| Total unrealized (losses) gains on securities |
198 | (352 | ) | |||||
| Accretion of net unrealized losses transferred |
260 | 762 | ||||||
| Defined benefit pension plans: |
||||||||
| Amortization of prior service cost and loss included in net periodic benefit cost |
233 | 243 | ||||||
|
|
|
|
|
|||||
| Other comprehensive income |
691 | 653 | ||||||
|
|
|
|
|
|||||
| Comprehensive income |
$ | 8,848 | $ | 6,894 | ||||
|
|
|
|
|
|||||
| Six months ended June 30, | ||||||||
| 2017 | 2016 | |||||||
| Net income |
$ | 14,253 | $ | 11,549 | ||||
| Other comprehensive income (loss), net of tax: |
||||||||
| Unrealized gains (losses) on securities: |
||||||||
| Unrealized (losses) gains arising during period |
333 | (11 | ) | |||||
| Less: reclassification adjustment for gains included in net income |
— | (27 | ) | |||||
|
|
|
|
|
|||||
| Total unrealized (losses) gains on securities |
333 | (38 | ) | |||||
| Accretion of net unrealized losses transferred |
633 | 1,747 | ||||||
| Defined benefit pension plans: |
||||||||
| Amortization of prior service cost and loss included in net periodic benefit cost |
465 | 485 | ||||||
|
|
|
|
|
|||||
| Other comprehensive income |
1,431 | 2,194 | ||||||
|
|
|
|
|
|||||
| Comprehensive income |
$ | 15,684 | $ | 13,743 | ||||
|
|
|
|
|
|||||
See accompanying notes to unaudited consolidated interim financial statements.
Page 6 of 44
Table of Contents
Century Bancorp, Inc.
Consolidated Statements of Changes in Stockholders’ Equity (unaudited)
For the Six Months Ended June 30, 2017 and 2016
| Class A Common Stock |
Class B Common Stock |
Additional Paid-In Capital |
Retained Earnings |
Accumulated Other Comprehensive Income (Loss) |
Total Stockholders’ Equity |
|||||||||||||||||||
| (In thousands) | ||||||||||||||||||||||||
| Balance at December 31, 2015 |
$ | 3,601 | $ | 1,967 | $ | 12,292 | $ | 221,232 | $ | (24,548 | ) | $ | 214,544 | |||||||||||
| Net income |
— | — | — | 11,549 | — | 11,549 | ||||||||||||||||||
| Other comprehensive income, net of tax: |
||||||||||||||||||||||||
| Unrealized holding (losses) gains arising during period, net of $61 in taxes and $45 in realized gains |
— | — | — | — | (38 | ) | (38 | ) | ||||||||||||||||
| Accretion of unrealized losses on securities transferred to held-to-maturity, net of $935 in taxes |
— | — | — | — | 1,747 | 1,747 | ||||||||||||||||||
| Pension liability adjustment, net of $322 in taxes |
— | — | — | — | 485 | 485 | ||||||||||||||||||
| Cash dividends paid, Class A common stock, $.24 per share |
— | — | — | (866 | ) | — | (866 | ) | ||||||||||||||||
| Cash dividends paid, Class B common stock, $.12 per share |
— | — | — | (235 | ) | — | (235 | ) | ||||||||||||||||
|
|
|
|
|
|
|
|
|
|
|
|
|
|||||||||||||
| Balance at June 30, 2016 |
$ | 3,601 | $ | 1,967 | $ | 12,292 | $ | 231,680 | $ | (22,354 | ) | $ | 227,186 | |||||||||||
|
|
|
|
|
|
|
|
|
|
|
|
|
|||||||||||||
| Balance at December 31, 2016 |
$ | 3,601 | $ | 1,967 | $ | 12,292 | $ | 243,565 | $ | (21,384 | ) | $ | 240,041 | |||||||||||
| Net income |
— | — | — | 14,253 | — | 14,253 | ||||||||||||||||||
| Other comprehensive income, net of tax: |
||||||||||||||||||||||||
| Unrealized holding (losses) gains arising during period, net of $221 in taxes |
— | — | — | — | 333 | 333 | ||||||||||||||||||
| Accretion of unrealized losses on securities transferred to held-to-maturity, net of $690 in taxes |
— | — | — | — | 633 | 633 | ||||||||||||||||||
| Pension liability adjustment, net of $311 in taxes |
— | — | — | — | 465 | 465 | ||||||||||||||||||
| Conversion of Class B Common Stock to Class A Common Stock, 3,000 shares |
3 | (3 | ) | — | — | — | — | |||||||||||||||||
| Cash dividends paid, Class A common stock, $.24 per share |
— | — | — | (865 | ) | — | (865 | ) | ||||||||||||||||
| Cash dividends paid, Class B common stock, $.12 per share |
— | — | — | (235 | ) | — | (235 | ) | ||||||||||||||||
|
|
|
|
|
|
|
|
|
|
|
|
|
|||||||||||||
| Balance at June 30, 2017 |
$ | 3,604 | $ | 1,964 | $ | 12,292 | $ | 256,718 | $ | (19,953 | ) | $ | 254,625 | |||||||||||
|
|
|
|
|
|
|
|
|
|
|
|
|
|||||||||||||
See accompanying notes to unaudited consolidated interim financial statements.
Page 7 of 44
Table of Contents
Century Bancorp, Inc.
Consolidated Statements of Changes in Stockholders’ Equity (unaudited)
For the Six Months Ended June 30, 2017 and 2016
| Six months ended June 30, | ||||||||
| 2017 | 2016 | |||||||
| CASH FLOWS FROM OPERATING ACTIVITIES: |
||||||||
| Net income |
$ | 14,253 | $ | 11,549 | ||||
| Adjustments to reconcile net income to net cash (used in) provided by operating activities: |
||||||||
| Gain on sales of mortgage loans |
(370 | ) | (798 | ) | ||||
| Net gains on sales of securities |
— | (45 | ) | |||||
| Provision for loan losses |
890 | 800 | ||||||
| Deferred income taxes |
(1,579 | ) | (1,792 | ) | ||||
| Net depreciation and amortization |
1,660 | 1,575 | ||||||
| Decrease in accrued interest receivable |
(664 | ) | (712 | ) | ||||
| Increase in other assets |
(2,593 | ) | (3,428 | ) | ||||
| Increase in other liabilities |
2,426 | 1,069 | ||||||
|
|
|
|
|
|||||
| Net cash provided by operating activities |
14,023 | 8,218 | ||||||
|
|
|
|
|
|||||
| CASH FLOWS FROM INVESTING ACTIVITIES: |
||||||||
| Purchase of short-term investments |
— | (8 | ) | |||||
| Maturities of short-term investments |
3,183 | |||||||
| Proceeds from redemptions of Federal Home Loan Bank of Boston stock |
714 | 4,898 | ||||||
| Purchase of Federal Home Loan Bank of Boston stock |
(5,260 | ) | (2,177 | ) | ||||
| Proceeds from calls/maturities of securities available-for-sale |
166,976 | 130,513 | ||||||
| Proceeds from sales of securities available-for-sale |
— | 1,946 | ||||||
| Purchase of securities available-for-sale |
(71,793 | ) | (287,834 | ) | ||||
| Proceeds from calls/maturities of securities held-to-maturity |
153,405 | 213,337 | ||||||
| Proceeds from sales of securities held-to-maturity |
— | 192 | ||||||
| Purchase of securities held-to-maturity |
(220,832 | ) | (345,692 | ) | ||||
| Net increase in loans |
(136,181 | ) | (132,182 | ) | ||||
| Proceeds from sales of portfolio loans |
26,701 | 50,220 | ||||||
| Capital expenditures |
(1,365 | ) | (835 | ) | ||||
|
|
|
|
|
|||||
| Net cash used in investing activities |
(84,452 | ) | (367,622 | ) | ||||
|
|
|
|
|
|||||
| CASH FLOWS FROM FINANCING ACTIVITIES: |
||||||||
| Net increase (decrease) in time deposits |
97,051 | (12,899 | ) | |||||
| Net (decrease) increase in demand, savings, money market and NOW deposits |
(181,072 | ) | 156,771 | |||||
| Cash dividends |
(1,100 | ) | (1,101 | ) | ||||
| Net (decrease) increase in securities sold under agreements to repurchase |
(14,940 | ) | 19,915 | |||||
| Net increase in other borrowed funds |
162,500 | 63,000 | ||||||
|
|
|
|
|
|||||
| Net cash provided by financing activities |
62,439 | 225,686 | ||||||
|
|
|
|
|
|||||
| Net decrease in cash and cash equivalents |
(7,990 | ) | (133,718 | ) | ||||
| Cash and cash equivalents at beginning of period |
236,151 | 220,724 | ||||||
|
|
|
|
|
|||||
| Cash and cash equivalents at end of period |
$ | 228,161 | $ | 87,006 | ||||
|
|
|
|
|
|||||
| SUPPLEMENTAL DISCLOSURES OF CASH FLOW INFORMATION: |
||||||||
| Cash paid during the period for: |
||||||||
| Interest |
$ | 12,997 | $ | 10,893 | ||||
| Income taxes |
2,980 | 2,110 | ||||||
| Change in unrealized gains (losses) on securities available-for-sale, net of taxes |
333 | (38 | ) | |||||
| Change in unrealized losses on securities transferred to held-to-maturity, net of taxes |
633 | 1,747 | ||||||
| Pension liability adjustment, net of taxes |
465 | 485 | ||||||
| Change in due to (from) to broker |
6,854 | 3,180 | ||||||
| Transfer of loans to loans held-for-sale |
— | 12,403 | ||||||
See accompanying notes to unaudited consolidated interim financial statements.
Page 8 of 44
Table of Contents
Century Bancorp, Inc.
Notes to Unaudited Consolidated Interim Financial Statements
Six Months Ended June 30, 2017 and 2016
Note 1. Basis of Financial Statement Presentation
The consolidated financial statements include the accounts of Century Bancorp, Inc. (the “Company”) and its wholly owned subsidiary, Century Bank and Trust Company (the “Bank”). The consolidated financial statements also include the accounts of the Bank’s wholly owned subsidiaries, Century Subsidiary Investments, Inc. (“CSII”), Century Subsidiary Investments, Inc. II (“CSII II”), Century Subsidiary Investments, Inc. III (“CSII III”) and Century Financial Services Inc. (“CFSI”). CSII, CSII II, and CSII III are engaged in buying, selling and holding investment securities. CFSI has the power to engage in financial agency, securities brokerage, and investment and financial advisory services and related securities credit. The Company also owns 100% of Century Bancorp Capital Trust II (“CBCT II”). The entity is an unconsolidated subsidiary of the Company.
All significant intercompany accounts and transactions have been eliminated in consolidation. The Company provides a full range of banking services to individual, business and municipal customers in Massachusetts, New Hampshire, Rhode Island, Connecticut, and New York. As a bank holding company, the Company is subject to the regulation and supervision of the Federal Reserve Board. The Bank, a state chartered financial institution, is subject to supervision and regulation by applicable state and federal banking agencies, including the Federal Reserve Board, the Federal Deposit Insurance Corporation (the “FDIC”) and the Commonwealth of Massachusetts Commissioner of Banks. The Bank is also subject to various requirements and restrictions under federal and state law, including requirements to maintain reserves against deposits, restrictions on the types and amounts of loans that may be granted and the interest that may be charged thereon, and limitations on the types of investments that may be made and the types of services that may be offered. Various consumer laws and regulations also affect the operations of the Bank. In addition to the impact of regulation, commercial banks are affected significantly by the actions of the Federal Reserve Board as it attempts to control the money supply and credit availability in order to influence the economy. All aspects of the Company’s business are highly competitive. The Company faces aggressive competition from other lending institutions and from numerous other providers of financial services. The Company has one reportable operating segment.
The financial statements have been prepared in conformity with accounting principles generally accepted in the United States of America and general practices within the banking industry. In preparing the financial statements, management is required to make estimates and assumptions that affect the reported amounts of assets and liabilities as of the date of the balance sheet and revenues and expenses for the period. Actual results could differ from those estimates. The Company’s quarterly report on Form 10-Q should be read in conjunction with the Company’s Annual Report on Form 10-K for the fiscal year ended December 31, 2016, as filed with the Securities and Exchange Commission.
Material estimates that are susceptible to change in the near term relate to the allowance for loan losses. Management believes that the allowance for loan losses is adequate based on independent appraisals and review of other factors, including historical charge-off rates with additional allocations based on risk factors for each category and general economic factors. While management uses available information to recognize loan losses, future additions to the allowance for loan losses may be necessary based on changes in economic conditions. In addition, regulatory agencies periodically review the Company’s allowance for loan losses. Such agencies may require the Company to recognize additions to the allowance for loan losses based on their judgments about information available to them at the time of their examination. Certain reclassifications are made to prior-year amounts whenever necessary to conform with the current-year presentation.
Page 9 of 44
Table of Contents
Note 2. Securities Available-for-Sale
| June 30, 2017 | December 31, 2016 | |||||||||||||||||||||||||||||||
| Amortized Cost |
Gross Unrealized Gains |
Gross Unrealized Losses |
Fair Value |
Amortized Cost |
Gross Unrealized Gains |
Gross Unrealized Losses |
Fair Value |
|||||||||||||||||||||||||
| (in thousands) | ||||||||||||||||||||||||||||||||
| U.S. Treasury |
$ | 1,999 | $ | — | $ | 4 | $ | 1,995 | $ | 2,000 | $ | — | $ | — | $ | 2,000 | ||||||||||||||||
| U.S. Government Sponsored Enterprises |
10,000 | — | — | 10,000 | 25,000 | — | 48 | 24,952 | ||||||||||||||||||||||||
| SBA Backed Securities |
71,357 | 27 | 195 | 71,189 | 57,899 | 14 | 146 | 57,767 | ||||||||||||||||||||||||
| U.S. Government Agency and Sponsored Enterprise Mortgage-Backed Securities |
223,655 | 463 | 336 | 223,782 | 243,703 | 293 | 671 | 243,325 | ||||||||||||||||||||||||
| Privately Issued Residential Mortgage-Backed Securities |
1,025 | 3 | 13 | 1,015 | 1,121 | 2 | 14 | 1,109 | ||||||||||||||||||||||||
| Obligations Issued by States and Political Subdivisions |
98,457 | — | 408 | 98,049 | 165,281 | — | 405 | 164,876 | ||||||||||||||||||||||||
| Other Debt Securities |
5,100 | 85 | 193 | 4,992 | 5,100 | 18 | 194 | 4,924 | ||||||||||||||||||||||||
| Equity Securities |
116 | 202 | — | 318 | 116 | 228 | — | 344 | ||||||||||||||||||||||||
|
|
|
|
|
|
|
|
|
|
|
|
|
|
|
|
|
|||||||||||||||||
| Total |
$ | 411,709 | $ | 780 | $ | 1,149 | $ | 411,340 | $ | 500,220 | $ | 555 | $ | 1,478 | $ | 499,297 | ||||||||||||||||
|
|
|
|
|
|
|
|
|
|
|
|
|
|
|
|
|
|||||||||||||||||
Included in SBA Backed Securities and U.S. Government Sponsored Enterprise Securities and U.S. Government Agency and Sponsored Enterprise Mortgage-Backed Securities are securities at fair value pledged to secure public deposits and repurchase agreements amounting to $ 173,235,000 and $210,780,000 at June 30, 2017 and December 31, 2016, respectively. Also included in securities available-for-sale are securities at fair value pledged for borrowing at the Federal Home Loan Bank of Boston amounting to $49,416,000 and $53,396,000 at June 30, 2017 and December 31, 2016, respectively. There were no sales of available-for-sale securities for the six months ended June 30, 2017. The Company realized gross gains of $33,000 from the proceeds of $1,946,000 from the sales of available-for-sales securities for the six months ended June 30, 2016.
Debt securities of U.S. Government Sponsored Enterprises and U.S. Government Agency and Sponsored Enterprise Mortgage-Backed Securities primarily refer to debt securities of Fannie Mae and Freddie Mac.
The following table shows the maturity distribution of the Company’s securities available-for-sale at June 30, 2017.
| Amortized Cost |
Fair Value |
|||||||
| (in thousands) | ||||||||
| Within one year |
$ | 90,264 | $ | 90,255 | ||||
| After one but within five years |
132,716 | 132,786 | ||||||
| After five but within ten years |
105,344 | 105,360 | ||||||
| More than 10 years |
81,769 | 81,270 | ||||||
| Non-maturing |
1,616 | 1,669 | ||||||
|
|
|
|
|
|||||
| Total |
$ | 411,709 | $ | 411,340 | ||||
|
|
|
|
|
|||||
The weighted average remaining life of investment securities available-for-sale at June 30, 2017 was 5.4 years. Included in the weighted average remaining life calculation at June 30, 2017 were $10,000,000 of U.S. Government Sponsored Enterprises obligations that are callable at the discretion of the issuer. The contractual maturities, which were used in the table above, of mortgage-backed securities, will differ from the actual maturities, due to the ability of the issuers to prepay underlying obligations.
Page 10 of 44
Table of Contents
As of June 30, 2017 and December 31, 2016, management concluded that the unrealized losses of its investment securities are temporary in nature since they are not related to the underlying credit quality of the issuers, and the Company does not intend to sell these debt securities and it is not more likely than not that it will be required to sell these debt securities before the anticipated recovery of its remaining amortized cost. In making its other-than-temporary impairment evaluation, the Company considered that the principal and interest on these securities are from issuers that are investment grade.
The unrealized loss on SBA Backed Securities, U.S. Government Agency and Sponsored Enterprise Mortgage Backed Securities, Obligations Issued by States and Political Subdivisions, and Other Debt Securities, related primarily to interest rates and not credit quality, and because the Company has the ability and intent to hold these investments until recovery of fair value, which may be maturity, the Company does not consider these investments to be other-than-temporarily impaired.
In evaluating the underlying credit quality of a security, management considers several factors such as the credit rating of the obligor and the issuer, if applicable. Internal reviews of issuer financial statements are performed as deemed necessary. In the case of privately issued mortgage-backed securities, the performance of the underlying loans is analyzed as deemed necessary to determine the estimated future cash flows of the securities. Factors considered include the level of subordination, current and estimated future default rates, current and estimated prepayment rates, estimated loss severity rates, geographic concentrations and origination dates of underlying loans. In the case of marketable equity securities, the severity of the unrealized loss, the length of time the unrealized loss has existed, and the issuer’s financial performance are considered.
The following table shows the temporarily impaired securities of the Company’s available-for-sale portfolio at June 30, 2017. This table shows the unrealized market loss of securities that have been in a continuous unrealized loss position for less than 12 months and a continuous loss position for 12 months or longer. There are 13 and 27 securities that are temporarily impaired for less than 12 months and for 12 months or longer, respectively, out of a total of 269 holdings at June 30, 2017.
| June 30, 2017 | ||||||||||||||||||||||||
| Less than 12 months | 12 months or longer | Total | ||||||||||||||||||||||
| Temporarily Impaired Investments | Fair Value |
Unrealized Losses |
Fair Value |
Unrealized Losses |
Fair Value |
Unrealized Losses |
||||||||||||||||||
| (in thousands) | ||||||||||||||||||||||||
| U.S. Treasury |
$ | 1,995 | $ | 4 | $ | — | $ | — | $ | 1,995 | $ | 4 | ||||||||||||
| U.S. Government Sponsored Enterprises |
— | — | — | — | — | — | ||||||||||||||||||
| SBA Backed Securities |
27,850 | 116 | 17,775 | 79 | 45,625 | 195 | ||||||||||||||||||
| U.S. Government Agency and Sponsored Enterprise Mortgage-Backed Securities |
36,251 | 83 | 66,121 | 253 | 102,372 | 336 | ||||||||||||||||||
| Privately Issued Residential Mortgage-Backed Securities |
— | — | 707 | 13 | 707 | 13 | ||||||||||||||||||
| Obligations Issued by States and Political Subdivisions |
— | — | 4,297 | 408 | 4,297 | 408 | ||||||||||||||||||
| Other Debt Securities |
— | — | 1,907 | 193 | 1,907 | 193 | ||||||||||||||||||
|
|
|
|
|
|
|
|
|
|
|
|
|
|||||||||||||
| Total temporarily impaired securities |
$ | 66,096 | $ | 203 | $ | 90,807 | $ | 946 | $ | 156,903 | $ | 1,149 | ||||||||||||
|
|
|
|
|
|
|
|
|
|
|
|
|
|||||||||||||
Page 11 of 44
Table of Contents
The following table shows the temporarily impaired securities of the Company’s available-for-sale portfolio at December 31, 2016. This table shows the unrealized market loss of securities that have been in a continuous unrealized loss position for less than 12 months and a continuous loss position for 12 months or longer. There are 49 and 15 securities that are temporarily impaired for less than 12 months and for 12 months or longer, respectively, out of a total of 270 holdings at December 31, 2016.
| Temporarily Impaired Investments |
December 31, 2016 | |||||||||||||||||||||||
| Less than 12 months | 12 months or longer | Total | ||||||||||||||||||||||
| Fair Value | Unrealized Losses |
Fair Value |
Unrealized Losses |
Fair Value | Unrealized Losses |
|||||||||||||||||||
| (in thousands) | ||||||||||||||||||||||||
| U.S. Government Sponsored Enterprises |
$ | 24,952 | $ | 48 | $ | — | $ | — | $ | 24,952 | $ | 48 | ||||||||||||
| SBA Backed Securities |
52,346 | 145 | 951 | 1 | 53,297 | 146 | ||||||||||||||||||
| U.S. Government Agency and Sponsored Enterprise Mortgage-Backed Securities |
135,612 | 485 | 31,504 | 186 | 167,116 | 671 | ||||||||||||||||||
| Privately Issued Residential Mortgage-Backed Securities |
— | — | 757 | 14 | 757 | 14 | ||||||||||||||||||
| Obligations Issued by States and Political Subdivisions |
— | — | 4,298 | 405 | 4,298 | 405 | ||||||||||||||||||
| Other Debt Securities |
453 | 47 | 1,553 | 147 | 2,006 | 194 | ||||||||||||||||||
|
|
|
|
|
|
|
|
|
|
|
|
|
|||||||||||||
| Total temporarily impaired securities |
$ | 213,363 | $ | 725 | $ | 39,063 | $ | 753 | $ | 252,426 | $ | 1,478 | ||||||||||||
|
|
|
|
|
|
|
|
|
|
|
|
|
|||||||||||||
Note 3. Investment Securities Held-to-Maturity
| June 30, 2017 | December 31, 2016 | |||||||||||||||||||||||||||||||
| Amortized Cost |
Gross Unrealized Gains |
Gross Unrealized Losses |
Estimated Fair Value |
Amortized Cost |
Gross Unrealized Gains |
Gross Unrealized Losses |
Estimated Fair Value |
|||||||||||||||||||||||||
| (in thousands) | ||||||||||||||||||||||||||||||||
| U.S. Government Sponsored Enterprises |
$ | 134,378 | $ | 931 | $ | 287 | $ | 135,022 | $ | 148,326 | $ | 1,066 | $ | 527 | $ | 148,865 | ||||||||||||||||
| SBA Backed Securities |
54,427 | 3 | 779 | 53,651 | 46,140 | — | 1,088 | 45,052 | ||||||||||||||||||||||||
| U.S. Government Agency and Sponsored Enterprises Mortgage-Backed Securities |
1,534,070 | 5,419 | 21,322 | 1,518,167 | 1,459,520 | 4,948 | 22,577 | 1,441,891 | ||||||||||||||||||||||||
|
|
|
|
|
|
|
|
|
|
|
|
|
|
|
|
|
|||||||||||||||||
| Total |
$ | 1,722,875 | $ | 6,353 | $ | 22,388 | $ | 1,706,840 | $ | 1,653,986 | $ | 6,014 | $ | 24,192 | $ | 1,635,808 | ||||||||||||||||
|
|
|
|
|
|
|
|
|
|
|
|
|
|
|
|
|
|||||||||||||||||
Included in U.S. Government and Agency Securities are securities pledged to secure public deposits and repurchase agreements at fair value amounting to $1,268,349,000 and $1,147,207,000 at June 30, 2017 and December 31, 2016, respectively. Also included are securities pledged for borrowing at the Federal Home Loan Bank of Boston at fair value amounting to $305,269,000 and $424,353,000 at June 30, 2017 and December 31, 2016, respectively. There were no sales of held-to-maturity securities for the six months ended June 30, 2017. The Company realized gross gains of $12,000 from the proceeds of $192,000 from the sales of securities held-to-maturity for the six months ended June 30, 2016. The sales of securities held-to-maturity relate to certain mortgage backed securities for which the Company had previously collected a substantial portion of its principal investment.
At June 30, 2017 and December 31, 2016, all mortgage-backed securities are obligations of U.S. Government Agencies and Government Sponsored Enterprises. Debt securities of U.S. Government Sponsored Enterprises and U.S. Government Agency and Sponsored Enterprise Mortgage-Backed Securities primarily refer to debt securities of Fannie Mae and Freddie Mac.
Page 12 of 44
Table of Contents
The following table shows the maturity distribution of the Company’s securities held-to-maturity at June 30, 2017.
| Amortized Cost |
Fair Value |
|||||||
| (in thousands) | ||||||||
| Within one year |
$ | 45,780 | $ | 45,827 | ||||
| After one but within five years |
1,224,104 | 1,213,863 | ||||||
| After five but within ten years |
449,698 | 444,027 | ||||||
| More than ten years |
3,293 | 3,123 | ||||||
|
|
|
|
|
|||||
| Total |
$ | 1,722,875 | $ | 1,706,840 | ||||
|
|
|
|
|
|||||
The weighted average remaining life of investment securities held-to-maturity at June 30, 2017 was 4.4 years. Included in the weighted average remaining life calculation at June 30, 2017 were $35,496,000 of U.S. Government Sponsored Enterprises obligations that are callable at the discretion of the issuer. The actual maturities, which were used in the table above, of mortgage-backed securities, will differ from the contractual maturities, due to the ability of the issuers to prepay underlying obligations.
As of June 30, 2017 and December 31, 2016, management concluded that the unrealized losses of its investment securities are temporary in nature since they are not related to the underlying credit quality of the issuers, and the Company does not intend to sell these debt securities and it is not likely that it will be required to sell these debt securities before the anticipated recovery of their remaining amortized costs. In making its other-than-temporary impairment evaluation, the Company considered the fact that the principal and interest on these securities are from issuers that are investment grade.
The unrealized loss on U.S. Government Sponsored Enterprises, SBA Backed Securities, and U.S. Government Agency and Sponsored Enterprise Mortgage-Backed Securities related primarily to interest rates and not credit quality, and because the Company does not intend to sell any of these securities and it is not likely that it will be required to sell these securities before the anticipated recovery of the remaining amortized cost, the Company does not consider these investments to be other-than-temporarily impaired June 30, 2017 and December 31, 2016.
In evaluating the underlying credit quality of a security, management considers several factors such as the credit rating of the obligor and the issuer, if applicable. Internal reviews of issuer financial statements are performed as deemed necessary.
The following table shows the temporarily impaired securities of the Company’s held-to-maturity portfolio at June 30, 2017. This table shows the unrealized market loss of securities that have been in a continuous unrealized loss position for 12 months or less and a continuous loss position for 12 months or longer. There are 190 and 22 securities that are temporarily impaired for less than 12 months and for 12 months or longer, respectively, out of a total of 393 holdings at June 30, 2017.
| June 30, 2017 | ||||||||||||||||||||||||
| Less Than 12 Months | 12 Months or Longer | Total | ||||||||||||||||||||||
| Temporarily Impaired Investments | Fair Value |
Unrealized Losses |
Fair Value |
Unrealized Losses |
Fair Value |
Unrealized Losses |
||||||||||||||||||
| (in thousands) | ||||||||||||||||||||||||
| U.S. Government Sponsored Enterprises |
$ | 45,209 | $ | 287 | $ | — | $ | — | $ | 45,209 | $ | 287 | ||||||||||||
| SBA Backed Securities |
50,633 | 779 | — | — | 50,633 | 779 | ||||||||||||||||||
| U.S. Government Agency and Sponsored Enterprise Mortgage-Backed Securities |
1,015,890 | 18,964 | 76,584 | 2,358 | 1,092,474 | 21,322 | ||||||||||||||||||
|
|
|
|
|
|
|
|
|
|
|
|
|
|||||||||||||
| Total temporarily impaired securities |
$ | 1,111,732 | $ | 20,030 | $ | 76,584 | $ | 2,358 | $ | 1,188,316 | $ | 22,388 | ||||||||||||
|
|
|
|
|
|
|
|
|
|
|
|
|
|||||||||||||
Page 13 of 44
Table of Contents
The following table shows the temporarily impaired securities of the Company’s held-to-maturity portfolio at December 31, 2016. This table shows the unrealized market loss of securities that have been in a continuous unrealized loss position for less than 12 months and a continuous loss position for 12 months or longer. There are 194 and 16 securities that are temporarily impaired for less than 12 months and for 12 months or longer, respectively, out of a total of 375 holdings at December 31, 2016.
| December 31, 2016 | ||||||||||||||||||||||||
| Less Than 12 Months | 12 Months or Longer | Total | ||||||||||||||||||||||
| Temporarily Impaired Investments | Fair Value |
Unrealized Losses |
Fair Value |
Unrealized Losses |
Fair Value |
Unrealized Losses |
||||||||||||||||||
| (in thousands) | ||||||||||||||||||||||||
| U.S. Government Sponsored Enterprises |
$ | 59,219 | $ | 527 | $ | — | $ | — | $ | 59,219 | $ | 527 | ||||||||||||
| SBA Backed Securities |
45,052 | 1,088 | — | — | 45,052 | 1,088 | ||||||||||||||||||
| U.S. Government Agency and Sponsored Enterprise Mortgage-Backed Securities |
1,008,960 | 20,725 | 58,535 | 1,852 | 1,067,495 | 22,577 | ||||||||||||||||||
|
|
|
|
|
|
|
|
|
|
|
|
|
|||||||||||||
| Total temporarily impaired securities |
$ | 1,113,231 | $ | 22,340 | $ | 58,535 | $ | 1,852 | $ | 1,171,766 | $ | 24,192 | ||||||||||||
|
|
|
|
|
|
|
|
|
|
|
|
|
|||||||||||||
Note 4. Allowance for Loan Losses
The Company maintains an allowance for loan losses in an amount determined by management on the basis of the character of the loans, loan performance, financial condition of borrowers, the value of collateral securing loans and other relevant factors.
The following table summarizes the changes in the Company’s allowance for loan losses for the periods indicated.
| Three months ended June 30, |
Six months ended June 30, |
|||||||||||||||
| 2017 | 2016 | 2017 | 2016 | |||||||||||||
| (in thousands) | ||||||||||||||||
| Allowance for loan losses, beginning of period |
$ | 24,827 | $ | 23,544 | $ | 24,406 | $ | 23,075 | ||||||||
| Adjustment |
— | (84 | ) | — | (84 | ) | ||||||||||
| Loans charged off |
(100 | ) | (111 | ) | (197 | ) | (180 | ) | ||||||||
| Recoveries on loans previously charged-off |
72 | 164 | 190 | 252 | ||||||||||||
|
|
|
|
|
|
|
|
|
|||||||||
| Net (charge-offs) / recoveries |
(28 | ) | 53 | (7 | ) | 72 | ||||||||||
| Provision charged to expense |
490 | 350 | 890 | 800 | ||||||||||||
|
|
|
|
|
|
|
|
|
|||||||||
| Allowance for loan losses, end of period |
$ | 25,289 | $ | 23,863 | $ | 25,289 | $ | 23,863 | ||||||||
|
|
|
|
|
|
|
|
|
|||||||||
Page 14 of 44
Table of Contents
Further information pertaining to the allowance for loan losses for the three months ending June 30, 2017 follows:
| Construction and Land Development |
Commercial and Industrial |
Municipal | Commercial Real Estate |
Residential Real Estate |
Consumer | Home Equity |
Unallocated | Total | ||||||||||||||||||||||||||||
| (in thousands) | ||||||||||||||||||||||||||||||||||||
| Allowance for loan losses: |
||||||||||||||||||||||||||||||||||||
| Balance at March 31, 2017 |
$ | 873 | $ | 7,369 | $ | 1,899 | $ | 11,216 | $ | 1,671 | $ | 452 | $ | 1,050 | $ | 297 | $ | 24,827 | ||||||||||||||||||
| Charge-offs |
— | (29 | ) | — | — | — | (71 | ) | — | — | (100 | ) | ||||||||||||||||||||||||
| Recoveries |
— | 34 | — | — | — | 38 | — | — | 72 | |||||||||||||||||||||||||||
| Provision |
264 | 189 | (40 | ) | (188 | ) | 447 | (224 | ) | 96 | (54 | ) | 490 | |||||||||||||||||||||||
|
|
|
|
|
|
|
|
|
|
|
|
|
|
|
|
|
|
|
|||||||||||||||||||
| Ending balance at June 30, 2017 |
$ | 1,137 | $ | 7,563 | $ | 1,859 | $ | 11,028 | $ | 2,118 | $ | 195 | $ | 1,146 | $ | 243 | $ | 25,289 | ||||||||||||||||||
|
|
|
|
|
|
|
|
|
|
|
|
|
|
|
|
|
|
|
|||||||||||||||||||
| Amount of allowance for loan losses for loans deemed to be impaired |
$ | — | $ | 11 | $ | — | $ | 120 | $ | 69 | $ | — | $ | — | $ | — | $ | 200 | ||||||||||||||||||
|
|
|
|
|
|
|
|
|
|
|
|
|
|
|
|
|
|
|
|||||||||||||||||||
| Amount of allowance for loan losses for loans not deemed to be impaired |
$ | 1,137 | $ | 7,552 | $ | 1,859 | $ | 10,908 | $ | 2,049 | $ | 195 | $ | 1,146 | $ | 243 | $ | 25,089 | ||||||||||||||||||
|
|
|
|
|
|
|
|
|
|
|
|
|
|
|
|
|
|
|
|||||||||||||||||||
| Loans: |
||||||||||||||||||||||||||||||||||||
| Ending balance |
$ | 14,159 | $ | 650,542 | $ | 127,259 | $ | 736,603 | $ | 264,744 | $ | 11,218 | $ | 229,274 | $ | — | $ | 2,033,799 | ||||||||||||||||||
|
|
|
|
|
|
|
|
|
|
|
|
|
|
|
|
|
|
|
|||||||||||||||||||
| Loans deemed to be impaired |
$ | — | $ | 365 | $ | — | $ | 2,603 | $ | 4,343 | $ | — | $ | — | $ | — | $ | 7,311 | ||||||||||||||||||
|
|
|
|
|
|
|
|
|
|
|
|
|
|
|
|
|
|
|
|||||||||||||||||||
| Loans not deemed to be impaired |
$ | 14,159 | $ | 650,177 | $ | 127,259 | $ | 734,000 | $ | 260,401 | $ | 11,218 | $ | 229,274 | $ | — | $ | 2,026,488 | ||||||||||||||||||
|
|
|
|
|
|
|
|
|
|
|
|
|
|
|
|
|
|
|
|||||||||||||||||||
Further information pertaining to the allowance for loan losses for the six months ending June 30, 2017 follows:
| Construction and Land Development |
Commercial and Industrial |
Municipal | Commercial Real Estate |
Residential Real Estate |
Consumer | Home Equity |
Unallocated | Total | ||||||||||||||||||||||||||||
| (in thousands) | ||||||||||||||||||||||||||||||||||||
| Allowance for loan losses: |
||||||||||||||||||||||||||||||||||||
| Balance at December 31, 2016 |
$ | 1,012 | $ | 6,972 | $ | 1,612 | $ | 11,135 | $ | 1,698 | $ | 582 | $ | 1,102 | $ | 293 | $ | 24,406 | ||||||||||||||||||
| Charge-offs |
— | (29 | ) | — | — | — | (168 | ) | — | — | (197 | ) | ||||||||||||||||||||||||
| Recoveries |
— | 54 | — | — | 2 | 134 | — | — | 190 | |||||||||||||||||||||||||||
| Provision |
125 | 566 | 247 | (107 | ) | 418 | (353 | ) | 44 | (50 | ) | 890 | ||||||||||||||||||||||||
|
|
|
|
|
|
|
|
|
|
|
|
|
|
|
|
|
|
|
|||||||||||||||||||
| Ending balance at June 30, 2017 |
$ | 1,137 | $ | 7,563 | $ | 1,859 | $ | 11,028 | $ | 2,118 | $ | 195 | $ | 1,146 | $ | 243 | $ | 25,289 | ||||||||||||||||||
|
|
|
|
|
|
|
|
|
|
|
|
|
|
|
|
|
|
|
|||||||||||||||||||
| Amount of allowance for loan losses for loans deemed to be impaired |
$ | — | $ | 11 | $ | — | $ | 120 | $ | 69 | $ | — | $ | — | $ | — | $ | 200 | ||||||||||||||||||
|
|
|
|
|
|
|
|
|
|
|
|
|
|
|
|
|
|
|
|||||||||||||||||||
| Amount of allowance for loan losses for loans not deemed to be impaired |
$ | 1,137 | $ | 7,552 | $ | 1,859 | $ | 10,908 | $ | 2,049 | $ | 195 | $ | 1,146 | $ | 243 | $ | 25,089 | ||||||||||||||||||
|
|
|
|
|
|
|
|
|
|
|
|
|
|
|
|
|
|
|
|||||||||||||||||||
| Loans: |
||||||||||||||||||||||||||||||||||||
| Ending balance |
$ | 14,159 | $ | 650,542 | $ | 127,259 | $ | 736,603 | $ | 264,744 | $ | 11,218 | $ | 229,274 | $ | — | $ | 2,033,799 | ||||||||||||||||||
|
|
|
|
|
|
|
|
|
|
|
|
|
|
|
|
|
|
|
|||||||||||||||||||
| Loans deemed to be impaired |
$ | — | $ | 365 | $ | — | $ | 2,603 | $ | 4,343 | $ | — | $ | — | $ | — | $ | 7,311 | ||||||||||||||||||
|
|
|
|
|
|
|
|
|
|
|
|
|
|
|
|
|
|
|
|||||||||||||||||||
| Loans not deemed to be impaired |
$ | 14,159 | $ | 650,177 | $ | 127,259 | $ | 734,000 | $ | 260,401 | $ | 11,218 | $ | 229,274 | $ | — | $ | 2,026,488 | ||||||||||||||||||
|
|
|
|
|
|
|
|
|
|
|
|
|
|
|
|
|
|
|
|||||||||||||||||||
During the six months ending June 30, 2017, the Company’s provision was primarily attributable to an increase in commercial and industrial and residential real estate balances offset, somewhat, by changes in historical loss and qualitative factors. During the three months ending June 30, 2017 the Company’s provision was primarily attributable to an increase in residential real estate loan balances offset, somewhat, by changes in historical loss and qualitative factors. There was also an increase in commercial and industrial originations, which increased the commercial and industrial allocation and lower historical loss rate, which decreased the consumer allocations.
Page 15 of 44
Table of Contents
Further information pertaining to the allowance for loan losses for the three months ending June 30, 2016 follows:
| Construction and Land Development |
Commercial and Industrial |
Municipal | Commercial Real Estate |
Residential Real Estate |
Consumer | Home Equity |
Unallocated | Total | ||||||||||||||||||||||||||||
| (in thousands) | ||||||||||||||||||||||||||||||||||||
| Allowance for loan losses: |
||||||||||||||||||||||||||||||||||||
| Balance at March 31, 2016 |
$ | 1,973 | $ | 6,693 | $ | 990 | $ | 10,533 | $ | 1,249 | $ | 693 | $ | 1,185 | $ | 228 | $ | 23,544 | ||||||||||||||||||
| Charge-offs |
— | — | — | — | — | (111 | ) | — | — | (111 | ) | |||||||||||||||||||||||||
| Recoveries |
— | 56 | — | — | 2 | 106 | — | — | 164 | |||||||||||||||||||||||||||
| Provision |
264 | (878 | ) | 811 | 128 | 53 | (77 | ) | 9 | 40 | 350 | |||||||||||||||||||||||||
| Reclassification to other liabilities |
(3 | ) | (29 | ) | — | (11 | ) | (2 | ) | (3 | ) | (36 | ) | — | (84 | ) | ||||||||||||||||||||
|
|
|
|
|
|
|
|
|
|
|
|
|
|
|
|
|
|
|
|||||||||||||||||||
| Ending balance at June 30, 2016 |
$ | 2,234 | $ | 5,842 | $ | 1,801 | $ | 10,650 | $ | 1,302 | $ | 608 | $ | 1,158 | $ | 268 | $ | 23,863 | ||||||||||||||||||
|
|
|
|
|
|
|
|
|
|
|
|
|
|
|
|
|
|
|
|||||||||||||||||||
| Amount of allowance for loan losses for loans deemed to be impaired |
$ | 6 | $ | 10 | $ | — | $ | 151 | $ | 7 | $ | — | $ | — | $ | — | $ | 174 | ||||||||||||||||||
|
|
|
|
|
|
|
|
|
|
|
|
|
|
|
|
|
|
|
|||||||||||||||||||
| Amount of allowance for loan losses for loans not deemed to be impaired |
$ | 2,228 | $ | 5,832 | $ | 1,801 | $ | 10,499 | $ | 1,295 | $ | 608 | $ | 1,158 | $ | 268 | $ | 23,689 | ||||||||||||||||||
|
|
|
|
|
|
|
|
|
|
|
|
|
|
|
|
|
|
|
|||||||||||||||||||
| Loans: |
||||||||||||||||||||||||||||||||||||
| Ending balance |
$ | 31,178 | $ | 493,033 | $ | 134,386 | $ | 728,658 | $ | 219,494 | $ | 11,339 | $ | 183,816 | $ | — | $ | 1,801,904 | ||||||||||||||||||
|
|
|
|
|
|
|
|
|
|
|
|
|
|
|
|
|
|
|
|||||||||||||||||||
| Loans deemed to be impaired |
$ | 96 | $ | 410 | $ | — | $ | 3,736 | $ | 215 | $ | — | $ | — | $ | — | $ | 4,457 | ||||||||||||||||||
|
|
|
|
|
|
|
|
|
|
|
|
|
|
|
|
|
|
|
|||||||||||||||||||
| Loans not deemed to be impaired |
$ | 31,082 | $ | 492,623 | $ | 134,386 | $ | 724,922 | $ | 219,279 | $ | 11,339 | $ | 183,816 | $ | — | $ | 1,797,447 | ||||||||||||||||||
|
|
|
|
|
|
|
|
|
|
|
|
|
|
|
|
|
|
|
|||||||||||||||||||
Further information pertaining to the allowance for loan losses for the six months ending June 30, 2016 follows:
| Construction and Land Development |
Commercial and Industrial |
Municipal | Commercial Real Estate |
Residential Real Estate |
Consumer | Home Equity |
Unallocated | Total | ||||||||||||||||||||||||||||
| (in thousands) | ||||||||||||||||||||||||||||||||||||
| Allowance for loan losses: |
||||||||||||||||||||||||||||||||||||
| Balance at December 31, 2015 |
$ | 2,041 | $ | 5,899 | $ | 994 | $ | 10,589 | $ | 1,320 | $ | 644 | $ | 1,077 | $ | 511 | $ | 23,075 | ||||||||||||||||||
| Charge-offs |
— | — | — | — | — | (180 | ) | — | — | (180 | ) | |||||||||||||||||||||||||
| Recoveries |
— | 91 | — | — | 3 | 158 | — | — | 252 | |||||||||||||||||||||||||||
| Provision |
196 | (119 | ) | 807 | 72 | (19 | ) | (11 | ) | 117 | (243 | ) | 800 | |||||||||||||||||||||||
| Reclassification to other liabilities |
(3 | ) | (29 | ) | — | (11 | ) | (2 | ) | (3 | ) | (36 | ) | — | (84 | ) | ||||||||||||||||||||
|
|
|
|
|
|
|
|
|
|
|
|
|
|
|
|
|
|
|
|||||||||||||||||||
| Ending balance at June 30, 2016 |
$ | 2,234 | $ | 5,842 | $ | 1,801 | $ | 10,650 | $ | 1,302 | $ | 608 | $ | 1,158 | $ | 268 | $ | 23,863 | ||||||||||||||||||
|
|
|
|
|
|
|
|
|
|
|
|
|
|
|
|
|
|
|
|||||||||||||||||||
| Amount of allowance for loan losses for loans deemed to be impaired |
$ | 6 | $ | 10 | $ | — | $ | 151 | $ | 7 | $ | — | $ | — | $ | — | $ | 174 | ||||||||||||||||||
|
|
|
|
|
|
|
|
|
|
|
|
|
|
|
|
|
|
|
|||||||||||||||||||
| Amount of allowance for loan losses for loans not deemed to be impaired |
$ | 2,228 | $ | 5,832 | $ | 1,801 | $ | 10,499 | $ | 1,295 | $ | 608 | $ | 1,158 | $ | 268 | $ | 23,689 | ||||||||||||||||||
|
|
|
|
|
|
|
|
|
|
|
|
|
|
|
|
|
|
|
|||||||||||||||||||
| Loans: |
||||||||||||||||||||||||||||||||||||
| Ending balance |
$ | 31,178 | $ | 493,033 | $ | 134,386 | $ | 728,658 | $ | 219,494 | $ | 11,339 | $ | 183,816 | $ | — | $ | 1,801,904 | ||||||||||||||||||
|
|
|
|
|
|
|
|
|
|
|
|
|
|
|
|
|
|
|
|||||||||||||||||||
| Loans deemed to be impaired |
$ | 96 | $ | 410 | $ | — | $ | 3,736 | $ | 215 | $ | — | $ | — | $ | — | $ | 4,457 | ||||||||||||||||||
|
|
|
|
|
|
|
|
|
|
|
|
|
|
|
|
|
|
|
|||||||||||||||||||
| Loans not deemed to be impaired |
$ | 31,082 | $ | 492,623 | $ | 134,386 | $ | 724,922 | $ | 219,279 | $ | 11,339 | $ | 183,816 | $ | — | $ | 1,797,447 | ||||||||||||||||||
|
|
|
|
|
|
|
|
|
|
|
|
|
|
|
|
|
|
|
|||||||||||||||||||
During the six months ending June 30, 2016, the Company’s provision was primarily attributable to an increase in municipal balances. During the three months ending June 30, 2016 the Company’s provision was primarily attributable to an increase in construction loan balances. There was also an increase in municipal originations, which increased the municipal allocation and commercial and industrial loan payoffs, which decreased the commercial and industrial allocations.
Page 16 of 44
Table of Contents
The Company utilizes a six grade internal loan rating system for commercial real estate, construction and commercial loans as follows:
Loans rated 1-3 (Pass):
Loans in this category are considered “pass” rated loans with low to average risk.
Loans rated 4 (Monitor):
These loans represent classified loans that management is closely monitoring for credit quality. These loans have had or may have minor credit quality deterioration as of June 30, 2017 and December 31, 2016.
Loans rated 5 (Substandard):
Substandard loans represent classified loans that management is closely monitoring for credit quality. These loans have had more significant credit quality deterioration as of June 30, 2017 and December 31, 2016.
Loans rated 6 (Doubtful):
Doubtful loans represent classified loans that management is closely monitoring for credit quality. These loans had more significant credit quality deterioration as of June 30, 2017 and December 31, 2016 and are doubtful for full collection.
Impaired:
Impaired loans represent classified loans that management is closely monitoring for credit quality. A loan is classified as impaired when it is probable that the Company will be unable to collect all amounts due.
The following table presents the Company’s loans by risk rating at June 30, 2017.
| Construction and Land Development |
Commercial and Industrial |
Municipal | Commercial Real Estate |
|||||||||||||
| (in thousands) | ||||||||||||||||
| Grade: |
||||||||||||||||
| 1-3 (Pass) |
$ | 14,159 | $ | 650,177 | $ | 127,259 | $ | 704,531 | ||||||||
| 4 (Monitor) |
— | — | — | 29,469 | ||||||||||||
| 5 (Substandard) |
— | — | — | — | ||||||||||||
| 6 (Doubtful) |
— | — | — | — | ||||||||||||
| Impaired |
— | 365 | — | 2,603 | ||||||||||||
|
|
|
|
|
|
|
|
|
|||||||||
| Total |
$ | 14,159 | $ | 650,542 | $ | 127,259 | $ | 736,603 | ||||||||
|
|
|
|
|
|
|
|
|
|||||||||
The following table presents the Company’s loans by risk rating at December 31, 2016.
| Construction and Land Development |
Commercial and Industrial |
Municipal | Commercial Real Estate |
|||||||||||||
| (in thousands) | ||||||||||||||||
| Grade: |
||||||||||||||||
| 1-3 (Pass) |
$ | 14,834 | $ | 612,114 | $ | 135,418 | $ | 661,271 | ||||||||
| 4 (Monitor) |
— | — | — | 31,753 | ||||||||||||
| 5 (Substandard) |
— | — | — | — | ||||||||||||
| 6 (Doubtful) |
— | — | — | — | ||||||||||||
| Impaired |
94 | 389 | — | 3,149 | ||||||||||||
|
|
|
|
|
|
|
|
|
|||||||||
| Total |
$ | 14,928 | $ | 612,503 | $ | 135,418 | $ | 696,173 | ||||||||
|
|
|
|
|
|
|
|
|
|||||||||
Page 17 of 44
Table of Contents
The Company has increased its exposure to larger loans to large institutions with publically available credit ratings beginning in 2015. These ratings are tracked as a credit quality indicator for these loans. Credit ratings issued by national organizations were utilized as credit quality indicators as presented in the following table at June 30, 2017 and are included within the total loan portfolio.
| Commercial and Industrial |
Municipal | Commercial Real Estate |
Total | |||||||||||||
| (in thousands) | ||||||||||||||||
| Credit Rating: |
||||||||||||||||
| Aaa – Aa3 |
$ | 341,777 | $ | 66,484 | $ | 45,615 | $ | 453,876 | ||||||||
| A1 – A3 |
218,222 | 8,225 | 128,927 | 355,374 | ||||||||||||
| Baa1 – Baa3 |
— | 46,970 | 125,775 | 172,745 | ||||||||||||
| Ba2 |
— | 2,730 | — | 2,730 | ||||||||||||
|
|
|
|
|
|
|
|
|
|||||||||
| Total |
$ | 559,999 | $ | 124,409 | $ | 300,317 | $ | 984,725 | ||||||||
|
|
|
|
|
|
|
|
|
|||||||||
Credit ratings issued by national organizations were utilized as credit quality indicators as presented in the following table at December 31, 2016.
| Commercial and Industrial |
Municipal | Commercial Real Estate |
Total | |||||||||||||
| (in thousands) | ||||||||||||||||
| Credit Rating: |
||||||||||||||||
| Aaa – Aa3 |
$ | 334,674 | $ | 66,245 | $ | 6,596 | $ | 407,515 | ||||||||
| A1 – A3 |
188,777 | 33,365 | 129,423 | 351,565 | ||||||||||||
| Baa1 – Baa3 |
— | 26,970 | 127,366 | 154,336 | ||||||||||||
| Ba2 |
— | 3,610 | — | 3,610 | ||||||||||||
|
|
|
|
|
|
|
|
|
|||||||||
| Total |
$ | 523,451 | $ | 130,190 | $ | 263,385 | $ | 917,026 | ||||||||
|
|
|
|
|
|
|
|
|
|||||||||
The Company utilized payment performance as credit quality indicators for the loan types listed below. The indicators are depicted in the table “aging of past due loans,” below.
Further information pertaining to the allowance for loan losses at June 30, 2017 follows:
| Accruing 30-89 Days Past Due |
Non Accrual |
Accruing Greater than 90 Days |
Total Past Due |
Current Loans |
Total | |||||||||||||||||||
| (in thousands) | ||||||||||||||||||||||||
| Construction and land development |
$ | — | $ | — | $ | — | $ | — | $ | 14,159 | $ | 14,159 | ||||||||||||
| Commercial and industrial |
404 | 49 | — | 453 | 650,089 | 650,542 | ||||||||||||||||||
| Municipal |
— | — | — | — | 127,259 | 127,259 | ||||||||||||||||||
| Commercial real estate |
455 | 230 | — | 685 | 735,918 | 736,603 | ||||||||||||||||||
| Residential real estate |
984 | 735 | — | 1,719 | 263,025 | 264,744 | ||||||||||||||||||
| Consumer and overdrafts |
6 | 1 | — | 7 | 11,211 | 11,218 | ||||||||||||||||||
| Home equity |
1,357 | 107 | — | 1,464 | 227,810 | 229,274 | ||||||||||||||||||
|
|
|
|
|
|
|
|
|
|
|
|
|
|||||||||||||
| Total |
$ | 3,206 | $ | 1,122 | $ | — | $ | 4,328 | $ | 2,029,471 | $ | 2,033,799 | ||||||||||||
|
|
|
|
|
|
|
|
|
|
|
|
|
|||||||||||||
Page 18 of 44
Table of Contents
Further information pertaining to the allowance for loan losses at December 31, 2016 follows:
| Accruing 30-89 Days Past Due |
Non Accrual |
Accruing Greater than 90 Days |
Total Past Due |
Current Loans |
Total | |||||||||||||||||||
| (in thousands) | ||||||||||||||||||||||||
| Construction and land development |
$ | — | $ | 94 | $ | — | $ | 94 | $ | 14,834 | $ | 14,928 | ||||||||||||
| Commercial and industrial |
37 | 65 | — | 102 | 612,401 | 612,503 | ||||||||||||||||||
| Municipal |
— | — | — | — | 135,418 | 135,418 | ||||||||||||||||||
| Commercial real estate |
597 | 150 | — | 747 | 695,426 | 696,173 | ||||||||||||||||||
| Residential real estate |
245 | 656 | — | 901 | 240,456 | 241,357 | ||||||||||||||||||
| Consumer and overdrafts |
— | 11 | — | 11 | 11,686 | 11,697 | ||||||||||||||||||
| Home equity |
735 | 108 | — | 843 | 211,014 | 211,857 | ||||||||||||||||||
|
|
|
|
|
|
|
|
|
|
|
|
|
|||||||||||||
| Total |
$ | 1,614 | $ | 1,084 | $ | — | $ | 2,698 | $ | 1,921,235 | $ | 1,923,933 | ||||||||||||
|
|
|
|
|
|
|
|
|
|
|
|
|
|||||||||||||
A loan is impaired when, based on current information and events, it is probable that a creditor will be unable to collect all amounts due according to the contractual terms of the loan agreement. When a loan is impaired, the Company measures impairment based on the present value of expected future cash flows discounted at the loan’s effective interest rate, except that as a practical expedient, the Company measures impairment based on a loan’s observable market price or the fair value of the collateral if the loan is collateral dependent. Loans are charged-off when management believes that the collectability of the loan’s principal is not probable. The specific factors that management considers in making the determination that the collectability of the loan’s principal is not probable include: the delinquency status of the loan, the fair value of the collateral, if secured, and the financial strength of the borrower and/or guarantors. For collateral dependent loans, the amount of the recorded investment in a loan that exceeds the fair value of the collateral is charged-off against the allowance for loan losses in lieu of an allocation of a specific allowance amount when such an amount has been identified definitively as uncollectible. The Company’s policy for recognizing interest income on impaired loans is contained within Note 1 of the consolidated financial statements contained in the Company’s Annual Report for the fiscal year ended December 31, 2016.
Page 19 of 44
Table of Contents
The following is information pertaining to impaired loans for June 30, 2017:
| Carrying Value |
Unpaid Principal Balance |
Required Reserve |
Average Carrying Value for 3 Months Ending 6/30/17 |
Interest Income Recognized for 3 Months Ending 6/30/17 |
Average Carrying Value for 6 Months Ending 6/30/17 |
Interest Income Recognized for 6 Months Ending 6/30/17 |
||||||||||||||||||||||
| (in thousands) | ||||||||||||||||||||||||||||
| With no required reserve recorded: |
||||||||||||||||||||||||||||
| Construction and land development |
$ | — | $ | — | $ | — | $ | — | $ | — | $ | — | $ | — | ||||||||||||||
| Commercial and industrial |
49 | 248 | — | 43 | — | 43 | — | |||||||||||||||||||||
| Municipal |
— | — | — | — | — | — | — | |||||||||||||||||||||
| Commercial real estate |
— | — | — | 294 | — | 421 | — | |||||||||||||||||||||
| Residential real estate |
79 | 169 | — | 81 | 2 | 84 | 3 | |||||||||||||||||||||
| Consumer |
— | — | — | — | — | — | — | |||||||||||||||||||||
| Home equity |
— | — | — | — | — | — | — | |||||||||||||||||||||
|
|
|
|
|
|
|
|
|
|
|
|
|
|
|
|||||||||||||||
| Total |
$ | 128 | $ | 417 | $ | — | $ | 418 | $ | 2 | $ | 548 | $ | 3 | ||||||||||||||
|
|
|
|
|
|
|
|
|
|
|
|
|
|
|
|||||||||||||||
| With required reserve recorded: |
||||||||||||||||||||||||||||
| Construction and land development |
$ | — | $ | — | $ | — | $ | 69 | $ | — | $ | 80 | $ | — | ||||||||||||||
| Commercial and industrial |
316 | 331 | 11 | 326 | 4 | 332 | 8 | |||||||||||||||||||||
| Municipal |
— | — | — | — | — | — | — | |||||||||||||||||||||
| Commercial real estate |
2,603 | 2,728 | 120 | 2,546 | 24 | 2,548 | 48 | |||||||||||||||||||||
| Residential real estate |
4,264 | 4,265 | 69 | 1,145 | 24 | 701 | 25 | |||||||||||||||||||||
| Consumer |
— | — | — | — | — | — | — | |||||||||||||||||||||
| Home equity |
— | — | — | — | — | — | — | |||||||||||||||||||||
|
|
|
|
|
|
|
|
|
|
|
|
|
|
|
|||||||||||||||
| Total |
$ | 7,183 | $ | 7,324 | $ | 200 | $ | 4,086 | $ | 52 | $ | 3,661 | $ | 81 | ||||||||||||||
|
|
|
|
|
|
|
|
|
|
|
|
|
|
|
|||||||||||||||
| Total: |
||||||||||||||||||||||||||||
| Construction and land development |
$ | — | $ | — | $ | — | $ | 69 | $ | — | $ | 80 | $ | — | ||||||||||||||
| Commercial and industrial |
365 | 579 | 11 | 369 | 4 | 375 | 8 | |||||||||||||||||||||
| Municipal |
— | — | — | — | — | — | — | |||||||||||||||||||||
| Commercial real estate |
2,603 | 2,728 | 120 | 2,840 | 24 | 2,969 | 48 | |||||||||||||||||||||
| Residential real estate |
4,343 | 4,434 | 69 | 1,226 | 26 | 785 | 28 | |||||||||||||||||||||
| Consumer |
— | — | — | — | — | — | — | |||||||||||||||||||||
| Home equity |
— | — | — | — | — | — | — | |||||||||||||||||||||
|
|
|
|
|
|
|
|
|
|
|
|
|
|
|
|||||||||||||||
| Total |
$ | 7,311 | $ | 7,741 | $ | 200 | $ | 4,504 | $ | 54 | $ | 4,209 | $ | 84 | ||||||||||||||
|
|
|
|
|
|
|
|
|
|
|
|
|
|
|
|||||||||||||||
Page 20 of 44
Table of Contents
The following is information pertaining to impaired loans for June 30, 2016:
| Carrying Value |
Unpaid Principal Balance |
Required Reserve |
Average Carrying Value for 3 Months Ending 6/30/16 |
Interest Income Recognized for 3 Months Ending 6/30/16 |
Average Carrying Value for 6 Months Ending 6/30/16 |
Interest Income Recognized for 6 Months Ending 6/30/16 |
||||||||||||||||||||||
| (in thousands) | ||||||||||||||||||||||||||||
| With no required reserve recorded: |
||||||||||||||||||||||||||||
| Construction and land development |
$ | — | $ | — | $ | — | $ | — | $ | — | $ | — | $ | — | ||||||||||||||
| Commercial and industrial |
52 | 239 | — | 54 | — | 56 | — | |||||||||||||||||||||
| Municipal |
— | — | — | — | — | — | — | |||||||||||||||||||||
| Commercial real estate |
596 | 596 | — | 329 | 16 | 188 | 22 | |||||||||||||||||||||
| Residential real estate |
103 | 190 | — | 106 | 2 | 108 | 4 | |||||||||||||||||||||
| Consumer |
— | — | — | — | — | — | — | |||||||||||||||||||||
| Home equity |
— | — | — | — | — | — | — | |||||||||||||||||||||
|
|
|
|
|
|
|
|
|
|
|
|
|
|
|
|||||||||||||||
| Total |
$ | 751 | $ | 1,025 | $ | — | $ | 489 | $ | 18 | $ | 352 | $ | 26 | ||||||||||||||
|
|
|
|
|
|
|
|
|
|
|
|
|
|
|
|||||||||||||||
| With required reserve recorded: |
||||||||||||||||||||||||||||
| Construction and land development |
$ | 96 | $ | 108 | $ | 6 | $ | 97 | $ | — | $ | 97 | $ | — | ||||||||||||||
| Commercial and industrial |
358 | 373 | 10 | 370 | 5 | 374 | 9 | |||||||||||||||||||||
| Municipal |
— | — | — | — | — | — | — | |||||||||||||||||||||
| Commercial real estate |
3,140 | 3,239 | 151 | 2,030 | 20 | 1,878 | 33 | |||||||||||||||||||||
| Residential real estate |
112 | 112 | 7 | 283 | 1 | 505 | 3 | |||||||||||||||||||||
| Consumer |
— | — | — | — | — | — | — | |||||||||||||||||||||
| Home equity |
— | — | — | 22 | — | 51 | — | |||||||||||||||||||||
|
|
|
|
|
|
|
|
|
|
|
|
|
|
|
|||||||||||||||
| Total |
$ | 3,706 | $ | 3,832 | $ | 174 | $ | 2,802 | $ | 26 | $ | 2,905 | $ | 45 | ||||||||||||||
|
|
|
|
|
|
|
|
|
|
|
|
|
|
|
|||||||||||||||
| Total: |
||||||||||||||||||||||||||||
| Construction and land development |
$ | 96 | $ | 108 | $ | 6 | $ | 97 | $ | — | $ | 97 | $ | — | ||||||||||||||
| Commercial and industrial |
410 | 612 | 10 | 424 | 5 | 430 | 9 | |||||||||||||||||||||
| Municipal |
— | — | — | — | — | — | — | |||||||||||||||||||||
| Commercial real estate |
3,736 | 3,835 | 151 | 2,359 | 36 | 2,066 | 55 | |||||||||||||||||||||
| Residential real estate |
215 | 302 | 7 | 389 | 3 | 613 | 7 | |||||||||||||||||||||
| Consumer |
— | — | — | — | — | — | — | |||||||||||||||||||||
| Home equity |
— | — | — | 22 | — | 51 | — | |||||||||||||||||||||
|
|
|
|
|
|
|
|
|
|
|
|
|
|
|
|||||||||||||||
| Total |
$ | 4,457 | $ | 4,857 | $ | 174 | $ | 3,291 | $ | 44 | $ | 3,257 | $ | 71 | ||||||||||||||
|
|
|
|
|
|
|
|
|
|
|
|
|
|
|
|||||||||||||||
There were no troubled debt restructurings that occurred during the six-month period ended June 30, 2017.
There was one commercial real estate troubled debt restructuring during the six month period ending June 30, 2016. The pre-modification and post-modification outstanding recorded investment was $2,091,000. The loan was modified for 2016, by reducing the interest rate as well as extending the term on the loan. The financial impact for the modification was $3,000 reduction in principal payments and $1,000 reduction in interest payments.
Page 21 of 44
Table of Contents
Note 5. Reclassifications Out of Accumulated Other Comprehensive Income (a)
Amount Reclassified from Accumulated Other Comprehensive Income
| Details about Accumulated Other Comprehensive Income Components |
Three Months Ended June 30, 2017 |
Three Months Ended June 30, 2016 |
Affected Line Item in the Statement where Net Income is Presented | |||||||
| (in thousands) | ||||||||||
| Unrealized gains and losses on available-for-sale securities |
$ | — | $ | 45 | Net gains on sales of investments | |||||
| — | (18 | ) | Provision for income taxes | |||||||
|
|
|
|
|
|||||||
| $ | — | $ | 27 | Net income | ||||||
|
|
|
|
|
|||||||
| Accretion of unrealized losses transferred |
$ | (662 | ) | $ | (1,170 | ) | Interest on securities held-to-maturity | |||
| 402 | 408 | Provision for income taxes | ||||||||
|
|
|
|
|
|||||||
| $ | (260 | ) | $ | (762 | ) | Net income | ||||
|
|
|
|
|
|||||||
| Amortization of defined benefit pension items |
||||||||||
| Prior-service costs |
$ | (3 | )(b) | $ | (3 | )(b) | Salaries and employee benefits | |||
| Actuarial gains (losses) |
(385 | )(b) | (401 | )(b) | Salaries and employee benefits | |||||
|
|
|
|
|
|||||||
| Total before tax |
(388 | ) | (404 | ) | Income before taxes | |||||
|
|
|
|
|
|||||||
| 155 | 161 | Provision for income taxes | ||||||||
|
|
|
|
|
|||||||
| $ | (233 | ) | $ | (243 | ) | Net income | ||||
|
|
|
|
|
|||||||
| Details about Accumulated Other Comprehensive Income Components |
Six Months Ended June 30, 2017 |
Six Months Ended June 30, 2016 |
Affected Line Item in the Statement where Net Income is Presented | |||||||
| (in thousands) | ||||||||||
| Unrealized gains and losses on available-for-sale securities |
$ | — | $ | 45 | Net gains on sales of investments | |||||
| — | (18 | ) | Provision for income taxes | |||||||
|
|
|
|
|
|||||||
| $ | — | $ | 27 | Net income | ||||||
|
|
|
|
|
|||||||
| Accretion of unrealized losses transferred |
$ | (1,324 | ) | $ | (2,682 | ) | Interest on securities held-to-maturity | |||
| 691 | 935 | Provision for income taxes | ||||||||
|
|
|
|
|
|||||||
| $ | (633 | ) | $ | (1,747 | ) | Net income | ||||
|
|
|
|
|
|||||||
| Amortization of defined benefit pension items |
||||||||||
| Prior-service costs |
$ | (6 | )(b) | $ | (5 | )(b) | Salaries and employee benefits | |||
| Actuarial gains (losses) |
(770 | )(b) | (802 | )(b) | Salaries and employee benefits | |||||
|
|
|
|
|
|||||||
| Total before tax |
(776 | ) | (807 | ) | Income before taxes | |||||
|
|
|
|
|
|||||||
| 311 | 322 | Provision for income taxes | ||||||||
|
|
|
|
|
|||||||
| $ | (465 | ) | $ | (485 | ) | Net income | ||||
|
|
|
|
|
|||||||
| (a) | Amount in parentheses indicates reductions to net income. |
| (b) | These accumulated other comprehensive income components are included in the computation of net periodic pension cost (see Employee Benefits footnote (Note 7) for additional details). |
Page 22 of 44
Table of Contents
Note 6. Earnings per Share (“EPS”)
Class A and Class B shares participate equally in undistributed earnings. Under the Company’s Articles of Organization, the holders of Class A Common Stock are entitled to receive dividends per share equal to at least 200% of dividends paid, if any, from time to time, on each share of Class B Common Stock.
Diluted EPS includes the dilutive effect of common stock equivalents; basic EPS excludes all common stock equivalents. The Company had no common stock equivalents outstanding for the periods ended June 30, 2017 and 2016.
The following table is a reconciliation of basic EPS and diluted EPS.
| Three Months Ended June 30, |
Six Months Ended June 30, |
|||||||||||||||
| (in thousands except share and per share data) | 2017 | 2016 | 2017 | 2016 | ||||||||||||
| Basic EPS Computation: |
||||||||||||||||
| Numerator: |
||||||||||||||||
| Net income, Class A |
$ | 6,410 | $ | 4,902 | $ | 11,198 | $ | 9,071 | ||||||||
| Net income, Class B |
1,747 | 1,339 | 3,055 | 2,478 | ||||||||||||
| Denominator: |
||||||||||||||||
| Weighted average shares outstanding, Class A |
3,603,729 | 3,600,729 | 3,602,229 | 3,600,729 | ||||||||||||
| Weighted average shares outstanding, Class B |
1,964,180 | 1,967,180 | 1,965,680 | 1,967,180 | ||||||||||||
| Basic EPS, Class A |
$ | 1.78 | $ | 1.36 | $ | 3.11 | $ | 2.52 | ||||||||
| Basic EPS, Class B |
0.89 | 0.68 | 1.55 | 1.26 | ||||||||||||
|
|
|
|
|
|
|
|
|
|||||||||
| Diluted EPS Computation: |
||||||||||||||||
| Numerator: |
||||||||||||||||
| Net income, Class A |
$ | 6,410 | $ | 4,902 | $ | 11,198 | $ | 9,071 | ||||||||
| Net income, Class B |
1,747 | 1,339 | 3,055 | 2,478 | ||||||||||||
|
|
|
|
|
|
|
|
|
|||||||||
| Total net income, for diluted EPS, Class A computation |
8,157 | 6,241 | 14,253 | 11,549 | ||||||||||||
| Denominator: |
||||||||||||||||
| Weighted average shares outstanding, basic, Class A |
3,603,729 | 3,600,729 | 3,602,229 | 3,600,729 | ||||||||||||
| Weighted average shares outstanding, Class B |
1,964,180 | 1,967,180 | 1,965,680 | 1,967,180 | ||||||||||||
|
|
|
|
|
|
|
|
|
|||||||||
| Weighted average shares outstanding diluted, Class A |
5,567,909 | 5,567,909 | 5,567,909 | 5,567,909 | ||||||||||||
| Weighted average shares outstanding, Class B |
1,964,180 | 1,967,180 | 1,965,680 | 1,967,180 | ||||||||||||
| Diluted EPS, Class A |
$ | 1.47 | $ | 1.12 | $ | 2.56 | $ | 2.07 | ||||||||
| Diluted EPS, Class B |
0.89 | 0.68 | 1.55 | 1.26 | ||||||||||||
|
|
|
|
|
|
|
|
|
|||||||||
Note 7. Employee Benefits
The Company provides pension benefits to its employees under a noncontributory, defined benefit plan which is funded on a current basis in compliance with the requirements of the Employee Retirement Income Security Act of 1974 (“ERISA”) and recognizes costs over the estimated employee service period.
The Company also has a Supplemental Executive Insurance/Retirement Plan (the “Supplemental Plan”) which is limited to certain officers and employees of the Company. The Supplemental Plan is accrued on a current basis and recognizes costs over the estimated employee service period.
Executive officers of the Company and its subsidiaries who have at least one year of service may participate in the Supplemental Plan. The Supplemental Plan is voluntary and participants are required to contribute to its cost. Life insurance policies, which are owned by the Company, are purchased covering the lives of each participant.
Page 23 of 44
Table of Contents
Components of Net Periodic Benefit Cost for the Three Months Ended June 30,
| Pension Benefits | Supplemental Insurance/ Retirement Plan |
|||||||||||||||
| 2017 | 2016 | 2017 | 2016 | |||||||||||||
| (in thousands) | ||||||||||||||||
| Service cost |
$ | 310 | $ | 318 | $ | 395 | $ | 455 | ||||||||
| Interest |
362 | 340 | 345 | 334 | ||||||||||||
| Expected return on plan assets |
(746 | ) | (694 | ) | — | — | ||||||||||
| Recognized prior service cost (benefit) |
(26 | ) | (26 | ) | 29 | 29 | ||||||||||
| Recognized net actuarial losses |
226 | 200 | 159 | 200 | ||||||||||||
|
|
|
|
|
|
|
|
|
|||||||||
| Net periodic benefit cost |
$ | 126 | $ | 138 | $ | 928 | $ | 1,018 | ||||||||
|
|
|
|
|
|
|
|
|
|||||||||
Components of Net Periodic Benefit Cost for the Six Months Ended June 30,
| Pension Benefits | Supplemental Insurance/ Retirement Plan |
|||||||||||||||
| 2017 | 2016 | 2017 | 2016 | |||||||||||||
| (in thousands) | ||||||||||||||||
| Service cost |
$ | 620 | $ | 636 | $ | 790 | $ | 910 | ||||||||
| Interest |
724 | 680 | 690 | 668 | ||||||||||||
| Expected return on plan assets |
(1,492 | ) | (1,388 | ) | — | — | ||||||||||
| Recognized prior service cost (benefit) |
(52 | ) | (52 | ) | 58 | 58 | ||||||||||
| Recognized net actuarial losses |
452 | 400 | 318 | 400 | ||||||||||||
|
|
|
|
|
|
|
|
|
|||||||||
| Net periodic benefit cost |
$ | 252 | $ | 276 | $ | 1,856 | $ | 2,036 | ||||||||
|
|
|
|
|
|
|
|
|
|||||||||
Contributions
The Company intends to contribute $1,000,000 to the Pension Plan in 2017. As of June 30, 2017, $500,000 has been contributed.
Note 8. Fair Value Measurements
The Company follows FASB ASC 820-10, Fair Value Measurements and Disclosures, which among other things, requires enhanced disclosures about assets and liabilities carried at fair value. ASC 820-10 establishes a hierarchal disclosure framework associated with the level of pricing observability utilized in measuring financial instruments at fair value. The three broad levels of the hierarchy are as follows:
Level I – Quoted prices are available in active markets for identical assets or liabilities as of the reported date. The type of financial instruments included in Level I are highly liquid cash instruments with quoted prices such as G-7 government, agency securities, listed equities and money market securities, as well as listed derivative instruments.
Level II – Pricing inputs are other than quoted prices in active markets, which are either directly or indirectly observable as of the reported date. The nature of these financial instruments include cash instruments for which quoted prices are available but traded less frequently, derivative instruments whose fair value have been derived using a model where inputs to the model are directly observable in the market, or can be derived principally from or corroborated by observable market data, and instruments that are fair valued using other financial instruments, the parameters of which can be directly observed. Instruments which are generally included in this category are corporate bonds and loans, mortgage whole loans and municipal bonds.
Level III – Instruments that have little to no pricing observability as of the reported date. These financial instruments do not have two-way markets and are measured using management’s best estimate of fair value, where the inputs into the determination of fair value require significant management judgment or estimation. Instruments that are included in this category generally include certain commercial mortgage loans, certain private equity investments, and distressed debt and non-investment grade residual interests in securitizations.
Page 24 of 44
Table of Contents
The results of the fair value hierarchy as of June 30, 2017, are as follows:
Financial Instruments Measured at Fair Value on a Recurring Basis:
| Securities AFS Fair Value Measurements Using | ||||||||||||||||
| Carrying Value |
Quoted Prices In Active Markets for Identitcal Assets (Level 1) |
Significant Observable Inputs (Level 2) |
Significant Other Unobservable Inputs (Level 3) |
|||||||||||||
| (in thousands) | ||||||||||||||||
| U.S . Treasury |
$ | 1,995 | $ | — | $ | 1,995 | $ | — | ||||||||
| U.S . Government Sponsored Enterprises |
10,000 | — | 10,000 | — | ||||||||||||
| SBA Backed Securities |
71,189 | — | 71,189 | — | ||||||||||||
| U.S . Government Agency and Sponsored Mortgage-Backed Securities |
223,782 | — | 223,782 | — | ||||||||||||
| Privately Issued Residential Mortgage-Backed Securities |
1,015 | — | 1,015 | — | ||||||||||||
| Obligations Issued by States and Political Subdivisions |
98,049 | — | — | 98,049 | ||||||||||||
| Other Debt Securities |
4,992 | — | 4,992 | — | ||||||||||||
| Equity Securities |
318 | 318 | — | — | ||||||||||||
|
|
|
|
|
|
|
|
|
|||||||||
| Total |
$ | 411,340 | $ | 318 | $ | 312,973 | $ | 98,049 | ||||||||
|
|
|
|
|
|
|
|
|
|||||||||
| Financial Instruments Measured at Fair Value on a Non-recurring Basis: | ||||||||||||||||
| Impaired Loans |
$ | 230 | $ | — | $ | — | $ | 230 | ||||||||
Impaired loan balances represent those collateral dependent loans where management has estimated the credit loss by comparing the loan’s carrying value against the expected realizable fair value of the collateral. Fair value is generally determined through a review process that includes independent appraisals, discounted cash flows, or other external assessments of the underlying collateral, which generally include various Level 3 inputs which are not observable. The Company discounts the fair values, as appropriate, based on management’s observations of the local real estate market for loans in this category.
Appraisals, discounted cash flows and real estate tax assessments are reviewed quarterly. There is no specific policy regarding how frequently appraisals will be updated. Adjustments are made to appraisals and real estate tax assessments based on management’s estimate of changes in real estate values. Within the past twelve months there have been no updated appraisals, however, all impaired loans have been reviewed during the past quarter using either a discounted cash flow analysis, appraisal of collateral or other type of real estate tax assessment. The types of adjustments that are made to specific provisions (credits) relate to impaired loans recognized for the three and six month periods ended June 30, 2017 amounted to $4,000 and ($5,000), respectively.
There were no transfers between level 1, 2 and 3 for the six months ended June 30, 2017. There were no liabilities measured at fair value on a recurring or nonrecurring basis during the six month period ended June 30, 2017.
Page 25 of 44
Table of Contents
The following table presents additional information about assets measured at fair value on a recurring and nonrecurring basis for which the Company has utilized Level 3 inputs to determine fair value (dollars in thousands). Management continues to monitor the assumptions used to value the assets listed below.
| Asset |
Fair Value | Valuation Technique |
Unobservable Input |
Unobservable Input | ||||||
| Securities AFS (4) |
$ | 98,049 | Discounted cash flow | Discount rate | 0% -1% (3) | |||||
| Impaired Loans |
$ | 230 | Appraisal of collateral (1) | Appraisal adjustments (2) | 0%-30% discount | |||||
| (1) | Fair value is generally determined through independent appraisals of the underlying collateral, which generally include various Level 3 inputs which are not identifiable. |
| (2) | Appraisals may be adjusted by management for qualitative factors such as economic conditions and estimated expenses. |
| (3) | Weighted averages. |
| (4) | Municipal securities generally have maturities of one year or less and, therefore, the amortized cost equates to the fair value. There was one auction rate security whose fair value is based on the evaluation of the underlying issuer, prevailing interest rates and market liquidity. |
The changes in Level 3 securities for the three month period ended June 30, 2017 are shown in the table below:
| Auction Rate Securities |
Obligations Issued by States & Political Subdivisions |
Equity Securities |
Total | |||||||||||||
| (in thousands) | ||||||||||||||||
| Balance at December 31, 2016 |
$ | 4,298 | $ | 160,578 | $ | — | $ | 164,876 | ||||||||
| Purchases |
— | 47,430 | — | 47,430 | ||||||||||||
| Maturities and calls |
— | (114,144 | ) | — | (114,144 | ) | ||||||||||
| Amortization |
— | (113 | ) | — | (113 | ) | ||||||||||
|
|
|
|
|
|
|
|
|
|||||||||
| Balance at June 30, 2017 |
$ | 4,298 | $ | 93,751 | $ | — | $ | 98,049 | ||||||||
|
|
|
|
|
|
|
|
|
|||||||||
The amortized cost of Level 3 securities was $98,457,000 at June 30, 2017 with an unrealized loss of $408,000. The securities in this category are generally municipal securities with no readily determinable fair value or failed auction rate securities. Management evaluated the fair value of these securities based on an evaluation of the underlying issuer, prevailing rates and market liquidity.
The changes in Level 3 securities for the six month period ended June 30, 2016, are shown in the table below:
| Auction Rate Securities |
Obligations Issued by States & Political Subdivisions |
Equity Securities |
Total | |||||||||||||
| (in thousands) | ||||||||||||||||
| Balance at December 31, 2015 |
$ | 3,820 | $ | 153,140 | $ | 37 | $ | 156,997 | ||||||||
| Purchases |
— | 155,742 | — | 155,742 | ||||||||||||
| Maturities and calls |
— | (100,245 | ) | (37 | ) | (100,282 | ) | |||||||||
| Amortization |
— | (97 | ) | — | (97 | ) | ||||||||||
| Changes in fair value |
478 | — | — | 478 | ||||||||||||
|
|
|
|
|
|
|
|
|
|||||||||
| Balance at June 30, 2016 |
$ | 4,298 | $ | 208,540 | $ | — | $ | 212,838 | ||||||||
|
|
|
|
|
|
|
|
|
|||||||||
The amortized cost of Level 3 securities was $213,241,000 at June 30, 2016 with an unrealized loss of $403,000. The securities in this category are generally equity investments, municipal securities with no readily determinable fair value or failed auction rate securities. Management evaluated the fair value of these securities based on an evaluation of the underlying issuer, prevailing rates and market liquidity.
Page 26 of 44
Table of Contents
The results of the fair value hierarchy as of December 31, 2016, are as follows:
Financial Instruments Measured at Fair Value on a Recurring Basis:
| Securities AFS Fair Value Measurements Using | ||||||||||||||||
| Carrying Value |
Quoted Prices In Active Markets for Identitcal Assets (Level 1) |
Significant Observable Inputs (Level 2) |
Significant Other Unobservable Inputs (Level 3) |
|||||||||||||
| (in thousands) | ||||||||||||||||
| U.S. Treasury |
$ | 2,000 | $ | — | $ | 2,000 | $ | — | ||||||||
| U.S. Government Sponsored Enterprises |
24,952 | — | 24,952 | — | ||||||||||||
| SBA Backed Securities |
57,767 | — | 57,767 | — | ||||||||||||
| U.S. Government Agency and Sponsored Mortgage-Backed Securities |
243,325 | — | 243,325 | — | ||||||||||||
| Privately Issued Residential Mortgage-Backed Securities |
1,109 | — | 1,109 | — | ||||||||||||
| Obligations Issued by States and Political Subdivisions |
164,876 | — | — | 164,876 | ||||||||||||
| Other Debt Securities |
4,924 | — | 4,924 | — | ||||||||||||
| Equity Securities |
344 | 344 | — | — | ||||||||||||
|
|
|
|
|
|
|
|
|
|||||||||
| Total |
$ | 499,297 | $ | 344 | $ | 334,077 | $ | 164,876 | ||||||||
|
|
|
|
|
|
|
|
|
|||||||||
| Financial Instruments Measured at Fair Value on a Non-recurring Basis: | ||||||||||||||||
| Impaired Loans |
$ | 260 | $ | — | $ | — | $ | 260 | ||||||||
Impaired loan balances represent those collateral dependent loans where management has estimated the credit loss by comparing the loan’s carrying value against the expected realizable fair value of the collateral. Fair value is generally determined through a review process that includes independent appraisals, discounted cash flows, or other external assessments of the underlying collateral, which generally include various Level 3 inputs which are not identifiable. The Company discounts the fair values, as appropriate, based on management’s observations of the local real estate market for loans in this category.
Appraisals, discounted cash flows and real estate tax assessments are reviewed quarterly. There is no specific policy regarding how frequently appraisals will be updated. Adjustments are made to appraisals and real estate tax assessments based on management’s estimate of changes in real estate values. Within the past twelve months there have been no updated appraisals, however, all impaired loans have been reviewed during the past quarter using either a discounted cash flow analysis, appraisal of collateral or other type of real estate tax assessment. The types of adjustments that are made to specific provisions (credits) relate to impaired loans recognized for 2016 for the estimated credit loss amounted to ($135,000).
There were no transfers between level 1, 2 and 3 for the year ended December 31, 2016. There were no liabilities measured at fair value on a recurring or nonrecurring basis during the year ended December 31, 2016.
The following table presents additional information about assets measured at fair value on a recurring and nonrecurring basis for which the Company has utilized Level 3 inputs to determine fair value (dollars in thousands). Management continues to monitor the assumptions used to value the assets listed below.
| Asset |
Fair Value | Valuation Technique |
Unobservable Input |
Unobservable Input Value or Range | ||||||
| Securities AFS (4) |
$ | 164,876 | Discounted cash flow | Discount rate | 0%-1% (3) | |||||
| Impaired Loans |
$ | 260 | Appraisal of collateral (1) | Appraisal adjustments (2) | 0%-30% discount | |||||
Page 27 of 44
Table of Contents
| (1) | Fair value is generally determined through independent appraisals of the underlying collateral, which generally include various Level 3 inputs which are not identifiable. |
| (2) | Appraisals may be adjusted by management for qualitative factors such as economic conditions and estimated expenses. |
| (3) | Weighted averages |
| (4) | Municipal securities generally have maturities of one year or less and, therefore, the amortized cost equates to the fair value. There was one auction rate security whose fair value is based on the evaluation of the underlying issuer, prevailing interest rates and market liquidity. |
Note 9. Fair Values of Financial Instruments
The following methods and assumptions were used by the Company in estimating fair values of its financial instruments. Excluded from this disclosure are all nonfinancial instruments. Accordingly, the aggregate fair value amounts presented do not represent the underlying value of the Company.
The assumptions used below are expected to approximate those that market participants would use in valuing these financial instruments.
Fair value estimates are made at a specific point in time, based on available market information and judgments about the financial instrument, including estimates of timing, amount of expected future cash flows and the credit standing of the issuer. Such estimates do not consider the tax impact of the realization of unrealized gains or losses. In some cases, the fair value estimates cannot be substantiated by comparison to independent markets. In addition, the disclosed fair value may not be realized in the immediate settlement of the financial instrument. Care should be exercised in deriving conclusions about our business, its value or financial position based on the fair value information of financial instruments presented below.
Securities held-to-maturity: The fair values of these securities were based on quoted market prices, where available, as provided by third-party investment portfolio pricing vendors. If quoted market prices were not available, fair values provided by the vendors were based on quoted market prices of comparable instruments in active markets and/or based on a matrix pricing methodology which employs The Bond Market Association’s standard calculations for cash flow and price/yield analysis, live benchmark bond pricing and terms/condition data available from major pricing sources. Management regards the inputs and methods used by third party pricing vendors to be “Level 2 inputs and methods” as defined in the “fair value hierarchy” provided by FASB.
Loans Held-for-Sale: Fair value is measured using quoted market prices when available. These assets are typically categorized as Level 1. If quoted market prices are not available, comparable market values may be utilized. These assets are typically categorized as Level 2.
Loans: For variable-rate loans, that reprice frequently and with no significant change in credit risk, fair values are based on carrying amounts. The fair value of other loans is estimated using discounted cash flow analysis, based on interest rates currently being offered for loans with similar terms to borrowers of similar credit quality. Incremental credit risk for nonperforming loans has been considered.
Time deposits: The fair value of time deposits was estimated using a discounted cash flow approach that applies prevailing market interest rates for similar maturity instruments. The fair values of the Company’s time deposit liabilities do not take into consideration the value of the Company’s long-term relationships with depositors, which may have significant value.
Other borrowed funds: The fair value of other borrowed funds is based on the discounted value of contractual cash flows. The discount rate used is estimated based on the rates currently offered for other borrowed funds of similar remaining maturities.
Subordinated debentures: The fair value of subordinated debentures is based on the discounted value of contractual cash flows. The discount rate used is estimated based on the rates currently offered for other subordinated debentures of similar remaining maturities.
Page 28 of 44
Table of Contents
The following presents (in thousands) the carrying amount, estimated fair value, and placement in the fair value hierarchy of the Company’s financial instruments as of June 30, 2017 and December 31, 2016. This table excludes financial instruments for which the carrying amount approximates fair value. Financial assets for which the fair value approximates carrying value include cash and cash equivalents, short-term investments, FHLBB stock and accrued interest receivable. Financial liabilities for which the fair value approximates carrying value include non-maturity deposits, short-term borrowings and accrued interest payable.
| June 30, 2017 |
Carrying Amount |
Estimated Fair Value |
Fair Value Measurements Level 1 Inputs |
Fair Value Level 2 Inputs |
Fair Value Level 3 Inputs |
|||||||||||||||
| (in thousands) | ||||||||||||||||||||
| Financial assets: |
||||||||||||||||||||
| Securities held-to-maturity |
$ | 1,722,875 | $ | 1,706,840 | $ | — | $ | 1,706,840 | $ | — | ||||||||||
| Loans (1) |
2,008,510 | 1,987,896 | — | — | 1,987,896 | |||||||||||||||
| Financial liabilities: |
||||||||||||||||||||
| Time deposits |
575,410 | 577,804 | — | 577,804 | — | |||||||||||||||
| Other borrowed funds |
455,500 | 457,252 | — | 457,252 | — | |||||||||||||||
| Subordinated debentures |
36,083 | 36,083 | — | — | 36,083 | |||||||||||||||
| December 31, 2016 |
||||||||||||||||||||
| Financial assets: |
||||||||||||||||||||
| Securities held-to-maturity |
$ | 1,653,986 | $ | 1,635,808 | $ | — | $ | 1,635,808 | $ | — | ||||||||||
| Loans (1) |
1,899,527 | 1,873,703 | — | — | 1,873,703 | |||||||||||||||
| Financial liabilities: |
||||||||||||||||||||
| Time deposits |
478,359 | 480,133 | — | 480,133 | — | |||||||||||||||
| Other borrowed funds |
293,000 | 294,940 | — | 294,940 | — | |||||||||||||||
| Subordinated debentures |
36,083 | 36,083 | — | — | 36,083 | |||||||||||||||
| (1) | Comprised of loans (including collateral dependent impaired loans), net of deferred loan costs and the allowance for loan losses. |
Note 10. Recent Accounting Developments
In March 2017, the Financial Accounting Standards Board (“FASB”) issued Accounting Standards Update (“ASU”) ASU 2017-08, Receivables—Nonrefundable Fees and Other Costs (Subtopic 310-20) Premium Amortization on Purchased Callable Debt. The FASB is issuing this ASU to amend the amortization period for certain purchased callable debt securities held at a premium. The FASB is shortening the amortization period for the premium to the earliest call date. Under current generally accepted accounting principles (GAAP), entities generally amortize the premium as an adjustment of yield over the contractual life of the instrument. For public business entities, the amendments in this ASU are effective for fiscal years, and interim periods within those fiscal years, beginning after December 15, 2018. Management is currently assessing the applicability of this ASU and has not determined the impact, if any, as of June 30, 2017.
In March 2017, the FASB issued ASU 2017-07, Compensation-Retirement benefits (Topic 715) Improving the Presentation of Net Periodic Pension Cost and Net Periodic Postretirement Benefit Cost. The amendments in this ASU require that an employer disaggregate the service cost component from the other components of net benefit cost. The amendments also provide explicit guidance on how to present the service cost component and the other components of net benefit cost in the income statement and allow only the service cost component of net benefit cost to be eligible for capitalization. The amendments in this ASU are effective for fiscal years beginning after December 15, 2017. Early adoption is permitted. Management is currently assessing the applicability of this ASU and has not determined the impact, if any, as of June 30, 2017.
In February 2017, the FASB issued ASU 2017-06, Plan Accounting: Defined Benefit Pension Plans (Topic 960) Defined Contribution Pension Plans (Topic 962) Health and Welfare Benefit Plans (Topic 965), Employee Benefit Plan Master Trust Reporting. The FASB has issued this ASU to improve the usefulness of the information reported to users of employee benefit plan financial statements and to provide clarity to preparers and auditors. This ASU relates primarily to the reporting by an employee benefit plan for its interest in a master trust. The amendments in this ASU clarify presentation requirements for a plan’s interest in a master trust and require more detailed disclosures of the plan’s interest in the master trust. The amendments in this ASU are effective for fiscal years beginning after December 15, 2018. Early adoption is permitted. Management is currently assessing the applicability of this ASU and has not determined the impact, if any, as of June 30, 2017.
Page 29 of 44
Table of Contents
In February 2017, the FASB issued ASU 2017-05, Other Income Gains and Losses from the Derecognition of Nonfinancial Assets (Subtopic 610-20). This ASU was issued to clarify the scope of Subtopic 610-20, and to add guidance for partial sales of nonfinancial assets. For public entities, this ASU is effective for annual reporting periods beginning after December 15, 2017. Management believes that this ASU applies and is assessing the impact, if any, as of June 30, 2017.
In January 2017, the Financial Accounting Standards Board (“FASB”) issued Accounting Standards Update (“ASU”) 2017-04, Intangibles – Goodwill and Other (Topic 350). This ASU was issued to simplify the subsequent measurement of goodwill by eliminating Step 2 from the goodwill impairment test. For public entities, this ASU is effective for the fiscal years beginning after December 15, 2019, including interim periods within those fiscal years. Early adoption is permitted and application should be on a prospective basis. Management is currently assessing the applicability of this ASU and has not determined the impact, if any, as of June 30, 2017.
In June 2016, the FASB issued ASU 2016-13, Financial Instruments-Credit Losses (Topic 326): Measurement of Credit Losses on Financial Instruments. This ASU was issued to provide financial statement users with more decision-useful information about the expected credit losses on financial instruments and other commitments to extend credit held by a reporting entity at each reporting date. To achieve this objective, the amendments in this ASU replace the incurred loss impairment methodology in current GAAP with a methodology that reflects expected credit losses and requires consideration of a broader range of reasonable and supportable information to inform credit loss estimates. The amendments in this ASU are effective for fiscal years beginning after December 15, 2019, including interim periods within those fiscal years. The Company is currently assessing this ASU and has not determined the impact, if any, as of June 30, 2017.
In May 2016, the FASB issued ASU 2016-12, Revenue from Contracts with Customers (Topic 606): Narrow-Scope Improvements and Practical Expedients. The intention of this ASU is to provide additional clarification on specific issues brought forth by the FASB and the International Accounting Standards Board Joint Transition Resource Group for Revenue Recognition in relation to Topic 606 and revenue recognition. This ASU is to have the same effective date as ASU 2015-14 which deferred the effective date of ASU 2014-09 to December 15, 2017. Management has determined that ASU 2016-12 does apply, but has not determined the impact, if any, as of June 30, 2017. Management assembled a project team to address the changes pursuant to Topic 606. The project team has made an initial scope assessment and additional progress over the topic is expected to be made in the third quarter of 2017.
In February 2016, the FASB issued ASU 2016-02, Leases. This ASU requires lessees to put most leases on their balance sheet but recognize expenses on their income statements in a manner similar to today’s accounting. This ASU also eliminates today’s real estate-specific provisions for all companies. For lessors, this ASU modifies the classification criteria and the accounting for sales-type and direct financing leases. This ASU is effective for fiscal years beginning after December 15, 2018, including interim periods therein. Early adoption is permitted. The Company is currently assessing the applicability of this ASU and has not determined the impact, if any, as of June 30, 2017.
| Item 2. | Management’s Discussion and Analysis of Financial Condition and Results of Operations |
Executive Overview
Century Bancorp, Inc. (together with its bank subsidiary, unless the context otherwise requires, the “Company”) is a Massachusetts state-chartered bank holding company headquartered in Medford, Massachusetts. The Company is a Massachusetts corporation formed in 1972 and has one banking subsidiary (the “Bank”): Century Bank and Trust Company formed in 1969. At June 30, 2017, the Company had total assets of $4.5 billion. Currently, the Company operates 27 banking offices in 20 cities and towns in Massachusetts, ranging from Braintree in the south to Andover in the north. The Bank’s customers consist primarily of small and medium-sized businesses and retail customers in these communities and surrounding areas, as well as local governments, businesses, and educational institutions throughout Massachusetts, New Hampshire, Rhode Island, Connecticut and New York.
The Company’s results of operations are largely dependent on net interest income, which is the difference between the interest earned on loans and securities and interest paid on deposits and borrowings. The results of operations are also affected by the level of income and fees from loans, deposits, as well as operating expenses, the provision for loan losses, the impact of federal and state income taxes and the relative levels of interest rates and economic activity.
Page 30 of 44
Table of Contents
The Company offers a wide range of services to commercial enterprises, state and local governments and agencies, non-profit organizations and individuals. It emphasizes service to small and medium sized businesses and retail customers in its market area. In recent quarters, the Company has increased business to larger institutions, specifically, healthcare and higher education. The Company makes commercial loans, real estate and construction loans and consumer loans, and accepts savings, time, and demand deposits. In addition, the Company offers its corporate and institutional customers automated lock box collection services, cash management services and account reconciliation services, and actively promotes the marketing of these services to the municipal market. Also, the Company provides full service securities brokerage services through a program called Investment Services at Century Bank, which is supported by LPL Financial, a third party full-service securities brokerage business.
The Company has municipal cash management client engagements in Massachusetts, New Hampshire and Rhode Island comprising of approximately 250 government entities.
Net income for the six months ended June 30, 2017, was $14,253,000 or $2.56 per Class A share diluted, an increase of 23.4% compared to net income of $11,549,000, or $2.07 per Class A share diluted, for the same period a year ago. For the quarter ended June 30, 2017, net income totaled $8,157,000 or $1.47 per Class A share diluted, an increase of 30.7% compared to net income of $6,241,000, or $1.12 per Class A share diluted, for the same period a year ago.
Earnings per share (EPS) for each class of stock and time period is as follows:
| Three Months Ended June 30, |
||||||||
| 2017 | 2016 | |||||||
| Basic EPS – Class A common |
$ | 1.78 | $ | 1.36 | ||||
| Basic EPS – Class B common |
$ | 0.89 | $ | 0.68 | ||||
| Diluted EPS – Class A common |
$ | 1.47 | $ | 1.12 | ||||
| Diluted EPS – Class B common |
$ | 0.89 | $ | 0.68 | ||||
| Six Months Ended June 30, |
||||||||
| 2017 | 2016 | |||||||
| Basic EPS – Class A common |
$ | 3.11 | $ | 2.52 | ||||
| Basic EPS – Class B common |
$ | 1.55 | $ | 1.26 | ||||
| Diluted EPS – Class A common |
$ | 2.56 | $ | 2.07 | ||||
| Diluted EPS – Class B common |
$ | 1.55 | $ | 1.26 | ||||
Net interest income totaled $42,561,000 for the six months ended June 30, 2017 compared to $36,106,000 for the same period in 2016. The 17.9% increase in net interest income for the period is primarily due to an increase in average earning assets and an increase in the net interest margin. The net interest margin increased from 2.16% on a fully taxable equivalent basis in 2016 to 2.23% for the same period in 2017. This was primarily the result of an increase in rates on earning assets and prepayment penalties collected. The average balances of earning assets increased by 12.9% combined with a similar increase in average deposits. Also, interest expense increased 18.2% primarily as a result of an increase in rates and an increase in deposit balances.
The trends in the net interest margin are illustrated in the graph below:
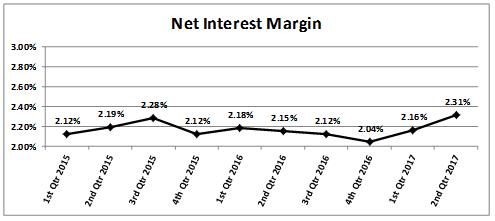
Page 31 of 44
Table of Contents
During the second and third quarter of 2015 the net interest margin increased primarily as a result of an increase in higher yielding assets as well as prepayment penalties collected. The increase in higher yielding assets was primarily the result of increased purchases of securities held-to-maturity. The margin decreased during the fourth quarter of 2015 primarily as a result of lower yielding loan originations. The margin increased during the first quarter of 2016 primarily as a result of an increase in rates on earning assets. The margin decreased during the second, third, and fourth quarters of 2016 primarily as a result of a decrease in rates on earning assets. The margin increased during the first and second quarters of 2017 primarily as a result of an increase in rates on earning assets. This increase was primarily the result of the yield on floating rate assets increasing as a result of recent increases in short term interest rates as well as an increase in prepayment penalties collected during the second quarter of 2017. Prepayment penalties collected amounted to $825,000 and contributed approximately seven basis points to the net interest margin for the second quarter. During the first and second quarters of 2017, the Company has not seen a corresponding increase in short term rates on interest bearing liabilities.
While management will continue its efforts to improve the net interest margin, there can be no assurance that certain factors beyond its control, such as the prepayment of loans and changes in market interest rates, will continue to positively impact the net interest margin.
The provision for loan losses increased by $90,000 from $800,000 for the six months ended June 30, 2016 to $890,000 for the same period in 2017, primarily as a result of an increase in loan growth offset, somewhat, by changes in historical loss factors. Refer to the allowance for loan loss section of the management discussion and analysis for additional discussion. Non-performing assets totaled $1,122,000 at June 30, 2017, compared to $1,084,000 at December 31, 2016.
For the first six months of 2017, the Company’s effective income tax rate was 4.7% compared to 0.7% for last year’s corresponding period. The effective income tax rate increased primarily as a result of an increase in taxable income.
During June 2016, the Company entered into a lease agreement to open a new branch located in Wellesley, Massachusetts. The Company closed its existing Wellesley branch and transferred the accounts to the new Wellesley branch which opened on December 19, 2016.
Recent Market Developments
Since June 2009, the U.S. economy has been recovering from the most severe recession and financial crisis since the Great Depression. There have been improvements in private sector employment, industrial production and U.S. exports. Even though the U.S. economy is in its eighth year of expansion, the consensus forecast is for expansion through at least 2018. Short and medium-term risks to the outlook include uncertainty in the United States over potential fiscal policy changes and uncertainty in Europe with respect to the United Kingdom’s decision to leave the European Union. Long-term risks to the U.S. economy include the slowdown in productivity growth, which may pose a risk to the U.S. standard of living.
On July 21, 2010, the Dodd-Frank Wall Street Reform and Consumer Protection Act (the “Act”) became law. The Act was intended to address many issues arising in the recent financial crisis and is exceedingly broad in scope, affecting many aspects of bank and financial market regulation. The Act requires, or permits by implementing regulation, enhanced prudential standards for banks and bank holding companies inclusive of capital, leverage, liquidity, concentration and exposure measures. In addition, traditional bank regulatory principles such as restrictions on transactions with affiliates and insiders were enhanced. The Act also contains reforms of consumer mortgage lending practices and creates a Bureau of Consumer Financial Protection, which is granted broad authority over consumer financial practices of banks and others. It is expected as the specific new or incremental requirements applicable to the Company become effective that the costs and difficulties of remaining compliant with all such requirements will increase. The Act broadened the base for FDIC assessments to average consolidated assets less tangible equity of financial institutions and also permanently raises the current standard maximum FDIC deposit insurance amount to $250,000. The Act extended unlimited deposit insurance on non-interest bearing transaction accounts through December 31, 2012.
In addition, the Act added a new Section 13 to the Bank Holding Company Act, the so-called “Volcker Rule,” (the “Rule”) which generally restricts certain banking entities such as the Company and its subsidiaries or affiliates, from engaging in proprietary trading activities and owning equity in or sponsoring any private equity or hedge fund. The Rule became effective July 21, 2012. The final implementing regulations for the Rule were issued by various regulatory agencies in December, 2013 and under an extended conformance regulation compliance was required to be achieved by July 21, 2015. The conformance period for investments in and relationships with certain “legacy covered funds” has been extended to July 21, 2017. Under the Rule, the Company may be restricted from engaging in proprietary trading, investing in third party hedge or private equity funds or sponsoring new funds unless it
Page 32 of 44
Table of Contents
qualifies for an exemption from the rule. The Company has little involvement in prohibited proprietary trading or investment activities in covered funds and the Company does not expect that complying with the requirements of the Rule will have any material effect on the Company’s financial condition or results of operation. The 2016 Presidential election and resulting change to a Republican Administration created the possibility that some of the “reforms” contained in the Act may be repealed or modified. New reforms under discussion include the prospect of some type of regulatory burden relief for small banks which in this context might include the Company. The extent and consequences of any such changes can’t be currently assessed but at the present time the Company does not think it is likely that changes that may be made will have any material effect on the Company’s financial condition and results of operations.
Federal banking regulators have issued risk-based capital guidelines, which assign risk factors to asset categories and off-balance-sheet items. Also, the Basel Committee has issued capital standards entitled “Basel III: A global regulatory framework for more resilient banks and banking systems” (“Basel III”). The Federal Reserve Board has finalized its rule implementing the Basel III regulatory capital framework. The rule that came into effect in January 2015 sets the Basel III minimum regulatory capital requirements for all organizations. It included a new common equity Tier I ratio of 4.5 percent of risk-weighted assets, raised the minimum Tier I capital ratio from 4 percent to 6 percent of risk-weighted assets and would set a new conservation buffer of 2.5 percent of risk-weighted assets. The implementation of the framework did not have a material impact on the Company’s financial condition or results of operations.
Financial Condition
Loans
On June 30, 2017, total loans outstanding were $2,033,799,000, up by $109,866,000 from the total on December 31, 2016. At June 30, 2017, commercial real estate loans accounted for 36.2%, commercial and industrial accounted for 31.9%, and residential real estate loans, including home equity loans, accounted for 24.3% of total loans.
Commercial real estate loans increased to $736,603,000 at June 30, 2017 from $696,173,000 at December 31, 2016, primarily as a result of new loan originations. Residential real estate loans increased to $264,744,000 at June 30, 2017 from $241,357,000 at December 31, 2016, primarily as a result of new loan originations. Home equity loans increased to $229,274,000 at June 30, 2017 from $211,857,000 at December 31, 2016, primarily as a result of a home equity loan promotion.
Commercial and industrial loans increased to $650,542,000 at June 30, 2017 from $612,503,000 at December 31, 2016, primarily as a result of an increase in larger loan originations to large institutions. Construction loans decreased to $14,159,000 at June 30, 2017 from $14,928,000 on December 31, 2016, primarily from payoffs of existing loans. Municipal loans decreased to $127,259,000 from $135,418,000, primarily as a result of payoffs of existing loans. In recent quarters, the Company has increased business to larger institutions, specifically, healthcare, higher education, and municipal organizations. Further discussion relating to changes in portfolio composition is discussed in the allowance for loan loss section of the management discussion and analysis.
Allowance for Loan Losses
The allowance for loan loss at June 30, 2017 was $25,289,000 as compared to $24,406,000 at December 31, 2016. The level of the allowance for loan losses to total loans was 1.24% at June 30, 2017 and 1.27% at December 31, 2016.
During 2015, the Company enhanced its approach to the development of the historical loss factors and qualitative factors used on certain loan portfolios. The methodology enhancement was in response to the changes in the risk characteristics of the Company’s new loan originations, as the Company has continued to increase its exposure to larger loan originations to large institutions with strong credit quality. The Company has limited internal loss history experience with these types of loans, and has determined a more appropriate representation of loss expectation is to utilize external historical loss factors based on public credit ratings, as there is a great deal of default and loss data available on these types of loans from the credit rating agencies. As of June 30, 2015, the Company incorporated this information into the development of the historical loss rates for these loan types. The combination of the enhancements made to the allowance methodology to address the changing risk profile of the Company’s new loan originations and the increase in these loans types as a percentage of the overall portfolio, has resulted in a decrease in the ratio of allowance for loan losses to total loans for 2016 and has continued into 2017. Also, during 2016 and the first six months of 2017, the Company’s weighted average risk rating has decreased. Additionally, the Company has continued to increase its lending for large loans to large institutions with publicly available credit ratings. The historical loss allocation for these types of loans is low. This has contributed to the continued decrease in the ratio of allowance for loan losses to total loans for 2017.
Page 33 of 44
Table of Contents
In addition, the Company monitors the outlook for the industries in which these institutions operate. Healthcare and higher education are the primary industries. The Company also monitors the volatility of the losses within the historical data.
By combining the credit rating, the industry outlook and the loss volatility, the Company arrives at the quantitative loss factor for each credit grade.
For a large loan to large institutions with publically available credit ratings the Company tracks these ratings. These ratings are tracked as a credit quality indicator for these loans. Credit ratings issued by national organizations were utilized as credit quality indicators as presented in the following table at June 30, 2017.
| Commercial and Industrial |
Municipal | Commercial Real Estate |
Total | |||||||||||||
| (in thousands) | ||||||||||||||||
| Credit Rating: |
||||||||||||||||
| Aaa – Aa3 |
$ | 341,777 | $ | 66,484 | $ | 45,615 | $ | 453,876 | ||||||||
| A1 – A3 |
218,222 | 8,225 | 128,927 | 355,374 | ||||||||||||
| Baa1 – Baa3 |
— | 46,970 | 125,775 | 172,745 | ||||||||||||
| Ba2 |
— | 2,730 | — | 2,730 | ||||||||||||
|
|
|
|
|
|
|
|
|
|||||||||
| Total |
$ | 559,999 | $ | 124,409 | $ | 300,317 | $ | 984,725 | ||||||||
|
|
|
|
|
|
|
|
|
|||||||||
Credit ratings issued by national organizations are presented in the following table at December 31, 2016.
| Commercial and Industrial |
Municipal | Commercial Real Estate |
Total | |||||||||||||
| (in thousands) | ||||||||||||||||
| Credit Rating: |
||||||||||||||||
| Aaa – Aa3 |
$ | 334,674 | $ | 66,245 | $ | 6,596 | $ | 407,515 | ||||||||
| A1 – A3 |
188,777 | 33,365 | 129,423 | 351,565 | ||||||||||||
| Baa1 – Baa3 |
— | 26,970 | 127,366 | 154,336 | ||||||||||||
| Ba2 |
— | 3,610 | — | 3,610 | ||||||||||||
|
|
|
|
|
|
|
|
|
|||||||||
| Total |
$ | 523,451 | $ | 130,190 | $ | 263,385 | $ | 917,026 | ||||||||
|
|
|
|
|
|
|
|
|
|||||||||
The allowance for loan losses is an estimate of the amount needed for an adequate reserve to absorb losses in the existing loan portfolio. This amount is determined by an evaluation of the loan portfolio, including input from an independent organization engaged to review selected larger loans, a review of loan experience and current economic conditions. Although the allowance is allocated between categories, the entire allowance is available to absorb losses attributable to all loan categories.
Page 34 of 44
Table of Contents
The following table summarizes the changes in the Company’s allowance for loan losses for the periods indicated.
| Three months ended June 30, |
Six months ended June 30, |
|||||||||||||||
| 2017 | 2016 | 2017 | 2016 | |||||||||||||
| (in thousands) | ||||||||||||||||
| Allowance for loan losses, beginning of period |
$ | 24,827 | $ | 23,544 | $ | 24,406 | $ | 23,075 | ||||||||
| Adjustment |
— | (84 | ) | — | (84 | ) | ||||||||||
| Loans charged off |
(100 | ) | (111 | ) | (197 | ) | (180 | ) | ||||||||
| Recoveries on loans previously charged-off |
72 | 164 | 190 | 252 | ||||||||||||
|
|
|
|
|
|
|
|
|
|||||||||
| Net (charge-offs) recoveries |
(28 | ) | 53 | (7 | ) | 72 | ||||||||||
| Provision charged to expense |
490 | 350 | 890 | 800 | ||||||||||||
|
|
|
|
|
|
|
|
|
|||||||||
| Allowance for loan losses, end of period |
$ | 25,289 | $ | 23,863 | $ | 25,289 | $ | 23,863 | ||||||||
|
|
|
|
|
|
|
|
|
|||||||||
The Company may experience increased levels of nonaccrual loans if borrowers are negatively impacted by future negative economic conditions. Management continually monitors trends in the loan portfolio to determine the appropriate level of allowance for loan losses. At the current time, management believes that the allowance for loan losses is adequate.
Nonperforming Assets
The following table sets forth information regarding nonperforming assets held by the Bank at the dates indicated:
| June 30 2017 |
December 31, 2016 |
|||||||
| (dollars in thousands) | ||||||||
| Nonaccruing loans |
$ | 1,122 | $ | 1,084 | ||||
| Total nonperforming assets |
$ | 1,122 | $ | 1,084 | ||||
| Loans past due 90 days or more and still accruing |
$ | — | $ | — | ||||
| Nonaccruing loans as a percentage of total loans |
0.06 | % | 0.06 | % | ||||
| Nonperforming assets as a percentage of total assets |
0.02 | % | 0.02 | % | ||||
| Accruing troubled debt restructures |
$ | 2,872 | $ | 3,526 | ||||
Cash and Cash Equivalents
Cash and cash equivalents decreased from $236,151,000 to $228,161,000 during the first six months of 2017. This decrease was primarily attributable to increased loan originations.
Short-term Investments
Short-term investments decreased by $3,183,000, primarily as a result of maturities during the first six months of 2017.
Investments
Management continually evaluates its investment alternatives in order to properly manage the overall balance sheet mix. The timing of purchases, sales and reinvestments, if any, will be based on various factors including expectation of movements in market interest rates, deposit flows and loan demand. Notwithstanding these events, it is the intent of management to grow the earning asset base mainly through loan originations while funding this growth through a mix of retail deposits, FHLB advances, and retail repurchase agreements.
Securities Available-for-Sale (at Fair Value)
The securities available-for-sale portfolio totaled $411,340,000 at June 30, 2017, a decrease of 17.6% from December 31, 2016. The portfolio decreased mainly as a result of calls and maturities of securities available-for-sale totaling $166,976,000 for the six months ended June 30, 2017. The calls and maturities were offset by purchases of $71,793,000. The portfolio is concentrated in United States Government Sponsored Enterprises, Mortgage-backed Securities and Obligations issued by States and Political Subdivisions and had an estimated weighted average remaining life of 5.4 years.
Page 35 of 44
Table of Contents
At June 30, 2017, 76.1% of the Company’s securities available-for-sale are classified as Level 2. The fair values of these securities are generally obtained from a pricing service, which provides the Company with a description of the inputs generally utilized for each type of security. These inputs include benchmark yields, reported trades, broker/dealer quotes, issuer spreads, two-sided markets, benchmark securities, bids, offers and reference data. Market indicators and industry and economic events are also monitored.
Securities available-for-sale totaling $98,049,000 or 23.8% of securities available-for-sale are classified as Level 3. These securities are generally municipal securities with no observable fair value. The securities are carried at cost which approximates fair value. A periodic review of underlying financial statements and credit ratings is performed to assess the appropriateness of these valuations.
During the first six months of 2017, net unrealized losses on the securities available-for-sale decreased to $369,000 from a net unrealized loss of $923,000 at December 31, 2016. The following table sets forth the fair value of securities available-for-sale at the dates indicated.
| June 30, 2017 |
December 31, 2016 |
|||||||
| (in thousands) | ||||||||
| U.S. Treasury |
$ | 1,995 | $ | 2,000 | ||||
| U.S. Government Sponsored Enterprises |
10,000 | 24,952 | ||||||
| Small Business Administration |
71,189 | 57,767 | ||||||
| U.S Government Agency and Sponsored Enterprise Mortgage-backed Securities |
223,782 | 243,325 | ||||||
| Privately Issued Residential Mortgage-backed Securities |
1,015 | 1,109 | ||||||
| Obligations issued by States and Political Subdivisions |
98,049 | 164,876 | ||||||
| Other Debt Securities |
4,992 | 4,924 | ||||||
| Equity Securities |
318 | 344 | ||||||
|
|
|
|
|
|||||
| Total Securities Available–for-Sale |
$ | 411,340 | $ | 499,297 | ||||
|
|
|
|
|
|||||
There were no sales of investments during the first six months of 2017.
Securities Held-to-Maturity (at Amortized Cost)
The securities held-to-maturity portfolio totaled $1,722,875,000 on June 30, 2017, an increase of 4.2% from December 31, 2016. Purchases of securities held-to-maturity totaled $220,832,000 for the six months ended June 30, 2017. The purchases were offset, somewhat, by calls and maturities of $153,405,000. The portfolio is concentrated in United States Government Sponsored Enterprises and Mortgage-backed Securities and had an estimated weighted average remaining life of 4.4 years. The following table sets forth the fair value of securities held-to-maturity at the dates indicated.
| June 30, 2017 |
December 31, 2016 |
|||||||
| (in thousands) | ||||||||
| U.S. Government Sponsored Enterprises |
$ | 134,378 | $ | 148,326 | ||||
| SBA Backed Securities |
54,427 | 46,140 | ||||||
| U.S. Government Agency and Sponsored Enterprise Mortgage-backed Securities |
1,534,070 | 1,459,520 | ||||||
|
|
|
|
|
|||||
| Total Securities Held-to-Maturity |
$ | 1,722,875 | $ | 1,653,986 | ||||
|
|
|
|
|
|||||
At June 30, 2017 and December 31, 2016, all mortgage-backed securities are obligations of U.S. Government Sponsored Enterprises. There were no sales of investments for the three months ending June 30, 2017.
Debt securities of Government Sponsored Enterprises primarily refer to debt securities of Fannie Mae and Freddie Mac.
Page 36 of 44
Table of Contents
Federal Home Loan Bank of Boston Stock
The Bank, as a member of the Federal Home Loan Bank of Boston (“FHLBB”), is required to maintain an investment in capital stock of the FHLBB. Based on redemption provisions, the stock has no quoted market value and is carried at cost. At its discretion, the FHLBB may declare dividends on the stock. The Company reviews for impairment based on the ultimate recoverability of the cost basis in the stock. During the first six months of 2017, the FHLBB redeemed $714,000 of FHLBB stock and the Company purchased $5,260,000 of FHLBB stock. As of June 30, 2017, no impairment has been recognized.
Deposits and Borrowed Funds
On June 30, 2017, deposits totaled $3,569,197,000, representing a 2.3% decrease from December 31, 2016. Total deposits decreased primarily as a result of decreases in money market accounts. Money market deposits decreased mainly as a result of decreased corporate account balances. Savings and NOW deposits increased, mainly as a result of corporate, personal, and municipal deposits, as the Company continued to offer competitive rates for these types of deposits during the first six months of the year. Time deposits increased primarily as a result of increased personal, corporate, and municipal time deposits as the Company has offered competitive rates for these types of deposits.
Borrowed funds totaled $622,840,000 at June 30, 2017 compared to $475,280,000 at December 31, 2016. Borrowed funds increased mainly as a result of an increase in short-term FHLBB borrowings, offset, somewhat, by a decrease in securities sold under agreements to repurchase. Securities sold under agreements to repurchase decreased, primarily as a result of decreases in corporate accounts.
Stockholders’ Equity
At June 30, 2017, total equity was $254,625,000 compared to $240,041,000 million at December 31, 2016. The Company’s equity increased primarily as a result of earnings and a decrease in other comprehensive loss, net of taxes, offset somewhat by dividends paid. Other comprehensive loss, net of taxes, decreased as a result of a decrease in unrealized losses on securities available-for-sale, unrealized losses on securities transferred from available-for-sale to held-to-maturity and amortization of the pension liability. The Company’s leverage ratio stood at 6.31% at June 30, 2017, compared to 6.28% at December 31, 2016. The increase in the leverage ratio was due to an increase in stockholders’ equity, offset somewhat by an increase in quarterly average assets. Book value as of June 30, 2017 was $45.73 per share compared to $43.11 at December 31, 2016.
Page 37 of 44
Table of Contents
Results of Operations
The following table sets forth the distribution of the Company’s average assets, liabilities and stockholders’ equity, and average rates earned or paid on a fully taxable equivalent basis for each of the three-month periods indicated.
| Three Months Ended | ||||||||||||||||||||||||
| June 30, 2017 | June 30, 2016 | |||||||||||||||||||||||
| Average Balance |
Interest Income/ Expenses (1) |
Rate Earned/ Paid (1) |
Average Balance |
Interest Income/ Expenses (1) |
Rate Earned/ Paid (1) |
|||||||||||||||||||
| (dollars in thousands) | ||||||||||||||||||||||||
| ASSETS |
||||||||||||||||||||||||
| Interest-earning assets: |
||||||||||||||||||||||||
| Loans (2) |
||||||||||||||||||||||||
| Loans taxable |
$ | 970,317 | $ | 9,742 | 4.03 | % | $ | 840,670 | $ | 8,321 | 3.98 | % | ||||||||||||
| Loans tax-exempt |
1,081,163 | 10,529 | 3.91 | % | 952,325 | 8,963 | 3.79 | % | ||||||||||||||||
| Securities available-for-sale (5): |
||||||||||||||||||||||||
| Taxable |
366,995 | 1,411 | 1.54 | % | 329,645 | 918 | 1.11 | % | ||||||||||||||||
| Tax-exempt |
124,060 | 442 | 1.43 | % | 142,691 | 315 | 0.88 | % | ||||||||||||||||
| Securities held-to-maturity: |
||||||||||||||||||||||||
| Taxable |
1,771,395 | 9,824 | 2.22 | % | 1,519,615 | 8,128 | 2.14 | % | ||||||||||||||||
| Interest-bearing deposits in other banks |
137,052 | 349 | 1.02 | % | 238,076 | 308 | 0.52 | % | ||||||||||||||||
|
|
|
|
|
|
|
|
|
|
|
|
|
|||||||||||||
| Total interest-earning assets |
4,450,982 | 32,297 | 2.91 | % | 4,023,022 | 26,953 | 2.69 | % | ||||||||||||||||
| Non interest-earning assets |
220,892 | 208,568 | ||||||||||||||||||||||
| Allowance for loan losses |
(25,115 | ) | (23,764 | ) | ||||||||||||||||||||
|
|
|
|
|
|||||||||||||||||||||
| Total assets |
$ | 4,646,759 | $ | 4,207,826 | ||||||||||||||||||||
|
|
|
|
|
|||||||||||||||||||||
| LIABILITIES AND STOCKHOLDERS’ EQUITY |
||||||||||||||||||||||||
| Interest-bearing deposits: |
||||||||||||||||||||||||
| NOW accounts |
$ | 1,024,625 | $ | 881 | 0.34 | % | $ | 892,631 | $ | 526 | 0.24 | % | ||||||||||||
| Savings accounts |
509,746 | 619 | 0.49 | % | 405,976 | 412 | 0.41 | % | ||||||||||||||||
| Money market accounts |
1,064,211 | 1,234 | 0.47 | % | 990,215 | 781 | 0.32 | % | ||||||||||||||||
| Time deposits |
555,923 | 1,902 | 1.37 | % | 449,372 | 1,394 | 1.25 | % | ||||||||||||||||
|
|
|
|
|
|
|
|
|
|
|
|
|
|||||||||||||
| Total interest-bearing deposits |
3,154,505 | 4,636 | 0.59 | % | 2,738,194 | 3,113 | 0.46 | % | ||||||||||||||||
| Securities sold under agreements to repurchase |
196,354 | 120 | 0.25 | % | 233,197 | 126 | 0.22 | % | ||||||||||||||||
| Other borrowed funds and subordinated debentures |
320,358 | 1,945 | 2.44 | % | 365,259 | 2,247 | 2.47 | % | ||||||||||||||||
|
|
|
|
|
|
|
|
|
|
|
|
|
|||||||||||||
| Total interest-bearing liabilities |
3,671,217 | 6,701 | 0.73 | % | 3,336,650 | 5,486 | 0.66 | % | ||||||||||||||||
|
|
|
|
|
|
|
|
|
|||||||||||||||||
| Non-interest-bearing liabilities |
||||||||||||||||||||||||
| Demand deposits |
664,602 | 589,491 | ||||||||||||||||||||||
| Other liabilities |
60,339 | 57,994 | ||||||||||||||||||||||
|
|
|
|
|
|||||||||||||||||||||
| Total liabilities |
4,396,158 | 3,984,135 | ||||||||||||||||||||||
|
|
|
|
|
|||||||||||||||||||||
| Stockholders’ equity |
250,601 | 223,691 | ||||||||||||||||||||||
| Total liabilities & stockholders’ equity |
$ | 4,646,759 | $ | 4,207,826 | ||||||||||||||||||||
|
|
|
|
|
|||||||||||||||||||||
| Net interest income on a fully taxable equivalent basis |
25,596 | 21,467 | ||||||||||||||||||||||
| Less taxable equivalent adjustment |
(3,491 | ) | (3,211 | ) | ||||||||||||||||||||
|
|
|
|
|
|||||||||||||||||||||
| Net interest income |
$ | 22,105 | $ | 18,256 | ||||||||||||||||||||
|
|
|
|
|
|
|
|
|
|||||||||||||||||
| Net interest spread (3) |
2.18 | % | 2.03 | % | ||||||||||||||||||||
|
|
|
|
|
|||||||||||||||||||||
| Net interest margin (4) |
2.31 | % | 2.15 | % | ||||||||||||||||||||
|
|
|
|
|
|||||||||||||||||||||
| (1) | On a fully taxable equivalent basis calculated using a federal tax rate of 34%. |
| (2) | Nonaccrual loans are included in average amounts outstanding. |
| (3) | Interest rate spread represents the difference between the weighted average yield on interest-earning assets and the weighted average cost of interest-bearing liabilities. |
| (4) | Net interest margin represents net interest income as a percentage of average interest-earning assets. |
| (5) | Average balances of securities available-for-sale calculated utilizing amortized cost. |
Page 38 of 44
Table of Contents
The following table sets forth the distribution of the Company’s average assets, liabilities and stockholders’ equity, and average rates earned or paid on a fully taxable equivalent basis for each of the six-month periods indicated.
| Six Months Ended | ||||||||||||||||||||||||
| June 30, 2017 | June 30, 2016 | |||||||||||||||||||||||
| Average Balance |
Interest Income/ Expenses (1) |
Rate Earned/ Paid (1) |
Average Balance |
Interest Income/ Expenses (1) |
Rate Earned/ Paid (1) |
|||||||||||||||||||
| (dollars in thousands) | ||||||||||||||||||||||||
| ASSETS |
||||||||||||||||||||||||
| Interest-earning assets: |
||||||||||||||||||||||||
| Loans (2) |
||||||||||||||||||||||||
| Loans taxable |
$ | 952,817 | $ | 18,775 | 3.97 | % | $ | 848,656 | $ | 16,712 | 3.96 | % | ||||||||||||
| Loans tax-exempt |
1,065,457 | 19,794 | 3.75 | % | 941,296 | 17,843 | 3.81 | % | ||||||||||||||||
| Securities available-for-sale (5): |
||||||||||||||||||||||||
| Taxable |
374,463 | 2,676 | 1.43 | % | 306,370 | 1,693 | 1.11 | % | ||||||||||||||||
| Tax-exempt |
137,690 | 926 | 1.35 | % | 137,039 | 581 | 0.85 | % | ||||||||||||||||
| Securities held-to-maturity: |
||||||||||||||||||||||||
| Taxable |
1,761,470 | 19,359 | 2.20 | % | 1,477,252 | 15,940 | 2.16 | % | ||||||||||||||||
| Interest-bearing deposits in other banks |
170,604 | 742 | 0.87 | % | 242,004 | 623 | 0.51 | % | ||||||||||||||||
|
|
|
|
|
|
|
|
|
|
|
|
|
|||||||||||||
| Total interest-earning assets |
4,462,501 | 62,272 | 2.80 | % | 3,952,617 | 53,392 | 2.71 | % | ||||||||||||||||
| Non interest-earning assets |
220,643 | 206,058 | ||||||||||||||||||||||
| Allowance for loan losses |
(24,849 | ) | (23,523 | ) | ||||||||||||||||||||
|
|
|
|
|
|||||||||||||||||||||
| Total assets |
$ | 4,658,295 | $ | 4,135,152 | ||||||||||||||||||||
|
|
|
|
|
|||||||||||||||||||||
| LIABILITIES AND STOCKHOLDERS’ EQUITY |
||||||||||||||||||||||||
| Interest-bearing deposits: |
||||||||||||||||||||||||
| NOW accounts |
$ | 995,569 | $ | 1,581 | 0.32 | % | $ | 863,073 | $ | 1,013 | 0.24 | % | ||||||||||||
| Savings accounts |
498,490 | 1,146 | 0.46 | % | 395,158 | 763 | 0.39 | % | ||||||||||||||||
| Money market accounts |
1,140,029 | 2,508 | 0.44 | % | 983,562 | 1,576 | 0.32 | % | ||||||||||||||||
| Time deposits |
529,040 | 3,553 | 1.35 | % | 448,890 | 2,752 | 1.23 | % | ||||||||||||||||
|
|
|
|
|
|
|
|
|
|
|
|
|
|||||||||||||
| Total interest-bearing deposits |
3,163,128 | 8,788 | 0.56 | % | 2,690,683 | 6,104 | 0.46 | % | ||||||||||||||||
| Securities sold under agreements to repurchase |
198,394 | 223 | 0.23 | % | 227,888 | 241 | 0.21 | % | ||||||||||||||||
| Other borrowed funds and subordinated debentures |
320,047 | 3,873 | 2.44 | % | 365,814 | 4,554 | 2.50 | % | ||||||||||||||||
|
|
|
|
|
|
|
|
|
|
|
|
|
|||||||||||||
| Total interest-bearing liabilities |
3,681,569 | 12,884 | 0.71 | % | 3,284,385 | 10,899 | 0.67 | % | ||||||||||||||||
|
|
|
|
|
|
|
|
|
|||||||||||||||||
| Non-interest-bearing liabilities |
||||||||||||||||||||||||
| Demand deposits |
670,241 | 573,303 | ||||||||||||||||||||||
| Other liabilities |
59,505 | 56,817 | ||||||||||||||||||||||
|
|
|
|
|
|||||||||||||||||||||
| Total liabilities |
4,411,315 | 3,914,505 | ||||||||||||||||||||||
|
|
|
|
|
|||||||||||||||||||||
| Stockholders’ equity |
246,980 | 220,647 | ||||||||||||||||||||||
| Total liabilities & stockholders’ equity |
$ | 4,658,295 | $ | 4,135,152 | ||||||||||||||||||||
|
|
|
|
|
|||||||||||||||||||||
| Net interest income on a fully taxable equivalent basis |
49,388 | 42,493 | ||||||||||||||||||||||
| Less taxable equivalent adjustment |
(6,827 | ) | (6,387 | ) | ||||||||||||||||||||
|
|
|
|
|
|||||||||||||||||||||
| Net interest income |
$ | 42,561 | $ | 36,106 | ||||||||||||||||||||
|
|
|
|
|
|
|
|
|
|||||||||||||||||
| Net interest spread (3) |
2.09 | % | 2.04 | % | ||||||||||||||||||||
|
|
|
|
|
|||||||||||||||||||||
| Net interest margin (4) |
2.23 | % | 2.16 | % | ||||||||||||||||||||
|
|
|
|
|
|||||||||||||||||||||
| (1) | On a fully taxable equivalent basis calculated using a federal tax rate of 34%. |
| (2) | Nonaccrual loans are included in average amounts outstanding. |
| (3) | Interest rate spread represents the difference between the weighted average yield on interest-earning assets and the weighted average cost of interest-bearing liabilities. |
| (4) | Net interest margin represents net interest income as a percentage of average interest-earning assets. |
| (5) | Average balances of securities available-for-sale calculated utilizing amortized cost. |
Page 39 of 44
Table of Contents
The following table presents certain information on a fully-tax equivalent basis regarding changes in the Company’s interest income and interest expense for the periods indicated. For each category of interest-earning assets and interest-bearing liabilities, information is provided with respect to changes attributable to changes in rate and changes in volume.
| Three Months Ended June 30, 2017 Compared with Three Months Ended June 30, 2016 |
Six Months Ended June 30, 2017 Compared with Six Months Ended June 30, 2016 |
|||||||||||||||||||||||
| Increase/(Decrease) Due to Change in |
Increase/(Decrease) Due to Change in |
|||||||||||||||||||||||
| Volume | Rate | Total | Volume | Rate | Total | |||||||||||||||||||
| (in thousands) | ||||||||||||||||||||||||
| Interest income: |
||||||||||||||||||||||||
| Loans |
||||||||||||||||||||||||
| Taxable |
$ | 1,322 | $ | 99 | $ | 1,421 | $ | 2,007 | $ | 56 | $ | 2,063 | ||||||||||||
| Tax-exempt |
1,267 | 299 | 1,566 | 2,268 | (317 | ) | 1,951 | |||||||||||||||||
| Securities available-for-sale |
||||||||||||||||||||||||
| Taxable |
113 | 380 | 493 | 424 | 559 | 983 | ||||||||||||||||||
| Tax-exempt |
(46 | ) | 173 | 127 | 3 | 342 | 345 | |||||||||||||||||
| Securities held-to-maturity |
||||||||||||||||||||||||
| Taxable |
1,387 | 309 | 1,696 | 3,119 | 300 | 3,419 | ||||||||||||||||||
| Interest-bearing deposits in other banks |
(169 | ) | 210 | 41 | (222 | ) | 341 | 119 | ||||||||||||||||
|
|
|
|
|
|
|
|
|
|
|
|
|
|||||||||||||
| Total interest income |
3,874 | 1,470 | 5,344 | $ | 7,599 | $ | 1,281 | $ | 8,880 | |||||||||||||||
|
|
|
|
|
|
|
|
|
|
|
|
|
|||||||||||||
| Interest expense: |
||||||||||||||||||||||||
| Deposits |
||||||||||||||||||||||||
| NOW accounts |
87 | 268 | 355 | 171 | 397 | 568 | ||||||||||||||||||
| Savings accounts |
118 | 89 | 207 | 220 | 163 | 383 | ||||||||||||||||||
| Money market accounts |
63 | 390 | 453 | 276 | 656 | 932 | ||||||||||||||||||
| Time deposits |
357 | 151 | 508 | 516 | 285 | 801 | ||||||||||||||||||
|
|
|
|
|
|
|
|
|
|
|
|
|
|||||||||||||
| Total interest-bearing deposits |
625 | 898 | 1,523 | 1,183 | 1,501 | 2,684 | ||||||||||||||||||
| Securities sold under agreements to repurchase |
(21 | ) | 15 | (6 | ) | (33 | ) | 15 | (18 | ) | ||||||||||||||
| Other borrowed funds and subordinated debentures |
(268 | ) | (34 | ) | (302 | ) | (567 | ) | (114 | ) | (681 | ) | ||||||||||||
|
|
|
|
|
|
|
|
|
|
|
|
|
|||||||||||||
| Total interest expense |
336 | 879 | 1,215 | 583 | 1,402 | 1,985 | ||||||||||||||||||
|
|
|
|
|
|
|
|
|
|
|
|
|
|||||||||||||
| Change in net interest income |
$ | 3,538 | $ | 591 | $ | 4,129 | $ | 7,016 | $ | (121 | ) | $ | 6,895 | |||||||||||
|
|
|
|
|
|
|
|
|
|
|
|
|
|||||||||||||
Net Interest Income
For the three months ended June 30, 2017, net interest income on a fully taxable equivalent basis totaled $25,596,000 compared to $21,467,000 for the same period in 2016, an increase of $4,129,000 or 19.2%. This increase in net interest income for the period is primarily due to an increase in average interest earning assets combined with a sixteen basis point increase in the net interest margin. The average balance of earning assets increased by 10.6% combined with a similar increase in average deposits. The net interest margin increased from 2.15% on a fully taxable equivalent basis in 2016 to 2.31% on the same basis for 2017. This was primarily the result of an increase in rates on earning assets. Prepayment penalties collected increased from $4,000 for the three months ended June 30, 2016 compared to $825,000 for the same period in 2017. This increase contributed approximately seven basis points to the increase in the net interest margin. Also, interest income on a fully taxable equivalent basis increased 19.8%, mainly as a result of an increase in interest earning assets. Interest expense increased 22.1% mainly as a result of an increase in deposit balances.
Page 40 of 44
Table of Contents
For the six months ended June 30, 2017, net interest income on a fully taxable equivalent basis totaled $49,388,000 compared to $42,493,000 for the same period in 2016, an increase of $6,895,000 or 16.2%. This increase in net interest income for the period is primarily due to an increase in average interest earning assets combined with a seven basis point increase in the net interest margin. The average balance of earning assets increased by 10.6% combined with a similar increase in average deposits. The net interest margin increased from 2.16% on a fully taxable equivalent basis in 2016 to 2.23% on the same basis for 2017. This was primarily the result of an increase in rates on earning assets. Prepayment penalties collected increased from $31,000 for the six months ended June 30, 2016 compared to $857,000 for the same period in 2017. This increase contributed approximately four basis points to the increase in the net interest margin. Also, interest income on a fully taxable equivalent basis increased 19.8%, mainly as a result of an increase in interest earning assets. Interest expense increased 22.1% mainly as a result of an increase in deposit balances.
As illustrated in the table above, the main contributors to the increase in net interest income were from securities held-to-maturity, loans and securities available-for-sale. Securities held-to-maturity income increased primarily as a result of an increase in volume. Loans income increased primarily from an increase in volume, this was partially offset by decrease rates on loans from new loan originations. Securities available-for-sale income increased from both an increase in volume and an increase in rates paid on the portfolio. The Company has a sizable floating rate available-for-sale portfolio. These securities reprice as interest rates rise. The increase in net interest income was partially offset by an increase in interest expense. This was mainly the result of increased rates paid on money market, saving and NOW accounts. The Company has modestly raised interest rates on these products to remain competitive.
Provision for Loan Losses
For the three months ended June 30, 2017, the loan loss provision was $490,000 compared to a provision of $350,000 for the same period last year. For the six months ended June 30, 2017, the loan loss provision was $890,000 compared to a provision of $800,000 for the same period last year. The increase in the provision, for both time periods presented, was primarily as a result of an increase in loan growth offset, somewhat, by changes in historical loss factors. Further discussion relating to changes in portfolio composition is discussed in footnote number four.
Non-Interest Income and Expense
Other operating income for the quarter ended June 30, 2017 decreased by $352,000 from the same period last year to $4,291,000. This was mainly attributable to a decrease in gains on sales of mortgage loans of $529,000, a decrease of $45,000 in net gains on sales of investments, and a decrease of $22,000 in lock box income. This was partially offset by an increase of $132,000 in other income and a $112,000 increase in service charges on deposit accounts. Other income increased primarily as a result of an increase in wealth management fees, merchant and charge card fees, and other customer fees. Also, service charges on deposit accounts increased primarily as a result of an increase in customer activity. Lockbox income decreased mainly as a result of decreased customer activity.
Other operating income for the six months ended June 30, 2017 decreased by $97,000 from the same period last year to $8,200,000. This was mainly attributable to a decrease in gains on sales of mortgage loans of $428,000, a decrease of $45,000 in net gains on sales of investments, and a decrease of $40,000 in lock box income. This was partially offset by an increase of $225,000 in other income and a $191,000 increase in service charges on deposit accounts. Other income increased primarily as a result of an increase in wealth management fees, merchant and charge card fees, and other customer fees. Also, service charges on deposit accounts increased primarily as a result of an increase in customer activity. Lockbox income decreased mainly as a result of decreased customer activity.
For the quarter ended June 30, 2017, operating expenses increased by $909,000 or 5.6% to $17,197,000, from the same period last year. The increase in operating expenses for the quarter was mainly attributable to an increase of $679,000 in salaries and employee benefits, $360,000 in other expenses, and $78,000 in equipment expenses. This was partially offset by a decrease in FDIC assessments of $152,000 and a decrease of $56,000 in occupancy expenses. Salaries and employee benefits increased mainly as a result of merit increases and increased bonus accruals. Equipment expenses increased primarily as a result of an increase in service contracts. Other expenses increased primarily as a result of an increase in marketing expenses and increased contributions. FDIC assessments decreased primarily as a result of a decrease in the assessment rate. Occupancy costs decreased primarily as a result of decreased rent expense associated with a reduction in rent for one branch.
Page 41 of 44
Table of Contents
For the six months ended June 30, 2017, operating expenses increased by $2,952,000 or 9.2% to $34,922,000, from the same period last year. The increase in operating expenses for the six months was mainly attributable to an increase of $2,046,000 in salaries and employee benefits, $934,000 in other expenses, $148,000 in equipment expenses, and $106,000 in occupancy expenses. This was partially offset by a decrease in FDIC assessments of $282,000. Salaries and employee benefits increased mainly as a result of merit increases and increased bonus accruals. Occupancy cost increased primarily as a result of amortization of leasehold improvements and increased building maintenance costs associated with snow removal. Equipment expenses increased primarily as a result of an increase in service contracts. Other expenses increased primarily as a result of an increase in marketing expenses and increased contributions. FDIC assessments decreased primarily as a result of a decrease in the assessment rate.
Income Taxes
For the second quarter of 2017, the Company’s income tax expense totaled $552,000 on pretax income of $8,709,000 resulting in an effective tax rate of 6.3%. For last year’s corresponding quarter, the Company’s income tax expense totaled $20,000 on pretax income of $6,261,000 resulting in an effective tax rate of 0.3%. The increase in the effective income tax rate was primarily the result of an increase in taxable income.
For the six months ended June 30, 2017, the Company’s income tax expense totaled $696,000 on pretax income of $14,949,000 resulting in an effective tax rate of 4.7%. For last year’s corresponding period, the Company’s income tax expense totaled $84,000 on pretax income of $11,633,000 resulting in an effective tax rate of 0.7%. The increase in the effective income tax rate was primarily the result of an increase in taxable income.
| Item 3. | Quantitative and Qualitative Disclosure about Market Risk |
Market risk is the risk of loss from adverse changes in market prices and rates. The Company’s market risk arises primarily from interest rate risk inherent in its lending and deposit taking activities. To that end, management actively monitors and manages its interest rate risk exposure. The Company’s profitability is affected by fluctuations in interest rates. A sudden and substantial increase or decrease in interest rates may adversely impact the Company’s earnings to the extent that the interest rates tied to specific assets and liabilities do not change at the same speed, to the same extent, or on the same basis. The Company monitors the impact of changes in interest rates on its net interest income using several tools. The Company’s primary objective in managing interest rate risk is to minimize the adverse impact of changes in interest rates on the Company’s net interest income and capital, while structuring the Company’s asset-liability structure to obtain the maximum yield-cost spread on that structure. Management believes that there has been no material changes in the interest rate risk reported in the Company’s Annual Report on Form 10-K for the fiscal year ended December 31, 2016, filed with the Securities and Exchange Commission. The information is contained in the Form 10-K within the Market Risk and Asset Liability Management section of Management’s Discussion and Analysis of Results of Operations and Financial Condition.
| Item 4. | Controls and Procedures |
The Company’s management, with participation of the Company’s principal executive and financial officers, has evaluated its disclosure controls and procedures as of the end of the period covered by this quarterly report. Based on this evaluation, the Company’s management, with participation of its principal executive and financial officers, has concluded that the Company’s disclosure controls and procedures are effective. The disclosure controls and procedures also effectively ensure that information required to be disclosed in the Company’s filings and submissions with the Securities and Exchange Commission under the Exchange Act is accumulated and reported to Company management (including the principal executive officer and the principal financial officer) as appropriate to allow timely decisions regarding required disclosure and is recorded, processed, summarized and reported within the time periods specified by the Securities and Exchange Commission. In addition, the Company has evaluated its internal control over financial reporting and during the second quarter of 2017 there were no changes that have materially affected, or are reasonably likely to materially affect, the Company’s internal control over financial reporting.
Page 42 of 44
Table of Contents
| Item 2 | Unregistered Sales of Equity Securities and Use of Proceeds – |
(a) — (b) Not applicable.
(c) None
| Item 3 | Defaults Upon Senior Securities – None |
| Item 4 | Mine Safety Disclosures – Not applicable |
| Item 5 | Other Information – None |
| Item 6 | Exhibits |
| 31.1 |
Certification of President and Chief Executive Officer of the Company Pursuant to Securities Exchange Act Rules 13a-14 and 15d-14. | |
| 31.2 |
Certification of Chief Financial Officer of the Company Pursuant to Securities Exchange Act Rules 13a-14 and 15d-14. | |
| + 32.1 |
Certification of President and Chief Executive Officer Pursuant to 18 U.S.C. Section 1350, as Adopted Pursuant to Section 906 of the Sarbanes-Oxley Act of 2002. | |
| + 32.2 |
Certification of Chief Financial Officer Pursuant to 18 U.S.C. Section 1350, as Adopted Pursuant to Section 906 of the Sarbanes-Oxley Act of 2002. | |
| + + 101. |
INS XBRL Instance Document | |
| + + 101. |
SCH XBRL Taxonomy Extension Schema | |
| + + 101. |
CAL XBRL Taxonomy Extension Calculation Linkbase | |
| + + 101. |
LAB XBRL Taxonomy Extension Label Linkbase | |
| + + 101. |
PRE XBRL Taxonomy Extension Presentation Linkbase | |
| + + 101. |
DEF XBRL Taxonomy Definition Linkbase | |
| + | This exhibit shall not be deemed “filed” for purposes of Section 18 of the Securities Exchange Act of 1934, or otherwise subject to the liability of that section, and shall not be deemed to be incorporated by reference into any filing under the Securities Act of 1933 or the Securities Exchange Act of 1934. |
| ++ | As provided in Rule 406T of regulation S-T, this information is filed for purposes of Sections 11 and 12 of the Securities Act of 1933 and Section 18 of the Securities Exchange Act of 1934 and consists of the following materials from Century Bancorp Inc.’s Quarterly Report on 10-Q for the quarter ended June 30, 2017, formatted in XBRL: (i) Consolidated Balance Sheets at June 30, 2017 and December 31, 2016; (ii) Consolidated Statements of Income for the six months ended June 30, 2017 and 2016; (iii) Consolidated Statements of Comprehensive Income for the six months ended June 30, 2017 and 2016; (iv) Consolidated Statements of Changes in Stockholders’ Equity for the six months ended June 30, 2017 and 2016; (v) Consolidated Statements of Cash Flows for the six months ended June 30, 2017 and 2016; and (vi) Notes to Unaudited Consolidated Interim Financial Statements. |
Page 43 of 44
Table of Contents
Pursuant to the requirements of the Securities Exchange Act of 1934, the registrant has duly caused this report to be signed on its behalf by the undersigned thereunto duly authorized.
| Date: | August 8, 2017 | Century Bancorp, Inc. | ||||||
| /s/ Barry R. Sloane | ||||||||
| Barry R. Sloane | ||||||||
| President and Chief Executive Officer | ||||||||
| /s/ William P. Hornby, CPA | ||||||||
| William P. Hornby, CPA | ||||||||
| Chief Financial Officer and Treasurer | ||||||||
| (Principal Accounting Officer) | ||||||||
Page 44 of 44