Attached files
| file | filename |
|---|---|
| EX-99.1 - EX-99.1 - Monogram Residential Trust, Inc. | a17-18852_1ex99d1.htm |
| 8-K - 8-K - Monogram Residential Trust, Inc. | a17-18852_18k.htm |
Exhibit 99.2
Supplemental Financial Information Second Quarter 2017
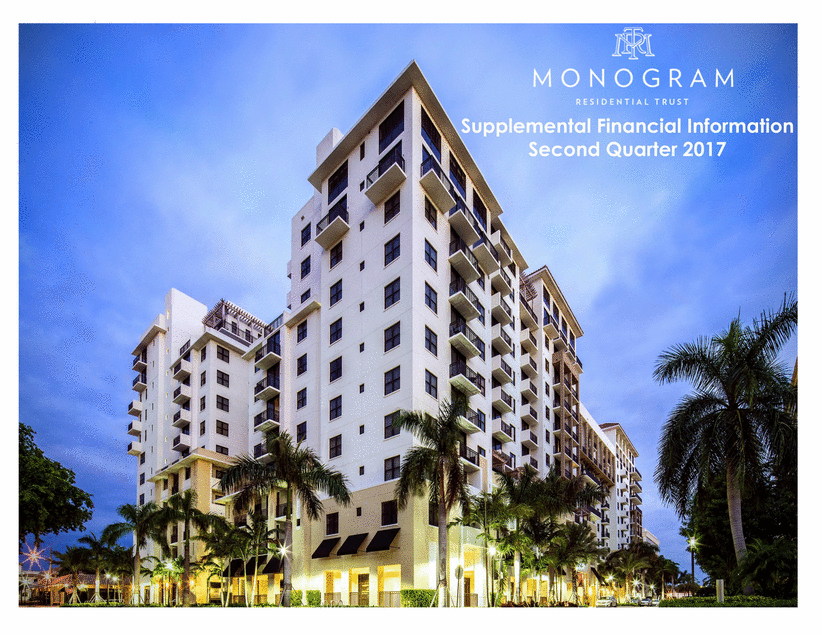
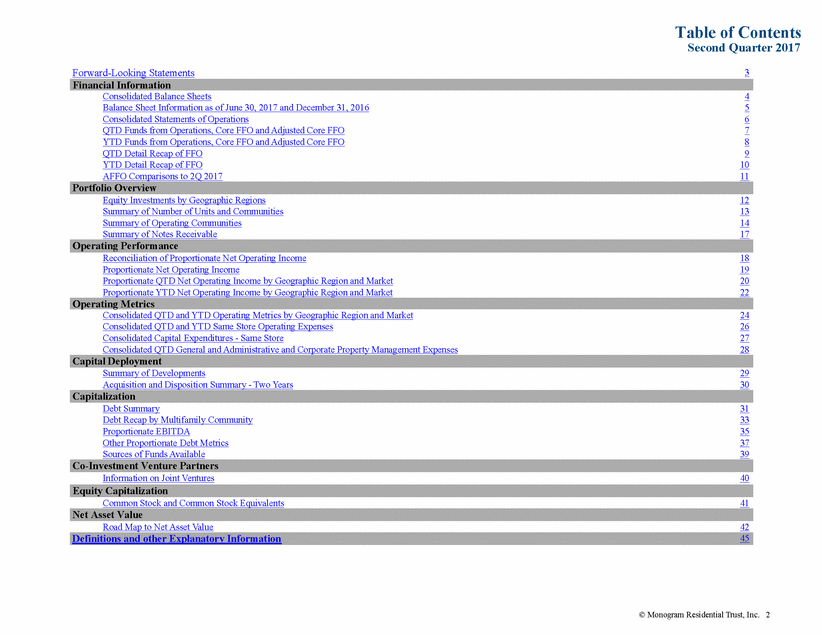
Table of Contents Second Quarter 2017 Forward-Looking Statements 3 Consolidated Balance Sheets 4 5 6 7 8 9 10 11 Balance Sheet Information as of June 30, 2017 and December 31, 2016 Consolidated Statements of Operations QTD Funds from Operations, Core FFO and Adjusted Core FFO YTD Funds from Operations, Core FFO and Adjusted Core FFO QTD Detail Recap of FFO YTD Detail Recap of FFO AFFO Comparisons to 2Q 2017 Equity Investments by Geographic Regions 12 13 14 17 Summary of Number of Units and Communities Summary of Operating Communities Summary of Notes Receivable Reconciliation of Proportionate Net Operating Income 18 19 20 22 Proportionate Net Operating Income Proportionate QTD Net Operating Income by Geographic Region and Market Proportionate YTD Net Operating Income by Geographic Region and Market Consolidated QTD and YTD Operating Metrics by Geographic Region and Market 24 26 27 28 Consolidated QTD and YTD Same Store Operating Expenses Consolidated Capital Expenditures - Same Store Consolidated QTD General and Administrative and Corporate Property Management Expenses Summary of Developments 29 30 Acquisition and Disposition Summary - Two Years Debt Summary 31 33 35 37 39 Debt Recap by Multifamily Community Proportionate EBITDA Other Proportionate Debt Metrics Sources of Funds Available Information on Joint Ventures 40 Common Stock and Common Stock Equivalents 41 Road Map to Net Asset Value 42 © Monogram Residential Trust, Inc. 2 Definitions and other Explanatory Information45 Net Asset Value Equity Capitalization Co-Investment Venture Partners Capitalization Capital Deployment Operating Metrics Operating Performance Portfolio Overview Financial Information
Forward-Looking Statements Second Quarter 2017 Certain statements made in the following supplemental financial information may constitute “forward-looking statements” within the meaning of Section 27A of the Securities Act of 1933, as amended, and Section 21E of the Securities Exchange Act of 1934, as amended. Statements regarding future events and developments and the future performance of Monogram Residential Trust, Inc. (which together with its subsidiaries may be referred to as the “Company,” “we,” “us,” or “our”), as well as management’s expectations, beliefs, plans, estimates or projections relating to the future, are forward-looking statements within the meaning of these laws. Examples of such statements in the following supplemental financial information and in the Company’s outlook include, expectations regarding apartment market conditions and expectations regarding future operating conditions, including the Company’s current outlook as to expected funds from operations, core funds from operations, adjusted funds from operations, revenue, operating expenses, net operating income, capital expenditures, depreciation, gains on sales and net income and anticipated development activities (including projected construction expenditures and timing). We intend these forward-looking statements to be covered by the safe harbor provisions for forward-looking statements contained in the Private Securities Litigation Reform Act of 1995 and are including this statement for purposes of complying with those safe harbor provisions. All forward-looking statements are subject to certain risks and uncertainties that could cause actual events to differ materially from those projected. Management believes that these forward-looking statements are reasonable; however, you should not place undue reliance on such statements. These statements are based on current expectations and speak only as of the date of such statements. The Company undertakes no obligation to publicly update or revise any forward-looking statement, whether as a result of future events, new information or otherwise. The following are some of the factors that could cause the Company’s actual results and its expectations to differ materially from those described in the Company’s forward-looking statements: we may abandon or defer development opportunities for a number of reasons, including, without limitation, changes in local market conditions which make development less desirable, increases in costs of development, increases in the cost of capital or lack of capital availability, resulting in losses; construction costs of a community may exceed our original estimates; we may not complete construction and lease-up of communities under development or redevelopment on schedule, resulting in increased interest costs and construction costs and a decrease in our expected rental revenues; we may dispose of multifamily communities due to factors including changes in local market conditions, better net earnings opportunities or capital reallocation, where the redeployment of the capital, including into properties currently in lease-up, may negatively impact our financial results, cash flows and guidance; newly acquired properties may not stabilize according to our estimated schedule, which may negatively impact our financial results, cash flows and guidance; occupancy rates and market rents may be adversely affected by competition and local economic and market conditions which are beyond our control; financing may not be available on favorable terms or at all, and our cash flows from operations and access to cost effective capital may be insufficient for the growth of our development program which could limit our pursuit of opportunities; our cash flows may be insufficient to meet required payments of principal and interest, or to make dividend payments, and we may be unable to refinance existing indebtedness or the terms of such refinancing may not be as favorable as the terms of existing indebtedness; and we may be unsuccessful in managing changes in our portfolio composition. Other factors that could cause such differences include, but are not limited to, (i) the risk that the proposed merger may not be completed in a timely manner, or at all, which may adversely affect the Company’s business and the price of its common stock, (ii) the failure to satisfy all of the closing conditions of the proposed merger, including the approval of the merger agreement by the Company’s stockholders, (iii) the occurrence of any event, change or other circumstance that could give rise to the termination of the merger agreement, (iv) the effect of the announcement or pendency of the proposed merger on the Company’s business, operating results, and relationships with joint venture partners, lenders, tenants, competitors and others, (v) risks that the proposed merger may disrupt the Company’s current plans and business operations, (vi) potential difficulties retaining employees as a result of the proposed merger, (vii) risks related to the diverting of management’s attention from the Company’s ongoing business operations, and (viii) the outcome of any legal proceedings that may be instituted against the Company related to the merger agreement or the proposed merger. Other important risk factors regarding the Company are included under the caption “Risk Factors” in the Company’s Annual Report on Form 10-K for the year ended December 31, 2016 and may be discussed in subsequent filings with the U.S. Securities and Exchange Commission (“SEC”) including the Company’s most recent Quarterly Report on Form 10-Q. Additional Information about the Proposed Transaction and Where to Find It In connection with the proposed transaction, Monogram has filed a preliminary proxy statement with the SEC as of July 28, 2017, and will file with the SEC and mail to its stockholders a definitive proxy statement. Additionally, Monogram will file other relevant materials in connection with the proposed acquisition of Monogram by an affiliate of Greystar Real Estate Partners. The materials to be filed by Monogram with the SEC may be obtained free of charge at the SEC’s web site at www.sec.gov. In addition, investors and security holders may obtain free copies of the documents filed with the SEC by Monogram on Monogram’s website at www.monogramres.com or by contacting Monogram investor relations at ir@monogramres.com. INVESTORS AND SECURITY HOLDERS OF MONOGRAM ARE URGED TO READ THE DEFINITIVE PROXY STATEMENT AND THE OTHER RELEVANT MATERIALS WHEN THEY BECOME AVAILABLE BEFORE MAKING ANY VOTING OR INVESTMENT DECISION WITH RESPECT TO THE PROPOSED TRANSACTION BECAUSE THEY WILL CONTAIN IMPORTANT INFORMATION. © Monogram Residential Trust, Inc. 3

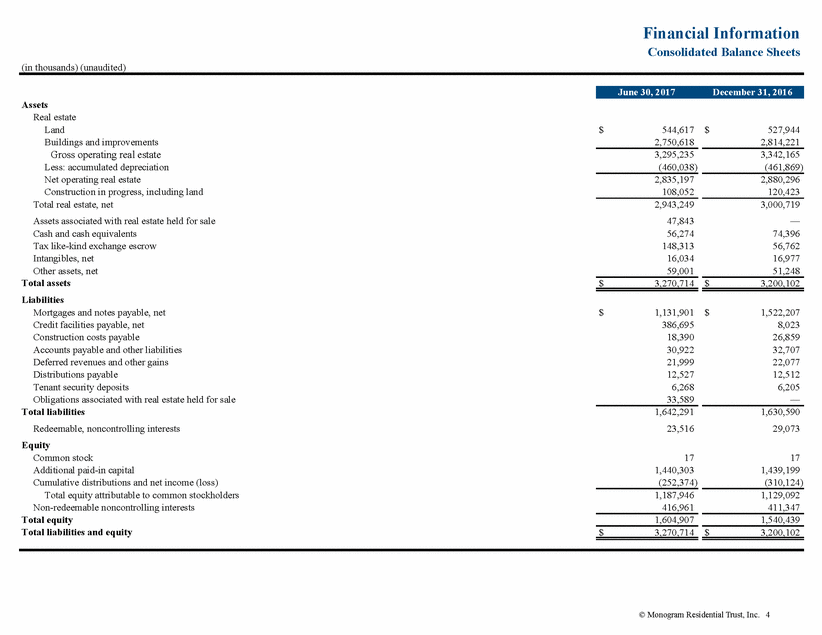
Financial Information Consolidated Balance Sheets (in thousands) (unaudited) Assets Real estate Land Buildings and improvements Gross operating real estate Less: accumulated depreciation Net operating real estate Construction in progress, including land Total real estate, net Assets associated with real estate held for sale Cash and cash equivalents Tax like-kind exchange escrow Intangibles, net Other assets, net Total assets Liabilities Mortgages and notes payable, net Credit facilities payable, net Construction costs payable Accounts payable and other liabilities Deferred revenues and other gains Distributions payable Tenant security deposits Obligations associated with real estate held for sale Total liabilities Redeemable, noncontrolling interests Equity Common stock Additional paid-in capital Cumulative distributions and net income (loss) Total equity attributable to common stockholders Non-redeemable noncontrolling interests Total equity Total liabilities and equity $ 544,617 2,750,618 $ 527,944 2,814,221 3,295,235 (460,038) 3,342,165 (461,869) 2,835,197 108,052 2,880,296 120,423 2,943,249 47,843 56,274 148,313 16,034 59,001 3,000,719 — 74,396 56,762 16,977 51,248 $ 3,270,714 $ 3,200,102 $ 1,131,901 386,695 18,390 30,922 21,999 12,527 6,268 33,589 $ 1,522,207 8,023 26,859 32,707 22,077 12,512 6,205 — 1,642,291 23,516 1,630,590 29,073 17 1,440,303 (252,374) 17 1,439,199 (310,124) 1,187,946 416,961 1,129,092 411,347 1,604,907 1,540,439 $ 3,270,714 $ 3,200,102 © Monogram Residential Trust, Inc. 4 June 30, 2017December 31, 2016
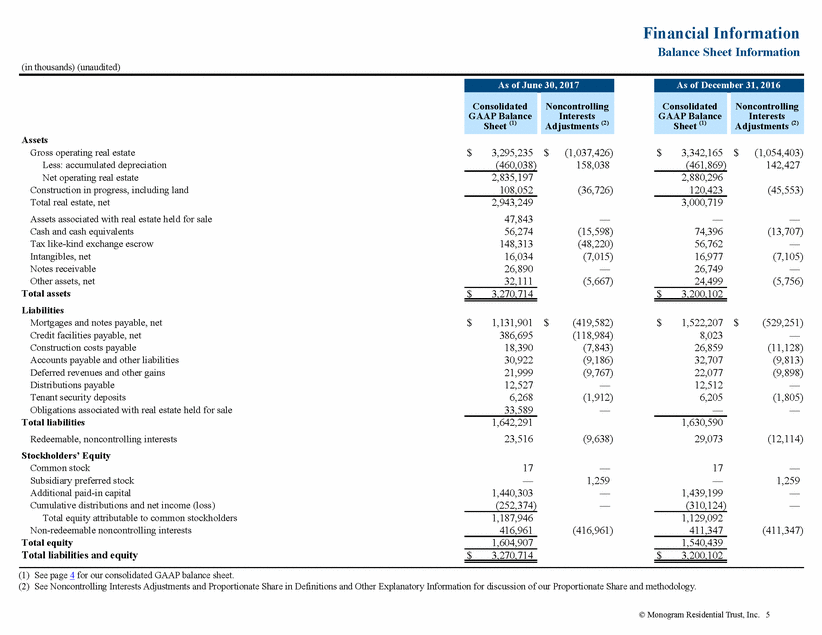
Financial Information Balance Sheet Information (in thousands) (unaudited) Adjustments (2) Assets Gross operating real estate Less: accumulated depreciation Net operating real estate Construction in progress, including land Total real estate, net Assets associated with real estate held for sale Cash and cash equivalents Tax like-kind exchange escrow Intangibles, net Notes receivable Other assets, net Total assets Liabilities Mortgages and notes payable, net Credit facilities payable, net Construction costs payable Accounts payable and other liabilities Deferred revenues and other gains Distributions payable Tenant security deposits Obligations associated with real estate held for sale Total liabilities Redeemable, noncontrolling interests Stockholders’ Equity Common stock Subsidiary preferred stock Additional paid-in capital Cumulative distributions and net income (loss) Total equity attributable to common stockholders Non-redeemable noncontrolling interests Total equity Total liabilities and equity $ 3,295,235 (460,038) $ (1,037,426) 158,038 $ 3,342,165 (461,869) $ (1,054,403) 142,427 2,835,197 108,052 2,880,296 120,423 (36,726) (45,553) 2,943,249 47,843 56,274 148,313 16,034 26,890 32,111 3,000,719 — 74,396 56,762 16,977 26,749 24,499 — (15,598) (48,220) (7,015) — (5,667) — (13,707) — (7,105) — (5,756) $ 3,270,714 $ 3,200,102 $ 1,131,901 386,695 18,390 30,922 21,999 12,527 6,268 33,589 $ (419,582) (118,984) (7,843) (9,186) (9,767) — (1,912) — $ 1,522,207 8,023 26,859 32,707 22,077 12,512 6,205 — $ (529,251) — (11,128) (9,813) (9,898) — (1,805) — 1,642,291 23,516 1,630,590 29,073 (9,638) (12,114) 17 — 1,440,303 (252,374) — 1,259 — — 17 — 1,439,199 (310,124) — 1,259 — — 1,187,946 416,961 1,129,092 411,347 (416,961) (411,347) 1,604,907 1,540,439 $ 3,270,714 $ 3,200,102 (1) See page 4 for our consolidated GAAP balance sheet. (2) See Noncontrolling Interests Adjustments and Proportionate Share in Definitions and Other Explanatory Information for discussion of our Proportionate Share and methodology. © Monogram Residential Trust, Inc. 5 As of December 31, 2016 Consolidated GAAP Balance Sheet (1) Noncontrolling Interests As of June 30, 2017 Consolidated GAAP Balance Sheet (1) Noncontrolling Interests Adjustments (2)
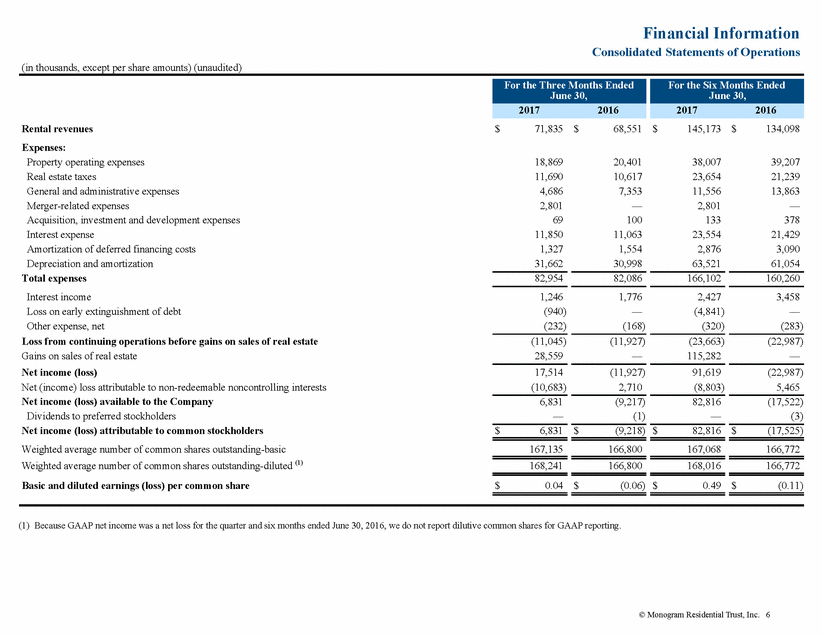
Financial Information Consolidated Statements of Operations (in thousands, except per share amounts) (unaudited) Rental revenues Expenses: Property operating expenses Real estate taxes General and administrative expenses Merger-related expenses Acquisition, investment and development expenses Interest expense Amortization of deferred financing costs Depreciation and amortization Total expenses Interest income Loss on early extinguishment of debt Other expense, net Loss from continuing operations before gains on sales of real estate Gains on sales of real estate Net income (loss) Net (income) loss attributable to non-redeemable noncontrolling interests Net income (loss) available to the Company Dividends to preferred stockholders Net income (loss) attributable to common stockholders Weighted average number of common shares outstanding-basic Weighted average number of common shares outstanding-diluted (1) Basic and diluted earnings (loss) per common share $ 71,835 $ 68,551 $ 145,173 $ 134,098 18,869 11,690 4,686 2,801 69 11,850 1,327 31,662 20,401 10,617 7,353 — 100 11,063 1,554 30,998 38,007 23,654 11,556 2,801 133 23,554 2,876 63,521 39,207 21,239 13,863 — 378 21,429 3,090 61,054 82,954 82,086 166,102 160,260 1,246 (940) (232) 1,776 — (168) 2,427 (4,841) (320) 3,458 — (283) (11,045) 28,559 (11,927) — (23,663) 115,282 (22,987) — 17,514 (10,683) (11,927) 2,710 91,619 (8,803) (22,987) 5,465 6,831 — (9,217) (1) 82,816 — (17,522) (3) $ 6,831 $ (9,218) $ 82,816 $ (17,525) 167,135 166,800 167,068 166,772 168,241 166,800 168,016 166,772 $ 0.04 $ (0.06) $ 0.49 $ (0.11) (1) Because GAAP net income was a net loss for the quarter and six months ended June 30, 2016, we do not report dilutive common shares for GAAP reporting. © Monogram Residential Trust, Inc. 6 For the Six Months Ended June 30, 20172016 For the Three Months Ended June 30, 20172016
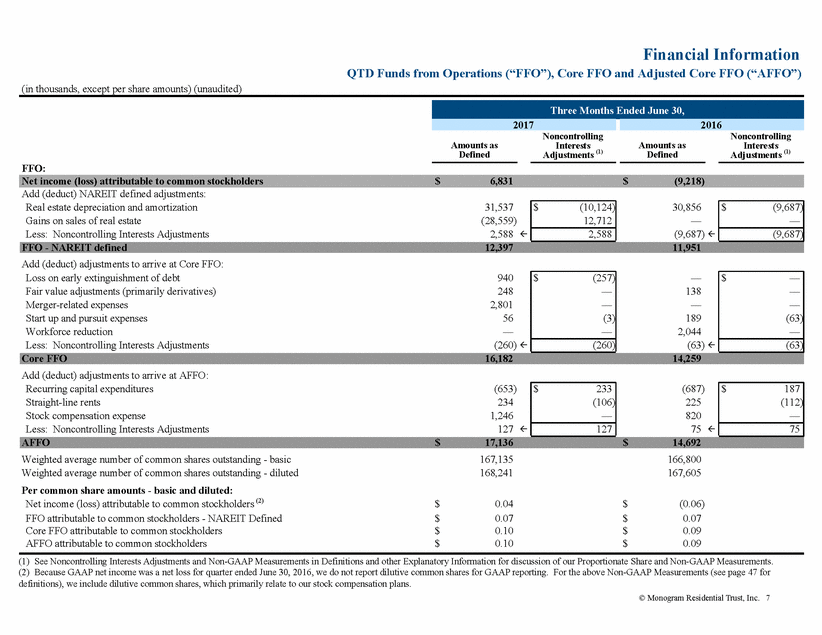
Financial Information QTD Funds from Operations (“FFO”), Core FFO and Adjusted Core FFO (“AFFO”) (in thousands, except per share amounts) (unaudited) Noncontrolling Noncontrolling Amounts as Defined Interests Adjustments (1) Amounts as Defined Interests Adjustments (1) FFO: Add (deduct) NAREIT defined adjustments: Add (deduct) adjustments to arrive at Core FFO: Add (deduct) adjustments to arrive at AFFO: Weighted average number of common shares outstanding - basic Weighted average number of common shares outstanding - diluted Per common share amounts - basic and diluted: Net income (loss) attributable to common stockholders (2) FFO attributable to common stockholders - NAREIT Defined Core FFO attributable to common stockholders AFFO attributable to common stockholders 167,135 168,241 166,800 167,605 $ $ $ $ 0.04 0.07 0.10 0.10 $ $ $ $ (0.06) 0.07 0.09 0.09 (1) See Noncontrolling Interests Adjustments and Non-GAAP Measurements in Definitions and other Explanatory Information for discussion of our Proportionate Share and Non-GAAP Measurements. (2) Because GAAP net income was a net loss for quarter ended June 30, 2016, we do not report dilutive common shares for GAAP reporting. For the above Non-GAAP Measurements (see page 47 for definitions), we include dilutive common shares, which primarily relate to our stock compensation plans. © Monogram Residential Trust, Inc. 7 Recurring capital expenditures(653) Straight-line rents234 Stock compensation expense1,246 Less: Noncontrolling Interests Adjustments127 $233 (106) — (687) 225 820 75 $187 (112) — 127 75 AFFO$17,136$14,692 Loss on early extinguishment of debt940 Fair value adjustments (primarily derivatives)248 Merger-related expenses2,801 Start up and pursuit expenses56 Workforce reduction— Less: Noncontrolling Interests Adjustments(260) $(257) — — (3) — — 138 — 189 2,044 (63) $— — — (63) — (63) (260) Core FFO16,18214,259 Real estate depreciation and amortization31,537 Gains on sales of real estate(28,559) Less: Noncontrolling Interests Adjustments2,588 $(10,124) 12,712 30,856 — (9,687) $(9,687) — 2,588 (9,687) FFO - NAREIT defined12,39711,951 Net income (loss) attributable to common stockholders$6,831$(9,218) Three Months Ended June 30, 2017 2016
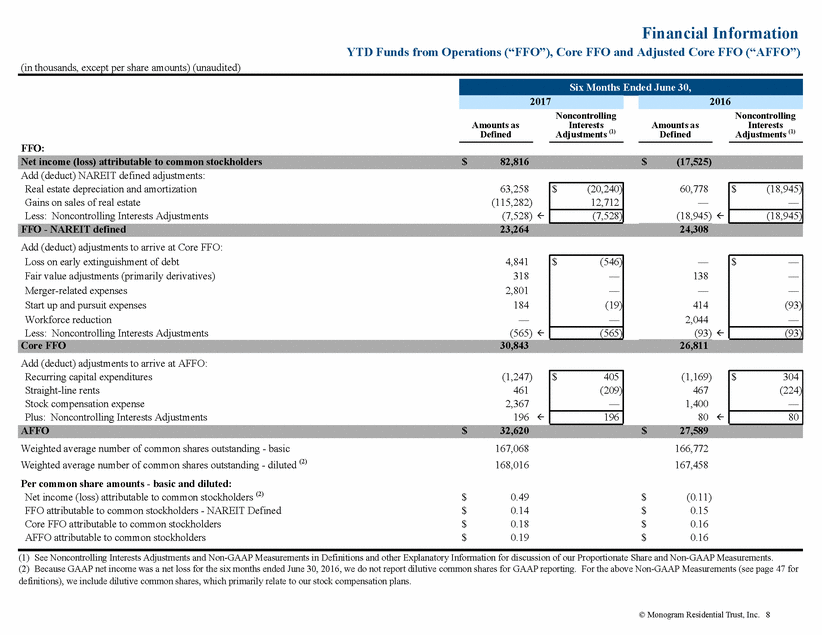
Financial Information YTD Funds from Operations (“FFO”), Core FFO and Adjusted Core FFO (“AFFO”) (in thousands, except per share amounts) (unaudited) Noncontrolling Noncontrolling Amounts as Defined Interests Adjustments (1) Amounts as Defined Interests Adjustments (1) FFO: Add (deduct) NAREIT defined adjustments: Add (deduct) adjustments to arrive at Core FFO: Add (deduct) adjustments to arrive at AFFO: Weighted average number of common shares outstanding - basic Weighted average number of common shares outstanding - diluted (2) Per common share amounts - basic and diluted: Net income (loss) attributable to common stockholders (2) FFO attributable to common stockholders - NAREIT Defined Core FFO attributable to common stockholders AFFO attributable to common stockholders 167,068 168,016 166,772 167,458 $ $ $ $ 0.49 0.14 0.18 0.19 $ $ $ $ (0.11) 0.15 0.16 0.16 (1) See Noncontrolling Interests Adjustments and Non-GAAP Measurements in Definitions and other Explanatory Information for discussion of our Proportionate Share and Non-GAAP Measurements. (2) Because GAAP net income was a net loss for the six months ended June 30, 2016, we do not report dilutive common shares for GAAP reporting. For the above Non-GAAP Measurements (see page 47 for definitions), we include dilutive common shares, which primarily relate to our stock compensation plans. © Monogram Residential Trust, Inc. 8 Recurring capital expenditures(1,247) Straight-line rents461 Stock compensation expense2,367 Plus: Noncontrolling Interests Adjustments196 $405 (209) — (1,169) 467 1,400 80 $304 (224) — 196 80 AFFO$32,620$27,589 Loss on early extinguishment of debt4,841 Fair value adjustments (primarily derivatives)318 Merger-related expenses2,801 Start up and pursuit expenses184 Workforce reduction— Less: Noncontrolling Interests Adjustments(565) $(546) — — (19) — — 138 — 414 2,044 (93) $— — — (93) — (565) (93) Core FFO30,84326,811 Real estate depreciation and amortization63,258 Gains on sales of real estate(115,282) Less: Noncontrolling Interests Adjustments(7,528) $(20,240) 12,712 60,778 — (18,945) $(18,945) — (7,528) (18,945) FFO - NAREIT defined23,26424,308 Net income (loss) attributable to common stockholders$82,816$(17,525) Six Months Ended June 30, 2017 2016
Financial Information QTD Detail Recap of FFO (in thousands) (unaudited) Noncontrolling Noncontrolling Interests Adjustments (1) Amounts as Defined Interests Adjustments (1) Amounts as Defined Revenues: Rental revenues before straight-line rents Straight-line rents Rental revenues Property operating expenses: Property operating expenses (including real estate taxes) Fee income: Asset management fees Property management fees Other: General and administrative expenses Corporate property management expenses Workforce reduction Merger-related expenses Start up and pursuit expenses Stock compensation expense Interest expense (2) Amortization of deferred financing costs Interest income Loss on early extinguishment of debt Other expense, net Dividends to preferred stockholders Depreciation and amortization related to non-real estate assets Less: Noncontrolling Interests Adjustments FFO - NAREIT defined $ 72,069 (234) $ 68,776 (225) 71,835 68,551 (28,472) (27,429) — — — — (3,589) (1,881) — (2,801) (56) (1,246) (11,850) (1,327) 1,246 (940) (301) (84) (125) (8,012) (5,500) (2,395) (2,044) — (189) (820) (11,063) (1,554) 1,776 — (263) (87) (143) (6,889) $ 12,397 $ 11,951 Note: Certain amounts from the consolidated financial statements differ from the consolidated amounts above due to non-FFO items or reclassifications (e.g., corporate property management expenses, stock compensation expenses, etc.) See page 7 for reconciliation of net income attributable to common stockholders to FFO - NAREIT defined. (1) See Noncontrolling Interests Adjustments and Non-GAAP Measurements in Definitions and other Explanatory Information for discussion of our Proportionate Share and Non-GAAP Measurements. (2) See page 36 for components of interest expense, including contractual interest, capitalized interest, amortization of deferred financing costs and other finance fees. © Monogram Residential Trust, Inc. 9 $(20,903) 112 8,751 377 783 43 — — — 63 — 3,391 331 (3) — 131 32 3 (6,889) $(23,828) 106 9,611 370 887 73 — — — 3 — 4,063 377 (3) 257 33 32 7 (8,012) Three months ended June 30, 2016 Three Months Ended June 30, 2017
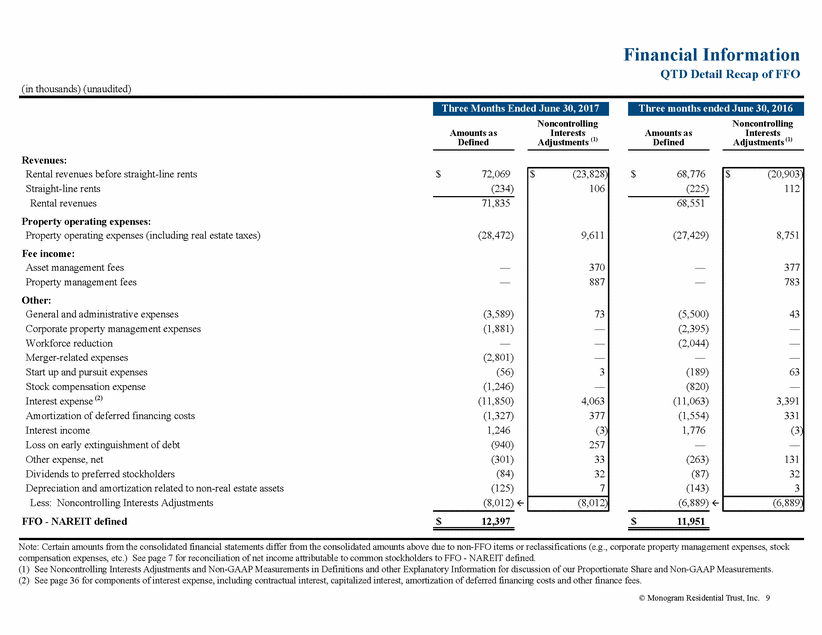
Financial Information YTD Detail Recap of FFO (in thousands) (unaudited) Noncontrolling Noncontrolling Amounts as Defined Interests Adjustments (1) Amounts as Defined Interests Adjustments (1) Revenues: Rental revenues before straight-line rents Straight-line rents Rental revenues Property operating expenses: Property operating expenses (including real estate taxes) Fee income: Asset management fees Property management fees Other: General and administrative expenses Corporate property management expenses Workforce reduction Merger-related expenses Start up and pursuit expenses Stock compensation expense Interest expense (2) Amortization of deferred financing costs Interest income Loss on early extinguishment of debt Other expense, net Dividends to preferred stockholders Depreciation and amortization related to non-real estate assets Less: Noncontrolling Interests Adjustments FFO - NAREIT defined $ 145,634 (461) $ 134,565 (467) 145,173 134,098 (56,945) (54,154) — — — — (9,473) (4,282) — (2,801) (184) (2,367) (23,554) (2,876) 2,427 (4,841) (418) (167) (263) (16,165) (11,519) (4,907) (2,044) — (414) (1,400) (21,429) (3,090) 3,458 — (533) (174) (276) (13,308) $ 23,264 $ 24,308 Note: Certain amounts from the consolidated financial statements differ from the consolidated amounts above due to non-FFO items or reclassifications (e.g., corporate property management expenses, stock compensation expenses, etc.) See page 8 for reconciliation of net income attributable to common stockholders to FFO - NAREIT defined. (1) See Noncontrolling Interests Adjustments and Non-GAAP Measurements in Definitions and other Explanatory Information for discussion of our Proportionate Share and Non-GAAP Measurements. (2) See page 36 for components of interest expense, including contractual interest, capitalized interest and other finance fees. © Monogram Residential Trust, Inc. 10 $(40,787) 224 17,168 752 1,537 280 — — — 93 — 6,480 660 (6) — 222 64 5 (13,308) $(47,171) 209 18,791 734 1,755 257 — — — 19 — 7,793 769 (6) 546 62 63 14 (16,165) Six Months Ended June 30, 2016 Six Months Ended June 30, 2017
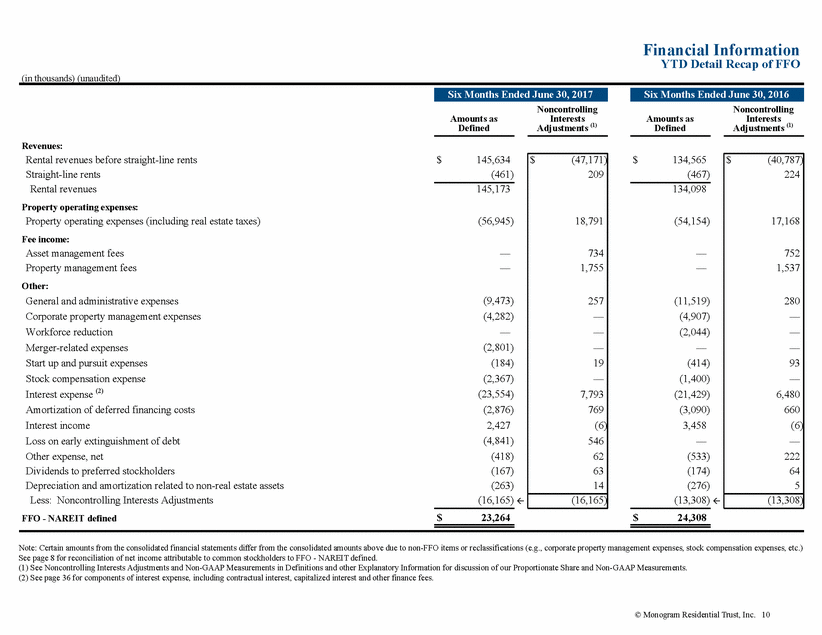
Financial Information AFFO Comparisons to 2Q 2017 (in millions, except per share amounts) (unaudited) AFFO attributable to common stockholders - 2Q 2017 AFFO attributable to common stockholders - 2Q 2016 $ 0.10 0.09 Increase in NOI from stabilized non-comparables and lease ups Decrease in NOI from dispositions Decrease in general and administrative expenses (1) $ 0.03 (0.03) 0.01 Weighted average number of common shares outstanding - diluted - 2Q 2017 Weighted average number of common shares outstanding - diluted - 2Q 2016 168.2 167.6 AFFO attributable to common stockholders - 2Q 2017 AFFO attributable to common stockholders - 1Q 2017 $ 0.10 0.09 Decrease in NOI from dispositions Increase in NOI from stabilized non-comparables, lease ups and acquisitions Decrease in general and administrative expenses (1) $ (0.02) 0.01 0.02 Weighted average number of common shares outstanding - diluted - 2Q 2017 Weighted average number of common shares outstanding - diluted - 1Q 2017 168.2 167.8 (1) Excludes merger-related expenses of $2.8 million for the three and six months ended June 30, 2017. © Monogram Residential Trust, Inc. 11 Major components of change quarter over quarter: Increase in AFFO attributable to common stockholders - quarter over quarter$0.01 Comparison of actual AFFO attributable to common stockholders 2Q 2017 to 1Q 2017: Major components of change quarter over quarter: Increase in AFFO attributable to common stockholders - quarter over quarter$0.01 Comparison of reported AFFO attributable to common stockholders 2Q 2017 to 2Q 2016:
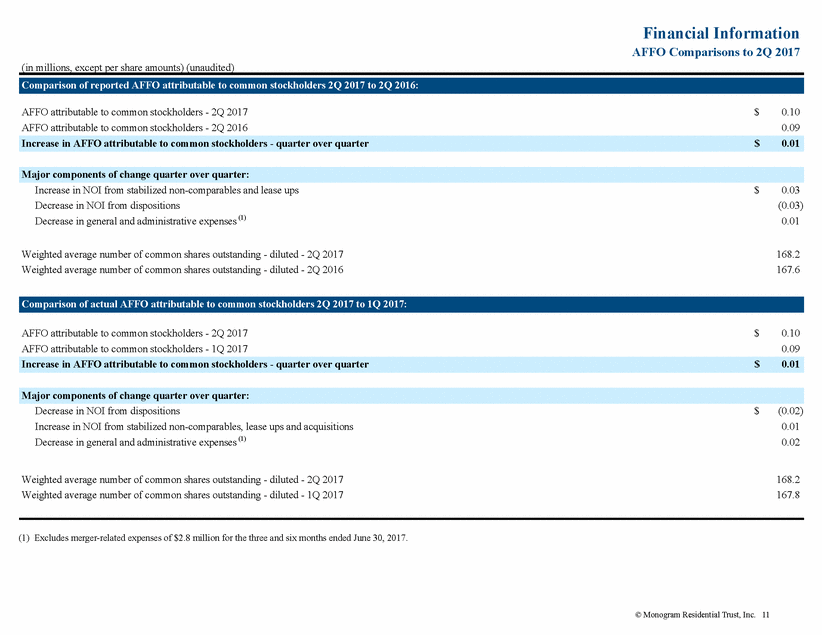
Portfolio Overview Equity Investments by Geographic Regions As of June 30, 2017 5 operating com unities 11 Northern California 5 operating com'm*unities Nevada Colorado 3 operating communities * Texas 1 operatm. g commum.ty 1 communicy held for sale 7 erating communities * Southern California 8 operating communities 1 development community Geo*rgia 8 operating communities * 1 operating comm nity * South florida"' 6 operating communities Opera.tin8 (45 Communit ies, including devel opments in l ease up *Development (1 community) and a community held for sale and sold i n July 2017) Note: Excludes 2 debt investments © Monogram Residential Trust, Inc. 12
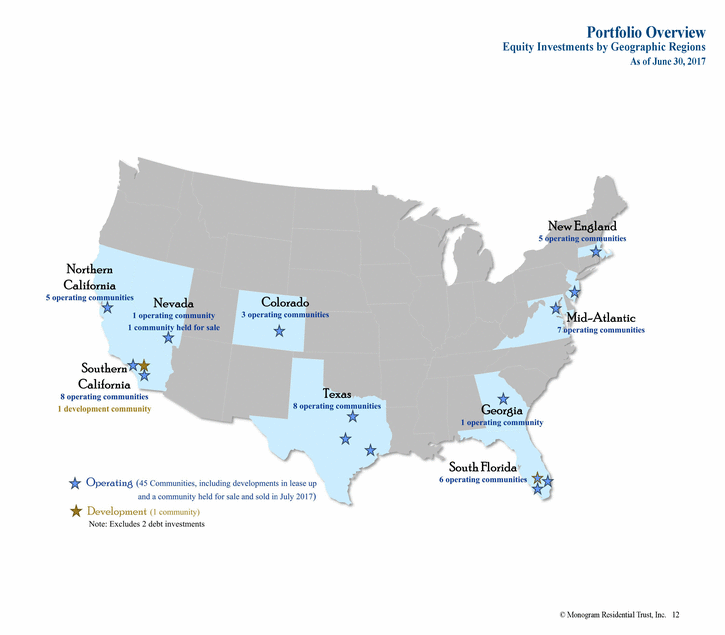
Portfolio Overview Summary of Number of Units and Communities Total Units Total Communities Equity Investments: Same Store Wholly owned Wholly owned sold in 2016 Wholly owned sold in 2017 Consolidated joint ventures Consolidated joint venture sold in 2016 Consolidated joint venture sold in 2017 1,863 — — 6,396 — — 1,655 283 974 5,419 134 231 7 — — 25 — — 6 1 3 20 1 1 Stabilized - Non Comparable Wholly owned Consolidated joint ventures (includes one community with 430 units classified as held for sale as of June 30, 2017 and sold in July 2017) Consolidated joint venture sold in 2017 328 2,595 — 416 1,736 270 2 7 — 2 7 1 Lease up (including operating communities and developments in lease up) Wholly owned Wholly owned acquired in 2017 Consolidated joint ventures — 440 511 120 — 2,201 — 2 2 1 — 6 Developments under Construction Consolidated joint ventures 510 656 1 2 N/A N/A — 1 Land held for future development - consolidated joint venture sold in 2016 Debt Investments: Mezzanine Loans - Development, Lease up, and Stabilized Wholly owned 795 1,116 2 3 Recap of Totals by Category Wholly owned Wholly owned acquired in 2017 Wholly owned sold in 2016 Wholly owned sold in 2017 Consolidated joint ventures Consolidated joint venture sold in 2016 Consolidated joint venture sold in 2017 2,986 440 — — 10,012 — — 3,307 — 283 974 10,012 134 501 11 2 — — 35 — — 12 — 1 3 36 1 2 © Monogram Residential Trust, Inc. 13 Total Communities - Equity and Debt Investments13,43815,2114855 Total Communities - Equity and Debt Investments13,43815,2114855 Total Communities - Debt Investments7951,11623 Total Communities - Equity Investments12,64314,0954652 Total Developments under Construction51065612 Total Lease up (including operating communities and developments in lease up)9512,32147 Total Stabilized - Non Comparable2,9232,422910 Total Stabilized11,18211,1184142 Total Same Store8,2598,6963232 June 30, 2017June 30, 2016 June 30, 2017June 30, 2016
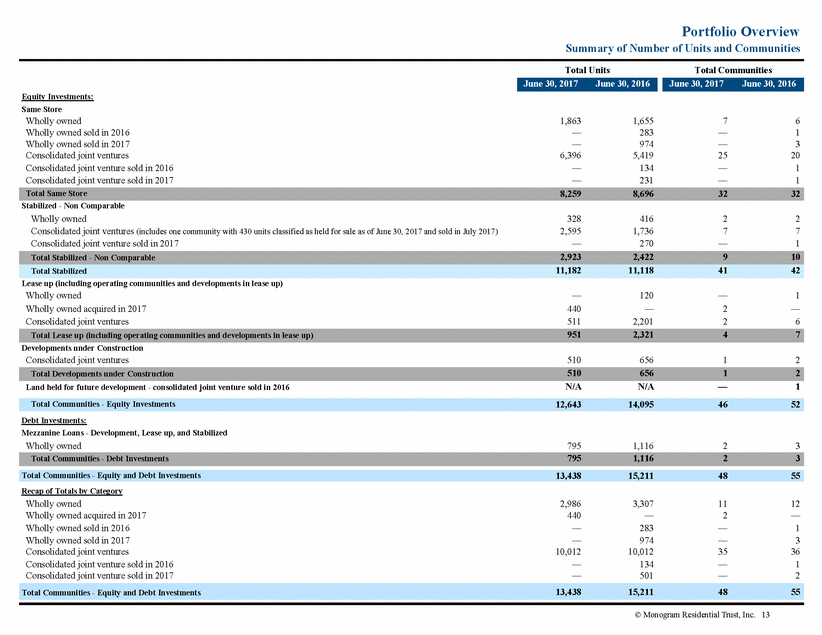
Portfolio Overview Summary of Operating Communities As of June 30, 2017 Location Ownership Development Units Same Store NOI Same Store Communities: Consolidated joint ventures 4550 Cherry Creek 7166 at Belmar Point 21 Denver, CO Lakewood, CO Denver, CO 55% 55% 55% 2004 2008 2015 288 308 212 Wholly owned The Mark Consolidated joint venture Satori The Franklin Delray Boca Raton, FL 100% 2015 208 Fort Lauderdale, FL Delray Beach, FL 55% 55% 2010 2013 279 180 Wholly owned The Cameron Consolidated joint ventures 55 Hundred Bailey's Crossing Burrough's Mill The Lofts at Park Crest Silver Spring, MD 100% 2010 325 Arlington, VA Alexandria, VA Cherry Hill, NJ McLean, VA 55% 55% 55% 55% 2010 2010 2004 2008 234 414 308 131 Consolidated joint ventures The Venue Clark County, NV 55% 2009 168 Wholly owned Pembroke Woods Stone Gate Consolidated joint venture Everly West Village Pembroke, MA Marlborough, MA 100% 100% 2006 2007 240 332 Wakefield, MA Mansfield, MA 55% 55% 2014 2008 186 200 Wholly owned Acappella Vara Consolidated joint ventures Acacia on Santa Rosa Creek Argenta San Bruno, CA San Francisco, CA 100% 100% 2010 2013 163 202 Santa Rosa, CA San Francisco, CA 55% 55% 2003 2008 277 179 © Monogram Residential Trust, Inc. 14 Northern California Totals82119.0% New England Totals95813.0% Nevada Totals1680.8% Mid-Atlantic Totals1,41218.1% South Florida Totals6678.8% Colorado Totals8088.1% CurrentYear of Completion or MostPercentage of Portfolio Based on EffectiveRecent SubstantialYTD 2017 Proportionate
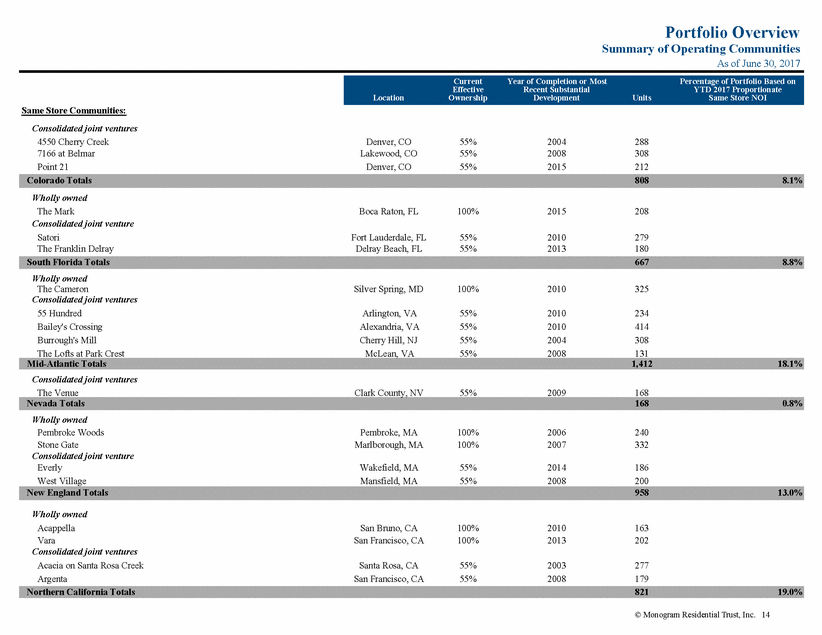
Portfolio Overview Summary of Operating Communities As of June 30, 2017 Location Ownership Development Units Same Store NOI Same Store Communities (continued): Consolidated joint ventures Blue Sol Calypso Apartments and Lofts Forty55 Lofts The Gallery at NoHo Commons San Sebastian Costa Mesa, CA Irvine, CA Marina del Rey, CA Los Angeles, CA Laguna Woods, CA 100% 55% 55% 55% 55% 2014 2008 2010 2008 2010 113 177 140 438 134 Wholly owned Allegro Consolidated joint ventures 4110 Fairmount Arpeggio Victory Park Briar Forest Lofts Eclipse Fitzhugh Urban Flats SEVEN Addison, TX 100% 2013 393 Dallas, TX Dallas, TX Houston, TX Houston, TX Dallas, TX Austin, TX 55% 55% 55% 55% 55% 55% 2014 2014 2008 2009 2009 2015 299 377 352 330 452 220 Stabilized Non-Comparable Communities: Wholly Owned The Mile Consolidated joint venture SoMa Miami, FL 100% 2016 120 Miami, FL 55% 2016 418 Consolidated joint venture Cyan on Peachtree Atlanta, GA 55% 2015 329 Consolidated joint venture Nouvelle Tysons Corner, VA 55% 2015 461 © Monogram Residential Trust, Inc. 15 Mid-Atlantic Totals461 Georgia Totals329 South Florida Totals538 Total Same Store Communities (weighted average year)20108,259100.0% Texas Totals2,42317.5% Southern California Totals1,00214.7% CurrentYear of Completion or MostPercentage of Portfolio Based on EffectiveRecent SubstantialYTD 2017 Proportionate
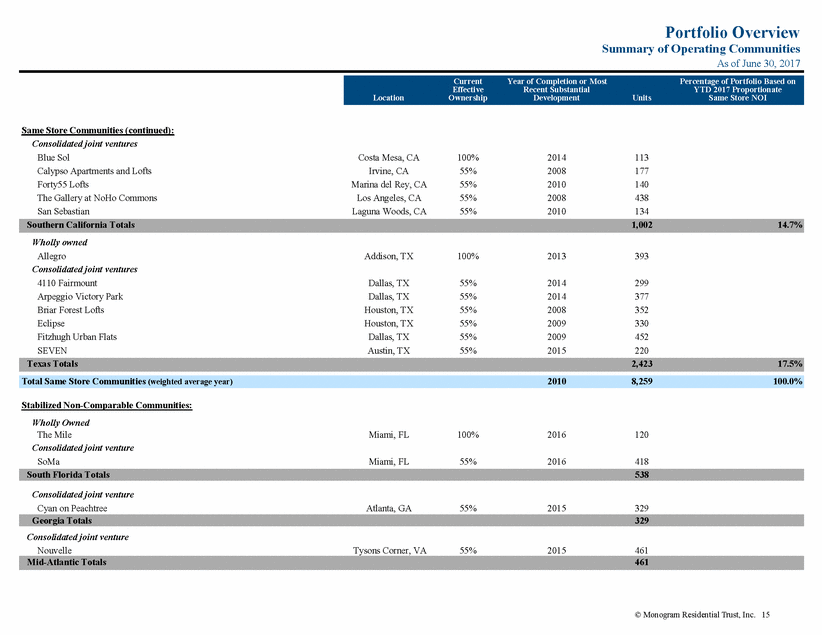
Portfolio Overview Summary of Operating Communities As of June 30, 2017 Location Ownership Development Units Same Store NOI Stabilized Non-Comparable Communities (continued): Consolidated joint venture Veritas (classified as held for sale as of June 30, 2017 and sold in July 2017) Henderson, NV 100% 2011 430 Consolidated joint venture Zinc Cambridge, MA 55% 2015 392 Consolidated joint venture OLUME San Francisco, CA 55% 2016 121 Wholly owned Ev Consolidated joint venture Verge San Diego, CA 100% 2015 208 San Diego, CA 70% 2016 444 Lease up: Consolidated joint venture Caspian Delray Beach Delray Beach 55% 2017 146 Wholly owned Latitude Arlington, VA 100% 2017 265 Wholly Owned Desmond at Wilshire Los Angeles, CA 100% 2016 175 Consolidated joint venture The Alexan Dallas, TX 50% 2017 365 © Monogram Residential Trust, Inc. 16 Total Operating Communities (weighted average year)201212,133 Total Lease up Communities (weighted average year)2017951 Texas Totals365 Southern California Totals175 Mid-Atlantic Totals265 Florida Totals146 Total Stabilized / Non-Comparable Communities (weighted average year)20152,923 Southern California Totals652 Northern California Totals121 New England Totals392 Nevada Totals430 CurrentYear of Completion or MostPercentage of Portfolio Based on EffectiveRecent SubstantialYTD 2017 Proportionate
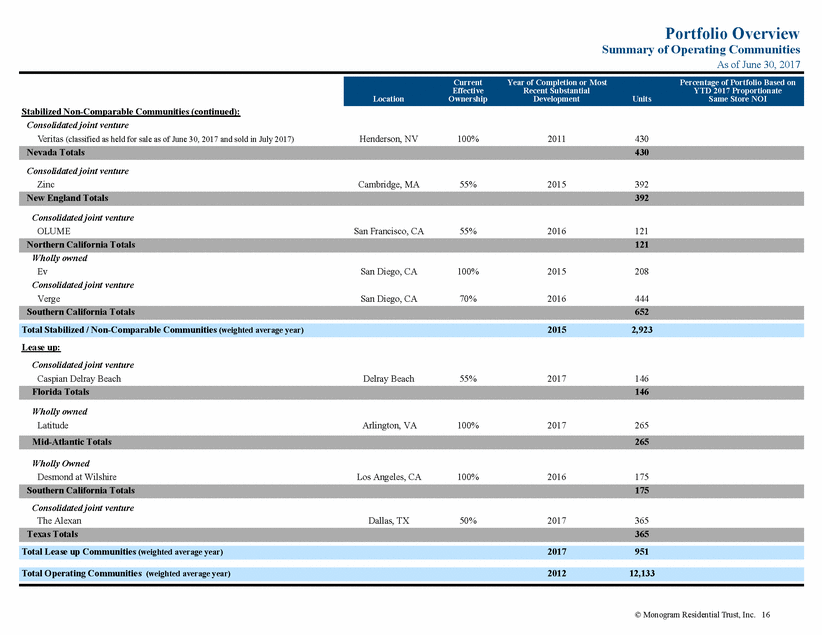
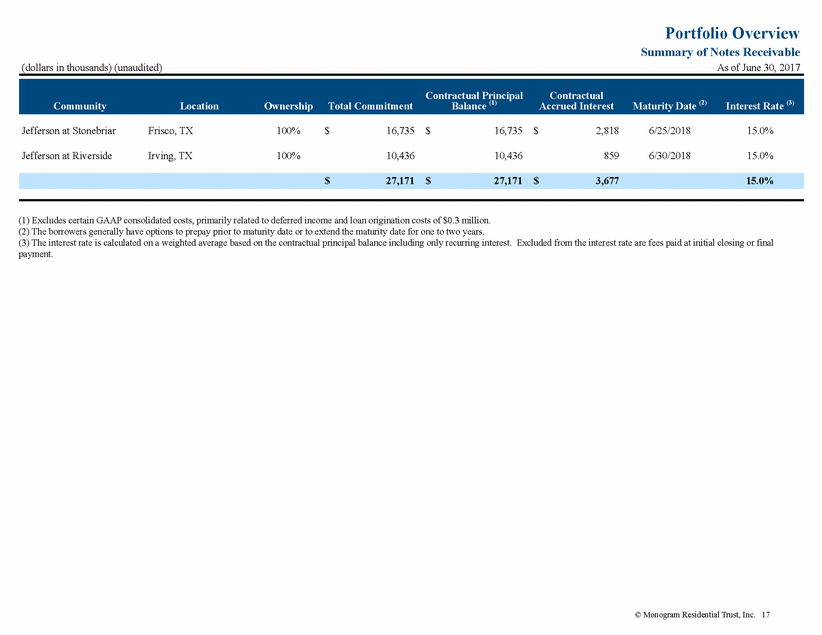
Portfolio Overview Summary of Notes Receivable As of June 30, 2017 (dollars in thousands) (unaudited) Balance (1) Maturity Date (2) Interest Rate (3) Community Location Ownership Total Commitment Accrued Interest Jefferson at Stonebriar Frisco, TX 100% $ 16,735$ 16,735 $ 2,818 6/25/2018 15.0% Jefferson at Riverside Irving, TX 100% 10,436 10,436 859 6/30/2018 15.0% (1) Excludes certain GAAP consolidated costs, primarily related to deferred income and loan origination costs of $0.3 million. (2) The borrowers generally have options to prepay prior to maturity date or to extend the maturity date for one to two years. (3) The interest rate is calculated on a weighted average based on the contractual principal balance including only recurring interest. Excluded from the interest rate are fees paid at initial closing or final payment. © Monogram Residential Trust, Inc. 17 $27,171$27,171$3,67715.0% Contractual PrincipalContractual
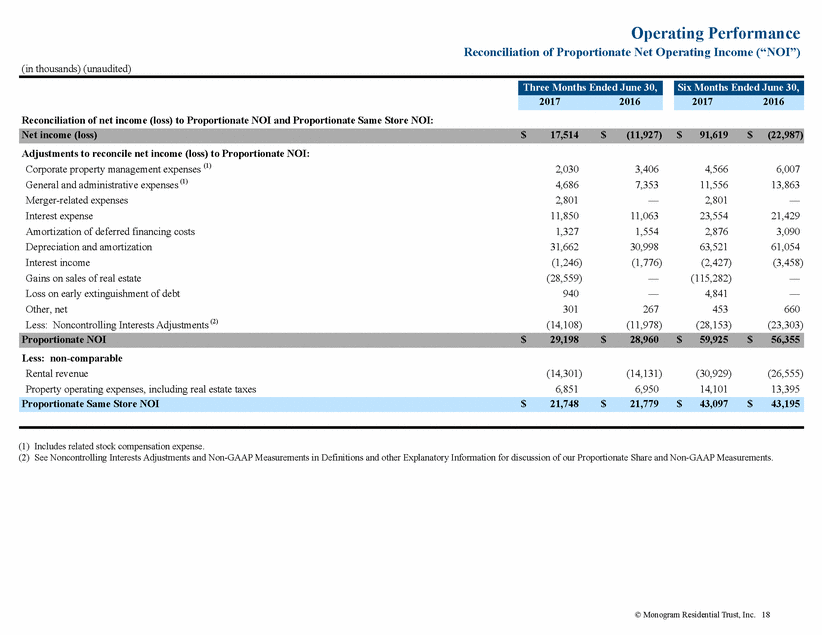
Operating Performance Reconciliation of Proportionate Net Operating Income (“NOI”) (in thousands) (unaudited) Reconciliation of net income (loss) to Proportionate NOI and Proportionate Same Store NOI: Adjustments to reconcile net income (loss) to Proportionate NOI: Corporate property management expenses (1) General and administrative expenses (1) Merger-related expenses Interest expense Amortization of deferred financing costs Depreciation and amortization Interest income Gains on sales of real estate Loss on early extinguishment of debt Other, net Less: Noncontrolling Interests Adjustments (2) 2,030 4,686 2,801 11,850 1,327 31,662 (1,246) (28,559) 940 301 (14,108) 3,406 7,353 — 11,063 1,554 30,998 (1,776) — — 267 (11,978) 4,566 11,556 2,801 23,554 2,876 63,521 (2,427) (115,282) 4,841 453 (28,153) 6,007 13,863 — 21,429 3,090 61,054 (3,458) — — 660 (23,303) Less: non-comparable Rental revenue Property operating expenses, including real estate taxes (14,301) 6,851 (14,131) 6,950 (30,929) 14,101 (26,555) 13,395 (1) Includes related stock compensation expense. (2) See Noncontrolling Interests Adjustments and Non-GAAP Measurements in Definitions and other Explanatory Information for discussion of our Proportionate Share and Non-GAAP Measurements. © Monogram Residential Trust, Inc. 18 Proportionate Same Store NOI$21,748$21,779$43,097$43,195 Proportionate NOI$29,198$28,960$59,925$56,355 Net income (loss)$17,514$(11,927)$91,619$(22,987) Six Months Ended June 30, 20172016 Three Months Ended June 30, 20172016
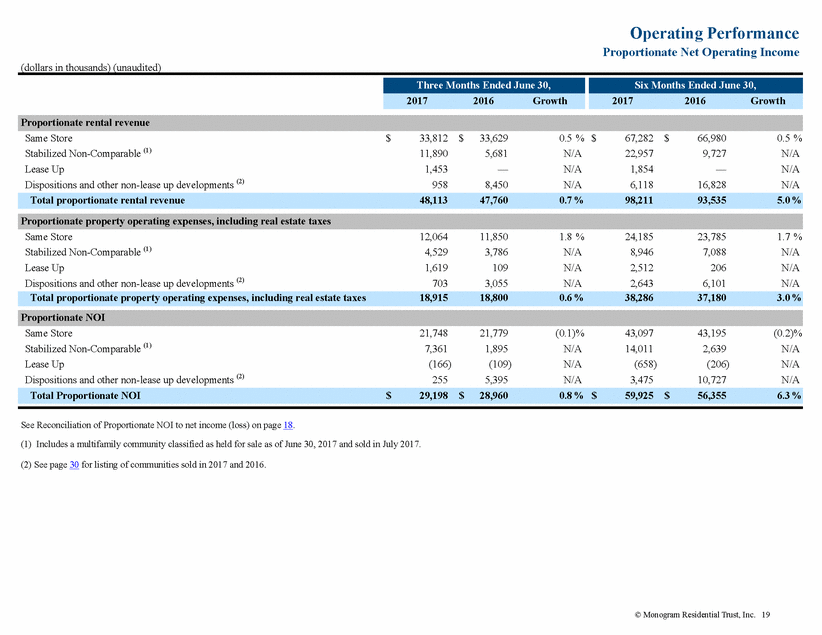
Operating Performance Proportionate Net Operating Income (dollars in thousands) (unaudited) Same Store Stabilized Non-Comparable (1) Lease Up Dispositions and other non-lease up developments (2) $ 33,812 11,890 1,453 958 $ 33,629 5,681 — 8,450 0.5 % N/A N/A N/A $ 67,282 22,957 1,854 6,118 $ 66,980 9,727 — 16,828 0.5 % N/A N/A N/A Same Store Stabilized Non-Comparable (1) Lease Up Dispositions and other non-lease up developments (2) 12,064 4,529 1,619 703 11,850 3,786 109 3,055 1.8 % N/A N/A N/A 24,185 8,946 2,512 2,643 23,785 7,088 206 6,101 1.7 % N/A N/A N/A Same Store Stabilized Non-Comparable (1) Lease Up Dispositions and other non-lease up developments (2) 21,748 7,361 (166) 255 21,779 1,895 (109) 5,395 (0.1)% N/A N/A N/A 43,097 14,011 (658) 3,475 43,195 2,639 (206) 10,727 (0.2)% N/A N/A N/A See Reconciliation of Proportionate NOI to net income (loss) on page 18. (1) Includes a multifamily community classified as held for sale as of June 30, 2017 and sold in July 2017. (2) See page 30 for listing of communities sold in 2017 and 2016. © Monogram Residential Trust, Inc. 19 Total Proportionate NOI$29,198$28,9600.8 % $59,925$56,3556.3 % Proportionate NOI Total proportionate property operating expenses, including real estate taxes18,91518,8000.6 %38,28637,1803.0 % Proportionate property operating expenses, including real estate taxes Total proportionate rental revenue48,11347,7600.7 %98,21193,5355.0 % Proportionate rental revenue Six Months Ended June 30, 20172016Growth Three Months Ended June 30, 20172016Growth
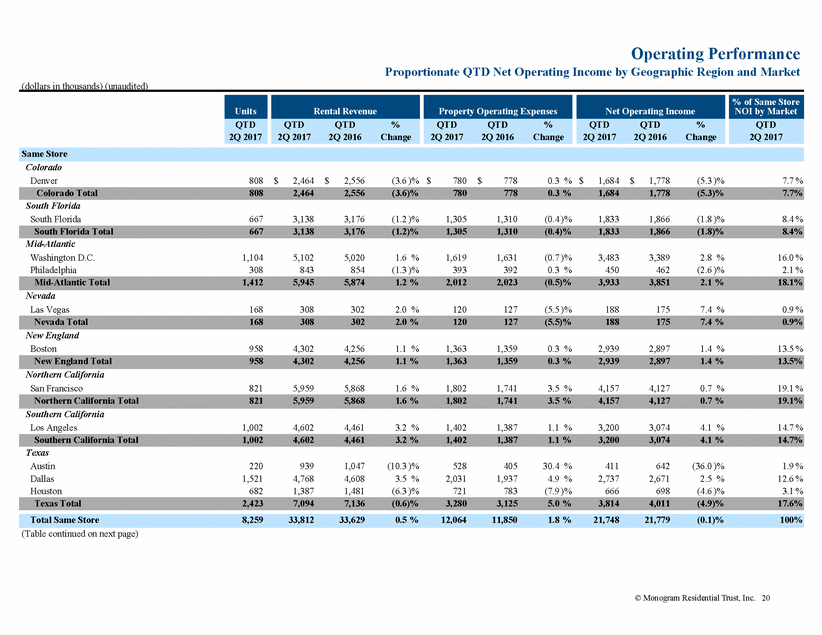
Operating Performance Proportionate QTD Net Operating Income by Geographic Region and Market (dollars in thousands) (unaudited) Colorado Denver 808 $ 2,464 $ 2,556 (3.6 )% $ 780 $ 778 0.3 % $ 1,684 $ 1,778 (5.3 )% 7.7 % South Florida South Florida 667 3,138 3,176 (1.2 )% 1,305 1,310 (0.4 )% 1,833 1,866 (1.8 )% 8.4 % Mid-Atlantic Washington D.C. Philadelphia 1,104 308 5,102 843 5,020 854 1.6 % (1.3 )% 1,619 393 1,631 392 (0.7 )% 0.3 % 3,483 450 3,389 462 2.8 % (2.6 )% 16.0 % 2.1 % Nevada Las Vegas 168 308 302 2.0 % 120 127 (5.5 )% 188 175 7.4 % 0.9 % New England Boston 958 4,302 4,256 1.1 % 1,363 1,359 0.3 % 2,939 2,897 1.4 % 13.5 % Northern California San Francisco 821 5,959 5,868 1.6 % 1,802 1,741 3.5 % 4,157 4,127 0.7 % 19.1 % Southern California Los Angeles 1,002 4,602 4,461 3.2 % 1,402 1,387 1.1 % 3,200 3,074 4.1 % 14.7 % Texas Austin Dallas Houston 220 1,521 682 939 4,768 1,387 1,047 4,608 1,481 (10.3 )% 3.5 % (6.3 )% 528 2,031 721 405 1,937 783 30.4 % 4.9 % (7.9 )% 411 2,737 666 642 2,671 698 (36.0 )% 2.5 % (4.6 )% 1.9 % 12.6 % 3.1 % (Table continued on next page) © Monogram Residential Trust, Inc. 20 Total Same Store8,25933,81233,6290.5 %12,06411,8501.8 %21,74821,779(0.1)%100% Texas Total2,4237,0947,136(0.6)%3,2803,1255.0 %3,8144,011(4.9)%17.6% Southern California Total1,0024,6024,4613.2 %1,4021,3871.1 %3,2003,0744.1 %14.7% Northern California Total8215,9595,8681.6 %1,8021,7413.5 %4,1574,1270.7 %19.1% New England Total9584,3024,2561.1 %1,3631,3590.3 %2,9392,8971.4 %13.5% Nevada Total1683083022.0 %120127(5.5)%1881757.4 %0.9% Mid-Atlantic Total1,4125,9455,8741.2 %2,0122,023(0.5)%3,9333,8512.1 %18.1% South Florida Total6673,1383,176(1.2)%1,3051,310(0.4)%1,8331,866(1.8)%8.4% Colorado Total8082,4642,556(3.6)%7807780.3 %1,6841,778(5.3)%7.7% Same Store % of Same Store NOI by Market QTD 2Q 2017 Net Operating Income QTDQTD% 2Q 20172Q 2016Change Property Operating Expenses QTDQTD% 2Q 20172Q 2016Change Rental Revenue QTDQTD% 2Q 20172Q 2016Change Units QTD 2Q 2017
Operating Performance Proportionate QTD Net Operating Income by Geographic Region and Market (dollars in thousands) (unaudited) South Florida South Florida 538 2,282 626 N/A 891 656 N/A 1,391 (30) N/A N/A Georgia Atlanta 329 1,118 979 N/A 447 435 N/A 671 544 N/A N/A Mid-Atlantic Washington D.C 461 1,527 413 N/A 601 559 N/A 926 (146) N/A N/A Nevada Las Vegas (1) 430 1,552 1,475 5.2 % 450 484 (7.0 )% 1,102 991 11.2 % N/A New England Boston 392 1,471 350 N/A 513 399 N/A 958 (49) N/A N/A Northern California San Francisco 121 681 181 N/A 284 169 N/A 397 12 N/A N/A Southern California San Diego 652 3,259 1,657 N/A 1,343 1,084 N/A 1,916 573 N/A N/A South Florida Mid-Atlantic Southern California Texas 146 265 175 365 35 310 634 474 — — — — N/A N/A N/A N/A 103 374 661 481 — — — 109 N/A N/A N/A N/A (68) (64) (27) (7) — — — (109) N/A N/A N/A N/A N/A N/A N/A N/A Note: Property operating expenses (including real estate taxes) from QTD Detail Recap of FFO on page 9 differ from the amounts above due to reclassifications between FFO line items (e.g., start up expenses). (1) The multifamily community was classified as held for sale as of June 30, 2017 and sold in July 2017. © Monogram Residential Trust, Inc. 21 Total Portfolio12,133$ 48,113$ 47,7600.7 % $ 18,915$ 18,8000.6 % $ 29,198$ 28,9600.8 %N/A Dispositions and other non-lease up developments—9588,450N/A7033,055N/A2555,395N/AN/A Total Lease up9511,453—N/A1,619109N/A(166)(109)N/AN/A Lease up (includes operating and development communities) Total Stabilized Non-Comparable2,92311,8905,681109 %4,5293,78620 %7,3611,895288 %N/A Southern California Total6523,2591,657N/A1,3431,084N/A1,916573N/AN/A Northern California Total121681181N/A284169N/A39712N/AN/A New England Total3921,471350N/A513399N/A958(49)N/AN/A Nevada Total4301,5521,4755.2 %450484(7.0)%1,10299111.2 %N/A Mid-Atlantic Total4611,527413N/A601559N/A926(146)N/AN/A Georgia Total3291,118979N/A447435N/A671544N/AN/A South Florida Total5382,282626N/A891656N/A1,391(30)N/AN/A Stabilized Non-Comparable % of Same Store NOI by Market QTD 2Q 2017 Net Operating Income QTDQTD% 2Q 20172Q 2016Change Property Operating Expenses QTDQTD% 2Q 20172Q 2016Change Rental Revenue QTDQTD% 2Q 20172Q 2016Change Units QTD 2Q 2017
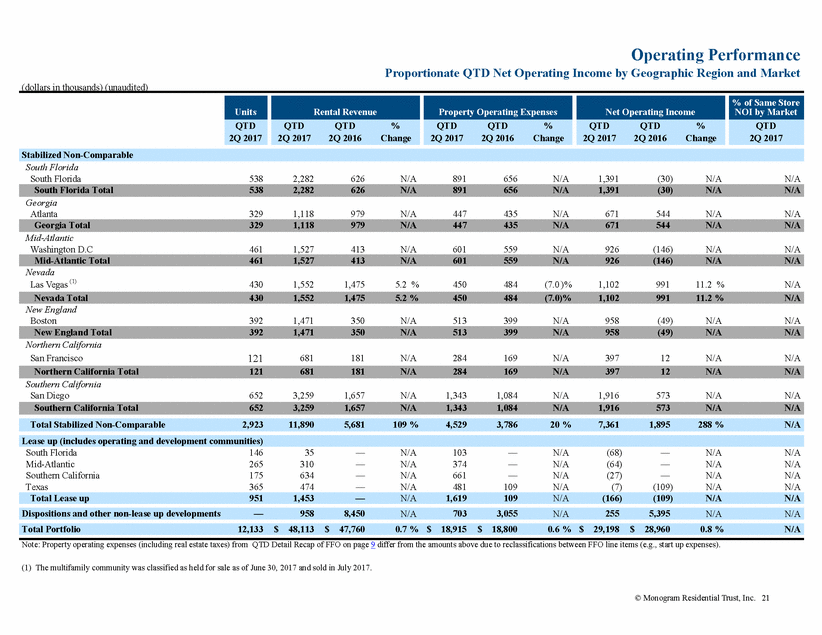
Operating Performance Proportionate YTD Net Operating Income by Geographic Region and Market (dollars in thousands) (unaudited) Colorado Denver 808 $ 4,910 $ 5,124 (4.2 )% $ 1,433 $ 1,495 (4.1 )% $ 3,477 $ 3,629 (4.2 )% 8.1 % South Florida 667 6,380 6,283 1.5 % 2,574 2,593 (0.7 )% 3,806 3,690 3.1 % 8.8 % Mid-Atlantic Washington D.C. Philadelphia 1,104 308 10,121 1,678 9,983 1,702 1.4 % (1.4 )% 3,208 772 3,258 785 (1.5 )% (1.7 )% 6,913 906 6,725 917 2.8 % (1.2 )% 16.0 % 2.1 % Nevada Las Vegas 168 604 594 1.7 % 238 248 (4.0 )% 366 346 5.8 % 0.8 % New England Boston 958 8,513 8,402 1.3 % 2,921 2,799 4.4 % 5,592 5,603 (0.2 )% 13.0 % Northern California San Francisco 821 11,822 11,733 0.8 % 3,653 3,534 3.4 % 8,169 8,199 (0.4 )% 19.0 % Southern California Los Angeles 1,002 9,141 8,881 2.9 % 2,822 2,742 2.9 % 6,319 6,139 2.9 % 14.7 % Texas Austin Dallas Houston 220 1,521 682 1,893 9,428 2,792 2,048 9,215 3,015 (7.6 )% 2.3 % (7.4 )% 1,012 4,086 1,466 804 3,954 1,573 25.9 % 3.3 % (6.8 )% 881 5,342 1,326 1,244 5,261 1,442 (29.2 )% 1.5 % (8.0 )% 2.0 % 12.4 % 3.1 % (Table continued on next page) © Monogram Residential Trust, Inc. 22 Total Same Store8,25967,28266,9800.5 %24,18523,7851.7 %43,09743,195(0.2)%100.0% Texas Total2,42314,11314,278(1.2)%6,5646,3313.7 %7,5497,947(5.0)%17.5% Southern California Total1,0029,1418,8812.9 %2,8222,7422.9 %6,3196,1392.9 %14.7% Northern California Total82111,82211,7330.8 %3,6533,5343.4 %8,1698,199(0.4)%19.0% New England Total9588,5138,4021.3 %2,9212,7994.4 %5,5925,603(0.2)%13.0% Nevada Total1686045941.7 %238248(4.0)%3663465.8 %0.8% Mid-Atlantic Total1,41211,79911,6851.0 %3,9804,043(1.6)%7,8197,6422.3 %18.1% South Florida Total6676,3806,2831.5 %2,5742,593(0.7)%3,8063,6903.1 %8.8% Colorado Total8084,9105,124(4.2)%1,4331,495(4.1)%3,4773,629(4.2)%8.1% Same Store % of Same Store NOI by Market YTD 2Q 2017 Net Operating Income YTDYTD% 2Q 20172Q 2016Change Property Operating Expenses YTDYTD% 2Q 20172Q 2016Change Rental Revenue YTDYTD% 2Q 20172Q 2016Change Units YTD 2Q 2017
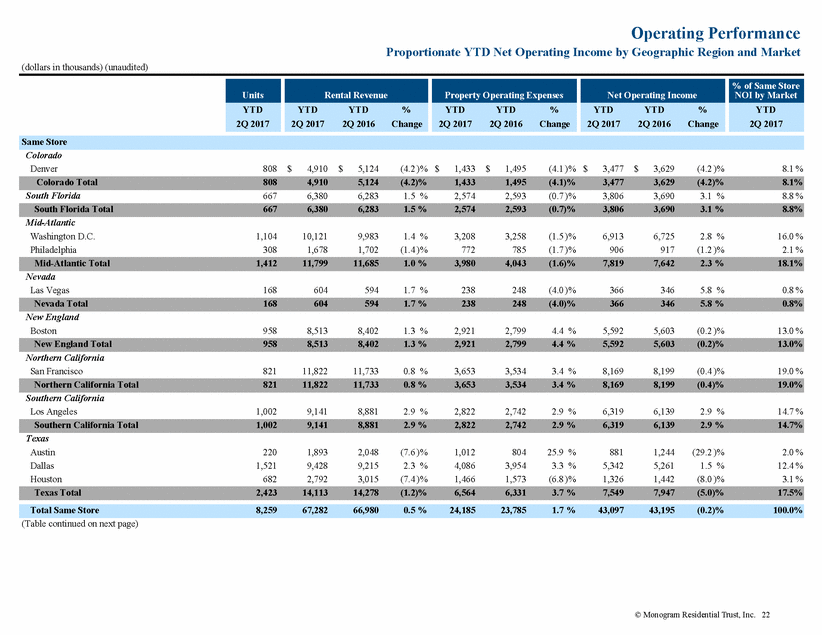
Operating Performance Proportionate YTD Net Operating Income by Geographic Region and Market (dollars in thousands) (unaudited) South Florida 538 4,411 981 N/A 1,802 1,131 N/A 2,609 (150) N/A N/A Georgia Atlanta 329 2,200 1,789 N/A 851 819 N/A 1,349 970 N/A N/A Mid-Atlantic Washington D.C 461 2,761 579 N/A 1,177 1,115 N/A 1,584 (536) N/A N/A Nevada Las Vegas (1) 430 3,062 2,906 5.4 % 908 922 (1.5 )% 2,154 1,984 8.6 % N/A New England Boston 392 2,707 568 N/A 979 797 N/A 1,728 (229) N/A N/A Northern California San Francisco 121 1,335 188 N/A 595 241 N/A 740 (53) N/A N/A Southern California San Diego 652 6,481 2,716 N/A 2,634 2,063 N/A 3,847 653 N/A N/A South Florida Mid-Atlantic Southern California Texas 146 265 175 365 36 310 712 796 — — — — N/A N/A N/A N/A 148 374 1,071 919 2 — — 204 N/A N/A N/A N/A (112) (64) (359) (123) (2) — — (204) N/A N/A N/A N/A N/A N/A N/A N/A Note: Property operating expenses (including real estate taxes) from YTD Detail Recap of FFO on page 10 differ from the amounts above due to reclassifications between FFO line items (e.g., start up expenses). (1) The multifamily community was classified as held for sale as of June 30, 2017 and sold in July 2017. © Monogram Residential Trust, Inc. 23 Total Portfolio12,133$ 98,211$ 93,5355.0 % $ 38,286$ 37,1803.0 % $ 59,925$ 56,3556.3 %N/A Dispositions and other non-lease up developments—6,11816,828N/A2,6436,101N/A3,47510,727N/AN/A Total Lease up9511,854—N/A2,512206N/A(658)(206)N/AN/A Lease up (includes operating and development communities) Total Stabilized Non-Comparable2,92322,9579,727136 %8,9467,08826 %14,0112,639431 %N/A Southern California Total6526,4812,716N/A2,6342,063N/A3,847653N/AN/A Northern California Total1211,335188N/A595241N/A740(53)N/AN/A New England Total3922,707568N/A979797N/A1,728(229)N/AN/A Nevada Total4303,0622,9065.4 %908922(1.5)%2,1541,9848.6 %N/A Mid-Atlantic Total4612,761579N/A1,1771,115N/A1,584(536)N/AN/A Georgia Total3292,2001,789N/A851819N/A1,349970N/AN/A South Florida Total5384,411981N/A1,8021,131N/A2,609(150)N/AN/A Stabilized Non-Comparable % of Same Store NOI by Market YTD 2Q 2017 Net Operating Income YTDYTD% 2Q 20172Q 2016Change Property Operating Expenses YTDYTD% 2Q 20172Q 2016Change Rental Revenue YTDYTD% 2Q 20172Q 2016Change Units YTD 2Q 2017
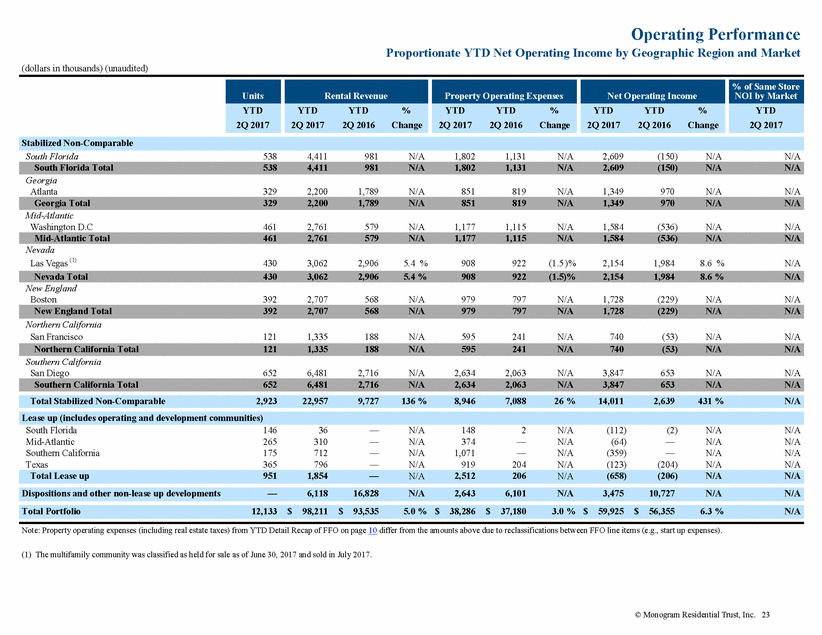
Operating Metrics Consolidated QTD and YTD Operating Metrics by Geographic Region and Market (1) Colorado Denver 808 68.4 % 69.6 % 70.8 % 70.8 % 96.5 % 93.2 % 94.0 % 94.2 % $ 1,864 $ 1,879 South Florida 667 58.3 % 59.3 % 59.7 % 59.4 % 93.0 % 96.1 % 92.9 % 96.7 % 2,156 2,176 Mid-Atlantic Washington D.C. Philadelphia 1,104 308 67.6 % 53.4 % 66.4 % 54.2 % 67.6 % 54.0 % 66.3 % 53.9 % 95.2 % 94.8 % 95.0 % 95.5 % 95.6 % 94.0 % 95.2 % 95.5 % 2,096 1,636 2,083 1,619 Nevada Las Vegas 168 61.0 % 57.9 % 60.6 % 58.2 % 97.6 % 96.4 % 95.8 % 96.6 % 1,040 1,027 New England Boston 958 68.3 % 68.8 % 66.1 % 67.4 % 96.9 % 97.2 % 97.1 % 97.6 % 1,795 1,768 Northern California San Francisco 821 69.8 % 70.4 % 69.3 % 70.0 % 97.1 % 96.8 % 96.1 % 95.8 % 3,062 3,058 Southern California Los Angeles 1,002 69.8 % 69.1 % 69.4 % 69.4 % 95.7 % 96.0 % 95.6 % 96.3 % 2,395 2,346 Texas Austin Dallas Houston 220 1,521 682 43.8 % 55.7 % 48.0 % 61.3 % 55.9 % 47.2 % 46.5 % 55.4 % 47.5 % 60.7 % 55.8 % 47.8 % 97.7 % 95.7 % 95.0 % 94.5 % 94.3 % 93.3 % 95.0 % 95.5 % 95.5 % 94.4 % 94.0 % 92.0 % 2,651 1,536 1,230 2,983 1,521 1,291 (Table continued on next page) © Monogram Residential Trust, Inc. 24 Total Same Store8,25963.7 %64.2 %63.6 %64.1 %95.8 %95.2 %95.4 %95.2 % $1,977$1,979 Texas Total2,42352.2 %54.8 %52.3 %54.7 %95.7 %94.1 %95.5 %93.5 %1,5511,589 Southern California Total1,00269.8 %69.1 %69.4 %69.4 %95.7 %96.0 %95.6 %96.3 %2,3952,346 Northern California Total82169.8 %70.4 %69.3 %70.0 %97.1 %96.8 %96.1 %95.8 %3,0623,058 New England Total95868.3 %68.8 %66.1 %67.4 %96.9 %97.2 %97.1 %97.6 %1,7951,768 Nevada Total16861.0 %57.9 %60.6 %58.2 %97.6 %96.4 %95.8 %96.6 %1,0401,027 Mid-Atlantic Total1,41265.2 %64.3 %65.2 %64.1 %95.1 %95.1 %95.2 %95.3 %1,9961,982 South Florida Total66758.3 %59.3 %59.7 %59.4 %93.0 %96.1 %92.9 %96.7 %2,1562,176 Colorado Total80868.4 %69.6 %70.8 %70.8 %96.5 %93.2 %94.0 %94.2 %1,8641,879 Same Store Monthly Rental Revenue per Unit QTDQTD 2Q 20172Q 2016 Weighted Average Occupancy QTDQTD 2Q 20172Q 2016 Period End Occupancy QTDQTD 2Q 20172Q 2016 Operating Margin YTDYTD 2Q 20172Q 2016 Operating Margin QTDQTD 2Q 20172Q 2016 Units QTD 2Q 2017
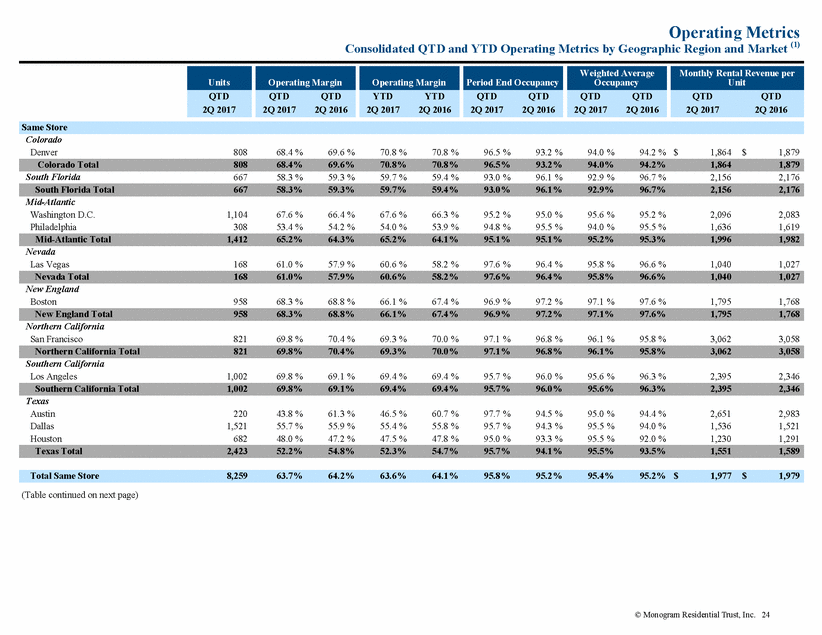
Operating Metrics Consolidated QTD and YTD Operating Metrics by Geographic Region and Market (1) South Florida 538 62.0 % N/A 60.7 % N/A 95.0 % 51.1 % 96.1 % 32.8 % 2,157 N/A Georgia Atlanta 329 60.0 % N/A 61.3 % N/A 90.3 % 92.4 % 94.3 % 88.0 % 2,016 N/A Mid-Atlantic Washington D.C 461 60.6 % N/A 57.4 % N/A 92.2 % 39.5 % 84.5 % 28.5 % 2,485 N/A Nevada Las Vegas (2) 430 71.0 % N/A 70.3 % N/A 97.2 % 95.8 % 97.9 % 95.5 % 1,152 N/A New England Boston 392 65.1 % N/A 63.8 % N/A 91.3 % 39.3 % 83.8 % 28.2 % 2,854 N/A Northern California San Francisco 121 58.4 % N/A 55.4 % N/A 94.2 % 44.6 % 96.4 % 30.3 % 3,416 N/A Southern California San Diego 652 59.0 % N/A 59.4 % N/A 95.6 % 80.7 % 95.7 % 62.9 % 2,064 N/A South Florida Mid-Atlantic Southern California Texas 146 265 175 365 N/A N/A N/A N/A N/A N/A N/A N/A N/A N/A N/A N/A N/A N/A N/A N/A 20.6 % 34.7 % 54.3 % 69.6 % N/A N/A N/A N/A 6.4 % 17.5 % 40.6 % 55.2 % N/A N/A N/A N/A N/A N/A N/A N/A N/A N/A N/A N/A (1) Operating margin and monthly rental revenue per unit are only provided for communities that are stabilized as of the end of the applicable period. Such metrics are not meaningful prior to stabilization. (2) The multifamily community was classified as held for sale as of June 30, 2017 and sold in July 2017. © Monogram Residential Trust, Inc. 25 Total Lease up951N/AN/AN/AN/A49.5 %N/A34.5 %N/AN/AN/A Lease up (includes operating and development communities) Total Stabilized11,18263.2 %N/A62.9 %N/A95.3 %87.4 %94.6 %84.3 %2,027N/A Total Stabilized Non-Comparable2,92361.9 %N/A60.9 %N/A93.9 %65.2 %92.6 %53.6 %2,170N/A Southern California Total65259.0 %N/A59.4 %N/A95.6 %80.7 %95.7 %62.9 %2,064N/A Northern California Total12158.4 %N/A55.4 %N/A94.2 %44.6 %96.4 %30.3 %3,416N/A New England Total39265.1 %N/A63.8 %N/A91.3 %39.3 %83.8 %28.2 %2,854N/A Nevada Total43071.0 %N/A70.3 %N/A97.2 %95.8 %97.9 %95.5 %1,152N/A Mid-Atlantic Total46160.6 %N/A57.4 %N/A92.2 %39.5 %84.5 %28.5 %2,485N/A Georgia Total32960.0 %N/A61.3 %N/A90.3 %92.4 %94.3 %88.0 %2,016N/A South Florida Total53862.0 %N/A60.7 %N/A95.0 %51.1 %96.1 %32.8 %2,157N/A Stabilized Non-Comparable Monthly Rental Revenue per Unit QTDQTD 2Q 20172Q 2016 Weighted Average Occupancy QTDQTD 2Q 20172Q 2016 Period End Occupancy QTDQTD 2Q 20172Q 2016 Operating Margin YTDYTD 2Q 20172Q 2016 Operating Margin QTDQTD 2Q 20172Q 2016 Units QTD 2Q 2017
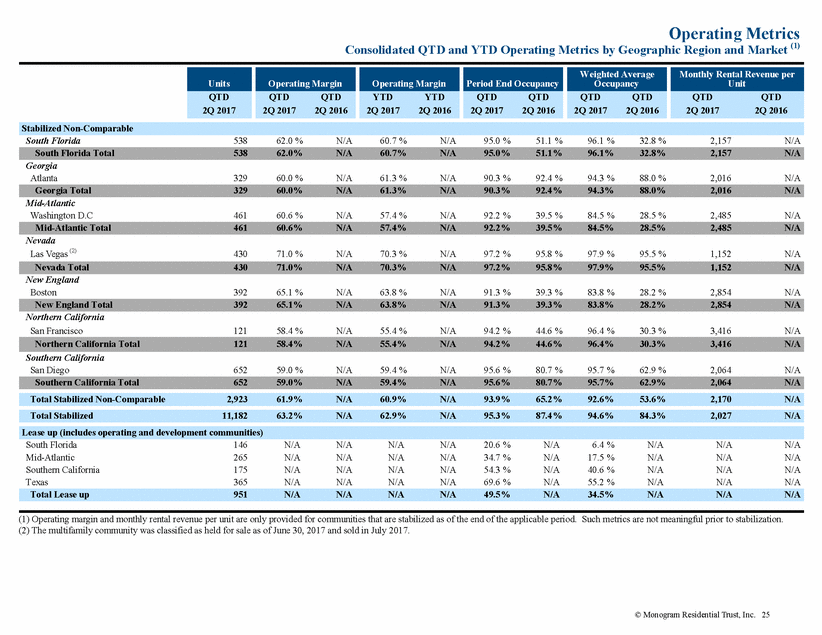
Operating Metrics Consolidated QTD and YTD Same Store Operating Expenses (dollars in thousands) (unaudited) Same Store Properties - Consolidated Detailed Comparison by Major Operating Expense Categories Onsite management Marketing Repairs and maintenance, including expensed turnover costs Utilities Insurance Real estate taxes Other $ 4,521 686 3,147 1,833 428 7,565 153 $ 4,657 690 3,155 1,727 460 7,184 124 $ (136) (4) (8) 106 (32) 381 29 (2.9)% (0.6)% (0.3)% 6.1 % (7.0)% 5.3 % 23.4 % $ 9,094 1,325 6,014 3,672 884 15,235 298 $ 9,322 1,268 6,011 3,539 935 14,625 270 $ (228) 57 3 133 (51) 610 28 (2.4)% 4.5 % — % 3.8 % (5.5)% 4.2 % 10.4 % Same Store Properties - Consolidated Percentage of Total Operating Expenses Onsite management Marketing Repairs and maintenance, including expensed turnover costs Utilities Insurance Real estate taxes Other 24.7 % 3.7 % 17.2 % 10.0 % 2.3 % 41.3 % 0.8 % 25.9 % 3.8 % 17.5 % 9.6 % 2.6 % 39.9 % 0.7 % 24.9 % 3.6 % 16.5 % 10.1 % 2.4 % 41.7 % 0.8 % 25.9 % 3.5 % 16.7 % 9.8 % 2.6 % 40.7 % 0.8 % © Monogram Residential Trust, Inc. 26 Total Operating Expenses100%100%100%100% Six Months Ended June 30, 20172016 Three Months Ended June 30, 20172016 Total Operating Expenses$18,333$17,997$3361.9 % $36,522$35,970$5521.5 % Six Months Ended June 30, 20172016$ Change% Change Three Months Ended June 30, 20172016$ Change% Change
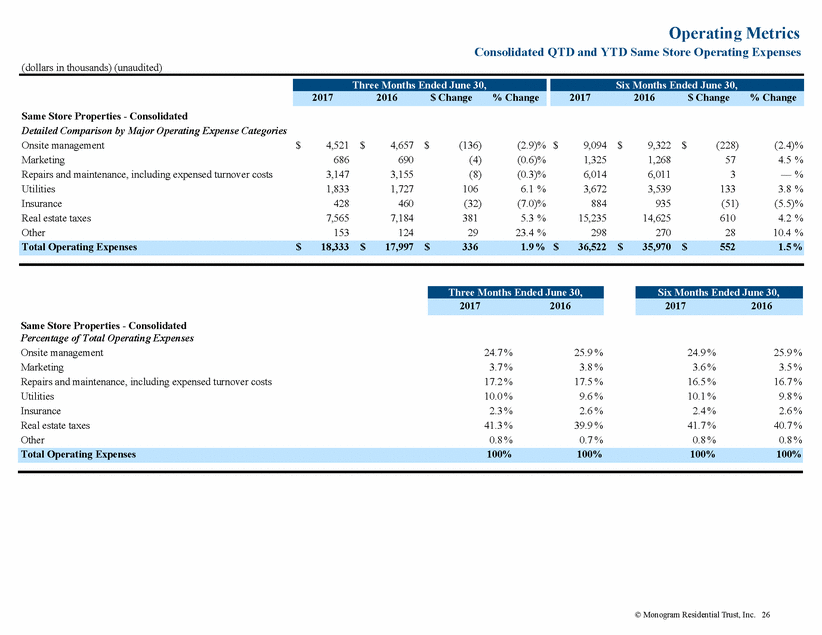
Operating Metrics Consolidated Capital Expenditures-Same Store (dollars in thousands, except per unit amounts) (unaudited) Recurring Non-Recurring Revenue Producing $ 600 2,143 355 $ 507 1,228 428 18.3 % 74.5 % (17.1)% $ 1,093 3,438 701 $ 845 1,881 988 29.3 % 82.8 % (29.0)% Recurring Non-Recurring Revenue Producing $ 73 259 43 $ 61 149 52 19.7 % 73.8 % (17.3)% $ 132 416 85 $ 102 228 120 29.4 % 82.5 % (29.2)% Recurring Non-Recurring Revenue Producing 1.2 % 4.2 % 0.7 % 1.0 % 2.4 % 0.9 % 1.1 % 3.4 % 0.7 % 0.8 % 1.9 % 1.0 % © Monogram Residential Trust, Inc. 27 Total capital expenditures as a percentage of rental revenue - Same Store6.1%4.3%5.2%3.7% Capital Expenditures as a Percentage of Rental Revenue - Same Store Total capital expenditures per unit - Same Store$375$26243.1 % $633$45040.7 % Capital Expenditures per Unit - Same Store Total capital expenditures - Same Store$3,098$2,16343.2 % $5,232$3,71440.9 % Capital Expenditures - Same Store Six Months Ended June 30, 20172016% Change Three Months Ended June 30, 20172016% Change
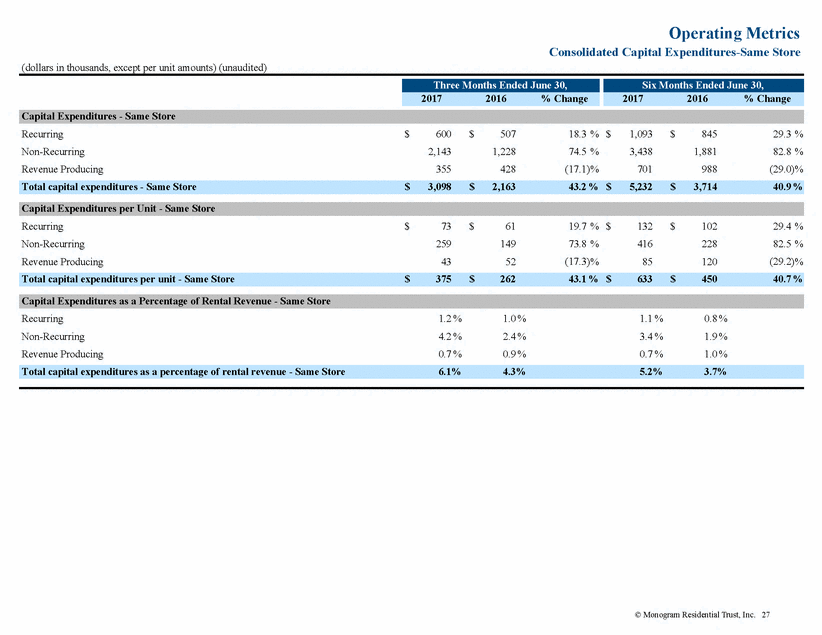
Operating Metrics Consolidated QTD General and Administrative and Corporate Property Management Expenses (dollars in thousands) (unaudited) For the Three Months Ended June 30, 2017 Total General and administrative and corporate property management expenses (1) Less: Asset management and property management fee income (2) $ 3,589 (370) $ 1,881 (887) $ 5,470 (1,257) $ 21,880 (5,028) Assets under management: Note: A common financial metric to present general and administrative expense efficiency is to calculate general and administrative expenses as a percent of assets under management for revenues and gross asset costs (costs prior to accumulated depreciation and amortization). We believe calculating these ratios is useful to our investors and analysts as it reflects performance related to the general and administrative expenses on a consolidated basis, which includes enterprise-wide results and our economic share of fee income. Our presentation also reflects expenses net of stock compensation expense and annualized amounts, which we believe provides for a more consistent comparison to other real estate companies. We also include annualized calculations from the latest quarter; however, the last quarter may not be reflective in all cases of full year results. (1) General and administrative expenses exclude stock compensation expense of $1.1 million and merger-related expenses of $2.8 million (reported as its own line item on the consolidated statement of operations). Corporate property management expenses exclude stock compensation expense of $0.1 million. (2) Asset management and property management fee income represent fee income earned by the Company from the noncontrolling interests’ share of operations. As all of our joint ventures are consolidated, this fee income is eliminated upon consolidation. (3) Total consolidated gross assets, which adds back accumulated depreciation and amortization, is included as a benchmark metric as it is representative of the Company’s assets under management, and is calculated as follows: Total assets per page 4 Accumulated depreciation per page 4 Accumulated depreciation of corporate assets Accumulated amortization of intangibles Total gross assets under management $ 3,270,714 460,038 1,476 32,493 $ 3,764,721 © Monogram Residential Trust, Inc. 28 Net Expenses as percentage of Total Consolidated Gross Assets (3)0.08%0.03%0.11%0.45% Net Expenses as percentage of Total Consolidated Revenue4.5%1.4%5.9%5.9% Net Expenses$3,219$994$4,213$16,852 Annualized Expenses Total Expenses Corporate Property Management Expenses General and Administrative Expenses
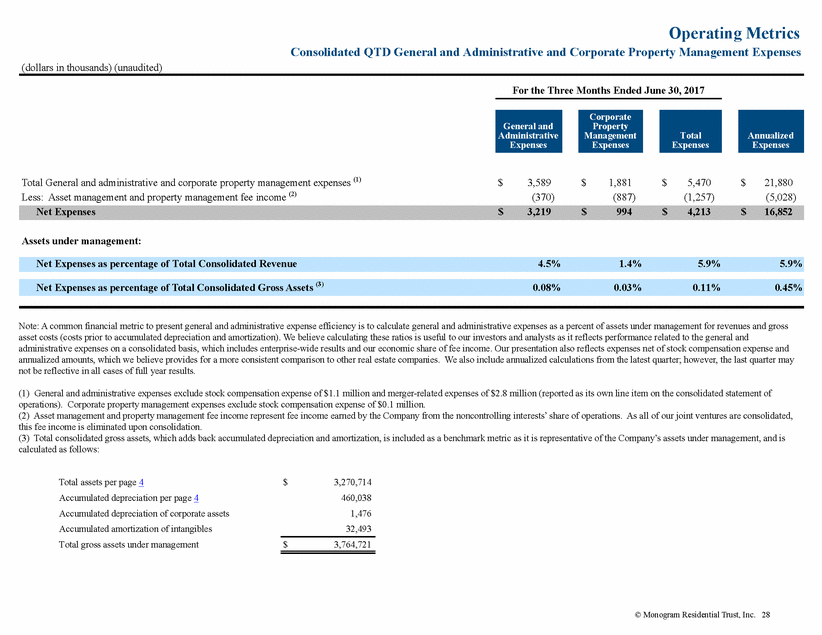
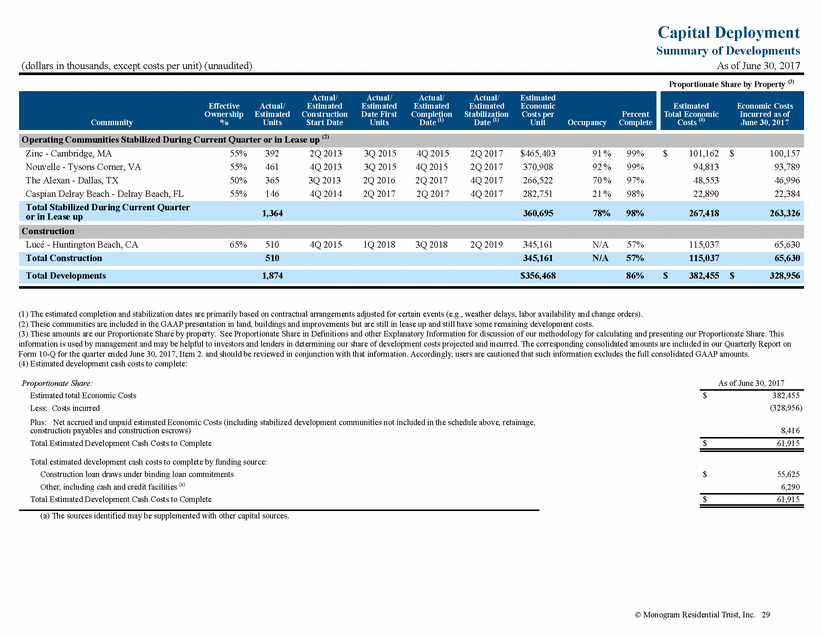
Capital Deployment Summary of Developments As of June 30, 2017 (dollars in thousands, except costs per unit) (unaudited) Proportionate Share by Property (3) Costs (4) June 30, 2017 Zinc - Cambridge, MA Nouvelle - Tysons Corner, VA The Alexan - Dallas, TX Caspian Delray Beach - Delray Beach, FL 55% 55% 50% 55% 392 461 365 146 2Q 2013 4Q 2013 3Q 2013 4Q 2014 3Q 2015 3Q 2015 2Q 2016 2Q 2017 4Q 2015 4Q 2015 2Q 2017 2Q 2017 2Q 2017 2Q 2017 4Q 2017 4Q 2017 $465,403 370,908 266,522 282,751 91 % 92 % 70 % 21 % 99% 99% 97% 98% $ 101,162 94,813 48,553 22,890 $ 100,157 93,789 46,996 22,384 1,364 360,695 78% 98% 267,418 263,326 or in Lease up Lucé - Huntington Beach, CA 65% 510 4Q 2015 1Q 2018 3Q 2018 2Q 2019 345,161 N/A 57% 115,037 65,630 (1) The estimated completion and stabilization dates are primarily based on contractual arrangements adjusted for certain events (e.g., weather delays, labor availability and change orders). (2) These communities are included in the GAAP presentation in land, buildings and improvements but are still in lease up and still have some remaining development costs. (3) These amounts are our Proportionate Share by property. See Proportionate Share in Definitions and other Explanatory Information for discussion of our methodology for calculating and presenting our Proportionate Share. This information is used by management and may be helpful to investors and lenders in determining our share of development costs projected and incurred. The corresponding consolidated amounts are included in our Quarterly Report on Form 10-Q for the quarter ended June 30, 2017, Item 2. and should be reviewed in conjunction with that information. Accordingly, users are cautioned that such information excludes the full consolidated GAAP amounts. (4) Estimated development cash costs to complete: Proportionate Share: Estimated total Economic Costs Less: Costs incurred As of June 30, 2017 $ 382,455 (328,956) Plus: Net accrued and unpaid estimated Economic Costs (including stabilized development communities not included in the schedule above, retainage, construction payables and construction escrows) Total Estimated Development Cash Costs to Complete 8,416 $ 61,915 Total estimated development cash costs to complete by funding source: Construction loan draws under binding loan commitments Other, including cash and credit facilities (a) Total Estimated Development Cash Costs to Complete $ 55,625 6,290 $ 61,915 (a) The sources identified may be supplemented with other capital sources. © Monogram Residential Trust, Inc. 29 Total Developments1,874$356,46886%$382,455$328,956 Total Construction510345,161N/A57%115,03765,630 Construction Total Stabilized During Current Quarter Operating Communities Stabilized During Current Quarter or in Lease up (2) EstimatedEconomic Costs Total EconomicIncurred as of Actual/Actual/Actual/Actual/Estimated EffectiveActual/EstimatedEstimatedEstimatedEstimatedEconomic OwnershipEstimatedConstructionDate FirstCompletionStabilizationCosts perPercent Community%UnitsStart DateUnitsDate (1) Date (1) UnitOccupancyComplete
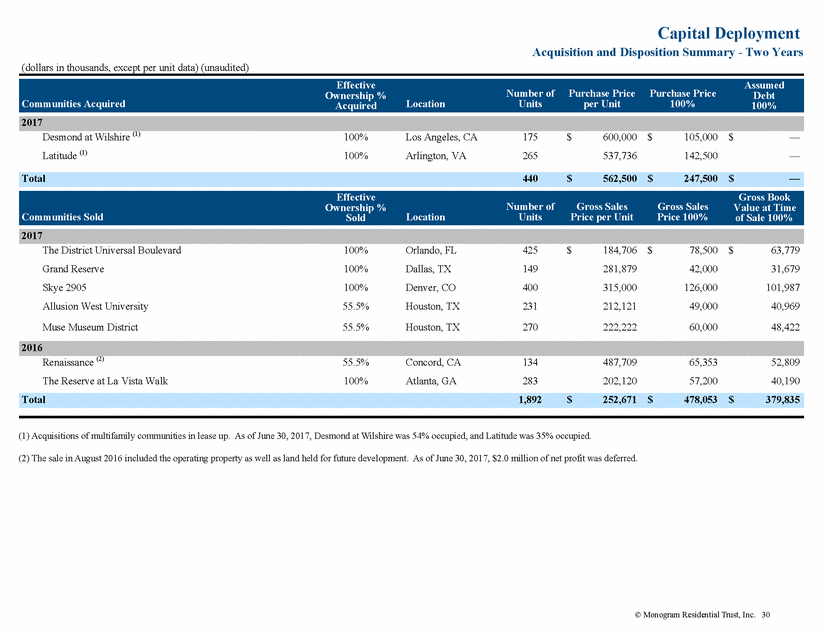
Capital Deployment Acquisition and Disposition Summary - Two Years (dollars in thousands, except per unit data) (unaudited) Number of Purchase Price Purchase Price Ownership % Debt Desmond at Wilshire (1) 100% 100% Los Angeles, CA Arlington, VA 175 265 $ 600,000 537,736 $ 105,000 142,500 $ — — Latitude (1) Number of Gross Sales Gross Sales Ownership % Value at Time The District Universal Boulevard Grand Reserve Skye 2905 Allusion West University Muse Museum District 100% 100% 100% 55.5% 55.5% Orlando, FL Dallas, TX Denver, CO Houston, TX Houston, TX 425 149 400 231 270 $ 184,706 281,879 315,000 212,121 222,222 $ 78,500 42,000 126,000 49,000 60,000 $ 63,779 31,679 101,987 40,969 48,422 Renaissance (2) 55.5% 100% Concord, CA Atlanta, GA 134 283 487,709 202,120 65,353 57,200 52,809 40,190 The Reserve at La Vista Walk (1) Acquisitions of multifamily communities in lease up. As of June 30, 2017, Desmond at Wilshire was 54% occupied, and Latitude was 35% occupied. (2) The sale in August 2016 included the operating property as well as land held for future development. As of June 30, 2017, $2.0 million of net profit was deferred. © Monogram Residential Trust, Inc. 30 Total1,892$252,671$478,053$379,835 2016 2017 EffectiveGross Book Communities SoldSoldLocationUnitsPrice per UnitPrice 100%of Sale 100% Total440$562,500$247,500$— 2017 EffectiveAssumed Communities AcquiredAcquiredLocationUnitsper Unit100%100%
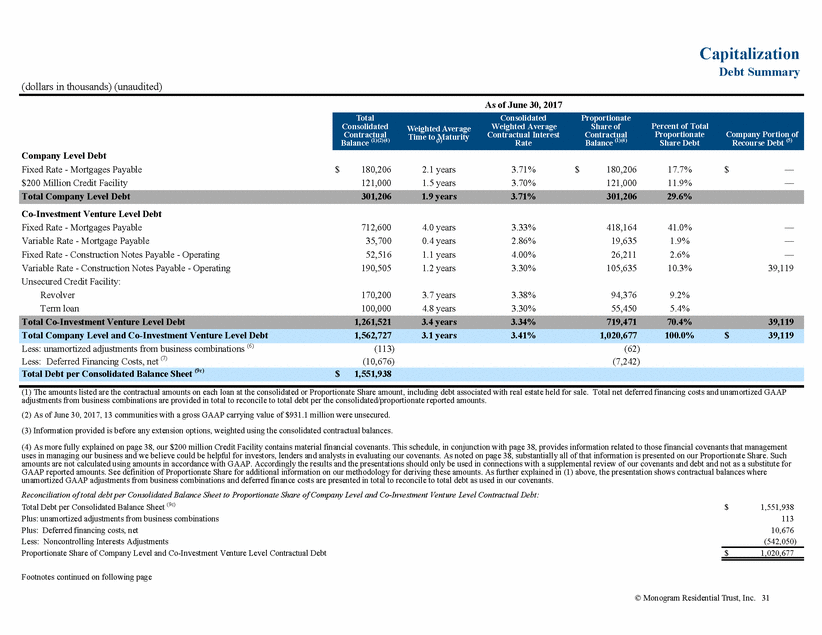
Capitalization Debt Summary (dollars in thousands) (unaudited) As of June 30, 2017 Consolidated Balance (1)(2)(4) Weighted Average Rate Share of Balance (1)(4) Percent of Total Share Debt Weighted Average (3) Recourse Debt (5) Company Level Debt Fixed Rate - Mortgages Payable $200 Million Credit Facility $ 180,206 121,000 2.1 years 1.5 years 3.71% 3.70% $ 180,206 121,000 17.7% 11.9% $ — — Co-Investment Venture Level Debt Fixed Rate - Mortgages Payable Variable Rate - Mortgage Payable Fixed Rate - Construction Notes Payable - Operating Variable Rate - Construction Notes Payable - Operating Unsecured Credit Facility: Revolver Term loan 712,600 35,700 52,516 190,505 4.0 years 0.4 years 1.1 years 1.2 years 3.33% 2.86% 4.00% 3.30% 418,164 19,635 26,211 105,635 41.0% 1.9% 2.6% 10.3% — — — 39,119 170,200 100,000 3.7 years 4.8 years 3.38% 3.30% 94,376 55,450 9.2% 5.4% Less: unamortized adjustments from business combinations (6) (113) (10,676) (62) (7,242) Less: Deferred Financing Costs, net (7) (1) The amounts listed are the contractual amounts on each loan at the consolidated or Proportionate Share amount, including debt associated with real estate held for sale. Total net deferred financing costs and unamortized GAAP adjustments from business combinations are provided in total to reconcile to total debt per the consolidated/proportionate reported amounts. (2) As of June 30, 2017, 13 communities with a gross GAAP carrying value of $931.1 million were unsecured. (3) Information provided is before any extension options, weighted using the consolidated contractual balances. (4) As more fully explained on page 38, our $200 million Credit Facility contains material financial covenants. This schedule, in conjunction with page 38, provides information related to those financial covenants that management uses in managing our business and we believe could be helpful for investors, lenders and analysts in evaluating our covenants. As noted on page 38, substantially all of that information is presented on our Proportionate Share. Such amounts are not calculated using amounts in accordance with GAAP. Accordingly the results and the presentations should only be used in connections with a supplemental review of our covenants and debt and not as a substitute for GAAP reported amounts. See definition of Proportionate Share for additional information on our methodology for deriving these amounts. As further explained in (1) above, the presentation shows contractual balances where unamortized GAAP adjustments from business combinations and deferred finance costs are presented in total to reconcile to total debt as used in our covenants. Reconciliation of total debt per Consolidated Balance Sheet to Proportionate Share of Company Level and Co-Investment Venture Level Contractual Debt: Total Debt per Consolidated Balance Sheet (9c) Plus: unamortized adjustments from business combinations Plus: Deferred financing costs, net Less: Noncontrolling Interests Adjustments Proportionate Share of Company Level and Co-Investment Venture Level Contractual Debt $ 1,551,938 113 10,676 (542,050) $ 1,020,677 Footnotes continued on following page © Monogram Residential Trust, Inc. 31 Total Debt per Consolidated Balance Sheet (9c) $1,551,938 Total Co-Investment Venture Level Debt1,261,5213.4 years3.34%719,47170.4%39,119 Total Company Level and Co-Investment Venture Level Debt1,562,7273.1 years3.41%1,020,677100.0%$39,119 Total Company Level Debt301,2061.9 years3.71%301,20629.6% TotalConsolidatedProportionate ContractualTime to MaturityContractual InterestContractualProportionateCompany Portion of
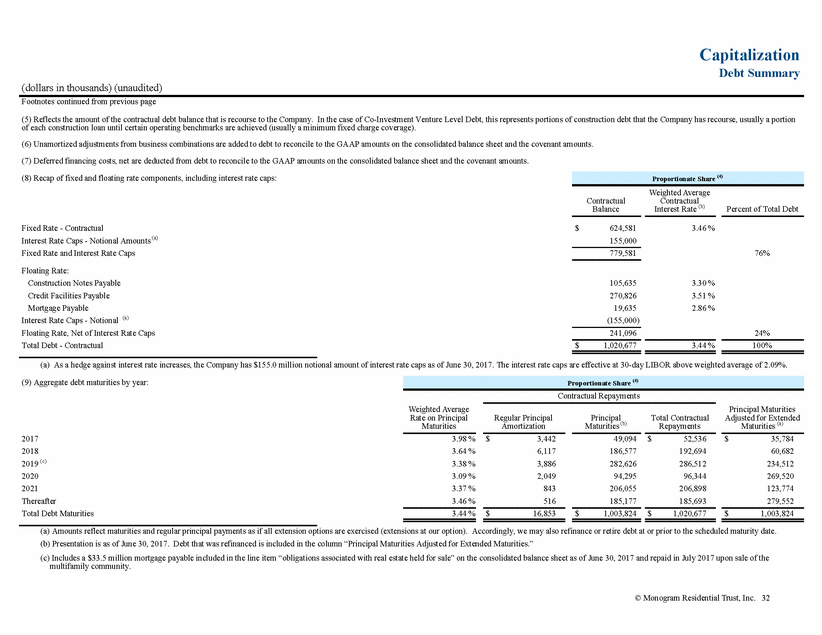
Capitalization Debt Summary (dollars in thousands) (unaudited) Footnotes continued from previous page (5) Reflects the amount of the contractual debt balance that is recourse to the Company. In the case of Co-Investment Venture Level Debt, this represents portions of construction debt that the Company has recourse, usually a portion of each construction loan until certain operating benchmarks are achieved (usually a minimum fixed charge coverage). (6) Unamortized adjustments from business combinations are added to debt to reconcile to the GAAP amounts on the consolidated balance sheet and the covenant amounts. (7) Deferred financing costs, net are deducted from debt to reconcile to the GAAP amounts on the consolidated balance sheet and the covenant amounts. (8) Recap of fixed and floating rate components, including interest rate caps: Weighted Average Contractual Interest Rate (b) Contractual Balance Percent of Total Debt Fixed Rate - Contractual Interest Rate Caps - Notional Amounts (a) Fixed Rate and Interest Rate Caps $ 624,581 155,000 3.46 % 779,581 76% Floating Rate: Construction Notes Payable Credit Facilities Payable Mortgage Payable Interest Rate Caps - Notional (a) Floating Rate, Net of Interest Rate Caps Total Debt - Contractual 105,635 270,826 19,635 (155,000) 3.30 % 3.51 % 2.86 % 241,096 24% $ 1,020,677 3.44 % 100% (a) As a hedge against interest rate increases, the Company has $155.0 million notional amount of interest rate caps as of June 30, 2017. The interest rate caps are effective at 30-day LIBOR above weighted average of 2.09%. (9) Aggregate debt maturities by year: Contractual Repayments Weighted Average Rate on Principal Maturities Principal Maturities Adjusted for Extended Maturities (a) Regular Principal Amortization Principal Maturities (b) Total Contractual Repayments 2017 2018 2019 (c) 2020 2021 Thereafter Total Debt Maturities 3.98 % 3.64 % 3.38 % 3.09 % 3.37 % 3.46 % $ 3,442 6,117 3,886 2,049 843 516 49,094 186,577 282,626 94,295 206,055 185,177 $ 52,536 192,694 286,512 96,344 206,898 185,693 $ 35,784 60,682 234,512 269,520 123,774 279,552 3.44 % $ 16,853 $ 1,003,824 $ 1,020,677 $ 1,003,824 (a) Amounts reflect maturities and regular principal payments as if all extension options are exercised (extensions at our option). Accordingly, we may also refinance or retire debt at or prior to the scheduled maturity date. (b) Presentation is as of June 30, 2017. Debt that was refinanced is included in the column “Principal Maturities Adjusted for Extended Maturities.” (c) Includes a $33.5 million mortgage payable included in the line item “obligations associated with real estate held for sale” on the consolidated balance sheet as of June 30, 2017 and repaid in July 2017 upon sale of the multifamily community. © Monogram Residential Trust, Inc. 32 Proportionate Share (4) Proportionate Share (4)
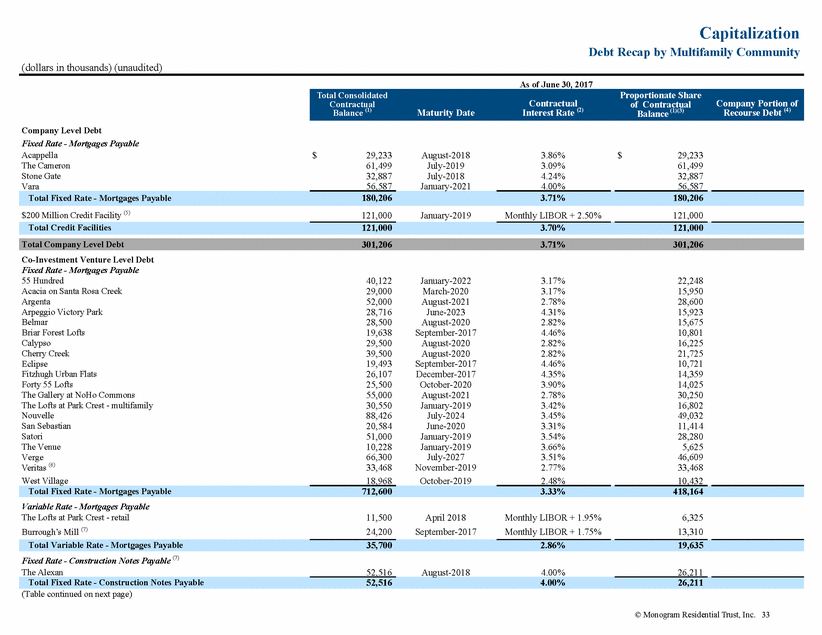
Capitalization Debt Recap by Multifamily Community (dollars in thousands) (unaudited) As of June 30, 2017 Contractual Company Portion of Contractual of Contractual Company Level Debt Fixed Rate - Mortgages Payable Acappella The Cameron Stone Gate Vara $ 29,233 61,499 32,887 56,587 August-2018 July-2019 July-2018 January-2021 3.86% 3.09% 4.24% 4.00% $ 29,233 61,499 32,887 56,587 $200 Million Credit Facility (5) 121,000 January-2019 Monthly LIBOR + 2.50% 121,000 Co-Investment Venture Level Debt Fixed Rate - Mortgages Payable 55 Hundred Acacia on Santa Rosa Creek Argenta Arpeggio Victory Park Belmar Briar Forest Lofts Calypso Cherry Creek Eclipse Fitzhugh Urban Flats Forty 55 Lofts The Gallery at NoHo Commons The Lofts at Park Crest - multifamily Nouvelle San Sebastian Satori The Venue Verge Veritas (6) West Village 40,122 29,000 52,000 28,716 28,500 19,638 29,500 39,500 19,493 26,107 25,500 55,000 30,550 88,426 20,584 51,000 10,228 66,300 33,468 18,968 January-2022 March-2020 August-2021 June-2023 August-2020 September-2017 August-2020 August-2020 September-2017 December-2017 October-2020 August-2021 January-2019 July-2024 June-2020 January-2019 January-2019 July-2027 November-2019 October-2019 3.17% 3.17% 2.78% 4.31% 2.82% 4.46% 2.82% 2.82% 4.46% 4.35% 3.90% 2.78% 3.42% 3.45% 3.31% 3.54% 3.66% 3.51% 2.77% 2.48% 22,248 15,950 28,600 15,923 15,675 10,801 16,225 21,725 10,721 14,359 14,025 30,250 16,802 49,032 11,414 28,280 5,625 46,609 33,468 10,432 Variable Rate - Mortgages Payable The Lofts at Park Crest - retail Burrough’s Mill (7) 11,500 24,200 April 2018 September-2017 Monthly LIBOR + 1.95% Monthly LIBOR + 1.75% 6,325 13,310 Fixed Rate - Construction Notes Payable (7) The Alexan 52,516 August-2018 4.00% 26,211 (Table continued on next page) © Monogram Residential Trust, Inc. 33 Total Fixed Rate - Construction Notes Payable52,5164.00%26,211 Total Variable Rate - Mortgages Payable35,7002.86%19,635 Total Fixed Rate - Mortgages Payable712,6003.33%418,164 Total Company Level Debt301,2063.71%301,206 Total Credit Facilities121,0003.70%121,000 Total Fixed Rate - Mortgages Payable180,2063.71%180,206 Total ConsolidatedProportionate Share Balance (1)Maturity DateInterest Rate (2) Balance (1)(3) Recourse Debt (4)
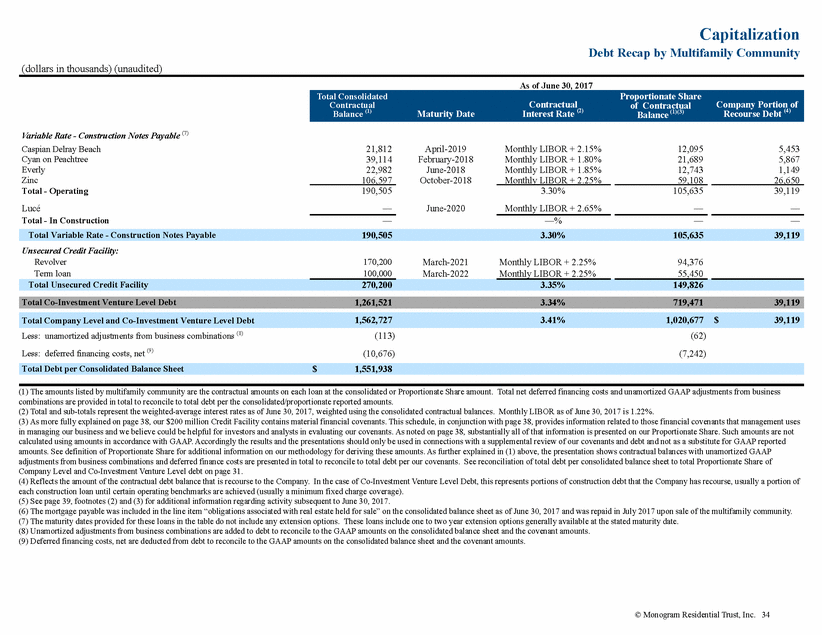
Capitalization Debt Recap by Multifamily Community (dollars in thousands) (unaudited) As of June 30, 2017 Contractual Company Portion of Contractual of Contractual Variable Rate - Construction Notes Payable (7) Caspian Delray Beach Cyan on Peachtree Everly Zinc Total - Operating Lucé Total - In Construction 21,812 39,114 22,982 106,597 April-2019 February-2018 June-2018 October-2018 Monthly LIBOR + 2.15% Monthly LIBOR + 1.80% Monthly LIBOR + 1.85% 12,095 21,689 12,743 5,453 5,867 1,149 Monthly LIBOR + 2.25% 59,108 26,650 190,505 — 3.30% Monthly LIBOR + 2.65% 105,635 — 39,119 — June-2020 — —% — — Unsecured Credit Facility: Revolver Term loan March-2021 March-2022 Monthly LIBOR + 2.25% Monthly LIBOR + 2.25% 94,376 55,450 170,200 100,000 Less: unamortized adjustments from business combinations (8) Less: deferred financing costs, net (9) (113) (10,676) (62) (7,242) (1) The amounts listed by multifamily community are the contractual amounts on each loan at the consolidated or Proportionate Share amount. Total net deferred financing costs and unamortized GAAP adjustments from business combinations are provided in total to reconcile to total debt per the consolidated/proportionate reported amounts. (2) Total and sub-totals represent the weighted-average interest rates as of June 30, 2017, weighted using the consolidated contractual balances. Monthly LIBOR as of June 30, 2017 is 1.22%. (3) As more fully explained on page 38, our $200 million Credit Facility contains material financial covenants. This schedule, in conjunction with page 38, provides information related to those financial covenants that management uses in managing our business and we believe could be helpful for investors and analysts in evaluating our covenants. As noted on page 38, substantially all of that information is presented on our Proportionate Share. Such amounts are not calculated using amounts in accordance with GAAP. Accordingly the results and the presentations should only be used in connections with a supplemental review of our covenants and debt and not as a substitute for GAAP reported amounts. See definition of Proportionate Share for additional information on our methodology for deriving these amounts. As further explained in (1) above, the presentation shows contractual balances with unamortized GAAP adjustments from business combinations and deferred finance costs are presented in total to reconcile to total debt per our covenants. See reconciliation of total debt per consolidated balance sheet to total Proportionate Share of Company Level and Co-Investment Venture Level debt on page 31. (4) Reflects the amount of the contractual debt balance that is recourse to the Company. In the case of Co-Investment Venture Level Debt, this represents portions of construction debt that the Company has recourse, usually a portion of each construction loan until certain operating benchmarks are achieved (usually a minimum fixed charge coverage). (5) See page 39, footnotes (2) and (3) for additional information regarding activity subsequent to June 30, 2017. (6) The mortgage payable was included in the line item “obligations associated with real estate held for sale” on the consolidated balance sheet as of June 30, 2017 and was repaid in July 2017 upon sale of the multifamily community. (7) The maturity dates provided for these loans in the table do not include any extension options. These loans include one to two year extension options generally available at the stated maturity date. (8) Unamortized adjustments from business combinations are added to debt to reconcile to the GAAP amounts on the consolidated balance sheet and the covenant amounts. (9) Deferred financing costs, net are deducted from debt to reconcile to the GAAP amounts on the consolidated balance sheet and the covenant amounts. © Monogram Residential Trust, Inc. 34 Total Debt per Consolidated Balance Sheet$1,551,938 Total Company Level and Co-Investment Venture Level Debt1,562,7273.41%1,020,677$39,119 Total Co-Investment Venture Level Debt1,261,5213.34%719,47139,119 Total Unsecured Credit Facility270,2003.35%149,826 Total Variable Rate - Construction Notes Payable190,5053.30%105,63539,119 Total ConsolidatedProportionate Share Balance (1)Maturity DateInterest Rate (2) Balance (1)(3) Recourse Debt (4)
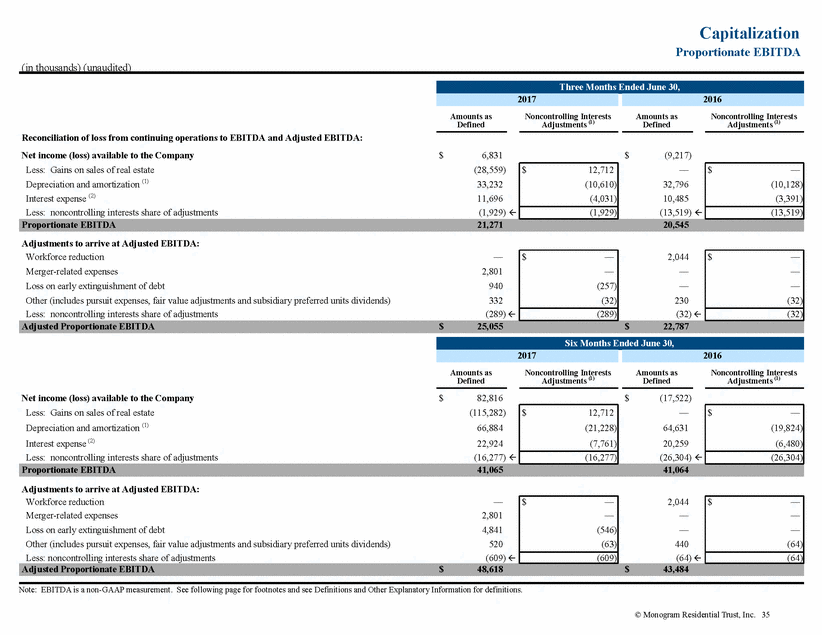
Capitalization Proportionate EBITDA (in thousands) (unaudited) Amounts as Defined Noncontrolling Interests Adjustments (1) Amounts as Defined Noncontrolling Interests Adjustments (1) Reconciliation of loss from continuing operations to EBITDA and Adjusted EBITDA: Net income (loss) available to the Company $ 6,831 $ (9,217) Adjustments to arrive at Adjusted EBITDA: Amounts as Defined Noncontrolling Interests Adjustments (1) Amounts as Defined Noncontrolling Interests Adjustments (1) Net income (loss) available to the Company $ 82,816 $ (17,522) Adjustments to arrive at Adjusted EBITDA: Note: EBITDA is a non-GAAP measurement. See following page for footnotes and see Definitions and Other Explanatory Information for definitions. © Monogram Residential Trust, Inc. 35 Workforce reduction— Merger-related expenses2,801 Loss on early extinguishment of debt4,841 Other (includes pursuit expenses, fair value adjustments and subsidiary preferred units dividends)520 Less: noncontrolling interests share of adjustments(609) $— — (546) (63) 2,044 — — 440 (64) $— — — (64) (609) (64) Adjusted Proportionate EBITDA$48,618$43,484 Less: Gains on sales of real estate(115,282) Depreciation and amortization (1) 66,884 Interest expense (2) 22,924 Less: noncontrolling interests share of adjustments(16,277) $12,712 (21,228) (7,761) — 64,631 20,259 (26,304) $— (19,824) (6,480) (16,277) (26,304) Proportionate EBITDA41,06541,064 Six Months Ended June 30, 2017 2016 Workforce reduction— Merger-related expenses2,801 Loss on early extinguishment of debt940 Other (includes pursuit expenses, fair value adjustments and subsidiary preferred units dividends)332 Less: noncontrolling interests share of adjustments(289) $— — (257) (32) 2,044 — — 230 (32) $— — — (32) (289) (32) Adjusted Proportionate EBITDA$25,055$22,787 Less: Gains on sales of real estate(28,559) Depreciation and amortization (1) 33,232 Interest expense (2) 11,696 Less: noncontrolling interests share of adjustments(1,929) $12,712 (10,610) (4,031) — 32,796 10,485 (13,519) $— (10,128) (3,391) (1,929) (13,519) Proportionate EBITDA21,27120,545 Three Months Ended June 30, 2017 2016
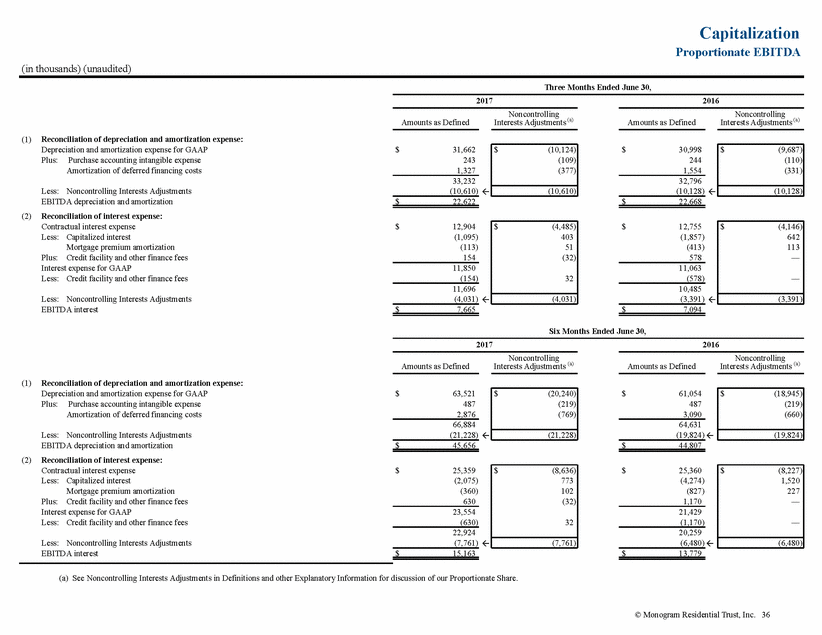
Capitalization Proportionate EBITDA (in thousands) (unaudited) Three Months Ended June 30, 2017 2016 Noncontrolling Interests Adjustments (a) Noncontrolling Interests Adjustments (a) Amounts as Defined Amounts as Defined Reconciliation of depreciation and amortization expense: Depreciation and amortization expense for GAAP Plus:Purchase accounting intangible expense Amortization of deferred financing costs (1) $ 31,662 243 1,327 $ 30,998 244 1,554 33,232 (10,610) 32,796 (10,128) Less: Noncontrolling Interests Adjustments EBITDA depreciation and amortization Reconciliation of interest expense: Contractual interest expense Less: Capitalized interest Mortgage premium amortization Plus: Credit facility and other finance fees Interest expense for GAAP Less: Credit facility and other finance fees $ 22,622 $ 22,668 (2) $ 12,904 (1,095) (113) 154 $ 12,755 (1,857) (413) 578 11,850 (154) 11,063 (578) 11,696 (4,031) 10,485 (3,391) Less: Noncontrolling Interests Adjustments EBITDA interest $ 7,665 $ 7,094 Six Months Ended June 30, 2017 2016 Noncontrolling Interests Adjustments (a) Noncontrolling Interests Adjustments (a) Amounts as Defined Amounts as Defined Reconciliation of depreciation and amortization expense: Depreciation and amortization expense for GAAP Plus:Purchase accounting intangible expense Amortization of deferred financing costs (1) $ 63,521 487 2,876 $ 61,054 487 3,090 66,884 (21,228) 64,631 (19,824) Less: Noncontrolling Interests Adjustments EBITDA depreciation and amortization Reconciliation of interest expense: Contractual interest expense Less: Capitalized interest Mortgage premium amortization Plus: Credit facility and other finance fees Interest expense for GAAP Less: Credit facility and other finance fees $ 45,656 $ 44,807 (2) $ 25,359 (2,075) (360) 630 $ 25,360 (4,274) (827) 1,170 23,554 (630) 21,429 (1,170) 22,924 (7,761) 20,259 (6,480) Less: Noncontrolling Interests Adjustments EBITDA interest $ 15,163 $ 13,779 (a) See Noncontrolling Interests Adjustments in Definitions and other Explanatory Information for discussion of our Proportionate Share. © Monogram Residential Trust, Inc. 36 $(8,227) 1,520 227 — — (6,480) $(8,636) 773 102 (32) 32 (7,761) $(18,945) (219) (660) (19,824) $(20,240) (219) (769) (21,228) $(4,146) 642 113 — — (3,391) $(4,485) 403 51 (32) 32 (4,031) $(9,687) (110) (331) (10,128) $(10,124) (109) (377) (10,610)
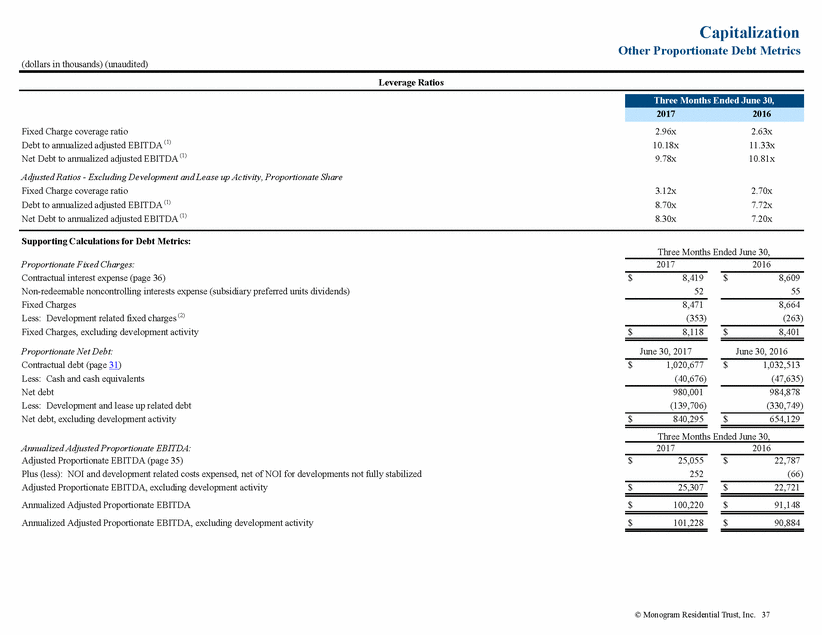
Capitalization Other Proportionate Debt Metrics (dollars in thousands) (unaudited) Leverage Ratios Fixed Charge coverage ratio Debt to annualized adjusted EBITDA (1) Net Debt to annualized adjusted EBITDA (1) Adjusted Ratios - Excluding Development and Lease up Activity, Proportionate Share Fixed Charge coverage ratio Debt to annualized adjusted EBITDA (1) Net Debt to annualized adjusted EBITDA (1) 2.96x 10.18x 9.78x 2.63x 11.33x 10.81x 3.12x 8.70x 8.30x 2.70x 7.72x 7.20x Supporting Calculations for Debt Metrics: Three Months Ended June 30, 2017 2016 Proportionate Fixed Charges: Contractual interest expense (page 36) Non-redeemable noncontrolling interests expense (subsidiary preferred units dividends) Fixed Charges Less: Development related fixed charges (2) Fixed Charges, excluding development activity $ 8,419 52 $ 8,609 55 8,471 (353) 8,664 (263) $ 8,118 $ 8,401 June 30, 2017 June 30, 2016 Proportionate Net Debt: Contractual debt (page 31) Less: Cash and cash equivalents Net debt Less: Development and lease up related debt Net debt, excluding development activity $ 1,020,677 (40,676) $ 1,032,513 (47,635) 980,001 (139,706) 984,878 (330,749) $ 840,295 $ 654,129 Three Months Ended June 30, 2017 2016 Annualized Adjusted Proportionate EBITDA: Adjusted Proportionate EBITDA (page 35) Plus (less): NOI and development related costs expensed, net of NOI for developments not fully stabilized Adjusted Proportionate EBITDA, excluding development activity Annualized Adjusted Proportionate EBITDA Annualized Adjusted Proportionate EBITDA, excluding development activity $ 25,055 252 $ 22,787 (66) $ 25,307 $ 22,721 $ 100,220 $ 91,148 $ 101,228 $ 90,884 © Monogram Residential Trust, Inc. 37 Three Months Ended June 30, 20172016
Capitalization Other Proportionate Debt Metrics (dollars in thousands) (unaudited) (1) Adjusted Proportionate EBITDA is annualized for last quarter for the respective reporting periods. (2) Represents interest expense related to developments and acquisitions in lease up during periods of operating deficits. (3) Our $200 million Credit Facility covenants, which constitute a material agreement and are included in our filed exhibits, are prepared on a Proportionate Share basis. We are in compliance with all of our debt covenants, including our $200 million Credit Facility. To assist in evaluating our covenant position, we have provided certain Proportionate Share information. We believe this information is useful to management, lenders and investors to evaluate our covenant compliance. However, this information differs from our reported consolidated GAAP amounts and users are cautioned to use such information in the limited content of covenant compliance. See page 31 for additional information concerning certain details of our debt. Assets (Liabilities) As of June 30, 2017 Cash Gross operating real estate Construction in progress Notes receivable Other tangible assets Mortgages and notes payable (contractual balances) Credit facility payable (contractual balance) Construction costs payable Accounts payable and other liabilities Distributions payable Tenant security deposits Redeemable noncontrolling interests Subsidiary preferred stock $ 40,676 2,257,809 71,326 26,890 23,737 (749,851) (270,826) (10,547) (21,736) (12,527) (4,356) (13,878) (1,259) Selected Operating Data For the Three Months Ended June 30, 2017 Contractual interest expense Capitalized interest Principal payments $ 8,419 692 1,781 © Monogram Residential Trust, Inc. 38
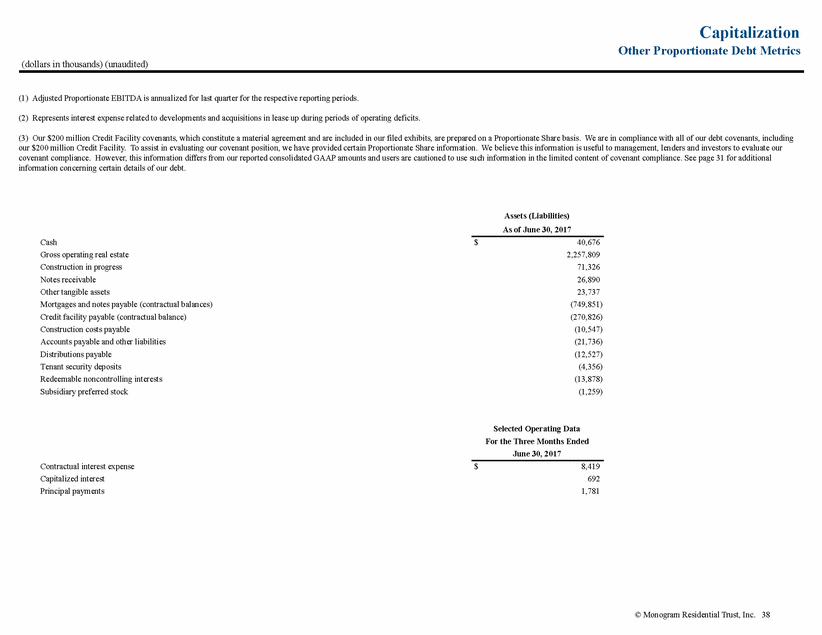
Capitalization Sources of Funds Available As of June 30, 2017 (dollars in thousands) (unaudited) Capacity (1) Commitment Outstanding Commitments Commitments $200 Million Credit Facility - 100% our share (2) $ 200,000 $ 200,000 $ 121,000 $ 79,000 $ — Unsecured Credit Facility - Proportionate Share (3) 166,350 162,022 149,826 12,196 — Construction notes payable - Proportionate Share (4) 187,251 187,251 131,846 55,405 — PGGM commitments (5) 300,000 300,000 263,696 2,791 33,513 Developer partner commitment 4,378 4,378 4,125 253 — Note: This schedule presents certain sources of capital available to the Company, exclusive of the sources available to our joint venture partners. Accordingly, all information, unless otherwise noted, is presented on our Proportionate Share. (1) Available capacity represents the amount of the maximum commitment that is available to be drawn based on current loan requirements (e.g. collateral, borrowing base). The amount currently drawn is reflected in the balance outstanding column. (2) The credit facility has an accordion feature, at our election, to increase the size of the facility to up to $400 million (proportionate share). Subsequent to June 30, 2017, in conjunction with our acquisitions and dispositions of multifamily communities and draws for working capital, our balance outstanding is currently $160 million and the amount available to draw is $40 million. (3) The credit facility has an accordion feature to increase the size of the facility up to $277.3 million (Proportionate Share). Subsequent to June 30, 2017, we paid down the credit facility by $22 million (Proportionate Share) and reduced available capacity by approximately $27 million (Proportionate Share). We may now draw approximately $6 million (Proportionate Share). We may add additional collateral which would increase our available capacity and the amount we can draw. Details of the balance outstanding are provided below and can also be found on the Debt Recap by Multifamily Community schedule on page 33: Consolidated Amounts as Defined Noncontrolling Interests Adjustments Proportionate Share Unsecured Credit Facility balance outstanding $ 270,200 $ (120,374) $ 149,826 (4) We may elect to not draw all amounts available to draw, and we may use other sources to fund our developments. Details of the reconciliation of the GAAP balance outstanding are provided below and can also be found on the Debt Recap by Multifamily Community schedule on page 33: Consolidated Amounts as Defined Noncontrolling Interests Adjustments Construction notes payable - balance outstanding: Fixed rate - operating Variable rate - operating Total Proportionate Share $ 52,516 190,505 $ (26,305) (84,870) $ 26,211 105,635 $ 243,021 $ (111,175) $ 131,846 (5) PGGM’s remaining commitments would apply to future investments. © Monogram Residential Trust, Inc. 39 MaximumAvailableBalanceUnfundedRemaining
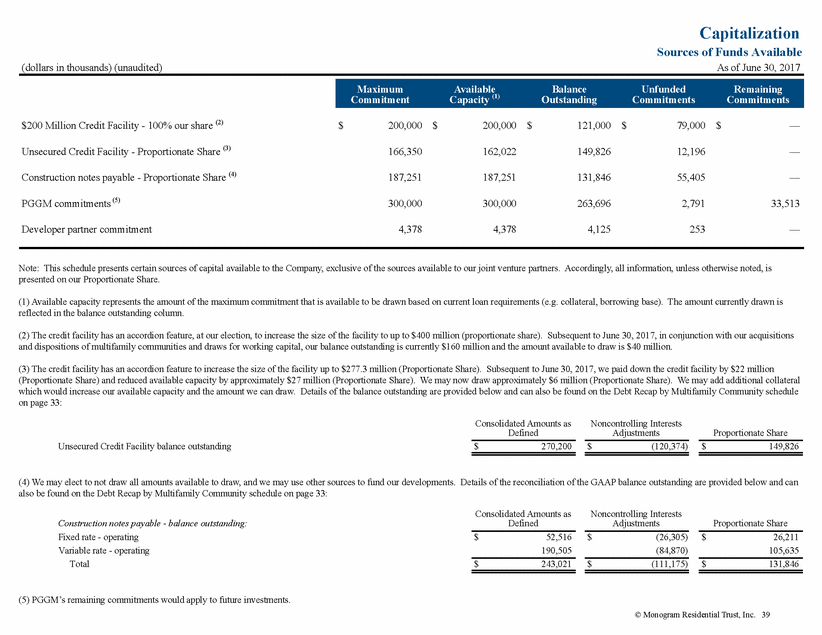
Co-Investment Venture Partners Information on Joint Ventures As of June 30, 2017 (dollars in thousands) (unaudited) Communities (1) Interests (2) Joint Venture Partner % Interests Commitments Stichting Depositary PGGM Private Real Estate Fund (“PGGM”) Operating portfolio - PGGM only Operating portfolio - includes other developer partners Development portfolio - includes other developer partners 4 14 1 45% 0% to 45% 45% $ 59,580 216,414 34,603 $ — 21,614 787 Milky Way Partners, L.P. (“NPS”) Developer partners Operating portfolio with developer partner (3) 2 —% (138) 1,115 (1) Certain multifamily communities are held through joint ventures with both PGGM and a developer partner which, for purposes of the presentation in this table, is included under the PGGM heading as one community. (2) Includes developer partner put options of $23.3 million which have been recorded as of June 30, 2017 in the consolidated balance sheet. (3) Interest ownership is primarily a back-end interest. © Monogram Residential Trust, Inc. 40 Total all joint venture partners35$416,961$23,516$3,044 Subsidiary preferred units2,031—— Total developer partners2—%(138)1,115— Operating portfolio1445%104,471—— Total PGGM related joint ventures190% to 45%310,59722,401$3,044 Range ofGAAPGAAP Number ofNoncontrollingNon -redeemableRedeemable MultifamilyInterest OwnershipNoncontrollingNoncontrollingUnfunded
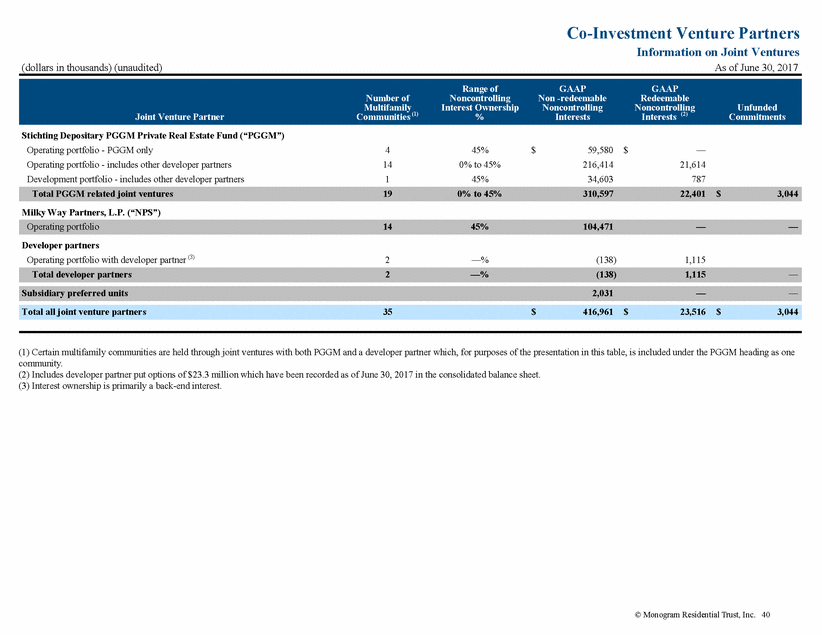
Equity Capitalization Common Stock and Common Stock Equivalents (unaudited) Common Stock and Common Stock Equivalents: Common stock (1) Dilutive securities: Restricted stock units Total common stock and common stock equivalents (2) - diluted 167,031,843 1,223,939 168,255,782 (1) The distribution declared and paid for the first quarter of 2017 and declared for the second quarter of 2017 was $0.075 per share. The regular distribution for the second quarter of 2017 was paid on July 7, 2017. In accordance with the Merger Agreement as defined and further discussed in our Quarterly Report on Form 10-Q for the quarter ended June 30, 2017, no future dividends are expected to be declared or paid through the closing of the Merger. (2) 1.0% of total common stock and common stock equivalents are held by employees and directors. © Monogram Residential Trust, Inc. 41 Shares/Units Outstanding as of June 30, 2017
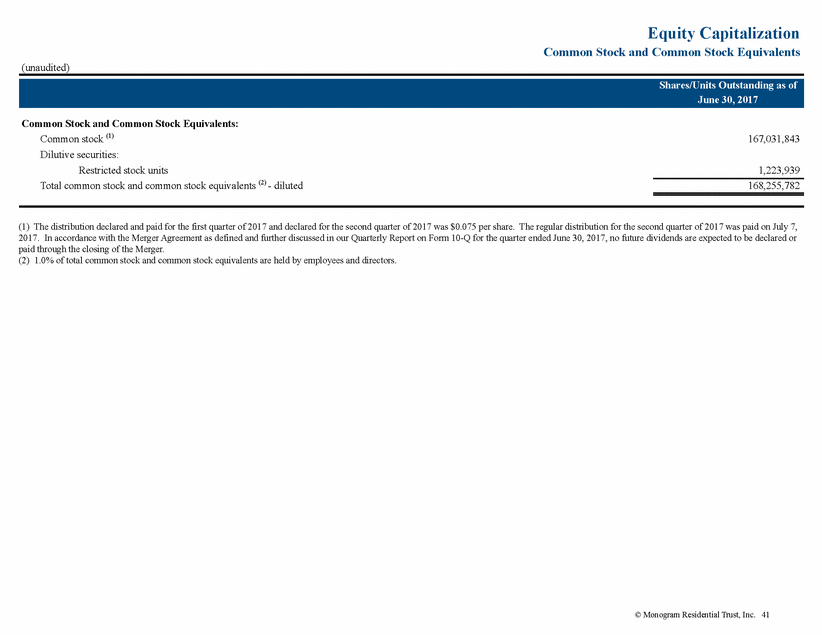
Net Asset Value Road Map to Net Asset Value (dollars in thousands) (unaudited) Property revenue - stabilized portfolio (1) $ 45,702 (16,593) (1,371) $ (4,550) 1,564 137 $ 41,152 (15,029) (1,234) Less: Property operating expenses, excluding property management expenses (1) Less: Assumed market rate property management fee at 3% of revenue Adjusted property Net Operating Income Annualized adjusted property Net Operating Income Third party asset management revenue (2) Third party property management revenue (2) $ 27,738 $ (2,849) $ 24,889 $ 110,952 370 887 $ (11,396) — — $ 99,556 370 887 Acquisitions in lease up and held for sale (3) Development - total Economic Costs incurred (4) Acquisitions in lease up, development and held for sale - total potential value creation (5) Master Partnership promote due to the Company (6) Developer promotes and put options, net (due by the Company) (7) $ 324,000 328,956 82,186 5,672 (35,355) $ — — — — — $ 324,000 328,956 82,186 5,672 (35,355) Net tangible assets/(liabilities) $ (879,425) $ 3,191 Common stock outstanding Restricted stock units outstanding Total common stock and common stock equivalents - diluted (See Notes to Road Map to Net Asset Value on next page) 167,031,843 1,223,939 168,255,782 © Monogram Residential Trust, Inc. 42 Fully Diluted Share Data Amounts as Defined Noncontrolling Interests Adjustments (8) Other Adjustments Selected Other Tangible Balance Sheet Data - Assets (Liabilities) Cash and cash equivalents$56,274 Notes receivable (9) 27,171 Tax like-kind exchange escrow148,313 Other tangible assets (10) 28,854 Mortgages and notes payable (11) (1,171,527) Credit facilities payable (11) (391,200) Subsidiary preferred stock— Other tangible liabilities (12) (68,107) Less: Noncontrolling Interests Adjustments490,797 $(15,598) — (48,220) (5,117) 421,676 120,374 (1,259) 18,941 $— — — — 3,191 — — — — 490,797 As of June 30, 2017 Adjustments As Adjusted Acquisitions in Lease Up, Development, Held for Sale and Joint Venture Data (Proportionate Share) Three Months Ended June 30, 2017 Adjustments As Adjusted Income Statement Data (Proportionate Share)
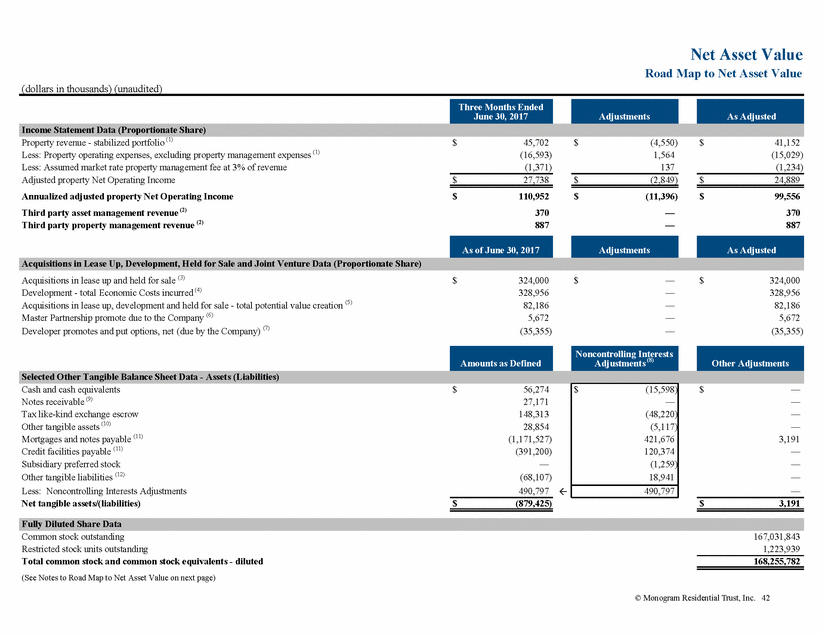
Net Asset Value Road Map to Net Asset Value (dollars in thousands) (unaudited) Notes to Road Map to Net Asset Value on page 42: Note: Estimating net asset value of our Company can be useful to both management and investors. While we do not provide any specific assumptions or methodologies and have not incorporated any information related to our proposed merger, we have provided certain information we believe could be useful in calculating our net asset value as of June 30, 2017. This information should also be reviewed in connection with our proposed merger and our preliminary proxy filed with the SEC on July 28, 2017. (1) Property revenue and property operating expenses-stabilized portfolio includes: Rental Revenue Property Operating Expenses Same Store per page 20 Stabilized Non-Comparable per page 21 $ 33,812 11,890 $ 12,064 4,529 Less: two multifamily communities not stabilized for the full second quarter of 2017 and one community held for sale at June 30 (a) (4,550) (1,564) $ 41,152 $ 15,029 (a) Includes Zinc and Nouvelle, which due to lease up and related concessions, were not at full stabilized operations for all of 2Q 2017. Includes Veritas, which was held for sale at June 30, 2017. (2) Represents our Proportionate Share of property and asset management revenue associated with third party joint venture assets per page 9. (3) Includes 2017 acquisitions of Desmond at Wilshire and Latitude (acquisitions in lease up). Amounts represents cost as of June 30, 2017. Also includes Veritas classified as held for sale as of June 30, 2017. See page 30 and see note 5 below. (4) Total Developments per page 29. (5) Value creation is equal to projected future stabilized value less total Economic Costs. The projected future stabilized value is based on the projected annual NOI at stabilization, less capital reserves divided by an estimated future capitalization rate, which includes a premium from the current capitalization rate to adjust for the period until stabilization. Total potential value creation represents the projected undiscounted total future value to be created at the stabilization date, before any selling expenses. (6) Projected promote due to the Company by PGGM based on current estimated portfolio value. (7) Our Proportionate Share of developers’ put options and amounts attributable to developer promotes. The amount included for developer promotes is calculated based on estimated valuations as of June 30, 2017. The developer promotes are not currently payable, where actual amounts, if any, are subject to future property sales prices, net of selling expenses, our capital account and our preferred return at the time of the property sale. (8) See Noncontrolling Interests Adjustments and Non-GAAP Measurements in Definitions and other Explanatory Information for discussion of our Proportionate Share and Non-GAAP Measurements. (9) Notes receivable is the contractual principal balance as presented on page 17. (Notes continued on next page) © Monogram Residential Trust, Inc. 43
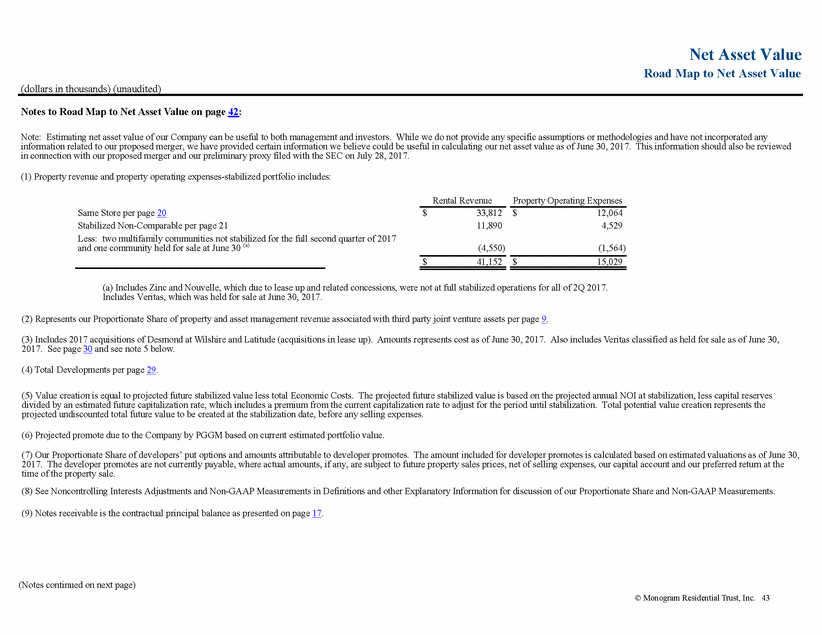
Net Asset Value Road Map to Net Asset Value (dollars in thousands) (unaudited) Notes to Road Map to Net Asset Value on page 42 (continued from previous page): (10) Other tangible assets, which are prepared on a basis consistent with our financial covenants include: Consolidated GAAP Amounts Noncontrolling Interests Adjustments Escrows and restricted cash Resident, tenant and other receivables Prepaid assets, deposits and other Total $ 5,449 9,160 14,245 $ (1,424) (1,227) (2,466) $ 28,854 $ (5,117) (11) Amounts in “amounts as defined” and “Noncontrolling Interests Adjustments” represent the contractual amounts. Mark-to-market adjustment to mortgages and notes payable are included in the Other Adjustments column. (12) Other tangible liabilities, which are prepared on a basis consistent with our financial covenants include: Consolidated GAAP Amounts Noncontrolling Interests Adjustments Construction costs payable Accounts payable and other liabilities Distributions payable Tenants security deposits Total $ (18,390) (30,922) (12,527) (6,268) $ 7,843 9,186 — 1,912 $ (68,107) $ 18,941 © Monogram Residential Trust, Inc. 44
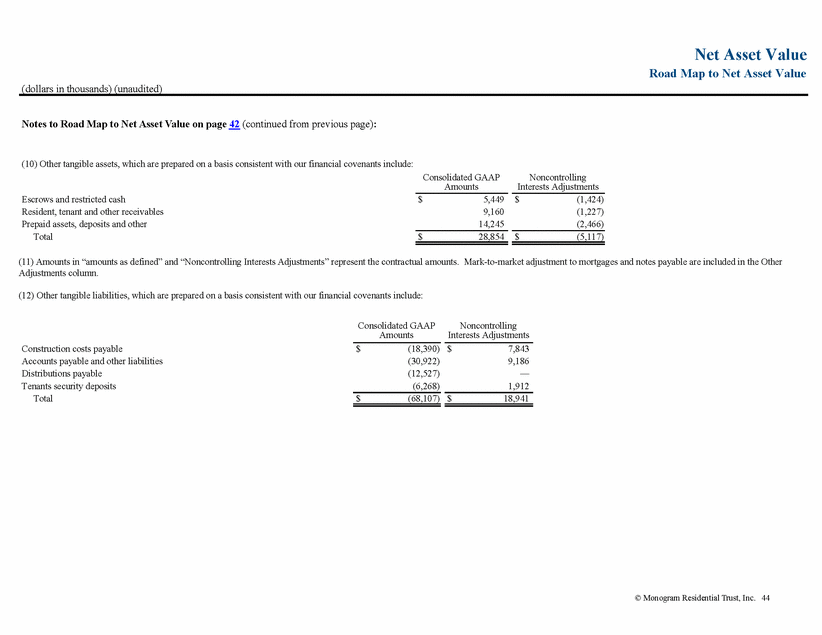
Definitions and other Explanatory Information Capital Expenditures Non-Recurring Amounts capitalized in accordance with GAAP related to property upgrades and building improvements, such as remodeling, investments in longer-lived assets and infrequent or unscheduled expenditures that are not considered Revenue Producing such as roofs, minor lobby renovations and parking lots. Recurring Amounts capitalized in accordance with GAAP that help preserve but generally do not increase the value and functionality of the community, such as replacements for appliances, carpeting and floorings, HVAC equipment, and individual unit turnover costs. Repairs and maintenance amounts are expensed as incurred. Revenue Producing Amounts capitalized in accordance with GAAP that are expected to directly increase rental rates, such as major renovations and rehabilitations of units and common areas, improvements to leasable areas, retail tenant improvements and leasing. Costs related to developments and entire community rehabilitations are not included in Revenue Producing. Community Classifications Construction A multifamily community is considered under development and construction once we have signed a general contractor’s agreement and vertical construction has begun and ends once lease up has started. Communities under construction are classified as construction in progress for GAAP presentation. Lease up A multifamily community is considered in lease up when the community has begun leasing. A temporary certificate of occupancy may be obtained as units are completed in phases, and accordingly, lease up may occur prior to final completion of the building. Lease up communities are generally classified in construction in progress for GAAP presentation prior to substantial completion and are generally classified in land, buildings and improvements once substantially complete. Operating A multifamily community is considered operating when substantially constructed and capable of generating all significant revenue sources. At such time, the community is classified as land, buildings and improvements for GAAP presentation. Same Store Our Same Store multifamily communities are defined as those that are stabilized and comparable for both the current and the prior calendar reporting year. Stabilized We consider a multifamily community to be Stabilized generally when the multifamily community achieves 90% occupancy. Stabilized communities that are not Same Store are described as stabilized non-comparable communities. Non-comparable stabilized communities are stabilized as of the latest quarter end, but may not be stabilized for the entire quarter or year to date. Debt Classifications Co-Investment Venture Level Debt Co-Investment Venture Level Debt is defined as consolidated debt that is an obligation of the joint venture and is not an obligation or contingency for us but does allow us to increase our access to capital. Company Level Debt Company Level Debt is defined as debt that is a direct or indirect obligation of the Company or one of its wholly owned subsidiaries. Recourse Debt The portion of debt for which the Company has provided recourse guarantees. Normal “bad boy” provisions, e.g. bankruptcy and environmental, are not included as Recourse Debt. EBITDA A non-GAAP measurement of earnings before interest, taxes, depreciation, amortization, and other non-recurring items. Similar to other non-GAAP measurements, EBITDA is presented on our Proportionate Share. Deduction for interest expense only includes stated interest expense. Fees and other charges are included as an expense in EBITDA. Amortization expense adjustments include amortization of deferred finance fees and all purchase accounting intangibles. We also present adjusted EBITDA which includes adjustments for gains or losses on early extinguishment of debt, impairment, pursuit expenses and similar activities. Its purpose is to highlight earnings without finance, depreciation and certain amortization expenses and its use is limited to specialized analysis. Our presentation may be different than other companies. © Monogram Residential Trust, Inc. 45
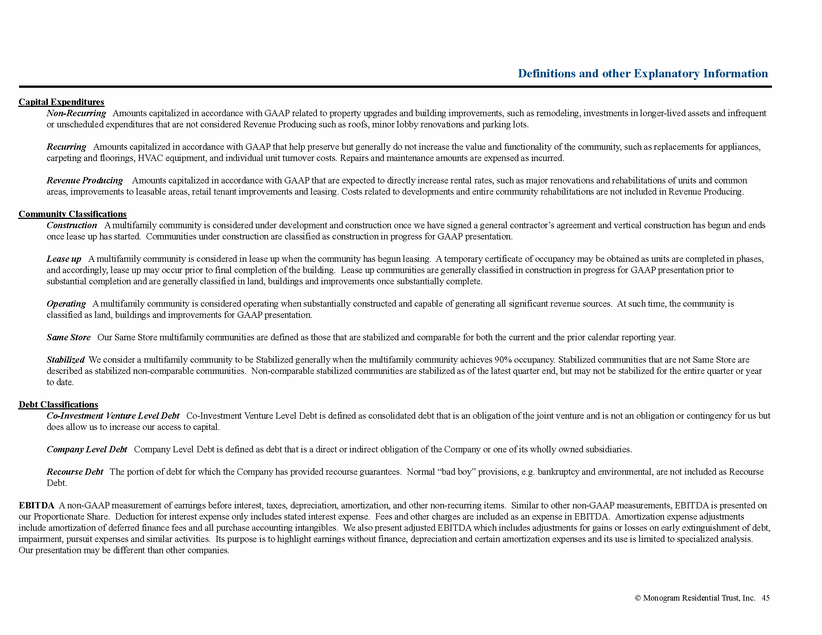
Definitions and other Explanatory Information Economic Costs Represents costs for all on-site development and construction costs recognized for GAAP, but including certain items expensed for GAAP (primarily specific financing and operating expenses incurred during lease up) and excluding certain GAAP costs related to consolidated allocated costs, former sponsor-related fees and other non-cash capitalized cost items. Effective Ownership Effective ownership represents our participation in the distributable operating cash and may change over time as certain milestones related to budgets, plans and completion are achieved. This effective ownership is indicative of, but may differ from, percentages for distributions, contributions or financing requirements. Fee Income Our revenue collected from joint ventures related to property management and asset management. Financial Ratios Debt (or Net Debt) to EBITDA Total contractual debt divided by annualized EBITDA based on respective reporting period. Contractual debt excludes debt associated with multifamily communities in development and/or lease up prior to stabilization and certain GAAP adjustments, primarily purchased discounts and premiums and deferred financing costs. Net debt presentations deduct cash and cash equivalents from the total debt amounts. Our presentation is based on our Proportionate Share. Excluding Development Activity As developments prior to stabilization are not yet producing expected operating results but may have outstanding debt and related interest and other finance charges (directly or indirectly), we also present certain ratios without the related NOI deficit, associated development debt, interest and other finance charges. Fixed Charge Coverage EBITDA or adjusted EBITDA divided by total of contractual interest and parent (if any) and subsidiary preferred stock dividends. We may also present less fixed charges net of development activity. Our presentation is based on our Proportionate Share. Monthly Rental Revenue Per UnitMonthly rental revenue per unit is calculated based on the leases in effect as of the indicated date, including in-place base rents for the occupied units and the current market rate for vacant residential units, including the effects of any rental concessions and affordable housing payments and subsidies, plus other recurring occupancy related charges for storage, parking, pets, trash or other recurring resident charges. Operating Margin NOI divided by total revenue. Joint Venture Partners Stichting Depositary PGGM Private Real Estate Fund (“PGGM”) PGGM is a $234 billion Dutch foundation acting in its capacity as title holder of and for the account of PGGM Private Real Estate Funds and its affiliates, a real estate investment vehicle for Dutch pension funds. Ten year (through 2023) - $300 million commitment including operating and development properties. We are also entitled to receive promoted interests after PGGM realizes defined returns. We and, under certain circumstances, PGGM also have buy/sell rights, which if exercised by us, may require us to acquire PGGM’s respective ownership interest or if exercised by PGGM, may require us to sell our respective ownership interest. Milky Way Partners, L.P. (“NPS”) NPS, the primary partner of which is Korea Exchange Bank, as Trustee for and on behalf of National Pension Service (acting for and on behalf of the National Pension Fund of the Republic of Korea Government, a $505 billion fund). We and, under certain circumstances, NPS have buy/sell rights, which if exercised by us, may require us to acquire NPS’s respective ownership interest or if exercised by NPS, may require us to sell our respective ownership interest. Developer partners Developer partners include national or regional real estate developer/owners. Generally, the developer partners have initial capital requirements until certain milestones are achieved, at which point their initial capital contributions are returned to them. The developer partners have a back-end interest generally only attributable to distributions related to a property sale or financings. The developer partners also have put options, one year after completion of the development where we (and in most cases PGGM) would be required to acquire their back-end interest at a set price as well as options to trigger a mark-to-market process generally after the seventh year after completion and a buy/sell after the tenth year. The amount of the individual developer put options range from $0.8 million to $6.4 million and as of June 30, 2017 total $23.3 million. Subsidiary preferred units Subsidiary preferred units issued in order for PGGM and NPS investments to qualify as a REIT. Units are callable at our option, paying an annual distribution of 12.5% on the face amount of $500 per unit. © Monogram Residential Trust, Inc. 46
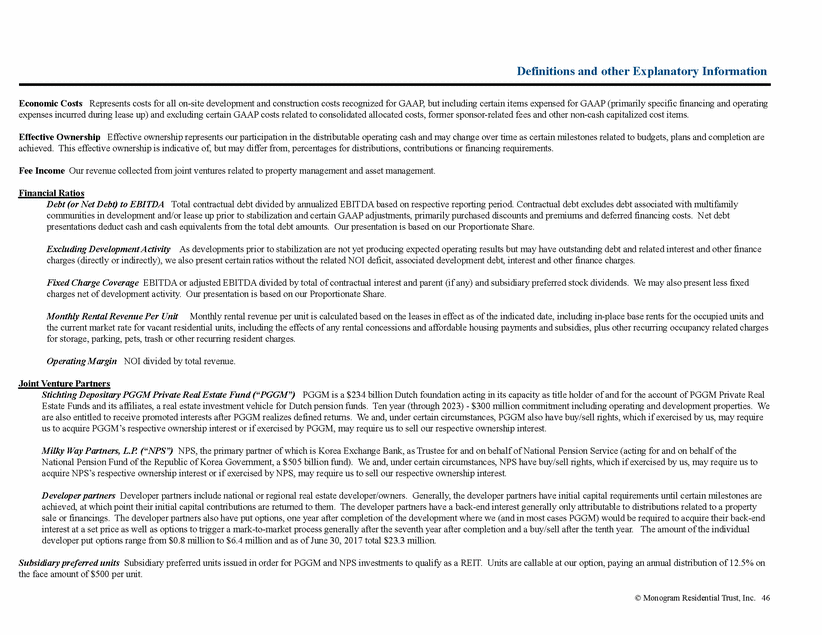
Definitions and other Explanatory Information Noncontrolling Interests Adjustments As further discussed in the Ownership Presentations section of Definitions and other Explanatory Information, our Proportionate Share information could be useful to investors in analyzing our financial information and our loan covenant compliance. Where the Noncontrolling Interests Adjustments are presented side by side with the GAAP amount, our Proportionate Share can be calculated by adding the Noncontrolling Interests Adjustments amount to the GAAP amount. For example, if the following information was presented: Noncontrolling Interests Adjustments GAAP Amount GAAP account A GAAP account B $ $ 100 (200) $ $ (25) 50 The Proportionate Share amount for GAAP account A would be $75 and the Proportionate Share amount for GAAP account B would be ($150). Non-GAAP Measurements We use the following non-GAAP measurements to present different components of our performance. We believe this information is also useful to our investors in comparing our results to other real estate companies and trusts because they provide characteristics of our performance that reflect the reality that real estate generally appreciates over time, which is not reflected in most depreciation methods, and focus on operating results widely used by real estate investors. We also use FFO as adjusted for straight-line rents, stock compensation expense, and recurring capital expenditures as a basis for certain of our debt covenant calculations. These non-GAAP measurements should not be considered as alternatives to net income (loss) presented in accordance with GAAP but as a supplemental performance measurement. Because these measurements may exclude certain cash flows, gains, revenues or expenses, we caution that these measurements may not be representative of our current or future performance as presented in accordance with GAAP. There can be no assurance that our methods for computing these non-GAAP measurements is comparable with that of other real estate companies and trusts in all respects. A reconciliation for each non-GAAP measurement to the most applicable GAAP measurement is provided on pages 7, 8, 18 and 31. Unless otherwise noted, our presentation is based on our Proportionate Share. Funds from Operations (“FFO”) FFO is a non-GAAP performance financial measure that is widely recognized as a measure of REIT operating performance. We use FFO as currently defined by the National Association of Real Estate Investment Trusts (“NAREIT”) to be net income (loss), computed in accordance with GAAP, excluding gains (or losses) from sales of property (including deemed sales (if any) and settlements of pre-existing relationships), plus depreciation and amortization on real estate assets, impairment write-downs of depreciable real estate or of investments in unconsolidated real estate partnerships, joint ventures and subsidiaries (if any) that are driven by measurable decreases in the fair value of depreciable real estate assets, and after related adjustments for unconsolidated partnerships, joint ventures and subsidiaries and noncontrolling interests. FFO is the amount attributable to our common stockholders. Core FFO Core FFO is calculated starting from FFO adjusted for loss on early extinguishment of debt, start up and pursuit expenses, fair value adjustments and non-recurring expenses. Core FFO is the amount attributable to our common stockholders. Adjusted Core FFO (“AFFO”) AFFO is calculated starting from Core FFO adjusted for Recurring capital expenditures, Straight-line rents and stock compensation expense. AFFO is the amount attributable to our common stockholders. Net Operating Income (“NOI”) NOI is calculated as total rental revenue less direct property operating expenses including real estate taxes. NOI does not include property management revenues, interest income, property management expenses, depreciation, interest and other finance expense, corporate general and administrative expenses, overhead allocations and other non-onsite operations. We provide NOI on our Proportionate Share. Occupancy Physical occupancy is defined as the residential units occupied (including non-revenue producing units) for multifamily communities divided by the total number of residential units. All occupancy is presented on a consolidated basis. © Monogram Residential Trust, Inc. 47
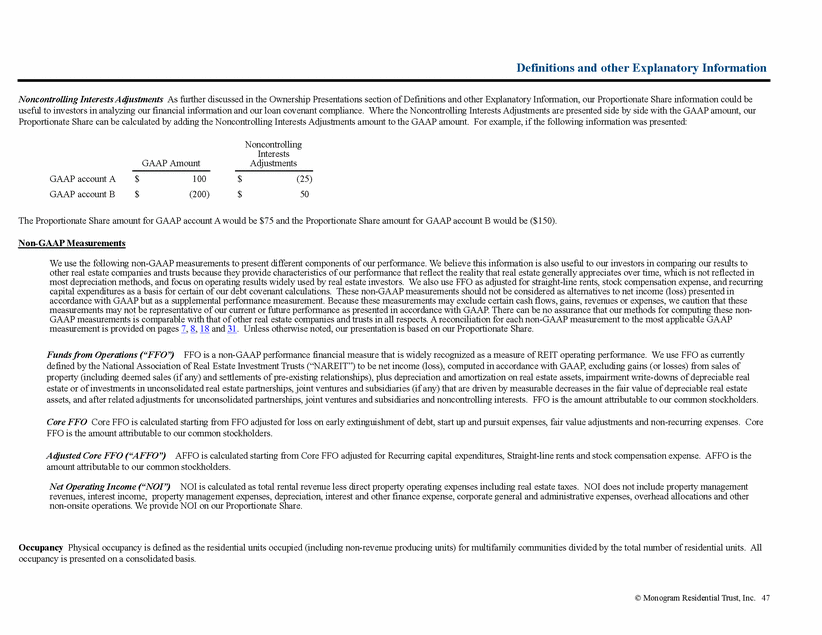
Definitions and other Explanatory Information Ownership Presentations Consolidated Presentation in accordance with GAAP, where ownership interests that generally provide us the ability to control the operation are presented at 100% of the assets, liabilities and operations. Amounts related to Noncontrolling Interests are aggregated and adjusted in summary. In Proportionate Share presentations, the Noncontrolling Interest amounts are eliminated and replaced with our share. Noncontrolling Interest The amounts attributable in a consolidation presentation to minority equity interests or owners without a controlling interest. In a proportionate presentation, these amounts are eliminated. GAAP recognizes two types of noncontrolling interests. Non-redeemable Noncontrolling Interest represents ownership interests that are not redeemable by the equity holders and are presented as part of permanent equity. Redeemable Noncontrolling Interest represents temporary equity not within our control, where the equity holder has the right to require that their interest be redeemed in cash. Our primary Redeemable Noncontrolling Interest is the put options exercisable by developer partners. Redeemable Noncontrolling Interests are presented in our consolidated balance sheet outside of permanent equity between debt and equity. Proportionate Share A non-GAAP presentation of financial amounts at our effective cash share based on our current participation in distributable operating cash. The amounts exclude Noncontrolling Interest in consolidated joint ventures. All interests are consolidated, where we are the controlling interest. Proportionate Share presentations may be useful in analyzing our financial information by providing revenues, expenses, assets and liabilities attributable only to our shareholders. Management uses this information to allocate resources and evaluate investments. Proportionate Share presentations are also relevant to our investors and lenders as it highlights operations and capital available for our lenders and investors and is the basis used for several of our loan covenants. However, our Proportionate Share does not include amounts related to our consolidated operations and financial position and should not be considered a replacement for corresponding GAAP amounts presented on a consolidated basis. Investors are cautioned that our Proportionate Share amounts should only be used to assess financial information in the limited context of evaluating amounts attributable to shareholders. We present our Proportionate Share and Proportionate amounts along with the corresponding GAAP balance and reconciling adjustments. Percent Complete To provide one measure of development status, calculated as Economic Costs incurred divided by total Economic Costs. QTD Amounts for the applicable quarter for the indicated year (Quarter to date). Start up and pursuit expenses Start up expenses associated with the lease up of newly acquired or developed multifamily communities, primarily marketing costs which are expensed for GAAP. Pursuit expenses are the write off of direct expenses, primarily third party due-diligence costs and travel expenses, associated with acquisitions that were not consummated. Prior to October 1, 2016, pursuit expenses also included all acquisition costs expensed in accordance with GAAP. Subsequent to October 1, 2016, all acquisition costs associated with a completed acquisition are capitalized to the cost of the real estate. Straight-line rents In accordance with GAAP, rental revenues are recorded evenly over the contractual period, irrespective of the timing of cash collections. The difference between the amount actually collected for a period and the straight-line amount is referred to as the Straight-line rent adjustment. This adjustment amount is reversed in presenting AFFO. Unfunded Commitments Amounts under a contractual commitment that have not been funded and are reasonably within our control. Unfunded Commitments do not include amounts related to fundings that are contingent on future events. Remaining commitments do not include amounts that are contingent on future events that are not within our full control. Year Built The date the community is substantially completed or renovated and ready for its intended use. YTD Amounts for the entire period of the applicable year (Year to date). © Monogram Residential Trust, Inc. 48
