Attached files
| file | filename |
|---|---|
| EX-99.1 - EX-99.1 - Regional Management Corp. | d433172dex991.htm |
| 8-K - FORM 8-K - Regional Management Corp. | d433172d8k.htm |
Exhibit 99.2
Regional
Management
2Q 2017 Earnings Call Presentation
August 1, 2017
Safe Harbor Statement
Regional
Management
This presentation, the related remarks, and the responses to various questions may contain various “forward-looking statements”
within the meaning of the Private Securities Litigation Reform Act of 1995, which represent Regional Management Corp.’s expectations or beliefs future events. Words such as “may,” “will,”
“should,” “likely,” “anticipates,” “expects,” “intends,” “plans,” “projects,” “believes,” “estimates,” “outlook,” and similar expressions may be used
to identify these forward-looking statements. Such forward-looking statements are about matters that are inherently subject to risks and uncertainties, many of which are
outside of the control of Regional Management. Factors that could cause actual results or performance to differ from the expectations expressed or implied in such forward-looking statements include, but are
not limited to, the following: changes in general economic conditions, including levels of unemployment and bankruptcies; risks associated with Regional Management’s transition to a new loan origination and servicing software system; risks
related to opening new branches, including the ability or inability to open new branches as planned; risks inherent in making loans, including repayment risks and value of collateral, which risks may increase in light of adverse or recessionary
economic conditions; changes in interest rates; the risk that Regional Management’s existing sources of liquidity become insufficient to satisfy its needs or that its access to these sources becomes unexpectedly restricted; changes in federal,
state, or local laws, regulations, or regulatory policies and practices, and risks associated with the manner in which laws and regulations are interpreted, implemented, and enforced; the timing and amount of revenues that may be recognized by
Regional Management; changes in current revenue and expense trends (including trends affecting delinquencies and credit losses); changes in Regional Management’s markets and general changes in the economy (particularly in the markets served by
Regional Management); changes in the competitive environment in which Regional Management operates or in the demand for its products; risks related to acquisitions; changes in operating and administrative expenses; and the departure, transition, or
replacement of key personnel. Such factors and others are discussed in greater detail in Regional Management’s filings with the Securities and Exchange Commission. We cannot guarantee future events, results, actions, levels of activity,
performance, or achievements.
Except to the extent required by law, neither Regional Management nor any of its respective agents, employees, or advisors intend or
have any duty or obligation to supplement, amend, update, or revise any forward-looking statement, whether as a result of new information, future developments, or otherwise.
The information and opinions contained in this document are provided as of the date of this presentation and are subject to change without notice. This document has not been
approved by any regulatory or supervisory authority.
2
2Q 17 Highlights – Strong Portfolio Growth
Regional
Management
(dollars in millions, except EPS)
2Q 17
2Q 16
$ Chg B/(W)
% Chg B/(W)
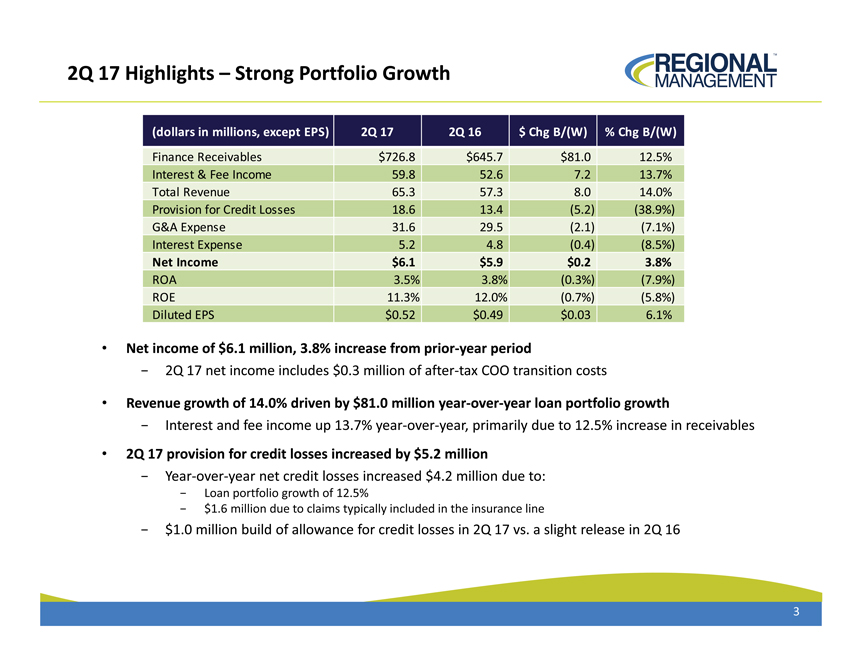
Finance Receivables $726.8 $645.7 $81.0 12.5%
Interest & Fee Income 59.8 52.6 7.2 13.7%
Total
Revenue 65.3 57.3 8.0 14.0%
Provision for Credit Losses 18.6 13.4 (5.2) (38.9%)
G&A Expense 31.6 29.5 (2.1) (7.1%)
Interest
Expense 5.2 4.8 (0.4) (8.5%)
Net Income $6.1 $5.9 $0.2 3.8%
ROA 3.5% 3.8% (0.3%) (7.9%)
ROE 11.3% 12.0%
(0.7%) (5.8%)
Diluted EPS $0.52 $0.49 $0.03 6.1%
Net
income of $6.1 million, 3.8% increase from prior-year period
— 2Q 17 net income includes
$0.3 million of after-tax COO transition costs
Revenue growth of 14.0% driven by $81.0 million year-over-year loan portfolio growth
— Interest and fee
income up 13.7% year-over-year, primarily due to 12.5% increase in receivables
2Q
17 provision for credit losses increased by $5.2 million
— Year-over-year net credit losses increased
$4.2 million due to:
— Loan portfolio growth of 12.5%
— $1.6 million due to claims typically included in the insurance line
— $1.0 million build of allowance for credit losses in 2Q 17 vs. a slight release in 2Q 16
3
Strategic Updates
Regional
Management
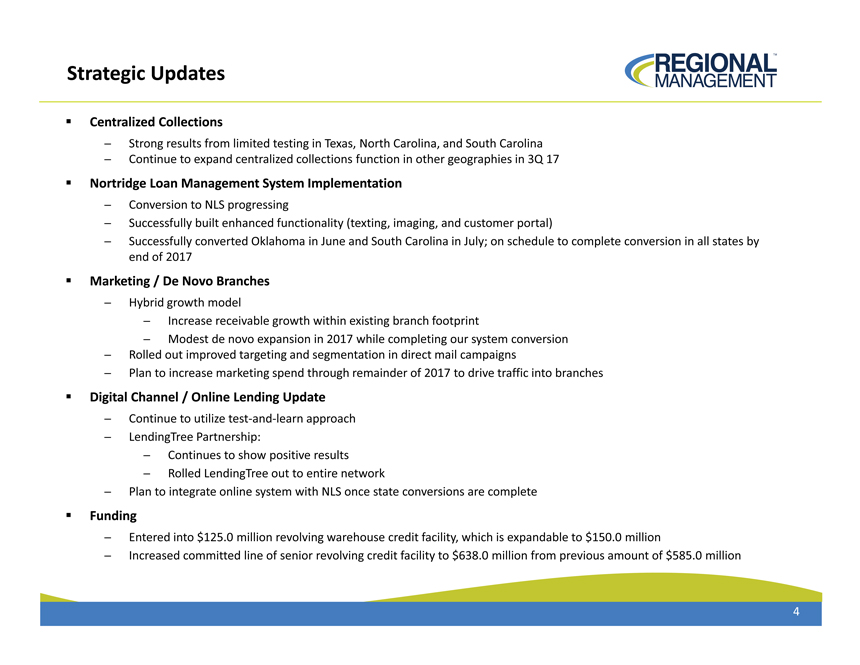
◾ Centralized Collections
— Strong
results from limited testing in Texas, North Carolina, and South Carolina
— Continue to expand centralized collections function in
other geographies in 3Q 17
◾ Nortridge Loan Management System Implementation
— Conversion to NLS progressing
— Successfully built enhanced functionality (texting, imaging, and customer portal)
— Successfully converted Oklahoma in June and South Carolina in July; on schedule to complete conversion in all states by end of 2017
◾ Marketing / De Novo Branches
— Hybrid growth model
— Increase receivable growth within existing branch footprint
— Modest de novo expansion in 2017 while completing our system conversion
— Rolled out improved targeting and segmentation in direct mail campaigns
— Plan to increase marketing spend through remainder of 2017 to drive traffic into branches
◾ Digital Channel / Online Lending Update
— Continue to utilize test-and-learn approach
— LendingTree Partnership:
— Continues to show positive results
— Rolled LendingTree out to entire network
— Plan to integrate online system with NLS once state conversions are complete
◾ Funding
— Entered into
$125.0 million revolving warehouse credit facility, which is expandable to $150.0 million
— Increased committed line of
senior revolving credit facility to $638.0 million from previous amount of $585.0 million
4
Net Income Follows Seasonal Pattern of Ledger Growth
Regional
Management
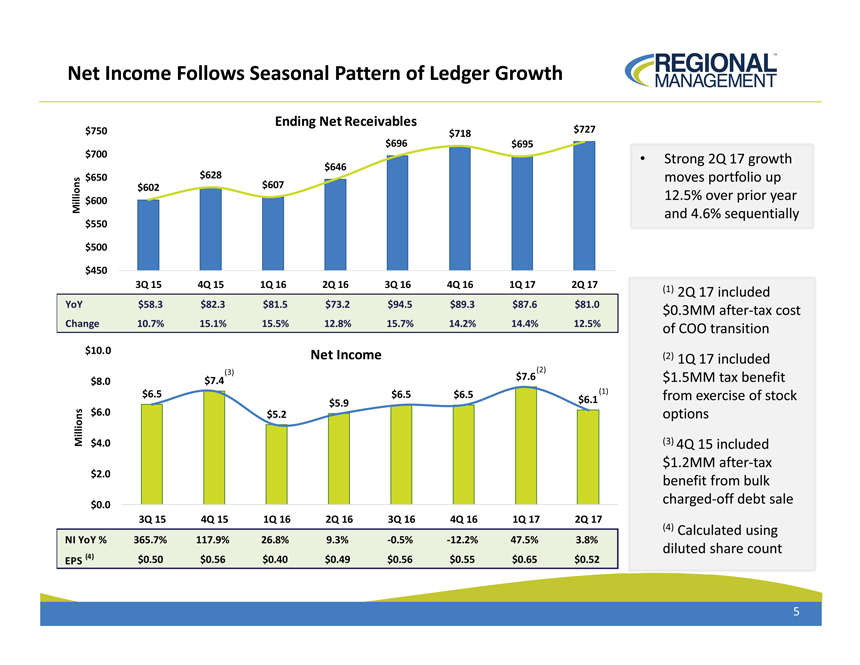
Ending Net Receivables
$750 $727 $718 $696 $695 $700
$628 $646 $650 $602 $607 Millions $600 $550
$500
$450
3Q 15 4Q 15 1Q 16 2Q 16 3Q 16 4Q 16 1Q 17 2Q 17 YoY $58.3 $82.3 $81.5 $73.2 $94.5 $89.3 $87.6 $81.0 Change 10.7% 15.1%
15.5% 12.8% 15.7% 14.2% 14.4% 12.5%
•
Strong 2Q 17 growth moves portfolio up 12.5% over prior year and 4.6% sequentially
(1) 2Q 17 included $0.3MM after-tax cost of COO transition
(2)
1Q 17 included $1.5MM tax benefit from exercise of stock options
(3) 4Q 15 included $1.2MM after-tax benefit from bulk charged-off debt sale
(4) Calculated using diluted share count
$10.0 Net Income
(3) (2)
$7.4 $7.6 $8.0 $6.5 $6.5 $6.5 (1) $5.9 $6.1 $6.0 $5.2 Millions $4.0 $2.0
$0.0
3Q 15 4Q 15 1Q 16 2Q 16 3Q 16 4Q 16 1Q 17 2Q 17
NI YoY % 365.7% 117.9% 26.8% 9.3% -0.5% -12.2% 47.5% 3.8% EPS (4)
$0.50 $0.56 $0.40 $0.49 $0.56 $0.55 $0.65 $0.52
5
Product Category Trends
Regional
Management
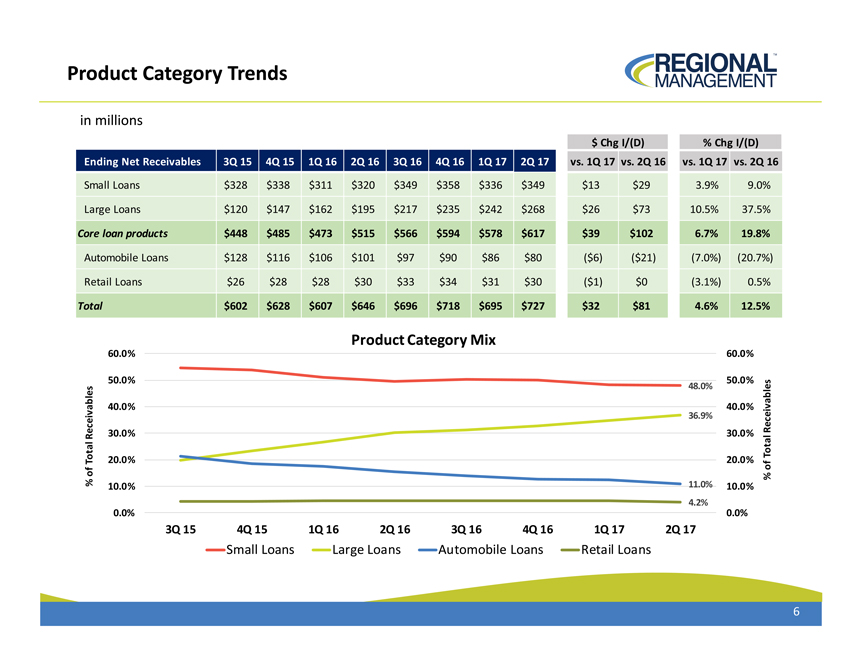
in millions
$ Chg I/(D) % Chg I/(D) Ending Net Receivables
3Q 15 4Q 15 1Q 16 2Q 16 3Q 16 4Q 16 1Q 17 2Q 17 vs. 1Q 17 vs. 2Q 16 vs. 1Q 17 vs. 2Q 16
Small Loans $328 $338 $311 $320 $349 $358 $336 $349 $13 $29
3.9% 9.0%
Large Loans $120 $147 $162 $195 $217 $235 $242 $268 $26 $73 10.5% 37.5%
Core loan products $448 $485 $473 $515 $566 $594 $578 $617 $39 $102
6.7% 19.8%
Automobile Loans $128 $116 $106 $101 $97 $90 $86 $80 ($6) ($21) (7.0%) (20.7%)
Retail Loans $26 $28 $28 $30 $33 $34 $31 $30 ($1) $0 (3.1%) 0.5%
Total $602 $628 $607 $646
$696 $718 $695 $727 $32 $81 4.6% 12.5%
Product Category Mix
60.0% 60.0%
50.0% 50.0%
48.0%
40.0% 40.0%
36.9% Receivables Receivables 30.0% 30.0% Total Total 20.0% 20.0% of of
% %
10.0% 11.0% 10.0%
4.2%
0.0% 0.0%
3Q 15 4Q 15 1Q 16 2Q 16 3Q 16 4Q 16 1Q 17
2Q 17
Small Loans Large Loans Automobile Loans Retail Loans
% of Total Receivables
6
Regional
Management
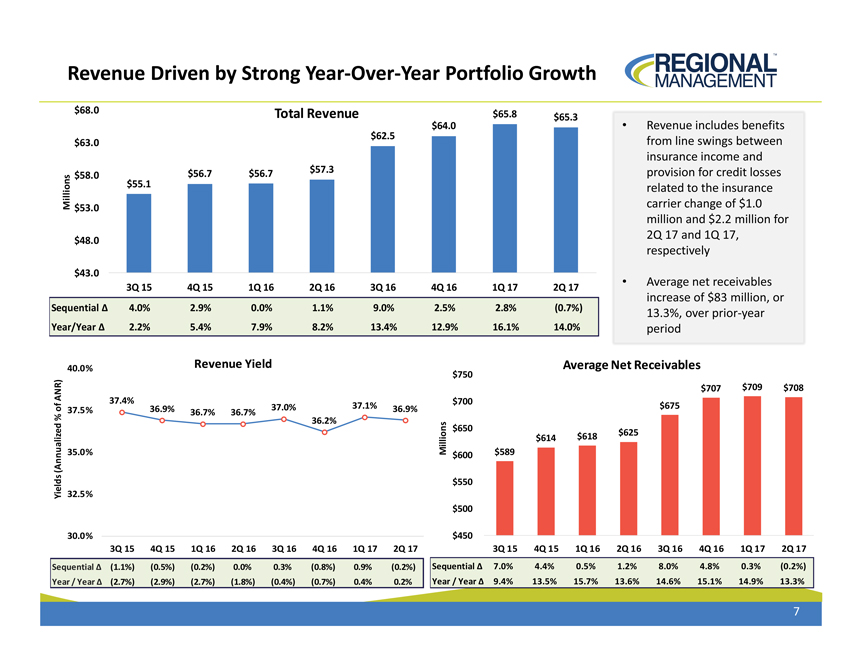
Revenue Driven by Strong Year-Over-Year Portfolio Growth
$68.0 Total Revenue $65.8
$64.0 $65.3
$62.5
$63.0
$56.7 $57.3
$58.0 $56.7
Millions $55.1
$53.0
$48.0
$43.0
3Q 15 4Q 15 1Q 16 2Q 16 3Q 16 4Q 16 1Q 17 2Q 17 Sequential Ä 4.0% 2.9% 0.0% 1.1% 9.0% 2.5% 2.8% (0.7%) Year/Year Ä 2.2% 5.4% 7.9% 8.2% 13.4% 12.9% 16.1% 14.0%
• Revenue includes benefits from line swings between insurance income and provision for credit losses related to the insurance carrier change of $1.0 million and $2.2 million
for
2Q 17 and 1Q 17, respectively
• Average net receivables increase of
$83 million, or 13.3%, over prior-year period
40.0% Revenue Yield Average Net Receivables
$750
ANR) $707 $709 $708 of 37.4% 37.0% 37.1% $700 $675
37.5% 36.9% 36.9%
% 36.7% 36.7%
36.2% $650 $625 $614 $618 (Annualized 35.0% Millions $600 $589 $550 Yields 32.5% $500
30.0%
$450
3Q 15 4Q 15 1Q 16 2Q 16 3Q 16 4Q 16 1Q 17 2Q 17 3Q 15 4Q 15 1Q 16 2Q 16 3Q 16 4Q 16 1Q 17 2Q 17
Sequential Ä (1.1%) (0.5%) (0.2%) 0.0% 0.3% (0.8%) 0.9% (0.2%) Sequential Ä 7.0% 4.4% 0.5% 1.2% 8.0% 4.8% 0.3% (0.2%) Year / Year Ä (2.7%) (2.9%) (2.7%) (1.8%)
(0.4%) (0.7%) 0.4% 0.2% Year /Year Ä 9.4% 13.5% 15.7% 13.6% 14.6% 15.1% 14.9% 13.3%
Yields (Annualized % of ANR)
7
Regional
Management
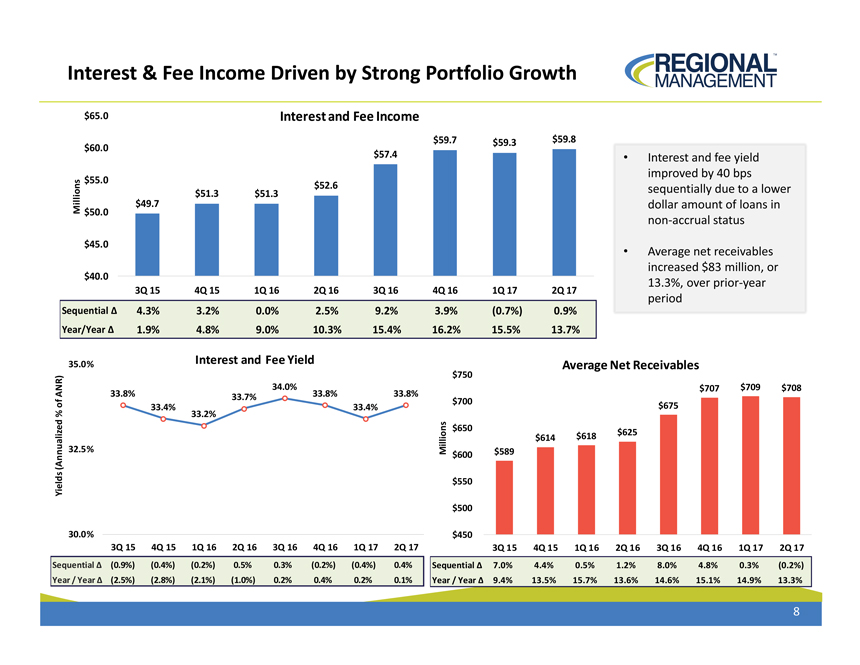
Interest & Fee Income Driven by Strong Portfolio Growth
$65.0 Interest
and Fee Income
$59.7 $59.3 $59.8
$60.0
$57.4 • Interest and fee yield improved by 40 bps
$55.0
$51.3 $51.3 $52.6 sequentially due to a lower Millions $50.0 $49.7 dollar amount of loans in non-accrual status
$45.0
• Average net receivables
$40.0 increased $83 million, or
13.3%, over prior-year
3Q 15 4Q 15 1Q 16 2Q 16 3Q 16 4Q 16 1Q 17 2Q 17
period
Sequential Ä 4.3% 3.2% 0.0% 2.5% 9.2% 3.9% (0.7%) 0.9% Year/Year Ä 1.9% 4.8% 9.0% 10.3% 15.4% 16.2% 15.5% 13.7%
35.0% Interest and Fee Yield
Average Net Receivables
$750
34.0% $707 $709 $708
ANR) 33.8% 33.7% 33.8% 33.8% $700
of 33.4% 33.4% $675
% 33.2% $650 $625 $614 $618
32.5% Millions $589 (Annualized $600 Yields
$550
$500
30.0% $450
3Q 15 4Q 15 1Q 16 2Q 16 3Q 16 4Q 16 1Q 17 2Q 17 3Q 15 4Q 15 1Q 16
2Q 16 3Q 16 4Q 16 1Q 17 2Q 17
Sequential Ä (0.9%) (0.4%) (0.2%) 0.5% 0.3% (0.2%) (0.4%) 0.4% Sequential Ä 7.0% 4.4% 0.5% 1.2% 8.0% 4.8% 0.3% (0.2%) Year
/ Year Ä (2.5%) (2.8%) (2.1%) (1.0%) 0.2% 0.4% 0.2% 0.1% Year /Year Ä 9.4% 13.5% 15.7% 13.6% 14.6% 15.1% 14.9% 13.3%
8
Regional
Management
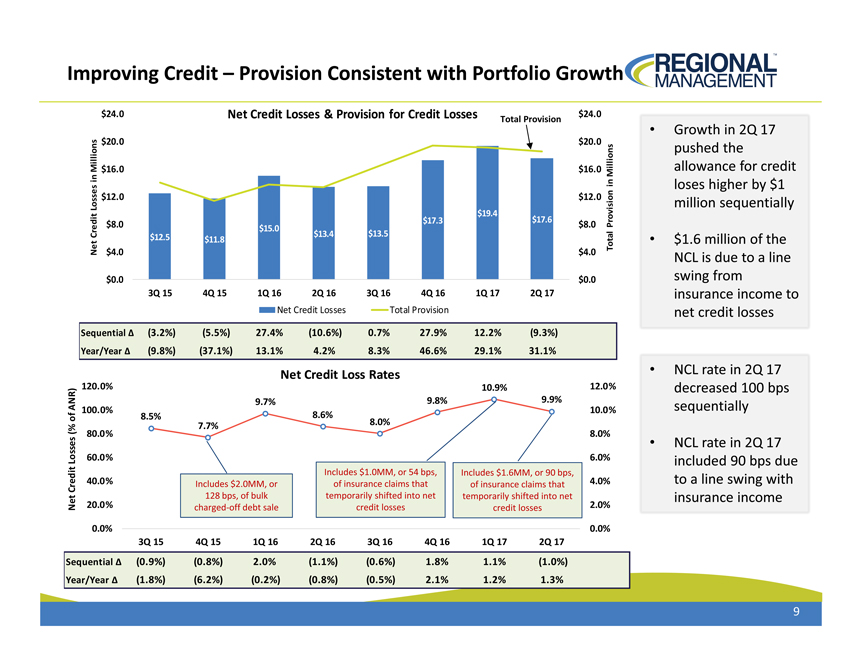
Improving Credit – Provision Consistent with Portfolio Growth
$24.0 Net
Credit Losses & Provision for Credit Losses $24.0
Total Provision
•
Growth in 2Q 17
$20.0 $20.0
pushed the
Millions $16.0 $16.0 allowance for credit
Millions in
in loses higher by $1 Losses $12.0 $12.0 million sequentially
$19.4
$17.3 $17.6 $8.0 $8.0 Provision Credit $15.0 $13.4 $13.5
$12.5 $11.8 Total • $1.6 million
of the Net $4.0 $4.0 NCL is due to a line $0.0 $0.0 swing from
3Q 15 4Q 15 1Q 16 2Q 16 3Q 16 4Q 16 1Q 17 2Q 17 insurance income to
Net Credit Losses Total Provision net credit losses
Sequential Ä (3.2%) (5.5%) 27.4%
(10.6%) 0.7% 27.9% 12.2% (9.3%) Year/Year Ä (9.8%) (37.1%) 13.1% 4.2% 8.3% 46.6% 29.1% 31.1%
Net Credit Loss Rates • NCL rate in 2Q 17
120.0% 10.9% 12.0% decreased 100 bps ANR) 9.7% 9.8% 9.9% 100.0% 8.6% 10.0% sequentially of 8.5%
(% 7.7% 8.0%
80.0% 8.0%
• NCL rate in 2Q 17 Losses 60.0% 6.0% included 90 bps due
Includes $1.0MM, or 54 bps,
Includes $1.6MM, or 90 bps,
Credit 40.0% Includes $2.0MM, or of insurance claims that of insurance claims that 4.0% to a line swing with 128 bps, of bulk
temporarily shifted into net temporarily shifted into net insurance income Net 20.0% charged-off debt sale credit losses credit losses 2.0% 0.0% 0.0%
3Q 15 4Q 15 1Q 16 2Q 16 3Q 16 4Q 16 1Q 17 2Q 17
Sequential Ä (0.9%) (0.8%) 2.0% (1.1%)
(0.6%) 1.8% 1.1% (1.0%) Year/Year Ä (1.8%) (6.2%) (0.2%) (0.8%) (0.5%) 2.1% 1.2% 1.3%
9
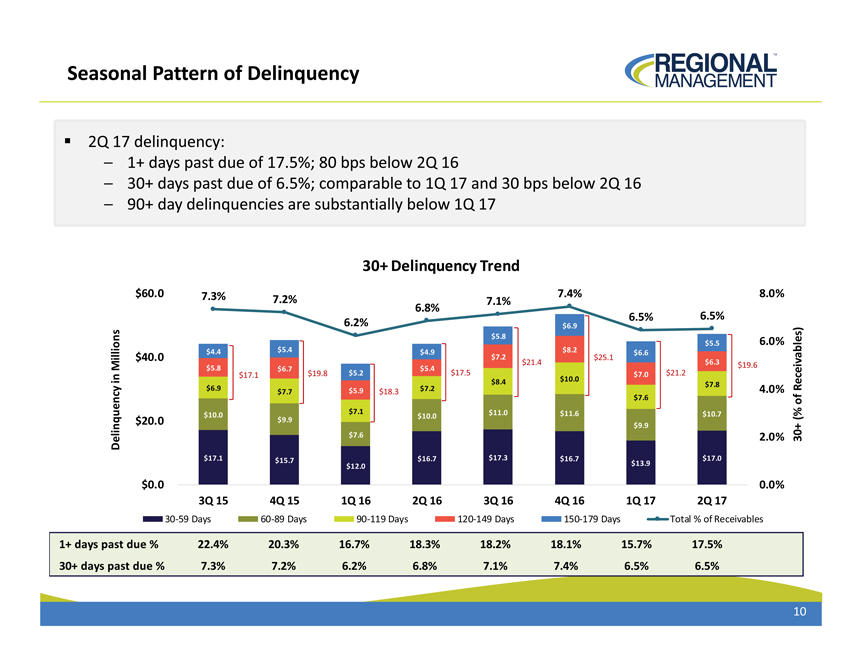
Seasonal Pattern of Delinquency
Regional
Management
2Q 17 delinquency:
- 1+ days past due of 17.5%; 80 bps below 2Q 16
- 30+ days past due of 6.5%; comparable to 1Q 17 and 30 bps below 2Q 16
- 90+ day
delinquencies are substantially below 1Q 17
30+ Delinquency Trend
$60.0 7.3%
7.4% 8.0% 7.2% 7.1% 6.8% 6.5% 6.5% 6.2% $6.9
$5.8 6.0%
$5.4 $5.5
$4.4 $4.9 $8.2 $6.6
$40.0 $7.2 $25.1
Millions $5.8 $5.4 $21.4 $6.3 $19.6
$6.7
$17.1 $19.8 $5.2 $17.5 $7.0 $21.2 in $8.4 $10.0
$7.8
$6.9 $5.9 $7.2 4.0% Receivables)
$7.7 $18.3 $7.6 of
$7.1 $11.0 $11.6 $10.7
$10.0 $10.0 (%
$20.0 $9.9 $9.9
Delinquency $7.6 2.0% 30+
$17.1 $15.7 $16.7 $17.3 $16.7 $13.9 $17.0
$12.0
$0.0 0.0%
3Q 15 4Q 15 1Q 16 2Q 16 3Q 16 4Q 16 1Q 17 2Q 17
30-59 Days 60-89 Days 90-119 Days 120-149 Days 150-179 Days Total % of Receivables
1+ days past due % 22.4% 20.3% 16.7%
18.3% 18.2% 18.1% 15.7% 17.5%
30+ days past due % 7.3% 7.2% 6.2% 6.8% 7.1% 7.4% 6.5% 6.5%
10
Regional
Management
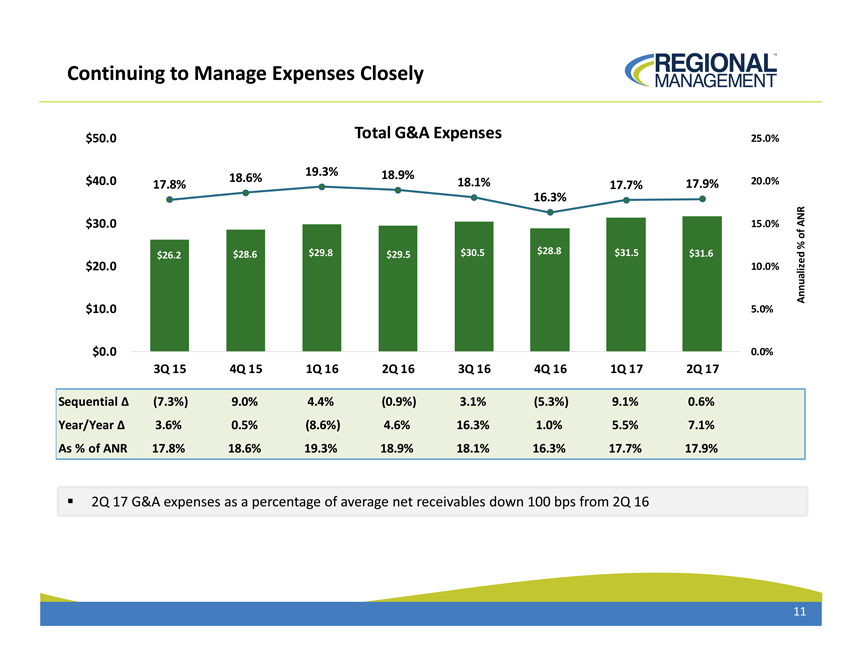
Continuing to Manage Expenses Closely
$50.0 Total G&A Expenses 25.0%
19.3% 18.9%
$40.0 18.6% 18.1% 20.0%
17.8% 17.7% 17.9%
16.3%
$30.0 15.0% ANR
of
%
$28.6 $29.8 $29.5 $30.5 $28.8 $31.5 $31.6
$26.2
$20.0 10.0% Annualized
$10.0 5.0%
$0.0 0.0%
3Q 15 4Q 15 1Q 16 2Q 16 3Q 16 4Q 16 1Q 17 2Q 17
Sequential Ä (7.3%) 9.0% 4.4% (0.9%) 3.1%
(5.3%) 9.1% 0.6%
Year/Year Ä 3.6% 0.5% (8.6%) 4.6% 16.3% 1.0% 5.5% 7.1%
As % of ANR 17.8% 18.6% 19.3% 18.9% 18.1% 16.3% 17.7% 17.9%
2Q 17 G&A
expenses as a percentage of average net receivables down 100 bps from 2Q 16
11
Regional
Management
Regional
Management
RM Listed NYSE