Attached files
| file | filename |
|---|---|
| EX-99.1 - EX-99.1 - MYERS INDUSTRIES INC | d433907dex991.htm |
| 8-K - 8-K - MYERS INDUSTRIES INC | d433907d8k.htm |
 AUGUST 1, 2017 – SECOND QUARTER EARNINGS PRESENTATION MYERS INDUSTRIES, INC. Exhibit 99.2 |
 SAFE
HARBOR
STATEMENT
Statements in this presentation concerning the Company’s goals, strategies, and
expectations for business and financial results may be
"forward-looking statements" within the meaning of the Private Securities
Litigation Reform Act of 1995 and are based on current indicators
and expectations. Any statement that is not of historical fact may
be deemed “forward-looking”. Words such as “expect”, “believe”, “project”, “plan”, “anticipate”, “intend”, “objective”, “goal”, “view” and
similar expressions identify forward-looking statements. These
statements are based on management’s current views and assumptions of future
events and financial performance and involve a number of risks and
uncertainties, many outside the Company’s control that could cause actual results to materially differ from those expressed or implied. You are cautioned not to put undue reliance on any forward-looking statement. We do not intend, and undertake no
obligation, to update these forward-looking statements. Such
risks include: (1)
Raw material availability, increases in raw material costs, or other production
costs (2)
Risks associated with our strategic growth initiatives or the failure to achieve the
anticipated benefits of such initiatives (3)
Unanticipated downturn in business relationships with customers or their
purchases (4)
Competitive pressures on sales and pricing
(5) Changes in the markets for the Company’s business segments (6) Changes in trends and demands in the markets in which the Company competes (7) Unexpected failures at our manufacturing facilities (8) Future economic and financial conditions in the United States and around the world
(9) Inability of the Company to meet future capital requirements (10) Claims, litigation and regulatory actions against the Company (11) Changes in laws and regulations affecting the Company (12) Other risks as detailed in the Company’s 10-K and other reports filed with the Securities Exchange Commission
Myers Industries, Inc. encourages investors to learn more about these risk factors. A
detailed explanation of these factors is available in the Company’s
publicly filed quarterly and annual reports, which can be found online at www.myersindustries.com and at the SEC.gov web site. Statements in this presentation speak only as of the date made. 2 |
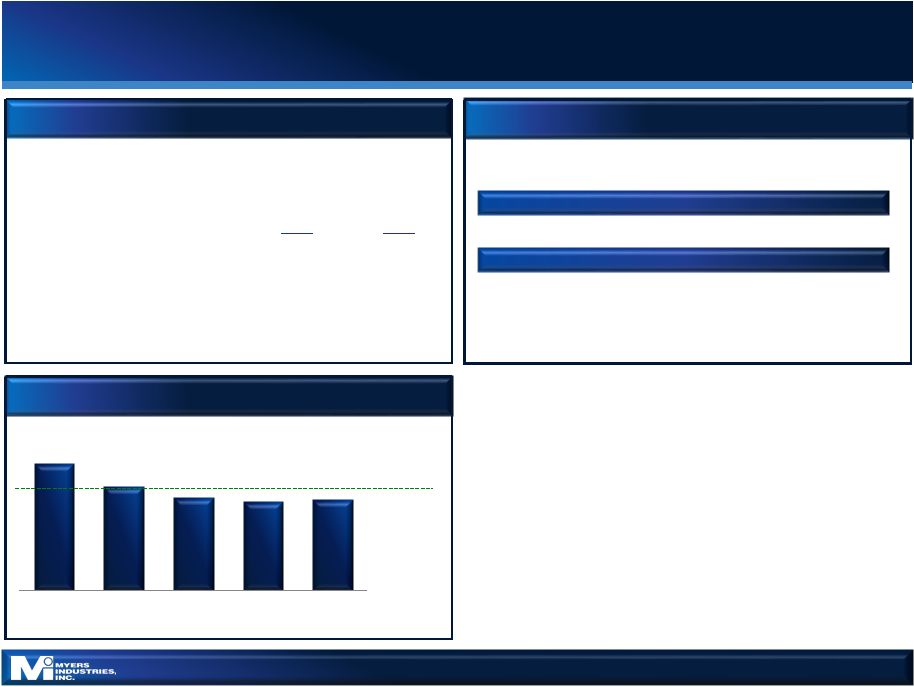
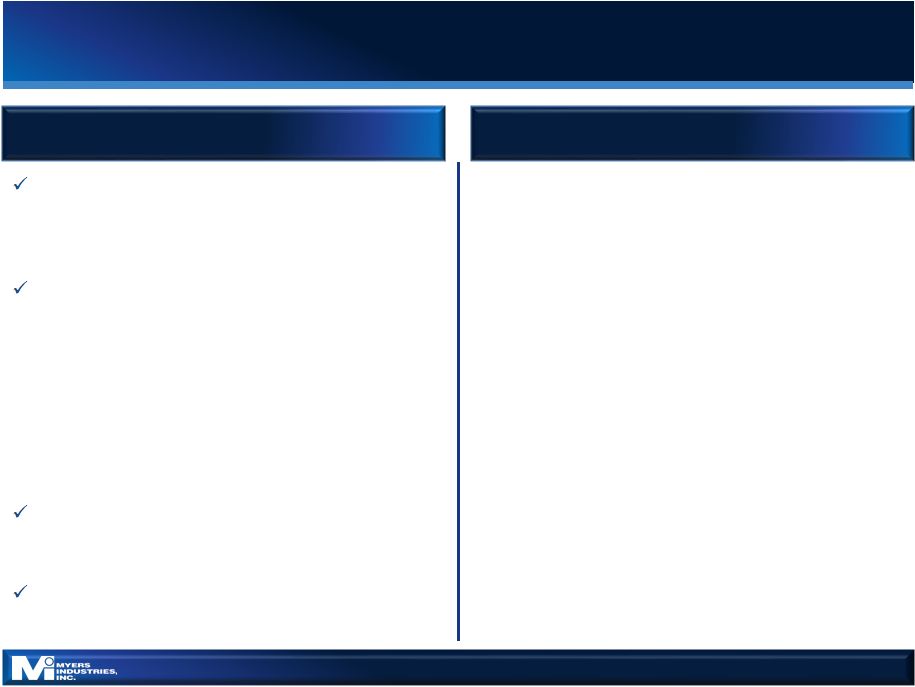 3 2017 Q2 OVERVIEW Challenges Achievements - Distribution execution remains challenging • Mixed market conditions; slow start to the quarter • Exit of low margin business • Continued share loss from 2016 territory gaps - Continued work to do towards driving flexible operations • Lean initiatives • Talent upgrades - Mitigating resin cost pressure through pricing actions and favorable sales mix Generated $8.7M in free cash flow; continued working capital discipline and timing of capital spending Niche market focus led to year-over-year sales growth in the Material Handling Segment • Solid growth in RV market driving growth in Vehicle related business • 4% growth in Consumer • Orders strengthening in the Food & Beverage market Operational re-alignment remains on track; savings to begin in second half of 2017 Consistently reducing debt |
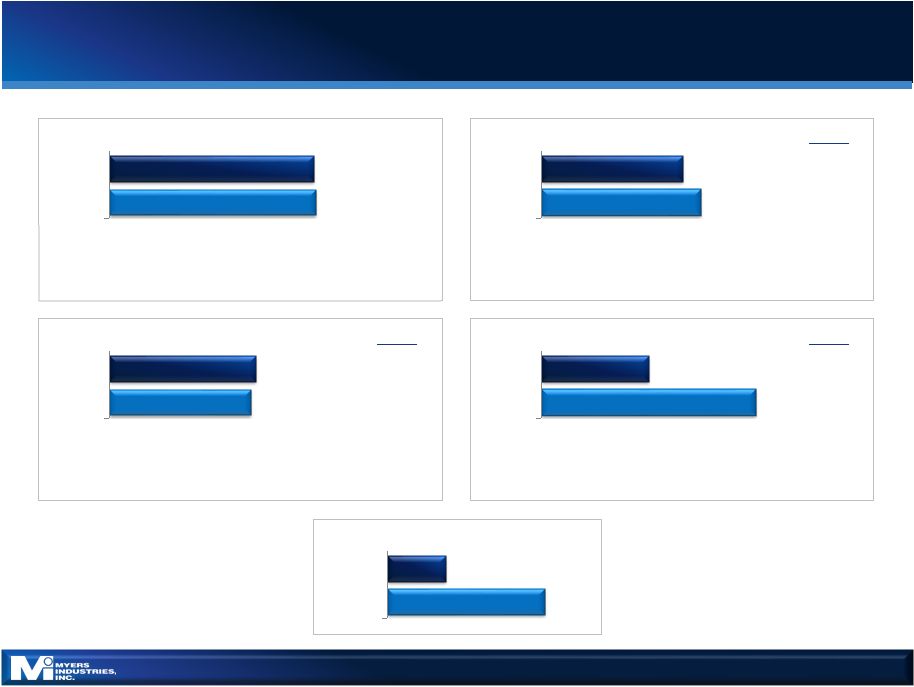 $0.19 $0.07 Q2 2016 Q2 2017 Diluted EPS $144.1 $142.3 Q2 2016 Q2 2017 Net Sales 4 Q2 FINANCIAL SUMMARY – GAAP $44.5 $39.3 Q2 2016 Q2 2017 Gross Profit $11.2 $5.6 Q2 2016 Q2 2017 Operating Income $32.0 $33.2 Q2 2016 Q2 2017 SG&A Expenses % Sales 23.3% 22.2% % Sales 27.6% 30.9% % Sales 3.9% 7.7% Operating income declined $5.6M • Gross profit lower $5.2M; primarily restructuring costs • SG&A higher $1.1M • Year-over-year decline in impairment charge $0.8M Gross profit declined $5.2M • Material Handling operating inefficiencies $1.4M • Restructuring expenses $4M SG&A increased $1.1M • Higher compensation costs and professional fees • Lower facility costs REFLECTS RESULTS FROM CONTINUING OPERATIONS;
IN
$MILLIONS
EXCEPT PER-SHARE
FIGURES
Net sales declined 1.3%
• Material Handling up $2M (2.1%) due to growth in niche markets, partially offset by declines in the Industrial market • Distribution down $4M (9.2%) |
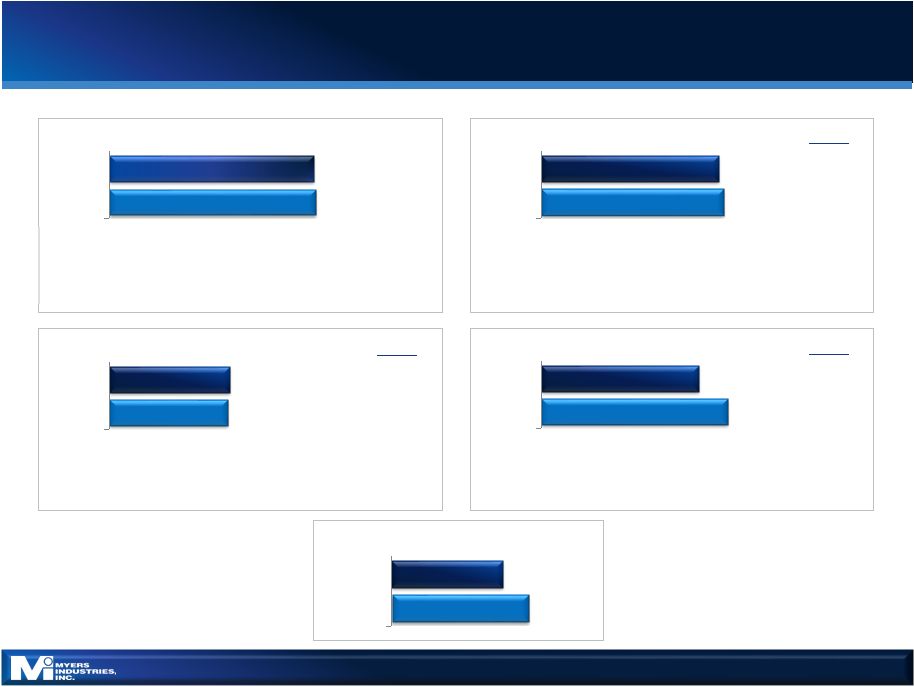 $0.21 $0.17 Q2 2016 Q2 2017 Adj. Diluted EPS $144.1 $142.3 Q2 2016 Q2 2017 Net Sales 5 Q2 FINANCIAL SUMMARY – ADJUSTED (NON-GAAP) $44.5 $43.4 Q2 2016 Q2 2017 Adj. Gross Profit $11.7 $9.9 Q2 2016 Q2 2017 Adj. Operating Income $32.8 $33.5 Q2 2016 Q2 2017 Adj. SG&A Expenses % Sales 23.5% 22.8% % Sales 30.5% 30.9% % Sales 6.9% 8.1% Adj. operating income declined $1.8M • Lower gross profit $1.1M • Higher SG&A $0.7M Net sales declined 1.3% • Material Handling up $2M (2.1%) due to growth in niche markets, partially offset by declines in the Industrial market • Distribution down $4M (9.2%) Adj. gross profit decreased $1.1M • Raw material cost inflation offset by pricing actions and positive mix • Material Handling operational inefficiencies $1.4M • Depreciation $0.5M lower, mostly due to restructuring REFLECTS RESULTS FROM CONTINUING OPERATIONS;
IN
$MILLIONS
EXCEPT PER-SHARE
FIGURES
Adj. SG&A increased $0.7M
• Higher compensation costs and professional fees • Lower facility costs |
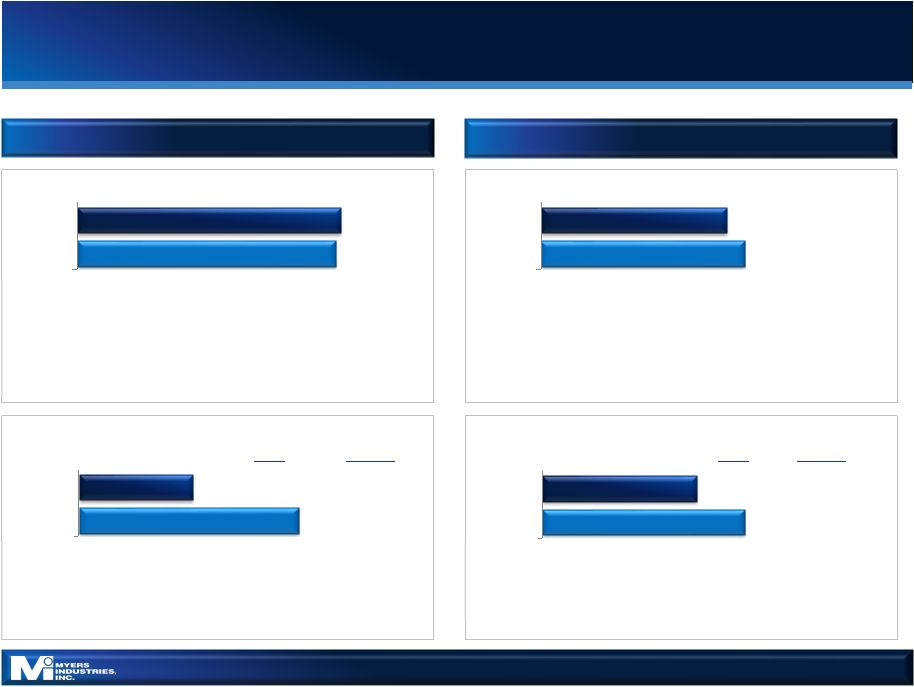 6 Q2 SEGMENT RESULTS Material Handling Distribution $100.9 $103.1 Q2 2016 Q2 2017 Net Sales $14.3 $7.4 Q2 2016 Q2 2017 Operating Income Adjusted $11.7 $13.3 $43.2 $39.3 Q2 2016 Q2 2017 Net Sales $4.0 $3.0 Q2 2016 Q2 2017 Operating Income $3.0 $4.0 GAAP Adjusted GAAP Net sales declined 9.2% • Mixed market conditions in Q2 • Export sales decreased year-over-year • Share loss from 2016 open and underperforming sales territories; new sales rep training ongoing; pricing tools and technology improvements in place Net sales increased 2.1% • Sales to the Consumer market up mid-single digits • Sales to the Vehicle market grew mid-single digits driven by strong
growth in RV • Strengthening orders and sales in Food & Beverage market • Sales declined mid-single digits in the Industrial market Adj. operating income decreased $1.6M • Higher volume and favorable price/mix offset raw material cost pressure • Operational inefficiencies Adj. operating income declined $1.0M • Lower volume partially offset by favorable mix of supplies vs. equipment REFLECTS RESULTS FROM CONTINUING OPERATIONS;
IN
$MILLIONS
EXCEPT PER-SHARE
FIGURES |
 WORKING CAPITAL AS A % OF TTM SALES
BALANCE SHEET 7 BALANCE SHEET & CASH FLOW See appendix for reconciliations from GAAP to adjusted results Q2 2017 Q4 2016 Cash 4.7 $ 7.9 $ Debt 170.1 189.5 Net Debt 165.4 $ 181.6 $ LTM Adjusted EBITDA 57.2 $ 63.6 $ Net Debt-to-Adj. EBITDA 2.9x 2.9x IN
$MILLIONS 11.1% 9.1% 8.1% 7.8% 8.0% Q2 '16 Q3 '16 Q4 '16 Q1 '17 Q2 '17 9% TARGET 4.2% 7.6% 3.8% 9.5% FREE CASH FLOW YTD 2017 YTD 2016 Cash from Continuing Operations 23.6 $ (3.1) $ Capital Expenditures (2.3) (10.6) Free Cash Flow 21.3 $ (13.6) $ IN
$MILLIONS STRONG CASH FLOWS DRIVEN BY SUSTAINED WORKING CAPITAL REDUCTIONS 10.3% • Reduced debt by $19M compared to Q4 2016 - Maintained net debt-to-adjusted EBITDA ratio despite lower EBITDA • Increase in YTD cash flow from continuing operations of $26.7M • Working capital as % of TTM sales consistent with Q4 2016 and below target of 9% |
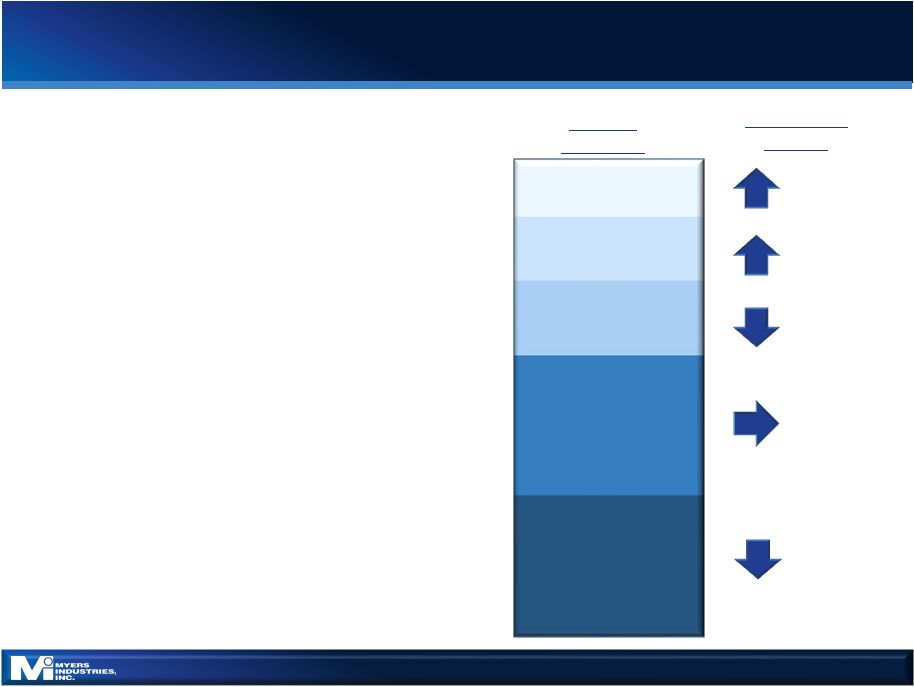 8 2017 OUTLOOK AND STRATEGIC UPDATE High single digits % of Net Sales 2016 2017 Growth Outlook Mid single digits Mid single digits Flat FORECASTING FLAT SALES IN 2017 ON A CONSTANT CURRENCY BASIS CONSUMER 12% VEHICLE 16% FOOD & BEVERAGE 13% AUTO AFTERMARKET 30% INDUSTRIAL 29% » Holding to prior outlook » FY revenue expected to be flat » Progress with niche market growth teams: • Share gains in several niche markets • Strong funnel of opportunities for next set of wins • Pricing and technology tools in place in Distribution » Operational realignment on track: • On schedule and on budget • Solid planning and execution by team » Capital allocation: • Using cash to pay down debt and fund strategic initiatives Mid single digits |
 APPENDIX |
 » Net Sales: Flat (ex-currency) » Capital expenditures: $10 - $12 million » Net interest expense: $8 - $9 million » D&A: $32 - $34 million » Effective tax rate (normalized): 36% 10 2017 KEY ASSUMPTIONS |
 11 RECONCILIATION OF NON-GAAP MEASURES
MYERS INDUSTRIES, INC.
RECONCILIATION OF NON-GAAP FINANCIAL MEASURES
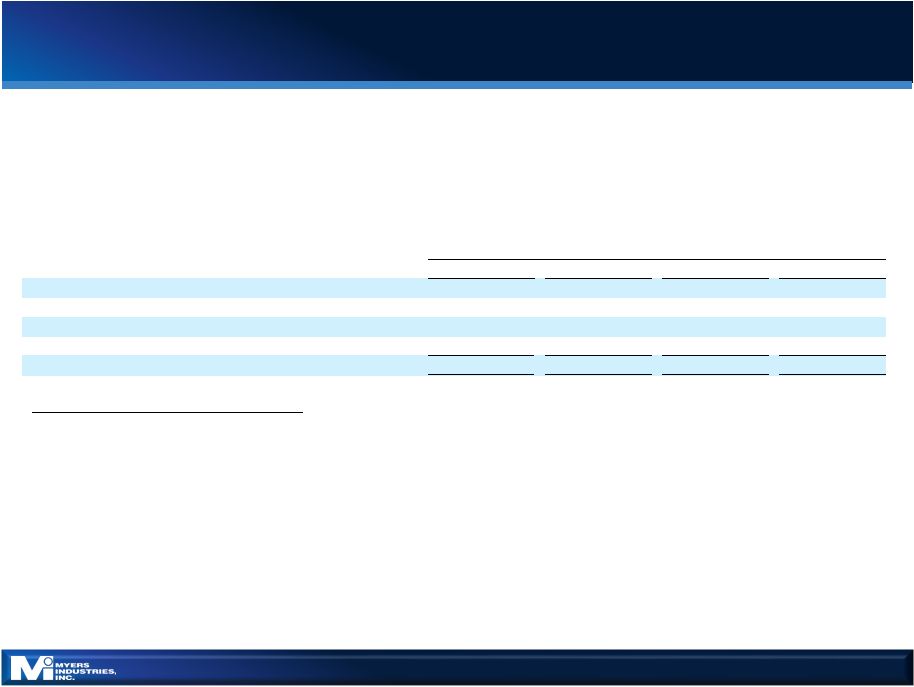
CONSOLIDATED GROSS PROFIT (UNAUDITED)
(Dollars in thousands) Note on Reconciliation of Income and Earnings Data: Gross profit excluding the items above in the text of this presentation and in this reconciliation chart is a non-GAAP June 30, 2017 June 30, 2016 June 30, 2017 June 30, 2016 Gross profit as reported 39,283 $
44,536
$
81,286 $
92,707
$
Restructuring expenses and other adjustments in cost of sales
Material Handling Segment
4,093
- 5,200 -
Distribution Segment - - - - Gross profit as adjusted 43,376 $
44,536
$
86,486 $
92,707
$
For the Three Months Ended For the Six Months Ended financial measure that Myers Industries, Inc. calculates according to the schedule above using GAAP amounts from the unaudited Condensed
Consolidated Statement of Operations. The Company believes that the
excluded items are not primarily related to core operational activities. The Company believes that gross profit excluding items that are not primarily related to core operating activities is generally viewed as providing useful information regarding a company's operating profitability.
Management uses gross profit excluding these items as well as other
financial measures in connection with its decision-making activities. Gross profit excluding these items should not be considered in isolation or as a substitute for gross profit prepared in accordance with GAAP. The Company's method for calculating gross profit excluding these items may not be
comparable to methods used by other companies.
|
 12 RECONCILIATION OF NON-GAAP MEASURES
MYERS INDUSTRIES, INC.
RECONCILIATION OF NON-GAAP FINANCIAL MEASURES
CONSOLIDATED SELLING, GENERAL AND ADMINISTRATIVE EXPENSES (UNAUDITED)
(Dollars in thousands) Note on Reconciliation of Income and Earnings Data: Selling, general and administrative expenses excluding the items above in the text of this presentation and in this reconciliation chart is a non-GAAP financial measure that Myers Industries, Inc. calculates according to the schedule above using GAAP amounts from the unaudited Condensed Consolidated Statement of Operations. The Company believes that the excluded items are not primarily related to core operational activities. The Company believes that selling, general and administrative expenses excluding items that are not primarily related to core operating activities is generally viewed as providing useful information regarding a company's operating profitability. Management uses selling, general and administrative expenses excluding these items as well as other financial measures in connection with its decision-making activities. Selling, general and administrative expenses excluding these items should not be considered in isolation or as a substitute for selling, general and administrative expenses prepared in accordance with GAAP. The Company's method for calculating selling, general and administrative expenses excluding these items may not be comparable to methods used by other companies. June 30, 2017 June 30, 2016 June 30, 2017 June 30, 2016 Selling, general and administrative expenses as reported
33,159
$
32,041 $
67,804
$
70,538 $
Restructuring expenses and other
adjustments in selling, general and
administrative expenses
Material Handling Segment
328
2,335 689
2,335 Distribution
Segment -
- - - Corporate - (1,550) -
(3,561) Selling, general and
administrative expenses as adjusted
33,487
$
32,826 $
68,493
$
69,312 $
For the Three Months Ended
For the Six Months Ended
|
 13 RECONCILIATION OF NON-GAAP MEASURES
MYERS INDUSTRIES, INC.
RECONCILIATION OF NON-GAAP FINANCIAL MEASURES
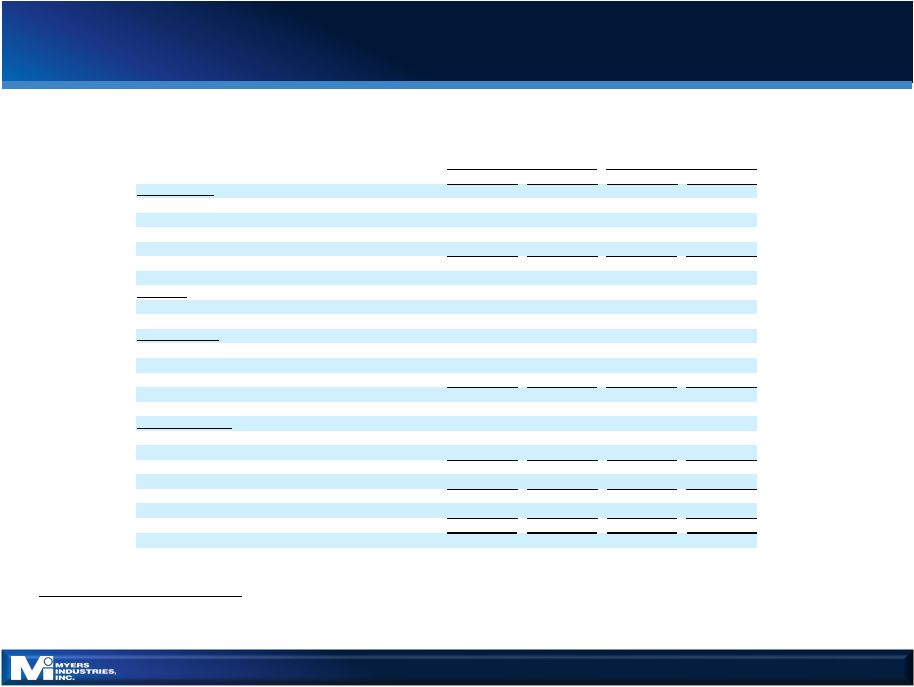
INCOME (LOSS) BEFORE TAXES BY SEGMENT (UNAUDITED)
(Dollars in thousands, except per share data)
Note on Reconciliation of Income and Earnings Data: Income (loss) excluding the items above in the text of this presentation and in this reconciliation chart is a non-GAAP financial measure that Myers Industries, Inc. calculates according to the schedule above using GAAP amounts from the unaudited Condensed Consolidated Statement of Operations. The Company believes that the excluded items are not primarily related to core operational activities. The Company believes that income (loss) excluding items that are not primarily related to core operating activities is generally viewed as providing useful information regarding a company's operating profitability. Management uses income (loss) excluding these items as well as other financial measures in connection with its decision-making activities. Income (loss) excluding these items should not be considered in isolation or as a substitute for income (loss) prepared in accordance with GAAP. The Company's method for calculating income (loss) excluding these items may not be comparable to methods used by other companies. *Income taxes are calculated using the normalized effective tax rate for each year. The normalized rate used above is 36%.
2017
2016
2017
2016
Material Handling
Operating income as reported
7,426
$
14,333
$
19,514
$
21,774
$
Asset impairments
544
1,329 544
9,874 Reduction to contingent liability
-
(2,335) -
(2,335) Restructuring expenses and other
adjustments 3,765
-
4,511 -
Operating income as adjusted 11,735 13,327
24,569
29,313
Distribution
Operating income as reported
3,025
3,966
4,563
6,502
Corporate
Expense Corporate expense as
reported (4,871)
(7,133)
(11,139)
(15,981)
Environmental
reserve -
1,550 -
1,550 CFO severance related costs
-
- -
2,011 Corporate expense as adjusted
(4,871)
(5,583)
(11,139)
(12,420)
Continuing
Operations Operating income as
reported 5,580
11,166
12,938
12,295
Total of all
adjustments above 4,309
544
5,055 11,100
Operating income as
adjusted 9,889
11,710
17,993
23,395
Interest expense,
net (1,785)
(2,053)
(3,760)
(4,072)
Income (loss)
before taxes as adjusted
8,104
9,657
14,233
19,323
Income tax
expense* (2,917)
(3,477)
(5,124)
(6,956)
Income (loss)
from continuing operations as adjusted
5,187
$
6,180
$
9,109
$
12,367
$
Adjusted earnings (loss) per
diluted share from continuing operations
0.17
$
0.21
$
0.30
$
0.41
$
Quarter Ended
June 30, Six Months Ended
June 30, |
 14 RECONCILIATION OF NON-GAAP MEASURES
MYERS INDUSTRIES, INC.
RECONCILIATION OF NON-GAAP FINANCIAL MEASURES
COMBINED STATEMENTS OF INCOME (UNAUDITED)
(Dollars in thousands) Note on Reconciliation of Income and Earnings Data: EBITDA as adjusted is a financial measure that Myers Industries, Inc. calculates according to the TTM 9/30/2016 12/31/2016 3/31/2017 6/30/2017 6/30/2017 Net Income as Reported Continuing Operations 424 $
(1,247)
$
3,128 $
2,012
$
4,317 $
Add: tax expense
547
48 2,255 1,783
4,633 Add: net interest
expense 2,015
2,086 1,975
1,785 7,861
Add: depreciation 6,182 6,142
6,700 6,984
26,008 Add: amortization
2,447
2,430 2,436
2,136 9,449
EBITDA 11,615 9,459
16,494 14,700
52,268 Add: one-time unusual
charges 897
996 42
2,998 4,933
EBITDA as Adjusted 12,512 $
10,455
$
16,536 $
17,698
$
57,201 $
Quarter Ended
TTM
3/31/2016
6/30/2016
9/30/2016
12/31/2016
12/31/2016
Net Income as Reported Continuing
Operations (3,336)
$
5,684 $
424
$
(1,247) $
1,525
$
Add: tax expense 2,446 3,429
547 48
6,470 Add: net interest
expense 2,019
2,053 2,015
2,086 8,173
Add: depreciation 6,000 6,283
6,182 6,142
24,607 Add: amortization
2,499
2,482 2,447
2,430 9,858
EBITDA 9,628 19,931
11,615 9,459
50,633 Add: one-time unusual
charges 10,556
544 897
996 12,993
EBITDA as Adjusted 20,184 $
20,475
$
12,512 $
10,455
$
63,626 $
Quarter Ended
schedule above using amounts from the unaudited Reconciliation of Non-GAAP
Financial Measures Income (Loss) Before Taxes By Segment and GAAP amounts
from the unaudited Condensed Consolidated Statement of Operations. The Company believes
that EBITDA as adjusted provides useful information regarding a company's
operating profitability. Management uses EBITDA as adjusted as well as other financial measures in connection with its decision-making activities. EBITDA as adjusted should not be considered in isolation or as a substitute for net income (loss), income (loss) before taxes or other
consolidated income data prepared in accordance with GAAP. The
Company's method for calculating EBITDA as adjusted may not be comparable to methods used by other companies. |
 15 RECONCILIATION OF NON-GAAP MEASURES
MYERS INDUSTRIES, INC.
RECONCILIATION OF FREE CASH FLOW TO GAAP NET CASH PROVIDED BY
(USED FOR) OPERATING ACTIVITIES - CONTINUING OPERATIONS (UNAUDITED) (Dollars in thousands) Note on Reconciliation of Cash Flow Data: Free cash flow is a non-GAAP financial measure that Myers Industries, Inc. calculates according to the schedule above using GAAP amounts from the unaudited Condensed Consolidated Statements of Cash Flows. The Company uses free cash flow as well as other financial measures in connection with its decision-making activities. The Company's method for calculating free cash flow may not be comparable to methods used by other companies. YTD YTD QTD June 30, 2017 March 31, 2017 June 30, 2017 Net cash provided by (used for) operating activities - continuing operations
23,634
$
-
13,049
$
=
10,585
$
Capital
expenditures (2,345)
-
(498)
= (1,847) Free cash flow
21,289
$
-
12,551
$
=
8,738
$
|
 |