Attached files
| file | filename |
|---|---|
| 8-K - FORM 8-K - ConnectOne Bancorp, Inc. | f8k_080117.htm |
Exhibit 99.1

Keefe, Bruyette & Woods Community Bank Investor Conference August 2017 New York, NY
This presentation contains forward - looking statements . Any statements about our expectations, beliefs, plans, predictions, forecasts, objectives, assumptions or future events or performance are not historical facts and may be forward - looking . These statements are often, but not always, made through the use of words or phrases such as “anticipate,” “believes,” “can,” “could,” “may,” “predicts,” “potential,” “should,” “will,” “estimate,” “plans,” “projects,” “continuing,” “ongoing,” “expects,” “intends” and similar words or phrases . Accordingly, these statements are only predictions and involve estimates, known and unknown risks, assumptions and uncertainties that could cause actual results to differ materially from those expressed in them . Our actual results could differ materially from those anticipated in such forward - looking statements as a result of several factors more fully described under “Risk Factors” in our Annual Report on Form 10 - K, Item 1 A, filed with the Securities and Exchange Commission . Any or all of our forward - looking statements in this presentation may turn out to be inaccurate . The inclusion of this forward - looking information should not be regarded as a representation by us that the future plans, estimates or expectations contemplated by us will be achieved . We have based these forward - looking statements largely on our current expectations and projections about future events and financial trends that we believe may affect our financial condition, results of operations, business strategy and financial needs . There are important factors that could cause our actual results, level of activity, performance or achievements to differ materially from the results, level of activity, performance or achievements expressed or implied by the forward looking statements including, but not limited to the risk factors described above and : ( 1 ) changes in general economic and financial market conditions ; ( 2 ) changes in the regulatory environment ; ( 3 ) economic conditions generally and in the financial services industry ; ( 4 ) changes in the economy affecting real estate values ; ( 5 ) our ability to achieve loan and deposit growth ; ( 6 ) the completion of our future acquisitions or business combinations and our ability to integrate the acquired business into our business model ; ( 7 ) projected population and income growth in our targeted market areas ; and ( 8 ) volatility and direction of market interest rates and a weakening of the economy which could materially impact credit quality trends and the ability to generate loans . All forward - looking statements are necessarily only estimates of future results and actual results may differ materially from expectations . You are, therefore, cautioned not to place undue reliance on such statements which should be read in conjunction with the other cautionary statements that are included elsewhere in this presentation . Further, any forward - looking statement speaks only as of the date on which it is made and we undertake no obligation to update or revise any forward - looking statement to reflect events or circumstances after the date on which the statement is made or to reflect the occurrence of unanticipated events . Forward Looking Statements
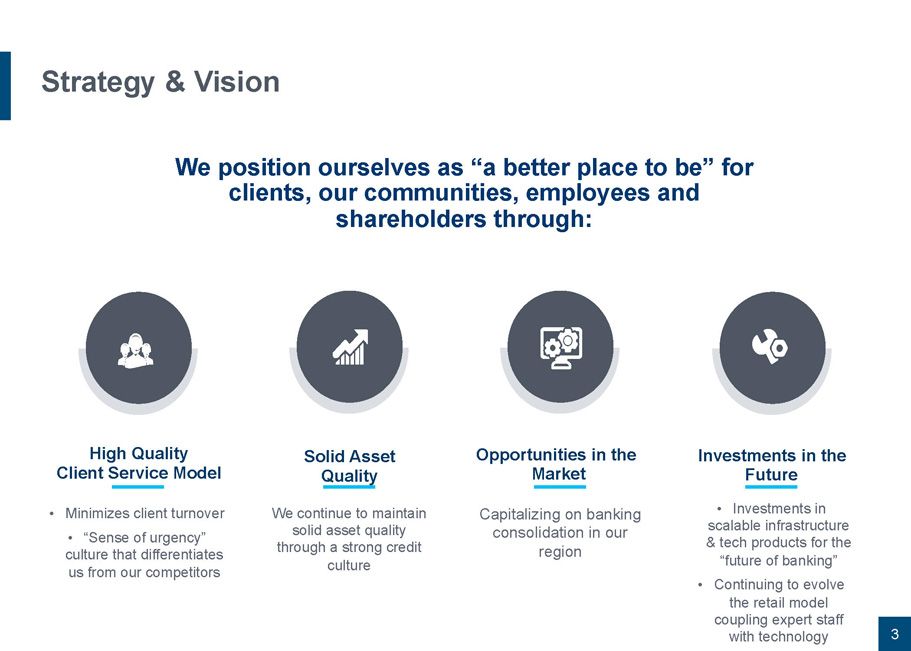
3 Strategy & Vision We position ourselves as “a better place to be” for clients, our communities, employees and shareholders through: • Minimizes client turnover • “Sense of urgency” culture that differentiates us from our competitors High Quality Client Service Model We continue to maintain solid asset quality through a strong credit culture Solid Asset Quality Capitalizing on banking consolidation in our region Opportunities in the Market Investments in the Future • Investments in scalable infrastructure & tech products for the “future of banking ” • Continuing to evolve the retail model coupling expert staff with technology
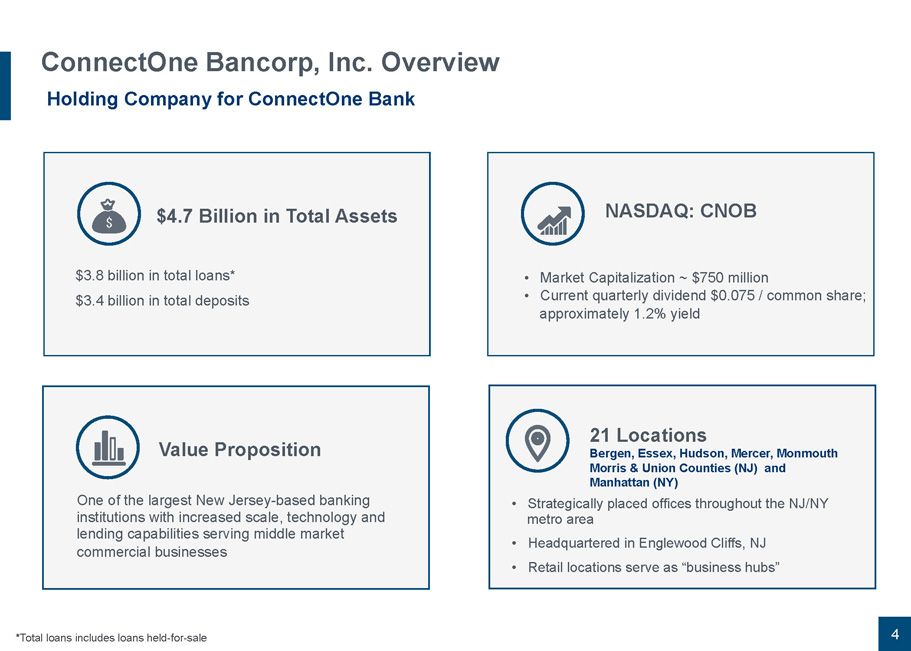
Value Proposition One of the largest New Jersey - based banking institutions with increased scale, technology and lending capabilities serving middle market commercial businesses $4.7 Billion in Total Assets $3.8 billion in total loans* $3.4 billion in total deposits ConnectOne Bancorp, Inc. Overview 21 Locations Bergen, Essex, Hudson, Mercer, Monmouth Morris & Union Counties (NJ) and Manhattan (NY) • Strategically placed offices throughout the NJ/NY metro area • Headquartered in Englewood Cliffs, NJ • Retail locations serve as “business hubs” NASDAQ: CNOB 4 *Total loans includes loans held - for - sale • Market Capitalization ~ $750 million • Current quarterly dividend $0.075 / common share; approximately 1.2 % yield Holding Company for ConnectOne Bank
5
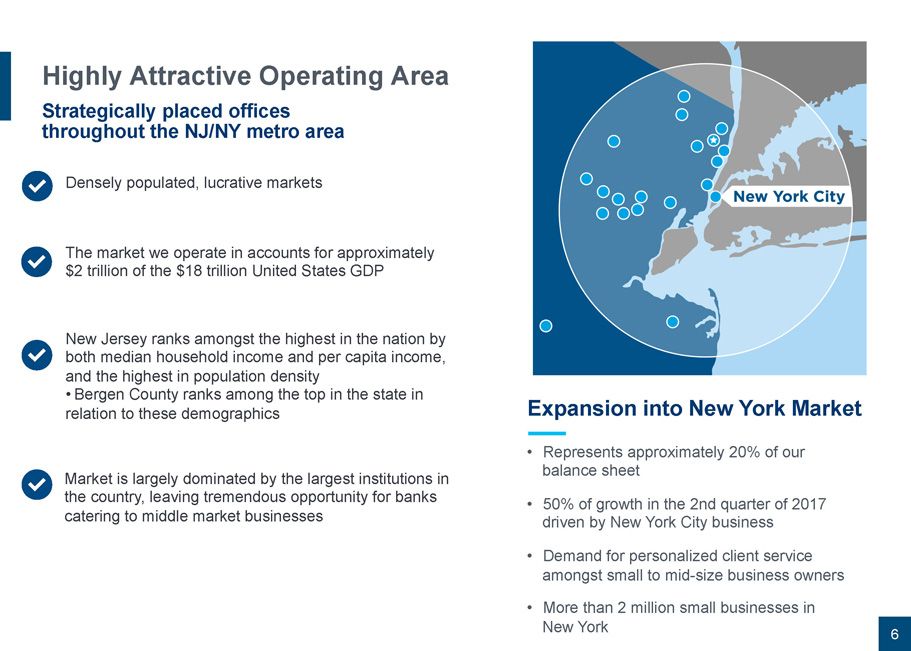
Highly Attractive Operating Area Strategically placed offices throughout the NJ/NY metro area 6 Densely populated, lucrative markets The market we operate in accounts for approximately $2 trillion of the $18 trillion United States GDP New Jersey ranks amongst the highest in the nation by both median household income and per capita income, and the highest in population density • Bergen County ranks among the top in the state in relation to these demographics Market is largely dominated by the largest institutions in the country, leaving tremendous opportunity for banks catering to middle market businesses • Represents approximately 20% of our balance sheet • 50% of growth in the 2nd quarter of 2017 driven by New York City business • Demand for personalized client service amongst small to mid - size business owners • More than 2 million small businesses in New York Expansion into New York Market
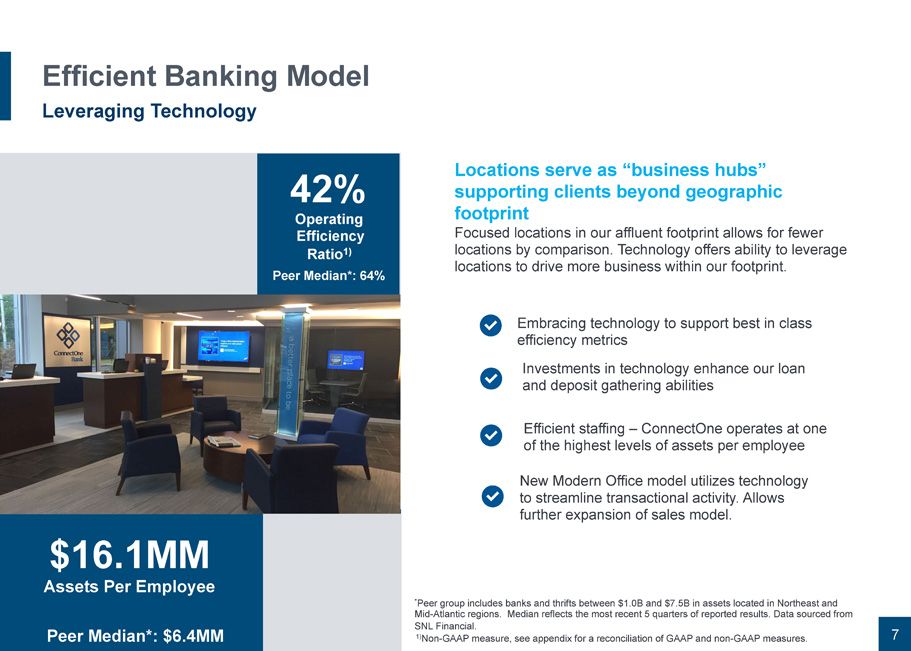
42% Operating Efficiency Ratio 1 ) 8 5% Consument Active $16.1MM Assets Per Employee Efficient Banking Model L everaging Technology Locations serve as “business hubs” supporting clients beyond geographic footprint Focused locations in our affluent footprint allows for fewer locations by comparison. Technology offers ability to leverage locations to drive more business within our footprint. Embracing technology to support best in class efficiency metrics 7 Peer Median*: 64% Peer Median*: $6.4MM Investments in technology enhance our loan and deposit gathering abilities New Modern Office model utilizes technology to streamline transactional activity. Allows further expansion of sales model. Efficient staffing – ConnectOne operates at one of the highest levels of assets per employee * Peer group includes banks and thrifts between $1.0B and $7.5B in assets located in Northeast and Mid - Atlantic regions. Median reflects the most recent 5 quarters of reported results. Data sourced from SNL Financial. 1) Non - GAAP measure, see appendix for a reconciliation of GAAP and non - GAAP measures.
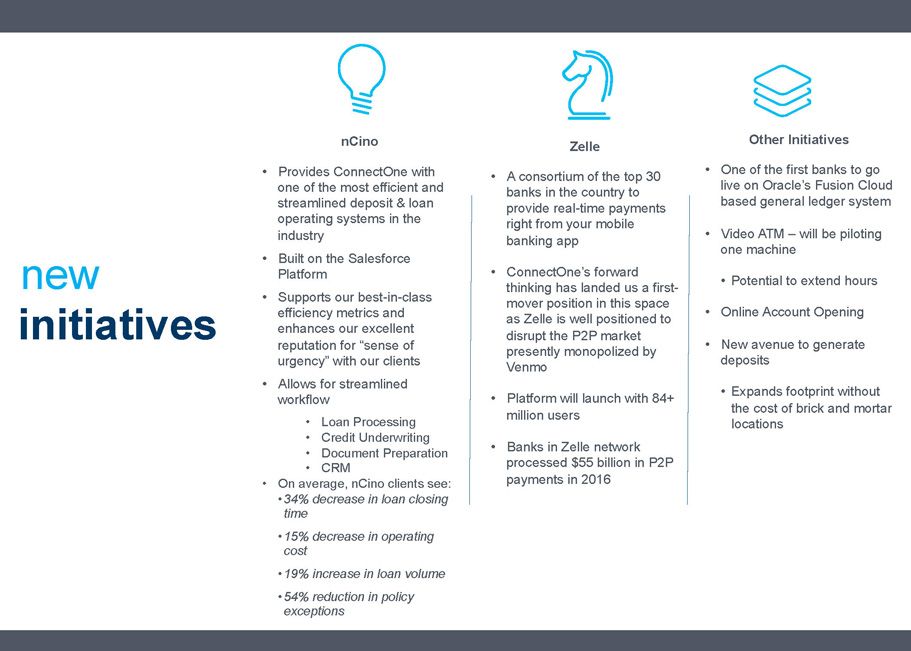
z initiatives new nCino • Provides ConnectOne with one of the most efficient and streamlined deposit & loan operating systems in the industry • Built on the Salesforce Platform • Supports our best - in - class efficiency metrics and enhances our excellent reputation for “sense of urgency” with our clients • Allows for streamlined workflow • Loan Processing • Credit Underwriting • Document Preparation • CRM • On average, nCino clients see: • 34% decrease in loan closing time • 15% decrease in operating cost • 19% increase in loan volume • 54% reduction in policy exceptions Zelle • A consortium of the top 30 banks in the country to provide real - time payments right from your mobile banking app • ConnectOne’s forward thinking has landed us a first - mover position in this space as Zelle is well positioned to disrupt the P2P market presently monopolized by Venmo • Platform will launch with 84+ million users • Banks in Zelle network processed $55 billion in P2P payments in 2016 Other Initiatives • One of the first banks to go live on Oracle’s Fusion Cloud based general ledger system • Video ATM – will be piloting one machine • Potential to extend hours • Online Account Opening • New avenue to generate deposits • Expands footprint without the cost of brick and mortar locations • Lorem ipsum dolor sit elit ipsum dolor sit amet edwart youngster oke nothing imposible hunter
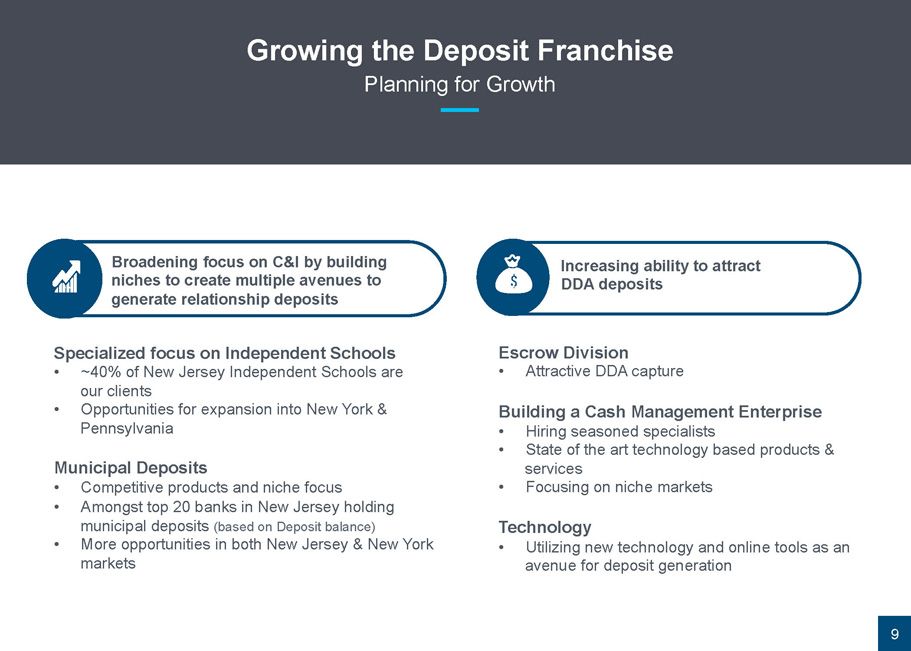
Specialized focus on Independent Schools • ~ 40% of New Jersey Independent Schools are our clients • Opportunities for expansion into New York & Pennsylvania Municipal Deposits • Competitive products and niche focus • Amongst top 20 banks in New Jersey holding municipal deposits (based on Deposit balance) • More opportunities in both New Jersey & New York markets Broadening focus on C&I by building niches to create multiple avenues to generate relationship deposits 9 Growing the Deposit Franchise Planning for Growth Escrow Division • Attractive DDA capture Building a Cash Management Enterprise • Hiring seasoned specialists • State of the art technology based products & services • Focusing on niche markets Technology • Utilizing new technology and online tools as an avenue for deposit generation Increasing ability to attract DDA deposits
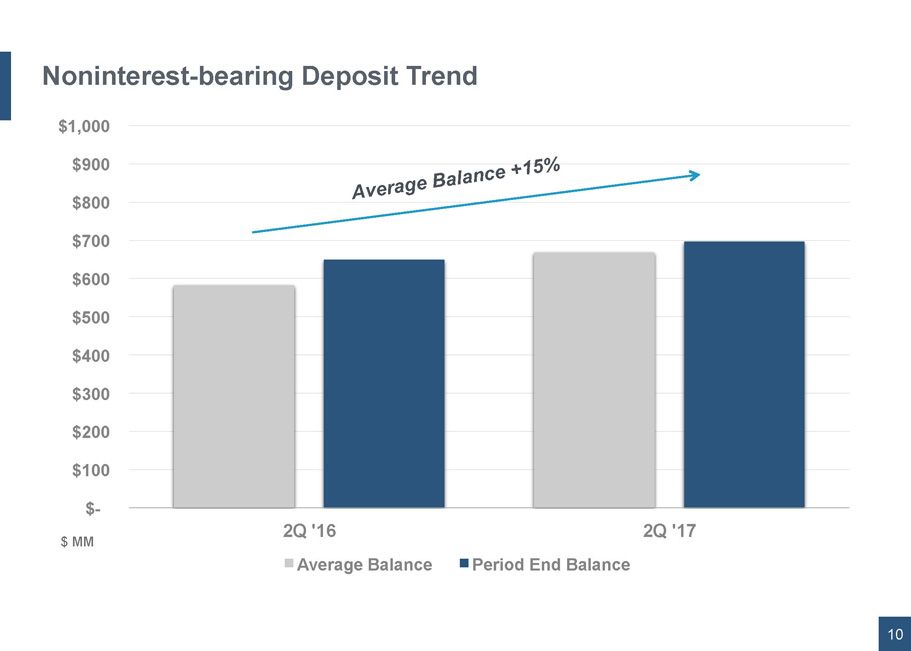
Noninterest - bearing Deposit Trend 10 $- $100 $200 $300 $400 $500 $600 $700 $800 $900 $1,000 2Q '16 2Q '17 Average Balance Period End Balance $ MM
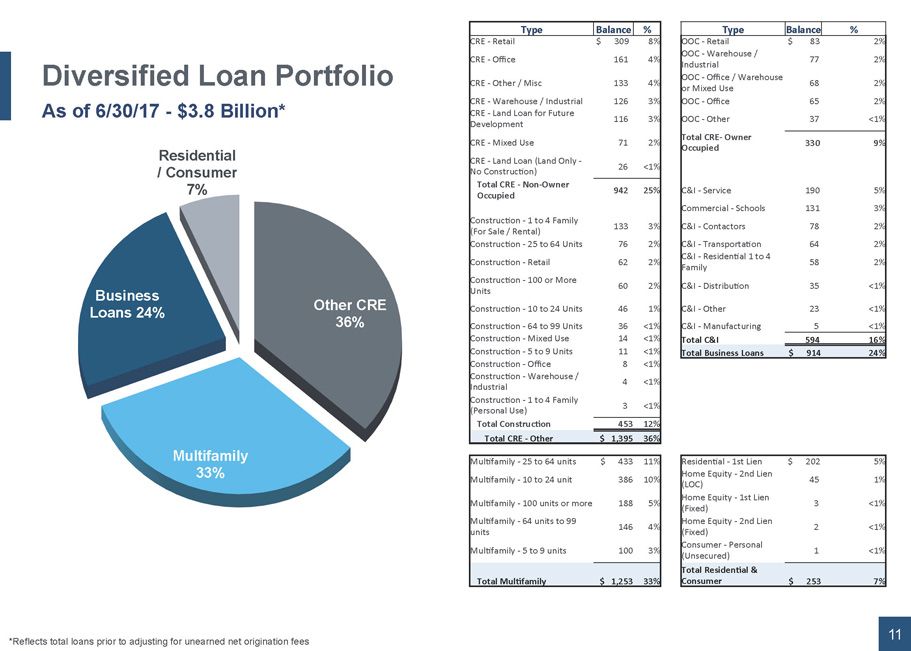
Diversified Loan Portfolio As of 6/30/17 - $3.8 Billion* 11 Other CRE 36 % Multifamily 33% Business Loans 24% Residential / Consumer 7% Type Balance % Type Balanc e % CRE - Retail $ 309 8% OOC - Retail $ 83 2% CRE - Office 161 4% OOC - Warehouse / Industrial 77 2% CRE - Other / Misc 133 4% OOC - Office / Warehouse or Mixed Use 68 2% CRE - Warehouse / Industrial 126 3% OOC - Office 65 2% CRE - Land Loan for Future Development 116 3% OOC - Other 37 <1% CRE - Mixed Use 71 2% Total CRE - Owner Occupied 330 9% CRE - Land Loan (Land Only - No Construction) 26 <1% Total CRE - Non - Owner Occupied 942 25% C&I - Service 190 5% Commercial - Schools 131 3% Construction - 1 to 4 Family (For Sale / Rental) 133 3% C&I - Contactors 78 2% Construction - 25 to 64 Units 76 2% C&I - Transportation 64 2% Construction - Retail 62 2% C&I - Residential 1 to 4 Family 58 2% Construction - 100 or More Units 60 2% C&I - Distribution 35 <1% Construction - 10 to 24 Units 46 1% C&I - Other 23 <1% Construction - 64 to 99 Units 36 <1% C&I - Manufacturing 5 <1% Construction - Mixed Use 14 <1% Total C&I 594 16% Construction - 5 to 9 Units 11 <1% Total Business Loans $ 914 24% Construction - Office 8 <1% Construction - Warehouse / Industrial 4 <1% Construction - 1 to 4 Family (Personal Use) 3 <1% Total Construction 453 12% Total CRE - Other $ 1,395 36% Multifamily - 25 to 64 units $ 433 11% Residential - 1st Lien $ 202 5% Multifamily - 10 to 24 unit 386 10% Home Equity - 2nd Lien (LOC) 45 1% Multifamily - 100 units or more 188 5% Home Equity - 1st Lien (Fixed) 3 <1% Multifamily - 64 units to 99 units 146 4% Home Equity - 2nd Lien (Fixed) 2 <1% Multifamily - 5 to 9 units 100 3% Consumer - Personal (Unsecured) 1 <1% Total Multifamily $ 1,253 33% Total Residential & Consumer $ 253 7% *Reflects total loans prior to adjusting for unearned net origination fees
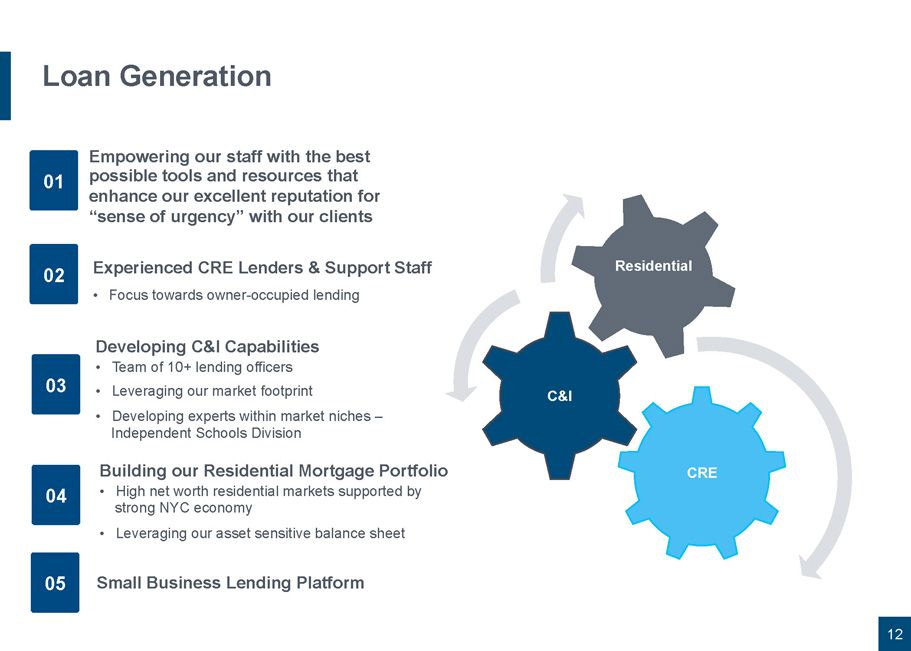
12 Loan Generation CRE C&I Residential Empowering our staff with the best possible tools and resources that enhance our excellent reputation for “sense of urgency” with our clients 01 Experienced CRE Lenders & Support Staff • Focus towards owner - occupied lending 02 Developing C&I Capabilities • Team of 10+ lending officers • Leveraging our market footprint • Developing experts within market niches – Independent Schools Division 03 04 Building our Residential Mortgage Portfolio • High net worth residential markets supported by strong NYC economy • Leveraging our a sset sensitive balance sheet Small Business Lending Platform 05
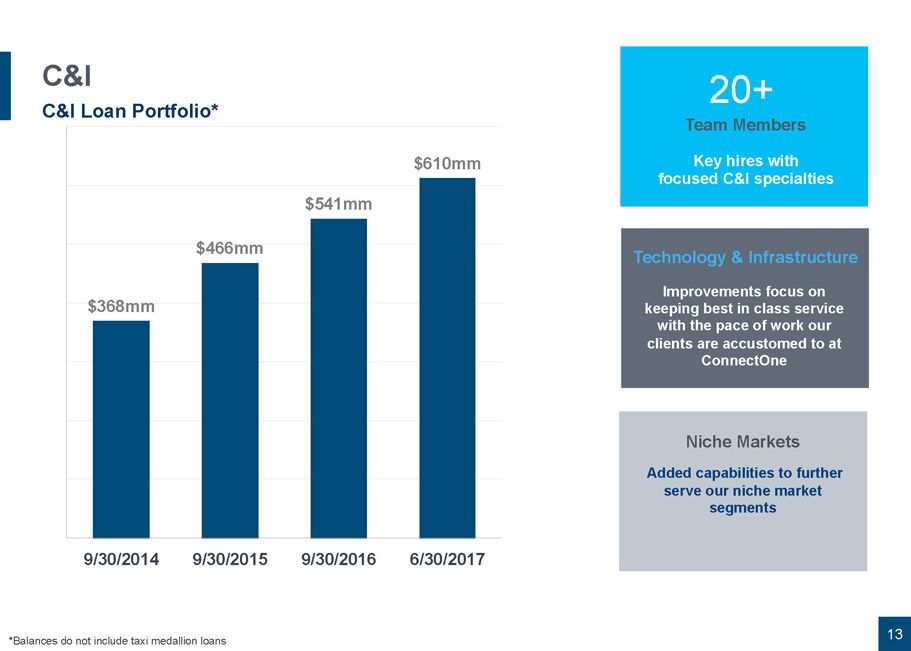
$368mm $466mm $541mm $610mm 9/30/2014 9/30/2015 9/30/2016 6/30/2017 C&I C&I Loan Portfolio* 13 Technology & Infrastructure Improvements focus on keeping best in class service with the pace of work our clients are accustomed to at ConnectOne 20 + Team Members Key hires with focused C&I specialties *Balances do not include taxi medallion loans Niche Markets Added capabilities to further serve our niche market segments
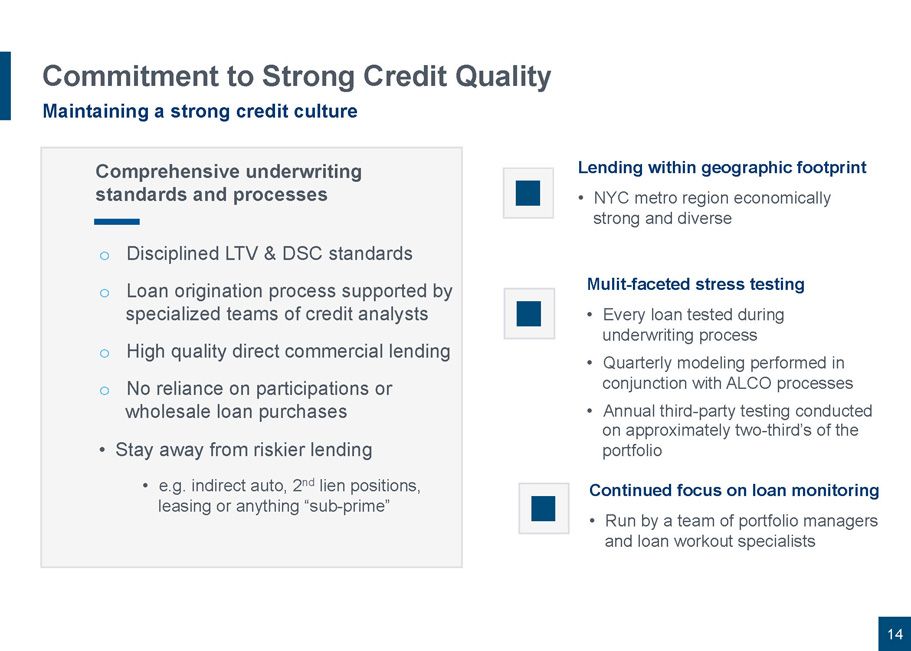
14 Commitment to Strong Credit Quality Maintaining a strong credit culture o Disciplined LTV & DSC standards o Loan origination process supported by specialized teams of credit analysts o High quality direct commercial lending o No reliance on participations or wholesale loan purchases • Stay away from riskier lending • e .g. indirect auto, 2 nd lien positions, leasing or anything “sub - prime” Comprehensive underwriting standards and processes Lending within geographic footprint • NYC metro region economically strong and diverse Mulit - faceted stress testing • Every loan tested during underwriting process • Quarterly modeling performed in conjunction with ALCO processes • Annual third - party testing conducted on approximately two - third’s of the portfolio Continued focus on loan monitoring • Run by a team of portfolio managers and loan workout specialists
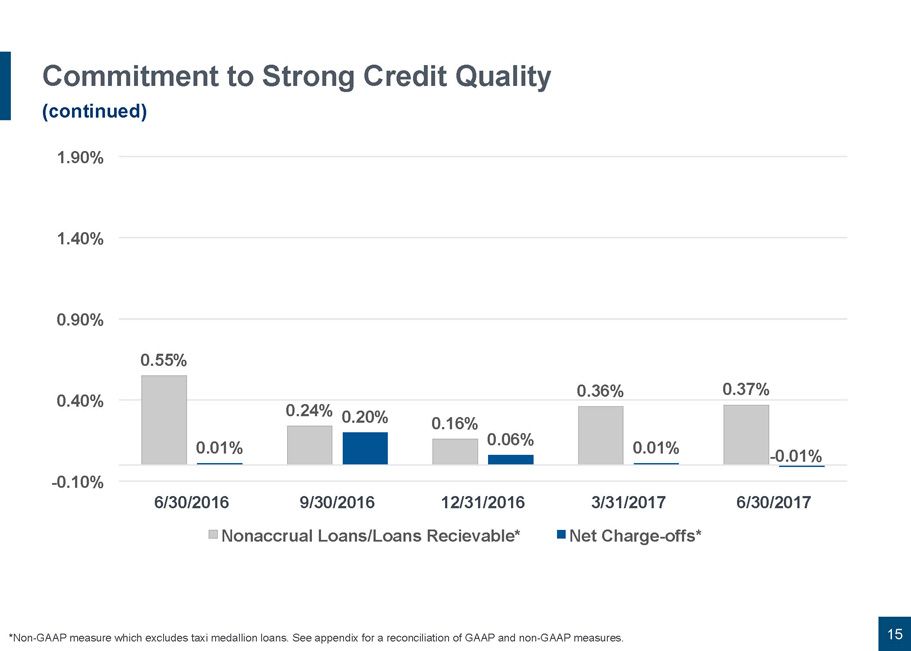
Commitment to Strong Credit Quality (continued) 15 0.55% 0.24% 0.16% 0.36% 0.37% 0.01% 0.20% 0.06% 0.01% - 0.01% -0.10% 0.40% 0.90% 1.40% 1.90% 6/30/2016 9/30/2016 12/31/2016 3/31/2017 6/30/2017 Nonaccrual Loans/Loans Recievable* Net Charge-offs* *Non - GAAP measure which excludes taxi medallion loans. See appendix for a reconciliation of GAAP and non - GAAP measures.
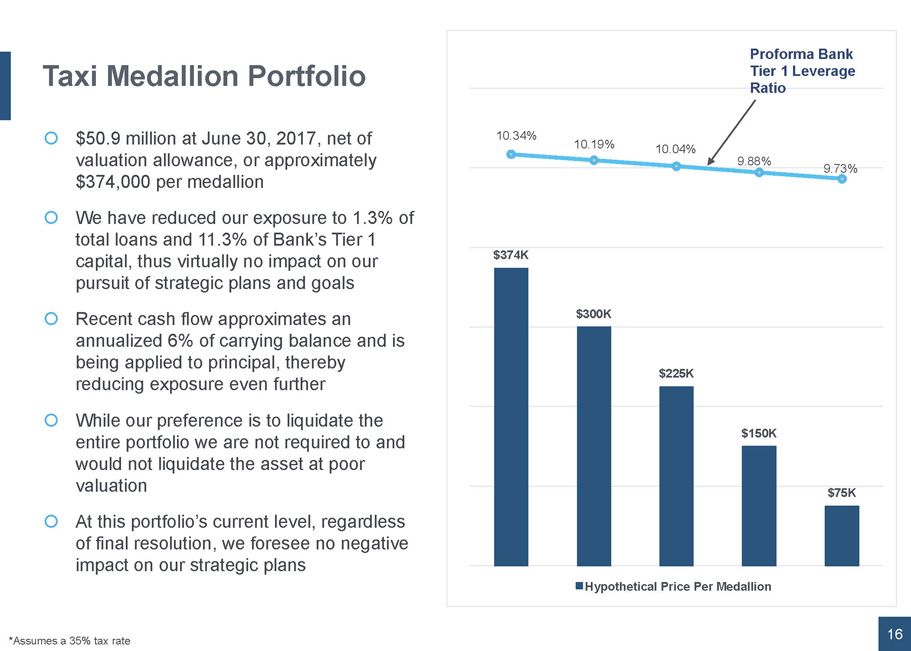
Taxi Medallion Portfolio $50.9 million at June 30, 2017, net of valuation allowance, or approximately $374,000 per medallion We have reduced our exposure to 1.3% of total loans and 11.3% of Bank’s Tier 1 capital, thus virtually no impact on our pursuit of strategic plans and goals Recent cash flow approximates an annualized 6% of carrying balance and is being applied to principal, thereby reducing exposure even further While our preference is to liquidate the entire portfolio we are not required to and would not liquidate the asset at poor valuation At this portfolio’s current level, regardless of final resolution, we foresee no negative impact on our strategic plans 16 Proforma Bank Tier 1 Leverage Ratio *Assumes a 35% tax rate $374K $300K $225K $150K $75K 10.34% 10.19% 10.04% 9.88% 9.73% Hypothetical Price Per Medallion Proforma Bank Tier 1 Leverage Ratio
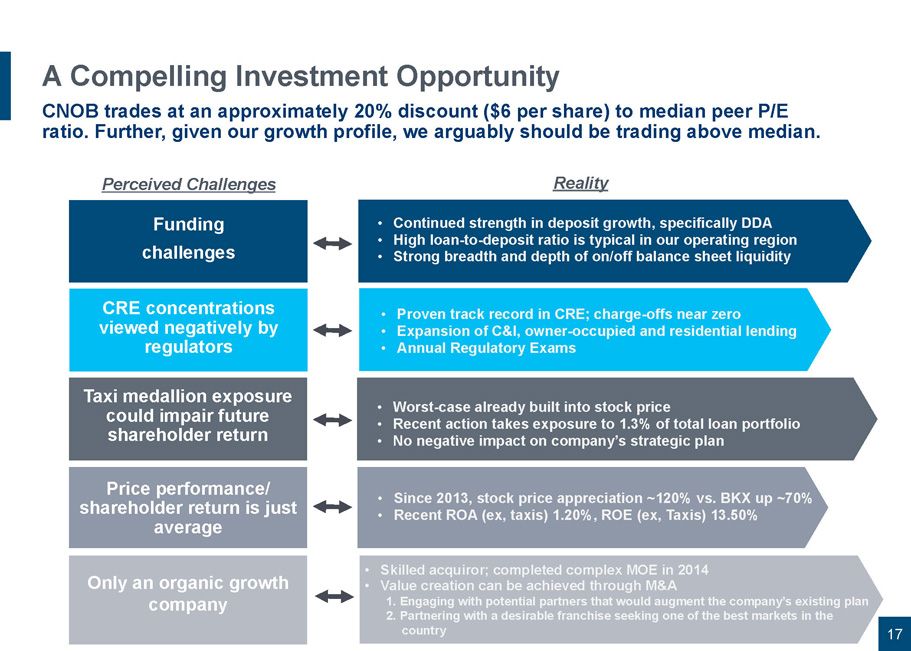
17 A Compelling Investment Opportunity CNOB trades at an approximately 20% discount ($6 per share) to median peer P/E ratio. Further, given our growth profile, we arguably should be trading above median. • Proven track record in CRE; charge - offs near zero • Expansion of C&I, owner - occupied and residential lending • Annual Regulatory Exams • Skilled acquiror; completed complex MOE in 2014 • Value creation can be achieved through M&A 1. Engaging with potential partners that would augment the company’s existing plan 2. Partnering with a desirable franchise seeking one of the best markets in the country • Since 2013, stock price appreciation ~120% vs. BKX up ~70 % • Recent ROA (ex, taxis) 1.20%, ROE (ex, Taxis) 13.50% • Worst - case already built into stock price • Recent action takes exposure to 1.3% of total loan portfolio • No negative impact on company’s strategic plan • Continued strength in deposit growth, specifically DDA • High l oan - to - deposit ratio is typical in our operating region • Strong breadth and depth of on/off balance sheet liquidity Funding c hallenges CRE concentrations viewed negatively by regulators Taxi medallion exposure could impair future shareholder return Price performance/shareholder return is just average Only an organic growth company Perceived Challenges Reality
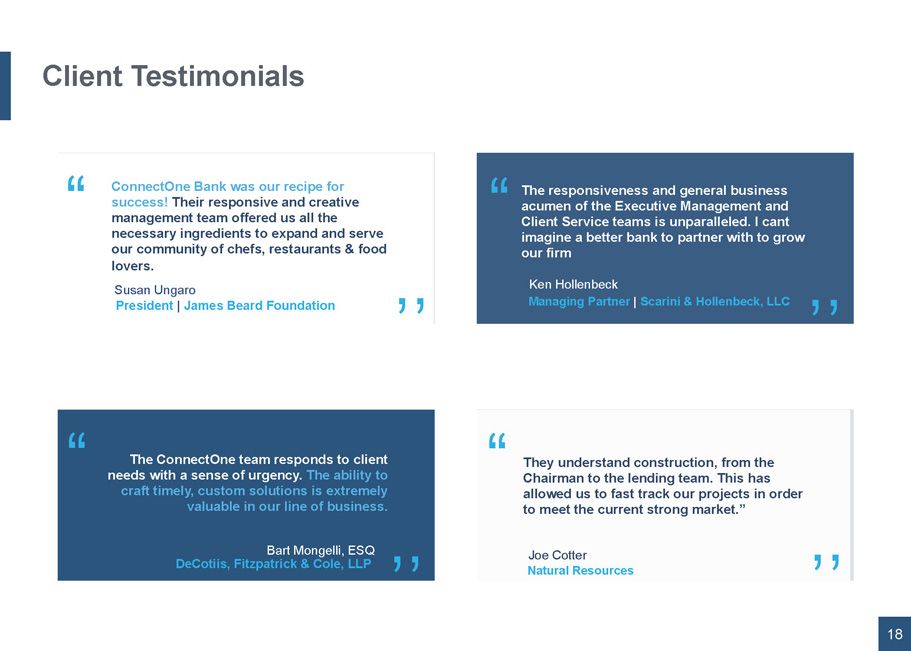
“ ,, ConnectOne Bank was our recipe for success! Their responsive and creative management team offered us all the necessary ingredients to expand and serve our community of chefs, restaurants & food lovers. “ ,, Client Testimonials 18 President | James Beard Foundation Susan Ungaro “ ,, The responsiveness and general business acumen of the Executive Management and Client Service teams is unparalleled. I cant imagine a better bank to partner with to grow our firm The ConnectOne team responds to client needs with a sense of urgency. The ability to craft timely, custom solutions is extremely valuable in our line of business. Bart Mongelli, ESQ DeCotiis, Fitzpatrick & Cole, LLP They understand construction, from the Chairman to the lending team. This has allowed us to fast track our projects in order to meet the current strong market.” “ ,, Ken Hollenbeck Managing Partner | Scarini & Hollenbeck, LLC Joe Cotter Natural Resources
20 Appendix
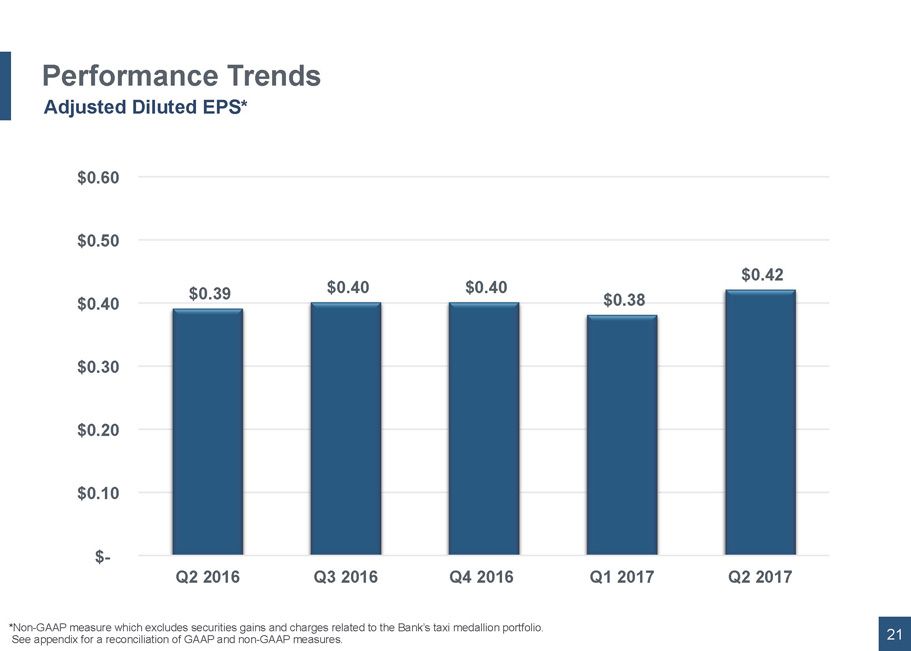
21 Performance Trends Adjusted Diluted EPS* $0.39 $0.40 $0.40 $0.38 $0.42 $- $0.10 $0.20 $0.30 $0.40 $0.50 $0.60 Q2 2016 Q3 2016 Q4 2016 Q1 2017 Q2 2017 *Non - GAAP measure which excludes securities gains and charges related to the Bank’s taxi medallion portfolio . See appendix for a reconciliation of GAAP and non - GAAP measures.
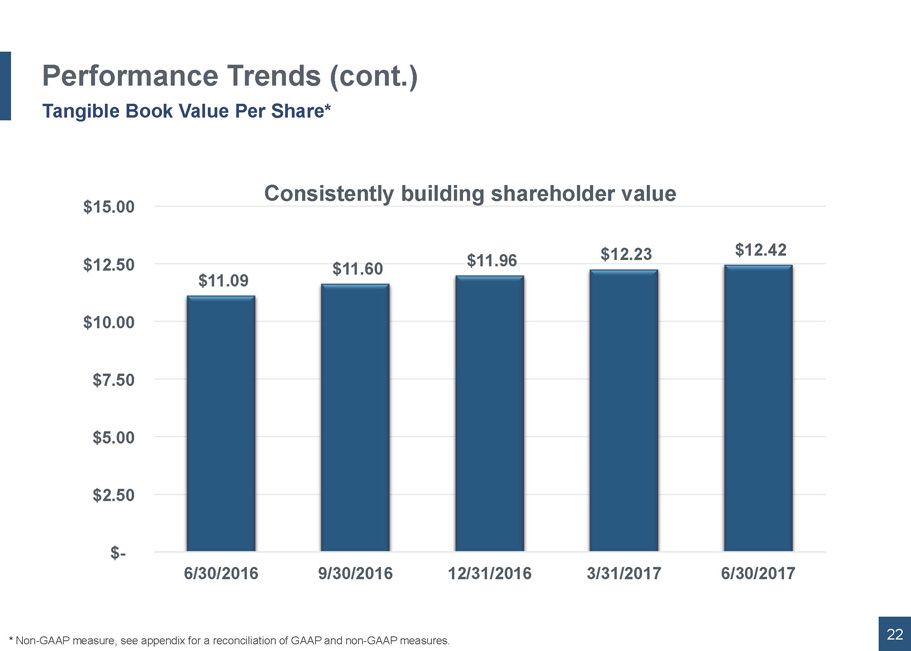
22 Performance Trends (cont.) Tangible Book Value Per Share* $11.09 $11.60 $11.96 $12.23 $12.42 $- $2.50 $5.00 $7.50 $10.00 $12.50 $15.00 6/30/2016 9/30/2016 12/31/2016 3/31/2017 6/30/2017 Consistently building shareholder value * Non - GAAP measure, see appendix for a reconciliation of GAAP and non - GAAP measures.
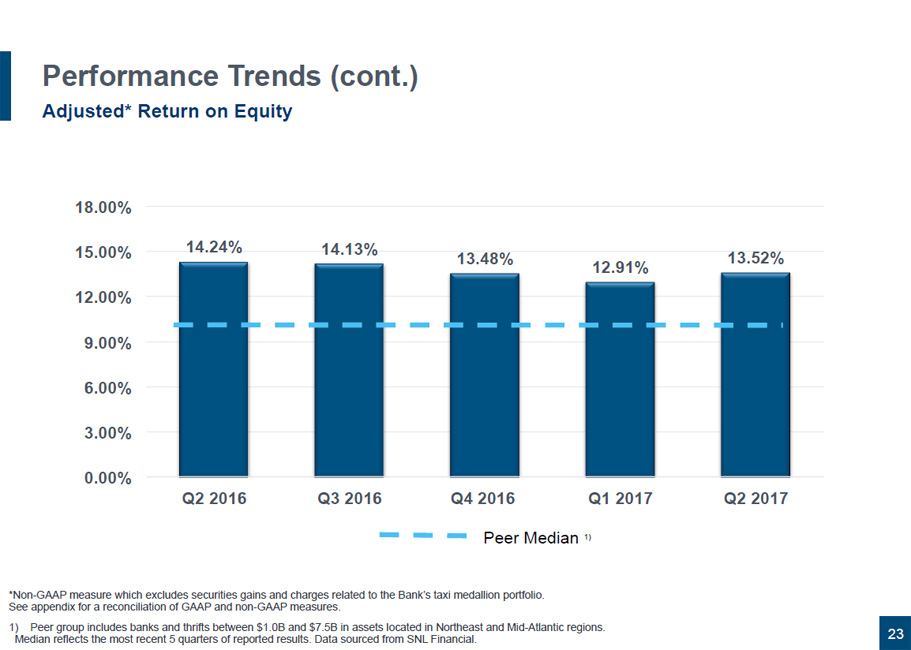
23 Performance Trends (cont.) Adjusted* Return on Equity 14.24% 14.13% 13.48% 12.91% 13.52% 0.00% 3.00% 6.00% 9.00% 12.00% 15.00% 18.00% Q2 2016 Q3 2016 Q4 2016 Q1 2017 Q2 2017 Peer Median 1) *Non - GAAP measure which excludes securities gains and charges related to the Bank’s taxi medallion portfolio. See appendix for a reconciliation of GAAP and non - GAAP measures. 1) Peer group includes banks and thrifts between $1.0B and $7.5B in assets located in Northeast and Mid - Atlantic regions. Median reflects the most recent 5 quarters of reported results. Data sourced from SNL Financial .
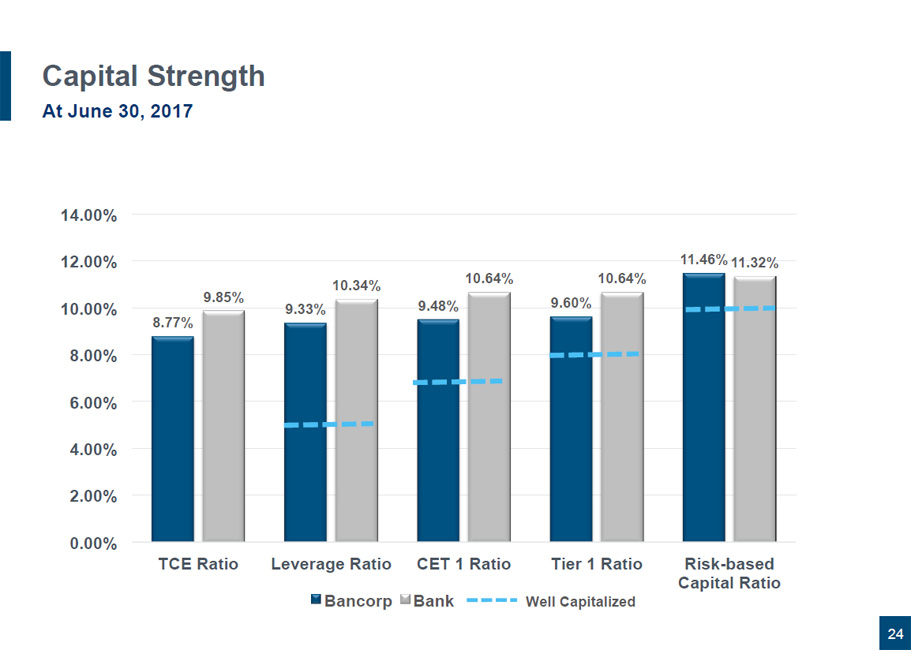
24 Capital Strength At June 30, 2017 8.77% 9.33% 9.48% 9.60% 11.46% 9.85% 10.34% 10.64% 10.64% 11.32% 0.00% 2.00% 4.00% 6.00% 8.00% 10.00% 12.00% 14.00% TCE Ratio Leverage Ratio CET 1 Ratio Tier 1 Ratio Risk-based Capital Ratio Bancorp Bank Well Capitalized
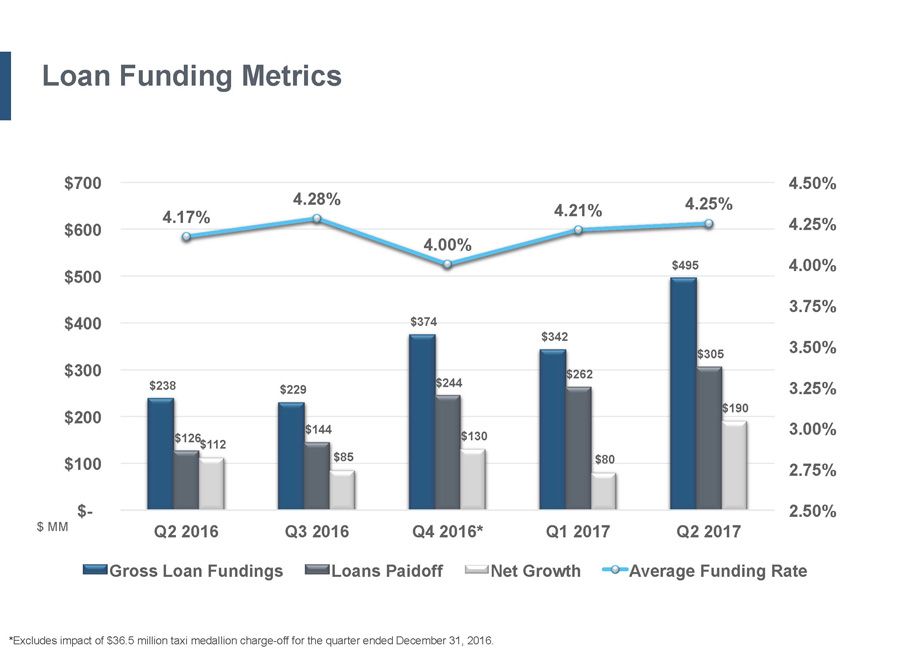
Loan Funding Metrics $238 $229 $374 $342 $495 $126 $144 $244 $262 $305 $112 $85 $130 $80 $190 4.17% 4.28% 4.00% 4.21% 4.25% 2.50% 2.75% 3.00% 3.25% 3.50% 3.75% 4.00% 4.25% 4.50% $- $100 $200 $300 $400 $500 $600 $700 Q2 2016 Q3 2016 Q4 2016* Q1 2017 Q2 2017 Gross Loan Fundings Loans Paidoff Net Growth Average Funding Rate $ MM *Excludes impact of $36.5 million taxi medallion charge - off for the quarter ended December 31, 2016 .
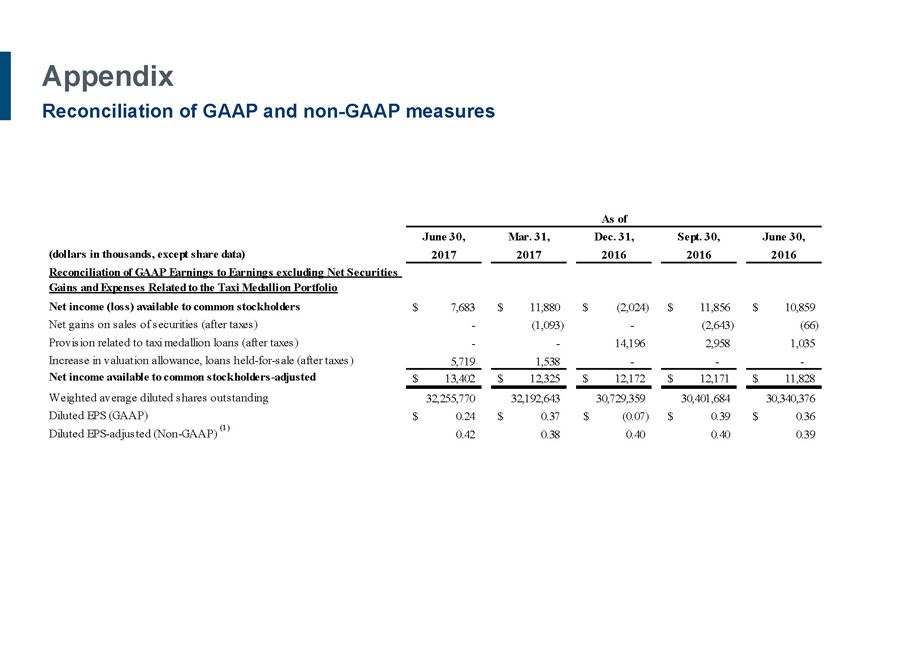
Appendix June 30, Mar. 31, Dec. 31, Sept. 30, June 30, (dollars in thousands, except share data) 2017 2017 2016 2016 2016 Reconciliation of GAAP Earnings to Earnings excluding Net Securities Gains and Expenses Related to the Taxi Medallion Portfolio Net income (loss) available to common stockholders 7,683$ 11,880$ (2,024)$ 11,856$ 10,859$ Net gains on sales of securities (after taxes) - (1,093) - (2,643) (66) Provision related to taxi medallion loans (after taxes) - - 14,196 2,958 1,035 Increase in valuation allowance, loans held-for-sale (after taxes) 5,719 1,538 - - - Net income available to common stockholders-adjusted 13,402$ 12,325$ 12,172$ 12,171$ 11,828$ Weighted average diluted shares outstanding 32,255,770 32,192,643 30,729,359 30,401,684 30,340,376 Diluted EPS (GAAP) 0.24$ 0.37$ (0.07)$ 0.39$ 0.36$ Diluted EPS-adjusted (Non-GAAP) (1) 0.42 0.38 0.40 0.40 0.39 As of Reconciliation of GAAP and non - GAAP measures
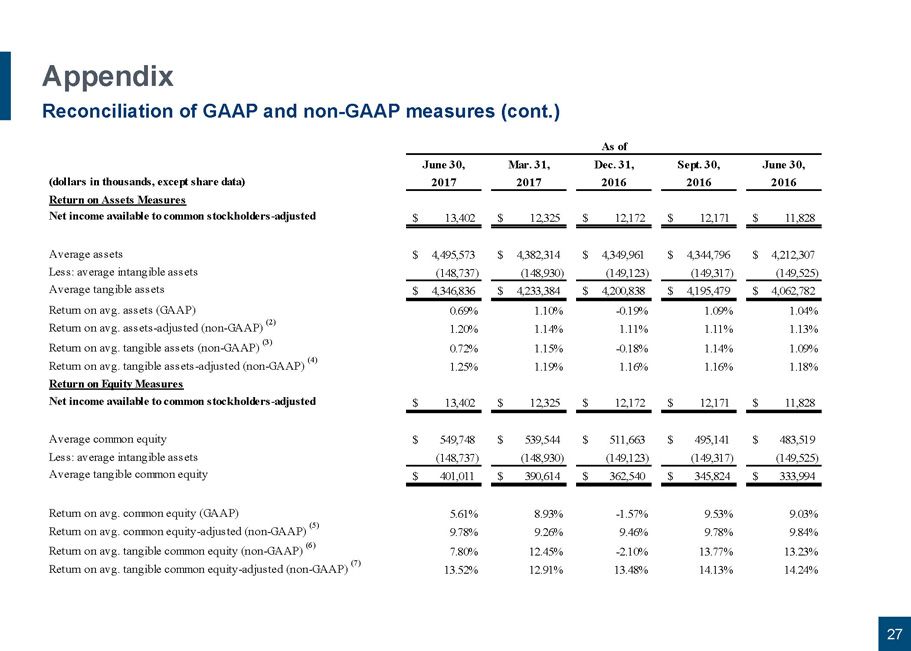
27 Appendix Reconciliation of GAAP and non - GAAP measures (cont.) June 30, Mar. 31, Dec. 31, Sept. 30, June 30, (dollars in thousands, except share data) 2017 2017 2016 2016 2016 Return on Assets Measures Net income available to common stockholders-adjusted 13,402$ 12,325$ 12,172$ 12,171$ 11,828$ Average assets 4,495,573$ 4,382,314$ 4,349,961$ 4,344,796$ 4,212,307$ Less: average intangible assets (148,737) (148,930) (149,123) (149,317) (149,525) Average tangible assets 4,346,836$ 4,233,384$ 4,200,838$ 4,195,479$ 4,062,782$ Return on avg. assets (GAAP) 0.69% 1.10% -0.19% 1.09% 1.04% Return on avg. assets-adjusted (non-GAAP) (2) 1.20% 1.14% 1.11% 1.11% 1.13% Return on avg. tangible assets (non-GAAP) (3) 0.72% 1.15% -0.18% 1.14% 1.09% Return on avg. tangible assets-adjusted (non-GAAP) (4) 1.25% 1.19% 1.16% 1.16% 1.18% Return on Equity Measures Net income available to common stockholders-adjusted 13,402$ 12,325$ 12,172$ 12,171$ 11,828$ Average common equity 549,748$ 539,544$ 511,663$ 495,141$ 483,519$ Less: average intangible assets (148,737) (148,930) (149,123) (149,317) (149,525) Average tangible common equity 401,011$ 390,614$ 362,540$ 345,824$ 333,994$ Return on avg. common equity (GAAP) 5.61% 8.93% -1.57% 9.53% 9.03% Return on avg. common equity-adjusted (non-GAAP) (5) 9.78% 9.26% 9.46% 9.78% 9.84% Return on avg. tangible common equity (non-GAAP) (6) 7.80% 12.45% -2.10% 13.77% 13.23% Return on avg. tangible common equity-adjusted (non-GAAP) (7) 13.52% 12.91% 13.48% 14.13% 14.24% As of

28 Appendix Reconciliation of GAAP and non - GAAP measures (cont.) June 30, Mar. 31, Dec. 31, Sept. 30, June 30, (dollars in thousands, except share data) 2017 2017 2016 2016 2016 Efficiency Measures Total noninterest expenses 25,303$ 18,249$ 15,252$ 14,551$ 14,352$ Increase in valuation allowance, loans held-for-sale (9,725) (2,600) - - - Foreclosed property expense (71) (100) (81) (37) 10 Operating noninterest expense 15,507$ 15,549$ 15,171$ 14,514$ 14,362$ Net interest income (tax equivalent basis) 35,839$ 33,956$ 34,120$ 33,762$ 33,112$ Noninterest income 1,422 3,002 1,573 5,576 1,570 Net gains on sales of investment securities - (1,596) - (4,131) (103) Operating revenue 37,261$ 35,362$ 35,693$ 35,207$ 34,579$ Operating efficiency ratio (non-GAAP) (8) 41.6% 44.0% 42.5% 41.2% 41.5% Net Interest Margin Average interest-earning assets 4,168,344$ 4,053,324$ 4,038,030$ 4,041,020$ 3,912,802$ Net interest income (tax equivalent basis) 35,839$ 33,956$ 34,120$ 33,762$ 33,112$ Impact of purchase accounting fair value marks (316) (649) (960) (1,045) (1,245) Adjusted net interest income 35,523$ 33,307$ 33,160$ 32,717$ 31,867$ Net interest margin (GAAP) 3.45% 3.40% 3.36% 3.32% 3.40% Adjusted net interest margin (non-GAAP) (9) 3.42% 3.33% 3.27% 3.22% 3.28% As of
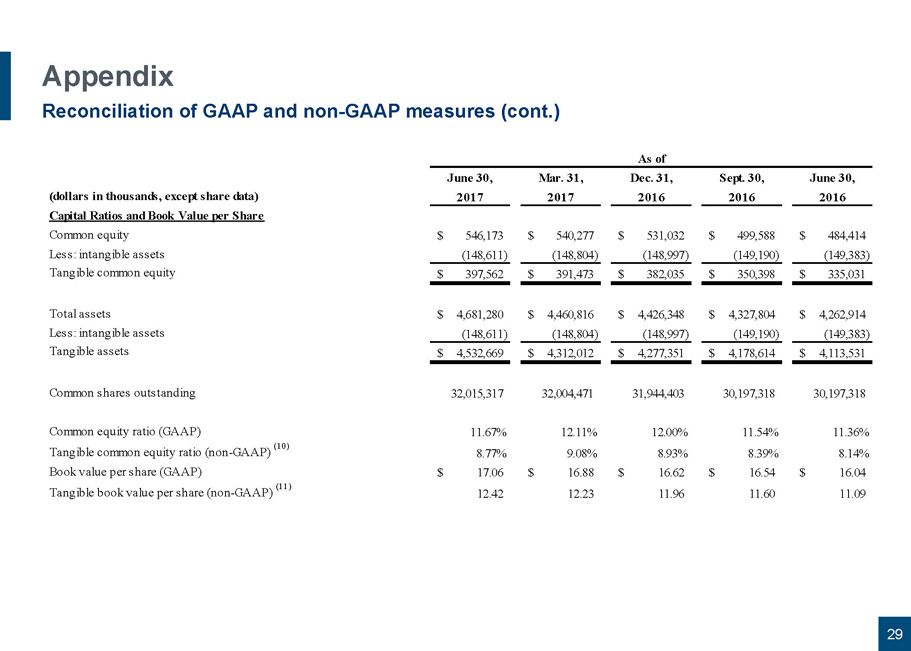
29 Appendix Reconciliation of GAAP and non - GAAP measures (cont.) June 30, Mar. 31, Dec. 31, Sept. 30, June 30, (dollars in thousands, except share data) 2017 2017 2016 2016 2016 Capital Ratios and Book Value per Share Common equity 546,173$ 540,277$ 531,032$ 499,588$ 484,414$ Less: intangible assets (148,611) (148,804) (148,997) (149,190) (149,383) Tangible common equity 397,562$ 391,473$ 382,035$ 350,398$ 335,031$ Total assets 4,681,280$ 4,460,816$ 4,426,348$ 4,327,804$ 4,262,914$ Less: intangible assets (148,611) (148,804) (148,997) (149,190) (149,383) Tangible assets 4,532,669$ 4,312,012$ 4,277,351$ 4,178,614$ 4,113,531$ Common shares outstanding 32,015,317 32,004,471 31,944,403 30,197,318 30,197,318 Common equity ratio (GAAP) 11.67% 12.11% 12.00% 11.54% 11.36% Tangible common equity ratio (non-GAAP) (10) 8.77% 9.08% 8.93% 8.39% 8.14% Book value per share (GAAP) 17.06$ 16.88$ 16.62$ 16.54$ 16.04$ Tangible book value per share (non-GAAP) (11) 12.42 12.23 11.96 11.60 11.09 As of

30 Appendix Reconciliation of GAAP and non - GAAP measures (cont.) June 30, Mar. 31, Dec. 31, Sept. 30, June 30, 2017 2017 2016 2016 2016 NCO Detail Net loan charge-offs: Charge-offs 10$ 72$ 37,074$ 1,910$ 77$ Recoveries (60) (129) (2) (12) (16) Net loan charge-offs (50)$ (57)$ 37,072$ 1,898$ 61$ as a % of average total loans (annualized) -0.01% -0.01% 4.23% 0.22% 0.01% Net loan charge-offs (excluding taxis): Charge-offs (excluding taxis) 10$ 71$ 540$ 1,694$ 77$ Recoveries (excluding taxis) (60) (5) (2) (12) (16) Net loan charge-offs (excluding taxis) (50)$ 66$ 538$ 1,682$ 61$ as a % of average total loans (annualized) -0.01% 0.01% 0.06% 0.20% 0.01% Nonaccrual loans (excluding taxis) 14,055 12,790 5,734 7,856 18,029 Nonaccrual loans (excluding taxis) as a % of loans receivable 0.37% 0.36% 0.16% 0.24% 0.55% Loans receivable (excluding taxis) 3,761,572$ 3,571,663$ 3,475,832$ 3,342,525$ 3,272,502$ Three Months Ended
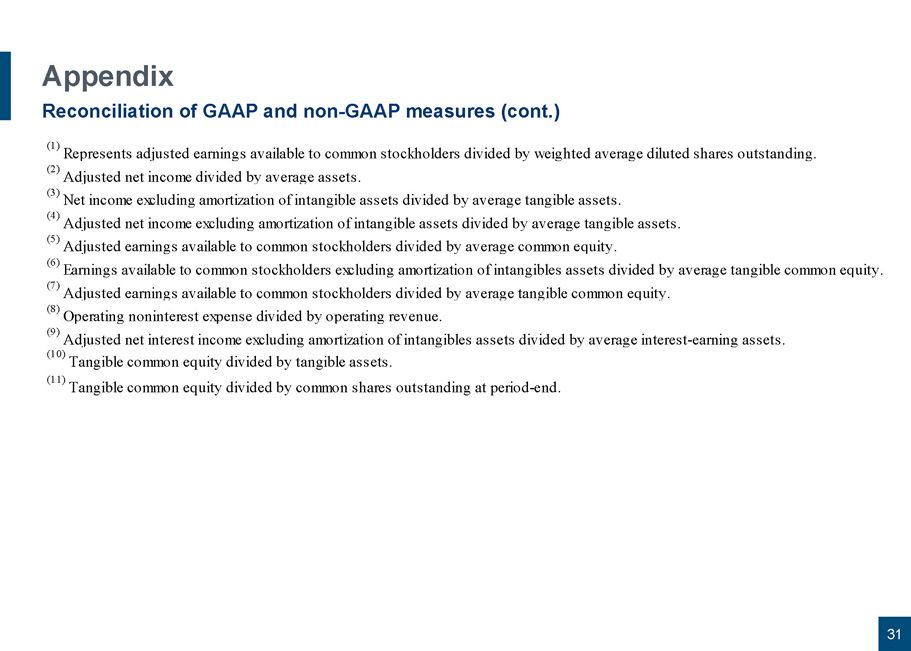
31 Appendix Reconciliation of GAAP and non - GAAP measures (cont.) (1) Represents adjusted earnings available to common stockholders divided by weighted average diluted shares outstanding. (2) Adjusted net income divided by average assets. (3) Net income excluding amortization of intangible assets divided by average tangible assets. (4) Adjusted net income excluding amortization of intangible assets divided by average tangible assets. (5) Adjusted earnings available to common stockholders divided by average common equity. (6) Earnings available to common stockholders excluding amortization of intangibles assets divided by average tangible common equity. (7) Adjusted earnings available to common stockholders divided by average tangible common equity. (8) Operating noninterest expense divided by operating revenue. (9) Adjusted net interest income excluding amortization of intangibles assets divided by average interest-earning assets. (10) Tangible common equity divided by tangible assets. (11) Tangible common equity divided by common shares outstanding at period-end.