Attached files
| file | filename |
|---|---|
| EX-31.1 - PERSONAL CERTIFICATION OF THE CHIEF EXECUTIVE OFFICER PURSUANT TO SECTION 302 - ConnectOne Bancorp, Inc. | connect3203971-ex311.htm |
| EX-32 - PERSONAL CERTIFICATION OF THE CEO AND THE CFO - ConnectOne Bancorp, Inc. | connect3203971-ex32.htm |
| EX-31.2 - PERSONAL CERTIFICATION OF THE CHIEF FINANCIAL OFFICER PURSUANT TO SECTION 302 - ConnectOne Bancorp, Inc. | connect3203971-ex312.htm |
| EX-23.1 - CONSENT OF CROWE HORWATH LLP - ConnectOne Bancorp, Inc. | connect3203971-ex231.htm |
| EX-21.1 - SUBSIDIARIES OF THE REGISTRANT - ConnectOne Bancorp, Inc. | connect3203971-ex211.htm |
| EX-12.1 - STATEMENT OF RATIOS OF EARNINGS TO FIXED CHARGES - ConnectOne Bancorp, Inc. | connect3203971-ex121.htm |
UNITED STATES
SECURITIES AND EXCHANGE COMMISSION
Washington, D.C. 20549
FORM 10-K
(Mark One)
| x | ANNUAL REPORT PURSUANT TO SECTION 13 OR 15(d) OF THE SECURITIES EXCHANGE ACT OF 1934. |
For the Fiscal Year Ended December 31, 2016
OR
| ¨ | TRANSITION REPORT PURSUANT TO SECTION 13 OR 15(d) OF THE SECURITIES EXCHANGE ACT OF 1934. |
For the Transition Period from to
Commission File Number: 000-11486

ConnectOne Bancorp, Inc.
(Exact name of registrant as specified in its charter)
| New Jersey | 52-1273725 | |
(State or Other Jurisdiction of Incorporation or Organization) |
(IRS Employer Identification Number) |
301 Sylvan Avenue
Englewood Cliffs, New Jersey 07632
(Address of Principal Executive Offices) (Zip Code)
201-816-8900
(Registrant’s Telephone Number, Including Area Code)
Securities registered pursuant to Section 12(b) of the Exchange Act:
| Title of each class | Name of each exchange on which registered | |
| Common Stock, no par value | NASDAQ |
Securities registered pursuant to Section 12(g) of the Exchange Act: None
Indicate by checkmark if the registrant is a well-known seasoned issuer, as defined in Rule 405 of the Securities Act. Yes ¨ No x
Indicate by checkmark if the registrant is not required to file reports pursuant to Section 13 or 15(d) of the Act. Yes ¨ No x
Indicate by check mark whether the registrant (1) has filed all reports required to be filed by Section 13 or 15 (d) of the Securities Exchange Act of 1934 during the preceding 12 months (or for such shorter period that the registrant was required to file such reports), and (2) has been subject to such filing requirements for the past 90 days. Yes x No ¨
Indicate by check mark whether the registrant has submitted electronically and posted on its corporate Web site, if any, every Interactive Data File required to be submitted and posted pursuant to Regulation S-T (232,405 of this chapter) during the preceding 12 months (or for such shorter period that the registrant has required to submit and post such files.) Yes x No ¨
Indicate by check mark if disclosure of delinquent filers pursuant to Item 405 of Regulation S-K is not contained herein, and will not be contained, to the best of Registrant’s knowledge, in definitive proxy or information statements incorporated by reference in Part III of the Form 10-K or any amendment to the Form 10-K. x
Indicate by check mark whether the registrant is a large accelerated filer, an accelerated filer, a nonaccelerated filer or a smaller reporting company. See definition of “large accelerated filer”, “accelerated filer” and “smaller reporting company” in Rule 12b-2 of the Securities Exchange Act of 1934.
| Large Accelerated Filer ¨ | Accelerated Filer x | Non-Accelerated ¨ | Small Reporting Company ¨ |
Indicate by check mark whether the registrant is a shell company (as defined in Rule 12b-2 of the Act) Yes ¨ or No x
The aggregate market value of the voting and nonvoting common equity held by nonaffiliates computed by reference to the price at which the common equity was last sold or the average bid and ask price of such common equity, as of the last business day of the registrant’s most recently completed second fiscal quarter - $368.0 million.
Shares Outstanding on March 10, 2017
Common Stock, no par value: 31,973,356 shares
DOCUMENTS INCORPORATED BY REFERENCE
Definitive proxy statement in connection with the 2017 Annual Stockholders Meeting to be filed with the Commission pursuant to Regulation 14A will be incorporated by reference in Part III
CONNECTONE BANCORP, INC.
Information included in or incorporated by reference in this Annual Report on Form 10-K, other filings with the Securities and Exchange Commission, the Company’s press releases or other public statements, contain or may contain forward looking statements. Please refer to a discussion of the Company’s forward looking statements and associated risks in “Item 1 - Business - Historical Development of Business” and “Item 1A - Risk Factors” in this Annual Report on Form 10-K.
CONNECTONE BANCORP, INC.
FORM 10-K
Historical Development of Business
This report, in Item 1, Item 7 and elsewhere, includes forward-looking statements within the meaning of Sections 27A of the Securities Act of 1933, as amended, and 21E of the Securities Exchange Act of 1934, as amended, that involve inherent risks and uncertainties. These forward-looking statements concern the financial condition, results of operations, plans, objectives, future performance and business of ConnectOne Bancorp, Inc. and its subsidiaries, including statements preceded by, followed by or that include words or phrases such as “believes,” “expects,” “anticipates,” “plans,” “trend,” “objective,” “continue,” “remain,” “pattern” or similar expressions or future or conditional verbs such as “will,” “would,” “should,” “could,” “might,” “can,” “may” or similar expressions. There are a number of important factors that could cause future results to differ materially from historical performance and these forward-looking statements. Factors that might cause such a difference include, but are not limited to: (1) competitive pressures among depository institutions may increase significantly; (2) changes in the interest rate environment may reduce interest margins; (3) prepayment speeds, loan origination and sale volumes, charge-offs and loan loss provisions may vary substantially from period to period; (4) general economic conditions may be less favorable than expected; (5) political developments, wars or other hostilities may disrupt or increase volatility in securities markets or other economic conditions; (6) legislative or regulatory changes or actions may adversely affect the businesses in which ConnectOne Bancorp, Inc. is engaged; (7) changes and trends in the securities markets may adversely impact ConnectOne Bancorp, Inc.; (8) a delayed or incomplete resolution of regulatory issues could adversely impact our planning; (9) difficulties in integrating any businesses that we may acquire, which may increase our expenses and delay the achievement of any benefits that we may expect from such acquisitions; (10) the impact of reputation risk created by the developments discussed above on such matters as business generation and retention, funding and liquidity could be significant; and (11) the outcome of any future regulatory and legal investigations and proceedings may not be anticipated. Further information on other factors that could affect the financial results of ConnectOne Bancorp, Inc. are included in Item 1A of this Annual Report on Form 10-K and in ConnectOne Bancorp’s other filings with the Securities and Exchange Commission. These documents are available free of charge at the Commission’s website at http://www.sec.gov and/or from ConnectOne Bancorp, Inc. ConnectOne Bancorp, Inc. assumes no obligation to update forward-looking statements at any time.
ConnectOne Bancorp, Inc., (the “Company” and with ConnectOne Bank, “we” or “us”) a one-bank holding company, was incorporated in the state of New Jersey on November 12, 1982 as Center Bancorp, Inc. and commenced operations on May 1, 1983 upon the acquisition of all outstanding shares of capital stock of Union Center National Bank, its then principal subsidiary.
On January 20, 2014, the Company entered into an Agreement and Plan of Merger (the “Merger Agreement”) with ConnectOne Bancorp, Inc., a New Jersey corporation (“Legacy ConnectOne”). Effective July 1, 2014, the Company completed the merger contemplated by the Merger Agreement (the “Merger”) with Legacy ConnectOne merging with and into the Company, with the Company as the surviving corporation. Also at closing, the Company changed its name to “ConnectOne Bancorp, Inc.” and changed its NASDAQ trading symbol to “CNOB”. Immediately following the consummation of the Merger, Union Center National Bank merged with and into ConnectOne Bank, a New Jersey-chartered commercial bank (“ConnectOne Bank” or the “Bank”) and a wholly-owned subsidiary of Legacy ConnectOne, with ConnectOne Bank continuing as the surviving bank. Subject to the terms and conditions of the Merger Agreement, each share of common stock, no par value per share, of Legacy ConnectOne was converted into 2.6 shares of the Company’s common stock.
The Company’s primary activity, at this time, is to act as a holding company for the Bank and its other subsidiaries. As used herein, the term “Parent Corporation” shall refer to the Company on an unconsolidated basis.
The Company owns 100% of the voting shares of Center Bancorp, Inc. Statutory Trust II, through which it issued trust preferred securities. The trust exists for the exclusive purpose of (i) issuing trust securities representing undivided beneficial interests in the assets of the trust; (ii) investing the gross proceeds of the trust securities in $5.2 million of junior subordinated deferrable interest debentures (subordinated debentures) of the Company; and (iii) engaging in only those activities necessary or incidental thereto. These subordinated debentures and the related income effects are not eliminated in the consolidated financial statements as the statutory business trust is not consolidated in accordance with Financial Accounting Standards Board (“FASB”) ASC 810-10 “Consolidation of Variable Interest Entities.” Distributions on the subordinated debentures owned by the subsidiary trust have been classified as interest expense in the Consolidated Statements of Income. See Note 11 of the Consolidated Financial Statements.
Except as described above, the Company’s wholly-owned subsidiaries are all included in the Company’s consolidated financial statements. These subsidiaries include an advertising subsidiary; an insurance subsidiary offering annuity products, property and casualty, life and health insurance, and various investment subsidiaries which hold, maintain and manage investment assets for the Company. The Company’s subsidiaries also include a real estate investment trust (the “REIT”) which holds a portion of the Company’s real estate loan portfolio. All subsidiaries mentioned above are directly or indirectly wholly owned by the Company, except that the Company owns less than 100% of the preferred stock of the REIT. A real estate investment trust must have 100 or more shareholders. The REIT has issued less than 20% of its outstanding non-voting preferred stock to individuals, primarily Bank personnel and directors.
| - 3 - | ||
SEC Reports and Corporate Governance
The Company makes its Annual Report on Form 10-K, Quarterly Reports on Form 10-Q and Current Reports on Form 8-K and amendments thereto available on its website at www.ConnectOneBank.com without charge as soon as reasonably practicable after filing or furnishing them to the SEC. Also available on the website are the Company’s corporate code of conduct that applies to all of the Company’s employees, including principal officers and directors, and charters for the Audit Committee, Nominating and Corporate Governance Committee and Compensation Committee.
Additionally, the Company will provide without charge, a copy of its Annual Report on Form 10-K to any shareholder by mail. Requests should be sent to ConnectOne Bancorp, Inc., Attention: Shareholder Relations, 301 Sylvan Avenue, Englewood Cliffs, New Jersey 07632.
Narrative Description of the Business
We offer a broad range of deposit and loan products and services to the general public and, in particular, to small and mid-sized businesses, local professionals and individuals residing, working and conducting business in our trade area.
While we expect to take an opportunistic approach to acquisitions, considering opportunities to purchase or merge with whole institutions, branches or lines of business that complement our existing strategy, the bulk of our future growth may be organic. Our goal is to open new offices in the counties contained in our broader trade area discussed below. However, we do not believe that we need to establish a physical location in each market that we serve. We believe that advances in technology have created new delivery channels which allow us to service customers and maintain business relationships without a physical presence, and that these customers can also be serviced through a regional office. We believe the key to customer acquisition and retention is establishing quality business relationship officers who will frequently go to the customer, rather than having the customer come into the branch.
We emphasize superior customer service and relationship banking. The Bank offers high-quality service by providing more direct, personal attention than we believe is offered by competing financial institutions, the majority of which are branch offices of banks headquartered outside our primary trade area. By emphasizing the need for a professional, responsive and knowledgeable staff, we offer a superior level of service to our customers. As a result of senior management’s availability for consultation on a daily basis, we believe we offer customers a quicker response on loan applications and other banking transactions than competitors, whose decisions may be made in distant headquarters. We believe that this response time results in a pricing advantage to us, in that we frequently may exceed competitors’ loan pricing and still win customers. We also provide state-of-the-art banking technology, including remote deposit capture, internet banking and mobile banking, to provide our customers with the most choices and maximum flexibility. We believe that this combination of quick, responsive and personal service and advanced technology provides the Bank’s customers with a superior banking experience.
The Bank, through its subsidiary, Center Financial Group LLC, provides financial services, including brokerage services, insurance and annuities, mutual funds and financial planning.
Our Market Area
Our banking offices are located in Bergen, Union, Morris, Essex, Hudson, Mercer and Monmouth Counties in New Jersey and in the borough of Manhattan, in New York City, which include some of the most affluent markets in the United States. We also attract business and customers from broader regions, including the other boroughs of New York City as well as Westchester County and Long Island in New York State.
Products and Services
We derive a majority of our revenue from net interest income (i.e., the difference between the interest we receive on our loans and securities and the interest we pay on deposits and other borrowings). We offer a broad range of deposit and loan products. In addition, to attract the business of consumer and business customers, we also provide a broad array of other banking services. Products and services provided include personal and business checking accounts, retirement accounts, money market accounts, time and savings accounts, credit cards, wire transfers, access to automated teller services, internet banking, Treasury Direct, ACH origination, lockbox services and mobile banking by phone. In addition, we offer safe deposit boxes. The Bank also offers remote deposit capture banking for both retail and business customers, providing the ability to electronically scan and transmit checks for deposit, reducing time and cost.
Noninterest demand deposit products include “Totally Free Checking” and “Simply Better Checking” for retail clients and “Small Business Checking” and “Analysis Checking” for commercial clients. Interest-bearing checking accounts require minimum balances for both retail and commercial clients and include “Consumer Interest Checking” and “Business Interest Checking”. Money market accounts consist of products that provide a market rate of interest to depositors but offer a limited number of preauthorized withdrawals. Our savings accounts consist of statement type accounts. Time deposits consist of certificates of deposit, including those held in IRA accounts, generally with initial maturities ranging from 7 days to 60 months and brokered certificates of deposit, which we use for asset liability management purposes and to supplement other sources of funding. CDARS/ICS Reciprocal deposits are offered based the Bank’s participation in Promontory Interfinancial
| - 4 - | ||
Network, LLC. Customers who are FDIC insurance sensitive are able to place large dollar deposits with the Company and the Company uses CDARS to place those funds into certificates of deposit issued by other banks in the Network. This occurs in increments of less than the FDIC insurance limits so that both the principal and interest are eligible for FDIC insurance coverage in amounts larger than the standard dollar amount. The FDIC currently considers these funds as brokered deposits.
Deposits serve as the primary source of funding for our interest-earning assets, but also generate noninterest revenue through insufficient funds fees, stop payment fees, wire transfer fees, safe deposit rental fees, debit card income, including foreign ATM fees and credit and debit card interchange, and other miscellaneous fees. In addition, the Bank generates additional noninterest revenue associated with residential loan originations and sales, loan servicing, late fees and merchant services.
We offer personal and commercial business loans on a secured and unsecured basis, revolving lines of credit, commercial mortgage loans, and residential mortgages on both primary and secondary residences, home equity loans, bridge loans and other personal purpose loans. However, we are not and have not historically been a participant in the sub-prime lending market.
Commercial loans are loans made for business purposes and are primarily secured by collateral such as cash balances with the Bank, marketable securities held by or under the control of the Bank, business assets including accounts receivable, taxi medallions, inventory and equipment, and liens on commercial and residential real estate. As of December 31, 2016, the carrying value of our taxi medallion portfolio totaled $65.6 million, all of which is designated as held-for-sale, reflecting management’s intent to sell the portfolio. All of our taxi medallion loans are secured by New York City taxi medallions.
Commercial construction loans are loans to finance the construction of commercial or residential properties secured by first liens on such properties. Commercial real estate loans include loans secured by first liens on completed commercial properties, including multi-family properties, to purchase or refinance such properties. Residential mortgages include loans secured by first liens on 1-4 family residential real estate, and are generally made to existing customers of the Bank to purchase or refinance primary and secondary residences. Home equity loans and lines of credit include loans secured by first or second liens on residential real estate for primary or secondary residences. Consumer loans are made to individuals who qualify for auto loans, cash reserve, credit cards and installment loans.
The Board of Directors has approved a loan policy granting designated lending authorities to specific officers of the Bank. Those officers are comprised of the Chief Executive Officer, Chief Lending Officer, Chief Credit Officer, Team Leaders and the Consumer Loan Officers. All loan approvals require the signatures of a minimum of two officers. The Senior Lending Group (Chief Executive Officer, Chief Lending Officer and Chief Credit Officer) can approve loans up to $25 million in aggregate loan exposure and which do not exceed 65% of the Legal Lending Limit of the Bank (currently $69.3 million as of December 31, 2016 for most loans), provided that (i) the credit does not involve an exception to policy and a principal balance greater than $7.5 million or $20 million in all credit outstanding to the borrower in the aggregate, (ii) the credit does not exceed certain dollar amount thresholds set forth in our policy, which varies by loan type, and (iii) the credit is not extended to an insider of the Bank. The Board Loan Committee (which includes the Chief Executive Officer and four other Board members) approves credits that are both exceptions to policy and are above prescribed amounts related to loan type and collateral. Loans to insiders must be approved by the entire Board.
The Bank’s lending policies generally provide for lending within our primary trade area. However, the Bank will make loans to persons outside of our primary trade area when we deem it prudent to do so. In an effort to promote a high degree of asset quality, the Bank focuses primarily upon offering secured loans. However, the Bank does make short-term unsecured loans to borrowers with high net worth and income profiles. The Bank generally requires loan customers to maintain deposit accounts with the Bank. In addition, the Bank generally provides for a minimum required rate of interest in its variable rate loans. We believe that having senior management on-site allows for an enhanced local presence and rapid decision-making that attracts borrowers. The Bank’s legal lending limit to any one borrower is 15% of the Bank’s capital base (defined as tangible equity plus the allowance for loan and lease losses) for most loans ($69.3 million) and 25% of the capital base for loans secured by readily marketable collateral ($115.5 million). At December 31, 2016, the Bank’s largest committed relationship (to several affiliated borrowers) totaled $59.9 million. The Bank’s largest single loan outstanding at December 31, 2016 was $31.0 million.
Our business model includes using industry best practices for community banks, including personalized service, state-of-the-art technology and extended hours. We believe that this will generate deposit accounts with somewhat larger average balances than are found at many other financial institutions. We also use pricing techniques in our efforts to attract banking relationships having larger than average balances.
Competition
The banking business is highly competitive. We face substantial immediate competition and potential future competition both in attracting deposits and in originating loans. We compete with numerous commercial banks, savings banks and savings and loan associations, many of which have assets, capital and lending limits larger than those that we have. Other competitors include money market mutual funds, mortgage bankers, insurance companies, stock brokerage firms, regulated small loan companies, credit unions and issuers of commercial paper and other securities.
| - 5 - | ||
Our larger competitors have greater financial resources to finance wide-ranging advertising campaigns. Additionally, we endeavor to compete for business by providing high quality, personal service to customers, customer access to our decision-makers and competitive interest rates and fees. We seek to hire and retain quality employees who desire greater responsibility than may be available working for a larger employer.
SUPERVISION AND REGULATION
The banking industry is highly regulated. Statutory and regulatory controls increase a bank holding company’s cost of doing business and limit the options of its management to deploy assets and maximize income. The following discussion is not intended to be a complete list of all the activities regulated by the banking laws or of the impact of such laws and regulations on the Company or the Bank. It is intended only to briefly summarize some material provisions.
Bank Holding Company Regulation
The Company is a bank holding company within the meaning of the Bank Holding Company Act of 1956 (the “Holding Company Act”). As a bank holding company, the Company is supervised by the Board of Governors of the Federal Reserve System (“FRB”) and is required to file reports with the FRB and provide such additional information as the FRB may require. The Company and its subsidiaries are subject to examination by the FRB.
The Holding Company Act prohibits the Company, with certain exceptions, from acquiring direct or indirect ownership or control of more than 5% of the voting shares of any company which is not a bank and from engaging in any business other than that of banking, managing and controlling banks or furnishing services to subsidiary banks, except that it may, upon application, engage in, and may own shares of companies engaged in, certain businesses found by the FRB to be so closely related to banking “as to be a proper incident thereto.” The Holding Company Act requires prior approval by the FRB of the acquisition by the Company of more than 5% of the voting stock of any other bank. Satisfactory capital ratios and Community Reinvestment Act ratings and anti-money laundering policies are generally prerequisites to obtaining federal regulatory approval to make acquisitions. The policy of the FRB, embodied in FRB regulations, provides that a bank holding company is expected to act as a source of financial strength to its subsidiary bank and to commit resources to support the subsidiary bank in circumstances in which it might not do so absent that policy.
As a New Jersey-charted commercial bank and an FDIC-insured institution, acquisitions by the Bank require approval of the New Jersey Department of Banking and Insurance (the “Banking Department”) and the FDIC, an agency of the federal government. The Holding Company Act does not place territorial restrictions on the activities of non-bank subsidiaries of bank holding companies. The Gramm-Leach-Bliley Act, discussed below, allows the Company to expand into insurance, securities, merchant banking activities, and other activities that are financial in nature, in certain circumstances.
Regulation of Bank Subsidiary
The operations of the Bank are subject to requirements and restrictions under federal law, including requirements to maintain reserves against deposits, restrictions on the types and amounts of loans that may be granted, and limitations on the types of investments that may be made and the types of services which may be offered. Various consumer laws and regulations also affect the operations of the Bank. There are various legal limitations, including Sections 23A and 23B of the Federal Reserve Act, which govern the extent to which a bank subsidiary may finance or otherwise supply funds to its holding company or its holding company’s non-bank subsidiaries and affiliates. Under federal law, a bank subsidiary may only make loans or extensions of credit to, or invest in the securities of, its parent or the non-bank subsidiaries of its parent (other than direct subsidiaries of such bank which are not financial subsidiaries) or to any affiliate, or take their securities as collateral for loans to any borrower, upon satisfaction of various regulatory criteria, including specific collateral loan to value requirements.
The Dodd-Frank Act
The Dodd-Frank Act, adopted in 2010, will continue to have a broad impact on the financial services industry, as a result of the significant regulatory and compliance changes made by the Dodd-Frank Act, including, among other things, (i) enhanced resolution authority over troubled and failing banks and their holding companies; (ii) increased capital and liquidity requirements; (iii) increased regulatory examination fees; (iv) changes to assessments to be paid to the FDIC for federal deposit insurance; and (v) numerous other provisions designed to improve supervision and oversight of, and strengthening safety and soundness for, the financial services sector. Additionally, the Dodd-Frank Act establishes a new framework for systemic risk oversight within the financial system to be distributed among new and existing federal regulatory agencies, including the Financial Stability Oversight Council, the FRB, the Office of the Comptroller of the Currency and the FDIC. A summary of certain provisions of the Dodd-Frank Act is set forth below:
| • | Minimum Capital Requirements. The Dodd-Frank Act requires new capital rules and the application of the same leverage and risk-based capital requirements that apply to insured depository institutions to most bank holding companies. In addition to making bank holding companies subject to the same capital requirements as their bank subsidiaries, these provisions (often referred to as the Collins Amendment to the Dodd-Frank Act) were also intended to eliminate or significantly reduce the use of hybrid capital instruments, especially trust preferred securities, as regulatory capital. The Dodd-Frank Act also requires banking regulators to seek to make capital standards countercyclical, so that the required levels of capital increase in times of economic expansion and decrease in times of economic contraction. See “Capital Adequacy Guidelines” for a description of capital requirements adopted by U.S. federal banking regulators in 2013 and the treatment of trust preferred securities under such rules. |
| - 6 - | ||
| • | The Consumer Financial Protection Bureau (“Bureau”). The Dodd-Frank Act created the Bureau. The Bureau is tasked with establishing and implementing rules and regulations under certain federal consumer protection laws with respect to the conduct of providers of certain consumer financial products and services. The Bureau has rulemaking authority over many of the statutes governing products and services offered to bank consumers. In addition, the Dodd-Frank Act permits states to adopt consumer protection laws and regulations that are more stringent than those regulations promulgated by the Bureau and state attorneys general are permitted to enforce consumer protection rules adopted by the Bureau against state-chartered institutions. The Consumer Financial Protection Bureau has examination and enforcement authority over all banks and savings institutions with more than $10 billion in assets. Institutions with $10 billion or less in assets, such as the Bank, will continue to be examined for compliance with the consumer laws by their primary bank regulators. | |
| • | Deposit Insurance. The Dodd-Frank Act makes permanent the $250,000 deposit insurance limit for insured deposits. Amendments to the Federal Deposit Insurance Act also revise the assessment base against which an insured depository institution’s deposit insurance premiums paid to the Deposit Insurance Fund (“DIF”) will be calculated. Under the amendments, the assessment base will no longer be the institution’s deposit base, but rather its average consolidated total assets less its average tangible equity during the assessment period. Additionally, the Dodd-Frank Act makes changes to the minimum designated reserve ratio of the DIF, increasing the minimum from 1.15% to 1.35% of the estimated amount of total insured deposits and eliminating the requirement that the FDIC pay dividends to depository institutions when the reserve ratio exceeds certain thresholds. In December 2010, the FDIC increased the designated reserve ratio to 2.0%. | |
| • | Shareholder Votes. The Dodd-Frank Act requires publicly traded companies like the Company to give shareholders a non-binding vote on executive compensation and so-called “golden parachute” payments in certain circumstances. The Dodd-Frank Act also authorizes the SEC to promulgate rules that would allow shareholders to nominate their own candidates using a company’s proxy materials. The SEC has not yet adopted such rules. |
Although a significant number of the rules and regulations mandated by the Dodd-Frank Act have been finalized, many of the new requirements called for have yet to be implemented and will likely be subject to implementing regulations over the course of several years. Given the uncertainty associated with the manner in which the provisions of the Dodd-Frank Act will be implemented by the various regulatory agencies, the full extent of the impact such requirements will have on financial institutions’ operations is unclear. The changes resulting from the Dodd-Frank Act may impact the profitability of our business activities, require changes to certain of our business practices, impose upon us more stringent capital, liquidity and leverage ratio requirements (which, in turn, could require the Company and the Bank to seek additional capital) or otherwise adversely affect our business. These changes may also require us to invest significant management attention and resources to evaluate and make necessary changes in order to comply with new statutory and regulatory requirements.
Regulation W
Regulation W codifies prior regulations under Sections 23A and 23B of the Federal Reserve Act and interpretative guidance with respect to affiliate transactions. Affiliates of a bank include, among other entities, the bank’s holding company and companies that are under common control with the bank. The Company is considered to be an affiliate of the Bank. In general, subject to certain specified exemptions, a bank or its subsidiaries are limited in their ability to engage in “covered transactions” with affiliates:
| • | to an amount equal to 10% of the bank’s capital and surplus, in the case of covered transactions with any one affiliate; and | |
| • | to an amount equal to 20% of the bank’s capital and surplus, in the case of covered transactions with all affiliates |
In addition, a bank and its subsidiaries may engage in covered transactions and other specified transactions only on terms and under circumstances that are substantially the same, or at least as favorable to the bank or its subsidiary, as those prevailing at the time for comparable transactions with nonaffiliated companies. A “covered transaction” includes:
| • | a loan or extension of credit to an affiliate; | |
| • | a purchase of, or an investment in, securities issued by an affiliate; |
| - 7 - | ||
| • | a purchase of assets from an affiliate, with some exceptions; | |
| • | the acceptance of securities issued by an affiliate as collateral for a loan or extension of credit to any party; and | |
| • | the issuance of a guarantee, acceptance or letter of credit on behalf of an affiliate. |
Further, under Regulation W:
| • | a bank and its subsidiaries may not purchase a low-quality asset from an affiliate; | |
| • | covered transactions and other specified transactions between a bank or its subsidiaries and an affiliate must be on terms and conditions that are consistent with safe and sound banking practices; and | |
| • | with some exceptions, each loan or extension of credit by a bank to an affiliate must be secured by certain types of collateral with a market value ranging from 100% to 130%, depending on the type of collateral, of the amount of the loan or extension of credit |
Regulation W generally excludes all non-bank and non-savings association subsidiaries of banks from treatment as affiliates, except to the extent that the FRB decides to treat these subsidiaries as affiliates.
FDICIA
Pursuant to the Federal Deposit Insurance Corporation Improvement Act of 1991 (“FDICIA”), each federal banking agency has promulgated regulations, specifying the levels at which an insured depository institution such as the Bank would be considered “well capitalized,” “adequately capitalized,” “undercapitalized,” “significantly undercapitalized,” or “critically undercapitalized,” and to take certain mandatory and discretionary supervisory actions based on the capital level of the institution. To qualify to engage in financial activities under the Gramm-Leach-Bliley Act, all depository institutions must be “well capitalized.”
The FDIC’s regulations implementing these provisions of FDICIA provide that an institution will be classified as “well capitalized” if it (i) has a total risk-based capital ratio of at least 10.0%, (ii) has a Tier 1 risk-based capital ratio of at least 8.0%, (iii) has a Tier 1 leverage ratio of at least 5.0%, (iv) has a common equity Tier 1 capital ratio of at least 6.5%, and (v) meets certain other requirements. An institution will be classified as “adequately capitalized” if it (i) has a total risk-based capital ratio of at least 8.0%, (ii) has a Tier 1 risk-based capital ratio of at least 6.0%, (iii) has a Tier 1 leverage ratio of at least 4.0%, has a common equity Tier 1 capital ratio of at least 4.5%, and (v) does not meet the definition of “well capitalized.” An institution will be classified as “undercapitalized” if it (i) has a total risk-based capital ratio of less than 8.0%, (ii) has a Tier 1 risk-based capital ratio of less than 6.0%, (iii) has a Tier 1 leverage ratio of less than 4.0%, or (iv) has a common equity Tier 1 capital ratio of less than 4.5%. An institution will be classified as “significantly undercapitalized” if it (i) has a total risk-based capital ratio of less than 6.0%, (ii) has a Tier 1 risk-based capital ratio of less than 4.0%, (iii) has a Tier 1 leverage ratio of less than 3.0%, or (iv) has a common equity Tier 1 capital ratio of less 3.0%. An institution will be classified as “critically undercapitalized” if it has a tangible equity to total assets ratio that is equal to or less than 2.0%. An insured depository institution may be deemed to be in a lower capitalization category if it receives an unsatisfactory examination rating.
In addition, significant provisions of FDICIA required federal banking regulators to impose standards in a number of other important areas to assure bank safety and soundness, including internal controls, information systems and internal audit systems, credit underwriting, asset growth, compensation, loan documentation and interest rate exposure.
Capital Adequacy Guidelines
In December 2010 and January 2011, the Basel Committee on Banking Supervision (the “Basel Committee”) published the final texts of reforms on capital and liquidity generally referred to as “Basel III.” In July 2013, the FRB, the FDIC and the Comptroller of the Currency adopted final rules (the “New Rules”), which implement certain provisions of Basel III and the Dodd-Frank Act. The New Rules replaced the existing general risk-based capital rules of the various banking agencies with a single, integrated regulatory capital framework. The New Rules require higher capital cushions and more stringent criteria for what qualifies as regulatory capital. The New Rules were effective for the Bank and the Company on January 1, 2015.
Under the New Rules, the Company and the Bank are required to maintain the following minimum capital ratios, expressed as a percentage of risk-weighted assets:
| · | Common Equity Tier 1 Capital Ratio of 4.5% ( the “CET1”); | |
| · | Tier 1 Capital Ratio (CET1 capital plus “Additional Tier 1 capital”) of 6.0%; and | |
| · | Total Capital Ratio (Tier 1 capital plus Tier 2 capital) of 8.0%. |
| - 8 - | ||
In addition, the Company and the Bank will be subject to a leverage ratio of 4% (calculated as Tier 1 capital to average consolidated assets as reported on the consolidated financial statements).
The New Rules also require a “capital conservation buffer.” When fully phased in on January 1 2019, the Company and the Bank will be required to maintain a 2.5% capital conservation buffer, which is composed entirely of CET1, on top of the minimum risk-weighted asset ratios described above, resulting in the following minimum capital ratios:
| · | CET1 of 7%; | |
| · | Tier 1 Capital Ratio of 8.5%; and | |
| · | Total Capital Ratio of 10.5%. |
The purpose of the capital conservation buffer is to absorb losses during periods of economic stress. Banking institutions with a CET1, Tier 1 Capital Ratio and Total Capital Ratio above the minimum set forth above but below the capital conservation buffer will face constraints on their ability to pay dividends, repurchase equity and pay discretionary bonuses to executive officers, based on the amount of the shortfall.
The implementation of the capital conservation buffer began on January 1, 2016 at the 0.625% level, and it increases by 0.625% on each subsequent January 1 until it reaches 2.5% on January 1, 2019.
The New Rules provide for several deductions from and adjustments to CET1, which are being phased in between January 1, 2015 and January 1, 2018. For example, mortgage servicing rights, deferred tax assets dependent upon future taxable income and significant investments in common equity issued by nonconsolidated financial entities must be deducted from CET1 to the extent that any one of those categories exceeds 10% of CET1 or all such categories in the aggregate exceed 15% of CET1.
Under the New Rules, banking organizations such as the Company and the Bank may make a one-time permanent election regarding the treatment of accumulated other comprehensive income items in determining regulatory capital ratios. Effective as of January 1, 2015, the Company and the Bank elected to exclude accumulated other comprehensive income items for purposes of determining regulatory capital.
While the New Rules generally require the phase-out of non-qualifying capital instruments such as trust preferred securities and cumulative perpetual preferred stock, holding companies with less than $15 billion in total consolidated assets as of December 31, 2009, such as the Company, may permanently include non-qualifying instruments that were issued and included in Tier 1 or Tier 2 capital prior to May 19, 2010 in Additional Tier 1 or Tier 2 capital until they redeem such instruments or until the instruments mature.
The New Rules prescribe a standardized approach for calculating risk-weighted assets. Depending on the nature of the assets, the risk categories generally range from 0% for U.S. Government and agency securities, to 600% for certain equity exposures, and result in higher risk weights for a variety of asset categories. In addition, the New Rules provide more advantageous risk weights for derivatives and repurchase-style transactions cleared through a qualifying central counterparty and increase the scope of eligible guarantors and eligible collateral for purposes of credit risk mitigation.
Consistent with the Dodd-Frank Act, the New Rules adopt alternatives to credit ratings for calculating the risk-weighting for certain assets.
Federal Deposit Insurance and Premiums
Substantially all of the deposits of the Bank are insured up to applicable limits by the Deposit Insurance Fund (“DIF”) of the FDIC and are subject to deposit insurance assessments to maintain the DIF.
The assessment base for deposit insurance premiums is an institution’s average consolidated total assets minus average tangible equity. In connection with adopting this assessment base calculation, the FDIC lowered total base assessment rates to between 2.5 and 9 basis points for banks in the lowest risk category, and 30 to 45 basis points for banks in the highest risk category. The Company paid $2.4 million in total FDIC assessments in 2016, as compared to $1.9 million in 2015.
Pursuant to the Dodd-Frank Act, the FDIC has established 2.0% as the designated reserve ratio (DRR), that is, the ratio of the DIF to insured deposits. The FDIC has adopted a plan under which it will meet the statutory minimum DRR of 1.35% by September 30, 2020, the deadline imposed by the Dodd-Frank Act. The Dodd-Frank Act requires the FDIC to offset the effect on institutions with assets less than $10 billion of the increase in the statutory minimum DRR to 1.35% from the former statutory minimum of 1.15%. The FDIC has not yet announced how it will implement this offset.
In addition to deposit insurance assessments, the FDIC is required to continue to collect from institutions payments for the servicing of obligations of the Financing Corporation (“FICO”) that were issued in connection with the resolution of savings and loan associations, so long
| - 9 - | ||
as such obligations remain outstanding. The Bank paid a FICO premium of $209 thousand in 2016, versus approximately $143 thousand in 2015.
The Gramm-Leach-Bliley Financial Services Modernization Act of 1999
The Gramm-Leach-Bliley Financial Services Modernization Act of 1999 (the “Modernization Act”):
| · | allows bank holding companies meeting management, capital, and Community Reinvestment Act standards to engage in a substantially broader range of non-banking activities than previously was permissible, including insurance underwriting and making merchant banking investments in commercial and financial companies, if the bank holding company elects to become a financial holding company, it files a certification, effective in 30 days, and thereafter may engage in certain financial activities without further approvals; | |
| · | allows insurers and other financial services companies to acquire banks; | |
| · | removes various restrictions that previously applied to bank holding company ownership of securities firms and mutual fund advisory companies; and | |
| · | establishes the overall regulatory structure applicable to bank holding companies that also engage in insurance and securities operations. |
The Modernization Act also modified other financial laws, including laws related to financial privacy and community reinvestment. The Company has elected not to become a financial holding company.
Community Reinvestment Act
Under the Community Reinvestment Act (“CRA”), as implemented by FDIC regulations, an insured depository institution has a continuing and affirmative obligation consistent with its safe and sound operation to help meet the credit needs of its entire community, including low and moderate income neighborhoods. The CRA does not establish specific lending requirements or programs for financial institutions nor does it limit an institution’s discretion to develop the types of products and services that it believes are best suited to its particular community, consistent with the CRA. The CRA requires the FDIC, in connection with its examination of every bank, to assess the bank’s record of meeting the credit needs of its community and to take such record into account in its evaluation of certain applications by such bank.
USA PATRIOT Act
The Uniting and Strengthening America by Providing Appropriate Tools Required to Intercept and Obstruct Terrorism Act of 2001 (the “USA PATRIOT Act”) gives the federal government powers to address terrorist threats through domestic security measures, surveillance powers, information sharing, and anti-money laundering requirements. By way of amendments to the Bank Secrecy Act, the USA PATRIOT Act encourages information-sharing among bank regulatory agencies and law enforcement bodies. Further, certain provisions of the USA PATRIOT Act impose affirmative obligations on a broad range of financial institutions, including banks, thrift institutions, brokers, dealers, credit unions, money transfer agents and parties registered under the Commodity Exchange Act.
Among other requirements, the USA PATRIOT Act imposes the following requirements with respect to financial institutions:
| · | All financial institutions must establish anti-money laundering programs that include, at a minimum: (i) internal policies, procedures, and controls; (ii) specific designation of an anti-money laundering compliance officer; (iii) ongoing employee training programs; and (iv) an independent audit function to test the anti-money laundering program. | |
| · | The Secretary of the Department of Treasury, in conjunction with other bank regulators, is authorized to issue regulations that provide for minimum standards with respect to customer identification at the time new accounts are opened. | |
| · | Financial institutions that establish, maintain, administer, or manage private banking accounts or correspondent accounts in the United States for non-United States persons or their representatives (including foreign individuals visiting the United States) are required to establish appropriate, specific and, where necessary, enhanced due diligence policies, procedures, and controls designed to detect and report money laundering. | |
| · | Financial institutions are prohibited from establishing, maintaining, administering or managing correspondent accounts for foreign shell banks (foreign banks that do not have a physical presence in any country), and will be subject to certain record keeping obligations with respect to correspondent accounts of foreign banks. |
| - 10 - | ||
| · | Bank regulators are directed to consider a holding company’s effectiveness in combating money laundering when ruling on Federal Reserve Act and Bank Merger Act applications. |
The United States Treasury Department has issued a number of implementing regulations which address various requirements of the USA PATRIOT Act and are applicable to financial institutions such as the Bank. These regulations impose obligations on financial institutions to maintain appropriate policies, procedures and controls to detect, prevent and report money laundering and terrorist financing and to verify the identity of their customers.
Loans to Related Parties
The Company’s authority to extend credit to its directors and executive officers, as well as to entities controlled by such persons, is currently governed by the requirements of the Sarbanes-Oxley Act of 2002 and Regulation O promulgated by the FRB. Among other things, these provisions require that extensions of credit to insiders (i) be made on terms that are substantially the same as, and follow credit underwriting procedures that are not less stringent than, those prevailing for comparable transactions with unaffiliated persons and that do not involve more than the normal risk of repayment or present other unfavorable features and (ii) not exceed certain limitations on the amount of credit extended to such persons, individually and in the aggregate, which limits are based, in part, on the amount of the Bank’s capital. In addition, the Bank’s Board of Directors must approve all extensions of credit to insiders.
Dividend Restrictions
The Parent Corporation is a legal entity separate and distinct from the Bank. Virtually all of the revenue of the Parent Corporation available for payment of dividends on its capital stock will result from amounts paid to the Parent Corporation by the Bank. All such dividends are subject to the laws of the state of New Jersey, the Banking Act, the Federal Deposit Insurance Act (“FDIA”) and the regulation of the New Jersey Department of Banking and Insurance and of the FDIC.
Under the New Jersey Corporation Act, the Parent Corporation is permitted to pay cash dividends provided that the payment does not leave us insolvent. As a bank holding company under the BHCA, we would be prohibited from paying cash dividends if we are not in compliance with any capital requirements applicable to us. However, as a practical matter, for so long as our major operations consist of ownership of the Bank, the Bank will remain our source of dividend payments, and our ability to pay dividends will be subject to any restrictions applicable to the Bank.
Under the New Jersey Banking Act of 1948, as amended, dividends may be paid by the Bank only if, after the payment of the dividend, the capital stock of the Bank will be unimpaired and either the Bank will have a surplus of not less than 50% of its capital stock or the payment of the dividend will not reduce the Bank’s surplus. The payment of dividends is also dependent upon the Bank’s ability to maintain adequate capital ratios pursuant to applicable regulatory requirements.
The FRB has issued a policy statement regarding the payment of dividends by bank holding companies. In general, the FRB’s policies provide that dividends should be paid only out of current earnings and only if the prospective rate of earnings retention by the bank holding company appears consistent with the organization’s capital needs, asset quality and overall financial condition. FRB regulations also require that a bank holding company serve as a source of financial strength to its subsidiary banks by standing ready to use available resources to provide adequate capital funds to those banks during periods of financial stress or adversity and by maintaining the financial flexibility and capital-raising capacity to obtain additional resources for assisting its subsidiary banks where necessary. Under the prompt corrective action laws, the ability of a bank holding company to pay dividends may be restricted if a subsidiary bank becomes undercapitalized, and under regulations implementing the Basel III accord, a bank holding company’s ability to pay cash dividends may be impaired if it fails to satisfy certain capital buffer requirements. These regulatory policies could affect the ability of the Company to pay dividends or otherwise engage in capital distributions.
| - 11 - | ||
An investment in our common stock involves risks. Stockholders should carefully consider the risks described below, together with all other information contained in this Annual Report on Form 10-K, before making any purchase or sale decisions regarding our common stock. If any of the following risks actually occur, our business, financial condition or operating results may be harmed. In that case, the trading price of our common stock may decline, and stockholders may lose part or all of their investment in our common stock.
Risks Applicable to Our Business:
Our growth-oriented business strategy could be adversely affected if we are not able to attract and retain skilled employees or if we lose the services of our senior management team.
We may not be able to successfully manage our business as a result of the strain on our management and operations that may result from growth. Our ability to manage growth will depend upon our ability to continue to attract, hire and retain skilled employees. The loss of members of our senior management team, including those officers named in the summary compensation table of our proxy statement, could have a material adverse effect on our results or operations and ability to execute our strategic goals. Our success will also depend on the ability of our officers and key employees to continue to implement and improve our operational and other systems, to manage multiple, concurrent customer relationships and to hire, train and manage our employees.
We may need to raise additional capital to execute our growth oriented business strategy.
In order to continue our growth, we will be required to maintain our regulatory capital ratios at levels higher than the minimum ratios set by our regulators. In light of current economic conditions, our regulators have been seeking higher capital bases for insured depository institutions experiencing strong growth. In addition, the implementation of the Basel III regulatory capital requirements may require us to increase our regulatory capital ratios and raise additional capital. We can offer you no assurances that we will be able to raise capital in the future, or that the terms of any such capital will be beneficial to our existing security holders. In the event we are unable to raise capital in the future, we may not be able to continue our growth strategy
We have a significant concentration in commercial real estate loans.
Our loan portfolio is made up largely of commercial real estate loans. These types of loans generally expose a lender to a higher degree of credit risk of non-payment and loss than do residential mortgage loans because of several factors, including dependence on the successful operation of a business or a project for repayment, and loan terms with a balloon payment rather than full amortization over the loan term. In addition, commercial real estate loans typically involve larger loan balances to single borrowers or groups of related borrowers compared to one-to four-family residential mortgage loans. Underwriting and portfolio management activities cannot completely eliminate all risks related to these loans. Any significant failure to pay on time by our customers or a significant default by our customers would materially and adversely affect us.
At December 31, 2016, we had $2.7 billion of commercial real estate loans, including commercial construction loans, which represented 77.4% of loans receivable. Concentrations in commercial real estate are also monitored by regulatory agencies and subject to scrutiny. Guidance from these regulatory agencies includes all commercial real estate loans, including commercial construction loans, in calculating our commercial real estate concentration, but excludes owner-occupied commercial real estate loans. Based on this regulatory definition, our commercial real estate loans represented 532% of total risk-based capital.
Loans secured by owner-occupied real estate are reliant on the operating businesses to provide cash flow to meet debt service obligations, and as a result they are more susceptible to the general impact on the economic environment affecting those operating companies as well as the real estate.
Although the economy in our market area generally, and the real estate market in particular, is growing, we can give you no assurance that it will continue to grow or that the rate of growth will accelerate. Many factors, including continuing European economic difficulties, a strengthening U.S. dollar, and potential international trade tariffs could reduce or halt growth in our local economy and real estate market. Accordingly, it may be more difficult for commercial real estate borrowers to repay their loans in a timely manner in the current economic climate, as commercial real estate borrowers’ ability to repay their loans frequently depends on the successful development of their properties. The deterioration of one or a few of our commercial real estate loans could cause a material increase in our level of nonperforming loans, which would result in a loss of revenue from these loans and could result in an increase in the provision for loan and lease losses and/or an increase in charge-offs, all of which could have a material adverse impact on our net income. We also may incur losses on commercial real estate loans due to declines in occupancy rates and rental rates, which may decrease property values and may decrease the likelihood that a borrower may find permanent financing alternatives. Any weakening of the commercial real estate market may increase the likelihood of default of these loans, which could negatively impact our loan portfolio’s performance and asset quality. If we are required to liquidate the collateral securing a loan to satisfy the debt during a period of reduced real estate values, we could incur material losses. Any of these events could increase our costs, require management time and attention, and materially and adversely affect us.
| - 12 - | ||
Federal banking agencies have issued guidance regarding high concentrations of commercial real estate loans within bank loan portfolios. The guidance requires financial institutions that exceed certain levels of commercial real estate lending compared with their total capital to maintain heightened risk management practices that address the following key elements: board and management oversight and strategic planning, portfolio management, development of underwriting standards, risk assessment and monitoring through market analysis and stress testing, and maintenance of increased capital levels as needed to support the level of commercial real estate lending. If there is any deterioration in our commercial real estate portfolio or if our regulators conclude that we have not implemented appropriate risk management practices, it could adversely affect our business, and could result in the requirement to maintain increased capital levels. Such capital may not be available at that time, and may result in our regulators requiring us to reduce our concentration in commercial real estate loans.
If we are limited in our ability to originate loans secured by commercial real estate we may face greater risk in our loan portfolio
If, because of our concentration of commercial real estate loans, or for any other reasons, we are limited in our ability to originate loans secured by commercial real estate, we may incur greater risk in our loan portfolio. For example, we may seek to originate commercial and industrial loans, including both secured and unsecured commercial and industrial loans. Unsecured loans generally involve a higher degree of risk of loss than do secured loans because, without collateral, repayment is wholly dependent upon the success of the borrowers’ businesses and personal guarantees. Secured commercial and industrial loans are generally collateralized by accounts receivable, inventory, equipment or other assets owned by the borrower and typically include a personal guaranty of the business owner. Compared to real estate, that type of collateral is more difficult to monitor, its value is harder to ascertain, it may depreciate more rapidly and it may not be as readily saleable if repossessed. Therefore, we may be exposed to greater risk of loss on these credits.
The nature and growth rate of our commercial loan portfolio may expose us to increased lending risks.
Given the significant growth in our loan portfolio, many of our commercial real estate loans are unseasoned, meaning that they were originated relatively recently. As of December 31, 2016, we had $2.2 billion in commercial real estate loans outstanding. Approximately 62% of the loans, or $1.4 billion, had been originated in the past three years. Our limited experience with these loans does not provide us with a significant payment history pattern with which to judge future collectability. As a result, it may be difficult to predict the future performance of our loan portfolio. These loans may have delinquency or charge-off levels above our expectations, which could negatively affect our performance.
Our portfolio of loans secured by New York City taxi medallions could expose us to credit losses.
We maintain a significant credit exposure ($65.6 million carrying value as of December 31, 2016) of loans secured by New York City taxi medallions. The taxi industry in New York City is facing significant competition and pressure from technology based ride share companies such as Uber and Lyft. This has resulted in volatility in the pricing of medallions, and has impacted the earnings of many medallion holders, including our borrowers. The majority of the taxi medallion portfolio ($63.0 million, or 96%) was designated as nonaccrual, and the entire portfolio has been designated as loans held-for-sale, reflecting management’s intent to sell the portfolio. Any further deterioration in the value of New York City taxi medallions, or in the medallion taxi industry in New York City, could expose us to additional losses through a lower sale price for these loans, or, if we are unable to sell all or a portion of this portfolio, additional write downs on these loans.
The small to medium-sized businesses that the Bank lends to may have fewer resources to weather a downturn in the economy, which may impair a borrower’s ability to repay a loan to the Bank that could materially harm our operating results.
The Bank targets its business development and marketing strategy primarily to serve the banking and financial services needs of small to medium-sized businesses. These small to medium-sized businesses frequently have smaller market share than their competition, may be more vulnerable to economic downturns, often need substantial additional capital to expand or compete and may experience significant volatility in operating results. Any one or more of these factors may impair the borrower’s ability to repay a loan. In addition, the success of a small to medium-sized business often depends on the management talents and efforts of one or two persons or a small group of persons, and the death, disability or resignation of one or more of these persons could have a material adverse impact on the business and its ability to repay a loan. Economic downturns and other events that negatively impact our market areas could cause the Bank to incur substantial credit losses that could negatively affect our results of operations and financial condition.
We are a community bank and our ability to maintain our reputation is critical to the success of our business and the failure to do so may materially adversely affect our performance.
We are a community bank, and our reputation is one of the most valuable components of our business. As such, we strive to conduct our business in a manner that enhances our reputation. This is done, in part, by recruiting, hiring and retaining employees who share our core values of being an integral part of the communities we serve, delivering superior service to our customers and caring about our customers and associates. If our reputation is negatively affected, by the actions of our employees or otherwise, our business and, therefore, our operating results may be materially adversely affected.
| - 13 - | ||
Historically low interest rates may adversely affect our net interest income and profitability.
During the last seven years it has been the policy of the Board of Governors of the Federal Reserve System (the “Federal Reserve”) to maintain interest rates at historically low levels through its targeted federal funds rate and the purchase of mortgage-backed securities. As a result, yields on securities we have purchased, and to a lesser extent, market rates on the loans we have originated, have been at levels lower than were available prior to 2008. Consequently, the average yield on our interest-earning assets has decreased during the recent low interest rate environment. Our ability to lower our interest expense is limited at these interest rate levels, while the average yield on our interest-earning assets may continue to decrease. Accordingly, our net interest income may decrease, which may have an adverse effect on our profitability. For information with respect to changes in interest rates, see “Risk Factors-Changes in interest rates may adversely affect or our earnings and financial condition.”
Anti-takeover provisions in our corporate documents and in New Jersey corporate law may make it difficult and expensive to remove current management.
Anti-takeover provisions in our corporate documents and in New Jersey law may render the removal of our existing board of directors and management more difficult. Consequently, it may be difficult and expensive for our stockholders to remove current management, even if current management is not performing adequately.
Competition from other financial institutions in originating loans and attracting deposits may adversely affect our profitability.
We face substantial competition in originating loans. This competition comes principally from other banks, savings institutions, mortgage banking companies, credit unions and other lenders. Many of our competitors enjoy advantages, including greater financial resources and higher lending limits, a wider geographic presence, more accessible branch office locations, the ability to offer a wider array of services or more favorable pricing alternatives, as well as lower origination and operating costs. This competition could reduce our net income by decreasing the number and size of loans that we originate and the interest rates we may charge on these loans.
In attracting deposits, we face substantial competition from other insured depository institutions such as banks, savings institutions and credit unions, as well as institutions offering uninsured investment alternatives, including money market funds. Many of our competitors enjoy advantages, including greater financial resources, more aggressive marketing campaigns, better brand recognition and more branch locations.
These competitors may offer higher interest rates than we do, which could decrease the deposits that we attract or require us to increase our rates to retain existing deposits or attract new deposits. Increased deposit competition could adversely affect our ability to generate the funds necessary for lending operations, which may increase our cost of funds.
We also compete with non-bank providers of financial services, such as brokerage firms, consumer finance companies, insurance companies and governmental organizations, which may offer more favorable terms. Some of our non-bank competitors are not subject to the same extensive regulations that govern our operations. As a result, such non-bank competitors may have advantages over us in providing certain products and services. This competition may reduce or limit our margins on banking services, reduce our market share and adversely affect our earnings and financial condition.
External factors, many of which we cannot control, may result in liquidity concerns for us.
Liquidity risk is the potential that the Bank may be unable to meet its obligations as they come due, capitalize on growth opportunities as they arise, or pay regular dividends because of an inability to liquidate assets or obtain adequate funding in a timely basis, at a reasonable cost and within acceptable risk tolerances.
Liquidity is required to fund various obligations, including credit commitments to borrowers, mortgage and other loan originations, withdrawals by depositors, repayment of borrowings, operating expenses, capital expenditures and dividend payments to shareholders.
Liquidity is derived primarily from deposit growth and retention; principal and interest payments on loans; principal and interest payments on investment securities; sale, maturity and prepayment of investment securities; net cash provided from operations, and access to other funding sources. In addition, in recent periods we have substantially increased our use of alternate deposit origination channels, such as brokered deposits, including reciprocal deposit services, and internet listing services.
Our access to funding sources in amounts adequate to finance our activities could be impaired by factors that affect us specifically or the financial services industry in general. Factors that could detrimentally impact our access to liquidity sources include a decrease in the level of our business activity due to market factors or an adverse regulatory action against us. In addition, our ability to use alternate deposit originations channels could be substantially impaired if we fail to remain “well capitalized”. Our ability to borrow could also be impaired by factors that are not specific to us, such as a severe disruption of the financial markets or negative views and expectations about the prospects for the financial services industry as a whole. The liquidity issues have been particularly acute for regional and community banks, as many of the larger financial institutions have significantly curtailed their lending to regional and community banks to reduce their exposure to the risks of
| - 14 - | ||
other banks. In addition, many of the larger correspondent lenders have reduced or even eliminated federal funds lines for their correspondent customers. Furthermore, regional and community banks generally have less access to the capital markets than do the national and super-regional banks because of their smaller size and limited analyst coverage. Any decline in available funding could adversely impact our ability to originate loans, invest in securities, meet our expenses, or fulfill obligations such as meeting deposit withdrawal demands, any of which could have a material adverse impact on our liquidity, business, results of operations and financial condition.
Declines in the value of our investment securities portfolio may adversely impact our results.
As of December 31, 2016, we had approximately $353.3 million in investment securities, available-for-sale. We may be required to record impairment charges on our investment securities if they suffer a decline in value that is considered other-than-temporary. Numerous factors, including lack of liquidity for re-sales of certain investment securities, absence of reliable pricing information on investment securities, adverse changes in business climate, adverse actions by regulators, or unanticipated changes in the competitive environment could have a negative effect on our investment portfolio in future periods. If an impairment charge is significant enough, it could affect the ability of the Bank to upstream dividends to the Company, which could have a material adverse effect on our liquidity and our ability to pay dividends to shareholders and could also negatively impact our regulatory capital ratios.
The Bank’s ability to pay dividends is subject to regulatory limitations, which, to the extent that the Company requires such dividends in the future, may affect the Company’s ability to honor its obligations and pay dividends.
As a bank holding company, the Company is a separate legal entity from the Bank and its subsidiaries and does not have significant operations. We currently depend on the Bank’s cash and liquidity to pay our operating expenses and to fund dividends to shareholders. We cannot assure you that in the future the Bank will have the capacity to pay the necessary dividends and that we will not require dividends from the Bank to satisfy our obligations. Various statutes and regulations limit the availability of dividends from the Bank. It is possible, depending upon our and the Bank’s financial condition and other factors, that bank regulators could assert that payment of dividends or other payments by the Bank are an unsafe or unsound practice. In the event that the Bank is unable to pay dividends, we may not be able to service our obligations, as they become due, or pay dividends on our capital stock. Consequently, the inability to receive dividends from the Bank could adversely affect our financial condition, results of operations, cash flows and prospects.
In addition, as described under “Capital Adequacy Guidelines,” beginning in 2016, banks and bank holding companies will be required to maintain a capital conservation buffer on top of minimum risk-weighted asset ratios. When fully phased in on January 1, 2019, the capital conservation buffer will be 2.5%. Banking institutions which do not maintain capital in excess of the capital conservation buffer will face constraints on the payment of dividends, equity repurchases and compensation based on the amount of the shortfall. Accordingly, if the Bank fails to maintain the applicable minimum capital ratios and the capital conservation buffer, distributions to the Company may be prohibited or limited.
We may incur impairment to goodwill.
We review our goodwill at least annually. Significant negative industry or economic trends, reduced estimates of future cash flows or disruptions to our business, could indicate that goodwill might be impaired. Our valuation methodology for assessing impairment requires management to make judgments and assumptions based on historical experience and to rely on projections of future operating performance. We operate in a competitive environment and projections of future operating results and cash flows may vary significantly from actual results. Additionally, if our analysis results in an impairment to our goodwill, we would be required to record a non-cash charge to earnings in our financial statements during the period in which such impairment is determined to exist. Any such charge could have a material adverse effect on our results of operations.
If we pursue acquisitions, we may heighten the risks to our operations and financial condition.
To the extent that we undertake acquisitions, we may experience the effects of higher operating expenses relative to operating income from the new operations, which may have a material adverse effect on our levels of reported net income, return on average equity and return on average assets. Other effects of engaging in such growth strategies may include potential diversion of our management’s time and attention and general disruption to our business. To the extent that we grow through acquisitions, we cannot assure you that we will be able to adequately and profitably manage this growth. Acquiring other banks and businesses involve similar risks to those commonly associated with branching, but may also involve additional risks, including:
| · | potential exposure to unknown or contingent liabilities of banks and businesses we acquire; |
| · | exposure to potential asset quality issues of the acquired bank or related business; |
| · | difficulty and expense of integrating the operations and personnel of banks and businesses we acquire; and |
| · | the possible loss of key employees and customers of the banks and businesses we acquire. |
| - 15 - | ||
Attractive acquisition opportunities may not be available to us in the future.
We expect that other banking and financial service companies, many of which have significantly greater resources than us, will compete with us in acquiring other financial institutions if we pursue such acquisitions. This competition could increase prices for potential acquisitions that we believe are attractive. Also, acquisitions are subject to various regulatory approvals. If we fail to receive the appropriate regulatory approvals, we will not be able to consummate an acquisition that we believe is in our best interests. Among other things, our regulators will consider our capital, liquidity, profitability, regulatory compliance and levels of goodwill when considering acquisition and expansion proposals. Any acquisition could be dilutive to our earnings and shareholders’ equity per share of our common stock.
Hurricanes or other adverse weather events could negatively affect our local economies or disrupt our operations, which would have an adverse effect on our business or results of operations.
Hurricanes and other weather events can disrupt our operations, result in damage to our properties and negatively affect the local economies in which we operate. In addition, these weather events may result in a decline in value or destruction of properties securing our loans and an increase in delinquencies, foreclosures and loan losses.
Risks Applicable to the Banking Industry Generally:
The financial services industry is undergoing a period of great volatility and disruption.
Beginning in mid-2007, there has been significant turmoil and volatility in global financial markets. Recent market uncertainty regarding the financial sector has increased. In addition to the impact on the economy generally, changes in interest rates, in the shape of the yield curve, or in valuations in the debt or equity markets or disruptions in the liquidity or other functioning of financial markets, all of which have been seen recently, could directly impact us in one or more of the following ways:
| · | Net interest income, the difference between interest earned on our interest earning assets and interest paid on interest-bearing liabilities, represents a significant portion of our earnings. Both increases and decreases in the interest rate environment may reduce our profits. We expect that we will continue to realize income from the spread between the interest we earn on loans, securities and other interest-earning assets, and the interest we pay on deposits, borrowings and other interest-bearing liabilities. The net interest spread is affected by the differences between the maturity and repricing characteristics of our interest-earning assets and interest-bearing liabilities. Our interest-earning assets may not reprice as slowly or rapidly as our interest-bearing liabilities. |
| · | The market value of our securities portfolio may decline and result in other than temporary impairment charges. The value of securities in our portfolio is affected by factors that impact the U.S. securities market in general as well as specific financial sector factors and entities. Recent uncertainty in the market regarding the financial sector has negatively impacted the value of securities within our portfolio. Further declines in these sectors may result in future other than temporary impairment charges. |
| · | Asset quality may deteriorate as borrowers become unable to repay their loans. |
Our allowance for loan and lease losses may not be adequate to cover actual losses.
Like all financial institutions, we maintain an allowance for loan and lease losses to provide for loan defaults and nonperformance. The process for determining the amount of the allowance is critical to our financial results and condition. It requires difficult, subjective and complex judgments about the future, including the impact of national and regional economic conditions on the ability of our borrowers to repay their loans. If our judgment proves to be incorrect, our allowance for loan and lease losses may not be sufficient to cover losses inherent in our loan portfolio. Further, state and federal regulatory agencies, as an integral part of their examination process, review our loans and allowance for loan and lease losses and may require an increase in our allowance for loan and lease losses.
Although we believe that our allowance for loan and lease losses is adequate to cover known and probable incurred losses included in the portfolio, we cannot assure you that we will not further increase the allowance for loan and lease losses or that our regulators will not require us to increase this allowance. Either of these occurrences could adversely affect our earnings.
Changes in interest rates may adversely affect our earnings and financial condition.
Our net income depends primarily upon our net interest income. Net interest income is the difference between interest income earned on loans, investments and other interest-earning assets and the interest expense incurred on deposits and borrowed funds. The level of net interest income is primarily a function of the average balance of our interest-earning assets, the average balance of our interest-bearing liabilities, and the spread between the yield on such assets and the cost of such liabilities. These factors are influenced by both the pricing and mix of our interest-earning assets and our interest-bearing liabilities which, in turn, are impacted by such external factors as the local economy,
| - 16 - | ||
competition for loans and deposits, the monetary policy of the Federal Open Market Committee of the Federal Reserve Board of Governors (the “FOMC”), and market interest rates.
A sustained increase in market interest rates could adversely affect our earnings if our cost of funds increases more rapidly than our yield on our earning assets, and compresses our net interest margin. In addition, the economic value of portfolio equity would decline if interest rates increase. For example, we estimate that as of December 31, 2016, a 200 basis point increase in interest rates would have resulted in our economic value of portfolio equity declining by approximately $42.1 million or 8.0%. See “Management’s Discussion and Analysis of Financial Condition and Results of Operations – Interest Rate Sensitivity Analysis.”
Different types of assets and liabilities may react differently, and at different times, to changes in market interest rates. We expect that we will periodically experience gaps in the interest rate sensitivities of our assets and liabilities. That means either our interest-bearing liabilities will be more sensitive to changes in market interest rates than our interest-earning assets, or vice versa. When interest-bearing liabilities mature or re-price more quickly than interest-earning assets, an increase in market rates of interest could reduce our net interest income. Likewise, when interest-earning assets mature or re-price more quickly than interest-bearing liabilities, falling interest rates could reduce our net interest income. We are unable to predict changes in market interest rates, which are affected by many factors beyond our control, including inflation, deflation, recession, unemployment, money supply, domestic and international events and changes in the United States and other financial markets.
We also attempt to manage risk from changes in market interest rates, in part, by controlling the mix of interest rate sensitive assets and interest rate sensitive liabilities. However, interest rate risk management techniques are not exact. A rapid increase or decrease in interest rates could adversely affect our results of operations and financial performance.
The banking business is subject to significant government regulations.
We are subject to extensive governmental supervision, regulation and control. These laws and regulations are subject to change, and may require substantial modifications to our operations or may cause us to incur substantial additional compliance costs. In addition, future legislation and government policy could adversely affect the commercial banking industry and our operations. Such governing laws can be anticipated to continue to be the subject of future modification. Our management cannot predict what effect any such future modifications will have on our operations. In addition, the primary focus of Federal and state banking regulation is the protection of depositors and not the shareholders of the regulated institutions.
For example, the Dodd-Frank Act may result in substantial new compliance costs. The Dodd-Frank Act was signed into law on July 21, 2010. Generally, the Dodd-Frank Act is effective the day after it was signed into law, but different effective dates apply to specific sections of the law, many of which will not become effective until various Federal regulatory agencies have promulgated rules implementing the statutory provisions. In addition, as a result of the 2016 elections, certain provisions of The Dodd-Frank Act may be repealed or modified. Uncertainty remains as to the ultimate impact of the Dodd-Frank Act, which could have a material adverse impact either on the financial services industry as a whole, or on our business, results of operations and financial condition.
The following aspects of the financial reform and consumer protection act are related to the operations of the Bank:
| · | A new independent consumer financial protection bureau was established within the Federal Reserve, empowered to exercise broad regulatory, supervisory and enforcement authority with respect to both new and existing consumer financial protection laws. However, smaller financial institutions, like the Bank, are subject to the supervision and enforcement of their primary federal banking regulator with respect to the federal consumer financial protection laws. |
| · | The act also imposes new obligations on originators of residential mortgage loans, such as the Bank. Among other things, originators must make a reasonable and good faith determination based on documented information that a borrower has a reasonable ability to repay a particular mortgage loan over the long term. If the originator cannot meet this standard, the loan may be unenforceable in foreclosure proceedings. The act contains an exception from this ability to repay rule for “qualified mortgages”, which are deemed to satisfy the rule, but does not define the term, and left authority to the Consumer Financial Protection Bureau (“CFPB”) to adopt a definition. A rule issued by the CFPB in January 2013, and effective January 10, 2014, sets forth specific underwriting criteria for a loan to qualify as a Qualified Mortgage Loan. The criteria generally exclude loans that are interest-only, have excessive upfront points or fees, have negative amortization features or balloon payments, or have terms in excess of 30 years. The underwriting criteria also impose a maximum debt to income ratio of 43%. If a loan meets these criteria and is not a “higher priced loan” as defined in FRB regulations, the CFPB rule establishes a safe harbor preventing a consumer from asserting as a defense to foreclosure the failure of the originator to establish the consumer’s ability to repay. However, this defense will be available to a consumer for all other residential mortgage loans. Although the majority of residential mortgages historically originated by the Bank would qualify as Qualified Mortgage Loans, the Bank has also made, and may continue to make in the future, residential mortgage loans that will not qualify as Qualified Mortgage Loans. These loans may expose the Bank to greater losses, loan repurchase obligations, or litigation related expenses and delays in taking title to collateral real estate, if these loans do not perform and borrowers challenge whether the Bank satisfied the ability to repay rule on originating the loan. |
| - 17 - | ||
| · | Tier 1 capital treatment for “hybrid” capital items like trust preferred securities is eliminated subject to various grandfathering and transition rules. |
| · | The prohibition on payment of interest on demand deposits was repealed, effective July 21, 2011. |
| · | Deposit insurance is permanently increased to $250,000. |
| · | The deposit insurance assessment base calculation now equals the depository institution’s total assets minus the sum of its average tangible equity during the assessment period. |
| · | The minimum reserve ratio of the Deposit Insurance Fund increased to 1.35% of estimated annual insured deposits or assessment base; however, the FDIC is directed to “offset the effect” of the increased reserve ratio for insured depository institutions with total consolidated assets of less than $10 billion. |
In addition, in order to implement Basel III and certain additional capital changes required by the Dodd-Frank Act, on July 9, 2013, the Federal banking agencies, including the FDIC, the Federal Reserve and the Office of the Comptroller of the Currency, approved, as an interim final rule, the regulatory capital requirements for U.S. insured depository institutions and their holding companies. This regulation requires financial institutions to maintain higher capital levels and more equity capital.
These provisions, as well as any other aspects of current or proposed regulatory or legislative changes to laws applicable to the financial industry, may impact the profitability of our business activities and may change certain of our business practices, including the ability to offer new products, obtain financing, attract deposits, make loans, and achieve satisfactory interest spreads, and could expose us to additional costs, including increased compliance costs. These changes also may require us to invest significant management attention and resources to make any necessary changes to operations in order to comply, and could therefore also materially and adversely affect our business, financial condition and results of operations.
Our management is actively reviewing the provisions of the Dodd-Frank Act, many of which are to be phased-in over the next several months and years, and assessing the probable impact on our operations. However, the ultimate effect of these changes on the financial services industry in general, and us in particular, is uncertain at this time.
The laws that regulate our operations are designed for the protection of depositors and the public, not our shareholders.
The federal and state laws and regulations applicable to our operations give regulatory authorities extensive discretion in connection with their supervisory and enforcement responsibilities, and generally have been promulgated to protect depositors and the Deposit Insurance Fund and not for the purpose of protecting shareholders. These laws and regulations can materially affect our future business. Laws and regulations now affecting us may be changed at any time, and the interpretation of such laws and regulations by bank regulatory authorities is also subject to change.
We can give no assurance that future changes in laws and regulations or changes in their interpretation will not adversely affect our business. Legislative and regulatory changes may increase our cost of doing business or otherwise adversely affect us and create competitive advantages for non-bank competitors.
The potential impact of changes in monetary policy and interest rates may negatively affect our operations.
Our operating results may be significantly affected (favorably or unfavorably) by market rates of interest that, in turn, are affected by prevailing economic conditions, by the fiscal and monetary policies of the United States government and by the policies of various regulatory agencies. Our earnings will depend significantly upon our interest rate spread (i.e., the difference between the interest rate earned on our loans and investments and the interest raid paid on our deposits and borrowings). Like many financial institutions, we may be subject to the risk of fluctuations in interest rates, which, if significant, may have a material adverse effect on our operations.
We cannot predict how changes in technology will impact our business; increased use of technology may expose us to service interruptions or breaches in security.
The financial services market, including banking services, is increasingly affected by advances in technology, including developments in:
| · | Telecommunications; |
| · | Data processing; |
| · | Automation; |
| - 18 - | ||
| · | Internet-based banking, including personal computers, mobile phones and tablets; |
| · | Debit cards and so-called “smart cards”; and |
| · | Remote deposit capture. |
Our ability to compete successfully in the future will depend, to a certain extent, on whether we can anticipate and respond to technological changes. We offer electronic banking services for our consumer and business customers via our website, www.cnob.com, including Internet banking and electronic bill payment, as well as mobile banking by phone. We also offer check cards, ATM cards, credit cards, and automatic and ACH transfers. The successful operation and further development of these and other new technologies will likely require additional capital investments in the future. In addition, increased use of electronic banking creates opportunities for interruptions in service or security breaches, which could expose us to claims by customers or other third parties. We cannot assure you that we will have sufficient resources or access to the necessary proprietary technology to remain competitive in the future, or that we will be able to maintain a secure electronic environment.
Item 1B. Unresolved Staff Comments
None.
| - 19 - | ||
The Bank operates seven banking offices in Bergen County, NJ, consisting of one office each in Englewood Cliffs, Englewood, Cresskill, Fort Lee, Hackensack, Ridgewood and Saddle River; nine banking offices in Union County, NJ, consisting of four offices in Union Township, and one office each in Springfield Township, Berkeley Heights, and Summit; three banking offices in Morris County, NJ, consisting of one office each in Boonton, Madison and Morristown; one office in Newark in Essex County, NJ; one office in West New York in Hudson County, NJ; one office in Princeton in Mercer County, NJ, and one office in Holmdel in Monmouth County, NJ. The Bank is also opened a branch office in the borough of Manhattan in New York City. The Bank’s principal office is located at 301 Sylvan Avenue, Englewood Cliffs, NJ. The principal office is a three-story leased building constructed in 2008.
The following table sets forth certain information regarding the Bank’s leased locations.
| Branch Location | Term | |
| 301 Sylvan Avenue, Englewood Cliffs, NJ | Term expires November 2028; renewable at the Bank’s option | |
| 12 East Palisade Avenue, Englewood, NJ | Term expires July 2022; renewable at the Bank’s option | |
| 1 Union Avenue, Cresskill, NJ | Term expires June 2026; renewable at the Bank’s option | |
| 899 Palisade Avenue, Fort Lee, NJ | Term expires April 2017; renewable at the Bank’s option | |
| 142 John Street, Hackensack, NJ | Term expires December 2021; renewable at the Bank’s option | |
| 171 East Ridgewood Avenue, Ridgewood, NJ | Term expires April 2019 renewable at the Bank’s option | |
| 71 East Allendale Road, Saddle River, NJ | Term expires May 2032, unless canceled or extended by the Bank | |
| 356 Chestnut Street, Union, NJ | Term expires in May 2027; renewable at the Bank’s option | |
| 104 Ely Place, Boonton, NJ | Term expires August 2021; renewable at the Bank’s option | |
| 300 Main Street, Madison, NJ | Term expires May 2021; renewable at the Bank’s option | |
| 545 Morris Avenue, Summit, NJ | Term expires January 2024; renewable at the Bank’s option | |
| 217 Chestnut Street, Newark, NJ | Term expires February 2019 | |
| 5914 Park Avenue, West New York, NJ | Term expires September 2018; renewable at the Bank’s option | |
| 344 Nassau Street, Princeton, NJ | Term expires May 2019; renewable at the Bank’s option | |
| 963 Holmdel Road, Holmdel, NJ | Term expires July 2021; renewable at the Bank’s option | |
| 551 Madison Ave, Suite 202, New York, NY | Term expires March 2023 |
The Bank operates a Drive In/Walk Up located at 2022 Stowe Street, Union, NJ.
There are no significant pending legal proceedings involving the Company other than those arising out of routine operations. None of these matters would have a material adverse effect on the Company or its results of operations if decided adversely to the Company.
Item 4. Mine Safety Disclosures
Not applicable.
| - 20 - | ||
Item 5. Market for the Registrant’s Common Stock, Related Stockholder Matters and Issuer Purchases of Equity Securities
Security Market Information
The common stock of the Company is traded on the NASDAQ Global Select Market under the symbol “CNOB”. As of December 31, 2016, the Company had 500 stockholders of record, excluding beneficial owners for whom CEDE & Company or others act as nominees. On December 31, 2016, the closing sale price was $25.95.
The following table sets forth the high and low closing sales price, and the dividends declared, on a share of the Company’s common stock for the years ended December 31, 2016 and 2015.
| Common Stock Price | ||||||||||||||||||||||||
| 2016 | 2015 | Common Dividends Declared | ||||||||||||||||||||||
| High | Low | High | Low | 2016 | 2015 | |||||||||||||||||||
| Fourth Quarter | $ | 26.50 | $ | 17.78 | $ | 19.51 | $ | 17.50 | $ | 0.075 | $ | 0.075 | ||||||||||||
| Third Quarter | 18.86 | 15.22 | 22.27 | 18.50 | 0.075 | 0.075 | ||||||||||||||||||
| Second Quarter | 17.30 | 15.12 | 21.88 | 19.00 | 0.075 | 0.075 | ||||||||||||||||||
| First Quarter | 18.63 | 15.17 | 19.50 | 17.85 | 0.075 | 0.075 | ||||||||||||||||||
| Total | $ | 0.300 | $ | 0.300 | ||||||||||||||||||||
Share Repurchase Program
Historically, repurchases have been made from time to time as, in the opinion of management, market conditions warranted, in the open market or in privately negotiated transactions. Shares repurchased were used for stock dividends and other issuances. No repurchases were made of the Company’s common stock during 2016 or 2015.
Dividends
Federal laws and regulations contain restrictions on the ability of the Parent Corporation and the Bank to pay dividends. For information regarding restrictions on dividends, see Part I, Item 1, “Business” and Part II, Item 8, “Financial Statements and Supplementary Data”, Note 20 of the Notes to Consolidated Financial Statements.”
Stockholders Return Comparison
Set forth on the following page is a line graph presentation comparing the cumulative stockholder return on the Parent Corporation’s common stock, on a dividend reinvested basis, against the cumulative total returns of the NASDAQ Composite and the KBW Bank Index for the period from December 31, 2011 through December 31, 2016.
| - 21 - | ||
COMPARE 5-YEAR CUMULATIVE
TOTAL RETURN
AMONG CONNECTONE BANCORP INC.
NASDAQ AND KBW BANK INDEX
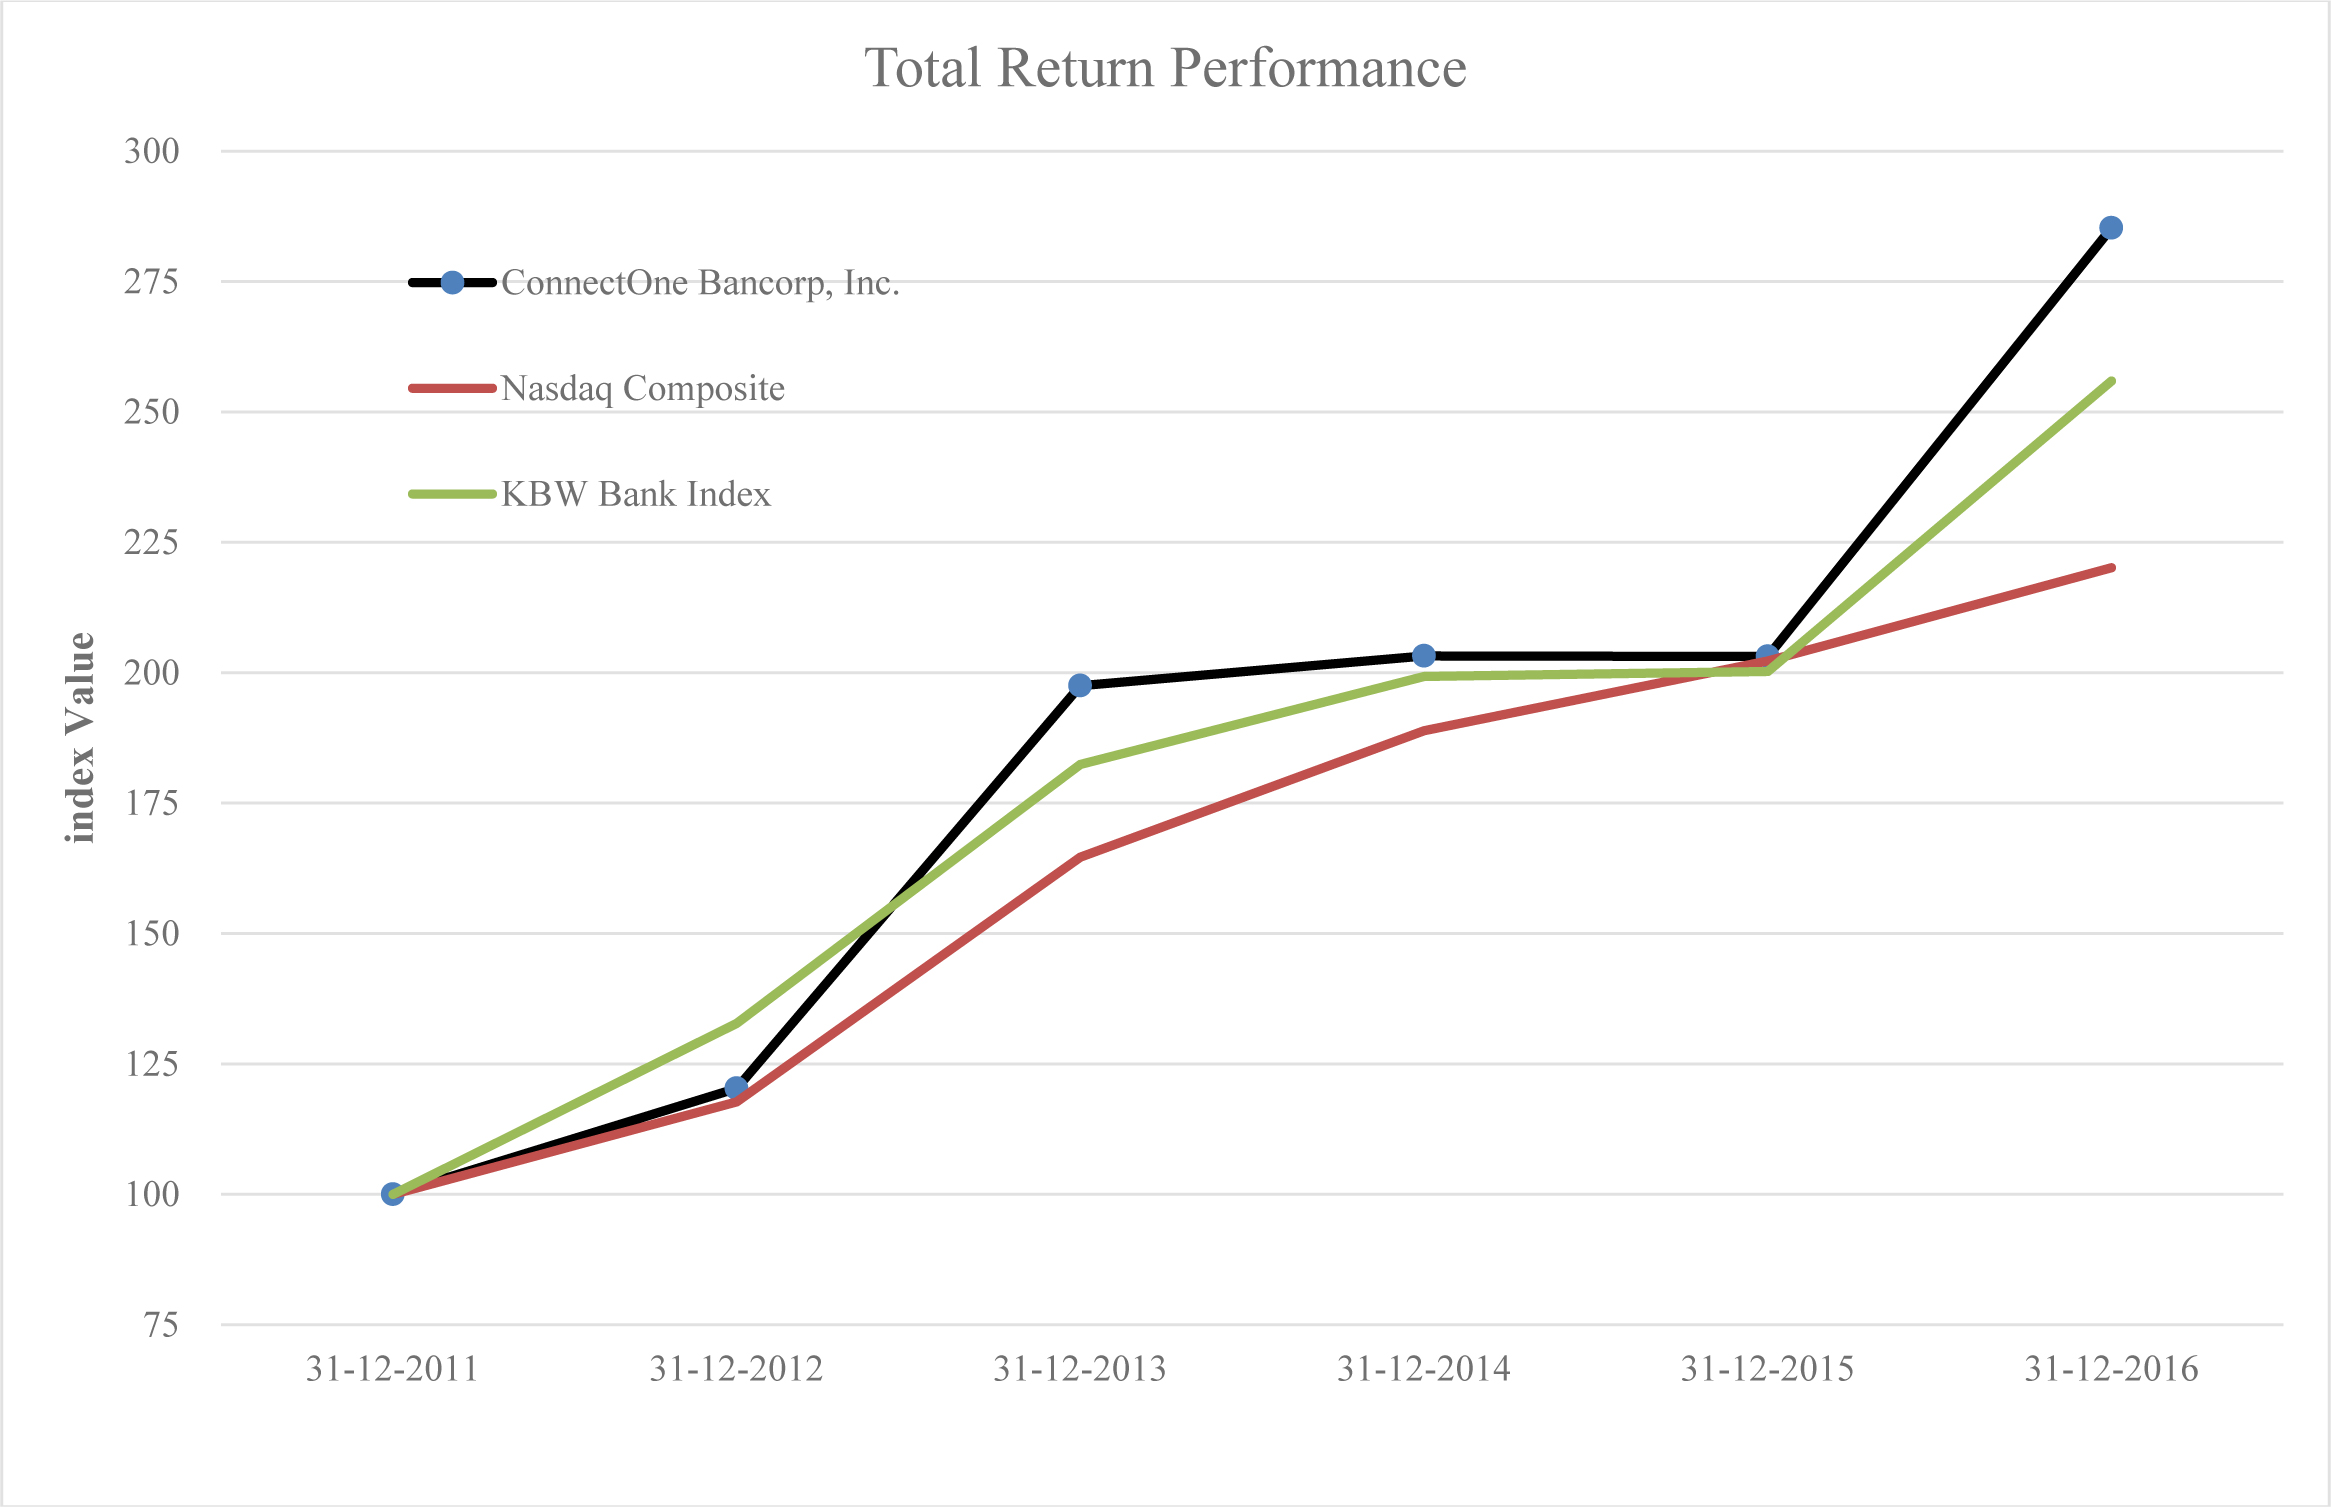
Assumes $100 Invested on December
31, 2011, with Dividends Reinvested
Year Ended December 31, 2016
COMPARISON OF CUMULATIVE TOTAL RETURN
OF ONE OR MORE
COMPANIES, PEER GROUPS, INDUSTRY INDEXES AND/OR BROAD MARKETS
| Fiscal Year Ending | ||||||||||||||||||||||||
| Company/Index/Market | 12/31/11 | 12/31/12 | 12/31/13 | 12/31/14 | 12/31/15 | 12/31/16 | ||||||||||||||||||
| ConnectOne Bancorp, Inc. | 100.00 | 120.27 | 197.54 | 203.22 | 203.11 | 285.27 | ||||||||||||||||||
| NASDAQ | 100.00 | 117.70 | 164.65 | 188.87 | 202.25 | 220.13 | ||||||||||||||||||
| KBW Bank Index | 100.00 | 132.78 | 182.44 | 199.28 | 200.25 | 255.90 | ||||||||||||||||||
| - 22 - | ||
Item 6. Selected Financial Data
The following tables set forth selected consolidated financial data as of the dates and for the periods presented. The selected consolidated statement of financial condition data as of December 31, 2016 and 2015 and the selected consolidated summary of income data for the years ended December 31, 2016, 2015 and 2014 have been derived from our audited consolidated financial statements and related notes that we have included elsewhere in this Annual Report. The selected consolidated statement of financial condition data as of December 31, 2014, 2013, 2012 and the selected consolidated summary of income data for the years ended December 31, 2013 and 2012 have been derived from audited consolidated financial statements that are not presented in this Annual Report.
The selected historical consolidated financial data as of any date and for any period are not necessarily indicative of the results that may be achieved as of any future date or for any future period. You should read the following selected statistical and financial data in conjunction with the more detailed information contained in “Management’s Discussion and Analysis of Financial Condition and Results of Operations” and our consolidated financial statements and the related notes that we have presented elsewhere in this Annual Report.
| - 23 - | ||
SUMMARY OF SELECTED STATISTICAL INFORMATION AND FINANCIAL DATA
| For the Years Ended December 31, | ||||||||||||||||||||
| 2016 | 2015 | 2014 | 2013 | 2012 | ||||||||||||||||
| (dollars in thousands, except share data) | ||||||||||||||||||||
| Selected Statement of Financial Condition Data | ||||||||||||||||||||
| Total assets | $ | 4,426,348 | $ | 4,015,909 | $ | 3,448,572 | $ | 1,673,082 | $ | 1,629,082 | ||||||||||
| Loans receivable | 3,475,832 | 3,009,007 | 2,538,641 | 960,943 | 889,672 | |||||||||||||||
| Allowance for loan and lease losses | 25,744 | 26,572 | 14,160 | 10,333 | 10,237 | |||||||||||||||
| Securities – available-for-sale | 353,290 | 195,770 | 289,532 | 323,070 | 496,815 | |||||||||||||||
| Securities – held-to-maturity | - | 224,056 | 224,682 | 215,286 | 58,064 | |||||||||||||||
| Goodwill and other intangible assets | 148,997 | 149,817 | 150,734 | 16,828 | 16,858 | |||||||||||||||
| Borrowings | 476,280 | 671,587 | 495,553 | 146,000 | 146,000 | |||||||||||||||
| Subordinated debt (net of issuance costs) | 54,534 | 54,343 | 5,155 | 5,155 | 5,155 | |||||||||||||||
| Deposits | 3,344,271 | 2,790,966 | 2,475,607 | 1,342,005 | 1,306,922 | |||||||||||||||
| Tangible common stockholders’ equity(1) | 325,127 | 316,277 | 284,235 | 168,584 | 160,691 | |||||||||||||||
| Total stockholders’ equity | 531,032 | 477,344 | 446,219 | 168,584 | 160,691 | |||||||||||||||
| Average total assets | 4,236,758 | 3,661,306 | 2,520,524 | 1,633,270 | 1,538,473 | |||||||||||||||
| Average common stockholders’ equity | 491,110 | 456,036 | 301,004 | 153,775 | 138,464 | |||||||||||||||
| Dividends | ||||||||||||||||||||
| Cash dividends paid on common stock | $ | 9,067 | $ | 8,996 | $ | 6,940 | $ | 4,254 | $ | 2,778 | ||||||||||
| Dividend payout ratio | 29.19 | % | 21.84 | % | 37.60 | % | 21.50 | % | 16.13 | % | ||||||||||
| Cash dividends per share | ||||||||||||||||||||
| Cash dividends | $ | 0.300 | $ | 0.300 | $ | 0.300 | $ | 0.280 | $ | 0.195 | ||||||||||
| Selected Statement of Income Data | ||||||||||||||||||||
| Interest income | $ | 161,241 | $ | 140,967 | $ | 94,207 | $ | 57,268 | $ | 55,272 | ||||||||||
| Interest expense | (31,096) | (23,814) | (14,808) | (11,082) | (11,776) | |||||||||||||||
| Net interest income | 130,145 | 117,153 | 79,399 | 46,186 | 43,496 | |||||||||||||||
| Provision for loan and lease losses | (38,700) | (12,605) | (4,683) | (350) | (325) | |||||||||||||||
| Net interest income after provision for loan losses | 91,445 | 104,548 | 74,716 | 45,836 | 43,171 | |||||||||||||||
| Noninterest income | 9,920 | 11,173 | 7,498 | 6,851 | 7,210 | |||||||||||||||
| Noninterest expense | (58,507) | (54,484) | (54,804) | (25,278) | (25,197) | |||||||||||||||
| Income before income tax expense | 42,858 | 61,237 | 27,410 | 27,409 | 25,184 | |||||||||||||||
| Income tax expense | (11,776) | (19,926) | (8,845) | (7,484) | (7,677) | |||||||||||||||
| Net income | $ | 31,082 | $ | 41,311 | $ | 18,565 | $ | 19,925 | $ | 17,507 | ||||||||||
| Preferred stock dividends | (22) | (112) | (112) | (141) | (281) | |||||||||||||||
| Net income available to common stockholders | $ | 31,060 | $ | 41,199 | $ | 18,453 | $ | 19,784 | $ | 17,226 | ||||||||||
__________________________
| (1) | These measures are not measures recognized under generally accepted accounting principles in the United States (“GAAP”), and are therefore considered to be non-GAAP financial measures. See –“Notes for Selected Financial Data” for a reconciliation of these measurers to their most comparable GAAP measures. |
| - 24 - | ||
| At or for the Years Ended December 31, | ||||||||||||||||||||
| (dollars in thousands, except share data) | 2016 | 2015 | 2014 | 2013 | 2012 | |||||||||||||||
| Per Common Share Data | ||||||||||||||||||||
| Basic | $ | 1.02 | $ | 1.37 | $ | 0.80 | $ | 1.21 | $ | 1.05 | ||||||||||
| Diluted | 1.01 | 1.36 | 0.79 | 1.21 | 1.05 | |||||||||||||||
| Book value per common share | 16.62 | 15.49 | 14.65 | 9.61 | 9.14 | |||||||||||||||
| Tangible book value per common share (1) | 11.96 | 10.51 | 9.57 | 8.58 | 8.11 | |||||||||||||||
| Selected Performance Ratios | ||||||||||||||||||||
| Return on average assets | 0.73 | % | 1.13 | % | 0.74 | % | 1.22 | % | 1.14 | % | ||||||||||
| Return on average common stockholders’ equity | 6.30 | 9.03 | 6.13 | 12.87 | 12.44 | |||||||||||||||
| Net interest margin | 3.38 | 3.55 | 3.57 | 3.30 | 3.32 | |||||||||||||||
| Selected Asset Quality Ratios as a % of loans receivable: | ||||||||||||||||||||
| Nonaccrual loans (excluding loans held-for sale) | 0.16 | % | 0.67 | % | 0.46 | % | 0.33 | % | 0.41 | % | ||||||||||
| Loans 90 days or greater past due and still accruing (non-PCI) | - | - | 0.05 | - | 0.01 | |||||||||||||||
| Loans 90 days or greater past due and still accruing (PCI) | 0.15 | - | - | - | - | |||||||||||||||
| Performing TDRs | 0.38 | 2.77 | 0.07 | 0.60 | 0.77 | |||||||||||||||
| Allowance for loan and lease losses | 0.74 | 0.86 | 0.56 | 1.08 | 1.15 | |||||||||||||||
| Nonperforming assets(2) to total assets | 1.57 | % | 0.58 | % | 0.37 | % | 0.20 | % | 0.30 | % | ||||||||||
| Allowance for loan and lease losses to nonaccrual loans (excluding loans held-for-sale | 449.0 | 128.1 | 122.0 | 329.4 | 283.1 | |||||||||||||||
| Net loan charge-offs (recoveries) to average loans(3) | 1.18 | 0.01 | 0.05 | 0.03 | (0.04) | |||||||||||||||
| Capital Ratios | ||||||||||||||||||||
| Leverage ratio | 9.29 | % | 9.07 | % | 9.37 | % | 9.69 | % | 9.02 | % | ||||||||||
| Common equity Tier 1 risk-based ratio | 9.74 | 9.14 | n/a | n/a | n/a | |||||||||||||||
| Risk-based Tier 1 capital ratio | 9.87 | 9.61 | 10.44 | 12.10 | 11.39 | |||||||||||||||
| Risk-based total capital ratio | 11.78 | 11.77 | 10.94 | 12.90 | 12.22 | |||||||||||||||
| Tangible common equity to tangible assets (1) | 8.93 | 8.18 | 8.62 | 8.48 | 8.22 | |||||||||||||||
__________________________
| (1) | These measures are not measures recognized under generally accepted accounting principles in the United States (“GAAP”), and are therefore considered to be non-GAAP financial measures. See –“Notes to Selected Financial Data” for a reconciliation of these measurers to their most comparable GAAP measures. |
| (2) | Nonperforming assets are defined as nonaccrual loans, nonaccrual loans held-for-sale, and other real estate owned. |
| (3) | Charge-offs in 2016 included $36.7 million related to the transfer of our taxi medallion portfolio to loans held-for-sale. |
| - 25 - | ||
Notes to Selected Financial Data
| As of the year ended December 31, | ||||||||||||||||||||
| 2016 | 2015 | 2014 | 2013 | 2012 | ||||||||||||||||
| (dollars in thousands, except per share data) | ||||||||||||||||||||
| Tangible common equity and tangible common equity/tangible assets | ||||||||||||||||||||
| Common stockholders’ equity | $ | 531,032 | $ | 466,094 | $ | 434,969 | $ | 157,334 | $ | 149,441 | ||||||||||
| Less: goodwill and other intangible assets | 148,997 | 149,817 | 150,734 | 16,828 | 16,858 | |||||||||||||||
| Tangible common stockholders’ equity | $ | 382,035 | $ | 316,277 | $ | 284,235 | $ | 140,506 | $ | 132,583 | ||||||||||
| Total assets | $ | 4,426,348 | $ | 4,015,909 | $ | 3,448,572 | $ | 1,673,082 | $ | 1,629,765 | ||||||||||
| Less: goodwill and other intangible assets | 148,997 | 149,817 | 150,734 | 16,828 | 16,858 | |||||||||||||||
| Tangible assets | $ | 4,277,351 | $ | 3,866,092 | $ | 3,297,838 | $ | 1,656,254 | $ | 1,612,907 | ||||||||||
| Tangible common equity ratio | 8.93 | % | 8.18 | % | 8.62 | % | 8.48 | % | 8.22 | % | ||||||||||
| Tangible book value per common share | ||||||||||||||||||||
| Book value per common share | $ | 16.62 | $ | 15.49 | $ | 14.65 | $ | 9.61 | $ | 9.14 | ||||||||||
| Less: goodwill and other intangible assets | 4.66 | 4.98 | 5.08 | 1.03 | 1.03 | |||||||||||||||
| Tangible book value per common share | $ | 11.96 | $ | 10.51 | $ | 9.57 | $ | 8.58 | $ | 8.11 | ||||||||||
| - 26 - | ||
Item 7. Management’s Discussion and Analysis (“MD&A”) of Financial Condition and Results of Operations
The purpose of this analysis is to provide the reader with information relevant to understanding and assessing the Company’s results of operations for each of the past three years and financial condition for each of the past two years. In order to fully appreciate this analysis, the reader is encouraged to review the consolidated financial statements and accompanying notes thereto appearing under Item 8 of this report, and statistical data presented in this document.
Cautionary Statement Concerning Forward-Looking Statements
See Item 1 of this Annual Report on Form 10-K for information regarding forward-looking statements.
Critical Accounting Policies and Estimates
Management’s Discussion and Analysis of Financial Condition and Results of Operations is based on our consolidated financial statements, which have been prepared in accordance with U.S. generally accepted accounting principles. The preparation of these financial statements requires us to make estimates and judgments that affect the reported amounts of assets, liabilities, revenues and expenses. Note 1 to our audited consolidated financial statements contains a summary of our significant accounting policies. Management believes our policy with respect to the methodology for the determination of the allowance for loan and lease losses involves a higher degree of complexity and requires management to make difficult and subjective judgments which often require assumptions or estimates about highly uncertain matters. Changes in these judgments, assumptions or estimates could materially impact results of operations. This critical policy and its application are periodically reviewed with the Audit Committee and our Board of Directors.
Business Combinations
The Company accounts for business combinations under the purchase method of accounting. The application of this method of accounting requires the use of significant estimates and assumptions in the determination of the fair value of assets acquired and liabilities assumed in order to properly allocate purchase price consideration between assets that are amortized, accreted or depreciated from those that are recorded as goodwill. Our estimates of the fair values of assets acquired and liabilities assumed are based upon assumptions that we believe to be reasonable, and whenever necessary, include assistance from independent third-party appraisal and valuation firms.
Allowance for Loan and Lease Losses and Related Provision
The allowance for loan and lease losses represents management’s estimate of probable incurred loan and lease losses inherent in the loan and lease portfolio. Determining the amount of the allowance for loan and lease losses is considered a critical accounting estimate because it requires significant judgment and the use of estimates related to the amount and timing of expected future cash flows on impaired loans, estimated probable incurred losses on pools of homogeneous loans based on historical loss experience, and consideration of current economic trends and conditions, all of which may be susceptible to significant change. The loan portfolio also represents the largest asset type on the Company’s Consolidated Statements of Condition.
The evaluation of the adequacy of the allowance for loan and lease losses includes, among other factors, an analysis of historical loss rates by loan category applied to current loan totals. However, actual loan losses may be higher or lower than historical trends, which vary. Actual losses on specified problem loans, which also are provided for in the evaluation, may vary from estimated loss percentages, which are established based upon a limited number of potential loss classifications.
The allowance for loan and lease losses is established through a provision for loan and lease losses charged to expense. Management believes that the current allowance for loan and lease losses will be adequate to absorb probable incurred loan and lease losses on existing loans and leases that may become uncollectible based on the evaluation of known and inherent risks in the originated loan portfolio. The evaluation takes into consideration such factors as changes in the nature and size of the portfolio, overall portfolio quality, and specific problem loans and current economic conditions which may affect our borrowers’ ability to pay. The evaluation also details historical losses by loan category and the resulting loan loss rates which are projected for current loan total amounts. Loss estimates for specified problem loans are also detailed. Various regulatory agencies, as an integral part of their examination process, periodically review our allowance for loan and lease losses. Such agencies may require us to make additional provisions for loan losses based upon information available to them at the time of their examination. All of the factors considered in the analysis of the adequacy of the allowance for loan and lease losses may be subject to change. To the extent actual outcomes differ from management estimates, additional provisions for loan losses may be required that could materially adversely impact earnings in future periods. Additional information can be found in Note 1 of the Notes to Consolidated Financial Statements.
| - 27 - | ||
Income Taxes
The objectives of accounting for income taxes are to recognize the amount of taxes payable or refundable for the current year and deferred tax liabilities and assets for the future tax consequences of events that have been recognized in an entity’s financial statements or tax returns. Judgment is required in assessing the future tax consequences of events that have been recognized in the Company’s consolidated financial statements or tax returns.
Fluctuations in the actual outcome of these future tax consequences could impact the Company’s consolidated financial condition or results of operations. Notes 1 (under the caption “Use of Estimates”) and 12 of the Notes to Consolidated Financial Statements include additional discussion on the accounting for income taxes.
Goodwill
The Company has adopted the provisions of FASB ASC 350-10-05, which requires that goodwill be reported separate from other intangible assets in the Consolidated Statements of Condition and not be amortized but tested for impairment annually or more frequently if indicators arise for impairment. No impairment charge was deemed necessary for the years ended December 31, 2016, 2015 and 2014.
Fair Value of Investment Securities
The Company relies upon the guidance in FASB ASC 820-10-65 when determining fair value for the Company’s pooled trust preferred securities and private issue corporate bond. See Note 22 of the Notes to Consolidated Financial Statements, Fair Value Measurements and Fair Value of Financial Instruments, for further discussion.
Overview and Strategy
We serve as a holding company for the Bank, which is our primary asset and only operating subsidiary. We follow a business plan that emphasizes the delivery of customized banking services in our market area to customers who desire a high level of personalized service and responsiveness. The Bank conducts a traditional banking business, making commercial loans, consumer loans and residential and commercial real estate loans. In addition, the Bank offers various non-deposit products through non-proprietary relationships with third party vendors. The Bank relies upon deposits as the primary funding source for its assets. The Bank offers traditional deposit products.
Many of our customer relationships start with referrals from existing customers. We then seek to cross sell our products to customers to grow the customer relationship. For example, we will frequently offer an interest rate concession on credit products for customers that maintain a noninterest-bearing deposit account at the Bank. This strategy has helped maintain our funding costs and the growth of our interest expense even as we have substantially increased our total deposits. It has also helped fuel our significant loan growth. We believe that the Bank’s significant growth and increasing profitability demonstrate the need for and success of our brand of banking.
Our results of operations depend primarily on our net interest income, which is the difference between the interest earned on our interest-earning assets and the interest paid on funds borrowed to support those assets, primarily deposits. Net interest margin is the difference between the weighted average rate received on interest-earning assets and the weighted average rate paid to fund those interest-earning assets, which is also affected by the average level of interest-earning assets as compared with that of interest-bearing liabilities. Net income is also affected by the amount of noninterest income and noninterest expenses.
General
The following discussion and analysis presents the more significant factors affecting the Company’s financial condition as of December 31, 2016 and 2015 and results of operations for each of the years in the three-year period ended December 31, 2016. The MD&A should be read in conjunction with the consolidated financial statements, notes to consolidated financial statements and other information contained in this report.
| - 28 - | ||
Operating Results Overview
Net income for the year ended December 31, 2016 was $31.1 million, a decrease of $10.2 million, or 24.8%, compared to net income of $41.3 million for 2015. Net income available to common shareholders for the year ended December 31, 2016 was $31.1 million, a decrease of $10.1 million, or 24.6%, compared to net income available to common shareholders of $41.2 million for 2015. Diluted earnings per share were $1.01 for 2016, a 25.7% decrease from $1.36 for 2015.
The change in net income from 2015 to 2016 was attributable to the following:
| · | Increased net interest income of $13.0 million primarily due to organic growth, |
| · | Increased provision for loan and lease losses of $26.1 million primarily due to an increase in additional reserves specifically allocated to the Company’s taxi medallion portfolio, resulting from the transfer of the portfolio to loans held-for-sale, |
| · | Decrease in noninterest income of $1.3 million primarily resulting from a prior year insurance recovery ($2.2 million), offset by current year increases in BOLI income ($0.8 million), |
| · | Noninterest expense increased approximately $4.0 million primarily due to an increase in salaries and employee benefits ($3.4 million), occupancy and equipment ($1.0 million), FDIC insurance ($0.8 million), data processing ($0.4 million) and other expenses ($0.6 million), offset by a prior year loss on extinguishment of debt ($2.4 million), and |
| · | Decreased income tax expense of $8.2 million resulting from decrease in income before taxes. |
Net income for the year ended December 31, 2015 was $41.3 million, an increase of $22.7 million, or 123.4%, compared to net income of $18.6 million for 2014. Net income available to common shareholders for the year ended December 31, 2015 was $41.2 million, an increase of $22.7 million, or 123.3%, compared to net income available to common shareholders of $18.5 million for 2014. Diluted earnings per share were $1.36 for 2015, a 72.2% increase from $0.79 for 2014.
The change in net income from 2014 to 2015 was attributable to the following:
| · | Increased net interest income of $37.8 million primarily due to the impact of the Merger and organic growth, |
| · | Increased provision for loan and lease losses of $7.9 million primarily due to an increase in organic loan growth during 2015, higher levels of specific reserves including $4.5 million related to the taxi medallion portfolio and $1.3 million related to the Union Center’s former operations center that was repositioned as a lease financing receivable and the maturity and extension of acquired portfolio loans, |
| · | Increased noninterest income of $3.7 million primarily resulting from an insurance recovery ($2.2 million) and an increase in net gains on sale of investment securities ($1.1 million), |
| · | Noninterest expense remained relatively flat due to an increase in salaries and employee benefits ($8.9 million), occupancy and equipment ($2.3 million), and professional and consulting ($1.3 million), offset by impact of the Merger (including direct merger charges of $12.4 million in 2014), and |
| · | Increased income tax expense of $11.1 million resulting from higher pretax income in 2015 offset by nondeductible merger-related expenses incurred in 2014. |
Net Interest Income
Fully taxable equivalent net interest income for 2016 totaled $133.0 million, an increase of $13.3 million, or 11.1%, from 2015. The increase in net interest income was due to an increase in average interest-earning assets, which grew by 16.7% to $3.9 billion. Partially offsetting the increase in interest-earning assets was a 17 basis-point contraction in the net interest margin. The decrease in the net interest margin was attributed to higher levels of cash held at the Federal Reserve Bank, lower accretion of purchase accounting adjustments related to the Merger, long-term subordinated debt issued in June 2016, and an increase in rates paid on deposits. Average total loans increased by 20.1% to $3.4 billion in 2016 from $2.8 billion in 2015.
Fully taxable equivalent net interest income for 2015 totaled $119.7 million, an increase of $37.9 million, or 46.4%, from 2014. The increase in net interest income was due to an increase in average interest-earning assets, which grew by 47.3% to $3.4 billion principally as a result of the Merger, which was effective on July 1, 2014. Partially offsetting the increase in interest-earning assets was a 2 basis-point contraction in the net interest margin. During 2015, the Bank’s funding costs were higher due to an increase in longer-term funding, including time deposits and subordinated debt. Average total loans increased by 64.6% to $2.8 billion in 2015 from $1.7 billion in 2014.
| - 29 - | ||
Average Balance Sheets
The following table sets forth certain information relating to our average assets and liabilities for the years ended December 31, 2016, 2015 and 2014 and reflect the average yield on assets and average cost of liabilities for the periods indicated. Such yields are derived by dividing income or expense by the average balance of assets or liabilities, respectively, for the periods shown.
| Years Ended December 31, | ||||||||||||||||||||||||||||||||||||
| 2016 | 2015 | 2014 | ||||||||||||||||||||||||||||||||||
| (Tax-Equivalent Basis) | Average Balance | Income/ Expense | Yield/ Rate | Average Balance | Income/ Expense | Yield/ Rate | Average Balance | Income/ Expense | Yield/ Rate | |||||||||||||||||||||||||||
| (dollars in thousands) | ||||||||||||||||||||||||||||||||||||
| ASSETS | ||||||||||||||||||||||||||||||||||||
| Interest-earning assets: | ||||||||||||||||||||||||||||||||||||
| Investment securities (1) (2) | $ | 396,622 | $ | 13,153 | 3.32 | % | $ | 482,703 | $ | 16,128 | 3.34 | % | $ | 508,024 | $ | 18,148 | 3.57 | % | ||||||||||||||||||
| Loans (2) (3) (4) | 3,355,452 | 148,755 | 4.43 | % | 2,793,952 | 126,133 | 4.51 | % | 1,696,977 | 77,669 | 4.58 | % | ||||||||||||||||||||||||
| Federal funds sold and interest-earnings deposits with banks | 152,397 | 756 | 0.50 | % | 65,513 | 178 | 0.27 | % | 68,152 | 138 | 0.20 | % | ||||||||||||||||||||||||
| Restricted investment in bank stocks | 28,439 | 1,410 | 4.96 | % | 27,335 | 1,081 | 3.95 | % | 14,946 | 636 | 4.26 | % | ||||||||||||||||||||||||
| Total interest-earning assets | 3,932,910 | 164,074 | 4.17 | % | 3,369,503 | 143,520 | 4.26 | % | 2,288,099 | 96,591 | 4.22 | % | ||||||||||||||||||||||||
| Noninterest-earning assets: | ||||||||||||||||||||||||||||||||||||
| Allowance for loan and lease losses | (32,554) | (17,905) | (14,267) | |||||||||||||||||||||||||||||||||
| Noninterest-earning assets | 336,402 | 309,708 | 246,692 | |||||||||||||||||||||||||||||||||
| Total assets | $ | 4,236,758 | $ | 3,661,306 | $ | 2,520,524 | ||||||||||||||||||||||||||||||
LIABILITIES & STOCKHOLDERS’ EQUITY | ||||||||||||||||||||||||||||||||||||
| Savings, NOW, money market, interest checking | $ | 1,544,838 | 6,754 | 0.44 | % | $ | 1,279,663 | 4,972 | 0.39 | % | $ | 1,121,148 | 4,152 | 0.37 | % | |||||||||||||||||||||
| Time deposits | 923,114 | 11,913 | 1.29 | % | 752,380 | 8,784 | 1.17 | % | 424,603 | 4,108 | 0.97 | % | ||||||||||||||||||||||||
| Total interest-bearing deposits | 2,467,952 | 18,667 | 0.76 | % | 2,032,043 | 13,756 | 0.68 | % | 1,545,751 | 8,260 | 0.53 | % | ||||||||||||||||||||||||
| Borrowings | 571,626 | 9,013 | 1.58 | % | 565,408 | 8,181 | 1.45 | % | 288,798 | 6,301 | 2.18 | % | ||||||||||||||||||||||||
| Subordinated debentures (5) | 55,155 | 3,246 | 5.89 | % | 30,497 | 1,700 | 5.57 | % | 5,155 | 156 | 3.03 | % | ||||||||||||||||||||||||
| Capital lease obligation | 2,829 | 170 | 6.01 | % | 2,946 | 177 | 6.01 | % | 1,528 | 91 | 5.96 | |||||||||||||||||||||||||
| Total interest-bearing liabilities | 3,097,562 | 31,096 | 1.00 | % | 2,630,894 | 23,814 | 0.91 | % | 1,841,232 | 14,808 | 0.80 | % | ||||||||||||||||||||||||
| Noninterest-bearing deposits | 624,731 | 537,287 | 350,310 | |||||||||||||||||||||||||||||||||
| Other liabilities | 21,203 | 25,839 | 16,728 | |||||||||||||||||||||||||||||||||
| Stockholders’ equity | 493,262 | 467,286 | 312,254 | |||||||||||||||||||||||||||||||||
| Total liabilities and stockholders’ equity | $ | 4,236,758 | $ | 3,661,306 | $ | 2,520,524 | ||||||||||||||||||||||||||||||
Net interest income/interest rate spread (6) | $ | 132,978 | 3.17 | % | $ | 119,706 | 3.35 | % | $ | 81,783 | 3.42 | % | ||||||||||||||||||||||||
| Tax-equivalent adjustment | (2,833) | (2,553) | (2,384) | |||||||||||||||||||||||||||||||||
| Net interest income as reported | $ | 130,145 | $ | 117,153 | $ | 79,399 | ||||||||||||||||||||||||||||||
| Net interest margin (7) | 3.38 | % | 3.55 | % | 3.57 | % | ||||||||||||||||||||||||||||||
__________________________
| (1) | Average balances are based on amortized cost. |
| (2) | Interest income is presented on a tax equivalent basis using 35% federal tax rate. |
| (3) | Includes loan fee income. |
| (4) | Loans include nonaccrual loans. |
| (5) | Amount does not reflect netting of debt issuance costs of $621, $812 and $ - as of December 31, 2016, December 31, 2015 and December 31, 2014, respectively. |
| (6) | Represents difference between the average yield on interest-earning assets and the average cost of interest-bearing liabilities and is presented on a tax equivalent basis. |
| (7) | Represents net interest income on a tax equivalent basis divided by average total interest-earning assets |
| - 30 - | ||
Rate/Volume Analysis
The following table presents, by category, the major factors that contributed to the changes in net interest income. Changes due to both volume and rate have been allocated in proportion to the relationship of the dollar amount change in each.
| 2016/2015 Increase (Decrease) Due to Change in: | 2015/2014 Increase (Decrease) Due to Change in: | |||||||||||||||||||||||
| Average Volume | Average Rate | Net Change | Average Volume | Average Rate | Net Change | |||||||||||||||||||
| (dollars in thousands) | ||||||||||||||||||||||||
| Interest income: | ||||||||||||||||||||||||
| Investment securities: | $ | (2,855) | $ | (120) | $ | (2,975) | $ | (846) | $ | (1,174) | $ | (2,020) | ||||||||||||
| Loans receivable and loans held-for-sale | 24,893 | (2,271) | 22,622 | 49,523 | (1,059) | 48,464 | ||||||||||||||||||
| Federal funds sold and interest-earnings deposits with banks | 431 | 147 | 578 | (7) | 47 | 40 | ||||||||||||||||||
| Restricted investment in bank stocks | 55 | 274 | 329 | 490 | (45) | 445 | ||||||||||||||||||
| Total interest income: | $ | 22,524 | $ | (1,970) | $ | 20,554 | $ | 49,160 | $ | (2,231) | $ | 46,929 | ||||||||||||
| Interest expense: | ||||||||||||||||||||||||
| Savings, NOW, money market, interest checking | $ | 1,294 | $ | 488 | $ | 1,622 | $ | 632 | $ | 188 | $ | 820 | ||||||||||||
| Time deposits | 2,203 | 926 | 3,289 | 3,827 | 849 | 4,676 | ||||||||||||||||||
| Borrowings and subordinated debentures | 1,549 | 829 | 2,378 | 5,415 | (1,991) | 3,424 | ||||||||||||||||||
| Capital lease obligation | (7) | - | (7) | 85 | 1 | 86 | ||||||||||||||||||
| Total interest expense: | $ | 5,039 | $ | 2,243 | $ | 7,282 | $ | 9,959 | $ | (953) | $ | 9,006 | ||||||||||||
| Net interest income: | $ | 17,485 | $ | (4,213) | $ | 13,272 | $ | 39,201 | $ | (1,278) | $ | 37,923 | ||||||||||||
Provision for Loan and Lease Losses
In determining the provision for loan and lease losses, management considers national and local economic trends and conditions; trends in the portfolio including orientation to specific loan types or industries; experience, ability and depth of lending management in relation to the complexity of the portfolio; effects of changes in lending policies, trends in volume and terms of loans; levels and trends in delinquencies, impaired loans and net charge-offs and the results of independent third party loan and lease review.
For the year ended December 31, 2016, the provision for loan and lease losses was $38.7 million, an increase of $26.1 million, compared to the provision for loan and lease losses of $12.6 million for 2015. The increase was largely attributable to an increase in reserves allocated to the Bank’s taxi medallion portfolio of approximately $27.7 million resulting from the transfer of the portfolio to loans held-for-sale, offset by a reduction in reserves of $1.5 million related to the movement of loans from the acquired portfolio into loans held-for-investment.
For the year ended December 31, 2015, the provision for loan and lease losses was $12.6 million, an increase of $7.9 million, compared to the provision for loan and lease losses of $4.7 million for the same period in 2014. The increase resulted from an increase in organic loan growth during 2015, higher levels of specific reserves including $4.5 million related to the taxi medallion portfolio and $1.3 million related to the Union Center’s former operations center that was repositioned as a lease financing receivable and the maturity and extension of acquired portfolio loans.
Noninterest Income
Noninterest income for the full-year 2016 decreased by $1.3 million, or 11.2% to $9.9 million from $11.2 million in 2015. The decrease was primarily the result of a 2015 insurance recovery of $2.2 million, offset by an increase in BOLI income of $0.8 million and higher net investment securities gains, increasing by $0.3 million to $4.2 million for the year ended December 31, 2016 from $3.9 million for the year ended December 31, 2015.
| - 31 - | ||
Noninterest income for the full-year 2015 increased by $3.7 million, or 49.0% to $11.2 million from $7.5 million in 2014. The increase was primarily the result of a 2015 insurance recovery of $2.2 million and higher net investment securities gains, increasing by $1.1 million to $3.9 million for the year ended December 31, 2015 from $2.8 million for the year ended December 31, 2014, partially offset by a slight decline in deposit, loan and other income of $0.1 million to $2.7 million and a decline in annuities and insurance commissions of $0.2 million to $0.2 million for the year ended December 31, 2015.
Noninterest Expense
Noninterest expenses for the full-year 2016 increased by $4.0 million, or 7.4% to $58.5 million from $54.5 million in 2015. The increase was primarily attributable to an increased level of business and staff resulting from organic growth. Salary and employee benefits increased by $3.3 million, occupancy and equipment expenses increased by $1.0 million, FDIC insurance increased by $0.8 million, data processing increased by $0.4 million, marketing and advertising increased by $0.2 million and other expenses increased by $0.6 million, offset by a 2015 loss on an extinguishment of debt for $2.4 million.
Noninterest expenses for the full-year 2015 decreased by $0.3 million, or 0.6% to $54.5 million from $54.8 million in 2014. The decrease was a result of merger-related charges of $12.4 million in 2014, offset by increases attributable to the Merger (2015 reflected a full-year of combined company expenses whereas 2014 reflected those expenses only during the second half) as well as an increased level of business and staff resulting from organic growth. Salary and employee benefits increased by $8.9 million, occupancy and equipment expenses increased by $2.3 million and professional and consulting fees increased by $1.3 million.
Income Taxes
Income tax expense was $11.8 million for the full-year 2016 compared to $19.9 million for the full-year 2015 and $8.8 million for the full-year 2014. The effective tax rates were 27.5% for 2016 and 32.5% for 2015 and 32.3% for 2014. The effective tax rate in 2016 from 2015 decreased due to a decrease in the proportion of income subject to income taxes. The effective tax rate in 2015 from 2014 remained relatively flat.
For a more detailed description of income taxes see Note 12 of the Notes to Consolidated Financial Statements.
Financial Condition Overview
At December 31, 2016, the Company’s total assets were $4.4 billion, an increase of $410 million from December 31, 2015. Total loans (including loans held-for-sale) were $3.6 billion, an increase of $455 million from December 31, 2015. Deposits were $3.3 billion, an increase of $553 million from December 31, 2015.
At December 31, 2015, the Company’s total assets were $4.0 billion, an increase of $568 million from December 31, 2014. Loans receivable were $3.1 billion, an increase of $560 million from December 31, 2014. Deposits were $2.8 billion, an increase of $315 million from December 31, 2014.
Loan Portfolio
The Bank’s lending activities are generally oriented to small-to-medium sized businesses, high net worth individuals, professional practices and consumer and retail customers living and working in the Bank’s market area of Bergen, Union, Morris, Essex, Hudson, Mercer and Monmouth counties, New Jersey, as well as NYC’s five boroughs. The Bank has not made loans to borrowers outside of the United States. The Bank believes that its strategy of high-quality customer service, competitive rate structures and selective marketing have enabled it to gain market share.
Commercial loans are loans made for business purposes and are primarily secured by collateral such as cash balances with the Bank, marketable securities held by or under the control of the Bank, business assets including accounts receivable, inventory and equipment and liens on commercial and residential real estate. Commercial construction loans are loans to finance the construction of commercial or residential properties secured by first liens on such properties. Commercial real estate loans include loans secured by first liens on completed commercial properties, including multi-family properties, to purchase or refinance such properties. Residential mortgages include loans secured by first liens on residential real estate, and are generally made to existing customers of the Bank to purchase or refinance primary and secondary residences. Home equity loans and lines of credit include loans secured by first or second liens on residential real estate for primary or secondary residences. Consumer loans are made to individuals who qualify for auto loans, cash reserve, credit cards and installment loans.
During 2016 and 2015, loan portfolio growth was positively impacted in several ways including (i) an increase in demand for small business lines of credit, and business term loans as economic conditions have stabilized and begun to improve, (ii) industry consolidation and lending restrictions involving larger competitors allowing the Bank to gain market share, (iii) an increase in refinancing strategies employed by borrowers during the current low rate environment, and (iv) the Bank’s success in attracting highly experienced commercial loan officers with substantial local market knowledge.
| - 32 - | ||
Total gross loans at December 31, 2016 totaled $3.5 billion, an increase of $378 million, or 12.2%, over gross loans at December 31, 2015 of $3.1 billion. As of December 31, 2016, the Bank had transferred $77.8 million of loans to loans held-for-sale, consisting primarily of $65.6 million of taxi medallion loans (part of commercial loans), $7.7 million of commercial real estate loans and $4.5 million in non-taxi commercial loans. Excluding this transfer, total gross loans at December 31, 2016 increased by $455 million, or 14.7% over gross loans at December 31, 2015. The increase in gross loans was attributable to organic loan growth.
The largest component of our loan portfolio at December 31, 2016 and December 31, 2015 was commercial real estate loans. Our commercial real estate loans (including multifamily loans) at December 31, 2016 totaled $2.2 billion, an increase of $238 million, or 12.1%, over commercial real estate loans at December 31, 2015 of $2.0 billion. Our commercial loans totaled $553.6 million at December 31, 2016, a decrease of $16.5 million, or 2.9%, over commercial loans at December 31, 2015 of $570.1 million. The decrease was the result of a transfer of the entire taxi medallion portfolio ($65.6 million) to loans held-for-sale as of December 31, 2016. Excluding this transfer of the taxi medallion portfolio, the commercial loan portfolio increased by $49.1 million, or 8.7% over commercial loans at December 31, 2015.
Our commercial construction loans at December 31, 2016 totaled $486.2 million, an increase of $157.4 million, or 47.9%, over commercial construction loans at December 31, 2015 of $328.8 million. Our residential real estate loans totaled $232.5 million at December 31, 2016, a decrease of $1.1 million, or 0.5%, over residential real estate loans at December 31, 2015 of $233.7 million. Our consumer loans at December 31, 2016 totaled $2.4 million, a decrease of $0.1 million, 3.0%, over consumer loans of $2.5 million at December 31, 2015. The growth in our loan portfolio reflects the success of our business strategy, in particular emphasizing high-quality customer service, which has led to continued customer referrals.
The following table sets forth the classification of our loans by loan portfolio segment for the periods presented.
| December 31, | ||||||||||||||||
| 2016 | 2015 | 2014 | 2013 | 2012 | ||||||||||||
| (dollars in thousands) | ||||||||||||||||
| Commercial | $ | 553,576 | $ | 570,116 | $ | 499,816 | $ | 229,688 | $ | 181,682 | ||||||
| Commercial real estate | 2,204,710 | 1,966,696 | 1,634,510 | 536,539 | 497,392 | |||||||||||
| Commercial construction | 486,228 | 328,838 | 167,359 | 42,722 | 40,277 | |||||||||||
| Residential real estate | 232,547 | 233,690 | 234,967 | 150,571 | 169,094 | |||||||||||
| Consumer | 2,380 | 2,454 | 2,879 | 1,084 | 1,104 | |||||||||||
| Gross loans | 3,479,441 | 3,101,794 | 2,539,531 | 960,604 | 889,549 | |||||||||||
| Net deferred (fees) loan costs | (3,609) | (2,787) | (890) | 339 | 123 | |||||||||||
| Loans receivable | 3,475,832 | 3,099,007 | 2,538,641 | 960,943 | 889,672 | |||||||||||
| Allowance for loan and lease losses | (25,744) | (26,572) | (14,160) | (10,333) | (10,237) | |||||||||||
| Net loans receivable | $ | 3,450,088 | $ | 3,072,435 | $ | 2,524,481 | $ | 950,610 | $ | 879,435 | ||||||
The following table sets forth the classification of our gross loans by loan portfolio segment and by fixed and adjustable rate loans as of December 31, 2016 in term of contractual maturity.
| At December 31, 2016, Maturing | |||||||||||||
| In One Year or Less |
After One Year through Five Years |
After Five Years |
Total | ||||||||||
| (dollars in thousands) | |||||||||||||
| Commercial | $ | 228,442 | $ | 185,982 | $ | 139,152 | $ | 553,576 | |||||
| Commercial real estate | 201,193 | 622,184 | 1,381,333 | 2,204,710 | |||||||||
| Commercial construction | 428,177 | 58,051 | - | 486,228 | |||||||||
| Residential real estate | 5,224 | 33,878 | 193,445 | 232,547 | |||||||||
| Consumer | 805 | 813 | 762 | 2,380 | |||||||||
| Total | $ | 863,841 | $ | 900,908 | $ | 1,714,692 | $ | 3,479,441 | |||||
| Loans with: | |||||||||||||
| Fixed rates | $ | 180,994 | $ | 538,599 | $ | 523,755 | $ | 1,243,348 | |||||
| Variable rates | 682,847 | 362,309 | 1,190,937 | 2,236,093 | |||||||||
| Total | $ | 863,841 | $ | 900,908 | $ | 1,714,692 | $ | 3,479,441 | |||||
For additional information regarding loans, see Note 5 of the Notes to the Consolidated Financial Statements.
| - 33 - | ||
Asset Quality
General. One of our key objectives is to maintain a high level of asset quality. When a borrower fails to make a scheduled payment, we attempt to cure the deficiency by making personal contact with the borrower. Initial contacts typically are made 15 days after the date the payment is due, and late notices are sent approximately 15 days after the date the payment is due. In most cases, deficiencies are promptly resolved. If the delinquency continues, late charges are assessed and additional efforts are made to collect the deficiency. All loans which are delinquent 30 days or more are reported to the board of directors of the Bank on a monthly basis.
On loans where the collection of principal or interest payments is doubtful, the accrual of interest income ceases (“nonaccrual” loans). Except for loans that are well secured and in the process of collection, it is our policy to discontinue accruing additional interest and reverse any interest accrued on any loan that is 90 days or greater past due. On occasion, this action may be taken earlier if the financial condition of the borrower raises significant concern with regard to his/her ability to service the debt in accordance with the terms of the loan agreement. Interest income is not accrued on these loans until the borrower’s financial condition and payment record demonstrate an ability to service the debt.
Real estate acquired as a result of foreclosure is classified as other real estate owned (“OREO”) until sold. OREO is recorded at the lower of cost or fair value less estimated selling costs. Costs associated with acquiring and improving a foreclosed property are usually capitalized to the extent that the carrying value does not exceed fair value less estimated selling costs. Holding costs are charged to expense. Gains and losses on the sale of OREO are charged to operations, as incurred.
A loan is considered impaired when, based on current information and events, it is probable that the Bank will be unable to collect the scheduled payments of principal or interest when due according to the contractual terms of the loan agreement. Factors considered by management in determining impairment include payment status and the probability of collecting scheduled principal and interest payments when due. Loans for which the terms have been modified as a concession to the borrower due to the borrower experiencing financial difficulties are considered troubled debt restructurings (“TDR”) and are classified as impaired. Loans considered to be TDRs can be categorized as nonaccrual or performing. The impairment of a loan can be measured at (1) the fair value of the collateral less costs to sell, if the loan is collateral dependent, (2) at the value of expected future cash flows using the loan’s effective interest rate, or (3) at the loan’s observable market price. Generally, the Bank measures impairment of such loans by reference to the fair value of the collateral less costs to sell. Loans that experience minor payment delays and payment shortfall generally are not classified as impaired.
Loans $250,000 and over, as well as all TDRs, are individually evaluated for impairment. If a loan that is identified as impaired and the individual test results in an impairment, a portion of the allowance is allocated so that the loan is reported, net, at the fair value of collateral less costs to sell if repayment is expected solely from the collateral or at the present value of estimated future cash flows using the loan’s existing rate if the loan is dependent on cash flow. Loans with balances less than $250,000 (with the exception of TDRs) are collectively evaluated for impairment, and accordingly, are not separately identified for impairment disclosures.
Asset Classification. Federal regulations and our policies require that we utilize an internal asset classification system as a means of reporting problem and potential problem assets. We have incorporated an internal asset classification system, substantially consistent with Federal banking regulations, as a part of our credit monitoring system. Federal banking regulations set forth a classification scheme for problem and potential problem assets as “substandard,” “doubtful” or “loss” assets. An asset is considered “substandard” if it is inadequately protected by the current net worth and paying capacity of the obligor or of the collateral pledged, if any. “Substandard” assets include those characterized by the “distinct possibility” that the insured institution will sustain “some loss” if the deficiencies are not corrected. Assets classified as “doubtful” have all of the weaknesses inherent in those classified “substandard” with the added characteristic that the weaknesses present make “collection or liquidation in full,” on the basis of currently existing facts, conditions, and values, “highly questionable and improbable.” Assets classified as “loss” are those considered “uncollectible” and of such little value that their continuance as assets without the establishment of a specific loss reserve is not warranted. Assets which do not currently expose the insured institution to sufficient risk to warrant classification in one of the aforementioned categories but possess weaknesses are required to be designated “special mention.”
When an insured institution classifies one or more assets, or portions thereof, as “substandard” or “doubtful,” it is required that a general valuation allowance for loan and lease losses must be established for loan and lease losses in an amount deemed prudent by management. General valuation allowances represent loss allowances which have been established to recognize the inherent losses associated with lending activities, but which, unlike specific allowances, have not been allocated to particular problem assets. When an insured institution classifies one or more assets, or portions thereof, as “loss,” it is required either to establish a specific allowance for losses equal to 100% of the amount of the asset so classified or to charge off such amount.
| - 34 - | ||
A bank’s determination as to the classification of its assets and the amount of its valuation allowances is subject to review by Federal bank regulators which can order the establishment of additional general or specific loss allowances. The Federal banking agencies have adopted an interagency policy statement on the allowance for loan and lease losses. The policy statement provides guidance for financial institutions on both the responsibilities of management for the assessment and establishment of allowances and guidance for banking agency examiners to use in determining the adequacy of general valuation guidelines. Generally, the policy statement recommends that institutions have effective systems and controls to identify, monitor and address asset quality problems; that management analyze all significant factors that affect the collectability of the portfolio in a reasonable manner; and that management establish acceptable allowance evaluation processes that meet the objectives set forth in the policy statement. Our management believes that, based on information currently available, our allowance for loan and lease losses is maintained at a level which covers all known and probable incurred losses in the portfolio at each reporting date. However, actual losses are dependent upon future events and, as such; further additions to the level of allowances for loan losses may become necessary.
The table below sets forth information on our classified loans and loans designated as special mention (excluding loans held-for-sale) as of the dates presented:
| December 31, | ||||||||
| 2016 | 2015 | |||||||
| (dollars in thousands) | ||||||||
| Classified Loans: | ||||||||
| Substandard | $ | 35,693 | $ | 130,253 | ||||
| Doubtful | - | 239 | ||||||
| Loss | - | - | ||||||
| Total classified loans | 35,693 | 130,492 | ||||||
| Special Mention Loans | 37,816 | 31,412 | ||||||
| Total classified and special mention loans | $ | 73,509 | $ | 161,904 | ||||
During the year ended December 31, 2016, “substandard” loans, which include lower credit quality loans which possess higher risk characteristics than special mention assets, decreased from $130.3 million, or 4.2% of total loans receivable, at December 31, 2015 to $35.7 million, or 1.0% of total loans, at December 31, 2016. The decrease is primarily attributable to the entire taxi medallion portfolio moving to the loans held-for-sale category. At December 31, 2015, approximately $80.3 million of taxi medallion loans were reported as “substandard”. In addition, a relationship totaling $10.4 million (consisting of two commercial loans and one lease financing receivable) that was reported as “substandard” as of December 31, 2015 was paid off during the third quarter of 2016.
Nonperforming Loans, Troubled Debt Restructurings, Past Due Loans and OREO
Nonperforming loans include nonaccrual loans and accruing loans which are contractually past due 90 days or greater. Nonaccrual loans represent loans on which interest accruals have been suspended. The Company considers charging off loans, or a portion thereof, when they become contractually past due ninety days or more as to interest or principal payments or when other internal or external factors indicate that collection of principal or interest is doubtful. Troubled debt restructurings represent loans on which a concession was granted to a borrower, such as a reduction in interest rate to a rate lower than the current market rate for new debt with similar risks, and which are currently performing in accordance with the modified terms. The Company previously reported performing troubled debt restructured loans as a component of nonperforming assets. For additional information regarding loans, see Note 5 of the Notes to the Consolidated Financial Statements.
| - 35 - | ||
The following table sets forth, as of the dates indicated, the amount of the Company’s nonaccrual loans, other real estate owned (“OREO”), performing troubled debt restructurings (“TDRs”) and loans past due 90 days or greater and still accruing:
| At December 31, | ||||||||||||||||||||
| 2016 | 2015 | 2014 | 2013 | 2012 | ||||||||||||||||
| (dollars in thousands) | ||||||||||||||||||||
| Nonaccrual loans | $ | 5,734 | $ | 20,737 | $ | 11,609 | $ | 3,137 | $ | 3,616 | ||||||||||
| Nonaccrual loans (held-for-sale) | 63,044 | - | - | - | - | |||||||||||||||
| OREO | 626 | 2,549 | 1,108 | 220 | 1,300 | |||||||||||||||
| Total nonperforming assets(1) | $ | 69,404 | $ | 23,286 | $ | 12,717 | $ | 3,357 | $ | 4,916 | ||||||||||
| Performing TDRs | $ | 13,338 | $ | 85,925 | $ | 1,763 | $ | 5,746 | $ | 6,813 | ||||||||||
| Loans 90 days or greater past due and still accruing (non-PCI) | $ | - | $ | - | $ | - | $ | - | $ | - | ||||||||||
| Loans 90 days or greater past due and still accruing (PCI) | $ | 5,293 | $ | - | $ | - | $ | - | $ | - | ||||||||||
| (1) | Nonperforming assets are defined as nonaccrual loans, nonaccrual loans held-for-sale, and other real estate owned. |
| Nonaccrual loans (excluding loans held-for-sale) to total loans receivable | 0.16% | 0.67% | 0.46% | 0.33% | 0.41% | |||||||||||||||
| Nonperforming assets to total assets | 1.57% | 0.58% | 0.37% | 0.20% | 0.30% | |||||||||||||||
| Nonperforming assets, performing TDRs, and loans 90 days or greater past due and still accruing to total loans(2) | 2.48% | 3.52% | 0.62% | 0.95% | 1.32% |
| (2) | Includes loans held-for-sale. |
The decrease in performing TDRs was mainly attributable to the entire taxi medallion portfolio being moved to loans held-for-sale as of December 31, 2016. As of December 31, 2015, $78.5 of taxi medallion loans were reported as performing TDRs. In addition, prior to the taxi medallion loans being moved to the loans held-for-sale category, $63.0 million of taxi medallion loans (net of a $36.7 charge-off) were designated as nonaccrual.
Allowance for Loan and Lease Losses and Related Provision
The allowance for loan and lease losses is a reserve established through charges to earnings in the form of a provision for loan and lease losses. We maintain an allowance for loan and lease losses at a level considered adequate to provide for all known and probable incurred losses in the portfolio. The level of the allowance is based on management’s evaluation of estimated losses in the portfolio, after consideration of risk characteristics of the loans and prevailing and anticipated economic conditions. Loan charge-offs (i.e., loans judged to be uncollectible) are charged against the reserve and any subsequent recovery is credited. Our officers analyze risks within the loan portfolio on a continuous basis and through an external independent loan review function, and the results of the loan review function are also reviewed by our Audit Committee. A risk system, consisting of multiple grading categories for each portfolio class, is utilized as an analytical tool to assess risk and appropriate reserves. In addition to the risk system, management further evaluates risk characteristics of the loan portfolio under current and anticipated economic conditions and considers such factors as the financial condition of the borrower, past and expected loss experience, and other factors which management feels deserve recognition in establishing an appropriate reserve. These estimates are reviewed at least quarterly and, as adjustments become necessary, they are recognized in the periods in which they become known. Although management strives to maintain an allowance it deems adequate, future economic changes, deterioration of borrowers’ creditworthiness, and the impact of examinations by regulatory agencies all could cause changes to our allowance for loan and lease losses.
At December 31, 2016, the allowance for loan and lease losses was $25.7 million, a decrease of $0.8 million or 3.1%, from $26.6 million for the year ended December 31, 2015. The decrease in the allowance for loan and lease losses was primarily attributable to net charge-offs of $39.5 million, of which $36.7 million were for the nonperforming taxi medallion portfolio, offset by provisioning of $38.7 million, of which $32.2 million were related to the nonperforming taxi medallion portfolio. The remaining provision was mainly attributable to organic loan growth.
| - 36 - | ||
Net charge-offs totaled $39.5 million during 2016 and $0.2 million for 2015. The allowance for loan and lease losses as a percentage of loans receivable was 0.74% at December 31, 2016 and 0.86% at December 31, 2015. The increase in net charge-offs and the decrease in the percentage were attributable to the aforementioned charges against the taxi medallion portfolio.
Five-Year Statistical Allowance for Loan and Lease Losses
The following table reflects the relationship of loan volume, the provision and allowance for loan and lease losses and net charge-offs for the past five years.
| Years Ended December 31, | ||||||||||||||||||||
| 2016 | 2015 | 2014 | 2013 | 2012 | ||||||||||||||||
| (dollars in thousands) | ||||||||||||||||||||
| Balance at the beginning of year | $ | 26,572 | $ | 14,160 | $ | 10,333 | $ | 10,237 | $ | 9,602 | ||||||||||
| Charge-offs: | ||||||||||||||||||||
| Commercial-other | 1,446 | 507 | 777 | 132 | 57 | |||||||||||||||
| Commercial-taxi medallions | 36,750 | - | - | - | - | |||||||||||||||
| Commercial-lease financing receivable | 1,147 | - | - | - | - | |||||||||||||||
| Commercial real estate | 107 | - | - | - | - | |||||||||||||||
| Residential real estate | 94 | - | 159 | 175 | 454 | |||||||||||||||
| Consumer | 29 | 31 | - | 22 | 16 | |||||||||||||||
| Total charge-offs | 39,573 | 538 | 936 | 329 | 527 | |||||||||||||||
| Recoveries: | ||||||||||||||||||||
| Commercial-other | 4 | 340 | 50 | 69 | 620 | |||||||||||||||
| Commercial real estate | 35 | - | - | - | - | |||||||||||||||
| Residential real estate | 3 | 2 | 19 | - | 210 | |||||||||||||||
| Consumer | 3 | 3 | 11 | 6 | 7 | |||||||||||||||
| Total recoveries | 45 | 345 | 80 | 75 | 837 | |||||||||||||||
| Net charge-offs (recoveries) | 39,528 | 193 | 856 | 254 | (310 | ) | ||||||||||||||
| Provision for loan and lease losses | 38,700 | 12,605 | 4,683 | 350 | 325 | |||||||||||||||
| Balance at end of year | $ | 25,744 | $ | 26,572 | $ | 14,160 | $ | 10,333 | $ | 10,237 | ||||||||||
| Ratio of net charge-offs (recoveries) during the year to average loans outstanding during the year | 1.18 | % | 0.01 | % | 0.05 | % | 0.03 | % | (0.04) | % | ||||||||||
| Allowance for loan and lease losses as a percentage of loans receivable at end of year | 0.74 | % | 0.86 | % | 0.56 | % | 1.08 | % | 1.15 | % | ||||||||||
For additional information regarding loans, see Note 5 of the Notes to the Consolidated Financial Statements.
Implicit in the lending function is the fact that loan losses will be experienced and that the risk of loss will vary with the type of loan being made, the creditworthiness of the borrower and prevailing economic conditions. The allowance for loan and lease losses has been allocated in the table below according to the estimated amount deemed to be reasonably necessary to provide for the possibility of losses being incurred within the following categories of loans at December 31, for each of the past five years.
The table below shows, for three types of loans, the amounts of the allowance allocable to such loans and the percentage of such loans to total loans, along with the amount of the unallocated allowance.
| Commercial | Residential real estate | Consumer | Unallocated | |||||||||||||||||||||||||||||
| Amount of Allowance |
Loans to Total Loans % |
Amount of Allowance |
Loans to Total Loans % |
Amount of Allowance |
Loans to Total Loans % |
Amount of Allowance |
Total Allowance | |||||||||||||||||||||||||
| (dollars in thousands) | ||||||||||||||||||||||||||||||||
| 2016 | $ | 24,005 | 93.2 | $ | 957 | 6.7 | $ | 3 | 0.1 | $ | 779 | $ | 25,744 | |||||||||||||||||||
| 2015 | 25,127 | 92.4 | 977 | 7.5 | 4 | 0.1 | 464 | 26,572 | ||||||||||||||||||||||||
| 2014 | 12,121 | 90.6 | 1,113 | 9.3 | 7 | 0.1 | 919 | 14,160 | ||||||||||||||||||||||||
| 2013 | 7,806 | 84.2 | 990 | 15.7 | 146 | 0.1 | 1,391 | 10,333 | ||||||||||||||||||||||||
| 2012 | 7,944 | 80.9 | 1,528 | 19.0 | 114 | 0.1 | 651 | 10,237 | ||||||||||||||||||||||||
| - 37 - | ||
Investments
For the year ended December 31, 2016, the average volume of investment securities decreased by $86.1 million to approximately $396.6 million or 10.1% of average earning assets, from $482.7 million on average, or 14.3% of average earning assets, in 2015. The decrease in investment securities resulted from a focus on funding new loan originations and sale of investments. At December 31, 2016, the total investment portfolio amounted to $353.3 million, a decrease of $66.5 million from December 31, 2015. At December 31, 2016, the principal components of the investment portfolio are U.S. Treasury and Government Agency Obligations, Federal Agency Obligations including mortgage-backed securities, Obligations of U.S. states and political subdivision, corporate bonds and notes, and other debt and equity securities.
Transfers of debt securities from the held-to-maturity category to the available-for-sale category are made at fair value at the date of transfer. The unrealized holding gain or loss at the date of the transfer is recognized in accumulated other comprehensive income, net of applicable taxes. During the quarter ended September 30, 2016 the Company transferred all securities previously categorized as held-to-maturity to available-for-sale classification. The transfer resulted in an increase of approximately $210 million in amortized cost basis of securities and resulted in a net increase to accumulated other comprehensive income of $7.4 million, net of tax. This transfer will enhance liquidity and increase flexibility with regard to asset-liability management and balance sheet composition.
During the year ended December 31, 2016, volume related factors decreased investment revenue by $2.9 million. The tax-equivalent yield on investments decreased by 2 basis points to 3.32% from a yield of 3.34% during the year ended December 31, 2015. This was caused by the Company decreasing the size of its investment portfolio in an effort to deploy excess cash into loans.
Securities available-for-sale are a part of the Company’s interest rate risk management strategy and may be sold in response to changes in interest rates, changes in prepayment risk, liquidity management and other factors. The Company continues to reposition the investment portfolio as part of an overall corporate-wide strategy to produce reasonable and consistent margins where feasible, while attempting to limit risks inherent in the Company’s balance sheet.
At December 31, 2016, the net unrealized gain carried as a component of accumulated other comprehensive income and included in stockholders’ equity, net of tax, amounted to $0.9 million as compared with a net unrealized gain of $0.6 million at December 31, 2015, resulting from changes in market conditions and interest rates at December 31, 2016. For additional information regarding the Company’s investment portfolio, see Note 4, Note 17 and Note 22 of the Notes to the Consolidated Financial Statements.
During 2016, securities sold from the Company’s available-for-sale portfolio amounted to $85.3 million, as compared with $65.2 million in 2015 and $80.4 million in 2014. The gross realized gains on securities sold, called or matured amounted to approximately $4.2 million in 2016, $3.9 million in 2015 and $2.8 million in 2014, while there were no gross realized losses in 2016 and 2015 and there were losses of $19 thousand in 2014. There were no impairment charges in 2016 or 2015 as compared to $740 thousand in 2014.
The table below illustrates the maturity distribution and weighted average yield on a tax-equivalent basis for investment securities at December 31, 2016, on a contractual maturity basis.
| Due in 1 year or less | Due after 1 year through 5 years | Due after 5 years through 10 years | Due after 10 years | Total | ||||||||||||||||||||||||||||||||||||||||
| Amortized Cost | Weighted Average Yield | Amortized Cost | Weighted Average Yield | Amortized Cost | Weighted Average Yield | Amortized Cost | Weighted Average Yield | Amortized Cost | Weighted Average Yield | Market Value | ||||||||||||||||||||||||||||||||||
| (dollars in thousands) | ||||||||||||||||||||||||||||||||||||||||||||
| Investment Securities Available-for-Sale | ||||||||||||||||||||||||||||||||||||||||||||
| Federal Agency Obligations | $ | - | - | % | $ | 3,324 | 1.79 | % | $ | 3,987 | 2.49 | % | $ | 45,515 | 2.43 | % | $ | 52,826 | 2.39 | % | $ | 52,837 | ||||||||||||||||||||||
| Residential Mortgage Pass-through Securities | - | - | 983 | 2.37 | 6,435 | 2.09 | 65,504 | 2.58 | 72,922 | 2.53 | 72,497 | |||||||||||||||||||||||||||||||||
| Commercial Mortgage Pass-through Securities | - | - | - | - | 4,186 | 2.40 | - | - | 4,186 | 2.40 | 4,209 | |||||||||||||||||||||||||||||||||
| Obligations of U.S. States and Political Subdivisions | 1,818 | 4.65 | 6,637 | 4.20 | 26,855 | 4.49 | 113,437 | 4.61 | 148,747 | 4.57 | 150,605 | |||||||||||||||||||||||||||||||||
| Trust Preferred | - | - | - | - | - | - | 5,575 | 5.33 | 5,575 | 5.33 | 5,666 | |||||||||||||||||||||||||||||||||
| Corporate Bonds and Notes | 2,797 | 2.86 | 21,607 | 2.79 | 12,313 | 3.70 | - | - | 36,717 | 3.10 | 36,928 | |||||||||||||||||||||||||||||||||
| Asset-backed Securities | 38 | 1.39 | - | - | 7,417 | 1.68 | 7,412 | 1.56 | 14,867 | 1.62 | 14,583 | |||||||||||||||||||||||||||||||||
| Certificates of Deposit | 350 | 1.92 | 477 | 2.38 | 146 | 1.94 | - | - | 973 | 2.15 | 983 | |||||||||||||||||||||||||||||||||
| Equity Securities | - | - | - | - | - | - | 376 | 0.48 | 376 | 0.48 | 568 | |||||||||||||||||||||||||||||||||
| Other Securities | - | - | - | - | - | - | 14,739 | 0.02 | 14,739 | 0.02 | 14,414 | |||||||||||||||||||||||||||||||||
| Total Investment Securities | $ | 5,003 | 3.43 | % | $ | 33,028 | 2.95 | % | $ | 61,339 | 3.46 | % | $ | 252,558 | 3.34 | % | $ | 351,928 | 3.33 | % | $ | 353,290 | ||||||||||||||||||||||
For information regarding the carrying value of the investment portfolio, see Note 4, Note 17 and Note 22 of the Notes to the Consolidated Financial Statements.
| - 38 - | ||
The securities listed in the table above are either rated investment grade by Moody’s and/or Standard and Poor’s or have shadow credit ratings from a credit agency supporting an investment grade and conform to the Company’s investment policy guidelines. There were no municipal securities, or corporate securities, of any single issuer exceeding 10% of stockholders’ equity at December 31, 2016. Equity securities and other securities do not have a contractual maturity and are included in the “Due after ten years” maturity in the table above.
The following table sets forth the carrying value of the Company’s investment securities, as of December 31 for each of the last three years.
| 2016 | 2015 | 2014 | ||||||||||
| (dollars in thousands) | ||||||||||||
| Investment Securities Available-for-Sale: | ||||||||||||
Federal agency obligations | $ | 52,837 | $ | 29,146 | $ | 32,817 | ||||||
| Residential mortgage pass-through securities | 72,497 | 44,910 | 60,356 | |||||||||
| Commercial mortgage pass-through securities | 4,209 | 2,972 | 3,046 | |||||||||
| Obligations of U.S. States and political subdivisions | 150,605 | 8,357 | 8,406 | |||||||||
| Trust preferred securities | 5,666 | 16,255 | 16,306 | |||||||||
| Corporate bonds and notes | 36,928 | 53,976 | 125,777 | |||||||||
| Asset-backed securities | 14,583 | 19,725 | 27,502 | |||||||||
| Certificates of deposit | 983 | 1,905 | 2,123 | |||||||||
| Equity securities | 568 | 374 | 307 | |||||||||
| Other securities | 14,414 | 18,150 | 12,892 | |||||||||
| Total | $ | 353,290 | $ | 195,770 | $ | 289,532 | ||||||
| Investment Securities Held-to-Maturity: | ||||||||||||
| U.S. treasury & agency securities | $ | - | $ | 28,471 | $ | 28,264 | ||||||
| Federal agency obligations | - | 33,616 | 27,103 | |||||||||
| Residential mortgage pass-through securities | - | 3,805 | 5,955 | |||||||||
| Commercial mortgage-backed securities | - | 4,110 | 4,266 | |||||||||
| Obligations of U.S. States and political subdivisions | - | 118,015 | 120,144 | |||||||||
| Corporate bonds and notes | - | 36,039 | 38,950 | |||||||||
| Total | $ | - | $ | 224,056 | $ | 224,682 | ||||||
| Total investment securities | $ | 353,290 | $ | 418,676 | $ | 514,214 | ||||||
For other information regarding the Company’s investment securities portfolio, see Note 4 and Note 22 of the Notes to the Consolidated Financial Statements.
Interest Rate Sensitivity Analysis
The principal objective of our asset and liability management function is to evaluate the interest-rate risk included in certain balance sheet accounts; determine the level of risk appropriate given our business focus, operating environment, and capital and liquidity requirements; establish prudent asset concentration guidelines; and manage the risk consistent with Board approved guidelines. We seek to reduce the vulnerability of our operations to changes in interest rates, and actions in this regard are taken under the guidance of the Bank’s Asset Liability Committee (the “ALCO”). The ALCO generally reviews our liquidity, cash flow needs, maturities of investments, deposits and borrowings, and current market conditions and interest rates.
We currently utilize net interest income simulation and economic value of equity (“EVE”) models to measure the potential impact to the Bank of future changes in interest rates. As of December 31, 2016 and December 31, 2015 the results of the models were within guidelines prescribed by our Board of Directors. If model results were to fall outside prescribed ranges, action, including additional monitoring and reporting to the Board, would be required by the ALCO and Bank’s management.
The net interest income simulation model attempts to measure the change in net interest income over the next one-year period, and over the next three-year period on a cumulative basis, assuming certain changes in the general level of interest rates.
Based on our model, which was run as of December 31, 2016, we estimated that over the next one-year period a 200 basis-point instantaneous increase in the general level of interest rates would increase our net interest income by 5.79%, while a 100 basis-point instantaneous decrease in interest rates would decrease net interest income by 2.93%. As of December 31, 2015, we estimated that over the next one-year period, a 200 basis-point instantaneous increase in the general level of interest rates would increase our net interest income by 5.65%, while a 100 basis-point instantaneous decrease in the general level of interest rates would decrease our net interest income by 3.62%.
Based on our model, which was run as of December 31, 2016, we estimated that over the next three years, on a cumulative basis, a 200 basis-point instantaneous increase in the general level of interest rates would increase our net interest income by 6.65%, while a 100 basis-point instantaneous decrease in interest rates would decrease net interest income by 4.43%. As of December 31, 2015, we estimated that over
| - 39 - | ||
the next three years, on a cumulative basis, a 200 basis-point instantaneous increase in the general level of interest rates would increase our net interest income by 6.66%, while a 100 basis-point instantaneous decrease in interest rates would decrease net interest income by 5.59%.
An EVE analysis is also used to dynamically model the present value of asset and liability cash flows with instantaneous rate shocks of up 200 basis points and down 100 basis points. The economic value of equity is likely to be different as interest rates change. Our EVE as of December 31, 2016, would decline by 7.97% with an instantaneous rate shock of up 200 basis points, and increase by 2.96% with an instantaneous rate shock of down 100 basis points. Our EVE as of December 31, 2015, would decline by 15.02% with an instantaneous rate shock of up 200 basis points, and increase by 13.65% with an instantaneous rate shock of down 100 basis points.
| Interest Rates | Estimated | Estimated Change in EVE |
Interest Rates | Estimated | Estimated Change in NII | ||||
| (basis points) | EVE | Amount | % | (basis points) | NII | Amount | % | ||
| +300 | $459,528 | $(69,110) | (13.1) | +300 | $143,818 | $11,115 | 8.4 | ||
| +200 | 486,530 | (42,108) | (8.0) | +200 | 140,388 | 7,685 | 5.8 | ||
| +100 | 510,733 | (17,905) | (3.4) | +100 | 136,676 | 3,973 | 3.0 | ||
| 0 | 528,638 | - | 0.0 | 0 | 132,703 | - | 0.0 | ||
| -100 | 544,300 | 15,662 | 3.0 | -100 | 128,199 | (3,884) | (2.9) | ||
Estimates of Fair Value
The estimation of fair value is significant to certain assets of the Company, including available-for-sale investment securities. These are all recorded at either fair value or the lower of cost or fair value. Fair values are volatile and may be influenced by a number of factors. Circumstances that could cause estimates of the fair value of certain assets and liabilities to change include a change in prepayment speeds, expected cash flows, credit quality, discount rates, or market interest rates. Fair values for most available-for-sale investment securities are based on quoted market prices. If quoted market prices are not available, fair values are based on judgments regarding future expected loss experience, current economic condition risk characteristics of various financial instruments, and other factors. See Note 22 of the Notes to Consolidated Financial Statements for additional discussion.
These estimates are subjective in nature, involve uncertainties and matters of significant judgment and therefore cannot be determined with precision. Changes in assumptions could significantly affect the estimates.
Impact of Inflation and Changing Prices
The financial statements and notes thereto presented elsewhere herein have been prepared in accordance with generally accepted accounting principles, which require the measurement of financial position and operating results in terms of historical dollars without considering the change in the relative purchasing power of money over time due to inflation. The impact of inflation is reflected in the increased cost of the operations; unlike most industrial companies, nearly all of the Company’s assets and liabilities are monetary. As a result, interest rates have a greater impact on performance than do the effects of general levels of inflation. Interest rates do not necessarily move in the same direction or to the same extent as the prices of goods and services.
Liquidity
Liquidity is a measure of a bank’s ability to fund loans, withdrawals or maturities of deposits, and other cash outflows in a cost-effective manner. Our principal sources of funds are deposits, scheduled amortization and prepayments of loan principal, maturities of investment securities, and funds provided by operations. While scheduled loan payments and maturing investments are relatively predictable sources of funds, deposit flow and loan prepayments are greatly influenced by general interest rates, economic conditions and competition.
At December 31, 2016, the amount of liquid assets remained at a level management deemed adequate to ensure that, on a short and long-term basis, contractual liabilities, depositors’ withdrawal requirements, and other operational and client credit needs could be satisfied. As of December 31, 2016, liquid assets (cash and due from banks, interest-bearing deposits with banks and unencumbered investment securities) were $428.2 million, which represented 9.7% of total assets and 11.2% of total deposits and borrowings, compared to $466.8 million at December 31, 2015, which represented 11.6% of total assets and 13.5% of total deposits and borrowings on such date.
| - 40 - | ||
The Bank is a member of the Federal Home Loan Bank of New York and, based on available qualified collateral as of December 31, 2016, had the ability to borrow $1.3 billion. In addition, at December 31, 2016, the Bank had in place borrowing capacity of $25 million through correspondent banks. The Bank also has a credit facility established with the Federal Reserve Bank of New York for direct discount window borrowings with capacity based on pledged collateral of $12.6 million. At December 31, 2016, the Bank had aggregate available and unused credit of approximately $781 million, which represents the aforementioned facilities totaling $1.3 billion net of $521 million in outstanding borrowings and letters of credit. At December 31, 2016, outstanding commitments for the Bank to extend credit were $603 million.
Cash and cash equivalents totaled $200.4 million on December 31, 2016, decreasing by $0.5 million from $200.9 million at December 31, 2015. Operating activities provided $49.7 million in net cash. Investing activities used $427.7 million in net cash, primarily reflecting an increase in loans, which was offset in part by cash flow from the securities portfolio. Financing activities provided $377.5 million in net cash, primarily reflecting a net increase of $553.5 million in deposits and proceeds from the issuance of common stock of $38.4 million offset by a net decrease of $195.0 million in borrowings (consisting of $375.0 million in new borrowings offset by notional repayments of $570.0 million) and the redemption of $11.3 million of preferred stock associated with the Small Business Lending Fund.
Deposits
Deposits are our primary source of funds. Average total deposits increased $523.4 million, or 20.4% to $3.1 billion in 2016 from $2.6 billion in 2015 and increased $673.3 million, or 35.5% to $2.6 billion in 2015 from 2014. Growth in 2014 was partially due to the merger. During 2016 we saw substantial increases in demand accounts, money market accounts and time deposits. This was due to several promotional items as well as increased efforts to attract new customers.
The following table sets forth the year-to-date average balances and weighted average rates for various types of deposits for 2016, 2015 and 2014.
| 2016 | 2015 | 2014 | ||||||||||||||||
| Balance | Rate | Balance | Rate | Balance | Rate | |||||||||||||
| (dollars in thousands) | ||||||||||||||||||
| Demand, noninterest-bearing | $ | 624,731 | -- | $ | 537,287 | -- | $ | 350,310 | -- | |||||||||
| Demand, interest-bearing & NOW | 530,169 | 0.33% | 450,359 | 0.36% | 339,707 | 0.43% | ||||||||||||
| Money market accounts | 802,839 | 0.54% | 609,797 | 0.45% | 584,586 | 0.41% | ||||||||||||
| Savings | 211,830 | 0.29% | 219,507 | 0.28% | 196,855 | 0.16% | ||||||||||||
| Time | 923,114 | 1.29% | 752,380 | 1.17% | 424,603 | 1.13% | ||||||||||||
| Total Deposits | $ | 3,092,683 | 0.60% | $ | 2,569,330 | 0.54% | $ | 1,896,061 | 0.47% | |||||||||
The following table sets forth the distribution of total deposit accounts, by account types for each of the periods indicated.
| December 31, 2016 | December 31, 2015 | |||||||||||
| Amount | % of total | Amount | % of total | |||||||||
| (dollars in thousands) | ||||||||||||
| Demand, noninterest-bearing | $ | 694,977 | 20.78% | $ | 650,775 | 23.32% | ||||||
| Demand, interest-bearing & NOW | 563,740 | 16.86% | 490,380 | 17.57% | ||||||||
| Money market accounts | 911,867 | 27.27% | 658,695 | 23.60% | ||||||||
| Savings | 205,551 | 6.15% | 216,399 | 7.75% | ||||||||
| Time | 968,136 | 28.94% | 774,717 | 27.76% | ||||||||
| Total Deposits | $ | 3,344,271 | 100.00% | $ | 2,790,966 | 100.00% | ||||||
| - 41 - | ||
The following table summarizes the maturity distribution of time deposits in denomination of $100,000 or more:
| (dollars in thousands) | December 31, 2016 | December 31, 2015 | ||||||
| 3 months or less | $ | 107,350 | $ | 60,950 | ||||
| Over 3 to 6 months | 72,972 | 55,690 | ||||||
| Over 6 to 12 months | 158,890 | 118,576 | ||||||
| Over 12 months | 228,201 | 164,278 | ||||||
| Total | $ | 567,413 | $ | 399,494 | ||||
Borrowings
Borrowings consist of long and short term advances from the Federal Home Loan Bank and securities sold under agreements to repurchase. Federal Home Loan Bank advances are secured, under the terms of a blanket collateral agreement, primarily by commercial mortgage loans. As of December 31, 2016, the Company had $476.3 million in notes outstanding at a weighted average interest rate of 1.69%. As of December 31, 2015, the Company had $671.6 million in notes outstanding at a weighted average interest rate of 1.37%.
Contractual Obligations and Other Commitments
The following table summarizes contractual obligations at December 31, 2016 and the effect such obligations are expected to have on liquidity and cash flows in future periods.
| Total | Less than 1 year |
1 – 3 years | 4 – 5 years | Over 5 years |
||||||||||||
| December 31, 2016 | (dollars in thousands) | |||||||||||||||
| Contractual obligations: | ||||||||||||||||
| Operating lease obligations | $ | 16,099 | $ | 2,149 | $ | 4,134 | $ | 3,416 | $ | 6,400 | ||||||
| Other long-term liabilities/long-term debt: | ||||||||||||||||
| Time Deposits | 968,136 | 534,946 | 406,590 | 26,600 | - | |||||||||||
| Federal Home Loan Bank advances and repurchase agreements | 476,280 | 246,280 | 165,000 | 65,000 | - | |||||||||||
| Capital lease | 2,763 | 292 | 615 | 642 | 1,214 | |||||||||||
| Subordinated debentures | 54,534 | - | - | - | 54,534 | |||||||||||
| Total other long-term liabilities/long-term debt | 1,501,713 | 781,518 | 572,205 | 92,242 | 55,748 | |||||||||||
| Other commercial commitments – off balance sheet: | ||||||||||||||||
| Commitments under commercial loans and lines of credit | 267,865 | 221,148 | 29,177 | 10,914 | 6,626 | |||||||||||
| Home equity and other revolving lines of credit | 52,788 | 26,428 | 5,157 | 14,477 | 6,726 | |||||||||||
| Outstanding commercial mortgage loan commitments | 263,395 | 254,755 | 8,640 | - | - | |||||||||||
| Standby letters of credit | 18,331 | 18,051 | 280 | - | - | |||||||||||
| Overdraft protection lines | 733 | 384 | 12 | - | 337 | |||||||||||
| Total off balance sheet arrangements and contractual obligations | 603,112 | 520,766 | 43,266 | 25,391 | 13,689 | |||||||||||
| Total contractual obligations and other commitments | $ | 2,120,924 | $ | 1,304,433 | $ | 619,605 | $ | 121,049 | $ | 75,837 | ||||||
| - 42 - | ||
Capital
The maintenance of a solid capital foundation continues to be a primary goal for the Company. Accordingly, capital plans and dividend policies are monitored on an ongoing basis. The most important objective of the capital planning process is to balance effectively the retention of capital to support future growth and the goal of providing stockholders with an attractive long-term return on their investment.
The Company’s Tier 1 leverage capital (defined as tangible stockholders’ equity for common stock and Trust Preferred Capital Securities) at December 31, 2016 amounted to $390.2 million or 9.3% of average total assets. At December 31, 2015, the Company’s Tier 1 leverage capital amounted to $339.5 million or 9.1% of average total assets. The increase in Tier 1 capital reflects the Company’s retained earnings during 2016 as well as its issuance of 1,659,794 shares of common stock at a price of $24.25 per share for net proceeds of $38.4 million. Tier 1 capital excludes the effect of FASB ASC 320-10-05, which amounted to $0.9 million of net unrealized gains, after tax, on securities available-for-sale at December 31, 2016 (and would be reported as a component of accumulated other comprehensive income which is included in stockholders’ equity), and is reduced by goodwill and intangible assets, which amounted to $149.0 million as of December 31, 2016. For information on goodwill and intangible assets, see Note 1 to the Consolidated Financial Statements.
United States bank regulators have issued guidelines establishing minimum capital standards related to the level of assets and off balance-sheet exposures adjusted for credit risk. Specifically, these guidelines categorize assets and off balance-sheet items into four risk-weightings and require banking institutions to maintain a minimum ratio of capital to risk-weighted assets. At December 31, 2016, the Company’s CET 1, Tier 1 and total risk-based capital ratios were 9.7%, 9.9% and 11.8%, respectively. For information on risk-based capital and regulatory guidelines for the Parent Corporation and its bank subsidiary, see Note 16 to the Consolidated Financial Statements.
The foregoing capital ratios are based in part on specific quantitative measures of assets, liabilities and certain off-balance sheet items as calculated under regulatory accounting practices. Capital amounts and classifications are also subject to qualitative judgments by the bank regulators regarding capital components, risk weightings, and other factors.
Subordinated Debentures
During December 2003, Center Bancorp Statutory Trust II, a statutory business trust and wholly-owned subsidiary of the Parent Corporation issued $5.0 million of MMCapS capital securities to investors due on January 23, 2034. The trust loaned the proceeds of this offering to the Company and received in exchange $5.2 million of the Parent Corporation’s subordinated debentures. The subordinated debentures are redeemable in whole or part. The floating interest rate on the subordinated debentures is three-month LIBOR plus 2.85% and re-prices quarterly. The rate at December 31, 2016 was 3.74%.
During June 2015, the Parent Corporation issued $50 million in aggregate principal amount of fixed-to-floating rate subordinated notes (the “Notes”) to certain institutional accredited investors. The net proceeds from the sale of the Notes were used in the first quarter of 2016 to redeem $11.3 million in the Company’s outstanding. Senior Noncumulative Perpetual Preferred Stock issued to the U.S. Treasury under the Small Business Lending Fund Program, and for general corporate purposes, which included the Parent Corporation contributing $35 million of the net proceeds to the Bank in the form of common equity. The Notes are non-callable for five years, have a stated maturity of July 1, 2025, and bear interest at a fixed rate of 5.75% per year, from and including June 30, 2015 to, but excluding July 1, 2020. From and including July 1, 2020 to the maturity date or early redemption date, the interest rate will reset quarterly to a level equal to the then current three-month LIBOR rate plus 393 basis points.
| - 43 - | ||
Item 7A. Quantitative and Qualitative Disclosures about Market Risk
Interest Sensitivity
Market Risk
Interest rate risk management is our primary market risk. See "Item 7- Management's Discussion and Analysis of Financial Condition and Results of Operation- Interest Rate Sensitivity Analysis" herein for a discussion of our management of our interest rate risk.
Item 8. Financial Statements and Supplementary Data
All Financial Statements:
The following financial statements are filed as part of this report under Item 8 - “Financial Statements and Supplementary Data.”
| - 44 - | ||
REPORT OF INDEPENDENT REGISTERED PUBLIC ACCOUNTING FIRM
The Board of Directors and Stockholders of
ConnectOne Bancorp, Inc. and Subsidiaries
Englewood Cliffs, New Jersey
We have audited the accompanying consolidated statements of financial condition of ConnectOne Bancorp, Inc. and Subsidiaries (the “Company”) as of December 31, 2016 and 2015, and the related consolidated statements of income, comprehensive income, changes in stockholders' equity, and cash flows for each of the years in the three-year period ended December 31, 2016. We also have audited The Company’s internal control over financial reporting as of December 31, 2016, based on criteria established in the 2013 Internal Control – Integrated Framework issued by the Committee of Sponsoring Organizations of the Treadway Commission. The Company’s management is responsible for these consolidated financial statements, for maintaining effective internal control over financial reporting, and for its assessment of the effectiveness of internal control over financial reporting, included in the accompanying Management’s Report on Internal Control over Financial Reporting as disclosed in Item 9A. Our responsibility is to express an opinion on these consolidated financial statements and an opinion on the Company's internal control over financial reporting based on our audits.
We conducted our audits in accordance with the standards of the Public Company Accounting Oversight Board (United States). Those standards require that we plan and perform the audits to obtain reasonable assurance about whether the consolidated financial statements are free of material misstatement and whether effective internal control over financial reporting was maintained in all material respects. Our audits of the consolidated financial statements included examining, on a test basis, evidence supporting the amounts and disclosures in the financial statements, assessing the accounting principles used and significant estimates made by management, and evaluating the overall financial statement presentation. Our audit of internal control over financial reporting included obtaining an understanding of internal control over financial reporting, assessing the risk that a material weakness exists, and testing and evaluating the design and operating effectiveness of internal control based on the assessed risk. Our audits also included performing such other procedures as we considered necessary in the circumstances. We believe that our audits provide a reasonable basis for our opinions.
A company's internal control over financial reporting is a process designed to provide reasonable assurance regarding the reliability of financial reporting and the preparation of financial statements for external purposes in accordance with generally accepted accounting principles. A company's internal control over financial reporting includes those policies and procedures that (1) pertain to the maintenance of records that, in reasonable detail, accurately and fairly reflect the transactions and dispositions of the assets of the company; (2) provide reasonable assurance that transactions are recorded as necessary to permit preparation of financial statements in accordance with generally accepted accounting principles, and that receipts and expenditures of the company are being made only in accordance with authorizations of management and directors of the company; and (3) provide reasonable assurance regarding prevention or timely detection of unauthorized acquisition, use, or disposition of the company's assets that could have a material effect on the financial statements.
Because of its inherent limitations, internal control over financial reporting may not prevent or detect misstatements. Also, projections of any evaluation of effectiveness to future periods are subject to the risk that controls may become inadequate because of changes in conditions, or that the degree of compliance with the policies or procedures may deteriorate.
In our opinion, the consolidated financial statements referred to above present fairly, in all material respects, the financial position of ConnectOne Bancorp, Inc. and Subsidiaries as of December 31, 2016 and 2015, and the results of their operations and their cash flows for each of the years in the three-year period ended December 31, 2016, in conformity with accounting principles generally accepted in the United States of America. Also in our opinion, The Company maintained, in all material respects, effective internal control over financial reporting as of December 31, 2016, based on criteria established in the 2013 Internal Control – Integrated Framework issued by the Committee of Sponsoring Organizations of the Treadway Commission.
/s/ Crowe Horwath LLP
Crowe Horwath LLP
New York, New York
March 10, 2017
| - 45 - | ||
CONNECTONE BANCORP, INC. AND SUBSIDIARIES
CONSOLIDATED STATEMENTS OF FINANCIAL CONDITION
| December 31, | ||||||||
| 2016 | 2015 | |||||||
| (in thousands, except for share and per share data) | ||||||||
| ASSETS | ||||||||
| Cash and due from banks | $ | 37,150 | $ | 31,291 | ||||
| Interest-bearing deposits with banks | 163,249 | 169,604 | ||||||
| Cash and due from banks | 200,399 | 200,895 | ||||||
| Investment securities: | ||||||||
| Securities available-for-sale | 353,290 | 195,770 | ||||||
| Securities held-to-maturity (fair value of $ - and $231,445) | - | 224,056 | ||||||
| Loans held-for-sale | 78,005 | - | ||||||
| Loans receivable | 3,475,832 | 3,099,007 | ||||||
| Less: Allowance for loan and lease losses | 25,744 | 26,572 | ||||||
| Net loans receivable | 3,450,088 | 3,072,435 | ||||||
| Investment in restricted stock, at cost | 24,310 | 32,612 | ||||||
| Bank premises and equipment, net | 22,075 | 22,333 | ||||||
| Accrued interest receivable | 12,965 | 12,545 | ||||||
| Bank owned life insurance | 98,359 | 78,801 | ||||||
| Other real estate owned | 626 | 2,549 | ||||||
| Goodwill | 145,909 | 145,909 | ||||||
| Core deposit intangibles | 3,088 | 3,908 | ||||||
| Other assets | 37,234 | 24,096 | ||||||
| Total assets | $ | 4,426,348 | $ | 4,015,909 | ||||
| LIABILITIES | ||||||||
| Deposits: | ||||||||
| Noninterest-bearing | $ | 694,977 | $ | 650,775 | ||||
| Interest-bearing | 2,649,294 | 2,140,191 | ||||||
| Total deposits | 3,344,271 | 2,790,966 | ||||||
| Borrowings | 476,280 | 671,587 | ||||||
| Subordinated debentures | 54,534 | 54,343 | ||||||
| Accounts payable and accrued liabilities | 20,231 | 21,669 | ||||||
| Total liabilities | 3,895,316 | 3,538,565 | ||||||
COMMITMENTS AND CONTINGENCIES STOCKHOLDERS’ EQUITY | ||||||||
| Preferred Stock, $1,000 liquidation value per share: | ||||||||
| Authorized 5,000,000 shares; issued and outstanding 11,250 shares of Series B preferred stock at December 31, 2015; total liquidation value of $11,250 at December 31, 2015 | - | 11,250 | ||||||
| Common stock, no par value: | ||||||||
| Authorized 50,000,000 shares; issued 34,018,731 shares at December 31, 2016 and 32,149,585 shares at December 31, 2015; outstanding 31,948,307 shares at December 31, 2016 and 30,082,065 at December 31, 2015 | 412,726 | 374,287 | ||||||
| Additional paid-in capital | 11,407 | 8,527 | ||||||
| Retained earnings | 126,462 | 104,606 | ||||||
| Treasury stock, at cost (2,063,922 shares at December 31, 2016 and December 31, 2015) | (16,717) | (16,717) | ||||||
| Accumulated other comprehensive loss | (2,846) | (4,609) | ||||||
| Total stockholders’ equity | 531,032 | 477,344 | ||||||
| Total liabilities and stockholders’ equity | $ | 4,426,348 | $ | 4,015,909 | ||||
See the accompanying notes to the consolidated financial statements.
| - 46 - | ||
CONNECTONE BANCORP, INC. AND SUBSIDIARIES
CONSOLIDATED STATEMENTS OF INCOME
| Years Ended December 31, | ||||||||||||
| 2016 | 2015 | 2014 | ||||||||||
| (in thousands, except for share and per share data) | ||||||||||||
| Interest income: | ||||||||||||
| Interest and fees on loans | $ | 147,982 | $ | 125,493 | $ | 77,669 | ||||||
| Interest and dividends on investment securities: | ||||||||||||
| Taxable | 7,266 | 10,665 | 12,024 | |||||||||
| Nontaxable | 3,827 | 3,550 | 3,740 | |||||||||
| Dividends | 1,410 | 1,081 | 636 | |||||||||
| Interest on federal funds sold and other short-term investment | 756 | 178 | 138 | |||||||||
| Total interest income | 161,241 | 140,967 | 94,207 | |||||||||
| Interest expense: | ||||||||||||
| Deposits | 18,667 | 13,756 | 8,260 | |||||||||
| Borrowings | 12,429 | 10,058 | 6,548 | |||||||||
| Total interest expense | 31,096 | 23,814 | 14,808 | |||||||||
| Net interest income | 130,145 | 117,153 | 79,399 | |||||||||
| Provision for loan and lease losses | 38,700 | 12,605 | 4,683 | |||||||||
| Net interest income after provision for loan and lease losses | 91,445 | 104,548 | 74,716 | |||||||||
| Noninterest income: | ||||||||||||
| Annuity and insurance commissions | 191 | 242 | 382 | |||||||||
| Income on bank owned life insurance | 2,559 | 1,782 | 1,303 | |||||||||
| Net gains on sale of loans held-for-sale | 232 | 327 | 182 | |||||||||
| Deposit, loan and other income | 2,704 | 2,667 | 2,813 | |||||||||
| Insurance recovery | - | 2,224 | - | |||||||||
| Net gains on sale of investment securities | 4,234 | 3,931 | 2,818 | |||||||||
| Total noninterest income | 9,920 | 11,173 | 7,498 | |||||||||
| Noninterest expense: | ||||||||||||
| Salaries and employee benefits | 31,030 | 27,685 | 18,829 | |||||||||
| Occupancy and equipment | 8,571 | 7,587 | 5,312 | |||||||||
| FDIC Insurance | 2,940 | 2,110 | 1,618 | |||||||||
| Professional and consulting | 2,979 | 2,951 | 1,661 | |||||||||
| Marketing and advertising | 1,040 | 847 | 498 | |||||||||
| Data processing | 4,141 | 3,703 | 2,575 | |||||||||
| Merger-related expenses | - | - | 12,388 | |||||||||
| Loss on extinguishment of debt | - | 2,397 | 4,550 | |||||||||
| Amortization of core deposit intangible | 820 | 917 | 506 | |||||||||
| Charge due to wire fraud | - | - | 2,374 | |||||||||
| Other expenses | 6,986 | 6,287 | 4,493 | |||||||||
| Total noninterest expenses | 58,507 | 54,484 | 54,804 | |||||||||
| Income before income tax expense | 42,858 | 61,237 | 27,410 | |||||||||
| Income tax expense | 11,776 | 19,926 | 8,845 | |||||||||
| Net income | 31,082 | 41,311 | 18,565 | |||||||||
| Less: Preferred stock dividends | 22 | 112 | 112 | |||||||||
| Net income available to common stockholders | $ | 31,060 | $ | 41,199 | $ | 18,453 | ||||||
| Earnings per common share: | ||||||||||||
| Basic | $ | 1.02 | $ | 1.37 | $ | 0.80 | ||||||
| Diluted | 1.01 | 1.36 | 0.79 | |||||||||
| Dividends per common share | $ | 0.300 | $ | 0.300 | $ | 0.300 | ||||||
See the accompanying notes to the consolidated financial statements.
| - 47 - | ||
CONNECTONE BANCORP, INC. AND SUBSIDIARIES
CONSOLIDATED STATEMENTS OF COMPREHENSIVE INCOME
| Years Ended December 31, | ||||||||||||
| 2016 | 2015 | 2014 | ||||||||||
| (in thousands) | ||||||||||||
| Net income | $ | 31,082 | $ | 41,311 | $ | 18,565 | ||||||
| Other comprehensive income: | ||||||||||||
| Unrealized gains and losses: | ||||||||||||
| Unrealized holding (losses) gains on available-for-sale securities arising during the period | (5,624) | (2,991) | 6,966 | |||||||||
| Tax effect | 2,142 | 1,196 | (2,635) | |||||||||
| Net of tax | (3,482) | (1,795) | 4,331 | |||||||||
| Unrealized gains on securities transferred from held-to-maturity to available-for-sale the period | 10,069 | - | - | |||||||||
| Tax effect | (3,815) | - | - | |||||||||
| Net of tax | 6,254 | - | - | |||||||||
| Reclassification adjustment for realized gains included in net income | (4,234) | (3,931) | (2,818) | |||||||||
| Tax effect | 1,682 | 1,564 | 986 | |||||||||
| Net of tax | (2,552) | (2,367) | (1,832) | |||||||||
| Amortization of unrealized net losses on held-to-maturity securities transferred from available-for-sale securities | 1,986 | 220 | 215 | |||||||||
| Tax effect | (813) | (90) | (91) | |||||||||
| Net of tax | 1,173 | 130 | 124 | |||||||||
| Unrealized gains (losses) on cash flow hedges | 219 | (179) | 48 | |||||||||
| Tax effect | (90) | 73 | (20) | |||||||||
| Net of tax | 129 | (106) | 28 | |||||||||
| Unrealized pension plan gains and (losses): | ||||||||||||
| Unrealized pension plan gains (losses) before reclassifications | (2) | 485 | (2,119) | |||||||||
| Tax effect | 1 | (198) | 866 | |||||||||
| Net of tax | (1) | 287 | (1,253) | |||||||||
| Reclassification adjustment for realized losses included in net income | 407 | 433 | 223 | |||||||||
| Tax effect | (165) | (177) | (91) | |||||||||
| Net of tax | 242 | 256 | 132 | |||||||||
| Total other comprehensive income (loss) | 1,763 | (3,595) | 1,530 | |||||||||
| Total comprehensive income | $ | 32,845 | $ | 37,716 | $ | 20,095 | ||||||
See the accompanying notes to the consolidated financial statements.
| - 48 - | ||
CONNECTONE BANCORP, INC. AND SUBSIDIARIES
CONSOLIDATED STATEMENTS OF CHANGES IN STOCKHOLDERS’ EQUITY
| Preferred Stock | Common Stock | Additional Paid In Capital | Retained Earnings | Treasury Stock | Accumulated Other Comprehensive Income (Loss) | Total Stockholders’ Equity | ||||||||||||||||||||||
| (in thousands, except for share and per share data) | ||||||||||||||||||||||||||||
| Balance as of December 31, 2013 | $ | 11,250 | $ | 110,056 | $ | 4,986 | $ | 61,914 | $ | (17,078) | $ | (2,544) | $ | 168,584 | ||||||||||||||
| Net income | - | - | - | 18,565 | - | - | 18,565 | |||||||||||||||||||||
| Other comprehensive income, net of taxes | - | - | - | - | - | 1,530 | 1,530 | |||||||||||||||||||||
| Dividends on series B preferred stock | - | - | - | (112) | - | - | (112) | |||||||||||||||||||||
| Cash dividends declared on common stock ($0.300 per share) | - | - | - | (7,962) | - | - | (7,962) | |||||||||||||||||||||
| Issuance cost of common stock | - | - | - | (7) | - | - | (7) | |||||||||||||||||||||
| Exercise of 100,911 stock options (including tax benefits of $282) | - | - | 806 | - | 361 | - | 1,167 | |||||||||||||||||||||
| Stock-based compensation expense | - | - | 223 | - | - | - | 223 | |||||||||||||||||||||
| Stock issued in acquisition of legacy ConnectOne Bancorp, Inc. (13,221,152 shares) | - | 264,231 | - | - | - | - | 264,231 | |||||||||||||||||||||
| Balance as of December 31, 2014 | $ | 11,250 | $ | 374,287 | $ | 6,015 | $ | 72,398 | $ | (16,717) | $ | (1,014) | $ | 446,219 | ||||||||||||||
| Net income | - | - | - | 41,311 | - | - | 41,311 | |||||||||||||||||||||
| Other comprehensive loss, net of taxes | - | - | - | - | (3,595) | (3,595) | ||||||||||||||||||||||
| Dividends on series B preferred stock | - | - | - | (112) | - | - | (112) | |||||||||||||||||||||
| Cash dividends declared on common stock ($0.300 per share) | - | - | - | (8,991) | - | - | (8,991) | |||||||||||||||||||||
| Exercise of 340,492 stock options | - | - | 1,765 | - | - | - | 1,765 | |||||||||||||||||||||
| Restricted stock, net of forfeitures (69,258 shares) | - | - | - | - | - | - | - | |||||||||||||||||||||
| Stock-based compensation expense | - | - | 747 | - | - | - | 747 | |||||||||||||||||||||
| Balance as of December 31, 2015 | $ | 11,250 | $ | 374,287 | $ | 8,527 | $ | 104,606 | $ | (16,717) | $ | (4,609) | $ | 477,344 | ||||||||||||||
| Net income | - | - | - | 31,082 | - | - | 31,082 | |||||||||||||||||||||
| Other comprehensive income, net of taxes | - | - | - | - | - | 1,763 | 1,763 | |||||||||||||||||||||
| Dividends on series B preferred stock | - | - | - | (22) | - | - | (22) | |||||||||||||||||||||
| Cash dividends declared on common stock ($0.300 per share) | - | - | - | (9,204) | - | - | (9,204) | |||||||||||||||||||||
| Redemption of preferred stock | (11,250) | - | - | - | - | - | (11,250) | |||||||||||||||||||||
| Exercise of stock options (136,429 shares) | - | - | 767 | - | - | - | 767 | |||||||||||||||||||||
| Secondary offering of common stock, net of costs of $1,811 (1,659,794 shares) | - | 38,439 | - | - | - | - | 38,439 | |||||||||||||||||||||
| Restricted stock, net of forfeitures (70,019 shares) | - | - | - | - | - | - | - | |||||||||||||||||||||
| Stock-based compensation expense | - | - | 2,113 | - | - | - | 2,113 | |||||||||||||||||||||
| Balance as of December 31, 2016 | $ | - | $ | 412,726 | $ | 11,407 | $ | 126,462 | $ | (16,717) | $ | (2,846) | $ | 531,032 | ||||||||||||||
See the accompanying notes to the consolidated financial statements.
| - 49 - | ||
CONNECTONE BANCORP, INC. AND SUBSIDIARIES
CONSOLIDATED STATEMENTS OF CASH FLOWS
| Years Ended December 31, | ||||||||||
| (dollars in thousands) | 2016 | 2015 | 2014 | |||||||
| Cash flows from operating activities | ||||||||||
| Net income | $ | 31,082 | $ | 41,311 | $ | 18,565 | ||||
| Adjustments to reconcile net income to net cash provided by operating activities: | ||||||||||
| Depreciation and amortization of premises and equipment | 2,704 | 2,309 | 1,539 | |||||||
| Provision for loan and lease losses | 38,700 | 12,605 | 4,683 | |||||||
| Amortization of intangibles | 820 | 917 | 506 | |||||||
| Net accretion of loans | (4,280) | (5,052) | (4,328) | |||||||
| Accretion on bank premises | (132) | (108) | (51) | |||||||
| Accretion on deposits | (172) | (470) | (701) | |||||||
| Accretion on borrowings | (307) | (441) | (296) | |||||||
| Net deferred income tax expense (benefit) | 1,969 | (3,493) | 184 | |||||||
| Stock-based compensation | 2,113 | 747 | 223 | |||||||
| Gains on sales of investment securities, net | (4,234) | (3,931) | (2,818) | |||||||
| Gains on sale of loans held-for-sale, net | (232) | (327) | (182) | |||||||
| Loans originated for resale | (10,004) | (20,834) | (10,994) | |||||||
| Proceeds from sale of loans held-for-sale | 10,048 | 21,161 | 11,366 | |||||||
| Net gains on disposition of premises and equipment | (57) | - | - | |||||||
| Net (gain) loss on sale of other real estate owned | (182) | 164 | 23 | |||||||
| Increase in cash surrender value of bank owned life insurance | (2,559) | (1,782) | (1,303) | |||||||
| Loss on extinguishment of debt | - | 2,397 | 4,550 | |||||||
| Amortization of premiums and accretion of discounts on investments securities, net | 1,692 | 1,793 | 2,074 | |||||||
| Increase in accrued interest receivable | (420) | (845) | (428) | |||||||
| (Increase) decrease in other assets | (14,815) | 1,190 | 2,200 | |||||||
| (Decrease) increase in other liabilities | (2,022) | (1,080) | 377 | |||||||
| Net cash provided by operating activities | 49,712 | 46,231 | 25,189 | |||||||
| Cash flows from investing activities | ||||||||||
| Investment securities available-for-sale: | ||||||||||
| Purchases | (165,527) | (37,403) | (37,886) | |||||||
| Sales | 85,253 | 65,231 | 80,449 | |||||||
| Maturities, calls and principal repayments | 137,587 | 62,007 | 33,496 | |||||||
| Investment securities held-to-maturity: | ||||||||||
| Purchases | (1,000) | (17,531) | (20,860) | |||||||
| Maturities and principal repayments | 14,757 | 17,520 | 10,766 | |||||||
| Net redemptions (purchases) of restricted investment in bank stocks | 8,302 | (9,077) | (903) | |||||||
| Net increase in loans | (490,777) | (557,881) | (274,942) | |||||||
| Purchases of premises and equipment | (2,702) | (3,881) | (1,986) | |||||||
| Purchases of bank owned life insurance | (16,999) | (24,501) | - | |||||||
| Proceeds from sale of premises and equipment | 445 | - | - | |||||||
| Proceeds from sale of other real estate owned | 2,992 | 769 | 1,544 | |||||||
| Cash acquired in acquisition | - | - | 70,318 | |||||||
| Net cash used in investing activities | (427,669) | (504,747) | (140,004 | ) | ||||||
| Cash flows from financing activities | ||||||||||
| Net increase in deposits | 553,477 | 315,829 | 82,961 | |||||||
| Increase in subordinated debt | - | 50,000 | - | |||||||
| Advances of FHLB borrowings | 375,000 | 848,875 | 161,183 | |||||||
| Repayments of FHLB borrowings | (570,000) | (656,400) | (79,254) | |||||||
| Repayment of repurchase agreement | - | (18,397) | - | |||||||
| Cash dividends paid on common stock | (9,067) | (8,996) | (6,940) | |||||||
| Cash dividends paid on preferred stock | (22) | (112) | (140) | |||||||
| Redemption of preferred stock | (11,250) | - | - | |||||||
| Secondary offering and issuance of common stock | 38,439 | - | - | |||||||
| Tax benefit of options exercised | 117 | 341 | 282 | |||||||
| Proceeds from exercise of stock options | 767 | 1,424 | 878 | |||||||
| Net cash provided by financing activities | 377,461 | 532,564 | 158,970 | |||||||
| Net change in cash and cash equivalents | (496) | 74,048 | 44,155 | |||||||
| Cash and cash equivalents at beginning of period | 200,895 | 126,847 | 82,692 | |||||||
| Cash and cash equivalents at end of period | $ | 200,399 | $ | 200,895 | $ | 126,847 | ||||
(continued)
| - 50 - | ||
| Cash payments for: | ||||||||||
| Interest paid | $ | 30,862 | $ | 23,357 | $ | 14,785 | ||||
| Income taxes paid | 22,945 | 17,880 | 4,993 | |||||||
| Supplemental noncash disclosures: | ||||||||||
| Investing: | ||||||||||
| Transfer of loans to other real estate owned |
|
$ | 887 | $ | 2,374 | $ | 352 | |||
| Transfer of loans to loans held-for-sale | 77,817 | - | - | |||||||
| Transfer from investment securities held-to-maturity to investment securities available-for-sale |
209,855 | - | - | |||||||
| Financing: | ||||||||||
| Business Combinations: | ||||||||||
| Noncash assets acquired: | ||||||||||
| Investment securities | $ | - | $ | - | $ | 28,452 | ||||
| Restricted investments | - | - | 13,646 | |||||||
| Loans held-for-sale | - | - | 190 | |||||||
| Loans | - | - | 1,299,284 | |||||||
| Accrued interest receivable | - | - | 4,470 | |||||||
| Premises and equipment, net | - | - | 6,475 | |||||||
| Goodwill | - | - | 129,105 | |||||||
| Core deposit intangible | - | - | 5,308 | |||||||
| Bank owned life insurance | - | - | 15,481 | |||||||
| Other real estate owned | - | - | 2,455 | |||||||
| Other assets | - | - | 14,286 | |||||||
| Total noncash assets acquired | $ | - | $ | - | $ | 1,519,152 | ||||
| Noncash liabilities assumed: | ||||||||||
| Deposits | $ | - | $ | - | $ | 1,051,342 | ||||
| Borrowings | - | - | 263,370 | |||||||
| Other liabilities | - | - | 10,527 | |||||||
| Total noncash liabilities assumed | $ | - | $ | - | $ | 1,325,239 | ||||
| Net noncash assets acquired | $ | - | $ | - | $ | 193,913 | ||||
| Bargain gain on acquisition | $ | - | $ | - | $ | - | ||||
| Net cash and cash equivalents acquired | $ | - | $ | - | $ | 70,318 |
See the accompanying notes to the consolidated financial statements.
| - 51 - | ||
CONNECTONE BANCORP, INC. AND SUBSIDIARIES
NOTES TO CONSOLIDATED FINANCIAL STATEMENTS
Note 1 - Summary of Significant Accounting Policies
Business
ConnectOne Bancorp, Inc. (the “Parent Corporation”) is incorporated under the laws of State of New Jersey and is a registered bank holding company. The Parent Corporation’s business currently consists of the operation of its wholly-owned subsidiary, ConnectOne Bank (the “Bank” and, collectively with the Parent Corporation and the Parent Corporation’s subsidiaries, the “Company”). The Bank’s subsidiaries include Union Investment Company, Inc. (a New Jersey investment company), Twin Bridge Investments, LLC (a Delaware investment company), ConnectOne Preferred Funding Corp. (a New Jersey real estate investment trust), Center Financial Group, LLC (a New Jersey financial services company), Center Advertising, Inc. (a New Jersey advertising company), Morris Property Company, LLC, (a New Jersey real estate company), Volosin Holdings, LLC, (a New Jersey real estate company), and NJCB Spec-1, LLC (a New Jersey real estate company).
The Bank is a community-based, full-service New Jersey-chartered commercial bank that was founded in 2005. The Bank operates from its headquarters located at 301 Sylvan Avenue in the Borough of Englewood Cliffs, Bergen County, New Jersey, through its twenty other banking offices. Substantially all loans are secured by specific items of collateral including business assets, consumer assets, and commercial and residential real estate. Commercial loans are expected to be repaid from cash flow from business operations. There are no significant concentrations of loans to any one industry or customer. However, the customers’ ability to repay their loans is dependent on the cash flows, real estate and general economic conditions in the area.
Basis of Financial Statement Presentation
The consolidated financial statements of the Parent Corporation are prepared on an accrual basis and include the accounts of the Parent Corporation and the Company. All significant intercompany accounts and transactions have been eliminated from the accompanying consolidated financial statements.
The consolidated financial statements have been prepared in conformity with U.S. generally accepted accounting principles.
Segments
FASB ASC 28, “Segment Reporting,” requires companies to report certain information about operating segments. The Company is managed as one segment; a community bank. All decisions including but not limited to loan growth, deposit funding, interest rate risk, credit risk and pricing are determined after assessing the effect on the totality of the organization. For example, loan growth is dependent on the ability of the organization to fund this growth through deposits or other borrowings. As a result, the Company is managed as one operating segment.
Use of Estimates
In preparing the consolidated financial statements, management is required to make estimates and assumptions that affect the reported amounts of assets and liabilities as of the date of the statement of financial condition and revenues and expenses for the reported periods. These estimates and assumptions affect the amounts reported in the financial statements and the disclosure provided, and actual results could differ.
Cash and Cash Equivalents
Cash and cash equivalents include cash, deposits with other financial institutions with maturities of less than 90 days, and federal funds sold. Net cash flows are reported for customer loan and deposit transactions, interest-bearing deposits in other financial institutions, and federal funds purchased and repurchase agreements.
Investment Securities
The Company accounts for its investment securities in accordance with Financial Accounting Standards Board (“FASB”) Accounting Standards Codification (“ASC”) 320-10-05. Investments are classified into the following categories: (1) held-to-maturity securities, for which the Company has both the positive intent and ability to hold until maturity, which are reported at amortized cost; (2) trading securities, which are purchased and held principally for the purpose of selling in the near term and are reported at fair value with unrealized gains and losses included in earnings; and (3) available-for-sale securities, which do not meet the criteria of the other two categories and which management believes may be sold prior to maturity due to changes in interest rates, prepayment, risk, liquidity or other factors, and are reported at fair value, with unrealized gains and losses, net of applicable income taxes, reported as a component of accumulated other comprehensive income, which is included in stockholders’ equity and excluded from earnings.
| - 52 - | ||
CONNECTONE BANCORP, INC. AND SUBSIDIARIES
NOTES TO CONSOLIDATED FINANCIAL STATEMENTS
Note 1 - Summary of Significant Accounting Policies – (continued)
Investment securities are adjusted for amortization of premiums and accretion of discounts as adjustments to interest income, which are recognized on a level yield method without anticipating prepayments, except for mortgage backed securities where prepayments are anticipated. Investment securities gains or losses are determined using the specific identification method.
Securities are evaluated on at least a quarterly basis, and more frequently when market conditions warrant such an evaluation, to determine whether a decline in their value is other-than-temporary. FASB ASC 320-10-65 clarifies the interaction of the factors that should be considered when determining whether a debt security is other-than-temporarily impaired. For debt securities, management must assess whether (a) it has the intent to sell the security and (b) it is more likely than not that it will be required to sell the security prior to its anticipated recovery. These steps are done before assessing whether the entity will recover the cost basis of the investment. In instances when a determination is made that an other-than-temporary impairment exists but the investor does not intend to sell the debt security and it is not more likely than not that it will be required to sell the debt security prior to its anticipated recovery, FASB ASC 320-10-65 changed the presentation and amount of the other-than-temporary impairment recognized in the Consolidated Statement of Income. The other-than-temporary impairment is separated into (a) the amount of the total other-than-temporary impairment related to a decrease in cash flows expected to be collected from the debt security (the credit loss) and (b) the amount of the total other-than-temporary impairment related to all other factors. The amount of the total other-than-temporary impairment related to the credit loss is recognized through earnings. The amount of the total other-than-temporary impairment related to all other factors is recognized through other comprehensive income.
Loans Held-for-Sale
Residential mortgage loans originated and intended for sale in the secondary market are carried at the lower of aggregate cost or estimated fair value as determined by outstanding commitments from investors. For these loans originated and intended for sale, gains and losses on loan sales (sale proceeds minus carrying value) are recorded in other income and direct loan origination costs and fees are deferred at origination of the loan and are recognized in other income upon sale of the loan.
Other loans held-for-sale are carried at the lower of aggregate cost or estimated fair value. A portion of these loans, taxi medallions loans, have no material observable trading in any market. Fair value is established with considerations for a range of market participant indications, for all or parts of these loans and discounted cash flow analyses, which have significant unobservable inputs. See Note 22 for further discussion.
Another portion of these loans are based upon contractual offers to purchase which were obtained by management.
Loans
Loans that management has the intent and ability to hold for the foreseeable future or until maturity or payoff are reported at the principal balance outstanding, net of deferred loan fees and costs, and an allowance for loan and lease losses. Interest income is accrued on the unpaid principal balance. Loan origination fees, net of certain direct origination costs, are deferred and recognized in interest income using the level-yield method without anticipating prepayments.
Loan segments are defined as a group of loans and leases, which share similar initial measurement attributes, risk characteristics, and methods for monitoring and assessing credit risk. Management has determined that the Company has five segments of loans and leases: commercial (including lease financing), commercial real estate, commercial construction, residential real estate (including home equity) and consumer.
Loans that are 90 days past due are automatically placed on nonaccrual and previously accrued interest is reversed and charged against interest income unless the loans is both well-secured and in the process of collection. Past due status is based on the contractual terms of the loan. In all cases, loans are placed on nonaccrual or charged-off at an earlier date if collection of principal or interest is considered doubtful. Nonaccrual loans and loans 90 days or greater past due and still accruing include both smaller balance homogeneous loans that are collectively evaluated for impairment and individually evaluated for impairment.
All interest accrued but not received for loans placed on nonaccrual are reversed against interest income. Interest received on such loans is accounted for on the cash-basis or cost-recovery method, until qualifying for return to accrual. Loans are returned to accrual status when all the principal and interest amounts contractually due are brought current and future payments are reasonably assured.
| - 53 - | ||
CONNECTONE BANCORP, INC. AND SUBSIDIARIES
NOTES TO CONSOLIDATED FINANCIAL STATEMENTS
Note 1 - Summary of Significant Accounting Policies – (continued)
The policy of the Company is to generally grant commercial, residential and consumer loans to residents and businesses within its New Jersey and New York market area. The borrowers’ abilities to repay their obligations are dependent upon various factors including the borrowers’ income and net worth, cash flows generated by the borrowers’ underlying collateral, value of the underlying collateral, and priority of the lender’s lien on the property. Such factors are dependent upon various economic conditions and individual circumstances beyond the control of the Company. The Company is therefore subject to risk of loss. The Company believes its lending policies and procedures adequately minimize the potential exposure to such risks and that adequate provisions for loan losses are provided for all known and inherent risks. Collateral and/or personal guarantees are required for a large majority of the Company’s loans.
Allowance for Loan and Lease Loss
The allowance for loan and lease losses is a valuation allowance for probable incurred credit losses. Loan and lease losses are charged against the allowance when management believes the uncollectibility of a loan balance is confirmed. Subsequent recoveries, if any, are credited to the allowance. Management estimates the allowance balance required using past loan loss experience, the nature and volume of the portfolio, information about specific borrower situations and estimated collateral values, economic conditions, and other factors. Allocations of the allowance may be made for specific loans, but the entire allowance is available for any loan that, in management’s judgment, should be charged off. The allowance consists of specific and general components. The specific component relates to loans that are individually classified as impaired.
A loan is considered impaired when, based on current information and events, it is probable that the Bank will be unable to collect the scheduled payments of principal or interest when due according to the contractual terms of the loan agreement. Factors considered by management in determining impairment include payment status and the probability of collecting scheduled principal and interest payments when due. Loans for which the terms have been modified as a concession to the borrower due to the borrower experiencing financial difficulties are considered troubled debt restructurings (“TDR”) and are classified as impaired. Loans considered to be TDRs can be categorized as nonaccrual or performing. The impairment of a loan can be measured at (1) the fair value of the collateral less costs to sell, if the loan is collateral dependent, (2) at the value of expected future cash flows using the loan’s effective interest rate, or (3) at the loan’s observable market price. Generally, the Bank measures impairment of such loans by reference to the fair value of the collateral less costs to sell. Loans that experience minor payment delays and payment shortfall generally are not classified as impaired.
Loans $250,000 and over, as well as all TDRs, are individually evaluated for impairment. If a loan that is identified as impaired and the individual test results in an impairment, a portion of the allowance is allocated so that the loan is reported, net, at the fair value of collateral less costs to sell if repayment is expected solely from the collateral or at the present value of estimated future cash flows using the loan’s existing rate if the loan is dependent on cash flow. Loans with balances less than $250,000 (with the exception of TDRs) are collectively evaluated for impairment, and accordingly, are not separately identified for impairment disclosures.
Factors considered by management in determining impairment include payment status, collateral value, and the probability of collecting scheduled principal and interest payments when due. Loans that experience insignificant payment delays and payment shortfalls generally are not classified as impaired. Management determines the significance of payment delays and payment shortfalls on a case-by-case basis, taking into consideration all of the circumstances surrounding the loan and the borrower, including the length of the delay, the reasons for the delay, the borrower’s prior payment record, and the amount of the shortfall in relation to the principal and interest owed.
Troubled debt restructurings are separately identified for impairment disclosures and are measured at the present value of estimated future cash flows using the loan’s effective rate at inception. If a troubled debt restructuring is considered to be a collateral dependent loan, the loan is reported, net, at the fair value of the collateral. For troubled debt restructurings that subsequently default, the Company determines the amount of reserve in accordance with the accounting policy for the allowance for loan and lease losses.
The general component covers non-impaired loans and is based on historical loss experience adjusted for current factors. The historical loss experience, the primary factor, is determined by loan segment and is based on the actual loss history experienced by the Bank over an actual three year rolling calculation. This actual loss experience is supplemented with other economic factors based on the risks present for each portfolio segment. This actual loss experience is supplemented with the exogenous factor adjustments based on the risks present for each loan categories. These exogenous factors (nine total) include consideration of the following: concentrations of credit; delinquency & nonaccrual trends; economic & business conditions including evaluation of the national and regional economies and industries with significant loan concentrations; external factors including legal, regulatory or competitive pressures that may impact the loan portfolio; changes in the experience, ability, or size of the lending staff, management, or board of directors that may impact the loan portfolio; changes in underwriting standards, collection procedures, charge-off practices, or other changes in lending policies and procedures that may impact the loan portfolio; loss and recovery trends; changes in portfolio size and mix; and trends in problem loans.
| - 54 - | ||
CONNECTONE BANCORP, INC. AND SUBSIDIARIES
NOTES TO CONSOLIDATED FINANCIAL STATEMENTS
Note 1 - Summary of Significant Accounting Policies – (continued)
Purchased Credit-Impaired Loans
The Company acquires groups of loans in conjunction with mergers, some of which have shown evidence of credit deterioration since origination. These purchased credit-impaired loans are recorded at their estimated fair value, such that there is no carryover of the seller’s allowance for loan and lease losses. After acquisition, losses are recognized by an increase in the allowance for loan and lease losses.
Such purchased credit-impaired loans (“PCI”) are valued on an individual basis. The Company estimates the amount and timing of expected cash flows for each loan and the expected cash flows in excess of amount paid is recorded as interest income over the remaining life of the loan (accretable yield). The excess of the loan’s contractual principal and interest over expected cash flows is not recorded (nonaccretable difference).
A PCI loan may be resolved either through a sale of the loan, by working with the customer and obtaining partial or full repayment, by short sale of the collateral, or by foreclosure. A gain or loss on resolution would be recognized based on the difference between the proceeds received and the carrying amount of the loan.
PCI loans that met the criteria for nonaccrual may be considered performing, regardless of whether the customer is contractually delinquent, if management can reasonably estimate the timing and amount of the expected cash flows on such loans and if management expects to fully collect the new carrying value of the loans. As such, management may no longer consider the loans to be nonaccrual or nonperforming and may accrue interest on these loans, including the impact of any accretable discount.
Derivatives
The Company records cash flow hedges at the inception of the derivative contract based on the Company’s intentions and belief as to likely effectiveness as a hedge. Cash flow hedges represent a hedge of a forecasted transaction or the variability of cash flows to be received or paid related to a recognized asset or liability. For a cash flow hedge, the gain or loss on the derivative is reported in other comprehensive income and is reclassified into earnings in the same periods during which the hedged transaction affects earnings. The changes in the fair value of derivatives that are not highly effective in hedging the changes in fair value or expected cash flows of the hedged item are recognized immediately in current earnings. Changes in the fair value of derivatives that do not qualify for hedge accounting are reported currently in earnings, as noninterest income.
Net cash settlements on derivatives that qualify for hedge accounting are recorded in interest income or interest expense, based on the item being hedged. Net cash settlements on derivatives that do not qualify for hedge accounting are reported in noninterest income. Cash flows on hedges are classified in the cash flow statement the same as the cash flows of the items being hedged.
The Company formally documents the relationship between derivatives and hedged items, as well as the risk-management objective and the strategy for undertaking hedge transactions at the inception of the hedging relationship. This documentation includes linking cash flow hedges to specific assets and liabilities on the balance sheet or to specific firm commitments or forecasted transactions. The Company also formally assesses, both at the hedge’s inception and on an ongoing basis, whether the derivative instruments that are used are highly effective in offsetting changes in fair values or cash flows of the hedged items. The Company discontinues hedge accounting when it determines that the derivative is no longer effective in offsetting changes in the fair value or cash flows of the hedged item, the derivative is settled or terminates, a hedged forecasted transaction is no longer probable, a hedged firm commitment is no longer firm, or treatment of the derivative as a hedge is no longer appropriate or intended.
When hedge accounting is discontinued, subsequent changes in fair value of the derivative are recorded as noninterest income. When a cash flow hedge is discontinued but the hedged cash flows or forecasted transactions are still expected to occur, gains or losses that were accumulated in other comprehensive income are amortized into earnings over the same periods which the hedged transactions will affect earnings.
| - 55 - | ||
CONNECTONE BANCORP, INC. AND SUBSIDIARIES
NOTES TO CONSOLIDATED FINANCIAL STATEMENTS
Note 1 - Summary of Significant Accounting Policies – (continued)
Restricted Stock
The Bank is a member of the Federal Home Loan Bank (“FHLB”) of New York. Members are required to own a certain amount of stock based on the level of borrowings and other factors, and may invest in additional amounts. FHLB stock is carried at cost, classified as a restricted security, and periodically evaluated for impairment based on ultimate recovery of par value. Cash dividends on the stock are reported as income.
Transfers of Financial Assets
Transfers of financial assets are accounted for as sales, when control over the assets has been relinquished. Control over transferred assets is deemed to be surrendered when the assets have been isolated from the Company, the transferee obtains the right (free of conditions that constrain it from taking advantage of that right) to pledge or exchange the transferred assets, and the Company does not maintain effective control over the transferred assets through an agreement to repurchase them before their maturity.
Premises and Equipment
Land is carried at cost and premises and equipment are stated at cost less accumulated depreciation. Buildings and related components are depreciated using the straight-line method with useful lives ranging from 4 to 39 years. Furniture, fixtures and equipment are depreciated using the straight-line (or accelerated) method with useful lives ranging from 3 to 10 years.
Other Real Estate Owned
Other real estate owned (“OREO”), representing property acquired through foreclosure and held-for-sale, is initially recorded at fair value less cost to sell at the date of foreclosure, establishing a new cost basis. Subsequently, valuations are periodically performed by management and the assets are carried at the lower of carrying amount or fair value less cost to sell. Costs relating to holding the assets are charged to expenses.
Employee Benefit Plans
The Company has a noncontributory pension plan that covered all eligible employees up until September 30, 2007, at which time the Company froze its defined benefit pension plan. As such, all future benefit accruals in this pension plan were discontinued and all retirement benefits that employees would have earned as of September 30, 2007 were preserved. The Company’s policy is to fund at least the minimum contribution required by the Employee Retirement Income Security Act of 1974. The costs associated with the plan are accrued based on actuarial assumptions and included in salaries and employee benefits expense.
The Company accounts for its defined benefit pension plan in accordance with FASB ASC 715-30. FASB ASC 715-30 requires that the funded status of defined benefit postretirement plans be recognized on the Company’s statement of financial condition and changes in the funded status be reflected in other comprehensive income. FASB ASC 715-30 also requires companies to measure the funded status of the plan as of the date of its fiscal year-end.
The Company maintains a 401(k) employee savings plan to provide for defined contributions which covers substantially all employees of the Company. Employee 401(k) and profit sharing plan expense is the amount of matching contributions.
Stock-Based Compensation
Stock compensation accounting guidance (FASB ASC 718, “Compensation-Stock Compensation”) requires that the compensation cost related to share-based payment transactions be recognized in financial statements. That cost will be measured based on the grant date fair value of the equity or liability instruments issued. The stock compensation accounting guidance covers a wide range of share-based compensation arrangements including stock options, restricted share plans, performance-based awards, share appreciation rights and employee share purchase plans.
Stock compensation accounting guidance requires that compensation cost for all stock awards be calculated and recognized over the employees’ service period, generally defined as the vesting period. For awards with graded-vesting, compensation cost is recognized on a straight-line basis over the requisite service period for the entire award. A Black-Scholes model is used to estimate the fair value of stock options while the market price of the Company’s common stock at the date of grant is used for restricted stock awards. See Note 19 of the Notes to Consolidated Financial Statements for a further discussion.
| - 56 - | ||
CONNECTONE BANCORP, INC. AND SUBSIDIARIES
NOTES TO CONSOLIDATED FINANCIAL STATEMENTS
Note 1 - Summary of Significant Accounting Policies – (continued)
Earnings per Share
Financial Accounting Standards Board Accounting Standards Codification (“FASB ASC”) No. 260-10-45 addresses whether instruments granted in share-based payment transactions are participating securities prior to vesting and, therefore, need to be included in the earnings allocation in computing earnings per share (“EPS”). The restricted stock awards and certain restricted stock units granted by the Company contain non-forfeitable rights to dividends and therefore are considered participating securities. The two-class method for calculating basic EPS excludes dividends paid to participating securities and any undistributed earnings attributable to participating securities.
Earnings per common share have been computed based on the following:
| Years Ended December 31, | ||||||||||||
| 2016 | 2015 | 2014 | ||||||||||
| (in thousands, except per share amounts) | ||||||||||||
| Net income available to common stockholders | $ | 31,060 | $ | 41,199 | $ | 18,565 | ||||||
| Dividends paid on earnings allocated to participating securities | (147) | (157) | (50) | |||||||||
| Income attributable to common stock | $ | 30,913 | $ | 41,042 | $ | 18,515 | ||||||
| Weighted average common shares outstanding, including participating securities | 30,453 | 29,989 | 23,050 | |||||||||
| Weighted average participating securities | (54) | (51) | (20) | |||||||||
| Weighted average common shares outstanding | 30,399 | 29,938 | 23,030 | |||||||||
| Incremental shares from assumed conversions of options, performance units and restricted shares | 291 | 346 | 449 | |||||||||
| Weighted average common and equivalent shares outstanding | 30,690 | 30,284 | 23,479 | |||||||||
| Earnings per common share: | ||||||||||||
| Basic | $ | 1.02 | $ | 1.37 | $ | 0.80 | ||||||
| Diluted | 1.01 | 1.36 | 0.79 | |||||||||
There were no antidilutive share equivalents as of December 31, 2016, 2015 and 2014.
Treasury Stock
Subject to limitations applicable to the Parent Corporation, treasury stock purchases may be made from time to time as, in the opinion of management, market conditions warrant, in the open market or in privately negotiated transactions. Shares repurchased are added to the corporate treasury and will be used for future stock dividends and other issuances. The repurchased shares are recorded as treasury stock, which results in a decrease in stockholders’ equity. Treasury stock is recorded using the cost method and accordingly is presented as a reduction of stockholders’ equity. During the years ended December 31, 2016, 2015 and 2014, the Parent Corporation did not purchase any of its shares.
Goodwill
The Company adopted the provisions of FASB ASC 350-20-35-4 (“ASC 350”), which requires that goodwill be tested for impairment annually, or more frequently if indicators arise for impairment. The Company has selected December 31 as the date to perform the annual impairment test. No impairment charge was deemed necessary for the years ended December 31, 2016, 2015 and 2014.
In accordance with ASC 350, an impairment analysis is a two-step test. The first step is to identify potential impairment by comparing the value fair of a reporting unit with its carrying amount, including goodwill and the second step, if necessary, is to quantify the amount of impairment. Also considered as part of the analysis were:
| · | Market value and control value compared to Company’s common equity. |
| · | Company’s market price as compared to previous period. |
| · | Overall financial performance. |
| - 57 - | ||
CONNECTONE BANCORP, INC. AND SUBSIDIARIES
NOTES TO CONSOLIDATED FINANCIAL STATEMENTS
Note 1 - Summary of Significant Accounting Policies – (continued)
Other Intangible Assets
Other intangible assets consist of core deposits arising from business combinations that are amortized over their estimated useful lives to their estimated residual value.
Comprehensive Income
Total comprehensive income includes all changes in equity during a period from transactions and other events and circumstances from nonowner sources. The Company’s other comprehensive income is comprised of unrealized holding gains and losses on securities available-for-sale, unrecognized actuarial gains and losses of the Company’s defined benefit pension plan and unrealized gains and losses on cash flow hedge, net of taxes.
Restrictions on Cash
Cash on hand or on deposit with the Federal Reserve Bank is required to meet regulatory reserve and clearing requirements.
Dividend Restriction
Banking regulations require maintaining certain capital levels and may limit the dividends paid by the Bank to the Parent Corporation or by the Parent Corporation to the stockholders.
Fair Value of Financial Instruments
Fair values of financial instruments are estimated using relevant market information and other assumptions, as more fully disclosed in a separate note. Fair value estimates involve uncertainties and matters of significant judgment regarding interest rates, credit risk, prepayments, and other factors, especially in the absence of broad markets for particular items. Changes in assumptions or in market conditions could significantly affect the estimates.
Bank Owned Life Insurance
The Company invests in Bank Owned Life Insurance (“BOLI”) to help offset the cost of employee benefits. The change in the cash surrender value of the BOLI is recorded as a component of noninterest income.
Income Taxes
Income tax expense is the total of the current year income tax due or refundable and the change in deferred tax assets and liabilities. Deferred tax assets and liabilities are the expected future tax amounts for the temporary differences between carrying amounts and tax bases of assets and liabilities, computed using enacted tax rates. A valuation allowance, if needed, reduces deferred tax assets to the amount expected to be realized.
A tax position is recognized as a benefit only if it is “more likely than not” that the tax position would be sustained in a tax examination, with a tax examination being presumed to occur. The amount recognized is the largest amount of tax benefit that is greater than 50% likely of being realized on examination. For tax positions not meeting the “more likely than not” test, no tax benefit is recorded.
Advertising Costs
The Company recognizes its marketing and advertising cost as incurred.
Reclassifications
Certain reclassifications have been made in the consolidated financial statements and footnotes for 2015 and 2014 to conform to the classifications presented in 2016. Such reclassifications had no impact on net income or stockholders’ equity.
| - 58 - | ||
CONNECTONE BANCORP, INC. AND SUBSIDIARIES
NOTES TO CONSOLIDATED FINANCIAL STATEMENTS
Note 2 - New Authoritative Accounting Guidance
ASU No. 2017-04, “Intangibles – Goodwill and Other (Topic 350).” ASU 2017-04 aims to simplify the subsequent measurement of goodwill. Under these amendments, an entity should perform its annual, or interim, goodwill impairment test by comparing the fair value of a reporting unit with its carrying amount. An entity should recognize an impairment charge for the amount by which the carrying amount exceeds the reporting unit’s fair value; however, the loss recognized should not exceed the total amount of goodwill allocated to that reporting unit. Additionally, an entity should consider income tax effects from any tax deductible goodwill on the carrying amount of the reporting unit when measuring the goodwill impairment loss, if applicable. The Board also eliminated the requirements for any reporting unit with a zero or negative carrying amount to perform a qualitative assessment. An entity is required to disclose the amount of goodwill allocated to each reporting unit with a zero or negative carrying amount of net assets and still has the option to perform the qualitative assessment for a reporting unit to determine if the quantitative impairment test is necessary. The amendments in this update are effective for public business entities for fiscal years beginning after December 15, 2019. We are currently evaluating this ASU to determine the impact on our consolidated financial statements.
ASU No. 2017-01, “Business Combinations (Topic 805).” ASU 2017-01 provides a screen to determine when a set is not a business. The screen requires that when substantially all of the fair value of the gross assets acquired (or disposed of) is concentrated in a single identifiable asset or a group of similar identifiable assets, the set is not a business. This screen reduces the number of transactions that need to be further evaluated. The amendments in this update are effective for public business entities for fiscal years beginning after December 15, 2017, including interim periods within those fiscal years. The amendments in this update should be applied prospectively on or after the effective date. We are currently evaluating this ASU to determine the impact on our consolidated financial statements.
ASU No. 2016-16, “Income Taxes (Topic 740): Intra-Entity Transfers of Assets Other Than Inventory.” ASU 2016-16 requires an entity to recognize the income tax consequences of an intra-entity transfer of an asset other than inventory when the transfer occurs. The ASU eliminate the exception for an intra-entity transfer of an asset other than inventory. The ASU does not include new disclosure requirements; however, existing disclosure requirements might be applicable when accounting for the current and deferred income taxes for an intra-entity transfer of an asset other than inventory. For public entities that are U.S. Securities and Exchange Commission (SEC) filers, the amendments in this update are effective for annual reporting periods beginning after December 15, 2017, including interim reporting periods within those annual reporting periods. We are currently evaluating this ASU to determine the impact on our consolidated financial statements.
ASU No. 2016-15, “Statement of Cash Flows (Topic 230): Classification of Certain Cash Receipts and Cash Payments” provides guidance on the following eight specific cash flow issues: (1) Debt prepayment or debt extinguishment costs; (2) Settlement of zero-coupon debt instruments or other debt instruments with coupon interest rates that are insignificant in relation to the effective interest rate of the borrowing; (3) Contingent consideration payments made after a business combination; (4) Proceeds from the settlement of insurance claims; (5) Proceeds from the settlement of corporate-owned life insurance policies, including bank-owned life insurance policies; (6) Distributions received from equity method investees; (7) Beneficial interests in securitization transactions; (8) Separately identifiable cash flows and application of the predominance principle. The amendments in this Update are effective for public business entities for fiscal years beginning after December 15, 2017, and interim periods within those fiscal years. Early adoption is permitted, including adoption in an interim period. If an entity early adopts the amendments in an interim period, any adjustments should be reflected as of the beginning of the fiscal year that includes that interim period. An entity that elects early adoption must adopt all of the amendments in the same period. The amendments in this Update should be applied using a retrospective transition method to each period presented. If it is impracticable to apply the amendments retrospectively for some of the issues, the amendments for those issues would be applied prospectively as of the earliest date practicable. We are currently evaluating this ASU to determine the impact on our consolidated financial statements.
ASU No. 2016-13, “Financial Instruments – Credit Losses (Topic 326): Assets Measured at Amortized Cost.” ASU 2016-13 requires a financial asset (or a group of financial assets) measured at amortized cost basis to be presented at the net amount expected to be collected. The amendments in this update replace the incurred loss impairment methodology in current GAAP with a methodology that reflects expected credit losses and requires consideration of a broader range of reasonable and supportable information to inform credit loss estimates and affects loans, debt securities, trade receivables, net investments in leases, off-balance-sheet credit exposures, reinsurance receivables, and any other financial assets not excluded from the scope that have the contractual right to receive cash. For public business entities that are U.S. Securities and Exchange Commission (SEC) filers, the amendments in this Update are effective for fiscal years beginning after December 15, 2019, including interim periods within those fiscal years. We are currently evaluating the potential impact of this ASU on our consolidated financial statements.
| - 59 - | ||
CONNECTONE BANCORP, INC. AND SUBSIDIARIES
NOTES TO CONSOLIDATED FINANCIAL STATEMENTS
Note 2. New Authoritative Accounting Guidance – (continued)
ASU No. 2016-12, “Revenue from Contracts with Customers (Topic 606): Narrow-Scope Improvements and Practical Expedients.” ASU 2016-12 was issued to clarify ASC Topic 606, “Revenue from Contracts with Customers” and to address narrow-scope improvements to the guidance on collectability, noncash consideration, and completed contracts at transition. Additionally, the amendments in this Update provide a practical expedient for contract modifications at transition and an accounting policy election related to the presentation of sales taxes and other similar taxes collected from customers. The effective date and transition of ASU 2016-12 is the same as the effective date and transition of ASU 2014-09, “Revenue from Contracts with Customers (Topic 606),” as discussed above. Although management continues to evaluate the potential impact of this ASU on our consolidated financial statements at this time, we believe this standard will not have a significant impact on our consolidated financial statements.
ASU No. 2016-10, “Revenue from Contracts with Customers (Topic 606): Identifying Performance Obligations and Licensing.” ASU 2016-10 was issued to clarify ASC Topic 606, “Revenue from Contracts with Customers” related to (i) identifying performance obligations; and (ii) the licensing implementation guidance. The effective date and transition of ASU 2016-10 is the same as the effective date and transition of ASU 2014-09, “Revenue from Contracts with Customers (Topic 606),” as discussed above. Although management continues to evaluate the potential impact of this ASU on our consolidated financial statements at this time, we believe this standard will not have a significant impact on our consolidated financial statements.
ASU 2016-09, “Compensation - Stock Compensation (Topic 718): Improvements to Employee Share-Based Payment Accounting.” Under ASU 2016-09 all excess tax benefits and tax deficiencies related to share-based payment awards should be recognized as income tax expense or benefit in the income statement during the period in which they occur. Previously, such amounts were recorded in the pool of excess tax benefits included in additional paid-in capital, if such pool was available. Because excess tax benefits are no longer recognized in additional paid-in capital, the assumed proceeds from applying the treasury stock method when computing earnings per share should exclude the amount of excess tax benefits that would have previously been recognized in additional paid-in capital. Additionally, excess tax benefits should be classified along with other income tax cash flows as an operating activity rather than a financing activity, as was previously the case. ASU 2016-09 also provides that an entity can make an entity-wide accounting policy election to either estimate the number of awards that are expected to vest (current GAAP) or account for forfeitures when they occur. ASU 2016-09 changes the threshold to qualify for equity classification (rather than as a liability) to permit withholding up to the maximum statutory tax rates (rather than the minimum as was previously the case) in the applicable jurisdictions. ASU 2016-09 will be effective on January 1, 2017 and is not expected to have a significant impact on our consolidated financial statements.
ASU No. 2016-02, “Leases (Topic 842)” requires the recognition of a right of use asset and related lease liability by lessees for leases classified as operating leases under current accounting principles GAAP. Topic 842, which replaces the current guidance under Topic 840, retains a distinction between finance leases and operating leases. The recognition, measurement, and presentation of expenses and cash flows arising from a lease by a lessee also will not significantly change from current GAAP. For leases with a term of 12 months or less, a lessee is permitted to make an accounting policy election by class of underlying asset not to recognize right of use assets and lease liabilities. Topic 842 will be effective for the Company for reporting periods beginning January 1, 2019, with an early adoption permitted. The Company must apply a modified retrospective transition approach for the applicable leases existing at, or entered into after, the beginning of the earliest comparative period presented in the consolidated financial statements. The modified retrospective approach would not require any transition accounting for leases that expired before the earliest comparative period presented. We are currently evaluating this ASU to determine the impact on our consolidated financial statements.
ASU No. 2016-01, “Financial Instruments – Overall (Subtopic 825-10): Recognition and Measurement of Financial Assets and Financial Liabilities.” ASU 2016-1, among other things; (i) requires equity investments, with certain exceptions, to be measured at fair value with changes in fair value recognized in net income, (ii) simplifies the impairment assessment of equity investments without readily determinable fair values by requiring a qualitative assessment to identify impairment; (iii) eliminates the requirement for public business entities to disclose the methods and significant assumptions used to estimate the fair value that is required to be disclosed for financial instruments measured at amortized cost on the balance sheet; (iv) requires public business entities to use the exit price notion when measuring the fair value of financial instruments for disclosure purposes; (v) requires an entity to present separately in other comprehensive income the portion of the total change in the fair value of a liability resulting from a change in the instrument-specific credit risk when the entity has elected to measure the liability at fair value in accordance with the fair value option for financial instruments; (vi) requires separate presentation of financial assets and financial liabilities by measurement category and form of financial asset on the balance sheet or the accompanying notes to the financial statements; and (vii) clarifies that an entity should evaluate the need for a valuation allowance on a deferred tax asset related to available-for-sale. ASU 2016-1 will be effective for us on January 1, 2018 and we are currently evaluating the potential impact of ASU No. 2016-01 on our consolidated financial statements.
| - 60 - | ||
CONNECTONE BANCORP, INC. AND SUBSIDIARIES
NOTES TO CONSOLIDATED FINANCIAL STATEMENTS
Note 2. New Authoritative Accounting Guidance – (continued)
ASU No. 2014-09, “Revenue from Contracts with Customers (Topic 606).” ASU 2014-09 implements a common revenue standard that clarifies the principles for recognizing revenue. The core principle of ASU 2014-09 is that an entity should recognize revenue to depict the transfer of promised goods or services to customers in an amount that reflects the consideration to which the entity expects to be entitled in exchange for those goods or services. To achieve that core principle, an entity should apply the following steps: (i) identify the contract(s) with a customer; (ii) identify the performance obligations in the contract; (iii) determine the transaction price; (iv) allocate the transaction price to the performance obligations in the contract; and (v) recognize revenue when (or as) the entity satisfies a performance obligation. ASU 2014-09 was originally going to be effective for us on January 1, 2017; however, the FASB recently issued ASU 2015-14, “Revenue from Contracts with Customers (Topic 606) - Deferral of the Effective Date” which deferred the effective date of ASU 2014-09 by one year to January 1, 2018. We are currently evaluating the potential impact of this ASU on its consolidated financial statements.
Note 3 - Business Combinations
On January 20, 2014, the Company entered into an Agreement and Plan of Merger (the “Merger Agreement”) with ConnectOne Bancorp, Inc., a New Jersey corporation (“Legacy ConnectOne”). Effective July 1, 2014 (the “Effective Time”), the Company completed the merger contemplated by the Merger Agreement (the “Merger”) with Legacy ConnectOne, and Legacy ConnectOne merged with and into the Company, with the Company as the surviving corporation. Also at closing, the Company changed its name from “Center Bancorp, Inc.” to “ConnectOne Bancorp, Inc.” and changed its NASDAQ trading symbol to “CNOB” from “CNBC.”
Pursuant to the Merger Agreement, holders of Legacy ConnectOne common stock, no par value per share (the “Legacy ConnectOne Common Stock”), received 2.6 shares of common stock of the Company, no par value per share (the “Company Common Stock”), for each share of Legacy ConnectOne Common Stock held immediately prior to the effective time of the Merger, with cash to be paid in lieu of fractional shares. Each outstanding share of Company Common Stock remained outstanding and was unaffected by the Merger. Each option granted by Legacy ConnectOne to purchase shares of Legacy ConnectOne Common Stock was converted into an option to purchase Company Common Stock on the same terms and conditions as were applicable prior to the Merger (taking into account any acceleration or vesting by reason of the consummation of the Merger and its related transactions), subject to adjustment of the exercise price and the number of shares of Company Common Stock issuable upon exercise of such option based on the 2.6 exchange ratio.
Immediately following the Merger, Union Center National Bank, a bank organized pursuant to the laws of the United States, and a wholly owned subsidiary of the Company (“UNCB”), merged (the “Bank Merger”) with and into ConnectOne Bank, a New Jersey state-chartered commercial bank and a wholly owned subsidiary of Legacy ConnectOne, with ConnectOne Bank as the surviving entity (the “Bank”). The Bank now conducts business only in the name of and under the brand of ConnectOne.
The assets acquired and liabilities assumed have been accounted for under the acquisition method of accounting. The assets and liabilities, both tangible and intangible, were recorded at their fair values as of July 1, 2014 based on management’s best estimate using the information available as of the Merger date. The application of the acquisition method of accounting resulted in the recognition of goodwill of $129,105,000 and a core deposit intangible of $5,308,000. As of July 1, 2014, Legacy ConnectOne had assets with a carrying value of approximately $1.5 billion, including loans with a carrying value of approximately $1.2 billion, and deposits with a carrying value of approximately $1.1 billion. The table below summarizes the amounts recognized as of the Merger date for each major class of assets acquired and liabilities assumed, the estimated fair value adjustments and the amounts recorded in the Company’s financial statements at fair value at the Merger date (in thousands):
| - 61 - | ||
CONNECTONE BANCORP, INC. AND SUBSIDIARIES
NOTES TO CONSOLIDATED FINANCIAL STATEMENTS
Note 3 - Business Combinations – (continued)
| Consideration paid through Company common stock issued to Legacy ConnectOne shareholders and fair value of stock options acceleration was: | $ 264,231 |
| Legacy ConnectOne carrying value | Fair value adjustments | As recorded at acquisition | ||||||||||
| Cash and cash equivalents | $ | 70,318 | $ | - | $ | 70,318 | ||||||
| Investment securities | 28,436 | 16 | (a) | 28,452 | ||||||||
| Restricted investments | 13,646 | - | 13,646 | |||||||||
| Loans held-for-sale | 190 | - | 190 | |||||||||
| Loans | 1,304,600 | (5,316) | (b) | 1,299,284 | ||||||||
| Bank owned life insurance | 15,481 | - | 15,481 | |||||||||
| Premises and equipment, net | 7,380 | (905) | (c) | 6,475 | ||||||||
| Accrued interest receivable | 4,470 | - | 4,470 | |||||||||
| Core deposit intangible | - | 5,308 | (d) | 5,308 | ||||||||
| Other real estate owned | 2,455 | - | 2,455 | |||||||||
| Other assets | 10,636 | 3,650 | (e) | 14,286 | ||||||||
| Deposits | (1,049,666) | (1,676) | (f) | (1,051,342) | ||||||||
| Borrowings | (262,046) | (1,324) | (g) | (263,370) | ||||||||
| Other liabilities | (10,527) | - | (10,527) | |||||||||
| Total identifiable net assets | $ | 135,373 | $ | (247) | $ | 135,126 | ||||||
| Goodwill recorded in the Merger | $ | 129,105 | ||||||||||
The following provides an explanation of certain fair value adjustments presented in the above table:
| a) | Represents the fair value adjustment on investment securities held-to-maturity. |
| b) | Represents the elimination of Legacy ConnectOne’s allowance for loan and lease losses, deferred fees, deferred costs and an adjustment of the amortized cost of loans to estimated fair value, which includes an interest rate mark and credit mark. |
| c) | Represent an adjustment to reflect the fair value of above-market rent on leased premises. The above-market rent adjustment will be amortized on a straight-line basis over the remaining term of the respective leases. |
| d) | Represents intangible assets recorded to reflect the fair value of core deposits. The core deposit asset was recorded as an identifiable intangible asset and will be amortized on an accelerated basis over the estimated average life of the deposit base. |
| e) | Consist primarily of adjustments in net deferred tax assets resulting from the fair value adjustments related to acquired assets, liabilities assumed and identifiable intangibles recorded. |
| f) | Represents fair value adjustment on time deposits as the weighted average interest rates of time deposits assumed exceeded the costs of similar funding available in the market at the time of the Merger, as well as the elimination of fees paid on brokered time deposits. |
| g) | Represents the fair value adjustment on FHLB borrowings as the weighted average interest rate of FHLB borrowings assumed exceeded the cost of similar funding available in the market at the time of the Merger. |
The amount of goodwill recorded represents the excess purchase price over the estimated fair value of the net assets acquired by the Company and reflects the economies of scale, increased market share and lending capabilities, greater access to best-in-class banking technology, and related synergies that are expected to result from the acquisition.
| - 62 - | ||
CONNECTONE BANCORP, INC. AND SUBSIDIARIES
NOTES TO CONSOLIDATED FINANCIAL STATEMENTS
Note 3 - Business Combinations – (continued)
Except for collateral dependent loans with deteriorated credit quality, the fair values for loans acquired from Legacy ConnectOne were estimated using cash flow projections based on the remaining maturity and repricing terms. Cash flows were adjusted by estimated future credit losses and the rate of prepayments. Projected monthly cash flows were then discounted to present value using a risk-adjusted market rate for similar loans. For collateral dependent loans with deteriorated credit quality, fair value was estimated by analyzing the value of the underlying collateral, assuming the fair values of the loan were derived from the eventual sale of the collateral. These values were discounted using market derived rate of returns, with consideration given to the period of time and costs associated with the foreclosure and disposition of the collateral. There was no carryover of Legacy ConnectOne allowance for loan and lease losses associated with the loans that were acquired, as the loans were initially recorded at fair value on the date of the Merger.
The acquired loan portfolio subject to purchased credit impairment accounting guidance (ASC 310-30) as of July 1, 2014 was comprised of collateral dependent loans with deteriorated credit quality as follows:
| ASC 310-30 Loans | ||||
| Contractual principal and accrued interest at acquisition | $ | 23,284 | ||
| Principal not expected to be collected (nonaccretable discount) | (6,942) | |||
| Expected cash flows at acquisition | 16,342 | |||
| Interest component of expected cash flows (accretable discount) | (5,013) | |||
| Fair value of acquired loans | $ | 11,329 | ||
The core deposit intangible asset recognized is being amortized over its estimated useful life of approximately 10 years utilizing an accelerated method. Goodwill is not amortized for book purposes; however, it is reviewed at least annually for impairment and is not deductible for tax purposes.
The fair value of retail demand and interest-bearing deposit accounts was assumed to approximate the carrying value as these accounts have no stated maturity and are payable on demand. The fair value of time deposits was estimated by discounting the contractual future cash flows using market rates offered for time deposits of similar remaining maturities. The fair value of borrowed funds was estimated by discounting the future cash flows using market rates for similar borrowings.
Direct acquisition and integration costs of the Merger were expensed as incurred and totaled $12.4 million. These items were recorded as merger-related expenses on the statement of operations.
The following table presents selected unaudited pro forma financial information reflecting the Merger assuming it was completed as of January 1, 2013. The unaudited pro forma financial information is presented for illustrative purposes only and is not necessarily indicative of the financial results of the combined companies had the Merger actually been completed at the beginning of the periods presented, nor does it indicate future results for any other interim or full fiscal year period. Pro forma basic and diluted earnings per common share were calculated using the Company’s actual weighted average shares outstanding for the periods presented, plus the incremental shares issued, assuming the Merger occurred at the beginning of the periods presented.
The unaudited pro forma information set forth below reflects the adjustments related to (a) purchase accounting fair value adjustments; (b) amortization of core deposit and other intangibles; and (c) adjustments to interest income and expense due to amortization of premiums and accretion discounts. In the table below, merger-related expenses of $12.4 million were excluded from pro forma noninterest expenses for the year ended December 31, 2014. Income taxes were also adjusted to exclude income tax benefits of $5.6 million related to the merger expenses for the year ended December 31, 2014.
| 2014 | ||||
| Net interest income | $ | 107,988 | ||
| Noninterest income | 8,244 | |||
| Noninterest expense | (54,749) | |||
| Net income | 45,981 | |||
| Pro forma earnings per share from continuing operations: | ||||
| Basic | $ | 1.55 | ||
| Diluted | 1.53 | |||
| - 63 - | ||
CONNECTONE BANCORP, INC. AND SUBSIDIARIES
NOTES TO CONSOLIDATED FINANCIAL STATEMENTS
Note 4 - Investment Securities
The Company’s investment securities are classified as available-for-sale at December 31, 2016 and as available-for-sale and held-to-maturity at December 31, 2015. Investment securities available-for-sale are reported at fair value with unrealized gains or losses included in equity, net of tax. Accordingly, the carrying value of such securities reflects their fair value as of December 31, 2016 and December 31, 2015. Fair value is based upon either quoted market prices, or in certain cases where there is limited activity in the market for a particular instrument, assumptions are made to determine their fair value. See Note 22 of the Notes to Consolidated Financial Statements for a further discussion.
Transfers of debt securities between the held-to-maturity category to the available-for-sale category are made at fair value at the date of transfer. For transfers from the available-for-sale category to the held-to maturity category the unrealized holding gain or loss at the date of transfer remains in accumulated other comprehensive income and in the carrying value of the held-to-maturity investment security. Unrealized holding gains or losses that remain in accumulated other comprehensive income are amortized or accreted out of other comprehensive income with an offsetting entry to interest income as a yield adjustment through earnings over the remaining terms of the securities. For transfers from the held-to-maturity category to the available-for-sale category unrealized holding gain or loss at the date of the transfer shall be recognized in accumulated other comprehensive income, net of applicable taxes.
During the year ended December 31, 2016, the Company transferred all securities previously categorized as held-to-maturity to available-for-sale classification. The transfer resulted in an increase of approximately $210 million in amortized cost basis of available-for-sale securities and resulted in a net increase to accumulated other comprehensive income of $7.4 million, net of tax. This transfer will enhance liquidity and increase flexibility with regard to asset-liability management and balance sheet composition. As a result of the transfer, the Company believes it has tainted its held-to-maturity classification and judgment will be required in the future in determining when circumstances have changed such that management can assert that it has the intent and ability to hold debt securities to maturity. Based on this guidance, the Company does not expect to classify any securities as held-to-maturity within the near future.
| - 64 - | ||
CONNECTONE BANCORP, INC. AND SUBSIDIARIES
NOTES TO CONSOLIDATED FINANCIAL STATEMENTS
Note 4 - Investment Securities – (continued)
The following tables present information related to the Company’s portfolio of securities available-for-sale and held-to-maturity at December 31, 2016 and 2015.
| Amortized Cost |
Gross Unrealized Gains |
Gross Unrealized Losses |
Fair Value | |||||||||
| (dollars in thousands) | ||||||||||||
| December 31, 2016 | ||||||||||||
| Investment securities available-for-sale | ||||||||||||
| Federal agency obligations | $ | 52,826 | $ | 282 | $ | (271) | $ | 52,837 | ||||
| Residential mortgage pass-through securities | 72,922 | 519 | (944) | 72,497 | ||||||||
| Commercial mortgage pass-through securities | 4,186 | 23 | - | 4,209 | ||||||||
| Obligations of U.S. states and political subdivisions | 148,747 | 2,789 | (931) | 150,605 | ||||||||
| Trust preferred securities | 5,575 | 242 | (151) | 5,666 | ||||||||
| Corporate bonds and notes | 36,717 | 586 | (375) | 36,928 | ||||||||
| Asset-backed securities | 14,867 | 2 | (286) | 14,583 | ||||||||
| Certificates of deposit | 973 | 10 | - | 983 | ||||||||
| Equity securities | 376 | 192 | - | 568 | ||||||||
| Other securities | 14,739 | - | (325) | 14,414 | ||||||||
| Total securities available-for-sale | $ | 351,928 | $ | 4,645 | $ | (3,283) | $ | 353,290 | ||||
| Amortized Cost |
Gross Unrealized Gains |
Gross Unrealized Losses |
Fair Value |
|||||||||
| December 31, 2015 | (dollars in thousands) | |||||||||||
| Investment securities available-for-sale | ||||||||||||
| Federal agency obligations | $ | 29,062 | $ | 142 | $ | (58) | $ | 29,146 | ||||
| Residential mortgage pass-through securities | 44,155 | 803 | (48) | 44,910 | ||||||||
| Commercial mortgage pass-through securities | 2,981 | - | (9) | 2,972 | ||||||||
| Obligations of U.S. states and political subdivisions | 8,188 | 169 | - | 8,357 | ||||||||
| Trust preferred securities | 16,088 | 398 | (231) | 16,255 | ||||||||
| Corporate bonds and notes | 53,566 | 702 | (292) | 53,976 | ||||||||
| Asset-backed securities | 20,005 | 18 | (298) | 19,725 | ||||||||
| Certificates of deposit | 1,895 | 18 | (8) | 1,905 | ||||||||
| Equity securities | 376 | 21 | (23) | 374 | ||||||||
| Other securities | 18,303 | - | (153) | 18,150 | ||||||||
| Total securities available-for-sale | $ | 194,619 | $ | 2,271 | $ | (1,120) | $ | 195,770 | ||||
| Amortized Cost |
Gross Unrecognized Gains |
Gross Unrecognized Losses |
Fair Value | ||||||||||
| Investment securities held-to-maturity | |||||||||||||
| U.S. Treasury and agency securities | $ | 28,471 | $ | 755 | $ | - | $ | 29,226 | |||||
| Federal agency obligations | 33,616 | 280 | (119) | 33,777 | |||||||||
| Residential mortgage-backed securities | 3,805 | 11 | (6) | 3,810 | |||||||||
| Commercial mortgage-backed securities | 4,110 | 27 | (2) | 4,135 | |||||||||
| Obligations of U.S. states and political subdivisions | 118,015 | 5,001 | (3) | 123,013 | |||||||||
| Corporate bonds and notes | 36,039 | 719 | (161) | 36,597 | |||||||||
| Total securities held-to-maturity | $ | 224,056 | $ | 6,793 | $ | (291) | $ | 230,558 |
| - 65 - | ||
CONNECTONE BANCORP, INC. AND SUBSIDIARIES
NOTES TO CONSOLIDATED FINANCIAL STATEMENTS
Note 4 - Investment Securities – (continued)
The following table presents information for investments in securities available-for-sale at December 31, 2016, based on scheduled maturities. Actual maturities can be expected to differ from scheduled maturities due to prepayment or early call options of the issuer. Securities not due at a single maturity date are shown separately.
| December 31, 2016 | |||||||
| Amortized Cost |
Fair Value |
||||||
| (dollars in thousands) | |||||||
| Investment Securities Available-for-Sale: | |||||||
| Due in one year or less | $ | 5,003 | $ | 5,054 | |||
| Due after one year through five years | 32,045 | 32,406 | |||||
| Due after five years through ten years | 50,718 | 51,473 | |||||
| Due after ten years | 171,939 | 172,669 | |||||
| Residential mortgage pass-through securities | 72,922 | 72,497 | |||||
| Commercial mortgage pass-through securities | 4,186 | 4,209 | |||||
| Equity securities | 376 | 568 | |||||
| Other securities | 14,739 | 14,414 | |||||
| Total securities available-for-sale | $ | 351,928 | $ | 353,290 | |||
Gross gains and losses from the sales, calls, and maturities of investment securities for the years ended December 31, 2016, 2015 and 2014 were as follows (dollars in thousands):
| Years Ended December 31, | ||||||||||
| 2016 | 2015 | 2014 | ||||||||
| Proceeds | $ | 85,253 | $ | 65,231 | $ | 81,844 | ||||
| Gross gains on sales of investment securities | $ | 4,234 | $ | 3,931 | $ | 2,837 | ||||
| Gross losses on sales of investment securities | - | - | 19 | |||||||
| Net gains on sales of investment securities | 4,234 | 3,931 | 2,818 | |||||||
| Less: tax provision on net gains | (1,682) | (1,564) | (986) | |||||||
| Net gains on sales of investment securities, after tax | $ | 2,552 | $ | 2,367 | $ | 1,832 | ||||
| - 66 - | ||
CONNECTONE BANCORP, INC. AND SUBSIDIARIES
NOTES TO CONSOLIDATED FINANCIAL STATEMENTS
Note 4 - Investment Securities – (continued)
Other-than-Temporarily Impaired Investments
The Company reviews all securities for potential recognition of other-than-temporary impairment. The Company maintains a watch list for the identification and monitoring of securities experiencing problems that require a heightened level of review. This could include credit rating downgrades.
The Company’s assessment of whether an impairment in the portfolio is other-than temporary includes factors such as whether the issuer has defaulted on scheduled payments, announced restructuring and/or filed for bankruptcy, has disclosed severe liquidity problems that cannot be resolved, disclosed deteriorating financial condition or sustained significant losses.
Temporarily Impaired Investments
The Company does not believe that any of the unrealized losses, which were comprised of 84 and 74 investment securities as of December 31, 2016 and December 31, 2015, respectively, represent an other-than-temporary impairment. The gross unrealized losses associated with U.S. Treasury and agency securities, federal agency obligations, mortgage-backed securities, corporate bonds, tax-exempt securities, asset-backed securities, trust preferred securities, mutual funds and equity securities are not considered to be other-than-temporary because management believes these unrealized losses are related to changes in interest rates and do not affect the expected cash flows of the underlying collateral or issuer.
Factors which may contribute to unrealized losses include credit risk, market risk, changes in interest rates, economic cycles, and liquidity risk. The magnitude of any unrealized loss may be affected by the relative concentration of the Company’s investment in any one issuer or industry. The Company has established policies to reduce exposure through diversification of the investment portfolio including limits on concentrations to any one issuer. The Company believes the investment portfolio is prudently diversified.
The unrealized losses included in the tables below are primarily related to changes in interest rates and credit spreads. All of the Company’s investment securities are performing and are expected to continue to perform in accordance with their respective contractual terms and conditions. These are largely intermediate duration holdings and, in certain cases, monthly principal payments can further reduce loss exposure resulting from an increase in rates.
The Company evaluates all securities with unrealized losses quarterly to determine whether the loss is other-than-temporary. Unrealized losses in the corporate debt securities category consist primarily of senior unsecured corporate debt securities issued by large financial institutions, insurance companies and other corporate issuers. Single issuer corporate trust preferred securities are also included, and in the case of one holding the market valuation loss is largely based upon the floating rate coupon and corresponding market valuation. Neither that trust preferred issuer, nor any other corporate issuers, have defaulted on interest payments. The unrealized loss in equity securities consists of losses on other bank equities. The decline in fair value is due in large part to the lack of an active trading market for these securities, changes in market credit spreads and rating agency downgrades. Management concluded that these securities were not other-than-temporarily impaired at December 31, 2016.
In determining whether or not securities are OTTI, the Company must exercise considerable judgment. Accordingly, there can be no assurance that the actual results will not differ from the Company’s judgments and that such differences may not require the future recognition of other-than-temporary impairment charges that could have a material effect on the Company’s financial position and results of operations. In addition, the value of, and the realization of any loss on, an investment security is subject to numerous risks as cited above.
| - 67 - | ||
CONNECTONE BANCORP, INC. AND SUBSIDIARIES
NOTES TO CONSOLIDATED FINANCIAL STATEMENTS
Note 4 - Investment Securities – (continued)
The following tables indicate gross unrealized losses not recognized in income and fair value, aggregated by investment category and the length of time individual securities have been in a continuous unrealized loss position at December 31, 2016 and 2015. There were no investments held-to-maturity as of December 31, 2016.
| December 31, 2016 | |||||||||||||||||||
| Total | Less than 12 Months | 12 Months or Longer | |||||||||||||||||
| Fair Value |
Unrealized Losses |
Fair Value |
Unrealized Losses |
Fair Value |
Unrealized Losses |
||||||||||||||
| (dollars in thousands) | |||||||||||||||||||
| Investment Securities Available-for-Sale: |
|||||||||||||||||||
| Federal agency obligation | $ | 22,672 | $ | (271) | $ | 21,416 | $ | (262) | $ | 1,256 | $ | (9) | |||||||
| Residential mortgage pass-through securities | 50,136 | (944) | 49,817 | (937) | 319 | (7) | |||||||||||||
| Obligations of U.S. states and political subdivisions | 52,307 | (931) | 52,307 | (931) | - | - | |||||||||||||
| Trust preferred securities | 1,427 | (151) | - | - | 1,427 | (151) | |||||||||||||
| Corporate bonds and notes | 15,930 | (375) | 7,671 | (265) | 8,259 | (110) | |||||||||||||
| Asset-backed securities | 13,404 | (286) | 3,743 | (88) | 9,661 | (198) | |||||||||||||
| Other securities | 11,467 | (325) | - | - | 11,467 | (325) | |||||||||||||
| Total Temporarily Impaired Securities | $ | 167,343 | $ | (3,283) | $ | 134,954 | $ | (2,483) | $ | 32,389 | $ | (800) | |||||||
| December 31, 2015 | |||||||||||||||||||
| Total | Less than 12 Months | 12 Months or Longer | |||||||||||||||||
| Fair Value |
Unrealized Losses |
Fair Value |
Unrealized Losses |
Fair Value |
Unrealized Losses |
||||||||||||||
| (dollars in thousands) | |||||||||||||||||||
| Investment Securities Available-for-Sale: |
|||||||||||||||||||
| Federal agency obligation | $ | 6,755 | $ | (50) | $ | 2,770 | $ | (9) | $ | 3,985 | $ | (41) | |||||||
| Residential mortgage pass-through securities | 5,694 | (11) | 5,694 | (11) | — | — | |||||||||||||
| Trust preferred securities | 1,307 | (269) | — | — | 1,307 | (269) | |||||||||||||
| Corporate bonds and notes | 1,961 | (11) | 1,961 | (11) | — | — | |||||||||||||
| Asset-backed securities | 9,773 | (31) | 9,773 | (31) | — | — | |||||||||||||
| Certificates of deposit | 369 | (2) | 369 | (2) | — | — | |||||||||||||
| Equity securities | 307 | (69) | — | — | 307 | (69) | |||||||||||||
| Other securities | 5,417 | (82) | 1,978 | (21) | 3,439 | (61) | |||||||||||||
| Total | $ | 31,583 | $ | (525) | $ | 22,545 | $ | (85) | $ | 9,038 | $ | (440) | |||||||
| Investment Securities Held-to-Maturity: |
|||||||||||||||||||
| Federal agency obligation | 3,228 | (28) | 3,228 | (28) | — | — | |||||||||||||
| Obligations of U.S. states and political subdivisions | 8,341 | (60) | 1,401 | (3) | 6,940 | (57) | |||||||||||||
| Corporate bonds and notes | 993 | (7) | 993 | (7) | — | — | |||||||||||||
| Total | 12,562 | (95) | 5,622 | (38) | 6,940 | (57) | |||||||||||||
| Total Temporarily Impaired Securities | $ | 44,145 | $ | (620) | $ | 28,167 | $ | (123) | $ | 15,978 | $ | (497) | |||||||
Investment securities having a carrying value of approximately $121.9 million and $142.5 million at December 31, 2016 and December 31, 2015, respectively, were pledged to secure public deposits, borrowings, repurchase agreements, Federal Reserve Discount Window and Federal Home Loan Bank advances and for other purposes required or permitted by law. As of December 31, 2016 and December 31, 2015, there were no holdings of securities of any one issuer, other than the U.S. Government and its agencies, in an amount greater than 10% of stockholders’ equity.
| - 68 - | ||
CONNECTONE BANCORP, INC. AND SUBSIDIARIES
NOTES TO CONSOLIDATED FINANCIAL STATEMENTS
Note 5 - Loans and the Allowance for Loan and Lease Losses
Loans held-for-sale
The following table presents loans held-for-sale by loan segment:
| 2016 | 2015 | |||||||
| (in thousands) | ||||||||
| Commercial | $ | 70,105 | $ | - | ||||
| Commercial real estate | 7,712 | |||||||
| Residential mortgage loans | 188 | - | ||||||
| Total carrying amount | $ | 78,005 | $ | - | ||||
As of December 31, 2016, the commercial loans held-for-sale segment included the Company’s entire taxi medallion portfolio, with a carrying value of $65.6 million. As of December 31, 2016 the majority of the taxi medallion portfolio ($63.0 million, or 96%) was designated as nonaccrual.
Loans Receivable
The following table sets forth the composition of the Company’s loan portfolio segments, including net deferred fees, at December 31, 2016 and 2015, respectively:
| 2016 | 2015 | ||||||
| (in thousands) | |||||||
| Commercial | $ | 553,576 | $ | 570,116 | |||
| Commercial real estate | 2,204,710 | 1,966,696 | |||||
| Commercial construction | 486,228 | 328,838 | |||||
| Residential real estate | 232,547 | 233,690 | |||||
| Consumer | 2,380 | 2,454 | |||||
| Gross loans | 3,479,441 | 3,101,794 | |||||
| Net deferred (fees) | (3,609) | (2,787) | |||||
| Total loans receivable | $ | 3,475,832 | $ | 3,099,007 | |||
The loan segments in the above table have unique risk characteristics with respect to credit quality:
| · | The repayment of commercial loans is generally dependent on the creditworthiness and cash flow of borrowers, and if applicable, guarantors, which may be negatively impacted by adverse economic conditions. While the majority of these loans are secured, collateral type, marketing, coverage, valuation and monitoring is not as uniform as in other portfolio classes and recovery from liquidation of such collateral may be subject to greater variability. |
| · | Payment on commercial mortgages is driven principally by operating results of the managed properties or underlying business and secondarily by the sale or refinance of such properties. Both primary and secondary sources of repayment, and value of the properties in liquidation, may be affected to a greater extent by adverse conditions in the real estate market or the economy in general. |
| · | Properties underlying construction, land and land development loans often do not generate sufficient cash flows to service debt and thus repayment is subject to ability of the borrower and, if applicable, guarantors, to complete development or construction of the property and carry the project, often for extended periods of time. As a result, the performance of these loans is contingent upon future events whose probability at the time of origination is uncertain. |
| · | The ability of borrowers to service debt in the residential and consumer loan portfolios is generally subject to personal income which may be impacted by general economic conditions, such as increased unemployment levels. These loans are predominately collateralized by first and/or second liens on single family properties. If a borrower cannot maintain the loan, the Company’s ability to recover against the collateral in sufficient amount and in a timely manner may be significantly influenced by market, legal and regulatory conditions. |
| - 69 - | ||
CONNECTONE BANCORP, INC. AND SUBSIDIARIES
NOTES TO CONSOLIDATED FINANCIAL STATEMENTS
Note 5 - Loans and the Allowance for Loan and Lease Losses – (continued)
Purchased Credit-Impaired Loans
The Company holds purchased loans for which there was, at their acquisition date, evidence of deterioration of credit quality since their origination and it was probable, at acquisition, that all contractually required payments would not be collected. The carrying amount of those loans is as follows at December 31, 2016 and December 31, 2015.
| 2016 | 2015 | |||||||
| (in thousands) | ||||||||
| Commercial | $ | 7,098 | $ | 7,078 | ||||
| Commercial real estate | 982 | 1,775 | ||||||
| Commercial construction | - | - | ||||||
| Residential real estate | - | 328 | ||||||
| Consumer | - | - | ||||||
| Total carrying amount | $ | 8,080 | $ | 9,181 | ||||
For those purchased loans disclosed above, the Company did not increase the allowance for loan and lease losses for the year ended December 31, 2016. No allowances for loan and lease losses were reversed during 2016.
The accretable yield, or income expected to be collected, on the purchased credit-impaired loans above is as follows at December 31, 2016 and December 31, 2015.
| 2016 | 2015 | |||||||
| (in thousands) | ||||||||
| Balance at beginning of period | $ | 3,599 | $ | 4,805 | ||||
| New loans purchased | - | - | ||||||
| Accretion of income | (739) | (1,206) | ||||||
| Reclassifications from nonaccretable difference | - | - | ||||||
| Disposals | - | - | ||||||
| Balance at end of period | $ | 2,860 | $ | 3,599 | ||||
| - 70 - | ||
CONNECTONE BANCORP, INC. AND SUBSIDIARIES
NOTES TO CONSOLIDATED FINANCIAL STATEMENTS
Note 5 - Loans and the Allowance for Loan and Lease Losses – (continued)
Loans Receivable on Nonaccrual Status
The following table presents nonaccrual loans included in loans receivable by loan segment as of the periods presented.
| 2016 | 2015 | |||||||
| (in thousands) | ||||||||
| Commercial | $ | 1,460 | $ | 6,586 | ||||
| Commercial real estate | 1,081 | 9,112 | ||||||
| Commercial construction | - | 1,479 | ||||||
| Residential real estate | 3,193 | 3,559 | ||||||
| Total loans receivable on nonaccrual status | $ | 5,734 | $ | 20,736 | ||||
Nonaccrual loans and loans 90 days or greater past due and still accruing include both smaller balance homogeneous loans that are collectively evaluated for impairment and individually evaluated for impairment.
At December 31, 2016 and 2015, loan balances of approximately $1.7 billion and $1.6 billion, respectively, were pledged to secure borrowings from the Federal Home Loan Bank.
The Company continuously monitors the credit quality of its loans receivable. In addition to its internal monitoring, the Company utilizes the services of a third party loan review firm to periodically validate the credit quality of its loans receivable on a simple basis. Credit quality is monitored by reviewing certain credit quality indicators. Assets classified “Pass” are deemed to possess average to superior credit quality, requiring no more than normal attention. Assets classified as “Special Mention” have generally acceptable credit quality yet possess higher risk characteristics/circumstances than satisfactory assets. Such conditions include strained liquidity, slow pay, stale financial statements, or other conditions that require more stringent attention from the lending staff. These conditions, if not corrected, may weaken the loan quality or inadequately protect the Company’s credit position at some future date. Assets are classified “Substandard” if the asset has a well-defined weakness that requires management’s attention to a greater degree than for loans classified special mention. Such weakness, if left uncorrected, could possibly result in the compromised ability of the loan to perform to contractual requirements. An asset is classified as “Doubtful” if it is inadequately protected by the net worth and/or paying capacity of the obligor or of the collateral, if any, that secures the obligation. Assets classified as doubtful include assets for which there is a “distinct possibility” that a degree of loss will occur if the inadequacies are not corrected. All loans past due 90 days or greater and all impaired loans are included in the appropriate category below. The following table presents information about the loan credit quality by loan segment at December 31, 2016 and 2015:
Credit Quality Indicators
| December 31, 2016 | ||||||||||||||||||||
| Pass | Special Mention | Substandard | Doubtful | Total | ||||||||||||||||
| (in thousands) | ||||||||||||||||||||
| Commercial | $ | 539,961 | $ | 3,255 | $ | 10,360 | $ | - | $ | 553,576 | ||||||||||
| Commercial real estate | 2,154,343 | 31,173 | 19,194 | - | 2,204,710 | |||||||||||||||
| Commercial construction | 480,319 | 3,388 | 2,521 | - | 486,228 | |||||||||||||||
| Residential real estate | 228,990 | - | 3,557 | - | 232,547 | |||||||||||||||
| Consumer | 2,318 | - | 62 | - | 2,380 | |||||||||||||||
| Total loans | $ | 3,405,931 | $ | 37,816 | $ | 35,694 | $ | - | $ | 3,479,441 | ||||||||||
| December 31, 2015 | ||||||||||||||||||||
| Pass | Special Mention | Substandard | Doubtful | Total | ||||||||||||||||
| (in thousands) | ||||||||||||||||||||
| Commercial | $ | 462,358 | $ | 11,760 | $ | 95,998 | $ | - | $ | 570,116 | ||||||||||
| Commercial real estate | 1,919,041 | 18,990 | 28,426 | 239 | 1,966,696 | |||||||||||||||
| Commercial construction | 326,697 | 662 | 1,479 | - | 328,838 | |||||||||||||||
| Residential real estate | 229,426 | - | 4,264 | - | 233,690 | |||||||||||||||
| Consumer | 2,368 | - | 86 | - | 2,454 | |||||||||||||||
| Total loans | $ | 2,939,890 | $ | 31,412 | $ | 130,253 | $ | 239 | $ | 3,101,794 | ||||||||||
| - 71 - | ||
CONNECTONE BANCORP, INC. AND SUBSIDIARIES
NOTES TO CONSOLIDATED FINANCIAL STATEMENTS
Note 5 - Loans and the Allowance for Loan and Lease Losses – (continued)
The following table provides an analysis of the impaired loans by segment at December 31, 2016, 2015 and 2014:
| December 31, 2016 | ||||||||||||||||||||
| (dollars in thousands) | ||||||||||||||||||||
| No Related Allowance Recorded | Recorded Investment | Unpaid Principal Balance | Related Allowance | Average Recorded Investment | Interest Income Recognized | |||||||||||||||
| Commercial | $ | 3,637 | $ | 4,063 | $ | $ | 4,052 | $ | 64 | |||||||||||
| Commercial real estate | 18,288 | 18,288 | 18,532 | 250 | ||||||||||||||||
| Commercial construction | 5,909 | 5,909 | 5,308 | 79 | ||||||||||||||||
| Residential real estate | 1,851 | 2,055 | 1,908 | 19 | ||||||||||||||||
| Consumer | 62 | 62 | 72 | 4 | ||||||||||||||||
| Total | $ | 29,747 | $ | 30,377 | $ | $ | 29,872 | $ | 416 | |||||||||||
| With An Allowance Recorded | ||||||||||||||||||||
| Commercial real estate | $ | 1,244 | $ | 1,244 | $ | 145 | $ | 1,274 | $ | - | ||||||||||
| Total | ||||||||||||||||||||
| Commercial | $ | 3,637 | $ | 4,063 | $ | - | $ | 4,052 | $ | 64 | ||||||||||
| Commercial real estate | 19,532 | 19,532 | 145 | 19,806 | 250 | |||||||||||||||
| Commercial construction | 5,909 | 5,909 | - | 5,308 | 79 | |||||||||||||||
| Residential real estate | 1,851 | 2,055 | - | 1,908 | 19 | |||||||||||||||
| Consumer | 62 | 62 | - | 72 | 4 | |||||||||||||||
| Total (including related allowance) | $ | 30,991 | $ | 31,621 | $ | 145 | $ | 31,146 | $ | 416 | ||||||||||
| December 31, 2015 | ||||||||||||||||||||
| (dollars in thousands) | ||||||||||||||||||||
| No Related Allowance Recorded | Recorded Investment | Unpaid Principal Balance | Related Allowance | Average Recorded Investment | Interest Income Recognized | |||||||||||||||
| Commercial | $ | 610 | $ | 645 | $ | 686 | $ | - | ||||||||||||
| Commercial real estate | 15,517 | 16,512 | 6,363 | 60 | ||||||||||||||||
| Commercial construction | 2,149 | 2,141 | 1,535 | - | ||||||||||||||||
| Residential real estate | 3,954 | 4,329 | 3,322 | 10 | ||||||||||||||||
| Consumer | 87 | 86 | 96 | 5 | ||||||||||||||||
| Total | $ | 22,317 | $ | 23,713 | $ | 12,002 | $ | 75 | ||||||||||||
| With An Allowance Recorded | ||||||||||||||||||||
| Commercial | $ | 84,787 | $ | 84,449 | $ | 6,725 | $ | 55,445 | $ | 1,895 | ||||||||||
| Total | ||||||||||||||||||||
| Commercial | $ | 85,397 | $ | 85,094 | $ | 6,725 | $ | 56,131 | $ | 1,895 | ||||||||||
| Commercial real estate | 15,517 | 16,512 | - | 6,363 | 60 | |||||||||||||||
| Commercial construction | 2,149 | 2,141 | - | 1,535 | ||||||||||||||||
| Residential real estate | 3,954 | 4,329 | - | 3,322 | 10 | |||||||||||||||
| Consumer | 87 | 86 | - | 96 | 5 | |||||||||||||||
| Total | $ | 107,104 | $ | 108,162 | $ | 6,725 | $ | 67,447 | $ | 1,970 | ||||||||||
| - 72 - | ||
CONNECTONE BANCORP, INC. AND SUBSIDIARIES
NOTES TO CONSOLIDATED FINANCIAL STATEMENTS
Note 5 - Loans and the Allowance for Loan and Lease Losses – (continued)
| December 31, 2014 | ||||||||||||||||||||
| (dollars in thousands) | ||||||||||||||||||||
| No Related Allowance Recorded | Recorded Investment | Unpaid Principal Balance | Related Allowance | Average Recorded Investment | Interest Income Recognized | |||||||||||||||
| Commercial | $ | 481 | $ | 527 | $ | 494 | $ | - | ||||||||||||
| Commercial real estate | 5,890 | 6,857 | 6,276 | 129 | ||||||||||||||||
| Residential real estate | 3,072 | 3,406 | 3,170 | 41 | ||||||||||||||||
| Consumer | 109 | 101 | 107 | - | ||||||||||||||||
| Total | $ | 9,552 | $ | 10,891 | $ | 10,047 | $ | 170 | ||||||||||||
| With An Allowance Recorded | ||||||||||||||||||||
| Commercial | $ | 387 | $ | 389 | $ | 111 | $ | 389 | $ | - | ||||||||||
| Commercial real estate | 3,520 | 3,520 | 150 | 3,584 | 171 | |||||||||||||||
| Total | $ | 3,907 | $ | 3,909 | $ | 261 | $ | 3,973 | $ | 171 | ||||||||||
| Total | ||||||||||||||||||||
| Commercial | $ | 868 | $ | 917 | $ | 111 | $ | 883 | $ | - | ||||||||||
| Commercial real estate | 9,410 | 10,107 | 150 | 9,860 | 300 | |||||||||||||||
| Residential real estate | 3,072 | 3,406 | - | 3,170 | 41 | |||||||||||||||
| Consumer | 109 | 101 | - | 106 | - | |||||||||||||||
| Total | $ | 13,459 | $ | 14,531 | $ | 261 | $ | 14,019 | $ | 341 | ||||||||||
Included in the impaired loans table are $13.3 million, $85.9 million and $1.8 million of performing TDRs as of December 31, 2016, 2015 and 2014, respectively. Cash basis interest and interest income recognized on accrual basis approximate each other.
| - 73 - | ||
CONNECTONE BANCORP, INC. AND SUBSIDIARIES
NOTES TO CONSOLIDATED FINANCIAL STATEMENTS
Note 5 - Loans and the Allowance for Loan and Lease Losses – (continued)
The following table provides an analysis of the aging of the loans by segment, excluding net deferred fees that are past due at December 31, 2016 and December 31, 2015 by class:
Aging Analysis:
| December 31, 2016 | ||||||||||||||||||||||||||||
| 30-59 Days Past Due | 60-89 Days Past Due | 90 Days or Greater Past Due and Still Accruing | Nonaccrual | Total Past Due and Nonaccrual | Current | Total Loans Receivable | ||||||||||||||||||||||
| Commercial | $ | 475 | $ | 18 | $ | 4,630 | $ | 1,460 | $ | 6,583 | $ | 546,993 | $ | 553,576 | ||||||||||||||
| Commercial real estate | 4,928 | 1,584 | 663 | 1,081 | 8,256 | 2,196,454 | 2,204,710 | |||||||||||||||||||||
| Commercial construction | - | - | - | - | - | 486,228 | 486,228 | |||||||||||||||||||||
| Residential real estate | 2,131 | 388 | - | 3,193 | 5,712 | 226,835 | 232,547 | |||||||||||||||||||||
| Consumer | - | - | - | - | - | 2,380 | 2,380 | |||||||||||||||||||||
| Total | $ | 7,534 | $ | 1,990 | $ | 5,293 | $ | 5,734 | $ | 20,551 | $ | 3,458,890 | 3,479,441 | |||||||||||||||
| December 31, 2015 | ||||||||||||||||||||||||||||
| 30-59 Days Past Due |
60-89 Days Past Due |
90 Days
or Greater Past Due and Still Accruing |
Nonaccrual | Total
Past Due and Nonaccrual |
Current | Total
Loans Receivable |
||||||||||||||||||||||
| Commercial | $ | 6,178 | $ | 3,505 | $ | - | $ | 6,586 | $ | 16,269 | $ | 553,847 | $ | 570,116 | ||||||||||||||
| Commercial real estate | 1,998 | 988 | - | 9,112 | 12,098 | 1,954,598 | 1,966,696 | |||||||||||||||||||||
| Commercial construction | - | - | - | 1,479 | 1,479 | 327,359 | 328,838 | |||||||||||||||||||||
| Residential real estate | - | - | - | 3,559 | 3,559 | 230,131 | 233,690 | |||||||||||||||||||||
| Consumer | 4 | 9 | - | - | 13 | 2,441 | 2,454 | |||||||||||||||||||||
| Total | $ | 8,180 | $ | 4,502 | $ | - | $ | 20,736 | $ | 33,418 | $ | 3,068,376 | 3,101,794 | |||||||||||||||
Included in the 90 days or greater and still accruing are PCI loans, net of their fair value marks, which are accreting income per their valuation at date of acquisition.
| - 74 - | ||
CONNECTONE BANCORP, INC. AND SUBSIDIARIES
NOTES TO CONSOLIDATED FINANCIAL STATEMENTS
Note 5 - Loans and the Allowance for Loan and Lease Losses – (continued)
The following tables detail, at the period-end presented, the amount of gross loans (excluding loans held-for-sale) that are evaluated individually, and collectively, for impairment, those acquired with deteriorated quality, and the related portion of the allowance for loan and lease losses that are allocated to each loan portfolio segment:
| December 31, 2016 | ||||||||||||||||||||||||||||
| Commercial | Commercial real estate | Commercial construction | Residential real estate | Consumer | Unallocated | Total | ||||||||||||||||||||||
| (in thousands) | ||||||||||||||||||||||||||||
| Allowance for loan and lease losses | ||||||||||||||||||||||||||||
| Individually evaluated for impairment | $ | - | $ | 145 | $ | - | $ | - | $ | - | $ | - | $ | 145 | ||||||||||||||
| Collectively evaluated for impairment | 6,632 | 12,438 | 4,789 | 958 | 3 | 779 | 25,599 | |||||||||||||||||||||
| Acquired portfolio | - | - | - | - | - | - | - | |||||||||||||||||||||
| Acquired with deteriorated credit quality | - | - | - | - | - | - | - | |||||||||||||||||||||
| Total | $ | 6,632 | $ | 12,583 | $ | 4,789 | $ | 958 | $ | 3 | $ | 779 | $ | 25,744 | ||||||||||||||
| Gross loans | ||||||||||||||||||||||||||||
| Individually evaluated for impairment | $ | 3,637 | $ | 19,532 | $ | 5,909 | $ | 1,851 | $ | 62 | $ | 30,991 | ||||||||||||||||
| Collectively evaluated for impairment | 517,869 | 1,621,745 | 478,865 | 163,686 | 1,757 | 2,783,922 | ||||||||||||||||||||||
| Acquired portfolio | 24,972 | 562,451 | 1,454 | 67,010 | 561 | 656,448 | ||||||||||||||||||||||
| Acquired with deteriorated credit quality | 7,098 | 982 | - | - | - | 8,080 | ||||||||||||||||||||||
| Total | $ | 553,576 | $ | 2,204,710 | $ | 486,228 | $ | 232,547 | $ | 2,380 | $ | 3,479,441 | ||||||||||||||||
| December 31, 2015 | ||||||||||||||||||||||||||||
| Commercial | Commercial real estate | Commercial construction | Residential real estate | Consumer | Unallocated | Total | ||||||||||||||||||||||
| (in thousands) | ||||||||||||||||||||||||||||
| Allowance for loan and lease losses | ||||||||||||||||||||||||||||
| Individually evaluated for impairment | $ | 6,725 | $ | - | $ | - | $ | - | $ | - | $ | - | $ | 6,725 | ||||||||||||||
| Collectively evaluated for impairment | 4,224 | 10,926 | 3,253 | 976 | 4 | 464 | 19,847 | |||||||||||||||||||||
| Acquired portfolio | - | - | - | - | - | - | - | |||||||||||||||||||||
| Acquired with deteriorated credit quality | - | - | - | - | - | - | - | |||||||||||||||||||||
| Total | $ | 10,949 | $ | 10,926 | $ | 3,253 | $ | 976 | $ | 4 | $ | 464 | $ | 26,572 | ||||||||||||||
| Gross loans | ||||||||||||||||||||||||||||
| Individually evaluated for impairment | $ | 85,397 | $ | 15,517 | $ | 2,149 | $ | 3,954 | $ | 87 | $ | 107,104 | ||||||||||||||||
| Collectively evaluated for impairment | 395,424 | 1,269,140 | 315,785 | 136,633 | 1,649 | 2,118,631 | ||||||||||||||||||||||
| Acquired portfolio | 82,217 | 680,264 | 10,904 | 92,775 | 718 | 866,878 | ||||||||||||||||||||||
| Acquired with deteriorated credit quality | 7,078 | 1,775 | - | 328 | - | 9,181 | ||||||||||||||||||||||
| Total | $ | 570,116 | $ | 1,966,696 | $ | 328,838 | $ | 233,690 | $ | 2,454 | $ | 3,101,794 | ||||||||||||||||
| - 75 - | ||
CONNECTONE BANCORP, INC. AND SUBSIDIARIES
NOTES TO CONSOLIDATED FINANCIAL STATEMENTS
Note 5 - Loans and the Allowance for Loan and Lease Losses – (continued)
The Company’s allowance for loan and lease losses is analyzed quarterly. Many factors are considered, including growth in the portfolio, delinquencies, nonaccrual loan levels, and other factors inherent in the extension of credit.
A summary of the activity in the allowance for loan and lease losses is as follows:
| Year Ended December 31, 2016 | ||||||||||||||||||||||
| (dollars in thousands) | ||||||||||||||||||||||
| Commercial | Commercial real estate |
Commercial construction |
Residential real estate |
Consumer | Unallocated | Total | ||||||||||||||||
| Balance at January 1, 2016 | $ | 10,949 | $ | 10,926 | $ | 3,253 | $ | 976 | $ | 4 | $ | 464 | $ | 26,572 | ||||||||
| Loan charge-offs | (39,343) | (107) | - | (94) | (29) | - | (39,573) | |||||||||||||||
| Recoveries | 4 | 35 | - | 3 | 3 | - | 45 | |||||||||||||||
| Provision for loan and lease losses | 35,022 | 1,729 | 1,536 | 73 | 25 | 315 | 38,700 | |||||||||||||||
| Balance at December 31, 2016 | $ | 6,632 | $ | 12,583 | $ | 4,789 | $ | 958 | $ | 3 | $ | 779 | $ | 25,744 | ||||||||
| Year Ended December 31, 2015 | ||||||||||||||||||||||
| (dollars in thousands) | ||||||||||||||||||||||
| Commercial | Commercial real estate |
Commercial construction |
Residential real estate |
Consumer | Unallocated | Total | ||||||||||||||||
| Balance at January 1, 2015 | $ | 3,083 | $ | 7,799 | $ | 1,239 | $ | 1,113 | $ | 7 | $ | 919 | $ | 14,160 | ||||||||
| Loans charge-offs | (101) | (406) | - | - | (31) | - | (538) | |||||||||||||||
| Recoveries | 13 | 327 | - | 2 | 3 | - | 345 | |||||||||||||||
| Provision for loan and lease losses | 7,954 | 3,206 | 2,014 | (139) | 25 | (455) | 12,605 | |||||||||||||||
| Balance at December 31, 2015 | $ | 10,949 | $ | 10,926 | $ | 3,253 | $ | 976 | $ | 4 | $ | 464 | $ | 26,572 | ||||||||
| Year Ended December 31, 2014 | ||||||||||||||||||||||
| (dollars in thousands) | ||||||||||||||||||||||
| Commercial | Commercial real estate |
Commercial construction |
Residential real estate |
Consumer | Unallocated | Total | ||||||||||||||||
| Balance at January 1, 2014 | $ | 1,698 | $ | 5,746 | $ | 362 | $ | 990 | $ | 146 | $ | 1,391 | $ | 10,333 | ||||||||
| Loans charge-off | (379) | (398) | - | (159) | - | - | (936) | |||||||||||||||
| Recoveries | 50 | - | - | 19 | 11 | - | 80 | |||||||||||||||
| Provision for loan and lease losses | 1,714 | 2,451 | 877 | 263 | (150) | (472) | 4,683 | |||||||||||||||
| Balance at December 31, 2014 | $ | 3,083 | $ | 7,799 | $ | 1,239 | $ | 1,113 | $ | 7 | $ | 919 | $ | 14,160 | ||||||||
For the year ended, the loan charge-offs within the commercial loan segment were primarily made up of $36.7 million in charge-offs related to the taxi medallion portfolio and a $1.1 million charge related to a lease financing receivable of the former Union Center operations building.
The $36.7 million charge on the taxi medallion portfolio occurred in conjunction with the transfer of the taxi medallion loans to loans held-for-sale. The amount transferred to loans held-for-sale as of December 31, 2016 had a carrying value of $65.6 million following the charge-off.
Troubled Debt Restructurings
Loans are considered to have been modified in a troubled debt restructuring (“TDRs”) when due to a borrower’s financial difficulties, the Company makes certain concessions to the borrower that it would not otherwise consider. Modifications may include interest rate reductions, principal or interest forgiveness, forbearance, and other actions intended to minimize economic loss and to avoid foreclosure or repossession of collateral. Generally, a nonaccrual loan that has been modified in a troubled debt restructuring remains on nonaccrual status for a period of six months to demonstrate that the borrower is able to meet the terms of the modified loan. However, performance prior to the modification, or significant events that coincide with the modification, are included in assessing whether the borrower can meet the new terms and may result in the loan being returned to accrual status at the time of loan modification or after a shorter performance period. If the borrower’s ability to meet the revised payment schedule is uncertain, the loan remains on nonaccrual status.
At December 31, 2016, there were no commitments to lend additional funds to borrowers whose loans were on nonaccrual status or were contractually past due 90 days or greater and still accruing interest, or whose terms have been modified in troubled debt restructurings.
| - 76 - | ||
CONNECTONE BANCORP, INC. AND SUBSIDIARIES
NOTES TO CONSOLIDATED FINANCIAL STATEMENTS
Note 5 - Loans and the Allowance for Loan and Lease Losses – (continued)
The following table presents loans by segment modified as troubled debt restructurings and the related changes to the allowance for loan and leases losses that occurred during the year ended December 31, 2016 and December 31, 2015 (dollars in thousands):
| December 31, 2016 | December 31, 2015 | |||||||||||
| Recorded | Recorded | |||||||||||
| Investment | ALLL | Investment | ALLL | |||||||||
| Troubled debt restructurings | ||||||||||||
| Beginning balance | $ | 86,629 | $ | 4,500 | $ | 2,788 | $ | - | ||||
| Additions | 26,325 | 8,250 | 84,290 | 4,500 | ||||||||
| Payoffs/paydowns | (2,616) | - | (449) | |||||||||
| Transfers | (96,520) | - | - | |||||||||
| Other | - | (12,750) | - | - | ||||||||
| Ending balance | $ | 13,818 | $ | - | $ | 86,629 | $ | 4,500 | ||||
Loans modified in troubled debt restructurings totaled $13.8 million at December 31, 2016, of which $0.5 million were on nonaccrual status, $13.3 million were performing under restructured terms. At December 31, 2015, loans modified in troubled debt restructurings totaled $86.6 million, of which $0.7 million were on nonaccrual status and $85.9 million were performing under restructured terms.
During the year, approximately $96.5 million of taxi medallion loans were transferred to the loans held-for-sale category and, concurrently, were made nonaccrual. Prior to the transfer, the taxi medallion loans modified in a troubled debt restructuring had a specific reserve of $12.5 million, which was charged-off as part of the transfer of the entire taxi medallion loan portfolio to loans held-for-sale.
The following table presents loans by segment modified as troubled debt restructurings that occurred during the year ended December 31, 2016 (dollars in thousands):
| Pre-Modification | Post-Modification | |||||||
| Outstanding | Outstanding | |||||||
| Number of | Recorded | Recorded | ||||||
| Loans | Investment | Investment | ||||||
| Troubled debt restructurings: | ||||||||
| Commercial | 19 | $ | 22,420 | $ | 22,420 | |||
| Commercial real estate | 3 | 2,155 | 2,155 | |||||
| Commercial construction | 1 | 1,750 | 1,750 | |||||
| Residential real estate | - | - | - | |||||
| Consumer | - | - | - | |||||
| Total | 23 | $ | 26,325 | $ | 26,325 | |||
Included in the above troubled debt restructurings were 15 loans secured by 27 New York City taxi medallions totaling $18.5 million as of the date of the respective modifications. These loan modifications included interest rate reductions and maturity extensions. All 15 loans were accruing prior to modification, while 14 remained in accrual status post-modification. As of December 31, 2016, the taxi medallion loans that were modified in a troubled debt restructuring in 2016 were transferred to the loans held-for-sale category (along with the 2015 taxi medallion modified troubled debt restructurings) and, concurrently, were put on nonaccrual.
There were no charge-offs in connection with a loan modification at the time of modification during the year ended December 31, 2016. There were no troubled debt restructurings for which there was a payment default within twelve months following the modification during the year ended December 31, 2016.
| - 77 - | ||
CONNECTONE BANCORP, INC. AND SUBSIDIARIES
NOTES TO CONSOLIDATED FINANCIAL STATEMENTS
Note 5 - Loans and the Allowance for Loan and Lease Losses – (continued)
The following table presents loans by segment modified as troubled debt restructurings that occurred during the year ended December 31, 2015 (dollars in thousands):
| Pre-Modification | Post-Modification | |||||||
| Outstanding | Outstanding | |||||||
| Number of | Recorded | Recorded | ||||||
| Loans | Investment | Investment | ||||||
| Troubled debt restructurings: | ||||||||
| Commercial | 48 | $ | 78,466 | $ | 78,466 | |||
| Commercial real estate | 3 | 5,049 | 5,049 | |||||
| Commercial construction | 1 | 661 | 661 | |||||
| Residential real estate | 1 | 110 | 110 | |||||
| Consumer | 1 | 4 | 4 | |||||
| Total | 54 | $ | 84,290 | $ | 84,290 | |||
The increase in TDRs was due to loans secured by New York City taxi medallions that were modified during the second quarter of 2015. The modifications consisted of a deferral of principal amortization from approximately 25-30 year amortization to interest-only. There was no extension of the loans’ contractual maturity dates, there was no forgiveness of principal, and the interest rates on these loans were increased from approximately 3%-3.25% to 3.75%. These loans were accruing prior to modification and remained in accrual status post-modification.
There were no charge-offs in connection with a loan modification at the time of modification during the year ended December 31, 2015. There were no troubled debt restructurings for which there was a payment default within twelve months following the modification during the year ended December 31, 2015.
The following table presents loans by segment modified as troubled debt restructurings that occurred during the year ended December 31, 2014 (dollars in thousands):
| Pre-Modification | Post-Modification | |||||||
| Outstanding | Outstanding | |||||||
| Number of | Recorded | Recorded | ||||||
| Loans | Investment | Investment | ||||||
| Troubled debt restructurings: | ||||||||
| Commercial | 1 | $ | 672 | $ | 289 | |||
| Commercial real estate | - | - | - | |||||
| Commercial construction | - | - | - | |||||
| Residential real estate | 2 | 275 | 272 | |||||
| Total | 3 | $ | 947 | $ | 561 | |||
The TDRs presented as of December 31, 2014 did not increase the allowance for loan and lease losses and resulted in charge-offs of $333,000 during the year ended December 31, 2014. There were no troubled debt restructurings for which there was a payment default within twelve months following the modification during the year ended December 31, 2014.
Note 6 - Premises and Equipment
Premises and equipment are summarized as follows:
| Estimated | |||||||||
| Useful Life | |||||||||
| (Years) | 2016 | 2015 | |||||||
| (dollars in Thousands) | |||||||||
| Land | - | $ | 2,403 | $ | 2,403 | ||||
| Buildings | 20-40 | 16,027 | 16,490 | ||||||
| Furniture, fixtures and equipment | 3-7 | 29,039 | 27,235 | ||||||
| Leasehold improvements | 10-20 | 12,908 | 12,230 | ||||||
| Subtotal | 60,377 | 58,358 | |||||||
| Less: accumulated depreciation and amortization | 37,700 | 35,291 | |||||||
| Subtotal | 22,677 | 23,067 | |||||||
| Less: fair value adjustment for acquired leases | (602) | (734) | |||||||
| Total premises and equipment, net | $ | 22,075 | $ | 22,333 | |||||
Depreciation and amortization expense of premises and equipment was $2.7 million, $2.3 million and $1.5 million for 2016, 2015 and 2014, respectively.
| - 78 - | ||
CONNECTONE BANCORP, INC. AND SUBSIDIARIES
NOTES TO CONSOLIDATED FINANCIAL STATEMENTS
Note 6 - Premises and Equipment – (continued)
Capital Leases: As a result of the Merger, the Company acquired a lease agreement for a building under a capital lease. The lease arrangement requires monthly payments through 2028.
The Company has included this lease in premises and equipment as follows (dollars in thousands):
| 2016 | 2015 | |||||||
| Capital Lease | $ | 3,422 | $ | 3,422 | ||||
| Less: accumulated amortization | 1,369 | 1,198 | ||||||
| $ | 2,053 | $ | 2,224 | |||||
The following is a schedule by year of future minimum lease payments under the capitalized lease, together with the present value of net minimum lease payments at December 31, 2016 (dollars in thousands):
| 2017 | $ | 292 | ||
| 2018 | 294 | |||
| 2019 | 321 | |||
| 2020 | 321 | |||
| 2021 | 321 | |||
| Thereafter | 2,376 | |||
| Total minimum lease payments | 3,925 | |||
| Less amount representing interest | 1,162 | |||
| Present value of net minimum lease payments | $ | 2,763 |
Operating Leases: Occupancy and equipment expense includes rentals for premises and equipment of $2.5 million in 2016, $2.1 million in 2015 and $1.6 million in 2014. At December 31, 2016, the Company was obligated under a number of non-cancelable leases for premises and equipment, many of which provide for increased rentals based upon increases in real estate taxes and the cost of living index. These leases, most of which have renewal provisions, are principally operating leases.
Future minimum lease payments under these leases are as follows (dollars in thousands):
| 2017 | $ | 2,149 | ||
| 2018 | 2,131 | |||
| 2019 | 2,003 | |||
| 2020 | 1,851 | |||
| 2021 | 1,565 | |||
| Thereafter | 6,400 |
Note 7 - Goodwill and Other Intangible Assets
A goodwill impairment test is required under ASC 350, Intangibles – Goodwill and Other, and the FASB issued ASU No. 2011-08, “Testing Goodwill for Impairment,” allowing an initial qualitative assessment of goodwill commonly known as step zero impairment testing. In general, the step zero test allows an entity to first assess qualitative factors to determine whether it is more likely than not (i.e., more than 50%) that the fair value of a reporting unit is less than its carrying value. If a step zero impairment test results in the conclusion that it is more likely than not that the fair value of the reporting unit exceeds its carrying value, then no further testing is required.
Step zero impairment testing is an assessment of qualitative factors that affect the likelihood of impairment. Based upon management’s review, the Company’s intangible assets were not impaired and there has been no impairment through December 31, 2016. Management concludes that the ASC 350 goodwill step zero test has been passed, and no further testing is required.
| - 79 - | ||
CONNECTONE BANCORP, INC. AND SUBSIDIARIES
NOTES TO CONSOLIDATED FINANCIAL STATEMENTS
Note 7 - Goodwill and Other Intangible Assets - continued
Goodwill
The change in goodwill during the year is as follows (dollars in thousands):
| 2016 | 2015 | |||||||
| Beginning of year | $ | 145,909 | $ | 145,909 | ||||
| Acquired goodwill | - | - | ||||||
| Impairment | - | - | ||||||
| End of year | $ | 145,909 | $ | 145,909 | ||||
Acquired Intangible Assets
The table below provides information regarding the carrying amounts and accumulated amortization of total amortized intangible assets as of the dates set forth below.
| Gross Carrying Amount |
Accumulated Amortization |
Net Carrying Amount |
|||||||||
| (dollars in thousands) | |||||||||||
| As of December 31, 2016: | |||||||||||
| Core deposit intangibles | $ | 6,011 | $ | (2,923) | $ | 3,088 | |||||
| As of December 31, 2015: | |||||||||||
| Core deposit intangibles | $ | 6,011 | $ | (2,103) | $ | 3,908 | |||||
Aggregate amortization expense was $820,000, $917,000 and $507,000 for 2016, 2015 and 2014, respectively. Estimated amortization expense for each of the next five years (in thousands):
| 2017 | $ | 724 | ||
| 2018 | 627 | |||
| 2019 | 531 | |||
| 2020 | 434 | |||
| 2021 | 338 |
Note 8 – Deposits
Time Deposits
As of December 31, 2016 and 2015, the Company's total time deposits were $968.1 million and $774.7 million, respectively. As of December 31, 2016, the contractual maturities of these time deposits were as follows:
| (dollars in thousands) | Amount | |||
| 2017 | $ | 518,913 | ||
| 2018 | 302,698 | |||
| 2019 | 119,925 | |||
| 2020 | 20,167 | |||
| 2021 | 6,433 | |||
| Total | $ | 968,136 | ||
The amount of time deposits with balances of $250,000 or more was $106.5 million and $142.8 million as of December 31, 2016 and 2015, respectively.
| - 80 - | ||
CONNECTONE BANCORP, INC. AND SUBSIDIARIES
NOTES TO CONSOLIDATED FINANCIAL STATEMENTS
Note 9 – FHLB Borrowings
The Company’s FHLB borrowings and weighted average interest rates are summarized below:
| December 31, 2016 | December 31, 2015 | |||||||||||||||
| Amount | Rate | Amount | Rate | |||||||||||||
| (in thousands) | ||||||||||||||||
| Total FHLB borrowings | $ | 461,280 | 1.55 | % | $ | 656,587 | 1.26% | |||||||||
| By remaining period to maturity: | ||||||||||||||||
| One year or less | $ | 231,280 | 1.02 | % | 270,587 | 0.64% | ||||||||||
| One to two years | 130,000 | 1.84 | % | 156,000 | 1.13% | |||||||||||
| Two to three years | 35,000 | 1.60 | % | 130,000 | 1.84% | |||||||||||
| Three to four years | 65,000 | 2.82 | % | 35,000 | 1.60% | |||||||||||
| Four to five years | - | 65,000 | 2.82% | |||||||||||||
| Total borrowings | $ | 461,280 | 1.55 | % | $ | 656,587 | 1.26% | |||||||||
The FHLB borrowings are secured by pledges of certain collateral including, but not limited to, U.S. government and agency mortgage-backed securities and a blanket assignment of qualifying first lien mortgage loans, consisting of both residential mortgages and commercial real estate loans.
Three of the FHLB notes ($2.5 million and $7.5 million each due April 2, 2018, and $5.0 million due July 16, 2018) contain a convertible option which allows the FHLB, at quarterly intervals, to convert the fixed convertible advance into replacement funding for the same or lesser principal based on any advance then offered by the FHLB at its current market rate. The Company has the option to repay these advances, if converted, without penalty. The remaining advances are payable at stated maturity, with a prepayment penalty for fixed rate advances. All FHLB advances are fixed rate. The advances at December 2016 were primarily collateralized by approximately $1.3 billion of commercial mortgage loans, net of required over collateralization amounts, under a blanket lien arrangement. At December 31, 2016 the Company had remaining borrowing capacity of approximately at FHLB of $744 million.
Note 10 – Securities Sold under Agreements to Repurchase
The Company has entered into agreements under which it has sold securities subject to an obligation to repurchase the same or similar securities. Under these arrangements, the Company may transfer legal control over the assets but still retain effective control through an agreement that both entitles and obligates the Company to repurchase the assets. The obligation to repurchase the securities is reflected as a liability in the Company’s consolidated statement of condition, while the securities underlying the securities sold under agreements to repurchase remain in the respective asset accounts and are delivered to and held as collateral by third party trustees.
Repurchase agreements are secured borrowings. The Company pledges investment securities to secure those borrowings. Information concerning repurchase agreements is summarized as follows:
| 2016 | 2015 | 2014 | ||||||||||
| Average daily balance during the year | $ | 15,000 | $ | 22,890 | $ | 31,000 | ||||||
| Average interest rate during the year | 5.95 | % | 5.92 | % | 5.90 | % | ||||||
| Maximum month-end balance during the year | $ | 15,000 | $ | 31,000 | $ | 31,000 | ||||||
| Weighted average interest rate during the year | 5.95 | % | 5.92 | % | 5.90 | % | ||||||
| - 81 - | ||
CONNECTONE BANCORP, INC. AND SUBSIDIARIES
NOTES TO CONSOLIDATED FINANCIAL STATEMENTS
Note 10 – Securities Sold under Agreements to Repurchase - (continued)
The table below shows the remaining contractual maturity of agreement by fair value of collateral pledged:
| 2016 | ||||||||||||||||||||
| Remaining Contractual Maturity of the Agreements | ||||||||||||||||||||
| Overnight and Continuous | Up to 30 Days | 30-90 Days | Greater Than 90 Days | Total | ||||||||||||||||
| Repurchase agreements and repurchase-to-maturity transactions: | ||||||||||||||||||||
| U.S. Treasury and agency securities | $ | - | $ | - | $ | - | $ | - | $ | - | ||||||||||
| Residential mortgage pass-through securities | - | - | - | 16,826 | 16,826 | |||||||||||||||
| Total Borrowings | $ | - | $ | - | $ | - | $ | 16,826 | $ | 16,826 | ||||||||||
| Amounts related to agreements not included in offsetting disclosure in Note 13. | $ | 1,826 | ||||||||||||||||||
| 2015 | ||||||||||||||||||||
| Remaining Contractual Maturity of the Agreements | ||||||||||||||||||||
| Overnight and Continuous | Up to 30 Days | 30-90 Days | Greater Than 90 Days | Total | ||||||||||||||||
| Repurchase agreements and repurchase-to-maturity transactions: | ||||||||||||||||||||
| U.S. Treasury and agency securities | $ | - | $ | - | $ | - | $ | 6,313 | $ | 6,313 | ||||||||||
| Residential mortgage pass-through securities | - | - | - | 12,589 | 12,589 | |||||||||||||||
| Total Borrowings | $ | - | $ | - | $ | - | $ | 18,902 | $ | 18,902 | ||||||||||
| Amounts related to agreements not included in offsetting disclosure in Note 13. | $ | 3,902 | ||||||||||||||||||
The fair value of securities pledged to secure repurchase agreement may decline. The Company manages this risk by having a policy to pledge securities valued at 8% above the gross outstanding balance of repurchase agreement. Securities sold under agreements to repurchase are secured by securities with a carrying amount of $16.8 million and $18.9 million at year-end 2016 and 2015.
Note 11 - Subordinated Debentures
During 2003, the Company formed a statutory business trust, which exists for the exclusive purpose of (i) issuing Trust Securities representing undivided beneficial interests in the assets of the Trust; (ii) investing the gross proceeds of the Trust securities in junior subordinated deferrable interest debentures (subordinated debentures) of the Company; and (iii) engaging in only those activities necessary or incidental thereto. On December 19, 2003, Center Bancorp Statutory Trust II, a statutory business trust and wholly-owned subsidiary of the Parent Corporation issued $5.0 million of, MMCapS capital securities to investors due on January 23, 2034. The capital securities presently qualify as Tier 1 capital. The trust loaned the proceeds of this offering to the Company and received in exchange $5.2 million of the Parent Corporation’s subordinated debentures. The subordinated debentures are redeemable in whole or in part prior to maturity. The floating interest rate on the subordinate debentures is three-month LIBOR plus 2.85% and reprices quarterly. The rate at December 31, 2016 was 3.74%. These subordinated debentures and the related income effects are not eliminated in the consolidated financial statements as the statutory business trust is not consolidated in accordance with FASB ASC 810-10. Distributions on the subordinated debentures owned by the subsidiary trust have been classified as interest expense in the Consolidated Statements of Income.
The following table summarizes the mandatory redeemable trust preferred securities of the Company’s Statutory Trust II at December 31, 2016 and December 31, 2015.
| Issuance Date | Securities Issued |
Liquidation Value | Coupon Rate | Maturity | Redeemable by Issuer Beginning |
|||||||
| 12/19/2003 | $ | 5,000,000 | $1,000 per Capital Security | Floating 3-month LIBOR + 285 Basis Points | 01/23/2034 | 01/23/2009 | ||||||
| - 82 - | ||
CONNECTONE BANCORP, INC. AND SUBSIDIARIES
NOTES TO CONSOLIDATED FINANCIAL STATEMENTS
Note 11 - Subordinated Debentures - continued
In June 2015, the Parent Corporation issued $50.0 million in aggregate principal amount of fixed-to-floating rate subordinated notes (the “Notes”). The Notes are non-callable for five years, have a stated maturity of July 1, 2025, and bear interest at a fixed rate of 5.75% per year, from and including June 30, 2015 to, but excluding July 1, 2020. From and including July 1, 2020 to the maturity date or early redemption date, the interest rate will reset quarterly to a level equal to the then current three-month LIBOR rate plus 393 basis points. As of December 31, 2016, unamortized costs related to the debt issuance were $621,000.
Note 12 - Income Taxes
The current and deferred amounts of income tax expense for 2016, 2015 and 2014 are as follows (dollars in thousands):
| 2016 | 2015 | 2014 | ||||||||
| Current: | ||||||||||
| Federal | $ | 10,173 | $ | 22,512 | $ | 7,715 | ||||
| State | (366) | 907 | 946 | |||||||
| Subtotal | 9,807 | 23,419 | 8,661 | |||||||
| Deferred: | ||||||||||
| Federal | 2,682 | (3,835) | 223 | |||||||
| State | (713) | 342 | (39) | |||||||
| Subtotal | 1,969 | (3,493) | 184 | |||||||
| Income tax expense | $ | 11,776 | $ | 19,926 | $ | 8,845 | ||||
Actual income tax expense differs from the tax computed based on pre-tax income and the applicable statutory federal tax rate for the following reasons (dollars in thousands):
| 2016 | 2015 | 2014 | ||||||||||
| Income before income tax expense | $ | 42,858 | $ | 61,237 | $ | 27,410 | ||||||
| Federal statutory rate | 35 | % | 35 | % | 35 | % | ||||||
| Computed “expected” Federal income tax expense | 15,000 | 21,433 | 9,593 | |||||||||
| State tax, net of Federal tax benefit | (701) | 812 | 589 | |||||||||
| Bank owned life insurance | (896) | (624) | (456) | |||||||||
| Tax-exempt interest and dividends | (1,714) | (1,584) | (1,511) | |||||||||
| Other, net | 87 | (111) | 630 | |||||||||
| Income tax | $ | 11,776 | $ | 19,926 | $ | 8,845 | ||||||
| - 83 - | ||
CONNECTONE BANCORP, INC. AND SUBSIDIARIES
NOTES TO CONSOLIDATED FINANCIAL STATEMENTS
Note 12 - Income Taxes - continued
The tax effects of temporary differences that give rise to significant portions of the deferred tax asset and deferred tax liability at December 31, 2016 and 2015 are presented in the following table:
| 2016 | 2015 | ||||||
| (dollars in thousands) | |||||||
| Deferred tax assets: | |||||||
| Nonaccrual interest | $ | 470 | $ | 349 | |||
| Allowance for loan and lease losses | 10,374 | 10,798 | |||||
| Pension actuarial losses | 2,439 | 2,605 | |||||
| Purchase accounting | 4,881 | 7,195 | |||||
| Deferred compensation | 2,277 | 1,479 | |||||
| Unrealized losses on securities and SWAPs | - | 445 | |||||
| Deferred loan costs, net of fees | 613 | 460 | |||||
| Accrued rent | 617 | 530 | |||||
| Other | 14 | 25 | |||||
| New Jersey net operating loss | 1,004 | - | |||||
| Capital lease | 139 | 427 | |||||
| Total deferred tax assets | $ | 22,828 | $ | 24,313 | |||
| Deferred tax liabilities: | |||||||
| Employee benefit plans | $ | (2,275) | $ | (1,370) | |||
| Depreciation | (1,039) | (1,001) | |||||
| Market discount accretion | (235) | (41) | |||||
| Prepaid expenses | (345) | (341) | |||||
| Unrealized gains on securities and SWAPs | (449) | - | |||||
| Other | (33) | (27) | |||||
| Total deferred tax liabilities | (4,376) | (2,780) | |||||
| Net deferred tax assets | $ | 18,452 | $ | 21,533 | |||
In assessing the realization of deferred tax assets, management considers whether it is more likely than not that some portion or all of the deferred tax assets will not be realized. The ultimate realization of deferred tax assets for state purposes is dependent upon the generation of future taxable income during periods in which those temporary differences become deductible, while for Federal purposes the deferred tax assets can also be realized through tax carrybacks. Management considers the scheduled reversal of deferred tax liabilities, the projected future taxable income, and tax planning strategies in making this assessment. During 2016 and 2015, based on the level of historical taxable income and projections for future taxable income over the periods in which the deferred tax assets are deductible, the Company believes the net deferred tax assets are more likely than not to be realized.
The Company’s federal income tax returns are open and subject to examination from the 2013 tax return year and forward. The Company’s state income tax returns are generally open from the 2012 and later tax return years based on individual state statutes of limitations.
Note 13 – Offsetting Assets and Liabilities
Certain financial instrument-related assets and liabilities may be eligible for offset on the consolidated statements of condition because they are subject to master netting agreements or similar agreements. However, the Company does not elect to offset such arrangements on the consolidated financial statements. The Company enters into interest rate swap agreements with financial institution counterparties. For additional detail regarding interest rate swap agreements refer to Note 21 within this section. In the event of default on, or termination of, any one contract, both parties have the right to net settle multiple contracts. Also, certain interest rate swap agreements may require the Company to receive or pledge cash or financial instrument collateral based on the contract provisions.
| - 84 - | ||
CONNECTONE BANCORP, INC. AND SUBSIDIARIES
NOTES TO CONSOLIDATED FINANCIAL STATEMENTS
Note 13 – Offsetting Assets and Liabilities - continued
The Company also entered into an agreement to sell securities subject to an obligation to repurchase the same or similar securities, referred to as a repurchase agreement. Under this agreement, the Company may transfer legal control over the assets but still retain effective control through an agreement that both entitles and obligates the Company to repurchase the assets. The obligation to repurchase the securities is reflected as a liability in the Company’s consolidated statement of condition, while the securities underlying the repurchase agreements remain in the respective investment securities account, therefore there is no offsetting or netting of the investment securities assets with the repurchase agreement liability. The following table presents information about financial instruments that are eligible for offset as of December 31, 2016 and December 31, 2015:
| Gross Amounts Not Offset | ||||||||||||||||||||||||
| Gross Amounts Recognized | Gross Amounts Offset in the Statement of Financial Position | Net Amounts of Assets Presented in the Statement of Financial Position | Financial Instruments Recognized | Cash or Financial Instrument Collateral | Net Amount | |||||||||||||||||||
| (in thousands) | ||||||||||||||||||||||||
| December 31, 2016 | ||||||||||||||||||||||||
| Assets: | ||||||||||||||||||||||||
| Interest rate swaps | $ | 88 | $ | - | $ | 88 | $ | - | $ | - | $ | 88 | ||||||||||||
| Liabilities: | ||||||||||||||||||||||||
| Repurchase agreements | $ | 15,000 | $ | - | 15,000 | - | 15,000 | - | ||||||||||||||||
| December 31, 2015 | ||||||||||||||||||||||||
| Liabilities: | ||||||||||||||||||||||||
| Interest rate swaps | $ | 131 | $ | - | $ | 131 | $ | - | $ | - | $ | - | ||||||||||||
| Repurchase agreements | 15,000 | - | 15,000 | - | 15,000 | 131 | ||||||||||||||||||
| Total | $ | 15,131 | $ | - | $ | 15,131 | $ | - | $ | 15,000 | $ | 131 | ||||||||||||
For the year ended December 31, 2016 and 2015 there was no financial collateral pledged to our interest rate swaps. As these swap positions were not within the contractually agreed upon collateral requirement there was no collateral pledged to, or from, the respective counterparties.
Note 14 - Commitments, Contingencies and Concentrations of Credit Risk
In the normal course of business, the Company has outstanding commitments and contingent liabilities, such as standby and commercial letters of credit, unused portions of lines of credit and commitments to extend various types of credit. Commitments to extend credit and standby letters of credit generally do not exceed one year.
These financial instruments involve, to varying degrees, elements of credit risk in excess of the amounts recognized in the consolidated financial statements. The commitment or contract amount of these financial instruments is an indicator of the Company’s level of involvement in each type of instrument as well as the exposure to credit loss in the event of nonperformance by the other party to the financial instrument.
| - 85 - | ||
CONNECTONE BANCORP, INC. AND SUBSIDIARIES
NOTES TO CONSOLIDATED FINANCIAL STATEMENTS
Note 14 - Commitments, Contingencies and Concentrations of Credit Risk – (continued)
The Company controls the credit risk of these financial instruments through credit approvals, limits and monitoring procedures. To minimize potential credit risk, the Company generally requires collateral and other credit-related terms and conditions from the customer. In the opinion of management, the financial condition of the Company will not be materially affected by the final outcome of these commitments and contingent liabilities. A substantial portion of the Bank’s loans are secured by real estate located in New Jersey and New York. Accordingly, the collectability of a substantial portion of the loan portfolio of the Bank is susceptible to changes in the metropolitan New York real estate market.
The following table provides a summary of financial instruments with off-balance sheet risk at December 31, 2016 and 2015:
| 2016 | 2015 | ||||||
| (dollars in thousands) | |||||||
| Commitments under commercial loans and lines of credit | $ | 267,865 | $ | 278,201 | |||
| Home equity and other revolving lines of credit | 52,788 | 52,191 | |||||
| Outstanding commercial mortgage loan commitments | 263,395 | 273,552 | |||||
| Standby letters of credit | 18,331 | 20,895 | |||||
| Overdraft protection lines | 733 | 770 | |||||
| Total | $ | 603,112 | $ | 625,609 | |||
The Company is subject to claims and lawsuits that arise in the ordinary course of business. Based upon the information currently available in connection with such claims, it is the opinion of management that the disposition or ultimate determination of such claims will not have a material adverse impact on the consolidated financial position, results of operations, or liquidity of the Company.
Note 15 – Transactions with Executive Officers, Directors and Principal Stockholders
Loans to principal officers, directors, and their affiliates during the years ended December 31, 2016 and 2015 were as follows:
| 2016 | 2015 | ||||||
| (dollars in thousands) | |||||||
| Beginning balance | $ | 39,232 | $ | 44,353 | |||
| New loans | 25,274 | - | |||||
| Repayments | (17,736) | (5,121) | |||||
| Ending balance | $ | 46,770 | $ | 39,232 | |||
Deposits from principal officers, directors, and their affiliates at December 31, 2016 and 2015 were $47.7 million and $29.6 million respectively.
The Company has had, and may be expected to have in the future, banking transactions in the ordinary course of business with its executive officers, directors, principal stockholders, their immediate families and affiliated companies (commonly referred to as related parties). The Company leases branch facilities from related party entities. In addition, the Company also utilizes an advertising and public relations agency at which one of the Company’s directors is President and CEO and a principal owner. For these transactions, the expenses are not significant to the operations of the Company.
Note 16 - Stockholders’ Equity and Regulatory Requirements
Banks and bank holding companies are subject to regulatory capital requirements administered by federal banking agencies. Capital adequacy guidelines and, additionally for banks, prompt corrective action regulations, involve quantitative measures of assets, liabilities, and certain off-balance-sheet items calculated under regulatory accounting practices. Capital amounts and classifications are also subject to qualitative judgments by regulators. Failure to meet capital requirements can initiate regulatory action. The final rules implementing the Basel Committee on Banking Supervisions’ capital guidelines for U.S. banks (Basel III rules) became effective for the Company on January 1, 2015 with full compliance with all of the requirements being phased in over a multi- year schedule, and fully phased in by January 1, 2019. The net unrealized gain or loss on available for sale securities is not included in computing regulatory capital. Capital amounts and ratios for December 31, 2014 are calculated using Basel I rules. Management believes as of December 31, 2016, the Bank and the Parent Corporation meet all capital adequacy requirements which they are subject.
| - 86 - | ||
CONNECTONE BANCORP, INC. AND SUBSIDIARIES
NOTES TO CONSOLIDATED FINANCIAL STATEMENTS
Note 16 - Stockholders’ Equity and Regulatory Requirements – (continued)
Prompt corrective action regulations provide five classifications: well capitalized, adequately capitalized, undercapitalized, significantly undercapitalized and critically undercapitalized, although these terms are not used to represent overall financial condition. If adequately capitalized, regulatory approval is required to accept brokered deposits. If undercapitalized, capital distributions are limited, as is growth and expansion, and capital restoration plans are required. As of December 31, 2016 and 2015, the most recent regulatory notifications categorized the Banks as well capitalized under the regulatory framework for prompt corrective action. There are no conditions or events since that notification that management believes have changed the institution’s category.
The following is a summary of the Bank’s and the Parent Corporation’s actual capital amounts and ratios as of December 31, 2016 and 2015, compared to the FRB and FDIC minimum capital adequacy requirements and the FDIC requirements for classification as a well-capitalized institution.
| Minimum Capital Adequacy | For Classification Under Corrective Action Plan as Well Capitalized | |||||||||||||||||
| Amount | Ratio | Amount | Ratio | Amount | Ratio | |||||||||||||
| The Bank | (dollars in thousands) | |||||||||||||||||
| December 31, 2016 | ||||||||||||||||||
| Leverage (Tier 1) capital | $ | 434,067 | 10.34% | $ | 167,996 | 4.00% | $ | 209,995 | 5.00% | |||||||||
| Risk-Based Capital: | ||||||||||||||||||
| CET 1 | $ | 434,067 | 10.98% | $ | 177,944 | 4.50% | $ | 257,030 | 6.50% | |||||||||
| Tier 1 | 434,067 | 10.98% | 237,258 | 6.00% | 316,344 | 8.00% | ||||||||||||
| Total | 459,811 | 11.63% | 316,344 | 8.00% | 395,430 | 10.00% | ||||||||||||
| December 31, 2015 | ||||||||||||||||||
| Leverage (Tier 1) capital | $ | 372,979 | 9.96% | $ | 149,724 | 4.00% | $ | 187,154 | 5.00% | |||||||||
| Risk-Based Capital: | ||||||||||||||||||
| $ | 372,979 | 10.55% | $ | 159,028 | 4.50% | $ | 229,707 | 6.50% | ||||||||||
| Tier 1 | 372,979 | 10.55% | 212,037 | 6.00% | 282,716 | 8.00% | ||||||||||||
| Total | 399,551 | 11.31% | 282,716 | 8.00% | 353,395 | 10.00% | ||||||||||||
| Minimum Capital Adequacy | For Classification as Well Capitalized | |||||||||||||||||
| Amount | Ratio | Amount | Ratio | Amount | Ratio | |||||||||||||
| The Company | (dollars in thousands) | |||||||||||||||||
| December 31, 2016 | ||||||||||||||||||
| Leverage (Tier 1) capital | $ | 390,205 | 9.29% | $ | 168,048 | 4.00% | N/A | N/A | ||||||||||
| Risk-Based Capital: | ||||||||||||||||||
| CET 1 | $ | 385,050 | 9.74% | $ | 177,967 | 4.50% | N/A | N/A | ||||||||||
| Tier 1 | 390,205 | 9.87% | 237,289 | 6.00% | N/A | N/A | ||||||||||||
| Total | 465,949 | 11.78% | 316,386 | 8.00% | N/A | N/A | ||||||||||||
| December 31, 2015 | ||||||||||||||||||
| Leverage (Tier 1) capital | $ | 339,544 | 9.07% | $ | 149,776 | 4.00% | N/A | N/A | ||||||||||
| Risk-Based Capital: | ||||||||||||||||||
| $ | 323,139 | 9.14% | $ | 159,078 | 4.50% | N/A | N/A | |||||||||||
| Tier 1 | 339,544 | 9.61% | 212,104 | 6.00% | N/A | N/A | ||||||||||||
| Total | 416,116 | 11.77% | 282,805 | 8.00% | N/A | N/A | ||||||||||||
| - 87 - | ||
CONNECTONE BANCORP, INC. AND SUBSIDIARIES
NOTES TO CONSOLIDATED FINANCIAL STATEMENTS
Note 16 - Stockholders’ Equity and Regulatory Requirements – (continued)
The new Basel III rules require a “capital conservation buffer,” for both the Company and the Bank. When fully phased in on January 1, 2019, each of the Company and the Bank will be required to maintain a 2.5% capital conservation buffer, above and beyond the capital levels otherwise required under applicable regulation. The implementation of this capital conservation buffer began on January 1, 2016 at a level of 0.625%, and will increase by 0.625% on each subsequent January 1 until it reaches 2.5% on January 1, 2019. Under this guidance banking institutions with a CET1, Tier 1 Capital Ratio and Total Risk Based Capital Ratio above the minimum regulatory adequate capital ratios but below the capital conservation buffer will face constraints on their ability to pay dividends, repurchase equity and pay discretionary bonuses to executive officers, based on the amount of the shortfall.
As of December 31, 2016 both the Company and Bank satisfy the capital conservation buffer requirements applicable to them. The lowest ratio at the Company is the Tier 1 Capital Ratio which was 3.157% above the minimum buffer ratio and, at the Bank, the lowest ratio was the Total Risk Based Capital Ratio which was 3.003% above the minimum buffer ratio.
Note 17 - Comprehensive Income
Total comprehensive income includes all changes in equity during a period from transactions and other events and circumstances from nonowner sources. The Company’s other comprehensive income (loss) is comprised of unrealized holding gains and losses on securities available-for-sale, obligations for defined benefit pension plan and an adjustment to reflect the curtailment of the Company’s defined benefit pension plan, net of taxes.
| Affected Line Item in the | |||||||||||
| Details about Accumulated Other | Amounts Reclassified from Accumulated | Consolidated Statements | |||||||||
| Comprehensive Income Components | Other Comprehensive Income | of Income | |||||||||
| Twelve Months Ended | |||||||||||
| December 31, | |||||||||||
| (dollars in thousands) | 2016 | 2015 | 2014 | ||||||||
| Sale of investment securities available-for-sale | 4,234 | 3,931 | 2,818 | Net gains on sale investment securities | |||||||
| (1,682) | (1,564) | (986) | Income tax expense | ||||||||
| 2,552 | 2,367 | 1,832 | |||||||||
| Amortization of unrealized holding (losses) gains on securities transferred from available-for-sale to held-to-maturity | (1,986) | (220) | (215) | Interest income | |||||||
| 813 | 90 | 91 | Income tax benefit | ||||||||
| (1,173) | (130) | (124) | |||||||||
| Amortization of pension plan net actuarial losses | (407) | (433) | (204) | Salaries and employee benefits | |||||||
| 165 | 177 | 83 | Income tax benefit | ||||||||
| (242) | (256) | (121) | |||||||||
| Total reclassification | $ | 1,137 | $ | 1,981 | $ | 1,587 | |||||
Accumulated other comprehensive loss at December 31, 2016 and 2015 consisted of the following:
| 2016 | 2015 | ||||||
| (dollars in thousands) | |||||||
| Investment securities available-for-sale, net of tax | $ | 933 | $ | 713 | |||
| Cash flow hedge, net of tax | 52 | (77) | |||||
| Unamortized component of securities transferred from available-for-sale to held-to-maturity, net of tax |
- | (1,173) | |||||
| Defined benefit pension and post-retirement plans, net of tax | (3,831) | (4,072) | |||||
| Total | $ | (2,846) | $ | (4,609) | |||
| - 88 - | ||
CONNECTONE BANCORP, INC. AND SUBSIDIARIES
NOTES TO CONSOLIDATED FINANCIAL STATEMENTS
Note 18 - Pension and Other Benefits
Defined Benefit Plans
The Company maintains a frozen noncontributory pension plan covering employees of the Company prior to the Merger. The benefits are based on years of service and the employee’s compensation over the prior five-year period. The plan’s benefits are payable in the form of a ten year certain and life annuity. The plan is intended to be a tax-qualified defined benefit plan under Section 401(a) of the Internal Revenue Code. Payments may be made under the Pension Plan once attaining the normal retirement age of 65 and are generally equal to 44% of a participant’s highest average compensation over a 5-year period.
The following table sets forth changes in projected benefit obligation, changes in fair value of plan assets, funded status, and amounts recognized in the consolidated statements of condition for the Company’s pension plans at December 31, 2016 and 2015.
| 2016 | 2015 | ||||||
| (dollars in thousands) | |||||||
| Change in Benefit Obligation: | |||||||
| Projected benefit obligation at beginning of year | $ | 13,068 | $ | 15,074 | |||
| Interest cost | 514 | 519 | |||||
| Actuarial (gain) loss | 216 | (466) | |||||
| Benefits paid | - | (717) | |||||
| Settlements | (1,116) | (1,342) | |||||
| Projected benefit obligation at end of year | $ | 12,682 | $ | 13,068 | |||
| Change in Plan Assets: | |||||||
| Fair value of plan assets at beginning year | $ | 10,287 | $ | 10,414 | |||
| Actual return on plan assets | 831 | (296) | |||||
| Employer contributions | 2,000 | 2,000 | |||||
| Benefits paid | - | (717) | |||||
| Settlements | (1,116) | (1,114) | |||||
| Fair value of plan assets at end of year | $ | 12,002 | $ | 10,287 | |||
| Funded status | $ | (680) | $ | (2,781) | |||
The accumulated benefit obligation was $12.7 million and $13.1 million as of the year ended December 31, 2016 and 2015, respectively.
Amounts recognized as a component of accumulated other comprehensive loss as of year-end that have not been recognized as a component of the net periodic pension expense for the plan are presented in the following table. The Company expects to recognize approximately $412,000 of the net actuarial loss reported in the following table as of December 31, 2016 as a component of net periodic pension expense during 2017.
| 2016 | 2015 | ||||||
| Net actuarial loss recognized in accumulated other comprehensive income | $ | 6,272 | $ | 6,677 | |||
The net periodic pension expense and other comprehensive income (before tax) for 2016, 2015 and 2014 includes the following:
| 2016 | 2015 | 2014 | ||||||||
| (dollars in thousands) | ||||||||||
| Interest cost | $ | 514 | $ | 519 | $ | 576 | ||||
| Expected return on plan assets | (617) | (562) | (596) | |||||||
| Net amortization | 407 | 433 | 223 | |||||||
| Recognized settlement loss | - | 650 | 1 | |||||||
| Total net periodic pension expense | $ | 304 | $ | 1,040 | $ | 204 | ||||
| Total (gain) loss recognized in other comprehensive income | (405) | (918) | 1,896 | |||||||
| Total recognized in net periodic expense and other comprehensive income (before tax) | $ | (101) | $ | 122 | $ | 2,100 | ||||
| - 89 - | ||
CONNECTONE BANCORP, INC. AND SUBSIDIARIES
NOTES TO CONSOLIDATED FINANCIAL STATEMENTS
Note 18 - Pension and Other Benefits – (continued)
The following table presents the assumptions used to calculate the projected benefit obligation in each of the last three years.
| 2016 | 2015 | 2014 | |||||||
| Discount rate | 3.88 | % | 4.06 | % | 3.76 | % | |||
| Rate of compensation increase | N/A | N/A | N/A | ||||||
| Expected long-term rate of return on plan assets | 5.50 | % | 5.50 | % | 5.50 | % | |||
The following information is provided for the year ended December 31:
| 2016 | 2015 | 2014 | |||||||
| (dollars in thousands) | |||||||||
| Weighted average assumptions used to determine net periodic benefit cost for years ended December 31 | |||||||||
| Discount rate | 4.06 | % | 3.76 | % | 4.84 | % | |||
| Expected long-term return on plan assets | 5.50 | % | 5.50 | % | 5.50 | % | |||
| Rate of compensation increase | N/A | N/A | N/A | ||||||
The process of determining the overall expected long-term rate of return on plan assets begins with a review of appropriate investment data, including current yields on fixed income securities, historical investment data, historical plan performance and forecasts of inflation and future total returns for the various asset classes. This data forms the basis for the construction of a best-estimate range of real investment return for each asset class. An average, weighted real-return range is computed reflecting the plan’s expected asset mix, and that range, when combined with an expected inflation range, produces an overall best-estimate expected return range. Specific factors such as the plan’s investment policy, reinvestment risk and investment volatility are taken into consideration during the construction of the best estimate real return range, as well as in the selection of the final return assumption from within the range.
Plan Assets
The general investment policy of the Pension Trust is for the fund to experience growth in assets that will allow the market value to exceed the value of benefit obligations over time. The Company’s pension plan asset allocation as of December 31, 2016 and 2015, target allocation, and expected long-term rate of return by asset are as follows:
| Target Allocation | % of Plan Assets – Year Ended 2016 | % of Plan Assets – Year Ended 2015 | Weighted Average Expected Long-Term Rate of Return | ||||||||||
| Equity Securities | |||||||||||||
| Domestic | 43% | 44% | 47% | 3.4% | |||||||||
| International | 7% | 8% | 15% | 0.6% | |||||||||
| Debt and/or fixed income securities | 49% | 47% | 36% | 1.5% | |||||||||
| Cash and other alternative investments, including real estate funds, hedge funds and equity structured notes | 1% | 1% | 2% | 0% | |||||||||
| Total | 100% | $ | 100% | $ | 100% | $ | 5.5% | ||||||
| - 90 - | ||
CONNECTONE BANCORP, INC. AND SUBSIDIARIES
NOTES TO CONSOLIDATED FINANCIAL STATEMENTS
Note 18 - Pension and Other Benefits – (continued)
The fair values of the Company’s pension plan assets at December 31, 2016 and 2015, by asset class, are as follows:
| December 31, 2016 | Fair Value Measurements at Reporting Date Using | |||||||||||||||
| Asset Class | Quoted Prices in Active Markets for Identical Assets (Level 1) | Significant Other Observable Inputs (Level 2) | Significant Unobservable Inputs (Level 3) | |||||||||||||
| (dollars in thousands) | ||||||||||||||||
| Cash | $ | 19 | $ | 19 | $ | - | $ | - | ||||||||
| Equity securities: | ||||||||||||||||
| U.S. companies | 5,221 | 5,221 | - | - | ||||||||||||
| International companies | 1,005 | 1,005 | - | - | ||||||||||||
| Debt and/or fixed income securities | 5,689 | 5,689 | ||||||||||||||
| Real estate funds | 68 | 68 | - | - | ||||||||||||
| Total | $ | 12,002 | $ | 12,002 | $ | - | $ | - | ||||||||
| December 31, 2015 | Fair Value Measurements at Reporting Date Using | |||||||||||||||
| Asset Class | Quoted Prices in Active Markets for Identical Assets (Level 1) | Significant Other Observable Inputs (Level 2) | Significant Unobservable Inputs (Level 3) | |||||||||||||
| (dollars in thousands) | ||||||||||||||||
| Cash | $ | 114 | $ | 114 | $ | - | $ | - | ||||||||
| Equity securities: | ||||||||||||||||
| U.S. companies | 4,832 | 4,832 | - | - | ||||||||||||
| International companies | 1,584 | 1,584 | - | - | ||||||||||||
| Debt and/or fixed income securities | 3,684 | 3,684 | ||||||||||||||
| Real estate funds | 73 | 73 | - | - | ||||||||||||
| Total | $ | 10,287 | $ | 10,287 | $ | - | $ | - | ||||||||
| - 91 - | ||
CONNECTONE BANCORP, INC. AND SUBSIDIARIES
NOTES TO CONSOLIDATED FINANCIAL STATEMENTS
Note 18 - Pension and Other Benefits – (continued)
Fair Value of Plan Assets
The Company used the following valuation methods and assumptions to estimate the fair value of assets held by the plan (for further information on fair value methods, see Note 22):
Equity securities and real estate funds: The fair values for equity securities and real estate funds are determined by quoted market prices, if available (Level 1). For securities where quoted prices are not available, fair values are calculated based on market prices of similar securities (Level 2).
Debt and fixed income securities: Certain debt securities are valued at the closing price reported in the active market in which the bond is traded (Level 1 inputs). Other debt securities are valued based upon recent bid prices or the average of recent bid and asked prices when available (Level 2 inputs) and, if not available, they are valued through matrix pricing models developed by sources considered by management to be reliable. Matrix pricing, which is a mathematical technique commonly used to price debt securities that are not actively traded, values debt securities without relying exclusively on quoted prices for the specific securities but rather by relying on the securities’ relationship to other benchmark quoted securities (Level 2 inputs). For securities where quoted prices or market prices of similar securities are not available, fair values are calculated using discounted cash flows or other market indicators (Level 3). Discounted cash flows are calculated using spread to swap and LIBOR curves that are updated to incorporate loss severities, volatility, credit spread and optionality. During times when trading is more liquid, broker quotes are used (if available) to validate the model. Rating agency and industry research reports as well as defaults and deferrals on individual securities are reviewed and incorporated into the calculations.
The investment manager is not authorized to purchase, acquire or otherwise hold certain types of market securities (subordinated bonds, real estate investment trusts, limited partnerships, naked puts, naked calls, stock index futures, oil, gas or mineral exploration ventures or unregistered securities) or to employ certain types of market techniques (margin purchases or short sales) or to mortgage, pledge, hypothecate, or in any manner transfer as security for indebtedness, any security owned or held by the Plan.
Cash Flows
Contributions
The Bank does not expect to contribute to its Pension Trust in 2017.
Estimated Future Benefit Payments
The following benefit payments, which reflect expected future service, as appropriate, for the following years are as follows (in thousands):
| 2017 | $ | 731 | ||
| 2018 | 720 | |||
| 2019 | 730 | |||
| 2020 | 736 | |||
| 2021 | 748 | |||
| 2022-2026 | 3,635 |
401(k) Benefit Plan
The Company maintains a 401(k) employee savings plan to provide for defined contributions which covers substantially all employees of the Company. Beginning with the 2013 Plan Year, the Plan was amended to provide for a 3% non-elective safe harbor contribution for all participants. For 2016, 2015 and 2014, employer contributions amounted to $351,000, $338,000 and $291,000, respectively.
| - 92 - | ||
CONNECTONE BANCORP, INC. AND SUBSIDIARIES
NOTES TO CONSOLIDATED FINANCIAL STATEMENTS
Note 19 - Stock Based Compensation
The Company maintains two stock-based compensation plans from which new grants could be issued. The Company’s stock-based compensation plans permit Parent Corporation common stock to be issued to key employees and directors of the Company and its subsidiaries. Grants under the existing plans can be in the form of stock options (qualified or non-qualified), restricted shares, or performance units. Shares available for grant and issuance under the existing plans as of December 31, 2016 are 68,516 under the 2009 Equity Incentive Plan and 234,090 shares under the North Jersey Community Bancorp Equity Compensation Plan. The Company intends to issue all shares under these plans in the form of newly issued shares.
Restricted stock and option awards typically have a three-year vesting period starting one year after the date of grant with one-third vesting each year. The options generally expire ten years from the date of grant. Restricted stock awards granted to new employees and board members may be granted with shorter vesting periods. Grants of performance units typically have a cliff vesting after three years. All issuances are subject to forfeiture if the recipient leaves or is terminated prior to the awards vesting. Restricted shares have the same dividend and voting rights as common stock, while options and performance units do not.
All awards are issued at fair value of the underlying shares at the grant date. The Company expenses the cost of the awards, which is determined to be the fair market value of the awards at the date of grant, ratably over the vesting period.
No options were granted during 2016, 2015 or 2014.
During 2016 and 2015, the Company granted to various key employees performance unit awards, with each unit entitling the holder to one share of the Company’s common stock contingent upon the Company meeting or exceeding certain return on asset targets over the course of a three-year period commencing on January 1 of the year of issuance. Under the grant agreement, and assuming the Company has met or exceeded the applicable targets, grants of performance unit awards will vest on the third anniversary of the grant date or on an earlier date in the event of a change in control, as defined in the agreements. At December 31, 2016, the specific number of shares related to performance unit awards that were expected to vest was 151,572, determined by actual performance in consideration of the established range of the performance targets, which is consistent with the level of expense currently being recognized over the vesting period. Should this expectation change, additional compensation expense could be recorded in future periods or previously recognized expense could be reversed. At December 31, 2016 the maximum amount of performance unit awards that ultimately could vest if performance targets were exceeded is 181,526 shares.
Option activity under the Company’s option plans as of and for the year ended December 31, 2016 were as follows:
| Shares | Weighted- Average Exercise Price |
Weighted- Average Remaining Contractual Term (In Years) |
Aggregate Intrinsic Value |
||||||||||
| Outstanding at December 31, 2015 | 535,906 | $ | 6.48 | ||||||||||
| Granted | - | - | |||||||||||
| Exercised | (136,429) | 5.71 | |||||||||||
| Forfeited/cancelled/expired | (45,010) | 10.59 | |||||||||||
| Outstanding at December 31, 2016 | 354,467 | $ | 6.26 | 2.67 | $ | 6,979,455 | |||||||
| Exercisable at December 31, 2016 | 350,937 | $ | 6.18 | 2.62 | $ | 6,938,024 | |||||||
The aggregate intrinsic value of outstanding and exercisable options above represents the total pre-tax intrinsic value (the difference between the Company’s closing stock price on December 31, 2016 and the exercise price, multiplied by the number of in-the-money options) that would have been received by the option holders had all option holders exercised their options on December 31, 2016. This amount changes based on the fair market value of the Parent Corporation’s stock.
| Information related to stock option exercises during 2016: |
2016 | |||
| Intrinsic value of options exercised | $ | 1,381,233 | ||
| Cash received from options exercised | 767,189 | |||
| Tax benefit realized from options exercised | 117,311 | |||
| - 93 - | ||
CONNECTONE BANCORP, INC. AND SUBSIDIARIES
NOTES TO CONSOLIDATED FINANCIAL STATEMENTS
Note 19 - Stock Based Compensation – (continued)
The aggregate intrinsic value of exercised options above represents the total pre-tax intrinsic value (the difference between the Company’s closing stock price on the date of exercise and the exercise price, multiplied by the number of in-the-money options) of all options that were exercised during the year ending December 31, 2016. The tax benefit is calculated on any non-qualified options exercised during the period using a 36% tax rate.
The below table represents information regarding restricted shares currently outstanding at December 31, 2016:
| Nonvested Shares |
Weighted- Average Grant Date Fair Value |
||||||
| Nonvested at December 31, 2015 | 96,902 | $ | 16.81 | ||||
| Granted | 72,920 | 15.88 | |||||
| Vested | (55,648) | 16.01 | |||||
| Forfeited/cancelled/expired | (2,901) | 19.58 | |||||
| Nonvested at December 31, 2016 | 111,273 | $ | 16.81 | ||||
As of December 31, 2016, there was $973,745 of total unrecognized compensation cost related to nonvested restricted shares granted under the plans. The cost is expected to be recognized over a weighted average period of 20.1 months.
A summary of the status of unearned performance unit awards and the change during the period is presented in the table below:
| Units (expected) |
Units (maximum) |
Weighted- Average Grant Date Fair Value |
||||||||
| Unearned at December 31, 2015 | 94,585 | 113,502 | $ | 19.46 | ||||||
| Awarded | 64,434 | 77,3206 | 17.01 | |||||||
| Forfeited | (7,447) | (9,296) | 19.46 | |||||||
| Expired | - | - | - | |||||||
| Unearned at December 31, 2016 | 151,572 | 181,526 | $ | 18.47 | ||||||
At December 31, 2016, compensation cost of $1,237,533 related to nonvested awards not yet recognized is expected to be recognized over a weighted-average period of 1.4 years.
Note 20 - Dividends and Other Restrictions
Certain restrictions, including capital requirements, exist on the availability of undistributed net profits of the Bank for the future payment of dividends to the Parent Corporation. A dividend may not be paid if it would impair the capital of the Bank. At December 31, 2016, approximately $143.5 million was available for payment of dividends based on regulatory guidelines.
Note 21 – Derivatives
The Company utilizes interest rate swap agreements as part of its asset liability management strategy to help manage its interest rate risk position. The notional amount of the interest rate swap does not represent amounts exchanged by the parties. The amount exchanged is determined by reference to the notional amount and the other terms of the individual interest rate swap agreements.
Interest rate swaps were entered into on August 24, 2015, October 15, 2014 and December 30, 2014, each with a respective notional amount of $25.0 million and were designated as a cash flow hedge of a Federal Home Loan Bank advance. The swaps were determined to be fully effective during the period presented and therefore no amount of ineffectiveness has been included in net income. Therefore, the aggregate fair value of the swaps is recorded in other assets (liabilities) with changes in fair value recorded in other comprehensive income (loss). The amount included in accumulated other comprehensive income (loss) would be reclassified to current earnings should the hedges no longer be considered effective. The Company expects the hedges to remain fully effective during the remaining term of the swaps.
| - 94 - | ||
CONNECTONE BANCORP, INC. AND SUBSIDIARIES
NOTES TO CONSOLIDATED FINANCIAL STATEMENTS
Note 21 – Derivatives – (continued)
Summary information about the interest rate swap designated as a cash flow hedges as of year-end is as follows (dollars in thousands):
December 31, 2016 |
December 31, 2015 |
||||||
| Notional amount | $ | 75,000 | $ | 75,000 | |||
| Weighted average pay rates | 1.59 | % | 1.56 | % | |||
| Weighted average receive rates | 0.69 | % | 0.44 | % | |||
| Weighted average maturity | 2.8 years | 3.8 years | |||||
| Fair value | $ | 88 | $ | (131) | |||
Interest expense recorded on these swaps transactions totaled approximately $668,300, $763,500, and $60,000 during 2016, 2015, and 2014 is reported as a component of interest expense on FHLB Advances.
Cash Flow Hedge
The following table presents the net gains (losses), recorded in accumulated other comprehensive income and the Consolidated Statements of Income relating to the cash flow derivative instruments for the years ended December 31:
| 2016 | ||||||||||||
| (in thousands) | Amount of gain (loss) recognized in OCI (Effective Portion) | Amount of gain (loss) reclassified from OCI to interest income | Amount of gain (loss) recognized in other Noninterest income (Ineffective Portion) | |||||||||
| Interest rate contracts | $ | 219 | $ | - | $ | - | ||||||
| 2015 | ||||||||||||
| (in thousands) | Amount of gain (loss) recognized in OCI (Effective Portion) | Amount of gain (loss) reclassified from OCI to interest income | Amount of gain (loss) recognized in other Noninterest income (Ineffective Portion) | |||||||||
| Interest rate contracts | $ | (179) | $ | - | $ | - | ||||||
The following table reflects the cash flow hedges included in the Consolidated Balance Sheets as of December 31, 2016 and December 31, 2015:
| 2016 | 2015 | |||||||||||||||
| (in thousands) | Notional Amount | Fair Value | Notional Amount | Fair Value | ||||||||||||
| Included in other assets/(liabilities): | ||||||||||||||||
| Interest rate swaps related to FHLB Advances | $ | 75,000 | $ | 88 | $ | 75,000 | $ | (131) | ||||||||
There were no net gains (losses) recorded in accumulated other comprehensive income or in the Consolidated Statement of Income relating to cash flow derivative instruments for the years ended December 31, 2016, December 31, 2015 and December 31, 2014.
Note 22 - Fair Value Measurements and Fair Value of Financial Instruments
Fair value is the exchange price that would be received for an asset or paid to transfer a liability (exit price) in the principal or most advantageous market for the asset or liability in an orderly transaction between market participants on the measurement date. There are three levels of inputs that may be used to measure fair value:
FASB ASC 820-10-05 defines fair value, establishes a framework for measuring fair value, establishes a three-level valuation hierarchy for disclosure of fair value measurements and enhances disclosure requirements for fair value measurements. The valuation hierarchy is based upon the transparency of inputs to the valuation of an asset or liability as of the measurement date.
| - 95 - | ||
CONNECTONE BANCORP, INC. AND SUBSIDIARIES
NOTES TO CONSOLIDATED FINANCIAL STATEMENTS
Note 22 - Fair Value Measurements and Fair Value of Financial Instruments – (continued)
FASB ASC 820-10-65 provides additional guidance for estimating fair value in accordance with FASB ASC 820-10-05 when the volume and level of activity for the asset or liability have significantly decreased. This ASC also includes guidance on identifying circumstances that indicate a transaction is not orderly.
FASB ASC 820-10-05 establishes a fair value hierarchy that prioritizes the inputs to valuation methods used to measure fair value. The hierarchy gives the highest priority to unadjusted quoted prices in active markets for identical assets or liabilities (Level 1 measurements) and the lowest priority to unobservable inputs (Level 3 measurements). The three levels of the fair value hierarchy under FASB ASC 820-10-05 are as follows:
Level 1: Unadjusted quoted prices in active markets that are accessible at the measurement date for identical, unrestricted assets or liabilities.
Level 2: Quoted prices for similar assets and liabilities in active markets, and inputs that are observable for the asset or liability, either directly or indirectly, for substantially the full term of the financial instrument.
Level 3: Prices or valuation techniques that require inputs that are both significant to the fair value measurement and unobservable (for example, supported with little or no market activity).
An asset’s or liability’s level within the fair value hierarchy is based on the lowest level of input that is significant to the fair value measurement. The following information should not be interpreted as an estimate of the fair value of the entire Company since a fair value calculation is only provided for a limited portion of the Company’s assets and liabilities. Due to a wide range of valuation techniques and the degree of subjectivity used in making the estimates, comparisons between the Company’s disclosures and those of other companies may not be meaningful.
Assets and Liabilities Measured at Fair Value on a Recurring Basis
The following methods and assumptions were used to estimate the fair values of the Company’s assets measured at fair value on a recurring basis at December 31, 2016 and December 31, 2015:
Securities Available-for-Sale
Where quoted prices are available in an active market, securities are classified within Level 1 of the valuation hierarchy. Level 1 inputs include securities that have quoted prices in active markets for identical assets. If quoted market prices are not available, then fair values are estimated by using pricing models, quoted prices of securities with similar characteristics, or discounted cash flows. Examples of instruments, which would generally be classified within Level 2 of the valuation hierarchy include municipal bonds and certain agency collateralized mortgage obligations. In certain cases where there is limited activity in the market for a particular instrument, assumptions must be made to determine the fair value of the instruments and these are classified as Level 3. When measuring fair value, the valuation techniques available under the market approach, income approach and/or cost approach are used. The Company’s evaluations are based on market data and the Company employs combinations of these approaches for its valuation methods depending on the asset class.
| - 96 - | ||
CONNECTONE BANCORP, INC. AND SUBSIDIARIES
NOTES TO CONSOLIDATED FINANCIAL STATEMENTS
Note 22 - Fair Value Measurements and Fair Value of Financial Instruments – (continued)
Derivatives
The fair value of derivatives are based on valuation models using observable market data as of the measurement date (level 2). Our derivatives are traded in an over-the-counter market where quoted market prices are not always available. Therefore, the fair values of derivatives are determined using quantitative models that utilize multiple market inputs. The inputs will vary based on the type of derivative, but could include interest rates, prices and indices to generate continuous yield or pricing curves, prepayment rate, and volatility factors to value the position. The majority of market inputs are actively quoted and can be validated through external sources, including brokers, market transactions and third-party pricing services.
For financial assets and liabilities measured at fair value on a recurring basis, the fair value measurements by level within the fair value hierarchy used at December 31, 2016 and December 31, 2015 are as follows:
| December 31, 2016 | ||||||||||||||||
| Fair Value Measurements at Reporting Date Using | ||||||||||||||||
| Quoted Prices in Active Markets for Identical Assets (Level 1) | Significant Other Observable Inputs (Level 2) | Significant Unobservable Inputs (Level 3) | ||||||||||||||
| (in thousands) | ||||||||||||||||
| Recurring fair value measurements: | ||||||||||||||||
| Assets | ||||||||||||||||
| Investment securities: | ||||||||||||||||
| Available-for-sale: | ||||||||||||||||
| Federal agency obligations | $ | 52,837 | $ | - | $ | 52,837 | $ | |||||||||
| Residential
mortgage pass- through securities | 72,497 | - | 72,497 | |||||||||||||
| Commercial mortgage
pass- through securities | 4,209 | - | 4,209 | |||||||||||||
| Obligations
of U.S. states and political subdivision | 150,605 | - | 132,387 | 18,218 | ||||||||||||
| Trust preferred securities | 5,666 | - | 5,666 | |||||||||||||
| Corporate bonds and notes | 36,928 | - | 36,928 | |||||||||||||
| Asset-backed securities | 14,583 | - | 14,583 | |||||||||||||
| Certificates of deposit | 983 | - | 983 | |||||||||||||
| Equity securities | 568 | 568 | - | |||||||||||||
| Other securities | 14,414 | 14,414 | - | |||||||||||||
| Total available-for-sale | $ | 353,290 | $ | 14,982 | $ | 320,090 | $ | 18,218 | ||||||||
| Derivatives | 88 | - | 88 | |||||||||||||
| Total assets | $ | 353,378 | $ | 14,982 | $ | 320,178 | $ | 18,218 | ||||||||
| - 97 - | ||
CONNECTONE BANCORP, INC. AND SUBSIDIARIES
NOTES TO CONSOLIDATED FINANCIAL STATEMENTS
Note 22 - Fair Value Measurements and Fair Value of Financial Instruments – (continued)
| December 31, 2015 | ||||||||||||||||
| Fair Value Measurements at Reporting Date Using | ||||||||||||||||
| Quoted Prices in Active Markets for Identical Assets (Level 1) | Significant Other Observable Inputs (Level 2) | Significant Unobservable Inputs (Level 3) | ||||||||||||||
| (in thousands) | ||||||||||||||||
| Recurring fair value measurements: | ||||||||||||||||
| Assets | ||||||||||||||||
| Investment securities: | ||||||||||||||||
| Available-for-sale: | ||||||||||||||||
| Federal agency obligations | $ | 29,146 | $ | - | $ | 29,146 | $ | - | ||||||||
| Residential
mortgage pass- through securities | 44,910 | - | 44,910 | - | ||||||||||||
| Commercial mortgage
pass- through securities | 2,972 | - | 2,972 | - | ||||||||||||
| Obligations
of U.S. states and political subdivision | 8,357 | - | 8,357 | - | ||||||||||||
| Trust preferred securities | 16,255 | - | 16,255 | - | ||||||||||||
| Corporate bonds and notes | 53,976 | - | 53,976 | - | ||||||||||||
| Asset-backed securities | 19,725 | - | 19,725 | - | ||||||||||||
| Certificates of deposit | 1,905 | - | 1,905 | - | ||||||||||||
| Equity securities | 374 | 374 | - | - | ||||||||||||
| Other securities | 18,150 | 18,150 | - | - | ||||||||||||
| Total assets | $ | 195,770 | $ | 18,524 | $ | 177,246 | $ | - | ||||||||
| Liabilities | ||||||||||||||||
| Derivatives | (131) | - | (131 | ) | - | |||||||||||
| Total liabilities | $ | (131) | $ | - | $ | (131 | ) | $ | - | |||||||
There were no transfers between Level 1 and Level 2 during the years ended December 31, 2016 and 2015.
Assets Measured at Fair Value on a Non-Recurring Basis
The Company may be required periodically to measure certain assets at fair value on a non-recurring basis in accordance with GAAP. These adjustments to fair value usually result from the application of lower of cost or fair value accounting or impairment write-downs of individual assets. The following methods and assumptions were used to estimate the fair values of the Company’s assets measured at fair value on a non-recurring basis at December 31, 2016 and December 31, 2015:
Loans Held-for-Sale
Residential mortgage loans, originated and intended for sale in the secondary market, are carried at the lower of aggregate cost or estimated fair value as determined by outstanding commitments from investors. For these loans originated and intended for sale, gains and losses on loan sales (sale proceeds minus carrying value) are recorded in other income and direct loan origination costs and fees are deferred at origination of the loan and are recognized in other income upon sale of the loan. Management obtains quotes or bids on all or part of these loans directly from the purchasing financial institutions (Level 2).
| - 98 - | ||
CONNECTONE BANCORP, INC. AND SUBSIDIARIES
NOTES TO CONSOLIDATED FINANCIAL STATEMENTS
Note 22 - Fair Value Measurements and Fair Value of Financial Instruments – (continued)
Other loans held-for-sale are carried at the lower of aggregate cost or estimated fair value. A portion of these loans, taxi medallion loans, have no material observable trading in any market. The approach to determining fair value involved several steps, including a detailed collateral analysis of the underlying medallions, performance projections for individual loans, discounted cash flow modeling and consideration of indicative bids, which at December 31, 2016 did not necessarily contemplate whole loan sales (Level 3). Another portion of these loans are based upon contractual offers to purchase which were obtained by management (Level 2).
Impaired Loans
The Company may record adjustments to the carrying value of loans based on fair value measurements, generally as partial charge-offs of the uncollectible portions of these loans. These adjustments also include certain impairment amounts for collateral dependent loans calculated in accordance with GAAP. Impairment amounts are generally based on the fair value of the underlying collateral supporting the loan and, as a result, the carrying value of the loan less the calculated impairment amount applicable to that loan does not necessarily represent the fair value of the loan. Real estate collateral is valued using independent appraisals or other indications of value based on recent comparable sales of similar properties or assumptions generally observable by market participants. However, due to the substantial judgment applied and limited volume of activity as compared to other assets, fair value is based on Level 3 inputs. Estimates of fair value used for collateral supporting commercial loans generally are based on assumptions not observable in the market place and are also based on Level 3 inputs.
For assets measured at fair value on a non-recurring basis, the fair value measurements at December 31, 2016 and December 31, 2015 are as follows:
| Fair Value Measurements at Reporting Date Using | ||||||||||||||||
| Assets
measured at fair value on a nonrecurring basis: |
December
31, 2016 |
Quoted Prices in Active Markets for Identical Assets (Level 1) |
Significant Other Observable Inputs (Level 2) |
Significant Unobservable Inputs (Level 3) |
||||||||||||
| Impaired loans: | (in thousands) | |||||||||||||||
| Commercial real estate | $ | 1,099 | $ | - | $ | - | $ | 1,099 | ||||||||
Loans held-for-sale: |
||||||||||||||||
| Commercial | 70,105 | - | 4,509 | 65,596 | ||||||||||||
| Commercial real estate | 7,712 | - | 7,712 | - | ||||||||||||
| Fair Value Measurements at Reporting Date Using | ||||||||||||||||
| Assets
measured at fair value on a nonrecurring basis: |
December
31, 2015 |
Quoted Prices in Active Markets for Identical Assets (Level 1) |
Significant Other Observable Inputs (Level 2) |
Significant Unobservable Inputs (Level 3) |
||||||||||||
| Impaired loans: | (in thousands) | |||||||||||||||
| Commercial | $ | 3,751 | $ | - | $ | - | $ | 3,751 | ||||||||
Impaired loans - Collateral dependent impaired loans at December 31, 2016 that required a valuation allowance were $1.2 million with a related valuation allowance of $0.1 million compared to $6.0 million with a related valuation allowance of $2.2 million at December 31, 2015.
| - 99 - | ||
CONNECTONE BANCORP, INC. AND SUBSIDIARIES
NOTES TO CONSOLIDATED FINANCIAL STATEMENTS
Note 22 - Fair Value Measurements and Fair Value of Financial Instruments – (continued)
Assets Measured With Significant Unobservable Level 3 Inputs
Recurring basis
The table below presents a reconciliation of all assets measured at fair value of a recurring basis using significant unobservable inputs (Level 3) for the year ended December 31 (in thousands):
Balance of recurring Level 3 assets at |
Municipal Securities
|
||||||
| January 1 | 2016 | 2015 | |||||
| Federal agency obligations | $ | - | $ | - | |||
| Purchases | - | - | |||||
| Sales | - | - | |||||
| Transfer into Level 3 | - | - | |||||
| Transfers out of Level 3 | - | - | |||||
| Other(1) | 18,335 | - | |||||
| Principal paydowns | (117) | - | |||||
| Balance of recurring Level 3 assets | |||||||
| At December 31 | $ | 18,218 | $ | - | |||
| (1) | Includes transfers from held-to-maturity to available-for-sale designation |
The following methods and assumptions were used to estimate the fair values of the Company’s assets measured at fair value on a recurring basis at December 31, 2016. The table below provide quantitative information about significant unobservable inputs used in fair value measurements within Level 3 hierarchy.
| December 31, 2016 | ||||||||||||||
(dollars in thousands) |
Fair Value | Valuation Techniques |
Unobservable Input |
Range | ||||||||||
| Available-for-sale investments: | ||||||||||||||
| Municipal securities | $ | 18,218 | Discounted cash flows | Discount rate | 2.8% | |||||||||
At December 31, 2015, there were no assets measured on a recurring basis that contained any significant unobservable Level 3 inputs.
| - 100 - | ||
CONNECTONE BANCORP, INC. AND SUBSIDIARIES
NOTES TO CONSOLIDATED FINANCIAL STATEMENTS
Note 22 - Fair Value Measurements and Fair Value of Financial Instruments – (continued)
Non-recurring basis
The following methods and assumptions were used to estimate the fair values of the Company’s assets measured at fair value on a non-recurring basis for the periods presented. The tables below provide quantitative information about significant unobservable inputs used in fair value measurements within Level 3 hierarchy.
| December 31, 2016 | |||||||||
| (dollars in thousands) | Fair Value | Valuation Techniques (Weightings) |
Unobservable Input |
Range (weighed average) | |||||
| Impaired loans: | |||||||||
| Commercial real estate | $ | 1,099 | Appraisals of collateral value | Comparable sales | 0% - 15% (6%) | ||||
| Loans held-for-sale: | |||||||||
| Commercial taxi medallion loans | $ | 65,596 | Market approach (70%)
|
Indications under securitized transactions expressed as a price to unpaid principal balance |
40 - 100 (59) | ||||
|
Discounted cash flows (30%) |
Discount Rate |
14% | |||||||
| December 31, 2015 | |||||||||
| (dollars in thousands) | Fair Value | Valuation Techniques |
Unobservable Input |
Range (weighed average) | |||||
| Impaired loans: | |||||||||
| Commercial real estate | $ | 3,751 | Appraisals of collateral value | Comparable sales | 0% - 15% (6%) | ||||
Fair Value of Financial Instruments
FASB ASC 825-10 requires all entities to disclose the estimated fair value of their financial instrument assets and liabilities. For the Company, as for most financial institutions, the majority of its assets and liabilities are considered financial instruments as defined in FASB ASC 825-10. Many of the Company’s financial instruments, however, lack an available trading market as characterized by a willing buyer and willing seller engaging in an exchange transaction. It is also the Company’s general practice and intent to hold its financial instruments to maturity and not to engage in trading or sales activities except for loans held-for-sale and investment securities available-for-sale. Therefore, significant estimations and assumptions, as well as present value calculations, were used by the Company for the purposes of this disclosure.
| - 101 - | ||
CONNECTONE BANCORP, INC. AND SUBSIDIARIES
NOTES TO CONSOLIDATED FINANCIAL STATEMENTS
Note 22 - Fair Value Measurements and Fair Value of Financial Instruments – (continued)
Cash and cash equivalents. The carrying amounts of cash and short-term instruments approximate fair values.
FHLB stock. It is not practical to determine the fair value of FHLB stock due to restrictions placed on its transferability.
Investment Securities Held-to-Maturity. The fair value of the Company’s investment securities held-to-maturity was primarily measured using information from a third-party pricing service. If quoted prices were not available, fair values were estimated primarily by obtaining quoted prices for similar assets in active markets or through the use of pricing models. In cases where there may be limited or less transparent information provided by the Company’s third-party pricing service, fair value may be estimated by the use of secondary pricing services or through the use of non-binding third-party broker quotes.
Loans. The fair value of the Company’s loans was estimated by discounting the expected future cash flows using the current interest rates at which similar loans would be made to borrowers with similar credit ratings and for the same remaining maturities. Loans were segregated by types such as commercial, residential and consumer loans. Expected future cash flows were projected based on contractual cash flows, adjusted for estimated prepayments. The methods utilized to estimate the fair value of loans do not necessarily represent an exit price and therefore, while permissible for presentation purposes under ASC 825-10, do not conform to ASC 820-10.
Deposits. The carrying amounts of deposits with no stated maturities (i.e., noninterest-bearing, savings, NOW, and money market deposits) are assigned fair values equal to the carrying amounts payable on demand. The fair value of time deposits is based on the discounted value of contractual cash flows using estimated rates currently offered for alternative funding sources of similar remaining maturity.
Term Borrowings and Subordinated Debentures. The fair value of the Company’s long-term borrowings and subordinated debentures were calculated using a discounted cash flow approach and applying discount rates currently offered based on weighted remaining maturities.
Accrued Interest Receivable/Payable. The carrying amounts of accrued interest approximate fair value resulting in a level 2 or level 3 classification based on the level of the asset or liability with which the accrual is associated.
| - 102 - | ||
CONNECTONE BANCORP, INC. AND SUBSIDIARIES
NOTES TO CONSOLIDATED FINANCIAL STATEMENTS
Note 22 - Fair Value Measurements and Fair Value of Financial Instruments – (continued)
The following presents the carrying amount, fair value, and placement in the fair value hierarchy of the Company’s financial instruments as of December 31, 2016 and December 31, 2015:
| Fair Value Measurements | ||||||||||||||||
| Carrying Amount |
Fair Value |
Quoted Prices in Active Markets for Identical Assets (Level 1) |
Significant Other Observable Inputs (Level 2) |
Significant Unobservable Inputs (Level 3) |
||||||||||||
| (in thousands) | ||||||||||||||||
| December 31, 2016 | ||||||||||||||||
| Financial assets: | ||||||||||||||||
| Cash and due from banks | $ | 200,399 | $ | 200,399 | $ | 200,399 | $ | - | $ | - | ||||||
| Investment securities available-for-sale | 353,290 | 353,290 | 14,982 | 320,090 | 18,218 | |||||||||||
| Restricted investment in bank stocks | 24,310 | n/a | n/a | n/a | n/a | |||||||||||
| Loans held-for-sale | 78,005 | 78,005 | - | 12,409 | 65,596 | |||||||||||
| Net loans | 3,450,088 | 3,462,138 | - | - | 3,462,138 | |||||||||||
| Derivatives | 88 | 88 | - | 88 | - | |||||||||||
| Accrued interest receivable | 12,965 | 12,965 | - | 2,026 | 10,939 | |||||||||||
| Financial liabilities: | ||||||||||||||||
| Noninterest-bearing deposits | 694,977 | 694,977 | 694,977 | - | - | |||||||||||
| Interest-bearing deposits | 2,649,294 | 2,649,717 | 1,681,044 | 968,673 | - | |||||||||||
| Borrowings | 476,280 | 478,286 | - | 478,286 | - | |||||||||||
| Subordinated debentures | 54,534 | 55,901 | - | 55,901 | - | |||||||||||
| Accrued interest payable | 4,142 | 4,142 | - | 4,142 | - | |||||||||||
| December 31, 2015 | ||||||||||||||||
| Financial assets: | ||||||||||||||||
| Cash and due from banks | $ | 200,895 | $ | 200,895 | $ | 200,895 | $ | - | $ | - | ||||||
| Investment securities available-for-sale | 195,770 | 195,770 | 18,524 | 177,246 | - | |||||||||||
| Investment securities held-to-maturity | 224,056 | 230,558 | 29,226 | 182,774 | 18,558 | |||||||||||
| Restricted investment in bank stocks | 32,612 | n/a | n/a | n/a | n/a | |||||||||||
| Net loans | 3,072,435 | 3,059,343 | - | - | 3,059,343 | |||||||||||
| Accrued interest receivable | 12,545 | 12,545 | 68 | 2,699 | 9,778 | |||||||||||
| Financial liabilities: | ||||||||||||||||
| Noninterest-bearing deposits | 650,775 | 650,775 | 650,775 | - | - | |||||||||||
| Interest-bearing deposits | 2,140,191 | 2,137,149 | 1,359,651 | 777,498 | - | |||||||||||
| Borrowings | 671,587 | 674,131 | - | 674,131 | - | |||||||||||
| Subordinated debentures | 54,343 | 55,209 | - | 55,209 | - | |||||||||||
| Derivatives | 131 | 131 | - | 131 | - | |||||||||||
| Accrued interest payable | 4,387 | 4,387 | - | 4,387 | - | |||||||||||
| - 103 - | ||
CONNECTONE BANCORP, INC. AND SUBSIDIARIES
NOTES TO CONSOLIDATED FINANCIAL STATEMENTS
Note 22 - Fair Value Measurements and Fair Value of Financial Instruments – (continued)
The fair value of commitments to originate loans is estimated using the fees currently charged to enter into similar agreements, taking into account the remaining terms of the agreements and the present creditworthiness of the counterparties. For fixed-rate loan commitments, fair value also considers the difference between current levels of interest rates and the committed rates. The fair values of letters of credit and lines of credit are based on fees currently charged for similar agreements or on the estimated cost to terminate or otherwise settle the obligations with the counterparties at the reporting date. The fair value of commitments to originate loans is immaterial and not included in the tables above.
Changes in assumptions or estimation methodologies may have a material effect on these estimated fair values.
The Company’s remaining assets and liabilities, which are not considered financial instruments, have not been valued differently than has been customary with historical cost accounting. No disclosure of the relationship value of the Company’s core deposit base is required by FASB ASC 825-10.
Fair value estimates are based on existing balance sheet financial instruments, without attempting to estimate the value of anticipated future business and the value of assets and liabilities that are not considered financial instruments. For example, there are certain significant assets and liabilities that are not considered financial assets or liabilities, such as the brokerage network, deferred taxes, premises and equipment, and goodwill. In addition, the tax ramifications related to the realization of the unrealized gains and losses can have a significant effect on fair value estimates and have not been considered in the estimates.
Management believes that reasonable comparability between financial institutions may not be likely, due to the wide range of permitted valuation techniques and numerous estimates which must be made, given the absence of active secondary markets for many of the financial instruments. This lack of uniform valuation methodologies also introduces a greater degree of subjectivity to these estimated fair values.
Note 23 - Parent Corporation Only Financial Statements
The Parent Corporation operates its wholly-owned subsidiary, the Bank. The earnings of this subsidiary are recognized by the Parent Corporation using the equity method of accounting. Accordingly, earnings are recorded as increases in the Parent Corporation’s investment in the subsidiaries and dividends paid reduce the investment in the subsidiaries. The ability of the Parent Corporation to pay dividends will largely depend upon the dividends paid to it by the Bank. Dividends payable by the Bank to the Parent Corporation are restricted under supervisory regulations (see Note 20 of the Notes to Consolidated Financial Statements).
| - 104 - | ||
CONNECTONE BANCORP, INC. AND SUBSIDIARIES
NOTES TO CONSOLIDATED FINANCIAL STATEMENTS
Note 23 - Parent Corporation Only Financial Statements – (continued)
Condensed financial statements of the Parent Corporation only are as follows:
Condensed Statements of Condition
| At December 31, | |||||||
| 2016 | 2015 | ||||||
| (dollars in thousands) | |||||||
| ASSETS | |||||||
| Cash and cash equivalents | $ | 7,008 | $ | 14,857 | |||
| Investment in subsidiaries | 580,048 | 515,934 | |||||
| Securities available-for-sale | 730 | 533 | |||||
| Other assets | 426 | 2,405 | |||||
| Total assets | $ | 588,212 | $ | 533,729 | |||
| LIABILITIES AND STOCKHOLDERS’ EQUITY | |||||||
| Other liabilities | $ | 2,646 | $ | 1,895 | |||
| Subordinated debentures | 54,534 | 54,490 | |||||
| Stockholders’ equity | 531,032 | 477,344 | |||||
| Total liabilities and stockholders’ equity | $ | 588,212 | $ | 533,729 | |||
Condensed Statements of Income
| For Years Ended December 31, | ||||||||||
| 2016 | 2015 | 2014 | ||||||||
| (dollars in thousands) | ||||||||||
| Income: | ||||||||||
| Dividend income from subsidiaries | $ | 12,400 | $ | 10,537 | $ | 9,276 | ||||
| Other income | 8 | 7 | 6 | |||||||
| Management fees | - | - | 100 | |||||||
| Total Income | 12,408 | 10,544 | 9,382 | |||||||
| Expenses | (3,252) | (1,705) | (707) | |||||||
| Income before equity in undistributed earnings of subsidiaries | 9,156 | 8,839 | 8,675 | |||||||
| Equity in undistributed earnings of subsidiaries | 21,926 | 32,472 | 9,890 | |||||||
| Net Income | $ | 31,082 | $ | 41,311 | $ | 18,565 | ||||
| - 105 - | ||
CONNECTONE BANCORP, INC. AND SUBSIDIARIES
NOTES TO CONSOLIDATED FINANCIAL STATEMENTS
Note 23 - Parent Corporation Only Financial Statements – (continued)
Condensed Statements of Cash Flows
| For Years Ended December 31 | ||||||||||
| 2016 | 2015 | 2014 | ||||||||
| (dollars in thousands) | ||||||||||
| Cash flows from operating activities: | ||||||||||
| Net income | $ | 31,082 | $ | 41,311 | $ | 18,565 | ||||
| Adjustments to reconcile net income to net cash provided by operating activities: | ||||||||||
| Equity in undistributed earnings of subsidiary | (21,926) | (32,472) | (9,890) | |||||||
| Increase in other assets | 2,023 | (820) | (1,979) | |||||||
| Increase (decrease) in other liabilities | 544 | (1,840) | (1,010) | |||||||
| Net cash provided by operating activities | 11,723 | 7,267 | 6,191 | |||||||
| Cash flows from investing activities: | ||||||||||
| Capital infusion to subsidiary | (38,439) | (35,000) | - | |||||||
| Net cash used in investing activities | (38,439) | (35,000) | - | |||||||
| Cash flows from financing activities: | ||||||||||
| Proceeds from subordinated debt | - | 50,000 | - | |||||||
| Cash dividends on common stock | (9,067) | (8,996) | (6,940) | |||||||
| Cash dividends on preferred stock | (22) | (112) | (140) | |||||||
| Secondary offering and issuance of common stock | 38,439 | - | - | |||||||
| Redemption of preferred stock | (11,250) | - | - | |||||||
| Proceeds from exercise of stock options | 767 | 1,424 | 878 | |||||||
| Net cash used in financing activities | 18,867 | 42,316 | (6,202) | |||||||
| Decrease in cash and cash equivalents | (7,849) | 14,583 | (11) | |||||||
| Cash and cash equivalents at beginning of year | 14,857 | 274 | 285 | |||||||
| Cash and cash equivalents at the end of year | $ | 7,008 | $ | 14,857 | $ | 274 | ||||
| - 106 - | ||
CONNECTONE BANCORP, INC. AND SUBSIDIARIES
NOTES TO CONSOLIDATED FINANCIAL STATEMENTS
Note 24 - Quarterly Financial Information of ConnectOne Bancorp, Inc. (unaudited)
| 2016 | |||||||||||||
| 4th Quarter | 3rd Quarter | 2nd Quarter | 1st Quarter | ||||||||||
| (dollars in thousands, except per share data) | |||||||||||||
| Total interest income | $ | 41,499 | $ | 41,178 | $ | 40,038 | $ | 38,526 | |||||
| Total interest expense | 8,092 | 8,154 | 7,644 | 7,206 | |||||||||
| Net interest income | 33,407 | 33,024 | 32,394 | 31,320 | |||||||||
| Provision for loan and lease losses | 25,200 | 6,750 | 3,750 | 3,000 | |||||||||
| Total other income, net of securities gains | 1,573 | 1,445 | 1,467 | 1,202 | |||||||||
| Net securities gains | - | 4,131 | 103 | - | |||||||||
| Other expense | 15,252 | 14,551 | 14,352 | 14,353 | |||||||||
| (Loss) income before income taxes | (5,472) | 17,299 | 15,862 | 15,169 | |||||||||
| Income tax (benefit) expense | (3,448) | 5,443 | 5,003 | 4,778 | |||||||||
| Net income (loss) | (2,024) | 11,856 | 10,859 | 10,391 | |||||||||
| Preferred dividends | - | - | - | 22 | |||||||||
| Net income available to common stockholders |
$ | (2,024) | $ | 11,856 | $ | 10,859 | $ | 10,369 | |||||
| (Loss) earnings per share: | |||||||||||||
| Basic | $ | (0.07) | $ | 0.39 | $ | 0.36 | $ | 0.35 | |||||
| Diluted | (0.07) | 0.39 | 0.36 | 0.34 | |||||||||
| 2015 | |||||||||||||
| 4th Quarter | 3rd Quarter | 2nd Quarter | 1st Quarter | ||||||||||
| (dollars in thousands, except per share data) | |||||||||||||
| Total interest income | $ | 37,230 | $ | 36,186 | $ | 34,181 | $ | 33,370 | |||||
| Total interest expense | 6,774 | 6,459 | 5,503 | 5,078 | |||||||||
| Net interest income | 30,456 | 29,727 | 28,678 | 28,292 | |||||||||
| Provision for loan and lease losses | 5,055 | 4,175 | 1,550 | 1,825 | |||||||||
| Total other income, net of securities gains | 1,225 | 1,752 | 3,215 | 1,049 | |||||||||
| Net securities (losses) gains | 1,138 | 2,067 | 221 | 506 | |||||||||
| Other expense | 13,579 | 13,301 | 14,974 | 12,631 | |||||||||
| Income before income taxes | 14,185 | 16,070 | 15,590 | 15,391 | |||||||||
| Provision from income taxes | 4,617 | 5,228 | 5,069 | 5,012 | |||||||||
| Net income | 9,568 | 10,842 | 10,521 | 10,379 | |||||||||
| Preferred dividends | 28 | 28 | 28 | 28 | |||||||||
| Net income available to common stockholders |
$ | 9,540 | $ | 10,814 | $ | 10,493 | $ | 10,351 | |||||
| Earnings per share: | |||||||||||||
| Basic | $ | 0.32 | $ | 0.36 | $ | 0.35 | $ | 0.35 | |||||
| Diluted | 0.31 | 0.36 | 0.35 | 0.34 | |||||||||
Note: Due to rounding, quarterly earnings per share may not sum to reported annual earnings per share.
The provision for loan and lease losses for the fourth quarter was a notable increase that was mainly attributable to the transfer of the Company’s taxi medallion portfolio to loans held-for-sale.
| - 107 - | ||
CONNECTONE BANCORP, INC. AND SUBSIDIARIES
NOTES TO CONSOLIDATED FINANCIAL STATEMENTS
Note 25 – Presentation of Debt Issuance Costs
As of January 1, 2016, the Company adopted Accounting Standards Update (“ASU”) No. 2015-03 “Simplifying the Presentation of Debt Issuance Costs,” which requires that debt issuance costs be presented in the consolidated statement of condition as a direct deduction from the carrying amount of debt liability. This ASU is required to be applied retrospectively to all periods presented. The following table summarizes the impact of retrospective application to the consolidated statement of condition for the year ended December 31, 2015:
| (dollars in thousands) | December 31, 2015 | |||
| Other assets | ||||
| As previously reported | $ | 24,908 | ||
| As reported under the new guidance | 24,096 | |||
| Total assets | ||||
| As previously reported | $ | 4,016,721 | ||
| As reported under the new guidance | 4,015,909 | |||
| Subordinated debentures | ||||
| As previously reported | $ | 55,155 | ||
| As reported under the new guidance | 54,343 | |||
| Total liabilities | ||||
| As previously reported | $ | 3,539,377 | ||
| As reported under the new guidance | 3,538,565 | |||
| - 108 - | ||
Item 9. Changes in and Disagreements with Accountants on Accounting and Financial Disclosures
None.
Item 9A. Controls and Procedures
(a) Evaluation of Disclosure Controls and Procedures
The Company maintains disclosure controls and procedures that are designed to ensure that information required to be disclosed in its reports filed or submitted pursuant to the Securities Exchange Act of 1934, as amended (“Exchange Act”), is recorded, processed, summarized and reported within the time periods specified in the Securities and Exchange Commission’s rules and forms, and that information required to be disclosed by the Company in its Exchange Act reports is accumulated and communicated to management, including the Company’s Chief Executive Officer and Chief Financial Officer, to allow timely decisions regarding required disclosure.
Under the supervision and with the participation of its management, including the Company’s Chief Executive Officer and Chief Financial Officer, the Company evaluated the effectiveness of the design and operation of the Company’s disclosure controls and procedures pursuant to Exchange Act Rule 13a-15(e) and 15d-15(e) as of December 31, 2016. Based upon that evaluation, the Company’s Chief Executive Officer and Chief Financial Officer concluded that the Company’s disclosure controls and procedures were effective as of such date.
(b) Management’s Report on Internal Control over Financial Reporting
The Company’s management is responsible for establishing and maintaining adequate internal control over financial reporting as defined in Rules 13a-15(f) of the Exchange Act. The Company’s internal control system is a process designed to provide reasonable assurance to the Company’s management, Board of Directors and shareholders regarding the reliability of financial reporting and the preparation and fair presentation of financial statements for external reporting purposes in accordance with U.S. generally accepted accounting principles. Our internal control over financial reporting includes policies and procedures that pertain to the maintenance of records that, in reasonable detail, accurately and fairly reflect transactions and dispositions of assets; provide reasonable assurances that transactions are recorded as necessary to permit preparation of financial statements in accordance with U.S. generally accepted accounting principles and that receipts and expenditures are being made only in accordance with authorizations of management and the directors of the Company; and provide reasonable assurance regarding prevention or timely detection of unauthorized acquisition, use or disposition of the Company’s assets that could have a material effect on our financial statements.
All internal control systems, no matter how well designed, have inherent limitations. Therefore, even those systems determined to be effective can provide only reasonable assurance with respect to financial statement preparation and presentation. Also, projections of any evaluation of effectiveness to future periods are subject to the risk that controls may become inadequate because of changes in conditions, or that the degree of compliance with the policies or procedures may deteriorate.
As part of the Company’s program to comply with Section 404 of the Sarbanes-Oxley Act of 2002, our management assessed the effectiveness of the Company’s internal control over financial reporting as of December 31, 2016 (the “Assessment”). In making this Assessment, management used the control criteria framework of the Committee of Sponsoring Organizations (“COSO”) of the Treadway Commission published in its report entitled Internal Control - Integrated Framework (2013). Management’s Assessment included an evaluation of the design of the Company’s internal control over financial reporting and testing of the operational effectiveness of its internal control over financial reporting. Management reviewed the results of its Assessment with the Audit Committee.
Based on this Assessment, management determined that, as of December 31, 2016, the Company’s internal control over financial reporting was effective to provide reasonable assurance regarding the reliability of financial reporting and the preparation of financial statements for external purposes in accordance with accounting principles generally accepted in the United States of America.
Crowe Horwath LLP, the independent registered public accounting firm that audited the Company’s consolidated financial statements included in this Annual Report on Form 10-K, has issued an audit report on the Company’s internal control over financial reporting as of December 31, 2016. The report is included in this item under the heading “Report of Independent Registered Public Accounting Firm.”
(c) Changes in Internal Controls over Financial Reporting
There have been no changes in the Company’s internal controls over financial reporting that occurred during the Company’s last fiscal quarter to which this report relates that have materially affected, or are reasonable likely to materially affect, the Company’s internal control over financial reporting.
None.
| - 109 - | ||
Item 10. Directors and Executive Officers of the Registrant
Information required by this part is included in the definitive Proxy Statement for the Company’s 2017 Annual Meeting under the captions “ELECTION OF DIRECTORS” and “SECTION 16(A) BENEFICIAL OWNERSHIP REPORTS COMPLIANCE,” each of which is incorporated herein by reference. It is expected that such Proxy Statement will be filed with the Securities and Exchange Commission no later than April 30, 2017.
Item 11. Executive Compensation
Information concerning executive compensation is included in the definitive Proxy Statement for the Company’s 2017 Annual Meeting under the captions “EXECUTIVE COMPENSATION” and “DIRECTOR COMPENSATION”, which is incorporated by reference herein. It is expected that such Proxy Statement will be filed with the Securities and Exchange Commission no later than April 30, 2017.
Item 12. Security Ownership of Certain Beneficial Owners and Management and Related Stockholder Matters
Information concerning security ownership of certain beneficial owners and management is included in the definitive Proxy statement for the Company’s 2017 Annual Meeting under the caption “SECURITY OWNERSHIP OF MANAGEMENT”, which is incorporated herein by reference. It is expected that such Proxy statement will be filed with the Securities and Exchange Commission no later than April 30, 2017.
Item 13. Certain Relationships and Related Transactions
Information concerning certain relationships and related transactions is included in the definitive Proxy Statement for the Company’s 2017 Annual Meeting under the caption “INTEREST OF MANAGEMENT AND OTHERS IN CERTAIN TRANSACTIONS”, which is incorporated herein by reference. It is expected that such Proxy statement will be filed with the Securities and Exchange Commission no later than April 30, 2017.
Item 14. Principal Accounting Fees and Services
The information concerning principal accountant fees and services as well as related pre-approval policies under the caption “RATIFICATION OF INDEPENDENT AUDITORS” in the Proxy Statement for the Company’s 2017 Annual Meeting of Shareholders is incorporated by reference herein. It is expected that such Proxy Statement will be filed with the Securities and Exchange Commission no later than April 30, 2017.
| - 110 - | ||
Item 15. Exhibits, Financial Statement Schedules
| (a) | (1) Financial Statements and Schedules: |
The following Financial Statements and Supplementary Data are filed as part of this annual report:
| (b) | Exhibits (numbered in accordance with Item 601 of Regulation S-K) filed herewith or incorporated by reference as part of this annual report. |
| Exhibit No. | Description | |
| 3.1 | The Registrant’s Restated Certificate of Incorporation is incorporated by reference to Exhibit 3.1 to the Registrant’s Current Report on Form 8-K filed with the SEC on July 1, 2014. | |
| 3.2 | The Registrant’s Amended and Restated By-Laws are incorporated by reference to Exhibit 3.2 to the Registrant’s Current Report on Form 8-K filed with the SEC on July 1, 2014. | |
| 10.1 | The Registrant’s Annual Incentive Plan is incorporated by reference to Exhibit 10.6 to the Registrant’s Annual Report on Form 10-K for the year ended December 31, 2006. | |
| 10.2 | Center Bancorp, Inc. 2009 Equity Incentive Plan is incorporated by reference to Exhibit 10.1 to the Registrant’s Current Report on Form 8-K dated June 1, 2009. | |
| 10.3 | Center Bancorp, Inc. 1999 Stock Incentive Plan is incorporated by reference to Exhibit 10.11 to the Registrant’s Annual Report on Form 10-K for the year ended December 31, 1999. | |
| 10.4 | Indenture dated as of December 19, 2003, between the Registrant and Wilmington Trust Company relating to $5.0 million aggregate principal amount of floating rate debentures is incorporated by reference to Exhibit 10.16 of the Registrant’s Annual Report on Form 10-K for the year ended December 31, 2003. | |
| 10.5 | Amended and restated Declaration of Trust of Center Bancorp Statutory Trust II, dated as of December 19, 2003 is incorporated by reference to Exhibit 10.17 of the Registrant’s Annual Report on Form 10-K for the year ended December 31, 2003. | |
| 10.6 | Guarantee Agreement between Registrant and Wilmington Trust Company dated as of December 19, 2003 is incorporated by reference to Exhibit 10.18 of the Registrant’s Annual Report on Form 10-K for the year ended December 31, 2003. | |
| 10.7 | The Registrant’s Amended and Restated 2003 Non-Employee Director Stock Option Plan, as amended and restated, is incorporated by reference to Exhibit 10.1 to the Registrant’s Current Report on Form 8-K dated March 5, 2008. | |
| 10.8 | Open Market Share Purchase Incentive Plan is incorporated by reference to exhibit 10.1 to |
| - 111 - | ||
| Exhibit No. | Description | |
| the Registrant’s Current Report on Form 8-K dated January 26, 2006. | ||
| 10.9 | Amendment to 2003 Amended and Restated Non-Employee Director Stock Option Plan is incorporated by reference to Exhibit 10.8 to the Registrant’s Current Report on Form 8-K filed with the SEC on January 21, 2014. | |
| 10.10 | Employment Agreement, effective July 1, 2014, by and among the Registrant, ConnectOne Bank and Frank Sorrentino III, is incorporated by reference to Exhibit 10.7 to the Registrant’s Registration Statement on Form S-4/A filed with the SEC on April 4, 2014. * | |
| 10.11 | Employment Agreement dated as of December 19, 2013, by and among the Registrant, ConnectOne Bank and William S. Burns, is incorporated by reference to Exhibit 10.2 to the Registrant’s Current Report on Form 8-K filed with the SEC on July 1, 2014 * | |
| 10.12 | Form of Change in Control Agreement by and between the Company and each of Elizabeth Magennis and Laura Criscione dated December 19, 2013 is incorporated by reference to Exhibit 10.2 to the Registrant’s Current Report on Form 8-K filed with the SEC on July 1, 2014. * | |
| 10.13 | North Jersey Community Bank 2005 Stock Option Plan – A(1) | |
| 10.14 | North Jersey Community Bank 2005 Stock Option Plan – B(1) | |
| 10.15 | North Jersey Community Bank 2006 Equity Compensation Plan (1) | |
| 10.16 | North Jersey Community Bank 2008 Equity Compensation Plan (1) | |
| 10.17 | North Jersey Community Bank 2009 Equity Compensation Plan (1) | |
| 10.18 | 2012 Equity Compensation Plan (1) | |
| 10.19 | Subordinated Note Purchase Agreement dated June 30, 2015 (2) | |
| 10.20 | Indenture dated June 30, 2015 with U.S. Bank, National Association as Trustee (2) | |
| 11.1 | Statement regarding computation of per share earnings is omitted because the computation can be clearly determined from the material incorporated by reference in this Report. | |
| 12.1 | Statement of Ratios of Earnings to Fixed Charges | |
| 21.1 | Subsidiaries of the Registrant | |
| 23.1 | Consent of Crowe Horwath LLP | |
| 31.1 | Personal certification of the chief executive officer pursuant to section 302 of the Sarbanes-Oxley Act of 2002. | |
| 31.2 | Personal certification of the chief financial officer pursuant to section 302 of the Sarbanes-Oxley Act of 2002. | |
| 32 | Personal certification of the chief executive officer and the chief financial officer pursuant to section 906 of the Sarbanes-Oxley Act of 2002. |
| - 112 - | ||
| Exhibit No. | Description | |
| 101 .INS | XBRL instance document | |
| 101 .SCH | XBRL Taxonomy Extension Schema Document | |
| 101 .CAL | XBRL Taxonomy Extension Calculation Linkbase Document | |
| 101 .DEF | XBRL Taxonomy Extension Definition Linkbase Document | |
| 101 .LAB | XBRL Taxonomy Extension Label Linkbase Document | |
| 101 .PRE | XBRL Taxonomy Extension Presentation Linkbase Document |
| * | Management contract on compensatory plan or arrangement. |
| (1) | Incorporated by reference from Exhibits 10.13,10.14, 10.15, 10.16, 10.17 and 10.18, the Registrant’s Annual Report on Form 10-K for the year ending December 31, 2014 |
| (2) | Incorporated by reference from Exhibits 10.1, 10.2 and 10.3 of the Registrant’s Current Report on Form 8-K filed July 2, 2015 |
All financial statement schedules are omitted because they are either inapplicable or not required, or because the required information is included in the Consolidated Financial Statements or notes thereto.
| - 113 - | ||
Pursuant to the requirements of Section 13 or 15(d) of the Securities Exchange Act of 1934, ConnectOne Bancorp, Inc. has duly caused this report to be signed on its behalf by the undersigned, thereunto duly authorized.
| CONNECTONE BANCORP, INC. | ||
| March 10, 2017 | By: | |
| /s/ Frank Sorrentino III | ||
| Frank Sorrentino III | ||
| Chairman and Chief Executive Officer | ||
Pursuant to the requirements of the Securities Exchange Act of 1934, the following persons on behalf of the Registrant, in the capacities described below on March 10, 2017, have signed this report below.
| /s/ Frank Sorrentino III | Chairman of the Board & Chief Executive Officer (principal executive officer |
| Frank Sorrentino III | |
| /s/William S. Burns William S. Burns |
Executive Vice President & Chief Financial Officer (principal financial and accounting officer) |
| /s/Stephen Boswell | Director |
| Stephen Boswell | |
| /s/Frank Baier | Director |
| Frank Baier | |
| /s/Frank Huttle III | Director |
| Frank Huttle III | |
| /s/Michael Kempner | Director |
| Michael Kempner | |
| /s/Joseph Parisi, Jr. | Director |
| Joseph Parisi, Jr. | |
| /s/ Frederick S. Fish | Director |
| Frederick S. Fish | |
| /s/ Nicholas Minoia | Director |
| Nicholas Minoia | |
| /s/ Harold Schechter | Director |
| Harold Schechter | |
| /s/ William A. Thompson | Director |
| William A. Thompson | |
| /s/ Alexander Bol | Director |
| Alexander Bol |
| - 114 - | ||