Attached files
| file | filename |
|---|---|
| 8-K - 8-K - Matson, Inc. | f8-k.htm |
| EX-99.1 - EX-99.1 - Matson, Inc. | ex-99d1.htm |
Exhibit 99.2
|
|
Second Quarter 2017 Earnings Conference Call |
|
|
Forward Looking Statements Statements made during this call and presentation that set forth expectations, predictions, projections or are about future events are based on facts and situations that are known to us as of today, July 31, 2017. We believe that our expectations and assumptions are reasonable. Actual results may differ materially, due to risks and uncertainties, such as those described on pages 11-18 of our 2016 Form 10-K filed on February 24, 2017, and other subsequent filings by Matson with the SEC. Statements made during this call and presentation are not guarantees of future performance. We do not undertake any obligation to update our forward-looking statements. |
|
|
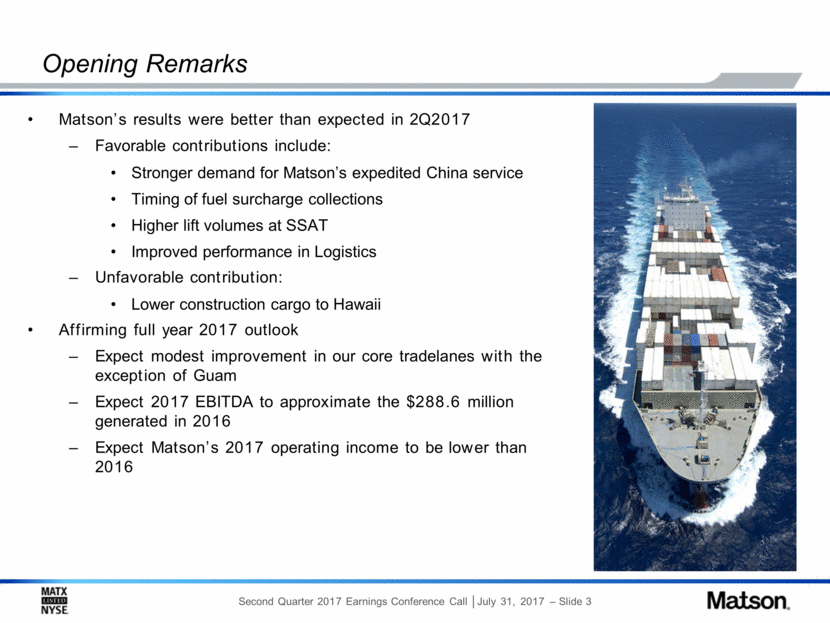
Opening Remarks Matson’s results were better than expected in 2Q2017 Favorable contributions include: Stronger demand for Matson’s expedited China service Timing of fuel surcharge collections Higher lift volumes at SSAT Improved performance in Logistics Unfavorable contribution: Lower construction cargo to Hawaii Affirming full year 2017 outlook Expect modest improvement in our core tradelanes with the exception of Guam Expect 2017 EBITDA to approximate the $288.6 million generated in 2016 Expect Matson’s 2017 operating income to be lower than 2016 |
|
|
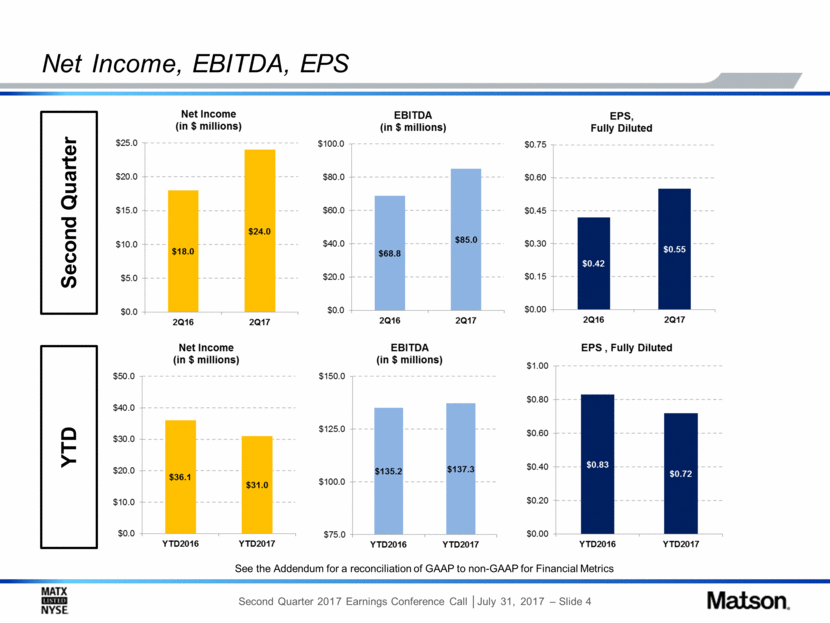
Net Income, EBITDA, EPS See the Addendum for a reconciliation of GAAP to non-GAAP for Financial Metrics Second Quarter YTD |
|
|
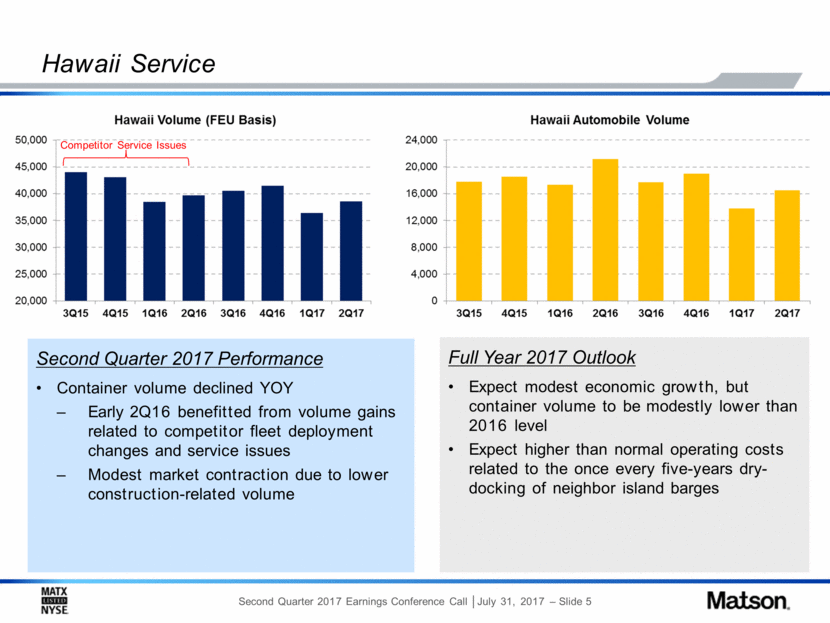
Hawaii Service Second Quarter 2017 Performance Container volume declined YOY Early 2Q16 benefitted from volume gains related to competitor fleet deployment changes and service issues Modest market contraction due to lower construction-related volume Full Year 2017 Outlook Expect modest economic growth, but container volume to be modestly lower than 2016 level Expect higher than normal operating costs related to the once every five-years dry-docking of neighbor island barges Competitor Service Issues |
|
|
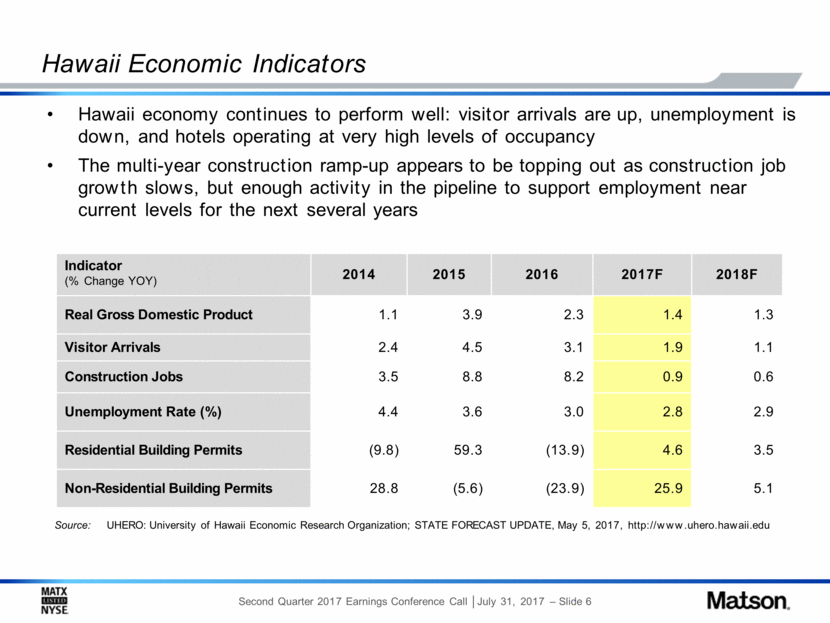
Hawaii Economic Indicators Indicator (% Change YOY) 2014 2015 2016 2017F 2018F Real Gross Domestic Product 1.1 3.9 2.3 1.4 1.3 Visitor Arrivals 2.4 4.5 3.1 1.9 1.1 Construction Jobs 3.5 8.8 8.2 0.9 0.6 Unemployment Rate (%) 4.4 3.6 3.0 2.8 2.9 Residential Building Permits (9.8) 59.3 (13.9) 4.6 3.5 Non-Residential Building Permits 28.8 (5.6) (23.9) 25.9 5.1 Source: UHERO: University of Hawaii Economic Research Organization; STATE FORECAST UPDATE, May 5, 2017, http://www.uhero.hawaii.edu Hawaii economy continues to perform well: visitor arrivals are up, unemployment is down, and hotels operating at very high levels of occupancy The multi-year construction ramp-up appears to be topping out as construction job growth slows, but enough activity in the pipeline to support employment near current levels for the next several years |
|
|
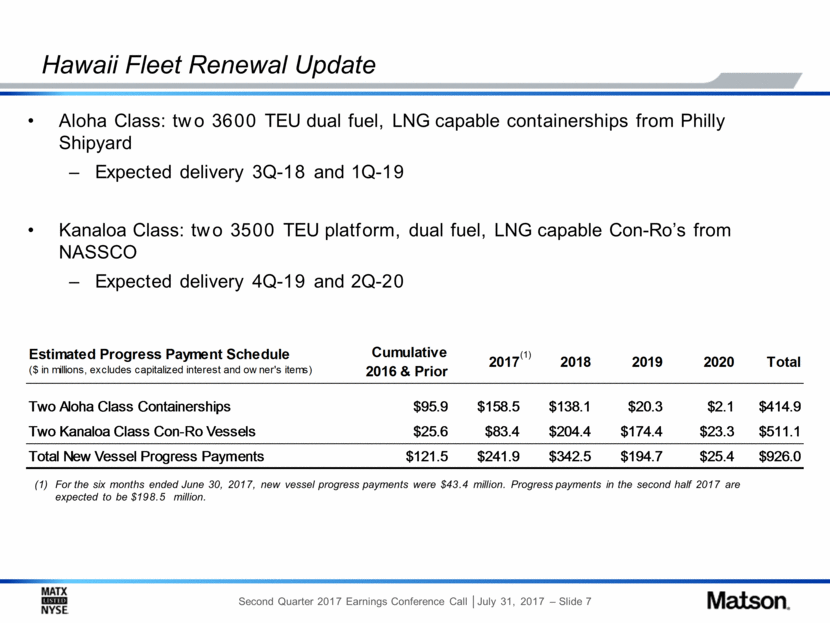
Hawaii Fleet Renewal Update Aloha Class: two 3600 TEU dual fuel, LNG capable containerships from Philly Shipyard Expected delivery 3Q-18 and 1Q-19 Kanaloa Class: two 3500 TEU platform, dual fuel, LNG capable Con-Ro’s from NASSCO Expected delivery 4Q-19 and 2Q-20 For the six months ended June 30, 2017, new vessel progress payments were $43.4 million. Progress payments in the second half 2017 are expected to be $198.5 million. (1) Estimated Progress Payment Schedule ($ in millions, excludes capitalized interest and owner's items) Cumulative 2016 & Prior 2017 2018 2019 2020 Total Two Aloha Class Containerships $95.9 $158.5 $138.1 $20.3 $2.1 $414.9 Two Kanaloa Class Con-Ro Vessels $25.6 $83.4 $204.4 $174.4 $23.3 $511.1 Total New Vessel Progress Payments $121.5 $241.9 $342.5 $194.7 $25.4 $926.0 |
|
|
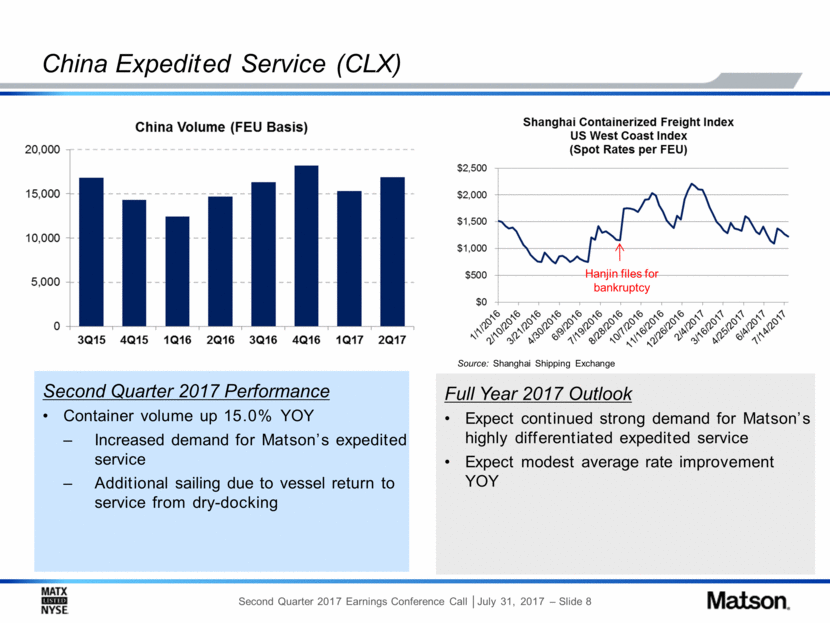
China Expedited Service (CLX) Second Quarter 2017 Performance Container volume up 15.0% YOY Increased demand for Matson’s expedited service Additional sailing due to vessel return to service from dry-docking Full Year 2017 Outlook Expect continued strong demand for Matson’s highly differentiated expedited service Expect modest average rate improvement YOY Source: Shanghai Shipping Exchange Hanjin files for bankruptcy |
|
|
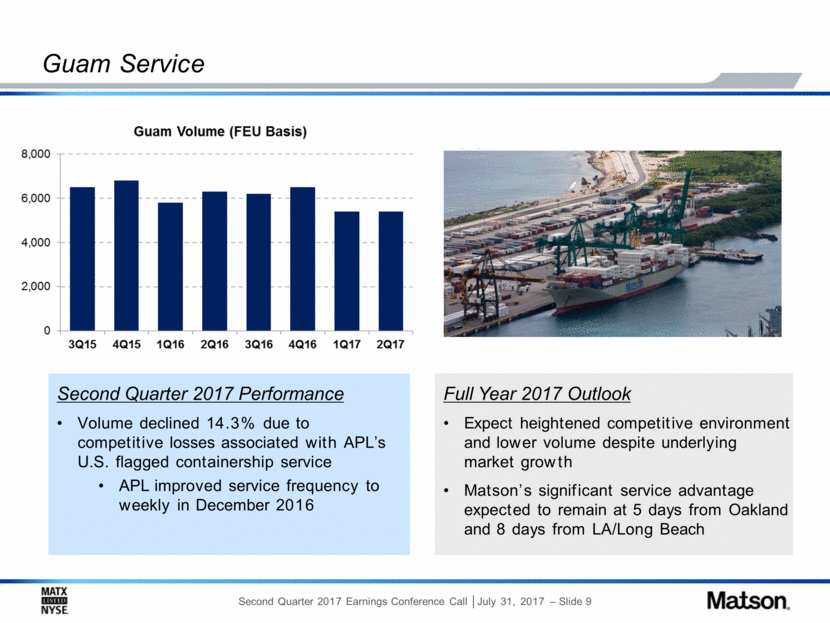
Guam Service Full Year 2017 Outlook Expect heightened competitive environment and lower volume despite underlying market growth Matson’s significant service advantage expected to remain at 5 days from Oakland and 8 days from LA/Long Beach Second Quarter 2017 Performance Volume declined 14.3% due to competitive losses associated with APL’s U.S. flagged containership service APL improved service frequency to weekly in December 2016 |
|
|
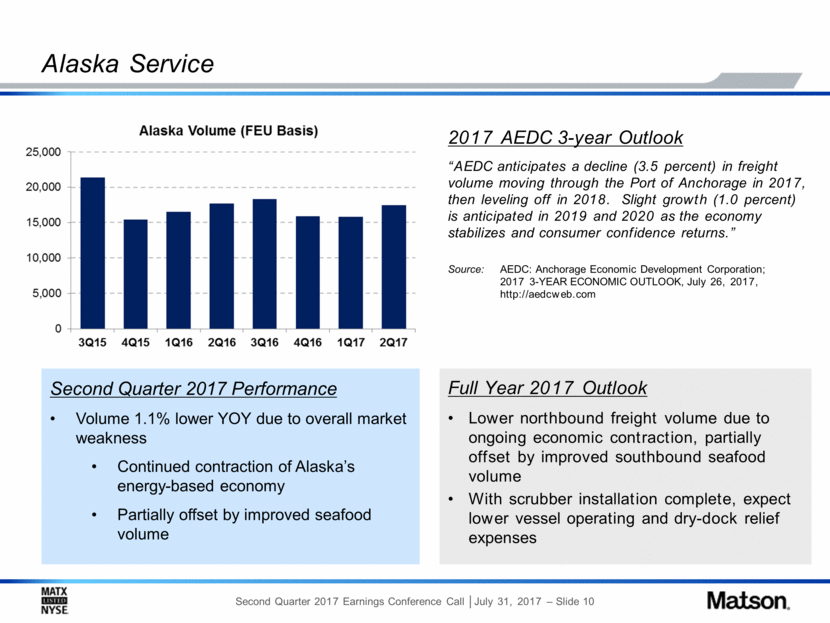
Alaska Service Full Year 2017 Outlook Lower northbound freight volume due to ongoing economic contraction, partially offset by improved southbound seafood volume With scrubber installation complete, expect lower vessel operating and dry-dock relief expenses Second Quarter 2017 Performance Volume 1.1% lower YOY due to overall market weakness Continued contraction of Alaska’s energy-based economy Partially offset by improved seafood volume 2017 AEDC 3-year Outlook “AEDC anticipates a decline (3.5 percent) in freight volume moving through the Port of Anchorage in 2017, then leveling off in 2018. Slight growth (1.0 percent) is anticipated in 2019 and 2020 as the economy stabilizes and consumer confidence returns.” Source: AEDC: Anchorage Economic Development Corporation; 2017 3-YEAR ECONOMIC OUTLOOK, July 26, 2017, http://aedcweb.com |
|
|
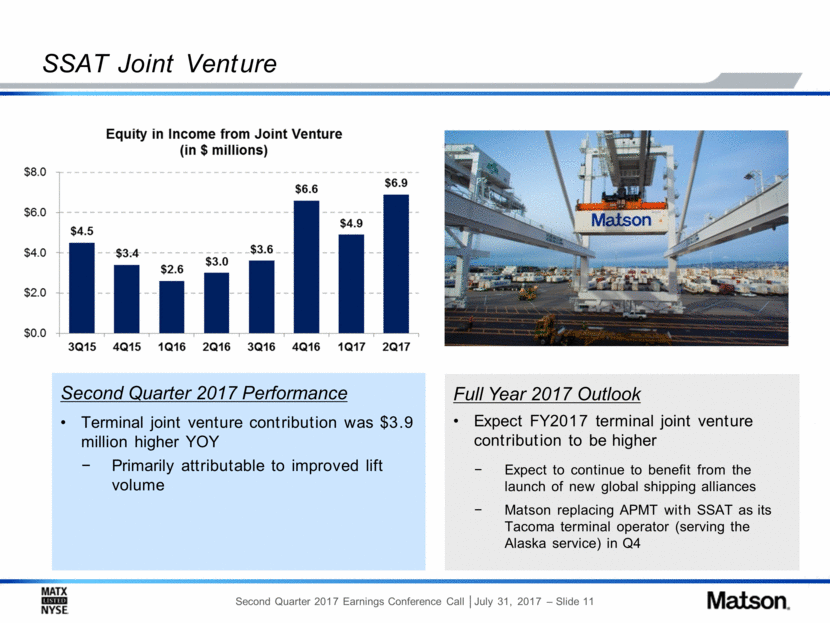
SSAT Joint Venture Second Quarter 2017 Performance Terminal joint venture contribution was $3.9 million higher YOY Primarily attributable to improved lift volume Full Year 2017 Outlook Expect FY2017 terminal joint venture contribution to be higher Expect to continue to benefit from the launch of new global shipping alliances Matson replacing APMT with SSAT as its Tacoma terminal operator (serving the Alaska service) in Q4 |
|
|
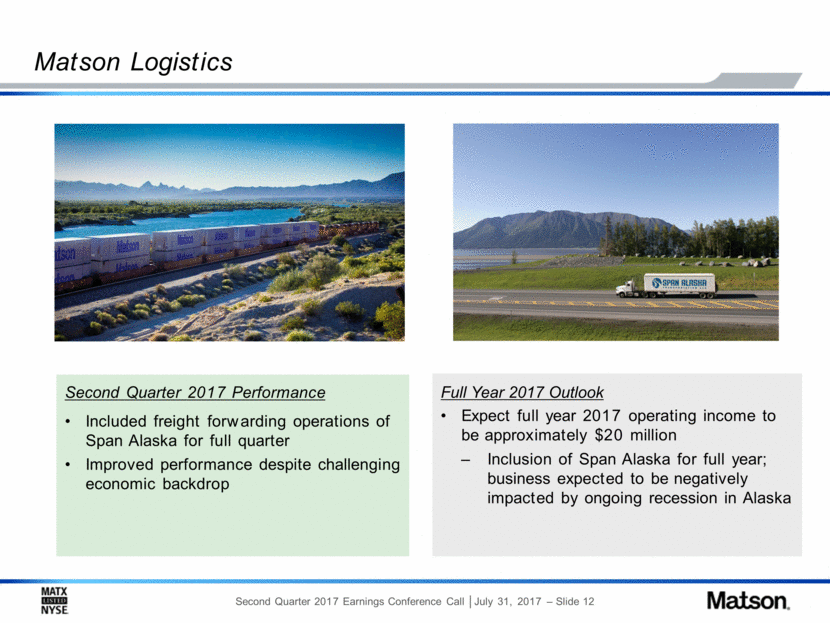
Matson Logistics Second Quarter 2017 Performance Included freight forwarding operations of Span Alaska for full quarter Improved performance despite challenging economic backdrop Full Year 2017 Outlook Expect full year 2017 operating income to be approximately $20 million Inclusion of Span Alaska for full year; business expected to be negatively impacted by ongoing recession in Alaska |
|
|
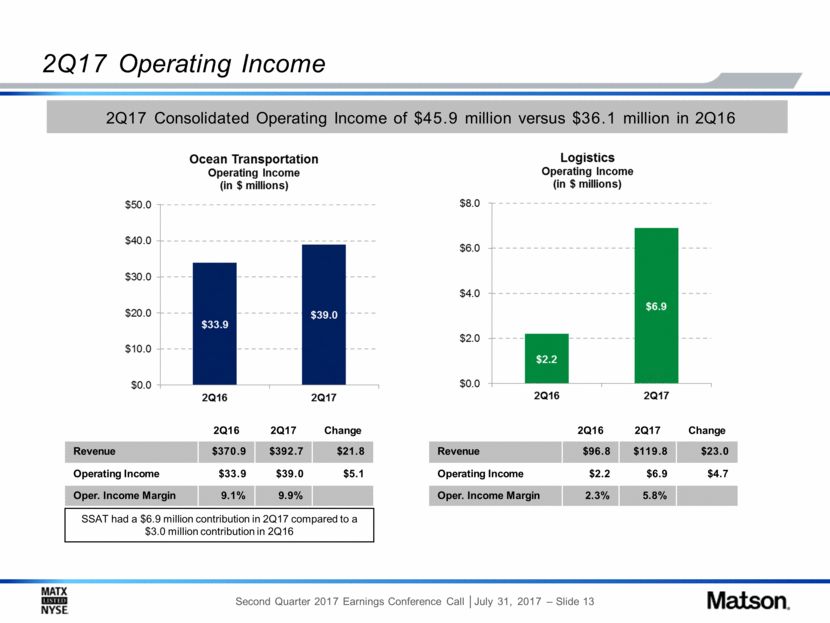
2Q17 Operating Income SSAT had a $6.9 million contribution in 2Q17 compared to a $3.0 million contribution in 2Q16 2Q16 2Q17 Change Revenue $370.9 $392.7 $21.8 Operating Income $33.9 $39.0 $5.1 Oper. Income Margin 9.1% 9.9% 2Q16 2Q17 Change Revenue $96.8 $119.8 $23.0 Operating Income $2.2 $6.9 $4.7 Oper. Income Margin 2.3% 5.8% 2Q17 Consolidated Operating Income of $45.9 million versus $36.1 million in 2Q16 |
|
|
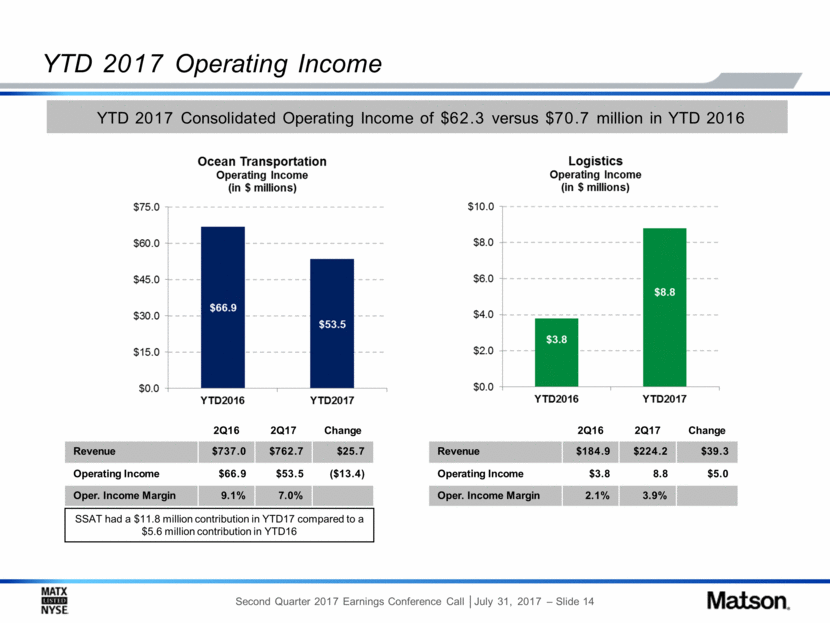
YTD 2017 Operating Income SSAT had a $11.8 million contribution in YTD17 compared to a $5.6 million contribution in YTD16 2Q16 2Q17 Change Revenue $737.0 $762.7 $25.7 Operating Income $66.9 $53.5 ($13.4) Oper. Income Margin 9.1% 7.0% 2Q16 2Q17 Change Revenue $184.9 $224.2 $39.3 Operating Income $3.8 8.8 $5.0 Oper. Income Margin 2.1% 3.9% YTD 2017 Consolidated Operating Income of $62.3 versus $70.7 million in YTD 2016 |
|
|
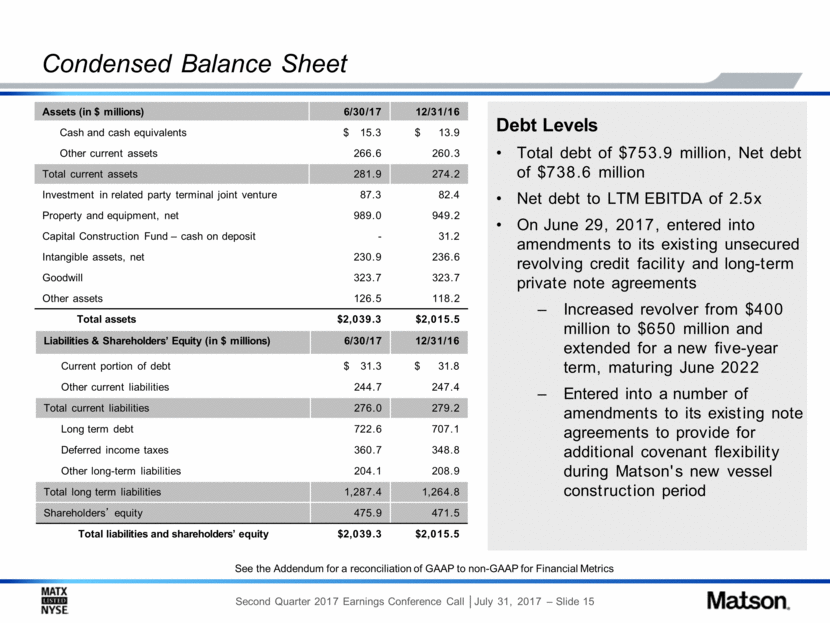
Condensed Balance Sheet Assets (in $ millions) 6/30/17 12/31/16 Cash and cash equivalents $ 15.3 $ 13.9 Other current assets 266.6 260.3 Total current assets 281.9 274.2 Investment in related party terminal joint venture 87.3 82.4 Property and equipment, net 989.0 949.2 Capital Construction Fund – cash on deposit - 31.2 Intangible assets, net 230.9 236.6 Goodwill 323.7 323.7 Other assets 126.5 118.2 Total assets $2,039.3 $2,015.5 Liabilities & Shareholders’ Equity (in $ millions) 6/30/17 12/31/16 Current portion of debt $ 31.3 $ 31.8 Other current liabilities 244.7 247.4 Total current liabilities 276.0 279.2 Long term debt 722.6 707.1 Deferred income taxes 360.7 348.8 Other long-term liabilities 204.1 208.9 Total long term liabilities 1,287.4 1,264.8 Shareholders’ equity 475.9 471.5 Total liabilities and shareholders’ equity $2,039.3 $2,015.5 Debt Levels Total debt of $753.9 million, Net debt of $738.6 million Net debt to LTM EBITDA of 2.5x On June 29, 2017, entered into amendments to its existing unsecured revolving credit facility and long-term private note agreements Increased revolver from $400 million to $650 million and extended for a new five-year term, maturing June 2022 Entered into a number of amendments to its existing note agreements to provide for additional covenant flexibility during Matson's new vessel construction period See the Addendum for a reconciliation of GAAP to non-GAAP for Financial Metrics |
|
|
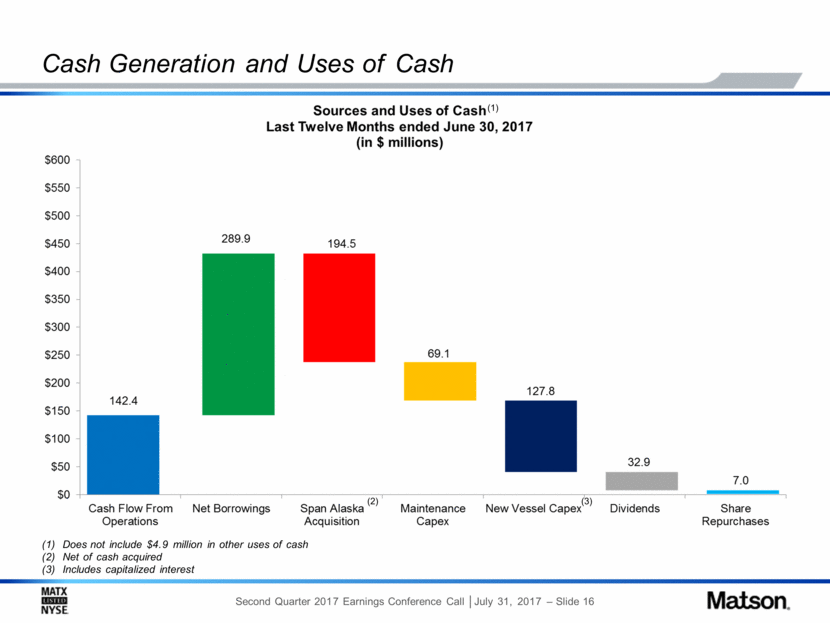
Cash Generation and Uses of Cash Does not include $4.9 million in other uses of cash Net of cash acquired Includes capitalized interest (2) (1) (3) |
|
|
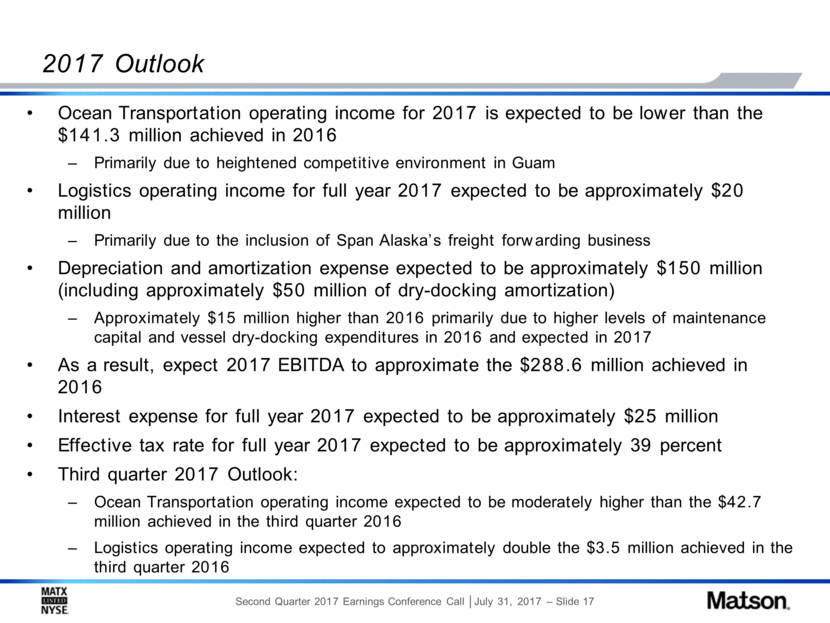
2017 Outlook Ocean Transportation operating income for 2017 is expected to be lower than the $141.3 million achieved in 2016 Primarily due to heightened competitive environment in Guam Logistics operating income for full year 2017 expected to be approximately $20 million Primarily due to the inclusion of Span Alaska’s freight forwarding business Depreciation and amortization expense expected to be approximately $150 million (including approximately $50 million of dry-docking amortization) Approximately $15 million higher than 2016 primarily due to higher levels of maintenance capital and vessel dry-docking expenditures in 2016 and expected in 2017 As a result, expect 2017 EBITDA to approximate the $288.6 million achieved in 2016 Interest expense for full year 2017 expected to be approximately $25 million Effective tax rate for full year 2017 expected to be approximately 39 percent Third quarter 2017 Outlook: Ocean Transportation operating income expected to be moderately higher than the $42.7 million achieved in the third quarter 2016 Logistics operating income expected to approximately double the $3.5 million achieved in the third quarter 2016 |
|
|
Addendum |
|
|
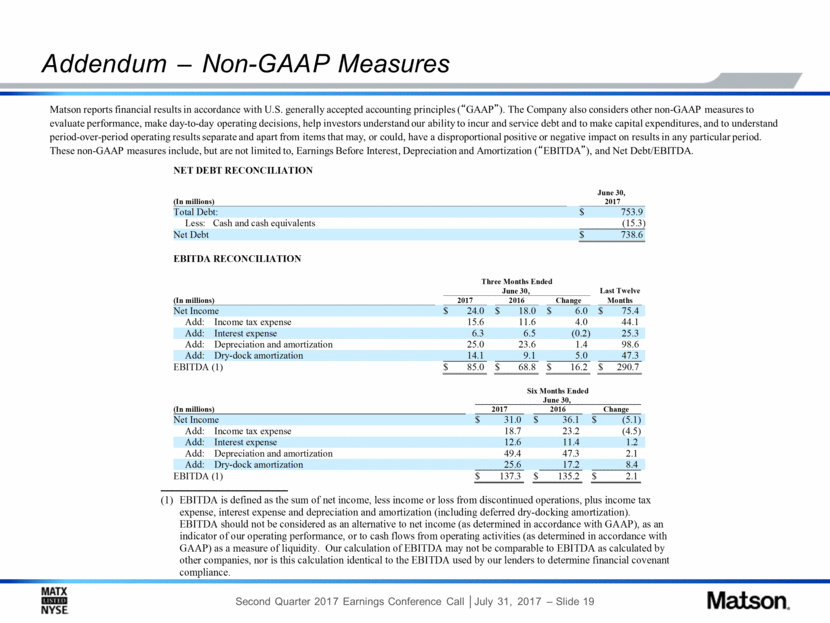
Addendum – Non-GAAP Measures Matson reports financial results in accordance with U.S. generally accepted accounting principles (“GAAP”). The Company also considers other non-GAAP measures to evaluate performance, make day-to-day operating decisions, help investors understand our ability to incur and service debt and to make capital expenditures, and to understand period-over-period operating results separate and apart from items that may, or could, have a disproportional positive or negative impact on results in any particular period. These non-GAAP measures include, but are not limited to, Earnings Before Interest, Depreciation and Amortization (“EBITDA”), and Net Debt/EBITDA. (1) EBITDA is defined as the sum of net income, less income or loss from discontinued operations, plus income tax expense, interest expense and depreciation and amortization (including deferred dry - docking amortization). EBITDA should not be considered as an alternative to net income (as determined in accordance with GAAP), as an indicator of our operating performance, or to cash flows from operating activities (as determined in accordance with GAAP) as a measure of liquidity. Our calculation of EBITDA may not be comparable to EBITDA as calculated by other companies, nor is this calculation identical to the EBITDA used by our lenders to determine financial covenant compliance . NET DEBT RECONCILIATION June 30, (In millions) 2017 Total Debt: $ 753.9 Less: Cash and cash equivalents (15.3) Net Debt $ 738.6 EBITDA RECONCILIATION Three Months Ended June 30, Last Twelve (In millions) 2017 2016 Change Months Net Income $ 24.0 $ 18.0 $ 6.0 $ 75.4 Add: Income tax expense 15.6 11.6 4.0 44.1 Add: Interest expense 6.3 6.5 (0.2) 25.3 Add: Depreciation and amortization 25.0 23.6 1.4 98.6 Add: Dry - dock amortization 14.1 9.1 5.0 47.3 EBITDA (1) $ 85.0 $ 68.8 $ 16.2 $ 290.7 Six Months Ended June 30, (In millions) 2017 2016 Change Net Income $ 31.0 $ 36.1 $ (5.1) Add: Income tax expense 18.7 23.2 (4.5) Add: Interest expense 12.6 11.4 1.2 Add: Depreciation and amortization 49.4 47.3 2.1 Add: Dry - dock amortization 25.6 17.2 8.4 EBITDA (1) $ 137.3 $ 135.2 $ 2.1 |

