Attached files
| file | filename |
|---|---|
| EX-99 - EX-99 - PUBLIC SERVICE ENTERPRISE GROUP INC | d429044dex99.htm |
| 8-K - FORM 8-K - PUBLIC SERVICE ENTERPRISE GROUP INC | d429044d8k.htm |
 Public
Service Enterprise Group PSEG Earnings Conference Call
2 nd Quarter 2017 July 28, 2017 EXHIBIT 99.1 |
| 1 Forward-Looking Statements Certain of the matters discussed in this presentation about our and our subsidiaries’ future performance, including,
without limitation, future revenues, earnings, strategies, prospects, consequences and all other statements that are not purely historical constitute “forward-looking statements”
within the meaning of the Private Securities Litigation Reform Act of 1995. Such forward-looking statements are subject to risks and uncertainties, which could cause actual results to differ
materially from those anticipated. Such statements are based on management’s beliefs as well as assumptions made by and information currently available to management. When used herein, the words
“anticipate,” “intend,” “estimate,” “believe,” “expect,” “plan,” “should,” “hypothetical,” “potential,” “forecast,” “project,” variations of such words and
similar expressions are intended to identify forward-looking statements. Factors that may cause actual results to differ are often presented with the forward-looking statements themselves. Other factors that could cause actual results to
differ materially from those contemplated in any forward-looking statements made by us herein are discussed in filings we make with the United States Securities and Exchange Commission (SEC) including our Annual Report on Form 10-K and subsequent reports on Form 10-Q and Form 8-K. These factors include, but are not limited to:
• fluctuations in wholesale power
and natural gas markets, including the potential impacts on the economic viability of our generation units; • our ability to obtain adequate fuel supply;
• any inability to manage our
energy obligations with available supply;
• increases in competition in
wholesale energy and capacity markets;
• changes in technology related to
energy generation, distribution and consumption and customer usage patterns; • economic downturns; • third party credit risk relating to our sale of generation output and purchase of
fuel; • adverse
performance of our decommissioning and defined benefit plan trust fund investments and changes in funding requirements; • changes in state and federal legislation and regulations;
• the impact of pending rate case
proceedings; •
regulatory, financial, environmental, health and safety risks associated with our ownership and operation of nuclear facilities; • adverse changes in energy industry laws, policies and regulations, including market
structures and transmission planning;
• changes in federal and state
environmental regulations and enforcement;
• delays in receipt of, or an
inability to receive, necessary licenses and permits;
• adverse outcomes of any legal,
regulatory or other proceeding, settlement, investigation or claim applicable to us and/or the energy industry; • changes in tax laws and regulations;
• the impact of our holding company
structure on our ability to meet our corporate funding needs, service debt and pay dividends; • lack of growth or slower growth in the number of customers or changes in customer
demand; • any
inability of Power to meet its commitments under forward sale obligations; • reliance on transmission facilities that we do not own or control and the impact on our
ability to maintain adequate transmission capacity;
• any inability to successfully
develop or construct generation, transmission and distribution projects; • any equipment failures, accidents, severe weather events or other incidents that impact our ability to provide safe and reliable service to our customers; • our inability to exercise control over the operations of generation facilities in which we
do not maintain a controlling interest;
• any inability to maintain
sufficient liquidity;
• any inability to realize
anticipated tax benefits or retain tax credits;
• challenges associated with
recruitment and/or retention of key executives and a qualified workforce; • the impact of our covenants in our debt instruments on our operations; and
• the impact of acts of terrorism,
cybersecurity attacks or intrusions. All of the
forward-looking statements made in this presentation are qualified by these cautionary statements and we cannot assure you that the results or developments anticipated by management
will be realized or even if realized, will have the expected
consequences to, or effects on, us or our business, prospects, financial condition, results of operations or cash flows. Readers are cautioned not to place undue reliance on these forward-looking statements in making any investment decision.
Forward-looking statements made in this presentation apply only as of the date of this presentation. While we may elect to update forward-looking statements from time to time, we specifically disclaim
any obligation to do so, even in light of new information or future events, unless otherwise required by applicable securities laws.
The forward-looking statements contained in this
presentation are intended to qualify for the safe harbor provisions of Section 27A of the Securities Act of 1933, as amended, and Section 21E of the Securities Exchange Act of 1934, as amended. |
 2 GAAP Disclaimer PSEG presents Operating Earnings and Adjusted Earnings Before Interest, Taxes, Depreciation and Amortization (EBITDA) in
addition to its Net Income reported in accordance with accounting principles generally
accepted in the United States (GAAP). Operating Earnings and Adjusted
EBITDA are non-GAAP financial measures that differ from Net Income. Non-GAAP Operating Earnings exclude the impact of returns (losses) associated with the Nuclear Decommissioning Trust (NDT), Mark-to-Market (MTM)
accounting and material one-time items. Non-GAAP Adjusted
EBITDA excludes the same items as our non-GAAP Operating Earnings
measure as well as income tax expense, interest expense and depreciation and amortization. The last two slides in this presentation (Slides A and B) include a list of items excluded from Net Income/(Loss) to reconcile to non-GAAP Operating
Earnings and non-GAAP Adjusted EBITDA with a reference to those slides included on
each of the slides where the non-GAAP information
appears. Management uses non-GAAP Operating Earnings in its internal
analysis, and in communications with investors and analysts, as a
consistent measure for comparing PSEG’s financial performance to previous
financial results. Management believes non-GAAP Adjusted EBITDA is
useful to investors and other users of our financial statements in evaluating operating performance because it provides them with an additional tool to compare business performance across companies and across periods. Management also
believes that non-GAAP Adjusted EBITDA is widely used by investors to measure
operating performance without regard to items such as income tax expense,
interest expense and depreciation and amortization, which can vary substantially from company to company depending upon, among other things, the book value of assets, capital structure and whether assets were constructed or
acquired. Non-GAAP Adjusted EBITDA also allows investors and other users to assess
the underlying financial performance of our fleet before
management’s decision to deploy capital. The presentation of non-GAAP Operating Earnings and non-GAAP Adjusted EBITDA is intended to complement, and should not be considered an alternative to, the presentation of Net Income, which is an
indicator of financial performance determined in accordance with GAAP. In addition,
non-GAAP Operating Earnings and non-GAAP Adjusted EBITDA as
presented in this release may not be comparable to similarly titled measures used by other companies. Due to the forward looking nature of non-GAAP Operating Earnings and non-GAAP Adjusted EBITDA guidance, PSEG is unable to
reconcile these non-GAAP financial measures to the most directly comparable GAAP
financial measure. Management is unable to project certain
reconciling items, in particular MTM and NDT gains (losses), for future periods due to market volatility. These materials and other financial releases can be found on the PSEG website at www.pseg.com, under the
Investors tab. From time to time, PSEG, PSE&G and PSEG Power release
important information via postings on their corporate website at http://investor.pseg.com. Investors and other interested parties are encouraged to
visit the corporate website to review new postings. The “email alerts” link
at http://investor.pseg.com may be
used to enroll to receive automatic email alerts and/or really simple
syndication (RSS) feeds regarding new postings at http://investor.pseg.com/rss. |
 PSEG
2017 Q2 Review
Ralph Izzo Chairman, President and Chief Executive Officer |
 4 Second Quarter Highlights Net Income of $0.22 vs. Net Income of $0.37 per share in Q2 2016, reflecting Hudson & Mercer
retirements Non-GAAP Operating Earnings* of $0.62 vs. $0.57 per share in Q2 2016 PSE&G achieved 17% growth in Q2 earnings per share over Q2 2016 – supported by increased investment in transmission and distribution, and cost containment PSEG Power results aided by continued cost control Operational Excellence Nuclear fleet achieved a capacity factor of 89.6% for Q2 and 94.8% for the first-half of 2017 PSE&G named Smart Electric Power Alliance’s (SEPA) 2017 Investor Owned Utility of the Year,
recognizing PSE&G’s Solar 4 All program and its leadership in landfill and
brownfield solar development Disciplined Capital Investment
– Producing Results
PSEG to invest ~$4.7 billion in 2017, consisting of ~$3.4 billion at PSE&G and
~$1.2 billion at PSEG Power
Regulatory & Policy Focus: New Jersey Board of Public Utilities (BPU) actions
support infrastructure investment; Energy Efficiency agreement in
principle reached; $2.7 billion, 5-year Gas System
Modernization Program (GSMP) extension and expansion filing
Hudson and Mercer coal/gas generating stations retired on June 1
PSEG Q2 2017 – Solid financial results at both businesses * See Slides A and B for Items excluded from Net Income to reconcile to Operating Earnings (non-GAAP). |
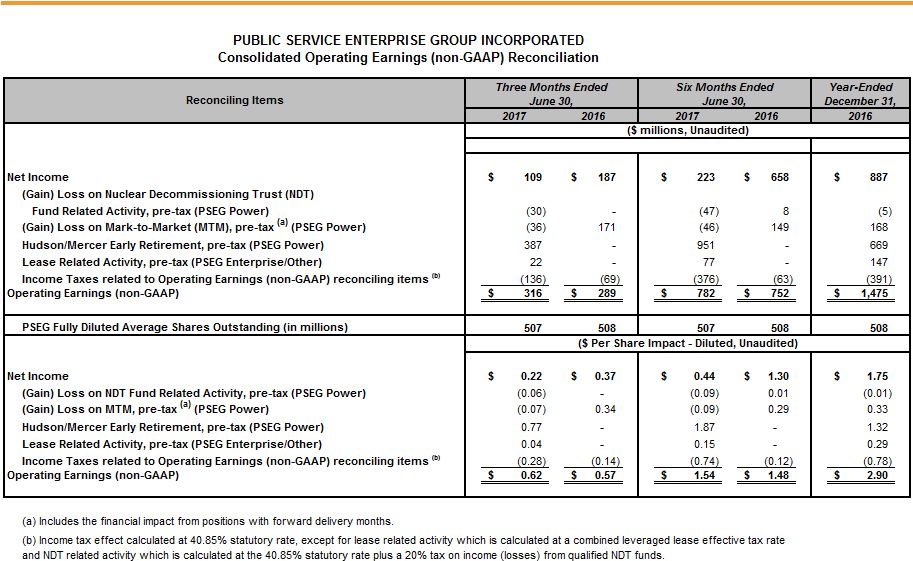
 5 PSEG Q2 Summary – GAAP EPS decline reflects Hudson & Mercer retirements Quarter ended June 30
*See Slide A for Items excluded from Net Income to reconcile to Operating Earnings
(non-GAAP). $ millions (except EPS)
2017 2016 Change Net Income $ 109 $ 187 $ (78) Reconciling Items 207 102 105 Operating Earnings (non-GAAP)* $ 316 $ 289 $ 27 EPS from Net Income $ 0.22 $ 0.37 $ (0.15) EPS from Operating Earnings (non-GAAP)* $ 0.62 $ 0.57 $ 0.05 Non-GAAP EPS results up 9% |
 6 PSEG First Half Summary – GAAP EPS decline reflects Hudson & Mercer June 1 retirements Six Months ended June 30 *See Slide A for Items excluded from Net Income to reconcile to Operating Earnings (non-GAAP).
$ millions (except EPS)
2017 2016 Change Net Income $ 223 $ 658 $ (435) Reconciling Items 559 94 465 Operating Earnings (non-GAAP)* $ 782 $ 752 $ 30 EPS from Net Income $ 0.44 $ 1.30 $ (0.86) EPS from Operating Earnings (non-GAAP)* $ 1.54 $ 1.48 $ 0.06 Non-GAAP EPS results up 4% |
 7 PSE&G – BPU Proposal to Incentivize Investment Infrastructure Investment Program (IIP) The BPU on June 30 proposed changes in regulation that would: Encourage and support accelerated utility investment Support system safety, reliability, resiliency and sustained economic growth in NJ
Support accelerated recovery on qualifying investments, and
Allow utility companies the option to seek approval for investment programs
extending up to five years (with a base rate case within five
years) The BPU is receiving comments on the proposal, and a final order is
anticipated by year-end |
 Growth
in utility infrastructure investment drives increased growth in regulated
earnings contribution 8
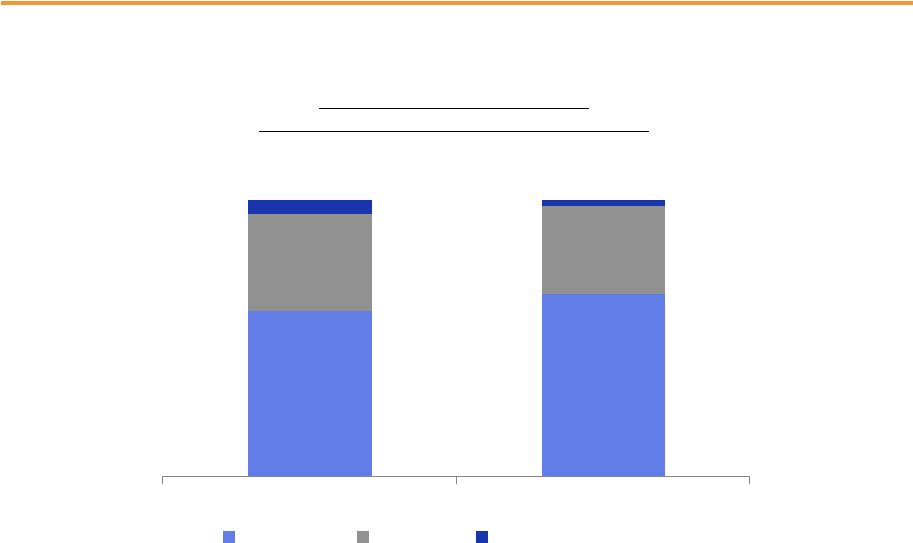
$2.80 - $3.00E PSEG - Maintaining 2017 Non-GAAP Earnings Guidance $2.90 Non-GAAP Operating Earnings* Contribution by Subsidiary and 2017 Guidance * See Slide A for Items excluded from Net Income to reconcile to Operating Earnings (non-GAAP).
** Based on the mid-point of 2017 non-GAAP Operating Earnings guidance of $2.80 - $3.00 per share. E = Estimate.
2016
2017E** PSE&G Power Enterprise/Other 60% 66% 32% 35% |
 PSEG
2017 Q2 Operating Company Review
Dan Cregg EVP and Chief Financial Officer |
 10 PSEG – Q2 Results by Subsidiary GAAP Net Income/(Loss) 2017 2016 Change PSE&G $ 0.41 $ 0.35 $ 0.06 PSEG Power $ (0.19) $ (0.02) $ (0.17) PSEG Enterprise/Other $ 0.00 $ 0.04 $ (0.04) Total PSEG $ 0.22 $ 0.37 $ (0.15) Non-GAAP Operating Earnings* 2017 2016 Change PSE&G $ 0.41 $ 0.35 $ 0.06 PSEG Power $ 0.19 $ 0.18 $ 0.01 PSEG Enterprise/Other $ 0.02 $ 0.04 $ (0.02) Total PSEG* $ 0.62 $ 0.57 $ 0.05 *See Slides A and B for Items excluded from Net Income/(Loss) to reconcile to Operating Earnings (non-GAAP) for PSEG, PSEG Power and
PSEG Enterprise/Other.
PSEG Q2 EPS Summary –
Quarter ended June 30 |
 11 $0.37 $0.57 0.06 0.01 $0.62 $0.00 $0.10 $0.20 $0.30 $0.40 $0.50 $0.60 $0.70 $0.80 PSEG EPS Reconciliation – Q2 2017 versus Q2 2016 * See Slide A for Items excluded from Net Income to reconcile to Operating Earnings (non-GAAP).
Capacity 0.01 Higher Volume 0.01 Recontracting (0.03) O&M 0.02 Transmission 0.04 Electric and Gas Margin 0.02 D&A (0.01) Other 0.01 Q2 2017 Net Income Q2 2016 Net Income PSEG Power PSE&G Enterprise/ Other Q2 2016 Operating Earnings (non-GAAP)* Q2 2017 Operating Earnings (non-GAAP)* Interest Expense and Taxes (0.02) $0.22 Utility investment and cost control drove Q2 results |
 12 PSEG – First Half Results by Subsidiary GAAP Net Income/(Loss) 2017 2016 Change PSE&G $ 1.00 $ 0.87 $ 0.13 PSEG Power $ (0.53) $ 0.36 $ (0.89) PSEG Enterprise/Other $ (0.03) $ 0.07 $ (0.10) Total PSEG $ 0.44 $ 1.30 $ (0.86) Non-GAAP Operating Earnings* 2017 2016 Change PSE&G $ 1.00 $ 0.87 $ 0.13 PSEG Power $ 0.49 $ 0.54 $ (0.05) PSEG Enterprise/Other $ 0.05 $ 0.07 $ (0.02) Total PSEG* $ 1.54 $ 1.48 $ 0.06 PSEG First Half EPS Summary – Six months ended June 30 *See Slides A and B for Items excluded from Net Income/(Loss) to reconcile to Operating Earnings (non-GAAP) for PSEG, PSEG Power and PSEG
Enterprise/Other. |
 13 PSEG EPS Reconciliation – First Half 2017 versus First Half 2016 * See Slide A for Items excluded from Net Income to reconcile to Operating Earnings (non-GAAP).
Capacity 0.01 Higher Gas Send-out 0.02 Recontracting (0.13) O&M 0.05 Transmission 0.07 Electric and Gas Margin 0.05 Distribution O&M 0.02 Distribution D&A (0.02) Taxes & Other 0.01 YTD 2017 Net Income YTD 2016 Net Income PSEG Power PSE&G Enterprise/ Other YTD 2016 Operating Earnings (non-GAAP)* YTD 2017 Operating Earnings (non-GAAP)* Interest Expense, Taxes and Other Utility investment and cost control drove year-to-date growth $1.30 $1.48 0.13 $1.54 (0.05) (0.02) $0.00 $0.50 $1.00 $1.50 $2.00 $0.44
|
 PSE&G 2017 Q2 Review |
 $0.35 0.06 0.00 $0.41 0.00 0.10 0.20 0.30 0.40 0.50 0.60 0.70 15 PSE&G EPS Reconciliation – Q2 2017 versus Q2 2016 Q2 2017 Net Income Q2 2016 Net Income Transmission 0.04 Electric and Gas Margin 0.02 D&A (0.01) Other 0.01 Earnings per share rose by 17% vs. Q2 2016, reflecting infrastructure investment |
 16 PSE&G – Q2 2017 weather had minor impact on EPS 2017 vs. 2016 vs. Normal PSE&G Monthly Weather Summary 279 174 20 365 170 5 359 128 15 0 100 200 300 400 500 2017 2016 Normal 358 851 3,160 129 1,164 2,497 166 877 3,019 0 500 1,000 1,500 2,000 2,500 3,000 3,500 2017 2016 Normal April May June April May June Monthly Temperature Humidity Index (THI) Monthly Heating Degree Days (HDD) Q2 2017 heating degree days were ~12% lower than Q2 2016 and ~6% lower than normal Q2 2017 temperature-humidity index was ~15% higher than Q2 2016 and ~8% higher than normal |
| 17 PSE&G – Regulatory Agreement/Filing Support Long-term Objectives PSE&G’s recent filing to extend its Gas System Modernization Program (GSMP)
and an agreement reached on its proposed Energy Efficiency investment program
reinforce PSE&G’s commitment to provide clean, reliable energy for
its customers Gas System Modernization Program II
In July, PSE&G filed for a 5-year extension of the GSMP which would accelerate
the pace of replacement of its aging cast iron and unprotected steel
mains and associated service. PSE&G is proposing to invest
approximately $540 million per year, or up to $2.7 billion, over the 5-year program
beginning in 2019. The filing is consistent with the draft regulations
that the BPU issued in June regarding Infrastructure Investment
Programs. Energy Efficiency
In July, PSE&G reached an agreement in principle with BPU Staff and Rate Counsel
related to its proposed request to extend its investment in Energy
Efficiency. Under the agreement, PSE&G would invest $69 million in
energy efficiency equipment for hospitals, multi-family housing and other sectors and a residential energy efficiency offering for smart thermostats and data analytics. The agreement
represents more than 90% of PSE&G’s request.
|
 18 PSE&G – Q2 Operating Highlights Filed for a 5-year extension and expansion of our Gas System Modernization Program
Agreement in principle reached on PSE&G’s Energy Efficiency filing provides a
~$69 million investment PSE&G set to file its distribution base rate
case with the BPU no later than November 1, 2017 Operations
Regulatory and Market Environment PSE&G’s Q2 2017 earnings increased by $0.06 or 17% to $0.41 per share
PSE&G is on-track to meet its 2017 plan to invest approximately ~$3.4 billion
to upgrade and expand Transmission & Distribution infrastructure
PSE&G’s
2017 Net Income guidance range remains unchanged at $945 - $985 million Financial Total electric sales were flat on a weather normalized basis for the trailing 12 months ended June 30
Total firm gas sales were slightly higher at 0.4% for the trailing 12 months ended June
30 due to increased commercial sales
The first half of 2017 was the 3rd mildest in New Jersey state records with HDD ~9%
below normal and ~2% lower than first-half 2016
SEPA named PSE&G its 2017 Investor Owned Utility of the Year, recognizing its
leadership in utility-scale solar development on landfill and
brownfield sites |
 PSEG
Power 2017 Q2 Review |
 20 $0.18 0.02 $0.19 $(0.02) (0.01) $(0.19) -0.20 -0.10 0.00 0.10 0.20 0.30 Capacity 0.01 Higher Volume 0.01 Recontracting/ Lower Prices (0.03) PSEG Power EPS Reconciliation – Q2 2017 versus Q2 2016 O&M * See Slide B for Items excluded from Net Income/(Loss) to reconcile to non-GAAP Operating Earnings for PSEG Power.
Q2 2016
Operating Earnings* (non-GAAP) Q2 2017 Operating Earnings* (non-GAAP) Fewer outage-related days and cost control offset lower prices Q2 2017 Net (Loss) Q2 2016 Net (Loss) |
 21 PSEG Power – Q2 Generation increases 4% 6,983 7,566 912 1,360 4,551 4,025 0 5,000 10,000 15,000 2016 2017 Total Nuclear Total Coal** Natural Gas * Excludes solar and Kalaeloa. ** Includes figures for Pumped Storage.
PSEG Power – Generation (GWh)* 12,446 12,951 PSEG Power – Capacity Factors (%) Quarter ended June 30 2016 2017 Combined Cycle PJM and NY 62.3% 55.3% Coal** PA 57.0% 81.3% CT 0.0% 0.9% Nuclear 82.7% 89.6% Quarter ended June 30 ($ millions) 2016 2017 Gas $ 64 $ 83 Coal $ 22 $ 31 Total Fossil $ 86 $ 114 Nuclear $ 48 $ 47 Total Fuel Cost $ 134 $ 161 Total Generation (GWh)
12,446 12,951 $ / MWh 10.77 12.43 PSEG Power – Fuel Costs |
 22 PSEG Power – First Half Generation in-line with year-ago Total Nuclear Total Coal** Natural Gas * Excludes solar and Kalaeloa. ** Includes figures for Pumped Storage.
PSEG Power – Generation (GWh)* 25,646 25,786 PSEG Power – Capacity Factors (%) PSEG Power – Fuel Costs 15,402 15,921 1,939 2,794 8,305 7,071 0 5,000 10,000 15,000 20,000 25,000 30,000 2016 2017 Six months ended June 30 ($ millions) 2016 2017 Gas $ 131 $ 162 Coal $ 49 $ 65 Total Fossil $ 180 $ 227 Nuclear $ 105 $ 101 Total Fuel Cost $ 285 $ 328 Total Generation (GWh ) 25,646 25,786 $ / MWh 11.11 12.72 Six months ended June 30 2016 2017 Combined Cycle PJM and NY 57.0% 48.5% Coal** PA 57.9% 82.5% CT 3.0% 5.2% Nuclear 91.2% 94.8% |
 23 PSEG Power – Gross Margin Performance $0 $10 $20 $30 $40 $50 2015 2016 2017 $36 Quarter ended June 30 PS Zone pricing improved over Q2 2016 Baffle bolt replacement outages completed at both Salem units Capacity revenues were up slightly vs. Q2 2016 reflecting step-up in New England
capacity pricing to $232 MW/day
Regional spark spreads compressed in the quarter
Q2 2017 had 46 nuclear refueling outage days vs. 76 outage days in Q2 2016
Regional Performance
Region Q2 Gross Margin ($M) Q2 2017 Performance PJM $431 Higher generation offset by recontracting at lower prices New England $19 Higher generation and prices New York $17 Higher generation and market prices offset by lower hedges PSEG Power Gross Margin ($/MWh) $40 $39 |
 24 Hedging Update… Contracted Energy* * HEDGE PERCENTAGES AND PRICES AS OF JUNE 30, 2017. REVENUES OF FULL REQUIREMENT LOAD DEALS BASED ON CONTRACT PRICE, INCLUDING RENEWABLE ENERGY CREDITS, ANCILLARY, AND TRANSMISSION COMPONENTS BUT EXCLUDING CAPACITY. HEDGES INCLUDE POSITIONS WITH MTM ACCOUNTING TREATMENT AND OPTIONS. Jul-Dec 2017 2018 2019 Volume TWh 17 34 34 Base Load % Hedged 100% 100% 40-45% (Nuclear and Base Load Coal) Price $/MWh $46 $41 $41 Volume TWh 7 18 23 Intermediate, Combined Cycle, % Hedged 60-65% 0% 0% Peaking Price $/MWh $46 $ - $ - Volume TWh 20-25 52-54 58-60 Total % Hedged 85-90% 65-70% 25-30% Price $/MWh $46 $41 $41 |
 25 PSEG Power – Q2 Operating Highlights Q2 output up 4% with shorter Salem 2 refueling outage versus the extended Salem 1 outage in Q2 2016;
baffle bolt inspection and replacement addressed at Salem 2 this Spring
Nuclear fleet achieved average capacity factor of 89.6% in Q2, producing
7.6 TWh of energy CCGT fleet capacity factor was 55.3% versus 62.3% in Q2
2016, CCGT availability remained strong at ~90% and produced 4.0 TWh of
energy; Coal capacity factor up in PA on higher market demand, coal fleet
produced 1.4 TWh of energy Operations
Regulatory and Market Environment Financial The 2020/2021 RPM auction (with 100% Capacity Performance requirement) resulted in a higher
average price of $174 MW/day for 7,800 MW that cleared the auction
2017 expected generation output on track for 49-50 TWh; BGS load projected at 11
TWh Recent court actions in New York and Illinois affirm state initiatives
supporting Zero Emissions Credits Construction on schedule and on budget
at Keys and Sewaren 7 for targeted 2018 in-service; Bridgeport Harbor
5 progressing on schedule for targeted 2019 operations Power’s total
debt as a percentage of capitalization at June 30 was 31%
Power’s 2017 non-GAAP Operating Earnings guidance range remains unchanged at $435 - $510 million; non-GAAP Adjusted EBITDA guidance for 2017 remains unchanged at $1,080 to $1,210 million |
 PSEG |
 27 PSEG Financial Highlights PSE&G earnings forecast to grow 8.5% to comprise 66% of PSEG’s 2017
non-GAAP Operating Earnings
PSEG’s 5-Year capital spending forecast of $15 billion over 2017
– 2021
to be invested in PSE&G (82%) and Power (18%)
PSE&G successfully executing regulatory/policy initiatives supporting
its 5-year, 7 -
9% annual growth in rate base
PSEG Power’s $2 billion investment in new generation, located in PJM
and New England, will improve fleet efficiency and geographic diversity
Moody’s upgraded PSEG’s senior unsecured credit rating to Baa1,
the rating outlook is Stable; subsidiary company ratings were affirmed Increased 2017 indicative common dividend by 4.9% to $1.72 per share Financial position remains strong: Cash from Power and increasing cash flow from operations at PSE&G supports dividend growth and funds capital spending program without the need to issue equity
Debt as a percentage of capitalization was 49% at June 30
Reiterating 2017 non-GAAP Operating Earnings guidance of $2.80 - $3.00 per share |
 28 PSEG 2017 Guidance - By Subsidiary $ millions (except EPS) 2017E 2016 PSE&G (Net Income) $945 - $985 $889 PSEG Power $435 - $510 $514 PSEG Enterprise/Other $35 - $35 $72 Operating Earnings (non-GAAP)* $1,415 - $1,530 $1,475 Operating EPS (non-GAAP)* $2.80 - $3.00E $2.90 Segment Operating Earnings Guidance and Prior Results (non-GAAP, except as noted)* $ millions 2017E 2016 PSEG Power $1,080 - $1,210 $1,201 PSEG Power Adjusted EBITDA (non-GAAP)* * See Slide A for Items excluded from Net Income to reconcile to Operating Earnings (non-GAAP) and Slide B for Items excluded from Net
Income/(Loss) to reconcile to Operating Earnings (non-GAAP) and
Adjusted EBITDA (non-GAAP). E = Estimate. |
 PSEG
Liquidity as of June 30, 2017 29 |
 Reconciliation of Non-GAAP Operating Earnings
Please see Slide 2 for an explanation of PSEG’s use of Operating Earnings as a
non-GAAP financial measure and how it differs from Net
Income. A |
 B Reconciliation of Non-GAAP Operating Earnings and Non-GAAP Adjusted EBITDA Please see Slide 2 for an explanation of PSEG’s use of Operating Earnings and Adjusted EBITDA as non-GAAP financial measures
and how they differ from Net Income/(Loss).
|