Attached files
| file | filename |
|---|---|
| EX-99.1 - EX-99.1 - PUBLIC SERVICE ENTERPRISE GROUP INC | d429044dex991.htm |
| 8-K - FORM 8-K - PUBLIC SERVICE ENTERPRISE GROUP INC | d429044d8k.htm |
EXHIBIT 99

|
Investor News | NYSE: PEG |
For further information, contact:
|
• Kathleen A. Lally, Vice President – Investor Relations |
Phone: 973-430-6565 | |
| • Carlotta Chan, Manager - Investor Relations |
Phone: 973-430-6596
|
PSEG ANNOUNCES 2017 SECOND QUARTER RESULTS
NET INCOME OF $0.22 Per Share
Non-GAAP Operating Earnings of $0.62 Per Share
Re-Affirms 2017 Non-GAAP Operating Earnings Guidance of $2.80 - $3.00 Per Share
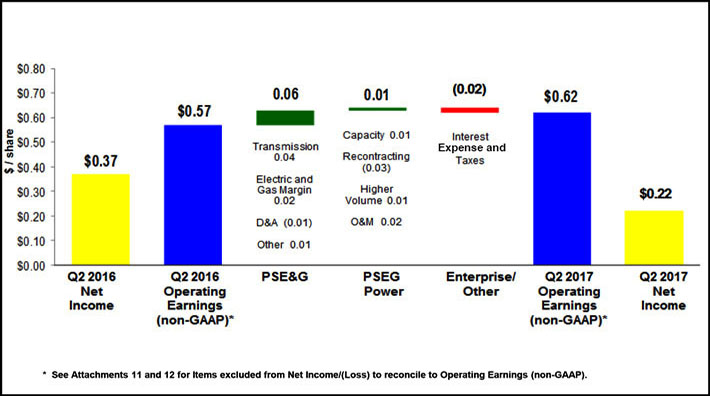
July 28, 2017 (Newark, NJ) (NYSE:PEG) Public Service Enterprise Group (PSEG) reported second quarter 2017 Net Income of $109 million or $0.22 per share as compared to Net Income of $187 million or $0.37 per share reported for the second quarter of 2016. Non-GAAP Operating Earnings for the second quarter of 2017 were $316 million or $0.62 per share as compared to Non-GAAP Operating Earnings for the second quarter of 2016 of $289 million or $0.57 per share. Net Income for the second quarter of 2017 was affected by accelerated depreciation associated with the June 1, 2017 retirement of the Hudson and Mercer coal/gas generating stations.
Ralph Izzo, Chairman, President and Chief Executive Officer said “PSEG’s second quarter earnings demonstrate the benefits of our utility investment program and adherence to operating efficiently. We remain committed to providing customers with affordable and resilient energy in a manner that also provides investors with strong, sustainable returns on capital. That commitment includes improving New Jersey’s aging infrastructure, as evidenced by our filing yesterday of a 5-year $2.7 billion extension of our Gas System Modernization Program.”
Management uses non-GAAP Operating Earnings in its internal analysis, and in communications with investors and analysts, as a consistent measure for comparing PSEG’s financial performance to previous financial results. Non-GAAP Operating Earnings exclude the impact of returns(losses) associated with Nuclear Decommissioning Trust (NDT), Mark-to-Market (MTM) accounting and material one-time items such as the previously noted Hudson and Mercer retirements.
The table below provides a reconciliation of PSEG’s Net Income to non-GAAP Operating Earnings for the second quarter. See Attachment 11 for a complete list of items excluded from Net Income in the determination of non-GAAP Operating Earnings. The presentation of non-GAAP Operating Earnings is intended to complement, and should not be considered an alternative to, the presentation of Net Income, which is an indicator of financial performance determined in accordance with GAAP. In addition, non-GAAP Operating Earnings as presented in this release may not be comparable to similarly titled measures used by other companies.
PSEG CONSOLIDATED EARNINGS (unaudited)
Second Quarter Comparative Results
2017 and 2016
| Income | Diluted Earnings | |||||||||||||||||||
| ($ millions) | Per Share | |||||||||||||||||||
| 2017 | 2016 | 2017 | 2016 | |||||||||||||||||
| Net Income |
$ | 109 | $ | 187 | $ | 0.22 | $ | 0.37 | ||||||||||||
| Reconciling Items* |
207 | 102 | 0.40 | 0.20 | ||||||||||||||||
|
|
|
|
|
|
|
|
|
|||||||||||||
| Non-GAAP Operating Earnings |
$ | 316 | $ | 289 | $ | 0.62 | $ | 0.57 | ||||||||||||
|
|
|
|
|
|
|
|
|
|||||||||||||
| Avg. Shares | 507M | 508M | ||||||||||||||||||
| * | See Attachment 11 |
GUIDANCE
Ralph Izzo went on to say, “We generated strong financial results in the first half of the year, and we are maintaining our non-GAAP Operating Earnings guidance for 2017 of $2.80 - $3.00 per share.”
Non-GAAP Operating Earnings guidance by company for the full year remains unchanged:
2017 Non-GAAP Operating Earnings Guidance
($ millions, except EPS)
| 2017E | ||||
| PSE&G |
$945 - $985 | |||
| PSEG Power |
$435 - $510 | |||
| PSEG Enterprise/Other |
$35 - $35 | |||
| Non-GAAP Operating Earnings |
$1,415 - $1,530 | |||
|
|
|
|||
| Non-GAAP EPS |
|
$2.80 - $3.00 |
| |
|
|
|
|||
| E: Estimate |
||||
Due to the forward looking nature of non-GAAP Operating Earnings guidance, PSEG is unable to reconcile this non-GAAP financial measure to the most directly comparable GAAP financial measure. Management is unable to project certain reconciling items, in particular MTM and NDT gains (losses), for future periods due to market volatility.
Non-GAAP Operating Earnings Review and Outlook by Operating Subsidiary
See Attachments 5 and 6 for detail regarding earnings reconciliations for 2017’s second quarter and year-to-date for each of PSEG’s businesses.
PSE&G
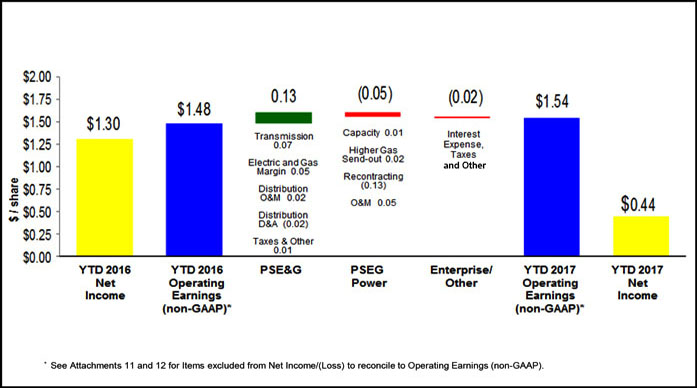
PSE&G reported Net Income of $208 million ($0.41 per share) for the second quarter of 2017 compared with Net Income of $179 million ($0.35 per share) for the second quarter of 2016.
PSE&G’s results for the second quarter reflect the benefits of its expanded investment program and regulatory mechanisms providing for recovery of costs and continued control of growth in operating expenses.
Growth in PSE&G’s investment in transmission improved second quarter Net Income comparisons by $0.04 per share. Investments made to enhance system resiliency under the Energy Strong and Gas System Modernization Program (GSMP) drove improved margin and second quarter Net Income comparisons by $0.02 per share. An increase in depreciation expense was offset by a reduction in O&M and other expenses.
Economic conditions in New Jersey continue to show steady improvement, particularly in the level of employment. The impact on electric revenue in the quarter from weather was favorable given warmer than normal conditions which conversely reduced gas sales early in the quarter. On a weather-normalized basis, electric and gas sales declined modestly. On a trailing twelve month basis, weather-normalized electric sales increased 0.1% year-over-year. Gas sales, on the same basis, increased 0.4% with growth in demand from the commercial sector.
PSE&G has had significant advances on a number of fronts. The company filed for an extension of the Gas System Modernization Program. PSE&G is proposing to invest up to $540 million per year for five years beginning in 2019. This program would accelerate the pace of replacement of its aging cast iron and unprotected steel mains and associated services. The filing is consistent with the draft regulations that the NJ Board of Public Utilities (BPU) issued in June 2017 regarding infrastructure investment programs.
PSE&G reached an agreement in principle with BPU Staff and Rate Counsel related to its proposed extension of its investment in Energy Efficiency. PSE&G would invest $69 million (more than 90% of its original request) in energy efficiency equipment for hospitals, multi-family housing and other sectors as well as provide for new residential energy efficiency offerings for smart thermostats and data analytics. This agreement is subject to review by the BPU.
PSE&G continues to progress towards its 2017 plan to invest $3.4 billion in transmission and distribution infrastructure upgrades.
The forecast of PSE&G’s Net Income for 2017 remains unchanged at $945 - $985 million.
PSEG Power
PSEG Power reported a Net Loss of $97 million ($0.19 per share) for the second quarter of 2017 and non-GAAP Adjusted EBITDA of $261 million compared with a Net Loss of $11 million ($0.02 per share) and non-GAAP Adjusted EBITDA of $250 million for the second quarter of 2016. Non-GAAP Operating Earnings for the second quarter of 2017 were $97 million ($0.19 per share) versus $91 million ($0.18 per share) for the second quarter of 2016.
PSEG Power’s Net Loss for the second quarter of 2017 reflects the impact of incremental depreciation and other expenses of $387 million, pre-tax, associated with the retirement of the Hudson and Mercer coal-fired generating stations on June 1, 2017.
Power’s operating results for the second quarter reflect on-going programs to reduce operating expenses and an increase in output which offset a decline in average hedge prices.
Non-GAAP Operating Earnings in the quarter increased $0.01 per share as the result of a June 1, 2017 increase in capacity prices. Growth in output also improved second quarter non-GAAP Operating Earnings comparisons by $0.01 per share. Lower average prices on energy hedges reduced Power’s non-GAAP Operating Earnings in the second quarter by $0.03 per share. A reduction in O&M associated with fewer nuclear and fossil outage related days and the June 1 retirement of Hudson and Mercer improved non-GAAP Operating Earnings by $0.02 per share. A higher level of depreciation was offset by a decline in interest expense.
Output from Power’s generating stations increased 4% in the second quarter. The improvement reflects a decline in nuclear refueling outage days to 46 from 76 outage related days in the year-ago quarter. The nuclear fleet’s capacity factor improved to 89.6% in the quarter from 82.7% producing 7.6 TWh of energy. Power’s gas-fired CCGT fleet operated at an average capacity factor of 55.3% versus 62.3% producing 4.0 TWh of energy. An increase in the price of gas improved the competitive performance of the coal fleet. During the quarter, the coal fleet operated at an average capacity factor of 32.6% versus 18.4% producing 1.4 TWh of energy.
Power continues to forecast output for 2017 of 49 – 50 TWh. Approximately 90% of production for the remainder of the year is hedged at an average price of $46 per MWh. Power has hedged approximately 65% - 70% of its forecast production for 2018 of 52 – 54 TWh at an average price of $41 per MWh. For 2019, Power has hedged 25% - 30% of its forecast production of 58 – 60 TWh at an average price of $41 per MWh. Power continues to assume Basic Generation Service (BGS) volumes will represent approximately 11 TWh of deliveries in 2017.
The forecast increase in output in both 2018 and 2019 reflects the commercial start-up in mid-2018 of 1,300 MWs of new gas-fired combined cycle capacity at the Keys Energy Center in Maryland and Sewaren in New Jersey, and the mid-2019 commercial start-up of the 485 MW gas-fired combined cycle generation unit in Bridgeport Harbor, Connecticut.
Management believes non-GAAP Adjusted EBITDA is useful to investors and other users of our financial statements in evaluating operating performance because it provides them with an additional tool to compare business performance across companies and across periods. Management also believes that non-GAAP Adjusted EBITDA is widely used by investors to measure operating performance without regard to items such as income tax expense, interest expense and depreciation and amortization, which can vary substantially from company to company depending upon, among other things, the book value of assets, capital structure and whether assets were constructed or acquired. Non-GAAP Adjusted EBITDA also allows investors and other users to assess the underlying financial performance of our fleet before management’s decision to deploy capital. Non-GAAP Adjusted EBITDA excludes the same items as our non-GAAP Operating Earnings measure as well as income tax expense, interest expense and depreciation and amortization. See Attachment 12 for a complete list of items excluded from Net Income/(Loss) in the determination of non-GAAP Adjusted EBITDA. The presentation of non-GAAP Adjusted EBITDA is intended to complement, and should not be considered an alternative to the presentation of Net Income/(Loss), which is an indicator of financial performance in accordance with GAAP. In addition, non-GAAP Adjusted EBITDA as presented in this release may not be comparable to similarly titled measures used by other companies.
Due to the forward looking nature of non-GAAP Adjusted EBITDA guidance, PSEG is unable to reconcile this non-GAAP financial measure to the most directly comparable GAAP financial measure. Management is unable to project certain reconciling items, in particular MTM and NDT gains(losses), for future periods due to market volatility.
The forecast range of Power’s 2017 non-GAAP Operating Earnings and non-GAAP Adjusted EBITDA are unchanged at $435 million - $510 million and $1,080 - $1,210 million, respectively.
PSEG Enterprise/Other
PSEG Enterprise/Other reported a Net Loss of $2 million for the second quarter of 2017 versus Net Income of $19 million ($0.04 per share) during the second quarter of 2016. Non-GAAP Operating Earnings for the second quarter of 2017 were $11 million ($0.02 per share) compared to $19 million ($0.04 per share) for the second quarter of 2016.
The Net Loss for the second quarter of 2017 includes a pre-tax charge of $22 million related to on-going liquidity challenges facing NRG REMA, LLC (REMA) and deterioration in market conditions affecting the residual value of the leveraged lease portfolio. The decrease in non-GAAP Operating Earnings quarter-over-quarter reflects the absence of certain tax items recorded in 2016 at PSEG Energy Holdings and higher Parent interest expense.
The forecast of PSEG Enterprise/Other non-GAAP Operating Earnings for 2017 remains unchanged at $35 million.
Financing
PSEG closed the quarter ended June 30, 2017 with $430 million of cash on its balance sheet with debt at the end of the quarter representing approximately 49% of consolidated capital.
######
About PSEG:
Public Service Enterprise Group (NYSE: PEG) is a publicly traded diversified energy company with annual revenues of $9.1 billion. Its operating subsidiaries are: Public Service Electric and Gas Company (PSE&G), PSEG Power LLC, and PSEG Long Island.
Public Service Electric and Gas Company (PSE&G) is New Jersey’s oldest and largest regulated gas and electric delivery utility, serving nearly three-quarters of the state’s population. PSE&G is the winner of the ReliabilityOne Award for superior electric system reliability.
PSEG Power LLC is an independent power producer that generates and sells electricity in the PJM, New York and New England wholesale power markets.
 Visit PSEG at: www.pseg.com; PSEG blog, Energize!; PSEG My Alerts!
FORWARD-LOOKING STATEMENT
Certain of the matters discussed in this presentation about our and our subsidiaries’ future performance, including, without limitation, future revenues, earnings, strategies, prospects, consequences and all other statements that are not purely historical constitute “forward-looking statements” within the meaning of the Private Securities Litigation Reform Act of 1995. Such forward-looking statements are subject to risks and uncertainties, which could cause actual results to differ materially from those anticipated. Such statements are based on management’s beliefs as well as assumptions made by and information currently available to management. When used herein, the words “anticipate,” “intend,” “estimate,” “believe,” “expect,” “plan,” “should,” “hypothetical,” “potential,” “forecast,” “project,” variations of such words and similar expressions are intended to identify forward-looking statements. Factors that may cause actual results to differ are often presented with the forward-looking statements themselves. Other factors that could cause actual results to differ materially from those contemplated in any forward-looking statements made by us herein are discussed in filings we make with the United States Securities and Exchange Commission (SEC) including our Annual Report on Form 10-K and subsequent reports on Form 10-Q and Form 8-K. These factors include, but are not limited to:
| • | fluctuations in wholesale power and natural gas markets, including the potential impacts on the economic viability of our generation units; |
| • | our ability to obtain adequate fuel supply; |
| • | any inability to manage our energy obligations with available supply; |
| • | increases in competition in wholesale energy and capacity markets; |
| • | changes in technology related to energy generation, distribution and consumption and customer usage patterns; |
| • | economic downturns; |
| • | third party credit risk relating to our sale of generation output and purchase of fuel; |
| • | adverse performance of our decommissioning and defined benefit plan trust fund investments and changes in funding requirements; |
| • | changes in state and federal legislation and regulations; |
| • | the impact of pending rate case proceedings; |
| • | regulatory, financial, environmental, health and safety risks associated with our ownership and operation of nuclear facilities; |
| • | adverse changes in energy industry laws, policies and regulations, including market structures and transmission planning; |
| • | changes in federal and state environmental regulations and enforcement; |
| • | delays in receipt of, or an inability to receive, necessary licenses and permits; |
| • | adverse outcomes of any legal, regulatory or other proceeding, settlement, investigation or claim applicable to us and/or the energy industry; |
| • | changes in tax laws and regulations; |
| • | the impact of our holding company structure on our ability to meet our corporate funding needs, service debt and pay dividends; |
| • | lack of growth or slower growth in the number of customers or changes in customer demand; |
| • | any inability of Power to meet its commitments under forward sale obligations; |
| • | reliance on transmission facilities that we do not own or control and the impact on our ability to maintain adequate transmission capacity; |
| • | any inability to successfully develop or construct generation, transmission and distribution projects; |
| • | any equipment failures, accidents, severe weather events or other incidents that impact our ability to provide safe and reliable service to our customers; |
| • | our inability to exercise control over the operations of generation facilities in which we do not maintain a controlling interest; |
| • | any inability to maintain sufficient liquidity; |
| • | any inability to realize anticipated tax benefits or retain tax credits; |
| • | challenges associated with recruitment and/or retention of key executives and a qualified workforce; |
| • | the impact of our covenants in our debt instruments on our operations; and |
| • | the impact of acts of terrorism, cybersecurity attacks or intrusions. |
All of the forward-looking statements made in this presentation are qualified by these cautionary statements and we cannot assure you that the results or developments anticipated by management will be realized or even if realized, will have the expected consequences to, or effects on, us or our business, prospects, financial condition, results of operations or cash flows. Readers are cautioned not to place undue reliance on these forward-looking statements in making any investment decision. Forward-looking statements made in this presentation apply only as of the date of this presentation. While we may elect to update forward-looking statements from time to time, we specifically disclaim any obligation to do so, even in light of new information or future events, unless otherwise required by applicable securities laws.
The forward-looking statements contained in this presentation are intended to qualify for the safe harbor provisions of Section 27A of the Securities Act of 1933, as amended, and Section 21E of the Securities Exchange Act of 1934, as amended.
From time to time, PSEG, PSE&G and PSEG Power release important information via postings on their corporate website at http://investor.pseg.com. Investors and other interested parties are encouraged to visit the corporate website to review new postings. The “Email Alerts” link at http://investor.pseg.com may be used to enroll to receive automatic email alerts and/or Really Simple Syndication (RSS) feeds regarding new postings.
TO FOLLOW AND CONNECT WITH PSEG VIA SOCIAL MEDIA, CLICK ON THE LINKS BELOW:


PSEG Social Media Channels: PSEG on Facebook; PSEG on Twitter; PSEG on LinkedIn; PSEG on YouTube
Attachment 1
PUBLIC SERVICE ENTERPRISE GROUP INCORPORATED
Consolidating Statements of Operations
(Unaudited, $ millions, except per share data)
| Three Months Ended June 30, 2017 | ||||||||||||||||
| PSEG | PSEG Enterprise/ Other (a) |
PSE&G | PSEG Power |
|||||||||||||
| OPERATING REVENUES |
$ | 2,133 | $ | (164 | ) | $ | 1,368 | $ | 929 | |||||||
| OPERATING EXPENSES |
||||||||||||||||
| Energy Costs |
588 | (281 | ) | 472 | 397 | |||||||||||
| Operation and Maintenance |
708 | 103 | 351 | 254 | ||||||||||||
| Depreciation and Amortization |
641 | 10 | 166 | 465 | ||||||||||||
|
|
|
|
|
|
|
|
|
|||||||||
| Total Operating Expenses |
1,937 | (168 | ) | 989 | 1,116 | |||||||||||
|
|
|
|
|
|
|
|
|
|||||||||
| OPERATING INCOME (LOSS) |
196 | 4 | 379 | (187 | ) | |||||||||||
| Income from Equity Method Investments |
5 | — | — | 5 | ||||||||||||
| Other Income and (Deductions) |
61 | 1 | 21 | 39 | ||||||||||||
| Other-Than-Temporary Impairments |
(3 | ) | — | — | (3 | ) | ||||||||||
| Interest Expense |
(91 | ) | (9 | ) | (69 | ) | (13 | ) | ||||||||
|
|
|
|
|
|
|
|
|
|||||||||
| INCOME (LOSS) BEFORE INCOME TAXES |
168 | (4 | ) | 331 | (159 | ) | ||||||||||
| Income Tax Benefit (Expense) |
(59 | ) | 2 | (123 | ) | 62 | ||||||||||
|
|
|
|
|
|
|
|
|
|||||||||
| NET INCOME (LOSS) |
$ | 109 | $ | (2 | ) | $ | 208 | $ | (97 | ) | ||||||
|
|
|
|
|
|
|
|
|
|||||||||
| Reconciling Items Excluded from Net Income (Loss) (b) |
207 | 13 | — | 194 | ||||||||||||
|
|
|
|
|
|
|
|
|
|||||||||
| OPERATING EARNINGS (non-GAAP) |
$ | 316 | $ | 11 | $ | 208 | $ | 97 | ||||||||
|
|
|
|
|
|
|
|
|
|||||||||
| Earnings Per Share |
||||||||||||||||
| NET INCOME (LOSS) |
$ | 0.22 | $ | — | $ | 0.41 | $ | (0.19 | ) | |||||||
|
|
|
|
|
|
|
|
|
|||||||||
| Reconciling Items Excluded from Net Income (Loss) (b) |
0.40 | 0.02 | — | 0.38 | ||||||||||||
|
|
|
|
|
|
|
|
|
|||||||||
| OPERATING EARNINGS (non-GAAP) |
$ | 0.62 | $ | 0.02 | $ | 0.41 | $ | 0.19 | ||||||||
|
|
|
|
|
|
|
|
|
|||||||||
|
|
|
|
|
|
|
|
|
|||||||||
| Three Months Ended June 30, 2016 | ||||||||||||||||
| PSEG | PSEG Enterprise/ Other (a) |
PSE&G | PSEG Power |
|||||||||||||
| OPERATING REVENUES |
$ | 1,905 | $ | (159 | ) | $ | 1,350 | $ | 714 | |||||||
| OPERATING EXPENSES |
||||||||||||||||
| Energy Costs |
624 | (286 | ) | 529 | 381 | |||||||||||
| Operation and Maintenance |
710 | 93 | 352 | 265 | ||||||||||||
| Depreciation and Amortization |
224 | 8 | 136 | 80 | ||||||||||||
|
|
|
|
|
|
|
|
|
|||||||||
| Total Operating Expenses |
1,558 | (185 | ) | 1,017 | 726 | |||||||||||
|
|
|
|
|
|
|
|
|
|||||||||
| OPERATING INCOME (LOSS) |
347 | 26 | 333 | (12 | ) | |||||||||||
| Income from Equity Method Investments |
4 | — | — | 4 | ||||||||||||
| Other Income and (Deductions) |
34 | — | 18 | 16 | ||||||||||||
| Other-Than-Temporary Impairments |
(10 | ) | — | — | (10 | ) | ||||||||||
| Interest Expense |
(97 | ) | (3 | ) | (74 | ) | (20 | ) | ||||||||
|
|
|
|
|
|
|
|
|
|||||||||
| INCOME (LOSS) BEFORE INCOME TAXES |
278 | 23 | 277 | (22 | ) | |||||||||||
| Income Tax Benefit (Expense) |
(91 | ) | (4 | ) | (98 | ) | 11 | |||||||||
|
|
|
|
|
|
|
|
|
|||||||||
| NET INCOME (LOSS) |
$ | 187 | $ | 19 | $ | 179 | $ | (11 | ) | |||||||
|
|
|
|
|
|
|
|
|
|||||||||
| Reconciling Items Excluded from Net Income (Loss) (b) |
102 | — | — | 102 | ||||||||||||
|
|
|
|
|
|
|
|
|
|||||||||
| OPERATING EARNINGS (non-GAAP) |
$ | 289 | $ | 19 | $ | 179 | $ | 91 | ||||||||
|
|
|
|
|
|
|
|
|
|||||||||
| Earnings Per Share |
||||||||||||||||
| NET INCOME (LOSS) |
$ | 0.37 | $ | 0.04 | $ | 0.35 | $ | (0.02 | ) | |||||||
|
|
|
|
|
|
|
|
|
|||||||||
| Reconciling Items Excluded from Net Income (Loss) (b) |
0.20 | — | — | 0.20 | ||||||||||||
|
|
|
|
|
|
|
|
|
|||||||||
| OPERATING EARNINGS (non-GAAP) |
$ | 0.57 | $ | 0.04 | $ | 0.35 | $ | 0.18 | ||||||||
|
|
|
|
|
|
|
|
|
|||||||||
| (a) | Includes activities at Energy Holdings, PSEG Long Island and the Parent as well as intercompany eliminations. |
| (b) | See Attachments 11 and 12 for details of items excluded from Net Income/(Loss) to compute Operating Earnings (non-GAAP). |
Attachment 2
PUBLIC SERVICE ENTERPRISE GROUP INCORPORATED
Consolidating Statements of Operations
(Unaudited, $ millions, except per share data)
| Six Months Ended June 30, 2017 | ||||||||||||||||
| PSEG | PSEG Enterprise/ Other (a) |
PSE&G | PSEG Power |
|||||||||||||
| OPERATING REVENUES |
$ | 4,725 | $ | (668 | ) | $ | 3,180 | $ | 2,213 | |||||||
| OPERATING EXPENSES |
||||||||||||||||
| Energy Costs |
1,462 | (867 | ) | 1,225 | 1,104 | |||||||||||
| Operation and Maintenance |
1,420 | 218 | 718 | 484 | ||||||||||||
| Depreciation and Amortization |
1,469 | 17 | 337 | 1,115 | ||||||||||||
|
|
|
|
|
|
|
|
|
|||||||||
| Total Operating Expenses |
4,351 | (632 | ) | 2,280 | 2,703 | |||||||||||
|
|
|
|
|
|
|
|
|
|||||||||
| OPERATING INCOME (LOSS) |
374 | (36 | ) | 900 | (490 | ) | ||||||||||
| Income from Equity Method Investments |
8 | — | — | 8 | ||||||||||||
| Other Income and (Deductions) |
122 | 7 | 45 | 70 | ||||||||||||
| Other-Than-Temporary Impairments |
(4 | ) | — | — | (4 | ) | ||||||||||
| Interest Expense |
(189 | ) | (16 | ) | (144 | ) | (29 | ) | ||||||||
|
|
|
|
|
|
|
|
|
|||||||||
| INCOME (LOSS) BEFORE INCOME TAXES |
311 | (45 | ) | 801 | (445 | ) | ||||||||||
| Income Tax Benefit (Expense) |
(88 | ) | 28 | (294 | ) | 178 | ||||||||||
|
|
|
|
|
|
|
|
|
|||||||||
| NET INCOME (LOSS) |
$ | 223 | $ | (17 | ) | $ | 507 | $ | (267 | ) | ||||||
|
|
|
|
|
|
|
|
|
|||||||||
| Reconciling Items Excluded from Net Income (Loss) (b) |
559 | 45 | — | 514 | ||||||||||||
|
|
|
|
|
|
|
|
|
|||||||||
| OPERATING EARNINGS (non-GAAP) |
$ | 782 | $ | 28 | $ | 507 | $ | 247 | ||||||||
|
|
|
|
|
|
|
|
|
|||||||||
| Earnings Per Share |
||||||||||||||||
| NET INCOME (LOSS) |
$ | 0.44 | $ | (0.03 | ) | $ | 1.00 | $ | (0.53 | ) | ||||||
|
|
|
|
|
|
|
|
|
|||||||||
| Reconciling Items Excluded from Net Income (Loss) (b) |
1.10 | 0.08 | — | 1.02 | ||||||||||||
|
|
|
|
|
|
|
|
|
|||||||||
| OPERATING EARNINGS (non-GAAP) |
$ | 1.54 | $ | 0.05 | $ | 1.00 | $ | 0.49 | ||||||||
|
|
|
|
|
|
|
|
|
|||||||||
| Six Months Ended June 30, 2016 | ||||||||||||||||
| PSEG | PSEG Enterprise/ Other (a) |
PSE&G | PSEG Power |
|||||||||||||
| OPERATING REVENUES |
$ | 4,521 | $ | (568 | ) | $ | 3,062 | $ | 2,027 | |||||||
| OPERATING EXPENSES |
||||||||||||||||
| Energy Costs |
1,460 | (817 | ) | 1,258 | 1,019 | |||||||||||
| Operation and Maintenance |
1,439 | 187 | 734 | 518 | ||||||||||||
| Depreciation and Amortization |
448 | 14 | 275 | 159 | ||||||||||||
|
|
|
|
|
|
|
|
|
|||||||||
| Total Operating Expenses |
3,347 | (616 | ) | 2,267 | 1,696 | |||||||||||
|
|
|
|
|
|
|
|
|
|||||||||
| OPERATING INCOME |
1,174 | 48 | 795 | 331 | ||||||||||||
| Income from Equity Method Investments |
6 | — | — | 6 | ||||||||||||
| Other Income and (Deductions) |
61 | — | 37 | 24 | ||||||||||||
| Other-Than-Temporary Impairments |
(20 | ) | — | — | (20 | ) | ||||||||||
| Interest Expense |
(189 | ) | (5 | ) | (142 | ) | (42 | ) | ||||||||
|
|
|
|
|
|
|
|
|
|||||||||
| INCOME BEFORE INCOME TAXES |
1,032 | 43 | 690 | 299 | ||||||||||||
| Income Tax Benefit (Expense) |
(374 | ) | (7 | ) | (249 | ) | (118 | ) | ||||||||
|
|
|
|
|
|
|
|
|
|||||||||
| NET INCOME |
$ | 658 | $ | 36 | $ | 441 | $ | 181 | ||||||||
|
|
|
|
|
|
|
|
|
|||||||||
| Reconciling Items Excluded from Net Income (b) |
94 | — | — | 94 | ||||||||||||
|
|
|
|
|
|
|
|
|
|||||||||
| OPERATING EARNINGS (non-GAAP) |
$ | 752 | $ | 36 | $ | 441 | $ | 275 | ||||||||
|
|
|
|
|
|
|
|
|
|||||||||
| Earnings Per Share |
||||||||||||||||
| NET INCOME |
$ | 1.30 | $ | 0.07 | $ | 0.87 | $ | 0.36 | ||||||||
|
|
|
|
|
|
|
|
|
|||||||||
| Reconciling Items Excluded from Net Income (b) |
0.18 | — | — | 0.18 | ||||||||||||
|
|
|
|
|
|
|
|
|
|||||||||
| OPERATING EARNINGS (non-GAAP) |
$ | 1.48 | $ | 0.07 | $ | 0.87 | $ | 0.54 | ||||||||
|
|
|
|
|
|
|
|
|
|||||||||
| (a) | Includes activities at Energy Holdings, PSEG Long Island and the Parent as well as intercompany eliminations. |
| (b) | See Attachments 11 and 12 for details of items excluded from Net Income/(Loss) to compute Operating Earnings (non-GAAP). |
Attachment 3
PUBLIC SERVICE ENTERPRISE GROUP INCORPORATED
Capitalization Schedule
(Unaudited, $ millions)
| June 30, 2017 |
December 31, 2016 |
|||||||
| DEBT |
||||||||
| Commercial Paper and Loans |
$ | — | $ | 388 | ||||
| Long-Term Debt* |
12,521 | 11,395 | ||||||
|
|
|
|
|
|||||
| Total Debt |
12,521 | 11,783 | ||||||
| STOCKHOLDERS’ EQUITY |
||||||||
| Common Stock |
4,929 | 4,936 | ||||||
| Treasury Stock |
(747 | ) | (717 | ) | ||||
| Retained Earnings |
8,962 | 9,174 | ||||||
| Accumulated Other Comprehensive Loss |
(226 | ) | (263 | ) | ||||
|
|
|
|
|
|||||
| Total Stockholders’ Equity |
12,918 | 13,130 | ||||||
|
|
|
|
|
|||||
| Total Capitalization |
$ | 25,439 | $ | 24,913 | ||||
|
|
|
|
|
|||||
| * | Includes current portion of Long-Term Debt |
Attachment 4
PUBLIC SERVICE ENTERPRISE GROUP INCORPORATED
CONDENSED CONSOLIDATED STATEMENTS OF CASH FLOWS
(Unaudited, $ millions)
| Six Months Ended June 30, | ||||||||
| 2017 | 2016 | |||||||
| CASH FLOWS FROM OPERATING ACTIVITIES |
||||||||
| Net Income |
$ | 223 | $ | 658 | ||||
| Adjustments to Reconcile Net Income to Net Cash Flows From Operating Activities |
1,533 | 1,064 | ||||||
|
|
|
|
|
|||||
| NET CASH PROVIDED BY OPERATING ACTIVITIES |
1,756 | 1,722 | ||||||
|
|
|
|
|
|||||
| NET CASH USED IN INVESTING ACTIVITIES |
(1,989 | ) | (2,004 | ) | ||||
|
|
|
|
|
|||||
| NET CASH PROVIDED BY FINANCING ACTIVITIES |
240 | 536 | ||||||
|
|
|
|
|
|||||
| Net Change in Cash and Cash Equivalents |
7 | 254 | ||||||
| Cash and Cash Equivalents at Beginning of Period |
423 | 394 | ||||||
|
|
|
|
|
|||||
| Cash and Cash Equivalents at End of Period |
$ | 430 | $ | 648 | ||||
|
|
|
|
|
|||||
Attachment 5
PUBLIC SERVICE ENTERPRISE GROUP INCORPORATED
Quarter-over-Quarter EPS Reconciliation
June 30, 2017 vs. June 30, 2016
(Unaudited)
Attachment 6
PUBLIC SERVICE ENTERPRISE GROUP INCORPORATED
Year-over-Year EPS Reconciliation
June 30, 2017 vs. June 30, 2016
(Unaudited)
Attachment 7
PUBLIC SERVICE ELECTRIC & GAS COMPANY
Retail Sales and Revenues
(Unaudited)
June 30, 2017
Electric Sales and Revenues
| Sales (millions kWh) |
Three Months Ended |
Change vs. 2016 |
Six Months Ended |
Change vs. 2016 |
||||||||||||
| Residential |
2,977 | -0.6 | % | 5,974 | -0.3 | % | ||||||||||
| Commercial & Industrial |
6,536 | -0.8 | % | 13,328 | 0.8 | % | ||||||||||
| Street Lighting |
68 | -9.2 | % | 165 | -1.6 | % | ||||||||||
| Interdepartmental |
2 | -2.3 | % | 5 | -1.6 | % | ||||||||||
|
|
|
|
|
|||||||||||||
| Total |
9,583 | -0.8 | % | 19,472 | 0.4 | % | ||||||||||
|
|
|
|
|
|||||||||||||
| Revenue ($ millions) |
||||||||||||||||
| Residential |
$ | 449 | -1.7 | % | $ | 884 | -3.0 | % | ||||||||
| Commercial & Industrial |
427 | 1.9 | % | 786 | 1.3 | % | ||||||||||
| Street Lighting |
16 | -5.6 | % | 34 | -1.0 | % | ||||||||||
| Other Operating Revenues* |
198 | 15.7 | % | 378 | 12.4 | % | ||||||||||
|
|
|
|
|
|||||||||||||
| Total |
$ | 1,090 | 2.4 | % | $ | 2,082 | 1.2 | % | ||||||||
|
|
|
|
|
|||||||||||||
| Weather Data |
Three Months Ended |
Change vs. 2016 |
Six Months Ended |
Change vs. 2016 |
||||||||||||
| THI Hours - Actual |
4,369 | 15.3 | % | 4,384 | 13.6 | % | ||||||||||
| THI Hours - Normal |
4,062 | 4,091 | ||||||||||||||
| * | Primarily sales of Non-Utility Generator energy to PJM and Transmission related revenues. |
Attachment 8
PUBLIC SERVICE ELECTRIC & GAS COMPANY
Retail Sales and Revenues
(Unaudited)
June 30, 2017
Gas Sold and Transported
| Sales (millions therms)* |
Three Months Ended |
Change vs. 2016 |
Six Months Ended |
Change vs. 2016 |
||||||||||||
| Firm Sales |
||||||||||||||||
| Residential Sales |
186 | -11.5 | % | 854 | -1.3 | % | ||||||||||
| Commercial & Industrial |
150 | -7.7 | % | 595 | 1.0 | % | ||||||||||
|
|
|
|
|
|||||||||||||
| Total Firm Sales |
336 | -9.8 | % | 1,449 | -0.4 | % | ||||||||||
|
|
|
|
|
|||||||||||||
| Non-Firm Sales |
||||||||||||||||
| Commercial & Industrial |
356 | -24.5 | % | 687 | -22.4 | % | ||||||||||
|
|
|
|
|
|||||||||||||
| Total Non-Firm Sales |
356 | 687 | ||||||||||||||
|
|
|
|
|
|||||||||||||
|
|
|
|
|
|||||||||||||
| Total Sales |
692 | -18.1 | % | 2,136 | -8.7 | % | ||||||||||
|
|
|
|
|
|||||||||||||
| Revenue ($ millions) |
||||||||||||||||
| Residential Sales - Firm |
$ | 56 | -25.3 | % | $ | 211 | 6.7 | % | ||||||||
| Commercial & Industrial - Firm Sales |
32 | 22.3 | % | 162 | 43.7 | % | ||||||||||
| Non-Firm Sales |
4 | 10.4 | % | 15 | 18.7 | % | ||||||||||
| Other Operating Revenues** |
45 | 2.9 | % | 87 | 0.1 | % | ||||||||||
|
|
|
|
|
|||||||||||||
| Total |
$ | 137 | -7.5 | % | $ | 475 | 15.9 | % | ||||||||
|
|
|
|
|
|||||||||||||
| Gas Transported |
$ | 141 | 2.5 | % | $ | 623 | 4.8 | % | ||||||||
| Weather Data |
Three Months Ended |
Change vs. 2016 |
Six Months Ended |
Change vs. 2016 |
||||||||||||
| Degree Days - Actual |
472 | -12.5 | % | 2,771 | -1.8 | % | ||||||||||
| Degree Days - Normal |
501 | 3,048 | ||||||||||||||
| * | CSG rate included in non-firm sales |
| ** | Primarily Appliance Service. |
Attachment 9
PSEG POWER LLC
Generation Measures*
(Unaudited)
| GWhr Breakdown Three Months Ended June 30, |
GWhr Breakdown Six Months Ended |
|||||||||||||||
| 2017 | 2016 | 2017 | 2016 | |||||||||||||
| Nuclear - NJ |
4,800 | 4,196 | 10,314 | 9,727 | ||||||||||||
| Nuclear - PA |
2,766 | 2,787 | 5,607 | 5,675 | ||||||||||||
|
|
|
|
|
|
|
|
|
|||||||||
| Total Nuclear |
7,566 | 6,983 | 15,921 | 15,402 | ||||||||||||
| Fossil - Coal/Natural Gas - NJ** |
(15 | ) | (40 | ) | (56 | ) | (59 | ) | ||||||||
| Fossil - Coal - PA |
1,368 | 958 | 2,763 | 1,948 | ||||||||||||
| Fossil - Coal - CT |
7 | (6 | ) | 87 | 50 | |||||||||||
|
|
|
|
|
|
|
|
|
|||||||||
| Total Coal |
1,360 | 912 | 2,794 | 1,939 | ||||||||||||
| Fossil - Oil & Natural Gas - NJ |
2,526 | 3,161 | 4,628 | 5,855 | ||||||||||||
| Fossil - Oil & Natural Gas - NY |
1,495 | 1,394 | 2,445 | 2,458 | ||||||||||||
| Fossil - Oil & Natural Gas - CT |
4 | (4 | ) | (2 | ) | (8 | ) | |||||||||
|
|
|
|
|
|
|
|
|
|||||||||
| Total Oil & Natural Gas |
4,025 | 4,551 | 7,071 | 8,305 | ||||||||||||
|
|
|
|
|
|
|
|
|
|||||||||
| 12,951 | 12,446 | 25,786 | 25,646 | |||||||||||||
| % Generation by Fuel Type Three Months Ended June 30, |
% Generation by Fuel Type Six Months Ended June 30, |
|||||||||||||||
| 2017 | 2016 | 2017 | 2016 | |||||||||||||
| Nuclear - NJ |
37 | % | 34 | % | 40 | % | 38 | % | ||||||||
| Nuclear - PA |
21 | % | 22 | % | 22 | % | 22 | % | ||||||||
|
|
|
|
|
|
|
|
|
|||||||||
| Total Nuclear |
58 | % | 56 | % | 62 | % | 60 | % | ||||||||
| Fossil - Coal/Natural Gas - NJ** |
0 | % | 0 | % | 0 | % | 0 | % | ||||||||
| Fossil - Coal - PA |
11 | % | 8 | % | 11 | % | 8 | % | ||||||||
| Fossil - Coal - CT |
0 | % | 0 | % | 0 | % | 0 | % | ||||||||
|
|
|
|
|
|
|
|
|
|||||||||
| Total Coal |
11 | % | 8 | % | 11 | % | 8 | % | ||||||||
| Fossil - Oil & Natural Gas - NJ |
19 | % | 25 | % | 18 | % | 23 | % | ||||||||
| Fossil - Oil & Natural Gas - NY |
12 | % | 11 | % | 9 | % | 9 | % | ||||||||
| Fossil - Oil & Natural Gas - CT |
0 | % | 0 | % | 0 | % | 0 | % | ||||||||
|
|
|
|
|
|
|
|
|
|||||||||
| Total Oil & Natural Gas |
31 | % | 36 | % | 27 | % | 32 | % | ||||||||
|
|
|
|
|
|
|
|
|
|||||||||
| 100 | % | 100 | % | 100 | % | 100 | % | |||||||||
| * | Excludes Solar and Kalaeloa |
| ** | Includes Pumped Storage. Pumped Storage accounted for <1% of total generation for the three and six months June 30, 2017 and 2016. Generation includes natural gas fuel switching intervals. |
Attachment 10
PUBLIC SERVICE ENTERPRISE GROUP INCORPORATED
Statistical Measures
(Unaudited)
| Three Months Ended June 30, | Six Months Ended June 30, | |||||||||||||||
| 2017 | 2016 | 2017 | 2016 | |||||||||||||
| Weighted Average Common Shares Outstanding (millions) |
||||||||||||||||
| Basic |
505 | 505 | 505 | 505 | ||||||||||||
| Diluted |
507 | 508 | 507 | 508 | ||||||||||||
| Stock Price at End of Period |
$ | 43.01 | $ | 46.61 | ||||||||||||
| Dividends Paid per Share of Common Stock |
$ | 0.43 | $ | 0.41 | $ | 0.86 | $ | 0.82 | ||||||||
| Dividend Yield |
4.0 | % | 3.5 | % | ||||||||||||
| Book Value per Common Share |
$ | 25.60 | $ | 26.38 | ||||||||||||
| Market Price as a Percent of Book Value |
168 | % | 177 | % | ||||||||||||
| Total Shareholder Return |
-2.1 | % | -0.2 | % | -0.1 | % | 22.7 | % | ||||||||
Attachment 11
PUBLIC SERVICE ENTERPRISE GROUP INCORPORATED
Consolidated Operating Earnings (non-GAAP) Reconciliation
| Reconciling Items | Three Months Ended June 30, |
Six Months Ended June 30, |
||||||||||||||
| 2017 | 2016 | 2017 | 2016 | |||||||||||||
| ($ millions, Unaudited) | ||||||||||||||||
| Net Income |
$ | 109 | $ | 187 | $ | 223 | $ | 658 | ||||||||
| (Gain) Loss on Nuclear Decommissioning Trust (NDT) Fund Related Activity, pre-tax (PSEG Power) |
(30 | ) | — | (47 | ) | 8 | ||||||||||
| (Gain) Loss on Mark-to-Market (MTM), pre-tax (a) (PSEG Power) |
(36 | ) | 171 | (46 | ) | 149 | ||||||||||
| Hudson/Mercer Early Retirement, pre-tax (PSEG Power) |
387 | — | 951 | — | ||||||||||||
| Lease Related Activity, pre-tax (PSEG Enterprise/Other) |
22 | — | 77 | — | ||||||||||||
| Income Taxes related to Operating Earnings (non-GAAP) reconciling items (b) |
(136 | ) | (69 | ) | (376 | ) | (63 | ) | ||||||||
|
|
|
|
|
|
|
|
|
|||||||||
| Operating Earnings (non-GAAP) |
$ | 316 | $ | 289 | $ | 782 | $ | 752 | ||||||||
|
|
|
|
|
|
|
|
|
|||||||||
| PSEG Fully Diluted Average Shares Outstanding (in millions) |
507 | 508 | 507 | 508 | ||||||||||||
|
($ Per Share Impact - Diluted, Unaudited) |
||||||||||||||||
| Net Income |
$ | 0.22 | $ | 0.37 | $ | 0.44 | $ | 1.30 | ||||||||
| (Gain) Loss on NDT Fund Related Activity, pre-tax (PSEG Power) |
(0.06 | ) | — | (0.09 | ) | 0.01 | ||||||||||
| (Gain) Loss on MTM, pre-tax (a) (PSEG Power) |
(0.07 | ) | 0.34 | (0.09 | ) | 0.29 | ||||||||||
| Hudson/Mercer Early Retirement, pre-tax (PSEG Power) |
0.77 | — | 1.87 | — | ||||||||||||
| Lease Related Activity, pre-tax (PSEG Enterprise/Other) |
0.04 | — | 0.15 | — | ||||||||||||
| Income Taxes related to Operating Earnings (non-GAAP) reconciling items (b) |
(0.28 | ) | (0.14 | ) | (0.74 | ) | (0.12 | ) | ||||||||
|
|
|
|
|
|
|
|
|
|||||||||
| Operating Earnings (non-GAAP) |
$ | 0.62 | $ | 0.57 | $ | 1.54 | $ | 1.48 | ||||||||
|
|
|
|
|
|
|
|
|
|||||||||
| (a) | Includes the financial impact from positions with forward delivery months. |
| (b) | Income tax effect calculated at 40.85% statutory rate, except for lease related activity which is calculated at a combined leveraged lease effective tax rate and NDT related activity which is calculated at the 40.85% statutory rate plus a 20% tax on income (losses) from qualified NDT funds. |
Attachment 12
PSEG Power Operating Earnings (non-GAAP) and Adjusted EBITDA (non-GAAP) Reconciliation
| Reconciling Items | Three Months Ended June 30, |
Six Months Ended June 30, |
||||||||||||||
| 2017 | 2016 | 2017 | 2016 | |||||||||||||
| ($ millions, Unaudited) | ||||||||||||||||
| Net Income (Loss) |
$ | (97 | ) | $ | (11 | ) | $ | (267 | ) | $ | 181 | |||||
| (Gain) Loss on NDT Fund Related Activity, pre-tax |
(30 | ) | — | (47 | ) | 8 | ||||||||||
| (Gain) Loss on MTM, pre-tax (a) |
(36 | ) | 171 | (46 | ) | 149 | ||||||||||
| Hudson/Mercer Early Retirement, pre-tax |
387 | — | 951 | — | ||||||||||||
| Income Taxes related to Operating Earnings (non-GAAP) reconciling items (b) |
(127 | ) | (69 | ) | (344 | ) | (63 | ) | ||||||||
|
|
|
|
|
|
|
|
|
|||||||||
| Operating Earnings (non-GAAP) |
$ | 97 | $ | 91 | $ | 247 | $ | 275 | ||||||||
| Depreciation and Amortization, pre-tax (c) |
87 | 81 | 179 | 161 | ||||||||||||
| Interest Expense, pre-tax (c) (d) |
12 | 20 | 28 | 42 | ||||||||||||
| Income Taxes (c) |
65 | 58 | 166 | 181 | ||||||||||||
|
|
|
|
|
|
|
|
|
|||||||||
| Adjusted EBITDA (non-GAAP) |
$ | 261 | $ | 250 | $ | 620 | $ | 659 | ||||||||
|
|
|
|
|
|
|
|
|
|||||||||
| PSEG Fully Diluted Average Shares Outstanding (in millions) |
507 | 508 | 507 | 508 | ||||||||||||
| (a) | Includes the financial impact from positions with forward delivery months. |
| (b) | Income tax effect calculated at 40.85% statutory rate, except for NDT related activity which is calculated at the 40.85% statutory rate plus a 20% tax on income (losses) from qualified NDT funds. |
| (c) | Excludes amounts related to Operating Earnings (non-GAAP) reconciling items. |
| (d) | Net of capitalized interest. |
PSEG Enterprise/Other
Operating Earnings (non-GAAP) Reconciliation
| Reconciling Items | Three Months Ended June 30, |
Six Months Ended June 30, |
||||||||||||||
| 2017 | 2016 | 2017 | 2016 | |||||||||||||
| ($ millions, Unaudited) | ||||||||||||||||
| Net Income (Loss) |
$ | (2 | ) | $ | 19 | $ | (17 | ) | $ | 36 | ||||||
| Lease Related Activity, pre-tax |
22 | — | 77 | — | ||||||||||||
| Income Taxes related to Operating Earnings (non-GAAP) reconciling items (a) |
(9 | ) | — | (32 | ) | — | ||||||||||
|
|
|
|
|
|
|
|
|
|||||||||
| Operating Earnings (non-GAAP) |
$ | 11 | $ | 19 | $ | 28 | $ | 36 | ||||||||
|
|
|
|
|
|
|
|
|
|||||||||
| PSEG Fully Diluted Average Shares Outstanding (in millions) |
507 | 508 | 507 | 508 | ||||||||||||
| (a) | Income tax effect calculated at a combined leveraged lease effective tax rate. |