Attached files
| file | filename |
|---|---|
| 8-K - 8-K - CMS ENERGY CORP | a17-18549_28k.htm |
Exhibit 99.1
Second Quarter 2017 Results & Outlook July 28, 2017 CMS Energy: World Class Performance Delivering Hometown Service PEOPLE PLANET PROFIT

This presentation is made as of the date hereof and contains “forward-looking statements” as defined in Rule 3b-6 of the Securities Exchange Act of 1934, Rule 175 of the Securities Act of 1933, and relevant legal decisions. The forward-looking statements are subject to risks and uncertainties. All forward-looking statements should be considered in the context of the risk and other factors detailed from time to time in CMS Energy’s and Consumers Energy’s Securities and Exchange Commission filings. Forward-looking statements should be read in conjunction with “FORWARD-LOOKING STATEMENTS AND INFORMATION” and “RISK FACTORS” sections of CMS Energy’s and Consumers Energy’s Form 10-K for the year ended December 31, 2016 and as updated in subsequent 10-Qs. CMS Energy’s and Consumers Energy’s “FORWARD-LOOKING STATEMENTS AND INFORMATION” and “RISK FACTORS” sections are incorporated herein by reference and discuss important factors that could cause CMS Energy’s and Consumers Energy’s results to differ materially from those anticipated in such statements. CMS Energy and Consumers Energy undertake no obligation to update any of the information presented herein to reflect facts, events or circumstances after the date hereof. The presentation also includes non-GAAP measures when describing CMS Energy’s results of operations and financial performance. A reconciliation of each of these measures to the most directly comparable GAAP measure is included in the appendix and posted on our website at www.cmsenergy.com. CMS Energy provides historical financial results on both a reported (GAAP) and adjusted (non-GAAP) basis and provides forward-looking guidance on an adjusted basis. During an oral presentation, references to “earnings” are on an adjusted basis. Adjustments could include items such as discontinued operations, asset sales, impairments, restructuring costs, regulatory items from prior years, or other items. Management views adjusted earnings as a key measure of the company’s present operating financial performance and uses adjusted earnings for external communications with analysts and investors. Internally, the company uses adjusted earnings to measure and assess performance. Because the company is not able to estimate the impact of specific line items, which have the potential to significantly impact, favorably or unfavorably, the company's reported earnings in future periods, the company is not providing reported earnings guidance nor is it providing a reconciliation for the comparable future period earnings. The adjusted earnings should be considered supplemental information to assist in understanding our business results, rather than as a substitute for the reported earnings. Similarly, management views the ratio of Funds From Operations (FFO)/Average Debt as a key measure of the company’s operating financial performance and its financial position, and uses the ratio for external communications with analysts and investors. Because the company does not establish its target FFO/Average Debt ratio based on a specific target numerator and target denominator, the company is unable to provide a reconciliation to a comparable GAAP financial measure. Adjusted weather-normalized earnings are provided to show the impact of deviations from normal weather. Investors and others should note that CMS Energy routinely posts important information on its website and considers the Investor Relations section, www.cmsenergy.com/investor-relations, a channel of distribution. 1
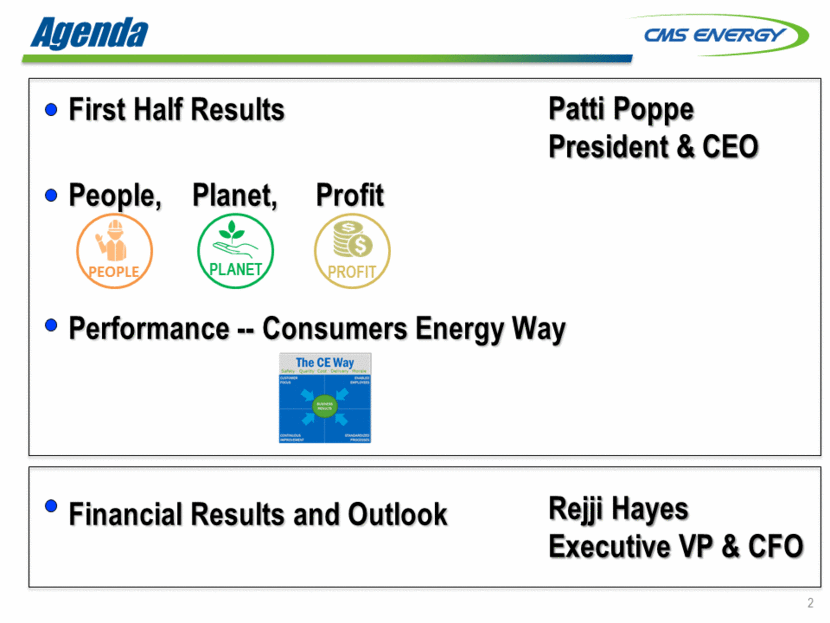
2 Agenda First Half Results People, Planet, Profit Performance -- Consumers Energy Way Financial Results and Outlook Patti Poppe President & CEO Rejji Hayes Executive VP & CFO PEOPLE PLANET PROFIT
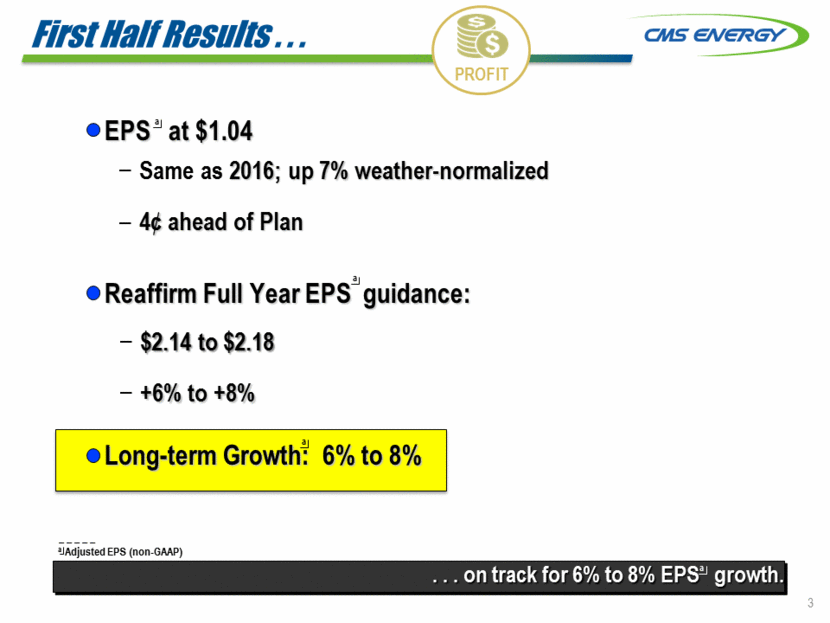
3 First Half Results . . . EPS at $1.04 Reaffirm Full Year EPS guidance: Long-term Growth: 6% to 8% . . . on track for 6% to 8% EPS growth. a a _ _ _ _ _ a Adjusted EPS (non-GAAP) Same as 2016; up 7% weather-normalized 4¢ ahead of Plan $2.14 to $2.18 +6% to +8% a PROFIT a
Consumers Among Top Employers Consumers Energy ranked Michigan’s TOP EMPLOYER by Forbes PEOPLE Consumers Energy named a “Most Trusted Brand” by Market Strategies International 4

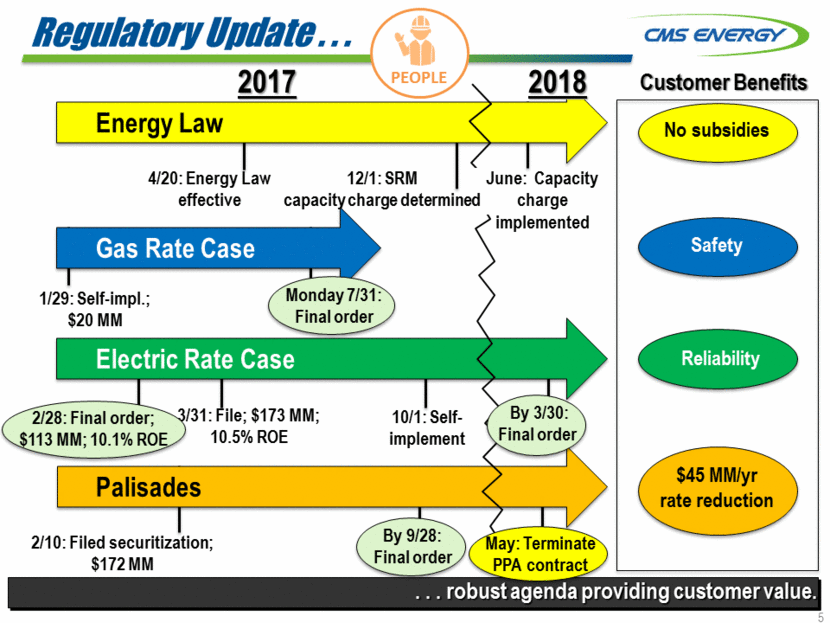
2/10: Filed securitization; $172 MM 5 Regulatory Update . . . . . . robust agenda providing customer value. Gas Rate Case Electric Rate Case 3/31: File; $173 MM; 10.5% ROE 10/1: Self-implement Energy Law Palisades 12/1: SRM capacity charge determined June: Capacity charge implemented 4/20: Energy Law effective 1/29: Self-impl.; $20 MM PEOPLE Monday 7/31: Final order By 3/30: Final order By 9/28: Final order May: Terminate PPA contract 2/28: Final order; $113 MM; 10.1% ROE Customer Benefits No subsidies Safety Reliability $45 MM/yr rate reduction 2017 2018
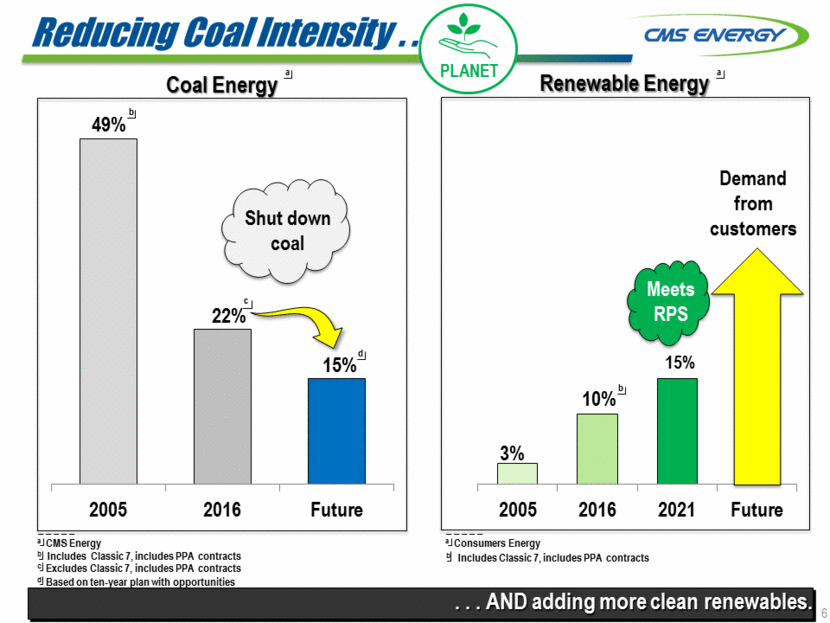
6 Reducing Coal Intensity . . . PLANET . . . AND adding more clean renewables. Coal Energy Renewable Energy 22% 15% 10% 15% c d _ _ _ _ _ c Excludes Classic 7, includes PPA contracts _ _ _ d Based on ten-year plan with opportunities 49% _ _ _ _ _ a CMS Energy b Shut down coal Demand from customers Meets RPS a _ _ _ _ _ b Includes Classic 7, includes PPA contracts a _ _ _ _ _ a Consumers Energy 3% b b Includes Classic 7, includes PPA contracts 2005 2016 Future 2005 2016 2021 Future
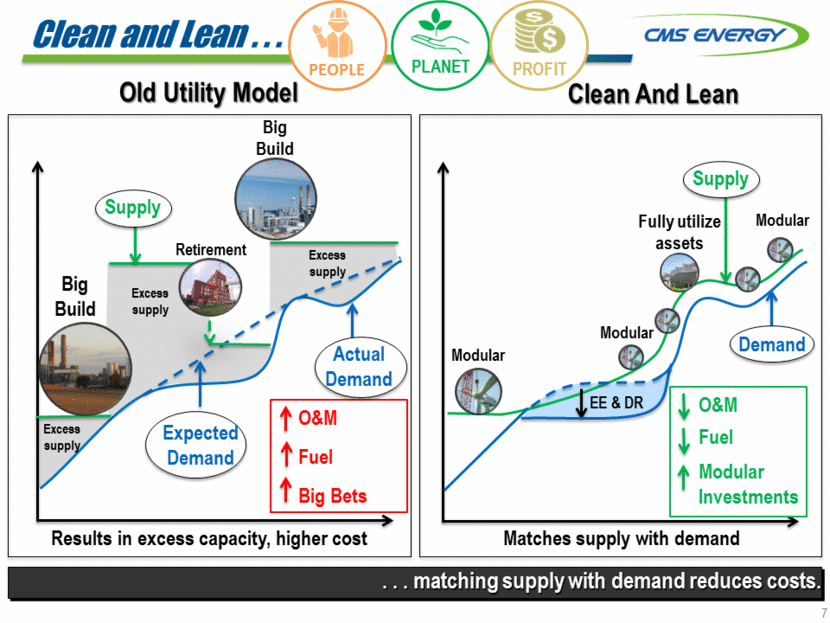
7 . . . matching supply with demand reduces costs. Clean and Lean . . . Old Utility Model Clean And Lean Big Build Big Build O&M Fuel Big Bets Modular Fully utilize assets O&M Fuel Modular Investments Results in excess capacity, higher cost Matches supply with demand Excess supply Excess supply Retirement Supply Actual Demand Demand EE & DR Excess supply Modular Modular Expected Demand Supply PLANET PEOPLE PROFIT
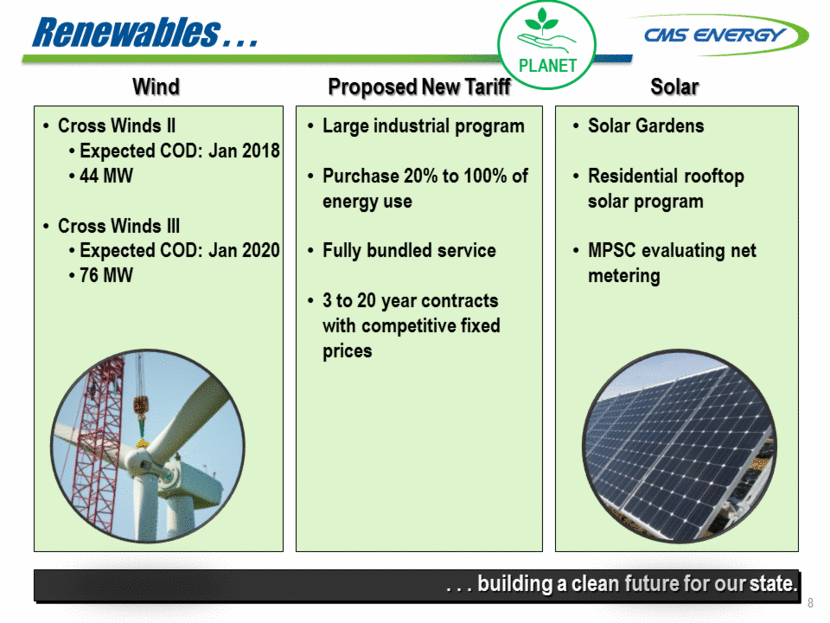
8 Renewables . . . PLANET . . . building a clean future for our state. Wind Proposed New Tariff Solar Solar Gardens Residential rooftop solar program MPSC evaluating net metering Cross Winds II Expected COD: Jan 2018 44 MW Cross Winds III Expected COD: Jan 2020 76 MW Large industrial program Purchase 20% to 100% of energy use Fully bundled service 3 to 20 year contracts with competitive fixed prices
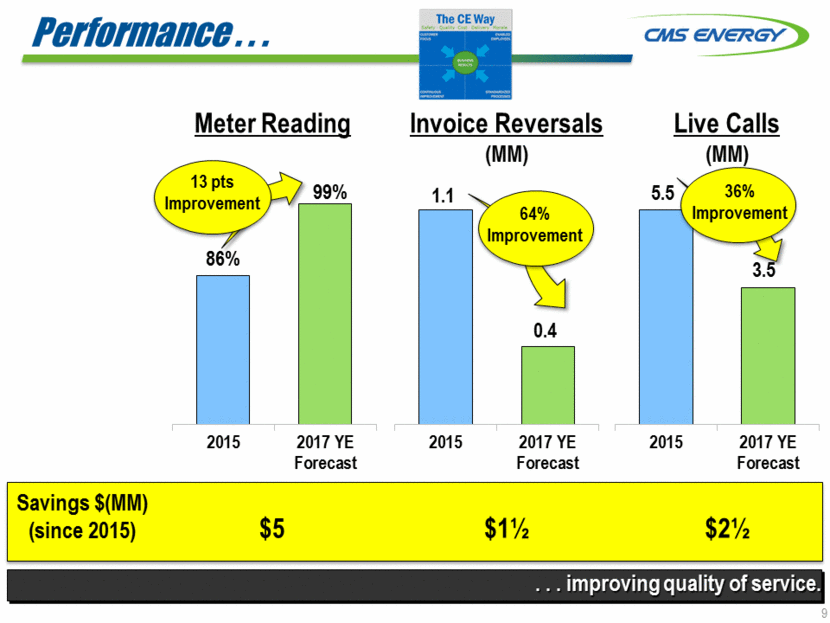
9 Performance . . . Meter Reading Invoice Reversals (MM) Live Calls (MM) Savings $(MM) (since 2015) $5 $1½ $2½ . . . improving quality of service. 1.1 0.4 5.5 3.5 36% Improvement 64% Improvement 99% 13 pts Improvement 2015 2017 YE Forecast 2015 2017 YE Forecast 86% 2015 2017 YE Forecast
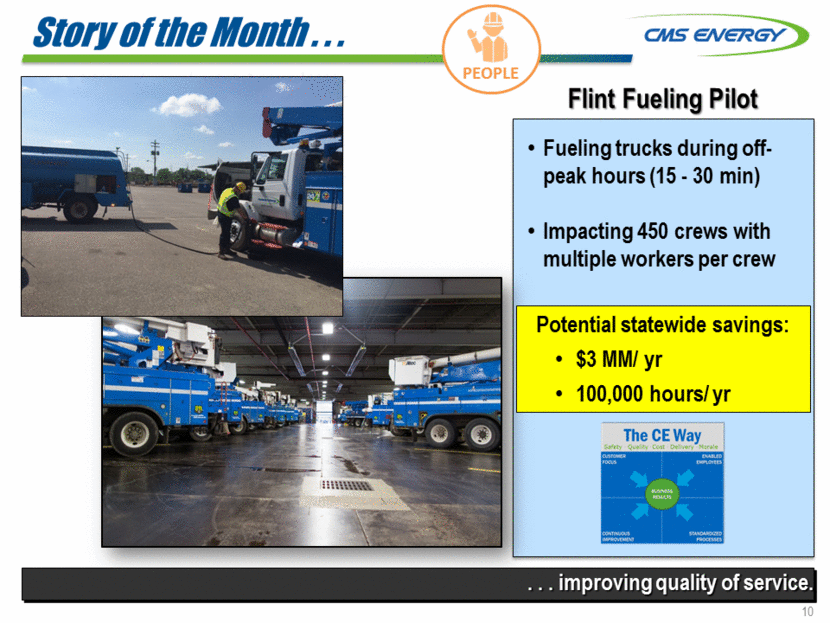
10 Story of the Month . . . . . . improving quality of service. Flint Fueling Pilot Fueling trucks during off-peak hours (15 - 30 min) Impacting 450 crews with multiple workers per crew Potential statewide savings: $3 MM/ yr 100,000 hours/ yr PEOPLE
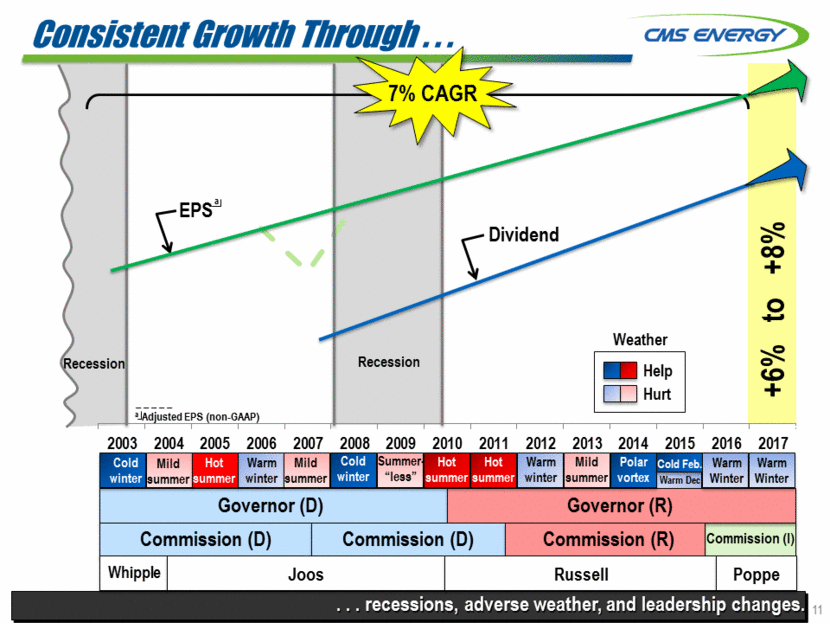
Consistent Growth Through . . . Recession Governor (R) Governor (D) Commission (D) Commission (R) Recession 7% CAGR Polar vortex Cold Feb. Mild summer Warm winter Hot summer Hot summer Cold winter Cold winter Summer- “less” Mild summer Mild summer Commission (D) Hurt Help EPS _ _ _ _ _ a Adjusted EPS (non-GAAP) a Warm winter Hot summer Dividend Weather . . . recessions, adverse weather, and leadership changes. Whipple Joos Russell Commission (I) Poppe Cold Feb. Warm Dec. Warm Winter 11 +6% to +8% Warm Winter 2003 2004 2005 2006 2007 2008 2009 2010 2011 2012 2013 2014 2015 2016 2017
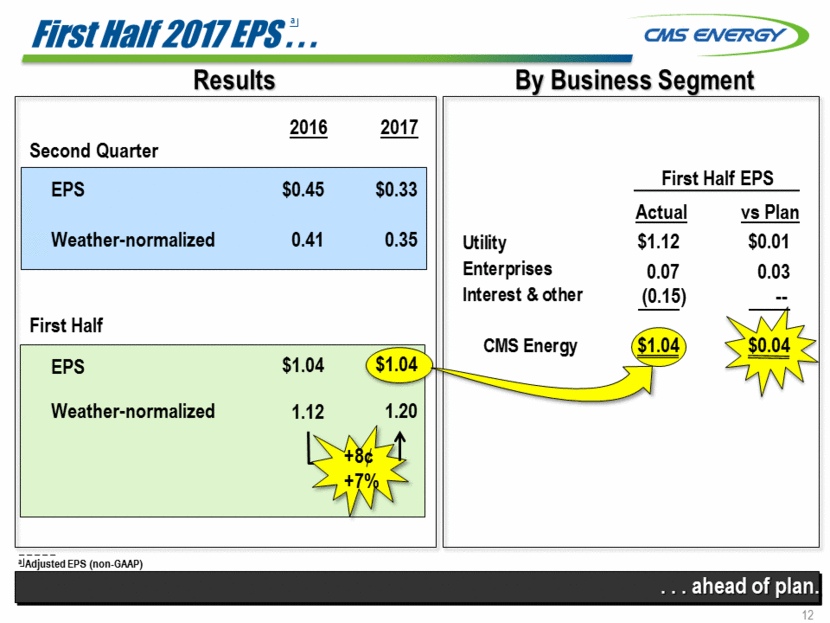
12 First Half 2017 EPS . . . . . . ahead of plan. By Business Segment Results $1.12 0.07 (0.15) $1.04 First Half EPS a _ _ _ _ _ a Adjusted EPS (non-GAAP) $0.45 2016 2017 0.41 0.35 $0.33 +8¢ +7% $1.04 First Half Weather-normalized 1.12 1.20 vs Plan $0.01 0.03 -- $0.04 Weather-normalized EPS EPS Second Quarter Actual $1.04 Utility Enterprises Interest & other CMS Energy
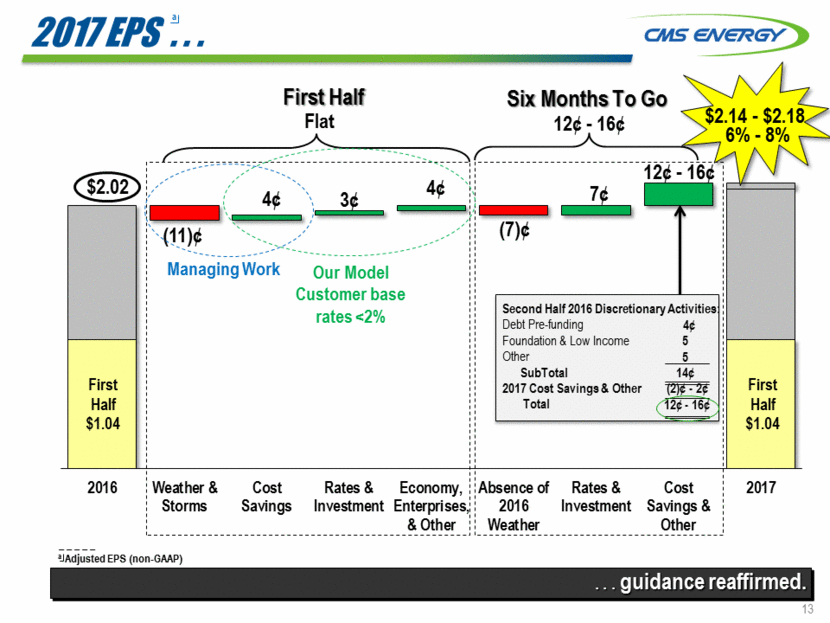
13 2017 EPS . . . First Half Six Months To Go Flat 12¢ - 16¢ $2.02 . . . guidance reaffirmed. First Half $1.04 $2.14 - $2.18 First Half $1.04 6% - 8% 7¢ a _ _ _ _ _ a Adjusted EPS (non-GAAP) 4¢ (7)¢ 12¢ - 16¢ Managing Work Our Model Customer base rates <2% Second Half 2016 Discretionary Activities: Debt Pre-funding Foundation & Low Income Other SubTotal 2017 Cost Savings & Other Total 4¢ 5 5 14¢ (2)¢ - 2¢ 12¢ - 16¢ 3¢ (11)¢ 4¢ 2016 Weather & Storms Cost Savings Rates & Investment Economy, Enterprises, & Other Absence of 2016 Weather Rates & Investment Cost Savings & Other 2017
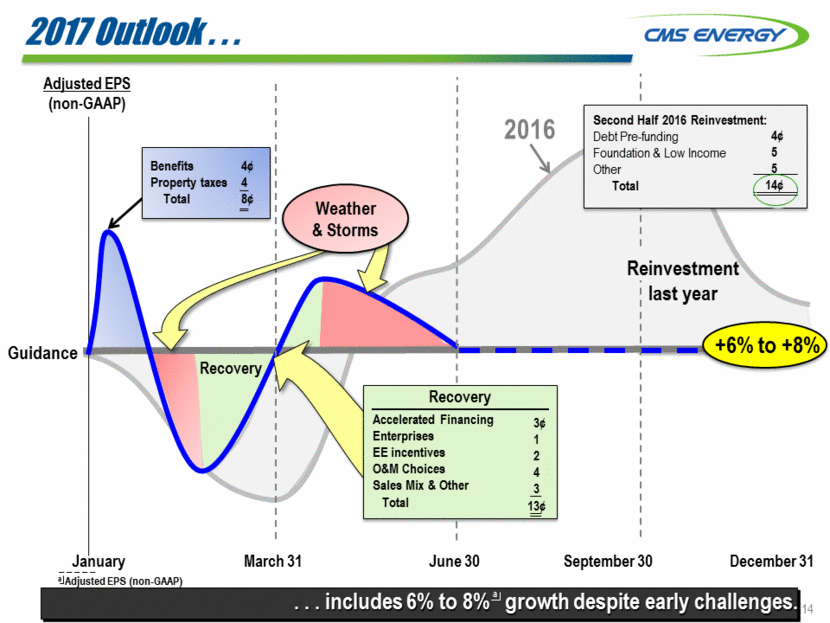
2017 Outlook . . . . . . includes 6% to 8% growth despite early challenges. Adjusted EPS (non-GAAP) January March 31 June 30 September 30 December 31 Recovery Guidance +6% to +8% Benefits Property taxes Total 4¢ 4 8¢ 14 Reinvestment last year 2016 Accelerated Financing Enterprises EE incentives O&M Choices Sales Mix & Other Total 3¢ 1 2 4 3 13¢ Recovery Weather & Storms _ _ _ _ _ a Adjusted EPS (non-GAAP) a Second Half 2016 Reinvestment: Debt Pre-funding Foundation & Low Income Other Total 4¢ 5 5 14¢
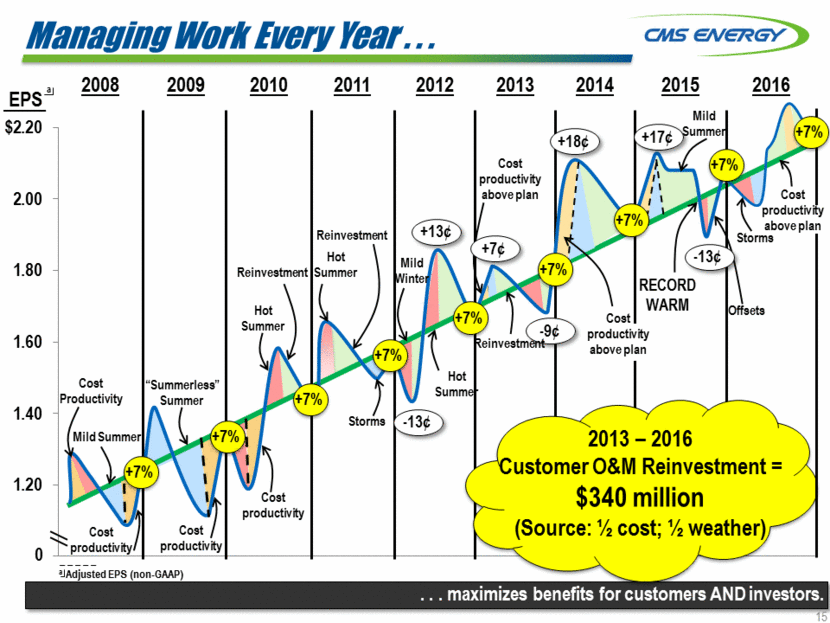
Managing Work Every Year . . . . . . maximizes benefits for customers AND investors. 15 2008 2009 2010 2011 2012 2013 2014 2015 +7% +7% +7% +7% +7% +7% +7% Offsets RECORD WARM -13¢ +17¢ +18¢ -9¢ +13¢ -13¢ Mild Summer Cost productivity above plan +7¢ Reinvestment Hot Summer Mild Winter Hot Summer Storms Hot Summer “Summerless” Summer Cost Productivity Cost productivity above plan 0 2013 – 2016 Customer O&M Reinvestment = $340 million (Source: ½ cost; ½ weather) Cost productivity Cost productivity Reinvestment Reinvestment Mild Summer Cost productivity EPS _ _ _ _ _ a Adjusted EPS (non-GAAP) a 2016 +7% +7% Storms Cost productivity above plan $1.00 $1.20 $1.40 $1.60 $1.80 $2.00 $2.20
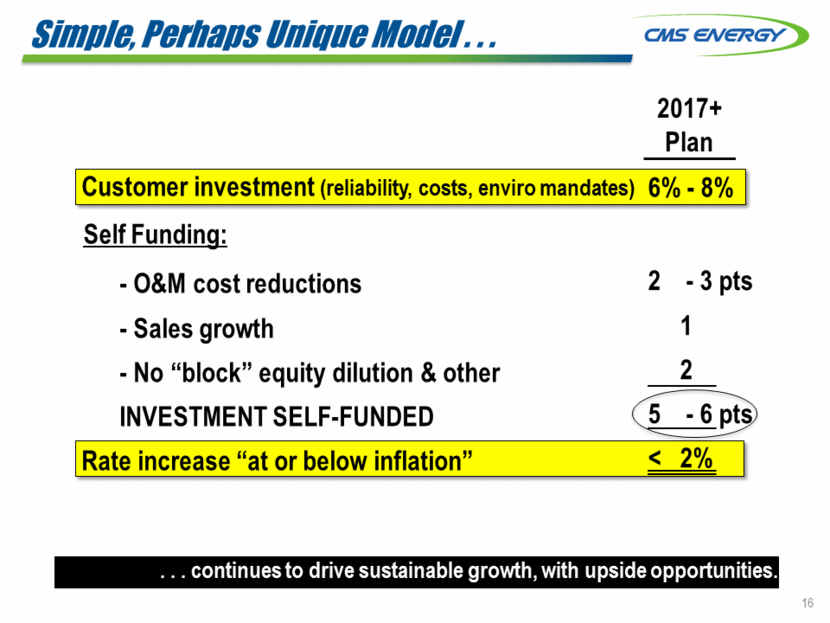
Simple, Perhaps Unique Model . . . Customer investment (reliability, costs, enviro mandates) - O&M cost reductions - Sales growth - No “block” equity dilution & other INVESTMENT SELF-FUNDED Rate increase “at or below inflation” 2017+ Plan 6% - 8% . . . continues to drive sustainable growth, with upside opportunities. 2 - 3 pts 1 2 5 - 6 pts < 2% 16 Self Funding:
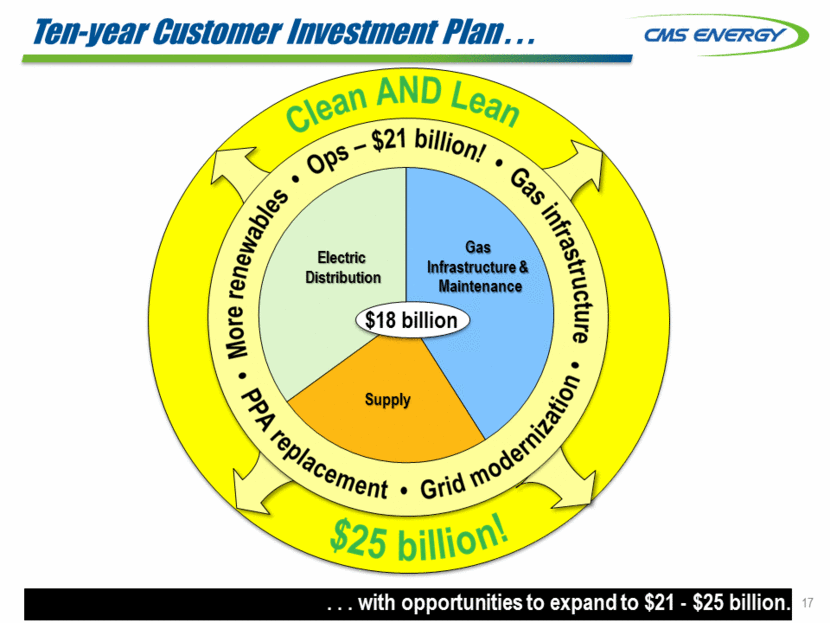
17 Electric Distribution Gas Infrastructure & Maintenance Supply $18 billion Ten-year Customer Investment Plan . . . . . . with opportunities to expand to $21 - $25 billion.
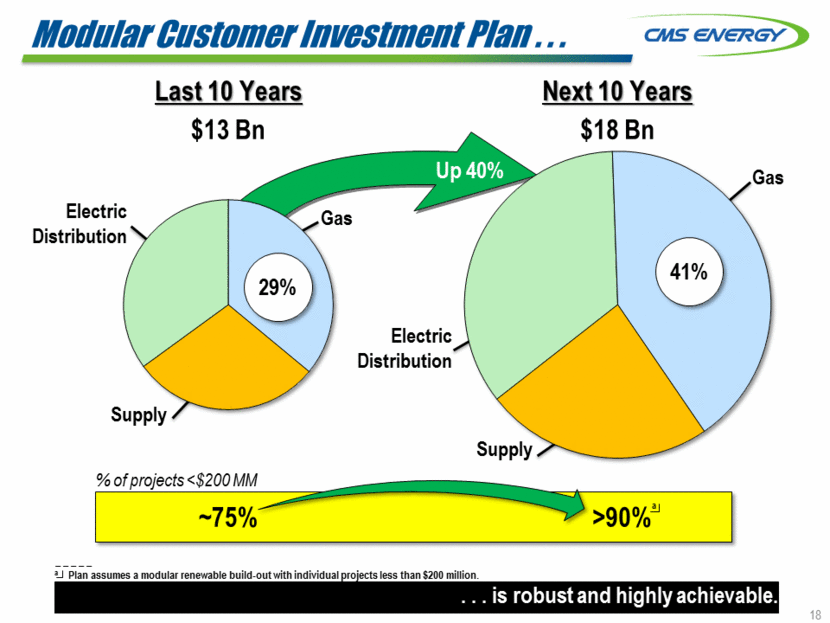
Modular Customer Investment Plan . . . 18 Last 10 Years Next 10 Years $13 Bn $18 Bn % of projects <$200 MM ~75% >90% Gas Supply Electric Distribution Electric Distribution Gas Supply Up 40% 41% 29% . . . is robust and highly achievable. a _ _ _ _ _ a Plan assumes a modular renewable build-out with individual projects less than $200 million.
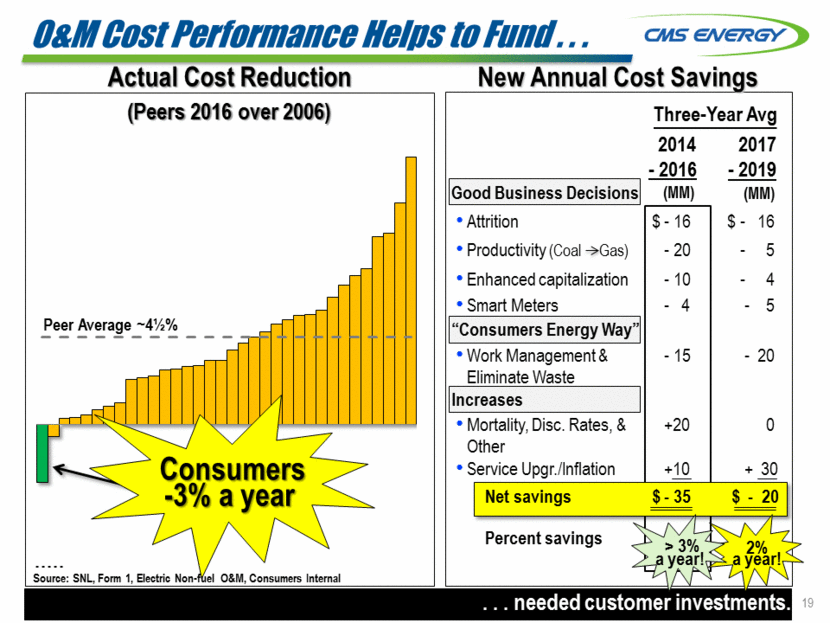
O&M Cost Performance Helps to Fund . . . Actual Cost Reduction Consumers - - - - - Source: SNL, Form 1, Electric Non-fuel O&M, Consumers Internal Peer Average ~4½% (Peers 2016 over 2006) New Annual Cost Savings Attrition $ - 16 $ - 16 Productivity (Coal Gas) - 20 - 5 Enhanced capitalization - 10 - 4 Smart Meters - 4 - 5 Work Management & Eliminate Waste - 15 - 20 Mortality, Disc. Rates, & Other +20 0 Service Upgr./Inflation +10 + 30 Net savings $ - 35 $ - 20 Percent savings 2014 - 2016 2017 - 2019 (MM) (MM) . . . needed customer investments. -3% a year 2% a year! 19 Good Business Decisions “Consumers Energy Way” Increases a year! > 3% Three-Year Avg
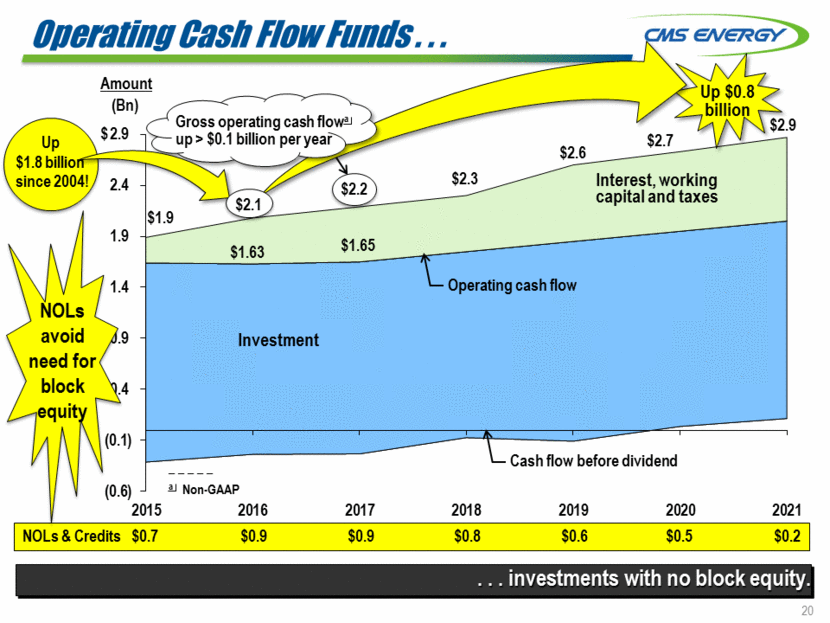
Operating Cash Flow Funds . . . . . . investments with no block equity. Amount (Bn) $ Investment Cash flow before dividend _ _ _ _ _ a Non-GAAP NOLs & Credits $0.7 $0.9 $0.9 $0.8 $0.6 $0.5 $0.2 $2.6 Interest, working capital and taxes $1.9 $2.9 $1.63 $2.3 $2.7 Up $0.8 billion Operating cash flow Gross operating cash flowa up > $0.1 billion per year 20 Up $1.8 billion since 2004! NOLs avoid need for block equity $2.2 $1.65 $2.1 (0.6) (0.1) 0.4 0.9 1.4 1.9 2.4 2.9 2015 2016 2017 2018 2019 2020 2021
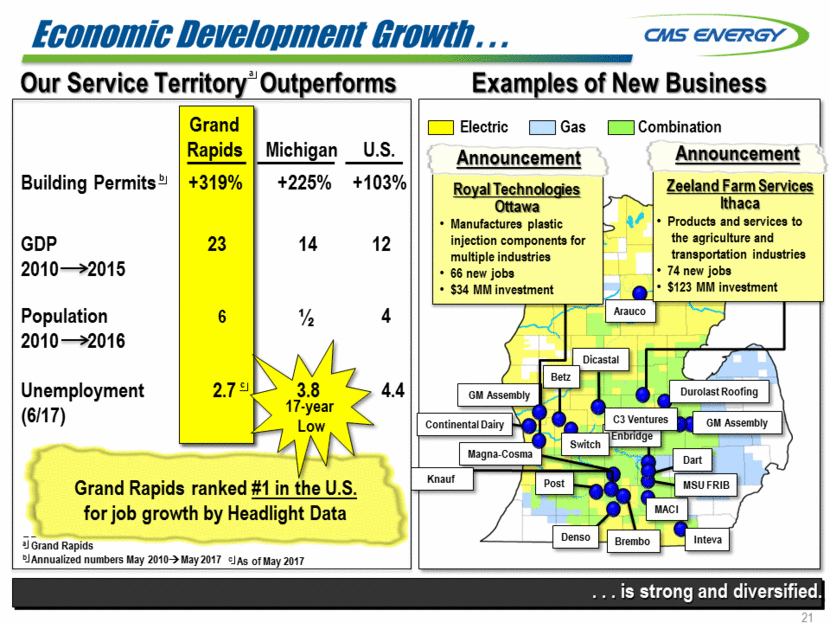
Economic Development Growth . . . Examples of New Business Electric Gas Combination Enbridge Brembo Denso Post Magna-Cosma Dicastal Continental Dairy Arauco Betz Knauf . . . is strong and diversified. GM Assembly _ _ _ _ _ a Grand Rapids b Annualized numbers May 2010 May 2017 Our Service Territory Outperforms a Switch Royal Technologies Ottawa Manufactures plastic injection components for multiple industries 66 new jobs $34 MM investment Durolast Roofing MACI MSU FRIB Dart Zeeland Farm Services Ithaca Products and services to the agriculture and transportation industries 74 new jobs $123 MM investment Announcement Announcement GM Assembly Grand Rapids ranked #1 in the U.S. for job growth by Headlight Data Inteva C3 Ventures b 21 c c As of May 2017 Grand Rapids Michigan U.S. Building Permits +319% +225% +103% GDP 2010 2015 23 14 12 Population 2010 2016 6 ½ 4 Unemployment (6/17) 2.7 3.8 4.4 17-year Low
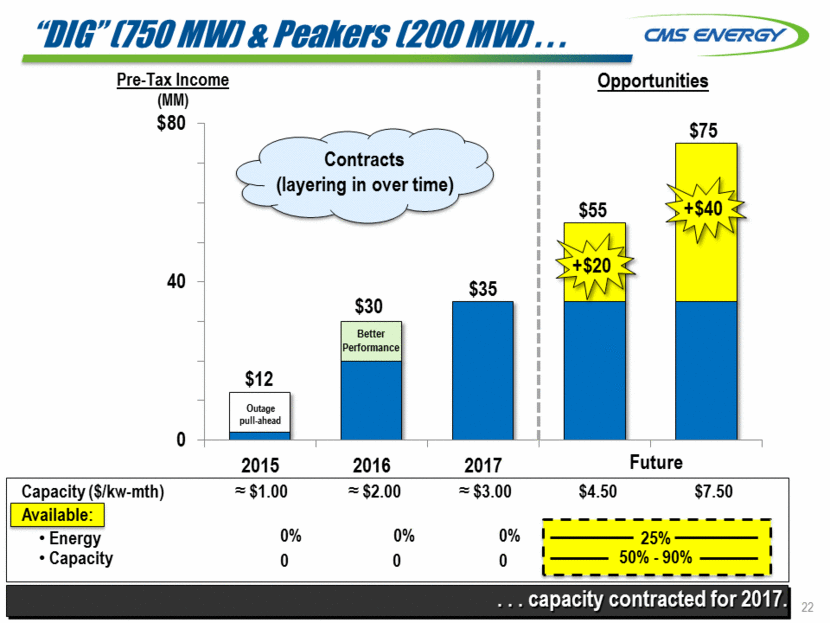
“DIG” (750 MW) & Peakers (200 MW) . . . 22 . . . capacity contracted for 2017. Pre-Tax Income (MM) $12 $30 $35 Outage pull-ahead Better Performance Future Opportunities Capacity ($/kw-mth) $1.00 $2.00 $3.00 $4.50 $7.50 Available: Energy Capacity 0% 0% 25% 0 0 0 $ +$20 +$40 Contracts (layering in over time) $75 $55 50% - 90% 0% 0 10 20 30 40 50 60 70 80 2015 2016 2017
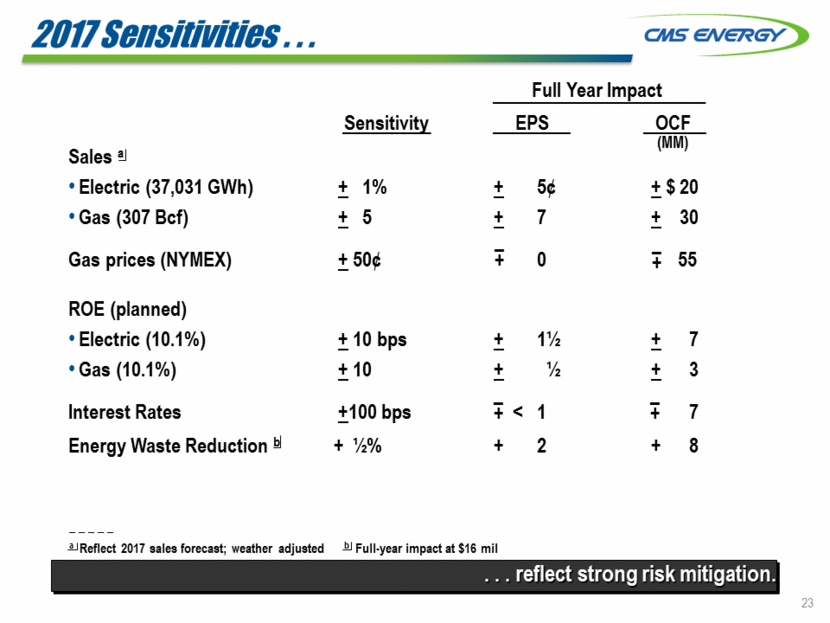
23 2017 Sensitivities . . . Full Year Impact Sensitivity EPS OCF Sales a Electric (37,031 GWh) Gas (307 Bcf) + 1% + 5 + 5¢ + 7 + $ 20 + 30 Gas prices (NYMEX) + 50¢ 0 55 ROE (planned) Electric (10.1%) Gas (10.1%) + 10 bps + 10 + 1½ + ½ + 7 + 3 Interest Rates Energy Waste Reduction b +100 bps + ½% < 1 + 2 7 + 8 – + . . . reflect strong risk mitigation. – + (MM) _ _ _ _ _ a Reflect 2017 sales forecast; weather adjusted b Full-year impact at $16 mil – + – +
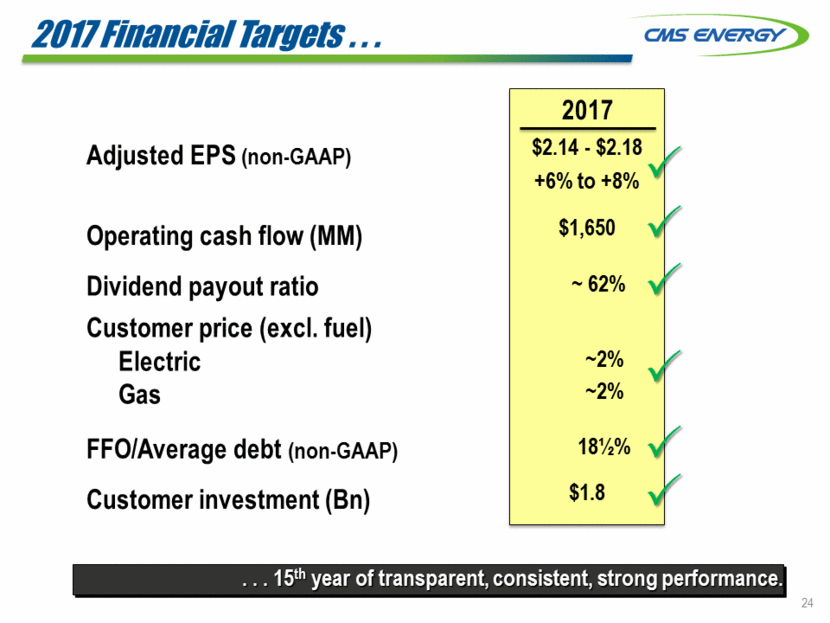
24 2017 Financial Targets . . . Adjusted EPS (non-GAAP) Operating cash flow (MM) Dividend payout ratio Customer price (excl. fuel) Electric Gas FFO/Average debt (non-GAAP) Customer investment (Bn) . . . 15th year of transparent, consistent, strong performance. 2017 $2.14 - $2.18 +6% to +8% $1,650 ~2% 18½% ~ 62% $1.8 ~2%
Q & A 25 See you at our September 25th Investor Day!

Appendix
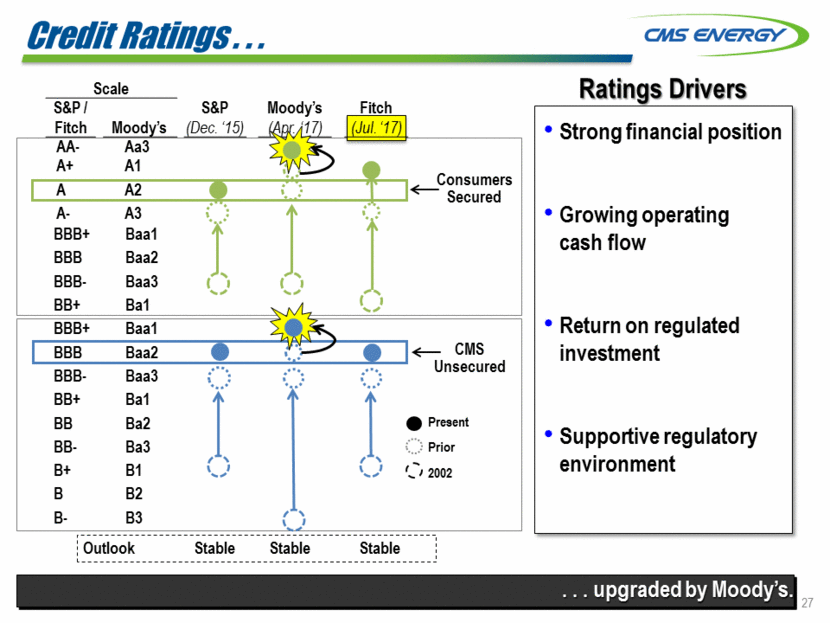
27 Strong financial position Growing operating cash flow Return on regulated investment Supportive regulatory environment Ratings Drivers Present Prior 2002 Consumers Secured CMS Unsecured . . . upgraded by Moody’s. Credit Ratings . . . Scale S&P / Fitch Moody’s S&P (Dec. ‘15) Moody’s (Apr. ‘17) Fitch (Jul. ‘17) AA- Aa3 A+ A1 A A2 A- A3 BBB+ Baa1 BBB Baa2 BBB- Baa3 BB+ Ba1 BBB+ Baa1 BBB Baa2 BBB- Baa3 BB+ Ba1 BB Ba2 BB- Ba3 B+ B1 B B2 B- B3 Outlook Stable Stable Stable
GAAP Reconciliation

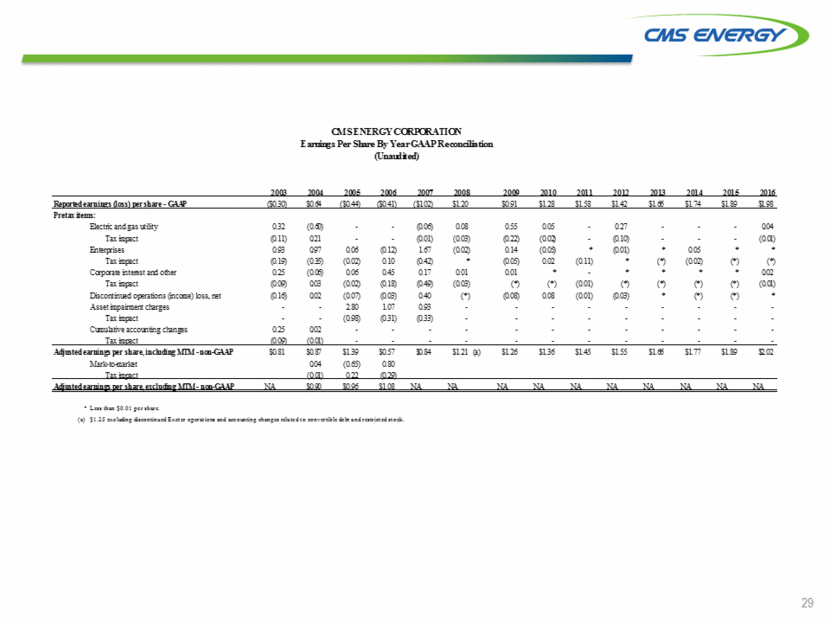
29 CMS ENERGY CORPORATION Earnings Per Share By Year GAAP Reconciliation (Unaudited) 2003 2004 2005 2006 2007 2008 2009 2010 2011 2012 2013 2014 2015 2016 Reported earnings (loss) per share - GAAP ($0.30) $0.64 ($0.44) ($0.41) ($1.02) $1.20 $0.91 $1.28 $1.58 $1.42 $1.66 $1.74 $1.89 $1.98 Pretax items: Electric and gas utility 0.32 (0.60) - - (0.06) 0.08 0.55 0.05 - 0.27 - - - 0.04 Tax impact (0.11) 0.21 - - (0.01) (0.03) (0.22) (0.02) - (0.10) - - - (0.01) Enterprises 0.93 0.97 0.06 (0.12) 1.67 (0.02) 0.14 (0.05) * (0.01) * 0.05 * * Tax impact (0.19) (0.35) (0.02) 0.10 (0.42) * (0.05) 0.02 (0.11) * (*) (0.02) (*) (*) Corporate interest and other 0.25 (0.06) 0.06 0.45 0.17 0.01 0.01 * - * * * * 0.02 Tax impact (0.09) 0.03 (0.02) (0.18) (0.49) (0.03) (*) (*) (0.01) (*) (*) (*) (*) (0.01) Discontinued operations (income) loss, net (0.16) 0.02 (0.07) (0.03) 0.40 (*) (0.08) 0.08 (0.01) (0.03) * (*) (*) * Asset impairment charges - - 2.80 1.07 0.93 - - - - - - - - - Tax impact - - (0.98) (0.31) (0.33) - - - - - - - - - Cumulative accounting changes 0.25 0.02 - - - - - - - - - - - - Tax impact (0.09) (0.01) - - - - - - - - - - - - Adjusted earnings per share, including MTM - non-GAAP $0.81 $0.87 $1.39 $0.57 $0.84 $1.21 (a) $1.26 $1.36 $1.45 $1.55 $1.66 $1.77 $1.89 $2.02 Mark-to-market 0.04 (0.65) 0.80 Tax impact (0.01) 0.22 (0.29) Adjusted earnings per share, excluding MTM - non-GAAP NA $0.90 $0.96 $1.08 NA NA NA NA NA NA NA NA NA NA * Less than $0.01 per share. (a) $1.25 excluding discontinued Exeter operations and accounting changes related to convertible debt and restricted stock.
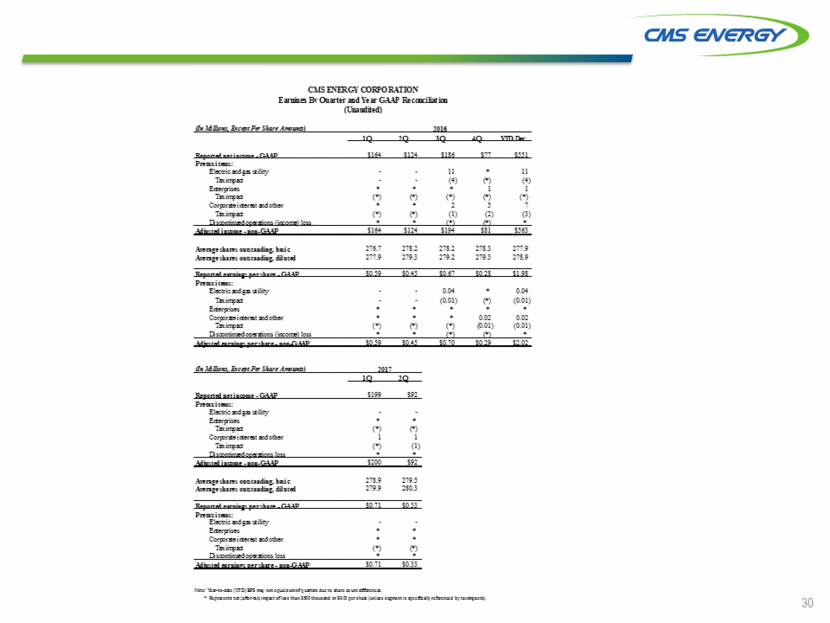
30 (In Millions, Except Per Share Amounts) 2016 1Q 2Q 3Q 4Q YTD Dec Reported net income - GAAP $164 $124 $186 $77 $551 Pretax items: Electric and gas utility - - 11 * 11 Tax impact - - (4) (*) (4) Enterprises * * * 1 1 Tax impact (*) (*) (*) (*) (*) Corporate interest and other * * 2 5 7 Tax impact (*) (*) (1) (2) (3) Discontinued operations (income) loss * * (*) (*) * Adjusted income - non-GAAP $164 $124 $194 $81 $563 Average shares outstanding, basic 276.7 278.2 278.2 278.3 277.9 Average shares outstanding, diluted 277.9 279.3 279.2 279.3 278.9 Reported earnings per share - GAAP $0.59 $0.45 $0.67 $0.28 $1.98 Pretax items: Electric and gas utility - - 0.04 * 0.04 Tax impact - - (0.01) (*) (0.01) Enterprises * * * * * Corporate interest and other * * * 0.02 0.02 Tax impact (*) (*) (*) (0.01) (0.01) Discontinued operations (income) loss * * (*) (*) * Adjusted earnings per share - non-GAAP $0.59 $0.45 $0.70 $0.29 $2.02 (In Millions, Except Per Share Amounts) 2017 1Q 2Q Reported net income - GAAP $199 $92 Pretax items: Electric and gas utility - - Enterprises * * Tax impact (*) (*) Corporate interest and other 1 1 Tax impact (*) (1) Discontinued operations loss * * Adjusted income - non-GAAP $200 $92 Average shares outstanding, basic 278.9 279.5 Average shares outstanding, diluted 279.9 280.3 Reported earnings per share - GAAP $0.71 $0.33 Pretax items: Electric and gas utility - - Enterprises * * Corporate interest and other * * Tax impact (*) (*) Discontinued operations loss * * Adjusted earnings per share - non-GAAP $0.71 $0.33 Note: Year-to-date (YTD) EPS may not equal sum of quarters due to share count differences. * Represents net (after-tax) impact of less than $500 thousand or $0.01 per share (unless segment is specifically referenced by tax impacts).
31 In Millions Twelve Months Ended 03/31/17 12/31/16 03/31/16 EBIT (1) Adjusted Non-GAAP Consolidated $ 1,339 $ 1,280 $ 1,133 Consumers Energy 1,274 1,215 1,077 Depreciation/Amortization Consolidated $ 835 $ 811 $ 766 Consumers Energy 826 803 761 EBITDA (1) Adjusted Non-GAAP Consolidated $ 2,174 $ 2,091 $ 1,899 Consumers Energy 2,100 2,018 1,838 Dividends and Other Distributions From Subsidiaries $ 492 $ 499 $ 532 Interest Expense, Net Consolidated $ 436 $ 435 $ 401 Energy Parent 149 150 136 Consumers Energy 269 268 252 As of 03/31/17 12/31/16 03/31/16 Book Value Per Share $ 15.61 $ 15.23 $ 14.72 Shares Outstanding - End of Period 280.0 279.2 279.2 Shares Outstanding - Year-to-Date Average Basic 278.9 277.9 276.7 Diluted 279.9 278.9 277.9 Debt Energy Parent debt (2) $ 3,026 $ 2,678 $ 2,606 CMS Capital debt (2) (3) 1,169 1,198 1,111 Consumers Energy debt (excluding securitization bonds) (2) 5,522 5,830 5,164 Consolidated (excluding securitization bonds) 9,717 9,706 8,881 Securitization Bonds 328 328 353 Consolidated $ 10,045 $ 10,034 $ 9,234 Unrestricted Cash & Cash Equivalents Consumers Energy $ 182 $ 131 $ 27 CMS Treasury Services 170 43 87 Other 81 61 63 Consolidated $ 433 $ 235 $ 177 Consumers Energy Common Equity Ratio - Ratemaking (Average) Electric 41.0% 41.4% Gas 40.9% 41.3% Rate Base (Average) Electric $ 10,184 $ 9,739 Gas 4,024 3,682 Return on Average Common Equity - Financial Electric (4) 11.2% 11.2% Gas (4) 9.4% 7.2% Return on Rate Base Electric 6.6% 6.3% Gas 5.9% 5.2% (1) EBIT equals Net Income+Accounting Change+Discontinued Operations+Noncontrolling Interests+Income Taxes+Interest Charges+Writedown+Losses-Gains on Asset Sales. EBITDA equals EBIT + Depreciation/Amortization (2) Includes current maturities, leases and notes payable (3) Includes EnerBank certificates of deposit (4) Weather normal ROE's are Electric %, Gas %
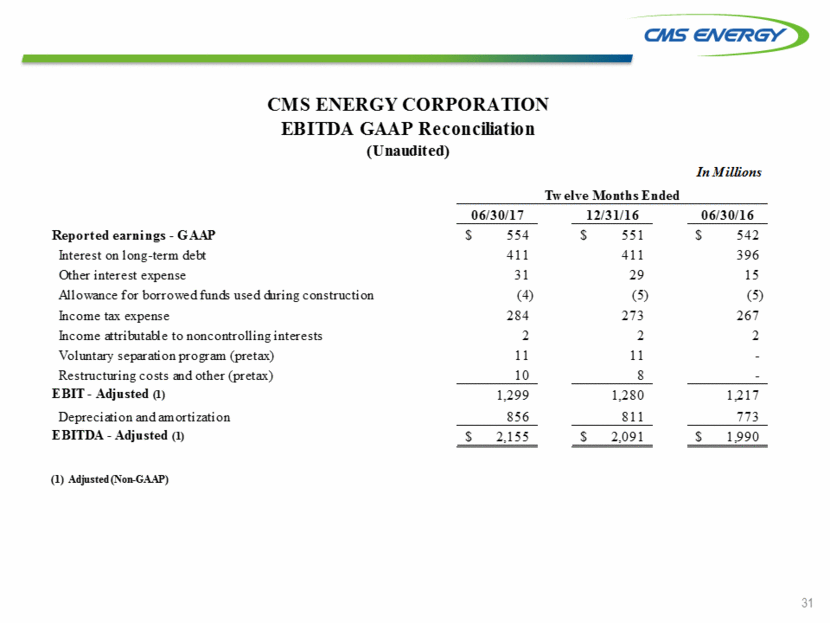
32 In Millions Twelve Months Ended 03/31/17 12/31/16 03/31/16 EBIT (1) Adjusted Non-GAAP Consolidated $ 1,339 $ 1,280 $ 1,133 Consumers Energy 1,274 1,215 1,077 Depreciation/Amortization Consolidated $ 835 $ 811 $ 766 Consumers Energy 826 803 761 EBITDA (1) Adjusted Non-GAAP Consolidated $ 2,174 $ 2,091 $ 1,899 Consumers Energy 2,100 2,018 1,838 Dividends and Other Distributions From Subsidiaries $ 492 $ 499 $ 532 Interest Expense, Net Consolidated $ 436 $ 435 $ 401 Energy Parent 149 150 136 Consumers Energy 269 268 252 As of 03/31/17 12/31/16 03/31/16 Book Value Per Share $ 15.61 $ 15.23 $ 14.72 Shares Outstanding - End of Period 280.0 279.2 279.2 Shares Outstanding - Year-to-Date Average Basic 278.9 277.9 276.7 Diluted 279.9 278.9 277.9 Debt Energy Parent debt (2) $ 3,026 $ 2,678 $ 2,606 CMS Capital debt (2) (3) 1,169 1,198 1,111 Consumers Energy debt (excluding securitization bonds) (2) 5,522 5,830 5,164 Consolidated (excluding securitization bonds) 9,717 9,706 8,881 Securitization Bonds 328 328 353 Consolidated $ 10,045 $ 10,034 $ 9,234 Unrestricted Cash & Cash Equivalents Consumers Energy $ 182 $ 131 $ 27 CMS Treasury Services 170 43 87 Other 81 61 63 Consolidated $ 433 $ 235 $ 177 Consumers Energy Common Equity Ratio - Ratemaking (Average) Electric 41.0% 41.4% Gas 40.9% 41.3% Rate Base (Average) Electric $ 10,184 $ 9,739 Gas 4,024 3,682 Return on Average Common Equity - Financial Electric (4) 11.2% 11.2% Gas (4) 9.4% 7.2% Return on Rate Base Electric 6.6% 6.3% Gas 5.9% 5.2% (1) EBIT equals Net Income+Accounting Change+Discontinued Operations+Noncontrolling Interests+Income Taxes+Interest Charges+Writedown+Losses-Gains on Asset Sales. EBITDA equals EBIT + Depreciation/Amortization (2) Includes current maturities, leases and notes payable (3) Includes EnerBank certificates of deposit (4) Weather normal ROE's are Electric %, Gas %
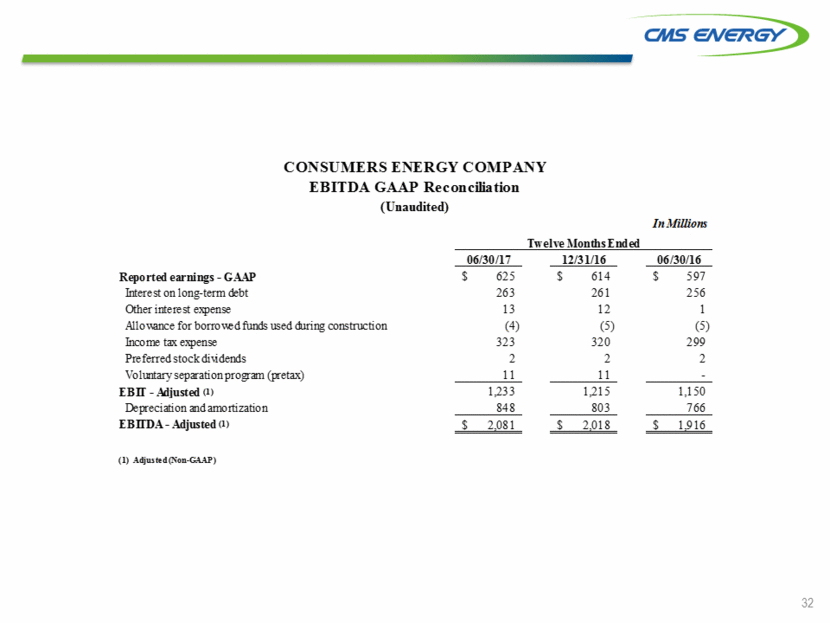
33 CMS Energy Reconciliation of Gross Operating Cash Flow to GAAP Operating Activities (unaudited) (mils) 2015 2016 2017 2018 2019 2020 2021 Consumers Operating Income + Depreciation & Amortization $ 1,866 $ 2,037 $ 2,134 $ 2,246 $ 2,547 $ 2,678 $ 2,816 Enterprises Project Cash Flows 20 46 58 58 53 53 54 Gross Operating Cash Flow $ 1,886 $ 2,083 $ 2,192 $ 2,304 $ 2,600 $ 2,731 $ 2,870 Other operating activities including taxes, interest payments and working capital (246) (454) (542) (554) (750) (781) (820) Net cash provided by operating activities $ 1,640 $ 1,629 $ 1,650 $ 1,750 $ 1,850 $ 1,950 $ 2,050
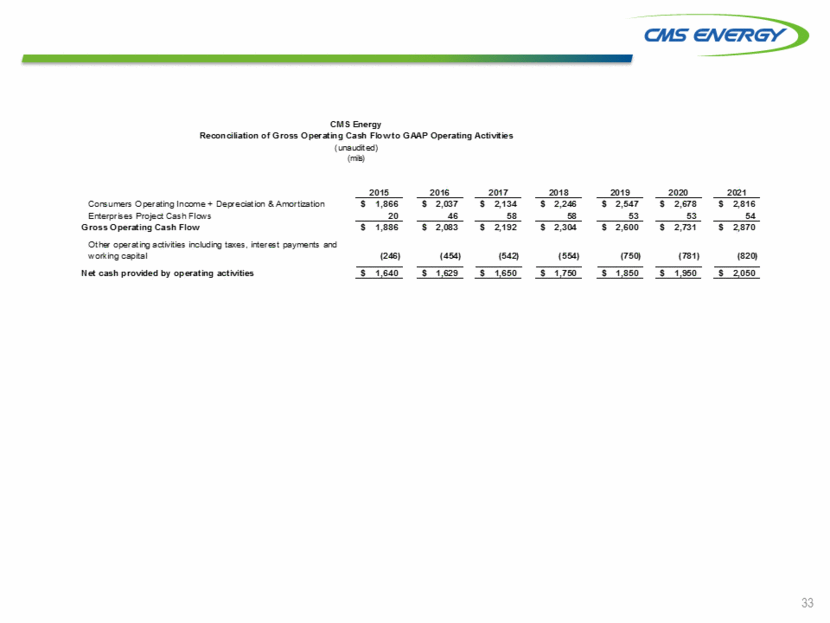
34 Consumers Energy 2017 Cash Flow Forecast GAAP Reconciliation (in millions) (unaudited) Reclassifications From Sources and Uses to Statement of Cash Flows Interest/ Capital Presentation Sources and Uses Tax Other Financing Other Working Accts/Rec Lease Pymts Securitization Common Consolidated Statements of Cash Flows non-GAAP Sharing Payments Capital Financing and Other Debt Pymts Dividends GAAP Description Amount Operating as Operating as Investing as Operating as Financing as Financing as Financing Amount Description Cash at year end 2016 $ 152 $ - $ - $ - $ - $ - $ - $ - $ 152 Cash at year end 2016 Sources Operating (dep & amort $883) $ 2,134 Other working capital (186) Net cash provided by Sources $ 1,948 $ (8) $ (253) $ (11) $ (12) $ 21 $ 25 $ - $ 1,710 operating activities Uses Interest and preferred dividends $ (253) Capital expenditures a (1,786) Dividends/tax sharing to CMS (525) Pension Contribution & Other - Net cash used in Uses $ (2,564) $ 8 $ 253 $ 11 $ - $ - $ - $ 517 $ (1,775) investing activities Cash flow from Cash flow $ (616) $ - $ - $ - $ (12) $ 21 $ 25 $ 517 $ (65) operating and investing activities Financing Equity $ 450 New Issues 650 Retirements (350) Net short-term financing & other (240) Net cash used in Financing $ 510 $ - $ - $ - $ 12 $ (21) $ (25) $ (517) $ (41) financing activities Net change in cash $ (106) $ - $ - $ - $ - $ - $ - $ - $ (106) Net change in cash Cash at year end 2017 b $ 46 $ - $ - $ - $ - $ - $ - $ - $ 46 Cash at year end 2017 a Includes cost of removal and capital leases b Includes restricted cash
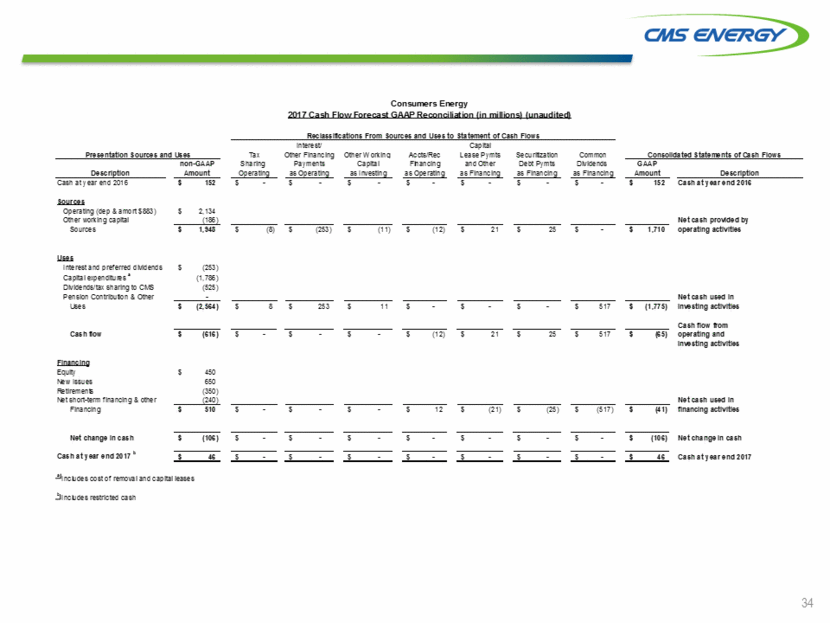
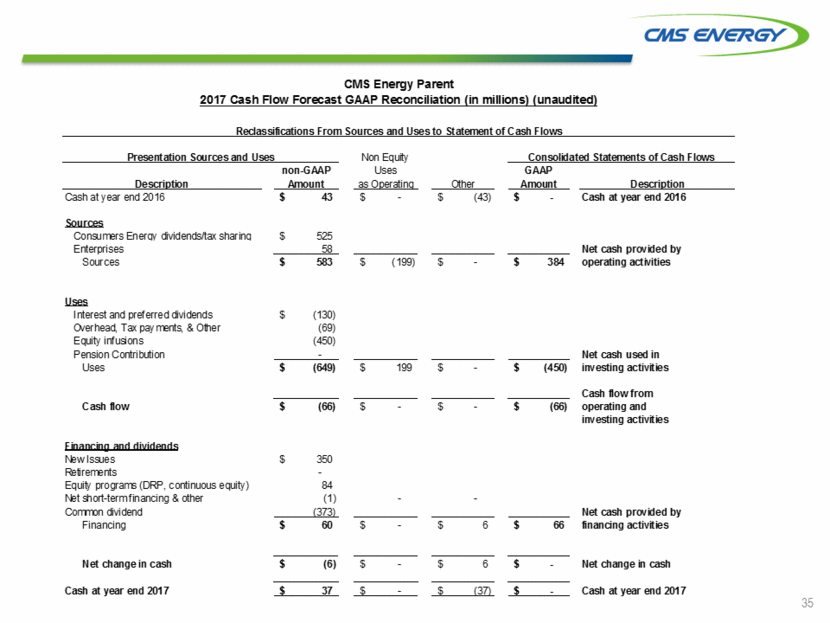
35 CMS Energy Parent 2017 Cash Flow Forecast GAAP Reconciliation (in millions) (unaudited) Reclassifications From Sources and Uses to Statement of Cash Flows Presentation Sources and Uses Non Equity Consolidated Statements of Cash Flows non-GAAP Uses GAAP Description Amount as Operating Other Amount Description Cash at year end 2016 $ 43 $ - $ (43) $ - Cash at year end 2016 Sources Consumers Energy dividends/tax sharing $ 525 Enterprises 58 Net cash provided by Sources $ 583 $ (199) $ - $ 384 operating activities Uses Interest and preferred dividends $ (130) Overhead, Tax payments, & Other (69) Equity infusions (450) Pension Contribution - Net cash used in Uses $ (649) $ 199 $ - $ (450) investing activities Cash flow from Cash flow $ (66) $ - $ - $ (66) operating and investing activities Financing and dividends New Issues $ 350 Retirements - Equity programs (DRP, continuous equity) 84 Net short-term financing & other (1) - - Common dividend (373) Net cash provided by Financing $ 60 $ - $ 6 $ 66 financing activities Net change in cash $ (6) $ - $ 6 $ - Net change in cash Cash at year end 2017 $ 37 $ - $ (37) $ - Cash at year end 2017
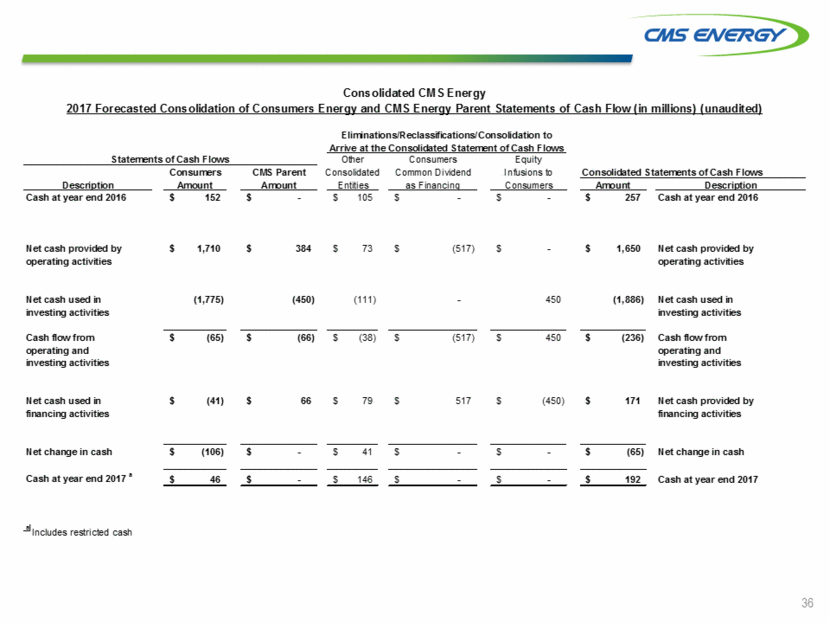
36 Consolidated CMS Energy 2017 Forecasted Consolidation of Consumers Energy and CMS Energy Parent Statements of Cash Flow (in millions) (unaudited) Eliminations/Reclassifications/Consolidation to Arrive at the Consolidated Statement of Cash Flows Statements of Cash Flows Other Consumers Equity Consumers CMS Parent Consolidated Common Dividend Infusions to Consolidated Statements of Cash Flows Description Amount Amount Entities as Financing Consumers Amount Description Cash at year end 2016 $ 152 $ - $ 105 $ - $ - $ 257 Cash at year end 2016 Net cash provided by $ 1,710 $ 384 $ 73 $ (517) $ - $ 1,650 Net cash provided by operating activities operating activities Net cash used in (1,775) (450) (111) - 450 (1,886) Net cash used in investing activities investing activities Cash flow from $ (65) $ (66) $ (38) $ (517) $ 450 $ (236) Cash flow from operating and operating and investing activities investing activities Net cash used in $ (41) $ 66 $ 79 $ 517 $ (450) $ 171 Net cash provided by financing activities financing activities Net change in cash $ (106) $ - $ 41 $ - $ - $ (65) Net change in cash Cash at year end 2017 a $ 46 $ - $ 146 $ - $ - $ 192 Cash at year end 2017 a Includes restricted cash
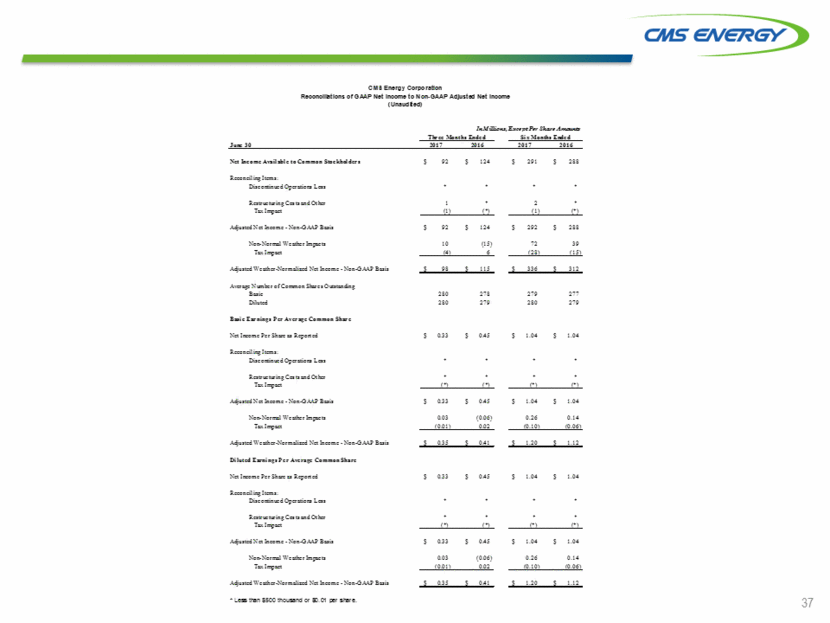
37 June 30 2017 2016 2017 2016 Net Income Available to Common Stockholders 92 $ 124 $ 291 $ 288 $ Reconciling Items: Discontinued Operations Loss * * * * Restructuring Costs and Other 1 * 2 * Tax Impact (1) (*) (1) (*) Adjusted Net Income - Non-GAAP Basis 92 $ 124 $ 292 $ 288 $ Non-Normal Weather Impacts 10 (15) 72 39 Tax Impact (4) 6 (28) (15) Adjusted Weather-Normalized Net Income - Non-GAAP Basis 98 $ 115 $ 336 $ 312 $ Average Number of Common Shares Outstanding Basic 280 278 279 277 Diluted 280 279 280 279 Basic Earnings Per Average Common Share Net Income Per Share as Reported 0.33 $ 0.45 $ 1.04 $ 1.04 $ Reconciling Items: Discontinued Operations Loss * * * * Restructuring Costs and Other * * * * Tax Impact (*) (*) (*) (*) Adjusted Net Income - Non-GAAP Basis 0.33 $ 0.45 $ 1.04 $ 1.04 $ Non-Normal Weather Impacts 0.03 (0.06) 0.26 0.14 Tax Impact (0.01) 0.02 (0.10) (0.06) Adjusted Weather-Normalized Net Income - Non-GAAP Basis 0.35 $ 0.41 $ 1.20 $ 1.12 $ Diluted Earnings Per Average Common Share Net Income Per Share as Reported 0.33 $ 0.45 $ 1.04 $ 1.04 $ Reconciling Items: Discontinued Operations Loss * * * * Restructuring Costs and Other * * * * Tax Impact (*) (*) (*) (*) Adjusted Net Income - Non-GAAP Basis 0.33 $ 0.45 $ 1.04 $ 1.04 $ Non-Normal Weather Impacts 0.03 (0.06) 0.26 0.14 Tax Impact (0.01) 0.02 (0.10) (0.06) Adjusted Weather-Normalized Net Income - Non-GAAP Basis 0.35 $ 0.41 $ 1.20 $ 1.12 $ * Less than $500 thousand or $0.01 per share. Three Months Ended Six Months Ended CMS Energy Corporation Reconciliations of GAAP Net Income to Non-GAAP Adjusted Net Income (Unaudited) In Millions, Except Per Share Amounts
