Attached files
| file | filename |
|---|---|
| EX-99.3 - EX-99.3 - NUVASIVE INC | d431643dex993.htm |
| EX-99.2 - EX-99.2 - NUVASIVE INC | d431643dex992.htm |
| EX-99.1 - EX-99.1 - NUVASIVE INC | d431643dex991.htm |
| 8-K - FORM 8-K - NUVASIVE INC | d431643d8k.htm |
 Q2 2017
Results Supplemental Presentation to Earnings Press Release
July 27, 2017 Exhibit 99.4 |
 Forward-Looking Statements
NuVasive cautions you that statements included in this presentation that are not a
description of historical facts are forward-looking statements that
involve risks, uncertainties, assumptions and other factors which, if they do not materialize or prove correct, could cause NuVasive’s results to differ materially from historical results or those expressed
or implied by such forward-looking statements. In addition, this presentation
contains selected financial results from the second quarter 2017, as well
as projections for 2017 financial guidance and longer-term financial performance goals. The Company’s projections for 2017 financial guidance and longer-term financial performance goals represent current
estimates, including initial estimates of the potential benefits, synergies and cost
savings associated with acquisitions, which are subject to the risk of
being inaccurate because of the preliminary nature of the forecasts, the risk of further adjustment, or unanticipated difficulty in selling products or generating expected profitability. The potential risks and
uncertainties that could cause actual growth and results to differ materially include,
but are not limited to: the risk that NuVasive’s revenue or earnings
projections may turn out to be inaccurate because of the preliminary nature of the forecasts; the risk of further adjustment to financial results or future financial expectations; unanticipated difficulty in
selling products, generating revenue or producing expected profitability; the risk that
acquisitions will not be integrated successfully or that the benefits and
synergies from the acquisition may not be fully realized or may take longer to realize than expected; and those other risks and uncertainties more fully described in the Company’s news releases and
periodic filings with the Securities and Exchange Commission. NuVasive’s public
filings with the Securities and Exchange Commission are available at www.sec.gov. The forward-looking
statements contained herein are based on the current expectations and
assumptions of NuVasive and not on historical facts. NuVasive assumes no obligation to update any forward-looking statement to reflect events or circumstances arising after the date on which it was made.
2 |
 Non-GAAP Financial Measures
Management uses certain non-GAAP financial measures such as non-GAAP earnings
per share, non-GAAP net income, non-GAAP operating expenses and
non-GAAP operating profit margin, which exclude amortization of intangible assets, non-cash purchase accounting adjustments on acquisitions, business transition costs, CEO transition related costs,
certain litigation charges, significant one-time items, non-cash interest
expense (excluding debt issuance cost) and/or losses on repurchase of
convertible notes, and the impact from taxes related to these items, including those taxes that would have occurred in lieu of these items. Management also uses certain non-GAAP measures which are intended to
exclude the impact of foreign exchange currency fluctuations. The measure constant
currency is the use of an exchange rate that eliminates fluctuations when
calculating financial performance numbers. The Company also uses measures
such as free cash flow, which represents cash flow from operations less cash used in the acquisition and disposition of capital. Additionally, the Company uses an adjusted EBITDA measure which represents
earnings before interest, taxes, depreciation and amortization and excludes the impact
of stock-based compensation, non-cash purchase accounting
adjustments on acquisition, business transition costs, CEO transition related costs, certain litigation charges, and other significant one-time items. Management calculates the non-GAAP financial
measures provided in this presentation excluding these costs and uses these
non-GAAP financial measures to enable it to further and more
consistently analyze the period-to-period financial performance of its core business operations. Management believes that providing investors with these non-GAAP measures gives them additional information to
enable them to assess, in the same way management assesses, the Company’s current
and future continuing operations. These non-GAAP measures are not in
accordance with, or an alternative for, GAAP, and may be different from
non-GAAP measures used by other companies. This presentation is
intended to accompany the Company’s second quarter 2017 earnings announcement, which includes financial results reported on a GAAP and non-GAAP basis. For reconciliations of non-GAAP financial measures
to the comparable GAAP financial measure, please refer to the earnings announcement, as
well as supplemental financial information posted on the Investor
Relations section of the Company’s corporate website at www.nuvasive.com. 3 |
 Q2 2017
Performance Reported year-over-year revenue growth of 10.3% to
$260.6 million, or 10.7% on a constant currency basis.
Delivered GAAP operating profit margin of 11.4%; non-GAAP operating profit margin
of 16.3%.
Drove GAAP diluted earnings per share of $0.22; non-GAAP diluted EPS up 15.0% to
$0.46. 4 *Performance growth reflects comparison to prior year period; for additional details regarding full year 2017 guidance, see slide 11
. Re-iterated full year 2017 guidance (inclusive of
acquisitions): •
Revenue growth of ~10.7% to $1.065B, including an approximately $4 million in
year- over-year currency headwinds
• Non-GAAP operating profit margin of ~17.1% • Adjusted EBITDA margin of ~26.7% • Non-GAAP diluted EPS of ~$2.00 |
 5 Second Quarter 2017 Revenue Highlights 3.0% U.S. SPINAL HARDWARE Includes All Implants, Fixation, MAGEC ® & PRECICE ® 18.7% 26.0% * * Constant currency basis U.S. SURGICAL SUPPORT Includes Biologics, IOM Services & Disposables INTERNATIONAL Includes Puerto Rico Key Performance Factors Continued Adoption of Core Product Areas within iGA Platform, including RELINE posterior fixation system Key Performance Factors Driven By Addition of Biotronic Key Performance Factors Strong Growth in All Core Markets, including EMEA, AsiaPac and Latin America in 2Q17 in 2Q17 in 2Q17 |
 Second
Quarter 2017 P&L Performance 6
Non-GAAP Measures
2Q17 Actuals 2Q17 YoY Performance Factors Gross Margin 74.5% 330 bps negatively impacted by lower gross margin profile of the Biotronic business (~280 bps); inventory inefficiencies due to transfer of production to new manufacturing facility Sales, Marketing & Admin. 53.4% 350 bps improvement from prior year impacted by lower SM&A profile of the Biotronic business (~230 bps); greater asset and workforce productivity (~120 bps) Research & Development 4.8% 20 bps improvement from prior year impacted by the Biotronic business (30 bps); offset by investments in internal R&D and strategic assets acquired to drive further innovation (10 bps) Operating Profit Margin 16.3% 40 bps improvement due to greater asset efficiencies related to both freight and workforce productivity EPS $0.46 $0.06; 15.0% YoY growth Adjusted EBITDA Margin 26.2% 90 bps reflecting the continued focus on improving the cash earnings profile of the business |
 * NuVasive financial performance guidance as of July 27, 2017. Global Revenue (In Millions) $762.4 $811.1 $962.1 2014 2015 2016 2017E Non-GAAP Operating Profit Margin ~570 Basis Point Improvement $1,065* 2014 2015 2016 2017E 11.4% 15.4% 16.1% ~17.1%*
Strong History of Growth and Profitability
DISCIPLINED EXECUTION OF STRATEGY DRIVES EXCEPTIONAL RESULTS
7 |
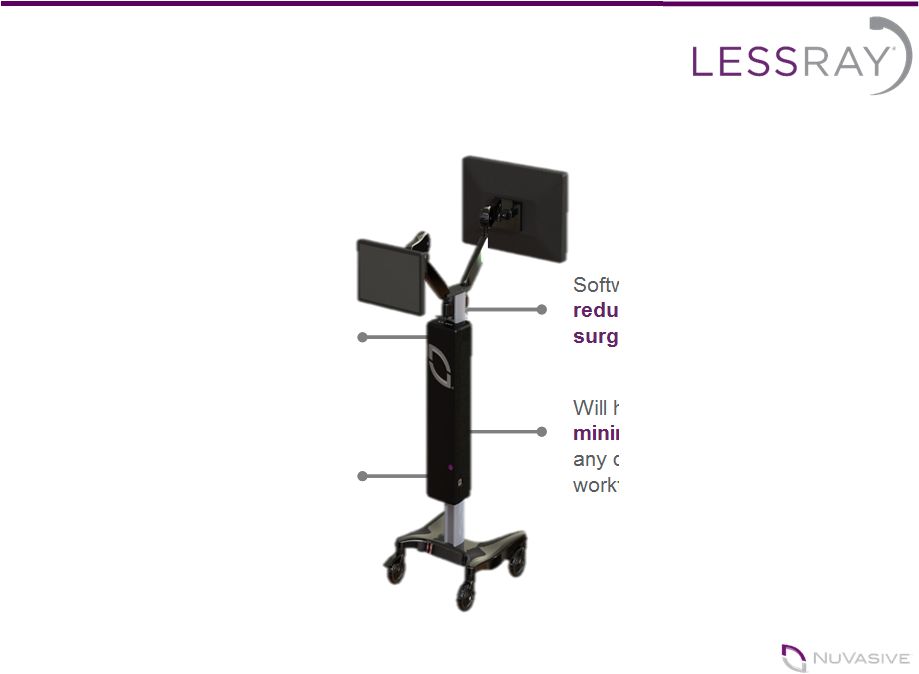 Reducing
Surgical Radiation Software that enables O.R. staff to
reduce their levels of exposure to surgical radiation Will help increase adoption of
minimally invasive surgery without any disruption of surgeon’s familiar workflow 8 Takes low-quality, low-radiation
images and improves them to
look like conventional full dose
images A foundational element of our multi- generational imaging, navigation
and surgical automation platform development strategy |
 Launching LessRay ® Targeted launch in September 2017
Revenue recognition expected to begin in
Q417 Priced with options, inducing
capital purchase and leasing option with service and support agreements Focused selling for use in spine surgery and over time will
address additional markets where
radiation reduction is a clear problem
9 |
 New ‘all digital’, 180,000 sq. ft. facility is on-line and supporting select implants and instruments Produced 160,000+ parts out of facility in Q2, doubling the parts from Q1 Hiring accelerated in Q2; expect to employ ~300 high-tech positions Further align R&D and Product Development teams to optimize and accelerate product launches, including 3D printing capabilities Transition from current Fairborn facility expected by end of 2017 World-class, Manufacturing HQ in West Carrollton Nearly Complete 10 Investment in U.S. Manufacturing WEST CARROLLTON, OHIO |
 * NuVasive financial performance guidance as of July 27, 2017; ^Constant currency 11 FY17 Guidance Performance Drivers Revenues • As reported ~$1.065B, ~11.1% YoY growth^ ~$61M full year of Biotronic contribution; ~$4M currency headwind • U.S. Spinal Hardware • U.S. Surgical Support • International ~7% YoY growth ~10% YoY growth ~26% YoY growth Strong expected lumbar, cervical and NSO product performance Full year of Biotronic contribution ~29% constant currency growth Non-GAAP Gross Margin ~75.6% ~100 bps YoY decrease due to the lower gross margin profile of Biotronic, partially offset by the increasing production at the West Carrollton facility Non-GAAP Sales, Marketing & Admin. ~53.5% ~200 bps YoY improvement primarily driven by sales force efficiencies and SM&A profile of Biotronic business Non-GAAP Research & Development ~5.0% ~$5M YoY increase in investment in innovation Non-GAAP Operating Profit Margin ~17.1% ~100 bps YoY improvement driven by core efficiencies while continuing to integrate acquired entities Non-GAAP Earnings Per Share ~$2.00 ~20% YoY growth Adjusted EBITDA Margin ~26.7% ~150 bps YoY increase Non-GAAP Effective Tax Rate ~35% Continued efforts to drive YoY improvement; ASU adoption 2016-09 Non-GAAP diluted WASO ~52.7M shares Increased from ~52M shares in 2016 due to higher share price impact on remaining 2017 convertible note dilution; ASU adoption 2016-09 Full Year 2017 Financial Performance Guidance* |
 12 New product launches and leading spine innovation roadmap International executing on all cylinders Success in adding new, leading surgeons Entering new markets: - trauma - radiation reduction iGA platform continues to ramp up New sales reps hired last year to begin rolling off non-compete agreements 2H 2017 Performance Drivers STRATEGIC PRIORITIES ALIGNED TO DELIVER CONTINUED GROWTH |
 Growing revenues at multiples of market in high
single-digit range*
Long-term non-GAAP
operating profit margins expanding to ~25% and adjusted
EBITDA margin to
~32%* Drive change in tax rate from high 30%’s to high 20%’s*
Optimizing tax structure to drive EPS growth 2x
the rate of revenue growth* Set to generate significant increases in free
cash flow
#1 #2 #3 #4 #5 Grow Revenues Expand Operating + EBITDA Margins Tax Rate Improvement Free Cash Flow EPS Growth Why Invest in NuVasive RELENTLESS FOCUS ON DRIVING SHAREHOLDER VALUE 13 * NuVasive financial performance guidance as of July 27, 2017. |
 14 |