Attached files
| file | filename |
|---|---|
| EX-10.15 - EX-10.15 - NUVASIVE INC | nuva-ex1015_678.htm |
| EX-32.1 - EX-32.1 - NUVASIVE INC | nuva-ex321_9.htm |
| EX-31.2 - EX-31.2 - NUVASIVE INC | nuva-ex312_6.htm |
| EX-31.1 - EX-31.1 - NUVASIVE INC | nuva-ex311_8.htm |
| EX-23.1 - EX-23.1 - NUVASIVE INC | nuva-ex231_11.htm |
| EX-21.1 - EX-21.1 - NUVASIVE INC | nuva-ex211_10.htm |
| EX-10.17 - EX-10.17 - NUVASIVE INC | nuva-ex1017_679.htm |
| EX-10.16 - EX-10.16 - NUVASIVE INC | nuva-ex1016_677.htm |
UNITED STATES
SECURITIES AND EXCHANGE COMMISSION
Washington, D.C. 20549
Form 10-K
(Mark One)
|
☒ |
ANNUAL REPORT PURSUANT TO SECTION 13 OR 15(d) OF THE SECURITIES EXCHANGE ACT OF 1934 |
For the fiscal year ended December 31, 2016
OR
|
☐ |
TRANSITION REPORT PURSUANT TO SECTION 13 OR 15(d) OF THE SECURITIES EXCHANGE ACT OF 1934 |
For the transition period from to
Commission file number: 000-50744
NUVASIVE, INC.
(Exact name of registrant as specified in its charter)
|
Delaware |
|
33-0768598 |
|
(State or other jurisdiction of incorporation or organization) |
|
(I.R.S. Employer Identification No.) |
|
7475 Lusk Boulevard |
|
92121 |
|
San Diego, California (Address of principal executive offices) |
|
(Zip Code) |
(858) 909-1800
(Registrant’s telephone number, including area code)
Securities registered pursuant to Section 12(b) of the Act
|
|
Title of Class: |
|
|
|
Name of Exchange on which Registered: |
|
|
Common Stock, par value $0.001 per share |
|
The NASDAQ Stock Market LLC (NASDAQ Global Select Market) |
||||
Securities registered pursuant to Section 12(g) of the Act: None
Indicate by check mark if the registrant is a well-known seasoned issuer, as defined in Rule 405 of the Securities Act of 1933, as amended. YES ☑ NO ☐
Indicate by check mark if the registrant is not required to file reports pursuant to Section 13 or Section 15(d) of the Securities Exchange Act of 1934, as amended. YES ☐ NO ☑
Indicate by check mark whether the registrant (1) has filed all reports required to be filed by Section 13 or 15(d) of the Securities Exchange Act of 1934 during the preceding 12 months (or for such shorter period than the registrant was required to file such reports), and (2) has been subject to such filing requirements for the past 90 days. YES ☑ NO ☐
Indicate by check mark whether the registrant has submitted electronically and posted on its corporate website, if any, every Interactive Data File required to be submitted and posted pursuant to Rule 405 of Regulation S-T (Section 232.405 of this chapter) during the preceding 12 months (or for such shorter period that the registrant was required to submit and post such files). YES ☑ NO ☐
Indicate by check mark if disclosure of delinquent filers pursuant to Item 405 of Regulation S-K (Section 229.405 of this chapter) is not contained herein, and will not be contained, to the best of registrant’s knowledge, in definitive proxy or information statements incorporated by reference in Part III of this Form 10-K or any amendment to this Form 10-K. ☐
Indicate by check mark whether the registrant is a large accelerated filer, an accelerated filer, a non-accelerated filer, or a smaller reporting company. See the definitions of “large accelerated filer,” “accelerated filer” and “smaller reporting company” in Rule 12b-2 of the Exchange Act. (Check one):
|
Large accelerated filer |
|
☑ |
|
Accelerated filer |
|
☐ |
|
|
|
|
|
|||
|
Non-accelerated filer |
|
☐ (Do not check if a smaller reporting company) |
|
Smaller reporting company |
|
☐ |
Indicate by check mark whether the registrant is a shell company (as defined in Rule 12b-2 of the Exchange Act). YES ☐ NO ☑
The aggregate market value of the voting and non-voting common equity held by non-affiliates of the registrant was approximately $3.0 billion as of the last business day of the registrant’s most recently completed second fiscal quarter (June 30, 2016), based upon the closing sale price for the registrant’s common stock on that day as reported by the NASDAQ Global Select Market. Shares of common stock held by each officer and director on June 30, 2016 have been excluded in that such persons may be deemed to be affiliates.
As of February 6, 2017, there were 50,599,338 shares of the registrant’s common stock issued and outstanding.
DOCUMENTS INCORPORATED BY REFERENCE
Part III of this Form 10-K incorporates information by reference to portions of the definitive Proxy Statement for the registrant’s 2017 Annual Meeting of Stockholders, which will be filed with the U.S. Securities and Exchange Commission not later than 120 days after December 31, 2016.
Annual Report on Form 10-K for the Fiscal Year ended December 31, 2016
|
PART I |
||||
|
Item 1. |
|
|
2 |
|
|
Item 1A. |
|
|
16 |
|
|
Item 1B. |
|
|
37 |
|
|
Item 2. |
|
|
37 |
|
|
Item 3. |
|
|
37 |
|
|
Item 4. |
|
|
37 |
|
|
PART II |
||||
|
Item 5. |
|
|
37 |
|
|
Item 6. |
|
|
40 |
|
|
Item 7. |
|
Management’s Discussion and Analysis of Financial Condition and Results of Operations |
|
41 |
|
Item 7A. |
|
|
58 |
|
|
Item 8. |
|
|
59 |
|
|
Item 9. |
|
Changes in and Disagreements With Accountants on Accounting and Financial Disclosure |
|
59 |
|
Item 9A. |
|
|
59 |
|
|
Item 9B. |
|
|
62 |
|
|
PART III |
||||
|
Item 10. |
|
|
62 |
|
|
Item 11. |
|
|
62 |
|
|
Item 12. |
|
Security Ownership of Certain Beneficial Owners and Management and Related Stockholder Matters |
|
62 |
|
Item 13. |
|
Certain Relationships and Related Transactions, and Director Independence |
|
62 |
|
Item 14. |
|
|
62 |
|
|
PART IV |
||||
|
Item 15. |
|
|
62 |
|
|
|
68 |
|||
|
|
70 |
|||
1
This Annual Report on Form 10-K (“Annual Report”) contains forward-looking statements that involve risks, uncertainties, assumptions and other factors which, if they do not materialize or prove correct, could cause our results to differ from historical results or those expressed or implied by such forward-looking statements. In some cases, you can identify these forward-looking statements by words like “may”, “will”, “should”, “could”, “expect”, “plan”, “anticipate”, “believes”, “estimates”, “predicts”, “potential”, “intends”, or “continues” (or the negative of those words and other comparable words). Forward-looking statements include, but are not limited to, statements about:
|
|
• |
our intentions, beliefs and expectations regarding our expenses, sales, operations and future financial performance; |
|
|
• |
our operating results; |
|
|
• |
our plans for future products and enhancements of existing products; |
|
|
• |
anticipated growth and trends in our business; |
|
|
• |
the timing of and our ability to maintain and obtain regulatory clearances or approvals; |
|
|
• |
our belief that our cash and cash equivalents and investments will be sufficient to satisfy our anticipated cash requirements; |
|
|
• |
our expectations regarding our revenues, customers and distributors; |
|
|
• |
our beliefs and expectations regarding our market penetration and expansion efforts; |
|
|
• |
our expectations regarding the benefits and integration of recently-acquired businesses and our ability to make future acquisitions and successfully integrate any such future-acquired businesses; |
|
|
• |
our anticipated trends and challenges in the markets in which we operate; and |
|
|
• |
our expectations and beliefs regarding and the impact of investigations, claims and litigation. |
These statements are not guarantees of future performance or events. Our actual results may differ materially from those discussed in this Annual Report and the documents incorporated by reference to this Annual Report. The potential risks and uncertainties that could cause actual results to differ materially include, but are not limited to, those set forth in Part I, Item 1(A) under the heading “Risk Factors”, Part II, Item 7 “Management’s Discussion and Analysis of Financial Condition and Results of Operations” and elsewhere throughout this Annual Report and in any other documents incorporated by reference to this Annual Report. Readers are cautioned not to place undue reliance on such forward-looking statements. We assume no obligation to update any forward-looking statements to reflect new information, future events or circumstances or otherwise, except as required by law.
This Annual Report and the documents incorporated by reference into this Annual Report refer to trademarks, such as Absolute Responsiveness®, Acuity®, Affix®, Armada®, AttraX®, Back Pact®, Bendini®, Better Back Alliance®, Better Insight. Better Decisions. Better Medicine®, Brigade®, CerPass®, CoRoent®, Creative Spine Technology®, DBR®, Embody®, Embrace®, ExtenSure®, Formagraft®, Gradient Plus®, Halo®, iGA™, ILIF®, InStim®, LessRay®, Leverage®, MAGEC®, MAGEC-EOS™, MAS®, MaXcess®, NeoDisc™, Nerve Avoidance Leader™, NuvaMap™, NuvaLine™, NuvaMap™ O.R., NuVasive®, NVM5®, Osteocel®, Precept®, PRECICE®, PROPEL®, Radian®, Reline™, Speed of Innovation®, SpheRx®, The Better Way Back®, Traverse®, Triad®, VuePoint®, X-Core®, and XLIF®, which are protected under applicable intellectual property laws and are our property or the property of our subsidiaries. Solely for convenience, our trademarks and tradenames referred to in this Annual Report may appear without the ® or ™ symbols, but such references are not intended to indicate in any way that we will not assert, to the fullest extent under applicable law, our rights to these trademarks and tradenames.
Item 1.Business
Overview
We are a leading medical device company in the global spine surgery market, focused on developing minimally-disruptive surgical products and procedurally-integrated solutions for spine surgery. Currently, our marketed product portfolio is focused on applications for spine fusion surgery, including biologics used to aid in the spinal fusion process. For the year ended December 31, 2016, we generated global revenues of $962.1 million, including sales in over 40 countries.
2
Our principal product offering includes a minimally-disruptive surgical platform called Maximum Access Surgery, or MAS. The MAS platform combines three categories of solutions that collectively minimize soft tissue disruption during spine fusion surgery, provide maximum visualization and are designed to enable safe and reproducible outcomes for the surgeon and the patient. The platform includes our proprietary software-driven nerve detection and avoidance systems, NVM5, and Intraoperative Monitoring, or IOM, services and support; MaXcess, an integrated split-blade retractor system; and a wide variety of specialized implants and biologics. Many of our products, including the individual components of our MAS platform can also be used in open or traditional spine surgery. Our spine surgery product line offerings, which include products for the thoracolumbar and the cervical spine, are primarily used to enable surgeon access to the spine to perform restorative and fusion procedures in a minimally-disruptive fashion. In May 2015, we launched Integrated Global Alignment, or iGA, in which products and computer assisted technology under our MAS platform help achieve more precise spinal alignment. Our biologics products, which are used to aid in the spinal fusion process or bone healing process, include allograft (donated human tissue) and synthetic offerings.
We believe our MAS platform and its related offerings provide a unique and comprehensive solution for the safe and reproducible minimally-disruptive surgical treatment of spine disorders by enabling surgeons to access the spine in a manner that affords both direct visualization and detection and avoidance of critical nerves. The fundamental difference between our MAS platform, which is sometimes referred to in the industry as “minimally invasive surgery” or “MIS”, is the ability to customize safe and reproducible access to the spine while allowing surgeons to continue to use instruments that are familiar to them and effective during surgery. Accordingly, the MAS platform does not force surgeons to reinvent or learn new approaches that add complexity and undermine safety, ease of use and/or efficacy. We have dedicated and continue to dedicate significant resources toward training spine surgeons around the world; both those who are new to our MAS and other product platforms, as well as ongoing education for MAS-trained surgeons attending advanced courses. An important ongoing objective of ours has been to maintain a leading position in access and nerve avoidance, as well as to pioneer and remain the ongoing leader in minimally invasive spine surgery. Our MAS platform, with the unique advantages provided by our nerve monitoring systems, enables an innovative lateral procedure known as eXtreme Lateral Interbody Fusion, or XLIF, in which surgeons access the spine for a fusion procedure from the side of the patient’s body, rather than from the front or back. It has been demonstrated clinically that XLIF and other procedures facilitated by our MAS platform decrease trauma and blood loss, and lead to faster overall patient recovery times compared to open spine surgery.
We continue to focus significant research and development efforts to expand our MAS and other product platforms and advance the applications of our unique technology into procedurally-integrated surgical solutions that improve clinical and economic outcomes. During 2016, we acquired businesses and technologies to further expand our product and services offerings and drive growth in our business:
|
|
• |
In February 2016, we acquired Ellipse Technologies, Inc., or Ellipse Technologies, which developed and commercialized expandable growing rod implant systems that can be non-invasively lengthened following implantation with precise, incremental adjustments via an external remote controller using magnetic technology called MAGnetic External Control, or MAGEC. Following the acquisition, these product offerings are now sold by our NuVasive Specialized Orthopedics division, or NSO. |
|
|
• |
In July 2016, we acquired BNN Holdings Corp., which through its subsidiaries and affiliates, owns and operates Biotronic NeuroNetwork, a patient-centric healthcare organization that provides intraoperative neurophysiological monitoring services to surgeons and healthcare facilities across the U.S. Following the acquisition, we combined the service offerings of Biotronic NeuroNetwork with our existing IOM business, Impulse Monitoring, Inc., under the newly created division NuVasive Clinical Services, or NCS. |
|
|
• |
In September 2016, we acquired the LessRay software technology suite, which is designed to be integrated into current surgeon workflow and utilizes an algorithm to drive image registration and help surgeons and hospital staff manage radiation exposure using low-dose image quality enhancement. This technology is expected to become an integral component of our IOM service and MAS platform. |
We expect to continue to pursue business and technology acquisitions targets, strategic partnerships and out‐of‐the‐box thinking to identify opportunities to broaden participation along the spine care continuum. Top priorities include opportunities that complement our technology leadership position in spine, targeted geographic expansion, technology that makes procedures even safer, as well as opportunities for imaging and navigation.
3
Our corporate headquarters is located in San Diego, California where we occupy approximately 154,000 square feet, including a six-suite state-of-the-art cadaver operating theatre designed to accommodate the training of spine surgeons. Our location in Amsterdam, the Netherlands, serves as our international headquarters. Our NSO division is based in Aliso Viejo, California, and our NCS division has corporate offices in Columbia, Maryland and Ann Arbor, Michigan. Our primary distribution and warehousing operations are located in our facility in Memphis, Tennessee. Our business is facilitated by rapid delivery of products and surgical instruments for surgeries involving our products. Because of its location and proximity to overnight third-party transporters, our Memphis facility enhances our ability to meet demanding delivery schedules and provide a greater level of customer service. Additionally, we have a manufacturing facility located in West Carrollton, Ohio that produces spinal implants. In furtherance of our initiative to increase the amount of products that we self-manufacture, in 2015 we added an approximately 180,000 square foot manufacturing facility in West Carrollton, Ohio. Throughout 2016, we have worked to build out and equip the new facility in order to expand our internal manufacturing efforts, and initial production is underway.
Our Strategy
We are a leading provider of innovative medical products that provide comprehensive solutions for the surgical treatment of spine disorders. We continue to pursue the following business strategies in order to improve our competitive position:
|
|
• |
Establish our MAS Platform as the Standard of Care. We believe our MAS platform has the potential to become the standard of care for spine surgery as hospitals, providers and spine surgeons continue to recognize its many benefits and adopt our products and procedures. We also believe our MAS platform has the potential to dramatically improve the clinical results of spine surgery. Because of this belief, we dedicate significant resources to researching clinical outcomes data as well as educating spine surgeons, hospitals, and other providers and their patients on the clinical and financial benefits of our products, and we intend to capitalize on the growing demand for minimally-disruptive surgical procedures. |
|
|
• |
Continue to Develop and Introduce Procedurally-Integrated Solutions and New Innovative Products. One of our core competencies is our ability to rapidly develop and commercialize innovative spine surgery products and procedures to fulfill an unmet clinical need. In the past several years, we have introduced a continual flow of new products and product enhancements. We have additional products and procedural offerings currently under development that should expand our presence in fusion surgery. With our comprehensive portfolio of product and service offerings, we believe that we can offer our customers a comprehensive procedural solution for spine surgery that distinguishes us from traditional spine implant companies. We intend to continue to build upon our procedural solution with new and enhanced technology offerings, as well as product expansions. We believe through continued innovation and a focus on providing comprehensive procedural solutions for our customers, we will increase our market share while at the same time improving patient care. As part of this strategy, the Company must continue to protect and defend its intellectual property related to our innovative products. |
|
|
• |
Expand the Reach of Our Exclusive Sales Force. We believe having a sales force dedicated to selling only our products is critical to achieving continued growth across our various product lines, driving greater market penetration and increasing our revenues. In the United States, we have an exclusive sales force consisting of a mix of directly-employed sales representatives and exclusive sales agents that are responsible for particular geographic regions of the country. Outside of the United States, our sales force consists of directly-employed sales representatives, independent sales agents and territory-based distributors. We believe that continuing to expand the range of such teams will allow us to increase our market share and drive adoption of our products and procedures. |
|
|
• |
Provide Tailored Solutions in Response to Surgeon Needs. Responding quickly to the needs of spine surgeons, which we refer to as “Absolute Responsiveness”, is central to our corporate culture, critical to our success, and we believe differentiates us from our competition. We solicit information and feedback from our surgeon customers and clinical advisors regarding the utility of, and potential improvements to, our products. For example, we have an on-site machine shop to allow us to rapidly manufacture product prototypes and a state-of-the-art cadaver operating theatre in San Diego, California to provide clinical training and validate new ideas through prototype testing. We also maintain regional training facilities and centers for excellence in strategic locations around the globe. Absolute Responsiveness goes beyond product development to include active support in all areas, including clinical research and payer relations. We believe that continuing to remain connected and responsive to the collective voices of the surgeon community will allow us to increase our market share and drive adoption of our procedurally-integrated spine solutions. |
4
|
|
• |
Provide Intraoperative Monitoring Capabilities. Monitoring the health of the nervous system during spinal surgery has been a key component of our strategy of product differentiation since early in our development. Over time, surgeon and hospital demand for nerve monitoring has increased along with the advancement of technologies and techniques used in IOM. We believe our proprietary NVM5 platform is a differentiator in the market and is unique in its ability to provide information about the directionality and proximity of nerves. Following our acquisition of Biotronic NeuroNetwork, we have expanded the scale of our IOM services business and are driving increased utilization of our NVM5 platform. We intend to continue to expand the utility of such platforms and broaden our IOM product and services offerings to further our value to our customers and increase adoption and usage. |
Industry Background and Market
The spine is the core of the human skeleton, and provides a crucial balance between structural support and flexibility. It consists of 33 separate bones called vertebrae that are connected together by connective tissue (defined as bone, muscle, or ligament) to form a column and to permit a normal range of motion. The spinal cord, the body’s central nerve system, is enclosed within the spinal column. Vertebrae are paired into what are called motion segments that move by means of three joints: two facet joints and one spine disc. The four major categories of spine disorders are degenerative conditions, deformities, trauma and tumors. The largest market and the focus of our business historically are degenerative conditions of the facet joints and the intervertebral disc space. These two conditions can result in instability and pressure on the nerve roots as they exit the spinal column, causing back or neck pain or radiating pain in the arms or legs.
The prescribed treatment for back or neck pain depends on the severity and duration of the disorder. Initially, physicians will prescribe non-operative, conservative procedures including bed rest, medication, lifestyle modification, exercise, physical therapy, chiropractic care and steroid injections. In many cases, non-operative treatment options are effective; however, some patients eventually require spine fusion surgery. The vast majority of spine fusion surgeries are done using traditional open surgical techniques from either the front or back of the patient. These traditional open surgical approaches generally require a large incision in the patient’s abdomen or back in order to enable the surgeon to access and see the spine and surrounding area. These open procedures are invasive, lengthy and complex, and typically result in significant blood loss, extensive tissue damage and lengthy patient hospitalization and rehabilitation.
We believe the market for procedurally-integrated spine surgery solutions will continue to grow over the long term, and we also believe that our market share will increase, because of the following market dynamics:
|
|
• |
Demand for Surgical Alternatives with Less Tissue Disruption. As has been proven in other surgical markets, we anticipate the broader acceptance of surgical treatments with less tissue disruption and patient trauma will result in increased demand. |
|
|
• |
Favorable Domestic Demographics. The population segment most likely to experience back pain is expected to increase as a result of aging “baby boomers” (people born between 1946 and 1965). We believe this large population segment will increasingly demand a quicker return to activities of daily living following surgery than prior generations. |
|
|
• |
Access to Care in Emerging Markets. Healthcare reforms in many emerging markets are expanding access to treatments to a greater proportion of their populations, which we believe will continue to drive strong increases in demand for healthcare-related product volumes. Increasing economic affluence in key developing regions will further drive demand for healthcare treatments. |
Although we believe that the market for procedurally-integrated spine surgery solutions will continue to grow over the long term, economic, political and regulatory influences are subjecting our industry to significant changes that may slow the growth rate of the spine surgery market.
5
Surgical Alternatives with Less Tissue Disruption
The benefits of minimally invasive surgery procedures in other areas of orthopedics have significantly contributed to the strong and growing demand for surgical alternatives with less tissue disruption of the spine. Surgeons and hospitals seek spine procedures that result in fewer operative and postoperative complications and decreased patient hospitalization periods. At the same time, patients seek procedures that reduce trauma, allow for faster recovery times and result in more favorable clinical outcomes. Despite patient and doctor demands, the rate of adoption of alternative surgical procedures with less tissue disruption has been relatively slow with respect to the spine. Currently, the majority of spine surgery patients are treated with traditional open and invasive techniques.
We believe the principal factor contributing to spine surgeons’ slow adoption of traditional minimally invasive spine alternatives has been inconsistent outcomes driven by the limited or lack of direct access to and visibility of the surgical anatomy, and the associated complex instruments that have been required to perform these procedures. Most traditional minimally invasive spine surgery systems do not allow the surgeon to directly view the spine and the relevant pathology point and, as such, provide only restrictive visualization through a camera system or endoscope, while also requiring the use of complex surgical techniques. In addition, most traditional minimally invasive spine surgery systems use complex or highly customized surgical instruments that require special training and the completion of a large number of trial cases before the surgeon becomes proficient using the system, which is an impediment and/or deterrent to their adoption.
Our Commercial Products
Our MAS platform allows surgeons to perform a wide range of minimally-disruptive spine procedures in all regions of the spine and from various surgical approaches, while overcoming the shortcomings of traditional minimally invasive spine surgical techniques. The MAS platform is designed to treat a wide range of spinal pathologies while accommodating a surgeon’s preferred surgical technique. We believe our approach improves clinical results and should continue to drive an expanded number of minimally-disruptive procedures performed, lead the market movement away from open surgery and make less invasive techniques the standard of care in spine fusion and non-fusion surgery.
Our products facilitate minimally-disruptive applications of the following spine surgery procedures, among others:
|
|
• |
Lumbar and thoracic fusion procedures in which the surgeon approaches the spine through the patient’s back, side or abdomen; |
|
|
• |
Cervical fusion procedures for either the posterior occipito-cervico-thoracic region or the anterior cervical region; and |
|
|
• |
Decompression, which is removal of a portion of bone or disc from over or under the nerve root to relieve pinching of the nerve. |
Our MAS platform combines three product categories: our MaXcess retractors, our specialized implants and fixation products, and our nerve monitoring systems and service offerings that collectively enable surgeons to detect and navigate around nerves while directing customized access to the spine for implant delivery. Biologics are used to complement procedures by assisting in the bone healing process.
6
MaXcess retractors have a split-blade design consisting of three blades that can be positioned to customize the surgical exposure in the shape and size specific to the surgical requirements rather than the more traditional fixed tube or two-blade designs of traditional minimally invasive spine surgical systems. This split-blade design also provides customizable access to the spine, which allows surgeons to perform surgical procedures using instruments that are similar to those used in open procedures but with a smaller incision and less tissue disruption. The ability to use familiar instruments reduces the learning curve for our procedures and facilitates the adoption of our products. Our system’s illumination of the operative corridor aids in providing surgeons with better direct visualization of the patient’s anatomy, without the need for additional technology or other special equipment such as endoscopes. Over the years, several improvements to our MaXcess systems have been made, including incorporating integrated neuromonitoring technology and improving the blade systems, and the MAS approach has broadened from the lumbar to the thoracic region. Our MaXcess products are used in the cervical spine for posterior application and anterior retraction, the lumbar spine for decompressions, transforaminal lumbar interbody fusions, or TLIFs, and posterior lumbar interbody fusions, or PLIFs, the thoracolumbar spine for eXtreme Lateral Interbody Fusion, or XLIFs, and the thoracic region for tumors and trauma, as well as in adult degenerative scoliosis procedures.
Implants and Fixation Products
We have many implants and fixation devices designed to be used with our MAS platform. Our portfolio of implants used for interbody disc height restoration include implants made from allograft, titanium and polyetheretherketone, or PEEK. Our CoRoent family of implants, which are made from PEEK, are available in a variety of shapes and sizes to accommodate specific approach, pathology and anatomical requirements of the patient and the particular fusion procedure. Our implants are designed for insertion into the smallest possible space while maximizing surface area contact for fusion. Our fixation products, including pedicle screws, rods and plates, have been uniquely designed and include a highly differentiated percutaneous minimally invasive solution with advanced guide technology, superior rod insertion options, and multiple reduction capabilities to be delivered through our procedures to provide stabilization of the spine. Our fixation offerings include our Armada, Precept and Reline posterior fixation portfolios.
Nerve Monitoring
Our nerve monitoring systems utilize electromyography, or EMG, as well as proprietary software hunting algorithms and graphical user interfaces to provide surgeons with an enhanced and intuitive nerve avoidance system. Our systems function by monitoring changes in electrical signals across muscle groups, which allows us to detect underlying changes in nerve activity. Through the NVM5 platform, we give surgeons the option to connect their instruments to a computer system that provides discrete, real-time, surgeon directed and surgeon controlled feedback about the directionality and relative proximity of nerves during surgery. Our systems analyze and then translate complex neurophysiologic data into simple, useful information to assist the surgeon’s clinical decision-making process. The health and integrity of the spinal cord and related nerves can also be assessed using motor evoked potentials, or MEPs, and somatosensory evoked potentials, SSEPs. Both of these methods of IOM involve applying stimulation and recording the response that must travel along the motor or sensory paths of the spinal cord. Surgeons can connect certain instruments to our nerve monitoring systems, thus creating an interactive set of instruments that better enable the safe navigation through the body’s nerve anatomy during surgery. The connection is accomplished using a clip that is attached to the instrument, effectively providing the benefits of our nerve monitoring systems through an instrument already familiar to the surgeon. The system’s proprietary software and easy to use graphical user interface allows the surgeon to make critical decisions in real time enabling safer, faster, and more reproducible procedures with the design for improved patient outcomes.
In addition to our MAS platform, our comprehensive procedural solution includes our biologics products, IOM services, and iGA technology.
Biologics
Biologics are used to aid in the spinal fusion process or bone healing process. The global biologics market in spine surgery consists of autograft (autologous human tissue), allograft (donated human tissue), and a varied offering of synthetic products and growth factors. Our allograft biologics product offerings include Osteocel Plus and Pro – a cellular bone matrix designed to mimic the biologic profile of autograft including mesenchymal stem cells and osteoprogenitor cells to aid in spinal fusion. Our synthetic biologics product offerings include Formagraft (collagen-based synthetic bone substitute), AttraX (synthetic bone graft material delivered in putty form), and Propel DBM (highly moldable demineralized bone matrix putty).
7
Intraoperative Monitoring Services
Monitoring the health of the nervous system during spinal surgery has been a key component of our strategy of product differentiation since early in our development. Over time, surgeon and hospital demand for nerve monitoring has increased along with the advancement of technologies and techniques used in IOM. We believe that our proprietary NVM5 platform is a differentiator in the market and is unique in its ability to provide information about the directionality and proximity of nerves. Through our IOM services business, we provide onsite and remote monitoring of the neurological systems of patients undergoing spinal and brain-related surgeries. Our neurophysiologists are present in the operating room during procedures and work in partnership with supervising physicians who remotely oversee and interpret neurophysiological data gathered via broadband transmission over the internet. Through this service, data can be analyzed in real time by healthcare professionals for additional interpretation of intraoperative information and oversight, which we believe further improves the safety and reproducibility of the vast array of our spine procedures.
Integrated Global Alignment
Current and emerging data illustrates a direct correlation between proper spinal alignment and long-term clinical outcomes. Our iGA platform offers a global approach for assessing, preserving, and restoring spinal alignment in an effort to promote surgical effectiveness and efficiencies, lasting patient outcomes, and improved quality of life. Using our NuvaPlanning portfolio of three software solutions, NuvaMap, NuvaLine and NuvaMap O.R., surgeons can preoperatively calculate and evaluate alignment parameters and implant integration by accurately modeling surgery to create a reliable plan with clear results, and then conduct a real-time interoperative assessment in order to correct the anterior and posterior column alignment in line with the surgical plan. Following a procedure, surgeons can use our solutions to confirm the success of the procedure and effect on alignment by reviewing surgical results and easily comparing those results to the surgical plan. In addition to our software solutions, we also offer specific products that are designed to restore alignment, including our Reline posterior fixation portfolio and our Bendini spinal rod bending system.
Following our acquisition of Ellipse Technologies, we now offer products to treat the unmet clinical needs of children who suffer from early onset scoliosis and patients who suffer from limb length discrepancies.
MAGEC-EOS Spinal Bracing and Distraction System
Early onset scoliosis, or EOS, refers to severely deformed curvatures of the spine diagnosed before the age of ten. EOS is a challenging health issue and can lead to more severe progressive deformities. Surgical treatments for early onset scoliosis include the use of surgically adjustable expandable rods to control the spine deformity while still allowing the spine to grow until a child reaches an appropriate size or age for a more permanent solution, such as spinal fusion. Surgeries to adjust spinal rods are highly invasive and associated with significant scarring, long recovery times, high infection rates, post-operative pain and impaired mobility as the child heals from surgery. Surgical adjustments to traditional growing rods are typically made every six to nine months to accommodate the growth of the spine. The MAGEC-EOS system is designed to overcome the limitations of conventional adjustable rod treatments for EOS. By enabling non-invasive adjustments, we believe MAGEC-EOS results in lower rates of complications associated with surgical procedures and repetitive exposure to general anesthesia. Our non-invasive adjustment technology enables physicians to perform more frequent adjustments in an outpatient setting, thereby improving deformity correction and allowing for optimal spinal growth.
PRECICE Limb Lengthening System
Limb length discrepancies, or LLDs, refer to a congenital deformity or injury resulting in one leg being shorter than the other. Large LLDs often require complex treatments including limb lengthening surgery to create equal limb length. The traditional limb lengthening surgical procedure includes the creation of a gap in the bone, or osteotomy, the attachment of wires or pins to the fractured bones, and the passing of the wires or pins through the skin to an external fixator, a scaffold-like frame that surrounds the limb. The external fixator distracts the bone when the patient or a family member manually turns the knobs on the fixator. These adjustments must be performed several times each day such that the bone is lengthened approximately one millimeter per day. Adjustments of the external fixator are very painful and associated with soft tissue disruption, disturbance of the wound healing process of the skin and soft tissue and high rates of infection. In addition, traditional external fixation can result in significant psychosocial comorbidities that reduce quality of life for patients undergoing treatment, including anxiety, social disengagement, sleep disorders, depression and addiction to pain medication. The PRECICE LLD system uses the MAGEC technology to enable non-invasive and painless adjustments using a pre-programmed ERC. As a result, PRECICE LLD enables physicians to customize therapy to the needs of the patient over time without the need for surgical re-intervention and provides improved quality of life and satisfaction for patients in need of surgical limb lengthening.
In addition, we intend to continue development on a wide variety of projects intended to broaden surgical applications for greater procedural integration of our MAS techniques and additional applications of the MAGEC technology. Such applications include tumor, trauma, and deformity, as well as increased fixation options and sagittal alignment products. We also expect to continue expanding our other product and services offerings as we execute on our strategy to offer our customers a procedural solution for spine surgery that distinguishes us from traditional spine implant companies.
8
Our research and development efforts are primarily focused on developing further enhancements to our existing products and improving and further integrating our procedural solutions to address unmet clinical needs while improving patient and economic outcomes. Our research and development group has extensive experience in developing products to treat spine pathologies. This group continues to work closely with our clinical advisors and spine surgeon customers to design products and procedural solutions designed to improve patient outcomes, simplify techniques, and reduce patient trauma including subsequent hospitalization and rehabilitation times; and as a result reduce overall costs to patients and the healthcare system.
International
We believe a spine market shift towards minimally invasive surgery and increases in international access to healthcare will provide us with an opportunity for accelerated growth outside the United States. Because our procedurally-integrated solutions and technologies treat similar pathologies around the world, we are focused on expanding our operations in select developed and emerging international markets. We are investing to tailor our products and technologies to meet varying international patient, surgeon and market requirements. We are also investing in expanding our global infrastructure to adapt to alternative distribution channels, to support differing language and customer service requirements, and to provide training and surgeon education in our MAS surgical techniques, our surgical instruments and our implants to our international customers. During 2016, we expanded our geographical footprint as part of our focus on increasing our commercial reach outside the United States. We have continued to expand our available product offerings internationally with our acquisition of Ellipse Technologies. Our international revenue, which excludes Puerto Rico, was $130.4 million or 14% of total revenue for the year ended December 31, 2016.
Sales and Marketing
In the United States, we currently sell our procedurally-integrated solutions through a combination of exclusive independent sales agents and directly-employed sales force. Each member of our United States sales force is responsible for a defined territory, with our independent sales agents acting as our sole representative in their respective territories. The determination of whether to engage a directly-employed sales representative or an independent sales agent is made on a territory–by-territory basis, with a focus on aligning the sales team with the best skills and experience with local surgeons’ needs. Our international sales force is comprised of directly-employed sales representatives, as well as exclusive distributors and independent sales agents. Directly-employed sales representatives make up the majority of our overall salesforce.
Surgeon Training and Education
We devote significant resources to training and educating surgeons regarding the safety and reproducibility of our MAS surgical techniques and our complementary instruments and implants. We maintain state-of-the-art cadaver operating rooms and training facilities to help educate surgeons regarding our products at our corporate headquarters in San Diego, California. We continue to train surgeons on the XLIF technique and our other MAS platform products including: our proprietary nerve monitoring systems, MaXcess, biologics, and specialized implants.
Manufacturing and Supply
We rely on third parties for the manufacture of a majority of our products, their components and servicing, and we maintain alternative manufacturing sources for a majority of our finished goods products. We also manufacture certain implants internally at our facility in Dayton, Ohio. We have identified or are in the process of identifying and qualifying additional suppliers, on a per product basis, for our highest volume products to best enable us to be able to maintain consistent supply to our customers. Our outsourcing strategy is targeted at companies that meet FDA, International Organization for Standardization (ISO), and quality standards supported by internal policies and procedures. Supplier performance is maintained and managed through a supplier qualification, performance management and corrective action program intended to ensure that all of our product requirements are met or exceeded. We believe that these types of manufacturing relationships historically have balanced our capital investment, helped control costs and provided manufacturing capacity necessary to compete with larger volume manufacturers of spine surgery products. As our business has continued to scale, we have determined to increase the amount of products that we self-manufacture. In 2015, we added an approximately 180,000 square foot manufacturing facility in West Carrollton, Ohio, in order to expand our internal manufacturing efforts. Throughout 2016, we have worked to build out and equip the new facility and initial production is underway. As we shift to the manufacturing of more of our products in-house, we will look to maintain adequate raw materials suppliers, sourcing alternatives and adequate supply to support our operations.
Our products are inspected, packaged and labeled, as needed, at either our San Diego headquarters or our Memphis distribution facility. Under our existing contracts with third-party manufacturers, we reserve the exclusive right to inspect and assure conformance of each product and product component to our specifications.
9
We currently rely on several tissue banks as our suppliers of allograft tissue implants, including two for our Osteocel Plus and Osteocel Pro product lines. Like our relationships with our device manufacturing suppliers, we subject our tissue processing suppliers to the same quality criteria in terms of selection, qualification, and verification of processed tissue quality upon receipt of goods, as well as hold them accountable to compliance with FDA regulations, state requirements, and as-voluntary industry standards (such as those put forward by the American Association of Tissue Banks).
We rely on one, exclusive supplier for PEEK, which comprises many of our CoRoent partial vertebral body replacement and interbody product lines. We also rely on one, exclusive supplier for our NVM5 neuromonitoring system, and rely on one, exclusive supplier for our neuromonitoring equipment that is used outside of the NV platform.
We, and our third-party manufacturers, are subject to the quality system regulations of the U.S. Food and Drug Administration (FDA), state regulations (such as the regulations promulgated by the California Department of Health Services), and regulations promulgated by foreign regulatory bodies (such as in the European Union). For tissue products, we are FDA registered and licensed in the States of California, New York, Florida, Maryland and Oregon. For our device implants and instruments, we are FDA registered, California licensed, CE marked and ISO certified. CE is an abbreviation for “Conformité Européenne” or European Conformity, and is the registration marking designating that a device can be commercially distributed throughout Europe. Our facilities and the facilities of our third-party manufacturers are subject to periodic announced and unannounced inspections by regulatory authorities, and may undergo compliance inspections conducted by the FDA, state, and/or international regulatory agencies.
Surgical Instrument and Implant Sets
For many of our customers, we provide surgical instrumentation sets, including both implants and instruments, as well as our nerve monitoring systems in a manner tailored to fulfill our customer’s obligations to meet surgery schedules. We do not generally receive separate economic value specific to the surgical instrument sets from the surgeons or hospitals that utilize them. In many cases, once the surgery is finished, the surgical instrument sets are returned to us, and we prepare them for shipment to meet future surgeries.
We complement this implant and instrument shipment model with field-based instrument assets. This hybrid strategy is designed to improve customer service, minimize backlogs, increase asset turns, optimize freight costs, and maximize cash flow. Our pool of surgical equipment that we loan to or place with hospitals continues to increase as we increase our product offering, expand our distribution channels and increase the market penetration of our products. These surgical instrumentation and implant sets are important to the growth of our business, and we anticipate additional investments in such assets going forward.
In certain cases we will sell either surgical instruments, implant sets or both to our customers. While this does not constitute a material component of our business, as customer penetration and volume increases, these sales of sets allows our customers to increase the amount of surgical volume performed locally.
Intellectual Property
We rely on a combination of patent, trademark, copyright, trade secret and other intellectual property laws, nondisclosure agreements and other measures to protect our intellectual property rights. We believe that in order to have a competitive advantage, we must develop and maintain the proprietary aspects of our technologies. We require our employees (who we refer to as “shareowners”), consultants and advisors to execute confidentiality agreements in connection with their employment, consulting or advisory relationships with us. We also require our shareowners, consultants and advisors who we expect to work on our products to agree to disclose and assign to us all inventions conceived using our property or which relate to our business. Despite any measures taken to protect our intellectual property, unauthorized parties may attempt to copy aspects of our products or to obtain and use information that we regard as proprietary.
Patents
As of December 31, 2016, we had over 820 issued and pending patents, including over 360 U.S. issued patents. Our issued and pending patents cover, among other things:
|
|
• |
MAS surgical access instrumentation and methodology, including our XLIF procedure and aspects thereof; |
|
|
• |
Neurophysiology enabled instrumentation and methodology, including pedicle screw test systems, software hunting algorithms, navigated guidance, rod bending and surgical access systems; |
|
|
• |
Implants and related instrumentation and targeting systems; |
|
|
• |
Biologics, including Osteocel Plus and Osteocel Pro, Formagraft and AttraX; |
|
|
• |
Motion preservation products; |
|
|
• |
Magnetic technology for non-invasive distraction of an implanted device, including the MAGEC technology platform; and |
10
|
|
• |
Digital imaging processing technology that generates high resolution images of the surgical field from low resolution scans, including the LessRay technology platform. |
Our issued patents begin to expire in 2018. We do not believe that the expiration of any single patent is likely to significantly affect our intellectual property position.
The medical device industry is characterized by the existence of a large number of patents and frequent litigation based on allegations of patent infringement. Patent litigation can involve complex factual and legal questions and its outcome is uncertain. Our success will depend in part on our not infringing patents issued to others, including our competitors and potential competitors. As the number of entrants into our market increases, the possibility of future patent infringement claims against us grows. While we make extensive efforts to ensure that our products do not infringe other parties’ patents and proprietary rights, our products and methods may be covered by patents held by our competitors. There are numerous risks associated with our intellectual property. For a complete discussion of these risks, please see the “Risk Factors” section of this Annual Report.
Trademarks
As of December 31, 2016, we had over 220 trademark registrations in both domestic and foreign regions.
Competition
Competition within the industry is primarily based on technology, innovation, quality, reputation and customer service. We believe that our significant competitors are Medtronic Sofamor Danek, or Medtronic, DePuy/Synthes, a Johnson & Johnson company, Stryker Spine, Globus Medical, and Zimmer Biomet Spine, which together represent a significant portion of the spine market. We also face competition from a significant number of smaller companies with more limited product offerings and geographic reach than our larger competitors. These companies, who represent intense competition in specific markets, include Orthofix International N.V., Alphatec Spine, K2M and others. With respect to our nerve monitoring systems, we compete with Medtronic, and Vyaire Medical (formerly VIASYS Healthcare, a division of Becton, Dickinson and Company). Our IOM services business competes with SpecialtyCare and numerous smaller and regional service providers. We also face competition from physician owned distributorships, or PODs, which are medical device distributors that are owned, directly or indirectly, by physicians. However, these PODs have recently come under scrutiny by the Office of Inspector General, or OIG as the associated physicians derive a portion of their revenue from selling or arranging for the sale of medical devices for use in procedures they perform on their own patients. The prevalence of these PODs may impact our ability to grow.
The United States Government Regulation
Our products are medical devices and human tissue products subject to extensive regulation by the FDA and other regulatory bodies both inside and outside of the United States. Each of these agencies requires us - to varying degrees - to comply with laws and regulations governing the development, testing, manufacturing, storage, labeling, marketing and distribution of our products.
FDA’s Premarket Clearance and Approval Requirements
Unless an exemption applies, each medical device that we market and sell in the United States must first receive either premarket clearance (by submitting a 510(k) notification) or premarket approval (by filing a premarket approval application, or PMA) from the FDA. In addition, certain modifications to marketed devices may require 510(k) clearance or approval of a PMA supplement. The FDA’s 510(k) clearance process usually takes between three and six months from the date the application is completed, but may last longer. The process of obtaining PMA approval is much more costly, lengthy and uncertain than the 510(k) clearance process and generally takes between one and three years, or even longer, from the time the application is submitted to the FDA until any approval is obtained. In addition, a clinical trial is almost always required to support a PMA application and may be required for a 510(k) premarket notification. There are numerous risks associated with conducting clinical trials, including high costs and uncertain outcomes. For a complete discussion of these risks, please see the “Risk Factors” section of this Annual Report.
Human Cell, Tissue, and Cellular and Tissue Based Products
Our allograft products, including our Triad, H2 and ExtenSure, and our Osteocel Plus and Osteocel Pro products, are regulated by the FDA as Human Cell, Tissue, and Cellular and Tissue Based Products. FDA regulations do not currently require these minimally manipulated human tissue-based products to be subjected to a premarket approval or pre-market notification process before they are marketed if they are deemed to meet the requirements of a “361” product under the Public Health Safety Act.
We are, however, required to register with the FDA as a provider of such products and to list these products with the FDA and comply with its Current Good Tissue Practices for Human Cell, Tissue, and Cellular- and Tissue-Based Product Establishments. The FDA periodically inspects tissue facilities to determine compliance with these requirements. Entities that provide us with allograft bone tissue are responsible for performing donor recovery, donor screening, donor testing, processing, and packaging and our compliance with those aspects of the Current Good Tissue Practices regulations that regulate those functions are dependent upon the actions of these independent entities.
11
The procurement and transplantation of allograft bone tissue is subject to United States federal law pursuant to the National Organ Transplant Act (NOTA), a criminal statute that prohibits the purchase and sale of human organs used in human transplantation - including bone and related tissue - for “valuable consideration” (as defined in the NOTA). The NOTA permits reasonable payments associated with the removal, transportation, processing, preservation, quality control, implantation and storage of human bone tissue. With the exception of removal and implantation, we provide services, directly or indirectly, in all of these areas. We make payments to vendors in consideration for the services they provide in connection with the recovery and screening of donors. Failure to comply with the requirements of NOTA could result in enforcement action against us.
The procurement of human tissue is also subject to state anatomical gift acts and some states have statutes similar to NOTA. In addition, some states require that tissue processors be licensed by that state. Failure to comply with state laws could also result in enforcement action against us.
Continuing FDA Regulation
After a device is placed on the market, numerous regulatory requirements continue to apply. These regulatory requirements include, but are not limited to, the following:
|
|
• |
product listing and establishment registration; |
|
|
• |
adherence to the Quality System Regulation which requires stringent design, testing, control, documentation and other quality assurance procedures; |
|
|
• |
labeling requirements and FDA prohibitions against the promotion of off-label uses or indications; |
|
|
• |
adverse event reporting; |
|
|
• |
post-approval restrictions or conditions, including post-approval clinical trials or other required testing; |
|
|
• |
post-market surveillance requirements; |
|
|
• |
the FDA’s recall authority, whereby it can ask for, or require, the recall of products from the market; and |
|
|
• |
requirements relating to voluntary corrections or removals. |
Failure to comply with applicable regulatory requirements can result in fines and other enforcement actions by the FDA, which could adversely impact our business.
We are also subject to announced and unannounced inspections by the FDA, the California Food and Drug Branch, American Association of Tissue Banking, as well as other regulatory agencies overseeing the implementation and adherence of applicable state and federal device and tissue licensing regulations. These inspections may include our manufacturing and subcontractors’ facilities.
Pursuant to FDA regulations, we can only market our products for cleared or approved uses. Although surgeons are permitted to use medical devices for indications other than those cleared or approved by the FDA based on their medical judgment, we are prohibited from promoting products for such “off-label” uses.
Healthcare Regulation and Commercial Compliance
The healthcare industry is highly regulated and changes in laws and regulations can be significant. The federal government and all states in which we currently operate regulate various aspects of our business. Changes in the law or new interpretation of existing laws can have a material effect on our permissible activities, the relative costs associated with doing business and the amount of reimbursement by government and other third-party payers.
Anti-kickback Statute
We are subject to the federal anti-kickback statute which, among other things, prohibits the knowing and willful solicitation, offer, payment or receipt of any remuneration, direct or indirect, in cash or in kind, in return for, or to induce the referral of patients for, items or services covered by Medicare, Medicaid and certain other governmental health programs. Under the Patient Protection and Affordable Care Act, as amended by the Health Care and Education Reconciliation Act of 2010 (PPACA), neither knowledge of the anti-kickback statute nor the specific intent to violate the law is a requirement for being found in violation of such laws. Violation of the anti-kickback statute may result in civil or criminal penalties and exclusion from Medicare, Medicaid and other federal healthcare programs, and - according to PPACA - now provides a basis for liability under the False Claims Act. Many states have enacted similar statutes, which are not limited to items and services paid for under Medicare or a federally funded healthcare program. We believe that our operations materially comply with the anti-kickback statutes; however, because these provisions are interpreted broadly by regulatory authorities, we cannot be assured that law enforcement officials or others will not challenge our operations under these statutes.
12
The Federal False Claims Act (in particular -its “qui tam” or “whistleblower” provisions) allow(s) private individuals to bring actions in the name of the United States government alleging that a defendant has made false claims for payment from federal funds. In addition, various states are considering enacting or have enacted laws modeled after the Federal False Claims Act, penalizing false claims against state funds. In 2013, we received a federal administrative subpoena from the OIG in connection with an investigation into possible false or otherwise improper claims submitted to Medicare and Medicaid. The subpoena sought discovery of documents for the period January 2007 through April 2013. In July 2015, we entered into a definitive settlement agreement with the U.S. Department of Justice, or DOJ, to settle this matter. Under the terms of the agreement, we agreed to pay $13.5 million plus fees and accrued interest of approximately $0.3 million to resolve this matter. The settlement was not an admission of liability or wrongdoing by us, and we were not required to enter into a corporate integrity agreement with the OIG as part of the settlement. On August 31, 2015, we received a civil investigative demand, or CID, issued by the DOJ pursuant to the federal False Claims Act. The CID requires the delivery of a wide range of documents and information related to an investigation by the DOJ concerning allegations that we assisted a physician group customer in submitting improper claims for reimbursement and made improper payments to the physician group in violation of the Anti-Kickback Statute. We are cooperating with the DOJ in regards to this matter. Any adverse findings related to this investigation could result in material financial penalties against the Company.
Health Insurance Portability and Accountability Act
Under the Health Insurance Portability and Accountability Act of 1996, as was amended in 2005 and in 2009, or HIPAA, a Covered Entity, as further defined under HIPAA, is required to adhere to certain requirements regarding the use, disclosure and security of protected health information, or PHI. In the past, HIPAA has generally affected us indirectly, as NuVasive is generally neither a Covered Entity nor a Business Associate, as further defined under HIPAA, to Covered Entities, except that our provision of IOM services through various subsidiaries may create a Business Associate relationship; additionally, we treat our Puerto Rico subsidiary as a Covered Entity. Regardless of Covered Entity status under HIPAA, in those cases where patient data is received, NuVasive is committed to maintaining the security and privacy of PHI. The potential for enforcement action against us is now greater, as the U.S. Department of Health and Human Services (HHS) can take action directly against Business Associates. Thus, while we believe we are and will be in compliance with all required HIPAA standards, there is no guarantee that the government will agree. Enforcement actions can be costly and interrupt regular operations of our business.
Foreign Corrupt Practices Act
The United States and foreign government regulators have increased regulation, enforcement, inspections and governmental investigations of the medical device industry, including increased United States government oversight and enforcement of the Foreign Corrupt Practices Act. If the United States or another foreign governmental authority were to conclude that we are not in compliance with applicable laws or regulations, such governmental authority can impose fines, delay or suspend regulatory clearances, institute proceedings to detain or seize our products, issue a recall, impose operating restrictions, enjoin future violations and assess civil penalties against us or our officers or employees, and can recommend criminal prosecution to the Department of Justice. Moreover, governmental authorities can ban or request the recall, repair, replacement or refund of the cost of any device or product we manufacture or distribute. We are also potentially subject to the UK Bribery Act, which would also subject us to the imposition of civil and criminal fines. Any of the foregoing actions could result in decreased sales as a result of negative publicity and product liability claims, and could have a material adverse effect on our financial condition, results of operations and prospects.
Physician Payments Sunshine Act of 2009 (Sunshine Act)
The Sunshine Act was enacted into law in 2010 and requires public disclosure to the United States government of payments to physicians and teaching hospitals, including in-kind transfers of value such as free gifts or meals. The Act also provides penalties for non-compliance. The Sunshine Act requires that we file an annual report on March 31st of a calendar year for the transfers of value incurred for the prior calendar year. This law, along with individual state reporting requirements, such as in Massachusetts and Vermont, increases the possibility that a healthcare company may run afoul of one or more of the requirements.
Compliance Program
A compliance program is a set of internal controls established by a company to prevent and/or detect any non-compliant activities and to address properly those issues that may be discovered. The United States government has recommended that healthcare companies, among others, develop and maintain an effective compliance program to reduce the likelihood of any such non-compliance by the company, its employees, agents and contractors. In addition, some states, such as Massachusetts and California, now require certain healthcare companies to have a formal compliance program in place in order to do business within the state. For years, we have maintained a compliance program structured to meet the requirements of the federal sentencing guidelines for an effective compliance program and the model compliance program guidance promulgated by HHS over the years. Our program includes, but is not limited to, a Code of Ethical Business Conduct, designation of a compliance officer, oversight by a designated committee of our Board of Directors, policies and procedures, a confidential disclosure method (a hotline), and conducting periodic audits to ensure compliance.
13
Sales of medical devices outside the United States are subject to foreign government regulations, which vary substantially from country to country. The time required to obtain approval by a foreign country may be longer or shorter than that required for FDA approval, and the requirements may differ.
The European Union has adopted numerous directives and standards regulating the design, manufacture, clinical trials, labeling, and adverse event reporting for medical devices. Additionally, certain countries (such as Switzerland), have voluntarily adopted laws and regulations that mirror those of the European Union with respect to medical devices. Devices that comply with the requirements of a relevant directive will be entitled to bear “CE” conformity marking, and, accordingly, can be commercially distributed throughout Europe. The method of assessing conformity varies depending on the class of the product, but normally involves a combination of self-assessment by the manufacturer and a third-party assessment by a “Notified Body”. This third-party assessment consists of an audit of the manufacturer’s quality system and technical review of the manufacturer’s product. We have now successfully passed several Notified Body audits since our original certification in 2001, granting us ISO certification and allowing the CE conformity marking to be applied to certain of our devices under the European Union Medical Device Directive.
The Japanese government in recent years made revisions to the Pharmaceutical Affairs Law (now called PMD Act) that made significant changes to the preapproval regulatory systems. These changes have - in part - stipulated that, in addition to obtaining a manufacturing or import approval from the Ministry of Health, Labor and Welfare, certain low-risk medical devices can now be evaluated by third-party organizations. Based on the risk-based classification, manufacturers are provided three procedures for satisfying the PMD Act requirements prior to placing products on the market: Pre-market Submission, or Todokede; Pre-market Certification, or Ninsho; and Pre-market Approval, or Shonin. NuVasive markets devices in Japan that are assessed by both government entities and third-party organizations using all three procedures in place for manufacturers. The level of review and time line for medical device approval will depend on the risk-based classification and subsequent regulatory procedure that the medical device is aligned based on assessment against the current PMD Law. Manufacturers must also obtain a manufacturing or import license from the prefectural government prior to importing medical devices. We also pursue authorizations required by the prefectural government as required.
Device and tissue premarket approval and/or registration and/or facility licensing requirements also exist in other markets where international NuVasive facilities are established and/or where we may conduct business, including, but not limited to, Southeast Asia, Australia, and Latin America. Such requirements vary by country and NuVasive has established procedures to drive its compliance with these requirements.
Third-Party Reimbursement
Broadly speaking, payer pushback on spine surgery in the United States has increased in the recent past, and we believe this has had an overall dampening effect on spine procedure volumes and prices.
We expect that sales volumes and prices of our products and services will continue to be largely dependent on the availability of reimbursement from third-party payers, such as governmental programs, for example, Medicare and Medicaid, private insurance plans, accountable care organizations and managed care programs. Reimbursement is contingent on established coding for a given procedure, coverage of the codes by the third-party payers, and adequate payment for the resources used.
Physician coding for procedures is established by the American Medical Association, or AMA. For coding related to spine surgery, the North American Spine Society, or NASS, is the primary liaison to the AMA. In July of 2006, NASS established the proper physician coding for the XLIF procedure by declaring it to be encompassed in existing codes that describe an anterolateral approach to the spine. This position was confirmed in a formal statement by NASS in January 2010. Hospital coding is established by CMS. XLIF is included in the nomenclature for hospital codes as an additional descriptor under long standing codes. All physician and hospital coding is subject to change which could impact reimbursement and physician practice behavior.
Independent of the coding status, third-party payers may deny coverage based on their own criteria, including if they feel that a device or procedure is not well established clinically, is not the most cost-effective treatment available, or is used for an unapproved indication. At various times in the past, certain insurance providers have adopted policies of not providing reimbursement for the XLIF procedure. We have worked with our surgeon customers and NASS who, in turn, have worked with these insurance providers to supply the information, explanation and clinical data they require to categorize the XLIF procedure as a procedure entitled to reimbursement under their policies. At present, the majority of insurance companies provide reimbursement for XLIF procedures.
14
However, certain carriers, large and small, may have policies significantly limiting coverage of XLIF, Interlaminar Lumbar Interbody Fusion, or ILIF, Osteocel Plus and Osteocel Pro, cervical interbody implants, and/or other procedures, products or services that we offer. We will continue to provide resources to patients, surgeons, hospitals, and insurers in order to ensure optimum patient care and clarity regarding reimbursement and work to remove any and all non-coverage policies. National and regional coverage policy decisions are subject to unforeseeable change and have the potential to impact physician behavior and reimbursement for physician services. We cannot offer definitive time frames or final outcomes regarding reversal of the coverage-limiting policies, as the process is dictated by the third-party insurance providers. For a discussion of these risks, please see the “Risk Factors” section of this Annual Report.
Payment amounts are established by government and private payer programs and are subject to fluctuations which could impact physician practice behavior. Third-party payers are increasingly challenging the prices charged for a wide range of medical products and services, including those in spine and intraoperative monitoring where we participate.
In international markets, reimbursement and healthcare payment systems vary significantly by country and many countries have instituted price ceilings on specific product lines. There can be no assurance that our products will be accepted by third-party payers, that reimbursement will be available, and/or that the third-party payers’ reimbursement policies (if available) will not adversely affect our ability to sell our products profitably.
Particularly in the United States where major healthcare reform provisions are scheduled, third-party payers must demonstrate they can improve quality and reduce costs; we accordingly see an increase in pre-approval/prior authorizations and non-coverage policies citing higher levels of evidence required for medical therapies and technologies. In addition, insured individuals are facing increased premiums and higher out–of-pocket costs for medical coverage which can lead a patient to delay medical treatment. An increasing number of insured individuals receive their medical care through managed care programs, which monitor and often require pre-approval of the services that a member will receive. The percentage of individuals covered by managed care programs is expected to grow in the United States over the next decade.
We believe that the overall escalating cost of medical products and services has led to, and will continue to lead to, increased pressures on the healthcare industry to reduce the costs of products and services. There can be no assurance that third-party reimbursement and coverage will be available or adequate, or that future legislation, regulation, or reimbursement policies of third-party payers will not adversely affect the demand for our products and services or our ability to sell these products and services on a profitable basis. The unavailability or inadequacy of third-party payer coverage or reimbursement could have a material adverse effect on our business, operating results and financial condition. For a discussion of these risks, please see the “Risk Factors” section of this Annual Report.
Shareowners (our employees)
We refer to our employees as “shareowners”. As of December 31, 2016, we had a direct and indirect workforce of over 2,200, including approximately 1,900 shareowners. In addition to our shareowners, we partner with exclusive independent sales agencies and independent distributors who sell our products in the United States and internationally. As of December 31, 2016, there are approximately 280 individuals associated with such sales agencies and distributors. None of our shareowners or sales agents are represented by a labor union, and we believe our shareowner and agency relations are good.
Corporate Information
Our business was incorporated in Delaware in July 1997. Our principal executive offices are located at 7475 Lusk Boulevard, San Diego, California 92121, and our telephone number is (858) 909-1800. Our website is located at www.nuvasive.com.
We file our annual reports on Form 10-K, quarterly reports on Form 10-Q and current reports on Form 8-K, and any amendments to those reports, electronically with the Securities and Exchange Commission (the Commission). We make these reports available free of charge on our website under the investor relations page as soon as reasonably practicable after we electronically file such material with, or furnish it to, the Commission. All such reports were made available in this fashion during 2016.
The public can also obtain any documents that we file with the Commission at http://www.sec.gov. The public may read and copy any materials that we file with the Commission at the Commission’s Public Reference Room at 100 F Street, N.E., Room 1580, Washington, D.C. 20549. The public may obtain information on the operation of the Public Reference Room by calling the Commission at 1-800-SEC-0330.
This report may refer to brand names, trademarks, service marks or trade names of other companies and organizations, and these brand names, trademarks, service marks and trade names are the property of their respective holders.
15
An investment in our common stock involves a high degree of risk. Risk factors that could cause actual results to differ from our expectations and that could negatively impact our financial condition and results of operations are set forth below and elsewhere in this report. If any of these risks actually occur, our business, financial condition, results of operations and future growth prospects could be materially and adversely affected. Under these circumstances, the trading price of our common stock could decline, and you may lose all or part of your investment. Further, additional risks not currently known to us or that we currently believe are immaterial also may impair our business, operations, liquidity and stock price materially and adversely. You should consider carefully the risks and uncertainties described below and elsewhere in this report before you decide to invest in our common stock.
Risks Related to Our Business and Industry
To be commercially successful, we must effectively demonstrate to spine surgeons the value proposition of our products and procedural solutions compared to those of our competitors.
We focus on marketing our products and procedural solutions to spine surgeons, because of the role that they play in determining the course of patient treatment. We believe spine surgeons will not widely adopt our products and procedural solutions unless we are able to effectively educate and train them as to the distinctive characteristics, perceived benefits, safety and cost-effectiveness of our offerings as compared to those of our competitors. Surgeons may be hesitant to use our products and procedural solutions for the following reasons, among others:
|
|
• |
lack of surgeon experience with minimally-disruptive surgical products and procedures; |
|
|
• |
lack or perceived lack of evidence supporting additional patient benefits; |
|
|
• |
perceived liability risks generally associated with the use of new products and procedures; |
|
|
• |
existing relationships with competitors and distributors; |
|
|
• |
limited or lack of availability of coverage and reimbursement within healthcare payment systems; |
|
|
• |
increased competition in lateral procedural offerings; |
|
|
• |
lack or perceived lack of differentiation among lateral procedures; |
|
|
• |
costs associated with the purchase of new products and equipment; and |
|
|
• |
the time commitment that may be required for training. |
If we are not able to effectively demonstrate to spine surgeons the value proposition of our products and procedural solutions, or if spine surgeons adopt competing products into their practice, our sales could significantly decrease or fail to increase, which could adversely impact our profitability and cash flow. In addition, we believe recommendations and support of our offerings by influential spine surgeons and other key opinion leaders are essential for market acceptance and adoption. If we are not successful in obtaining such support, surgeons may not use our products and procedural solutions, and we may not achieve expected sales or profitability.
Our future success depends on our strategy of obsoleting our products and our ability to timely acquire, develop and introduce new products or product enhancements that will be accepted by the market.
An important part of our business strategy is to stay ahead of our competitors by obsoleting our current offerings with new and enhanced products and technologies. As such, our success will depend in part on our ability to acquire, develop and introduce new products and enhancements to our existing products to keep pace with changes in technology and market demand, as well as physician, hospital and healthcare provider practices. The success of any new product offering or enhancement to an existing product will depend on numerous factors, including our ability to:
|
|
• |
properly identify and anticipate surgeon and patient needs; |
|
|
• |
develop and introduce new products or product enhancements in a timely and cost-effective manner; |
|
|
• |
adequately protect our intellectual property and avoid infringing upon the intellectual property rights of third parties; |
|
|
• |
demonstrate the safety and efficacy of new products through the conduct of clinical investigations or the collection of existing relevant clinical data; and |
|
|
• |
obtain the necessary regulatory clearances or approvals for new products or product enhancements. |
16
In addition, our research and development efforts may require a substantial investment of time and resources before we are adequately able to determine the commercial viability of a new product, technology, or other innovation. Even if we are able to develop enhancements or new generation products successfully, these enhancements or new generation products may not generate sufficient demand or produce sales in excess of the costs of development, which would cause our results of operations to suffer. It is also important that we carefully manage our introduction of new and enhanced products. If potential customers delay purchases until new or enhanced products are available, it could negatively impact our sales. In addition, to the extent we have excess or obsolete inventory as we transition to new products, it would result in margin reducing write-offs for obsolete inventory, and our results of operations may suffer.
We operate in a highly competitive market segment that is subject to rapid change, and if we are unable to compete successfully, our sales and operating results may suffer.
The market for spine surgery products and procedures is intensely competitive, subject to rapid change and significantly affected by new product introductions and other market activities of industry participants. Our ability to compete successfully will depend on our ability to develop proprietary products that reach the market in a timely manner, receive adequate reimbursement and are safer, less invasive and less expensive than those of our competitors. With respect to our nerve monitoring systems, we compete with Medtronic and Vyaire Medical (formerly VIASYS Healthcare, a division of Becton, Dickinson and Company), each of which have significantly greater resources than we do. Our IOM services business competes with Specialty Care and numerous smaller and regional nerve monitoring companies. With respect to MaXcess, our minimally-disruptive surgical system, our largest competitors are Medtronic, DePuy/Synthes, Stryker Spine, Globus Medical, and Zimmer Biomet Spine. We compete with many of the same companies with respect to our other products. We also compete with numerous smaller companies with respect to our implant products, many of whom have a significant regional market presence. At any time, these companies and other potential market entrants may develop alternative treatments, products or procedures for the treatment of spine disorders that compete directly or indirectly with our offerings. In addition, they may gain a market advantage by developing and patenting competitive products or processes earlier than we can or by obtaining regulatory clearances or market registrations more rapidly than we can.
Many of our competitors have greater resources than we have.
Many of our larger competitors are either publicly traded or divisions or subsidiaries of publicly traded companies, and enjoy several competitive advantages over us, including:
|
|
• |
significantly greater name recognition; |
|
|
• |
established relationships with a greater number of spine surgeons, hospitals, other healthcare providers and third-party payers; |
|
|
• |
larger and more well-established distribution networks domestically and/or internationally; |
|
|
• |
products supported by long-term clinical data; |
|
|
• |
greater experience in obtaining and maintaining FDA and other regulatory approvals or clearances for products and product enhancements; |
|
|
• |
more expansive portfolios of intellectual property rights; and |
|
|
• |
greater financial assets, cash flow, capital markets access and other resources for product research and development, sales and marketing, and litigation. |
Because of the significant size of the potential market for spine surgery products and procedures, we anticipate that existing competitors will continue to dedicate substantial resources to developing competing products. If we are unable to compete effectively, our sales and operating results may suffer.
Changes to third-party reimbursement policies and practices, including non-coverage decisions, can negatively impact our ability to sell our products and services.
Sales of our products and procedural solutions depend on the availability of adequate reimbursement from third-party payers. We believe that future third-party reimbursement for healthcare costs may be subject to changes in policies and practices, such as more restrictive criteria to qualify for surgery coverage or reduction in payment amounts to hospitals and surgeons for approved surgery and IOM services, both in the United States and internationally. Further, certain third-party payers have stated non-coverage decisions concerning our technologies and services. These actions could significantly alter our ability to sell our products and procedural solutions. The continuing efforts of governmental authorities, insurance companies, and other payers of healthcare costs to contain or reduce costs could lead to patients being unable to obtain approval for payment from these third-party payers. Changes in legislation, regulation or reimbursement policies of third-party payers may adversely affect the demand for our products and services as healthcare providers generally rely on third-party payers to reimburse all or part of the costs and fees associated with the procedures performed with these devices and services. Likewise, spine surgeons, neurophysiologists and their supervising physicians rely primarily on third-party reimbursement for the surgical or monitoring fees they earn. Spine surgeons are unlikely to use our products and services if they do not receive reimbursement adequate to cover the cost of their involvement in surgical procedures.
17
Pricing pressure from our competitors, hospital customers and insurance providers can negatively impact our ability to sell our products and services.
The market for spine surgery products is large and has attracted numerous new companies and technologies. As some companies have sought to compete based on price, it has created pricing pressure, which we expect to continue in the future. In addition, we may experience decreasing prices for our products due to pricing pressure from our hospital customers and insurance providers. Because healthcare costs have risen significantly over the past decade, numerous initiatives and reforms have resulted in efforts to drive down prices. As hospitals look to reduce costs, including by aggregating purchasing decisions and through industry consolidation, they may demand lower pricing and limit their number of suppliers. If competitive forces drive down the prices we are able to charge for our products, our profit margins will shrink, which will adversely affect our ability to maintain our profitability and to invest in and grow our business.
The proliferation of physician-owned distributorships, as well as aggressive competitive tactics to attract away key customers, could result in increased pricing pressure and harm our ability to maintain or grow revenue.
Physician-owned distributorships, or PODs, are medical device distributors that are owned, directly or indirectly, by physicians. These physicians derive revenue from selling or arranging for the sale of medical devices via their PODs that are used in the procedures they perform on their patients. We do not sell or distribute any of our products to PODs. However, the proliferation of PODs may reduce our market opportunities and may hamper our ability to grow or maintain revenue. PODs can have significant market knowledge and access to the surgeons who use our products, and we have seen increasingly aggressive competitive tactics from PODs focused on attracting customers away from us. To the extent these tactics are successful, our revenue may materially suffer.
If the quality of our products does not meet the expectations of physicians or patients, then our brand and reputation could suffer and our business could be adversely impacted.
In the course of conducting our business, we must adequately address quality issues that may arise with our products, as well as defects in third-party components included in our products. Although we have established internal procedures to minimize risks that may arise from quality issues, we may not be able to eliminate or mitigate occurrences of these issues and associated liabilities. If the quality of our products does not meet the expectations of physicians or patients, then our brand and reputation could suffer and our business could be adversely impacted.
The safety of many of our products is not yet supported by long-term clinical data and many of our products may therefore prove to be less safe and effective than initially thought.
As a consequence of our strategy to obsolete our own products with new technologies, many of our products do not have a long history of use. Further, many of our products are subject to the FDA’s 510(k) premarket notification clearance process, which typically does not require clinical data. Accordingly, many of our products currently lack the breadth of published long-term clinical data supporting their safety and effectiveness. For these reasons, spine surgeons may be slow to adopt our products, we may not have comparative data that our competitors have or are generating, and we may be subject to greater regulatory and product liability risks.
Further, future patient studies or clinical experience may indicate that treatment with our products does not improve patient outcomes. Such results would reduce demand for our products, affect sustainable reimbursement from third-party payers, significantly reduce our ability to achieve expected revenue and could prevent us from sustaining or increasing profitability. Moreover, if future results and experience indicate that our products cause unexpected or serious complications or other unforeseen negative effects, we could be subject to significant legal liability and harm to our business reputation. The spine medical device market has been particularly prone to potential product liability claims that are inherent in the testing, manufacture and sale of medical devices and products for spine surgery procedures.
We may engage in strategic transactions, including acquisitions, investments, or joint development agreements that may have an adverse effect on our business.
We may pursue transactions, including acquisitions of complementary businesses, technology licensing arrangements and joint development agreements to expand our product offerings and geographic presence as part of our business strategy, which could be material to our financial condition and results of operations. We may not complete transactions in a timely manner, on a cost-effective basis, or at all, and we may not realize the expected benefits of any acquisition, license arrangement or joint development agreement. Other companies may compete with us for these strategic opportunities. We also could experience negative effects on our results of operations and financial condition from acquisition-related charges, amortization of intangible assets and asset impairment charges, and other issues that could arise in connection with, or as a result of, the acquisition of an acquired company or business, including issues related to internal control over financial reporting, regulatory or compliance issues and potential adverse short-term effects on results of operations through increased costs or otherwise.
18
In February 2016, we completed the acquisition of Ellipse Technologies for an upfront payment of $380.0 million and a potential milestone payment of $30.0 million payable in 2017 related to the achievement of specific revenue targets. In July 2016, we acquired BNN Holdings Corp., which through its subsidiaries and affiliates, owns and operates Biotronic NeuroNetwork for a purchase price of $98.0 million. Acquisitions, including the acquisitions of Ellipse Technologies and Biotronic NeuroNetwork, involve numerous risks, including the following:
|
|
• |
difficulties in finding suitable partners or acquisition candidates; |
|
|
• |
difficulties in obtaining financing on favorable terms, if at all; |
|
|
• |
difficulties in completing transactions on favorable terms, if at all; |
|
|
• |
the possibility that we will pay more than the value we derive from the acquisition, which could result in future non-cash impairment charges and/or a dilution of future earnings per share; |
|
|
• |
difficulties in integration of the operations, technologies, personnel, and products of the acquired companies, which may require significant attention of the Company’s management team that otherwise would be available for the ongoing development of our business; |
|
|
• |
the applicability of additional laws, regulations and policies that have particular application to our acquisitions, including those relating to patient privacy, insurance fraud and abuse, false claims, prohibitions against self-referrals, anti-kickbacks, direct billing practices, HIPAA compliance, and prohibitions against the corporate practice of medicine and fee-splitting; |
|
|
• |
the assumption of certain known and unknown liabilities of the acquired companies; |
|
|
• |
the incurrence of debt, contingent liabilities or future write-offs of intangible assets or goodwill; |
|
|
• |
difficulties in retaining key relationships with employees, customers, partners and suppliers of the acquired company; and |
|
|
• |
difficulties in operating in different business markets where we may not have historical experience. |
Any of these factors could have a negative impact on our business, results of operations or financial position. Further, past and potential acquisitions entail risks, uncertainties and potential disruptions to our business, especially where we have limited experience as a company developing or marketing a particular product or technology. In addition, we may face additional risks related to foreign acquisitions. Foreign acquisitions involve unique risks in addition to those mentioned above, including those related to integration of operations across different cultures and languages, currency risks and the particular economic, political and regulatory risks associated with specific countries.
Healthcare policy changes, including United States healthcare reform legislation signed in 2010, may have a material adverse effect on us.
In March 2010, the Affordable Care Act was enacted in the United States, which made a number of substantial changes in the way healthcare is financed by both governmental and private insurers. Among other things, the Affordable Care Act:
|
|
• |
requires certain medical device manufacturers to pay a sales tax equal to 2.3% of the price for which such manufacturer sells its medical devices, provided that such tax, after going into effect in 2013, has now been suspended until 2018; |
|
|
• |
establishes a new Patient-Centered Outcomes Research Institute to oversee and identify priorities in comparative clinical effectiveness research in an effort to coordinate and develop such research; |
|
|
• |
implements payment system reforms including a national pilot program on payment bundling to encourage hospitals, physicians and other providers to improve the coordination, quality and efficiency of certain healthcare services through bundled payment models; and |
|
|
• |
establishes an Independent Payment Advisory Board that will submit recommendations to reduce Medicare spending if projected Medicare spending exceeds a specified growth rate. |
In addition, other legislative changes have been proposed and adopted since the Affordable Care Act was enacted. On August 2, 2011, the Budget Control Act of 2011 was signed into law, which, among other things, created the Joint Select Committee on Deficit Reduction to recommend to Congress proposals in spending reductions. The Joint Select Committee did not achieve a targeted deficit reduction of at least $1.2 trillion for the years 2013 through 2021, triggering the legislation’s automatic reduction to several government programs. This includes reductions to Medicare payments to providers of 2% per fiscal year, which went into effect on April 1, 2013 and, due to subsequent legislative amendments to the statute, will remain in effect through 2024 unless additional Congressional action is taken. On January 2, 2013, the American Taxpayer Relief Act of 2012 was signed into law, which, among other things, reduced Medicare payments to several providers, including hospitals, and increased the statute of limitations period for the government to recover overpayments to providers from three to five years.
19
We expect that additional state and federal healthcare reform measures will be adopted in the future, any of which could limit the amounts that federal and state governments will pay for healthcare products and services, which could result in reduced demand for our products or additional pricing pressure.
Our IOM business exposes us to risks inherent with the sale of services.
Our IOM services and support business operated though our subsidiary, NuVasive Clinical Services, exposes us to different risks than our other products and technologies. Through our IOM services business, we provide onsite and remote monitoring of the neurological systems of patients undergoing spinal and brain-related surgeries. Our neurophysiologists are present in the operating room during procedures and work in partnership with supervising physicians who remotely oversee and interpret neurophysiological data gathered via broadband transmission over the Internet. Providing this service subjects us to malpractice exposure. In addition, given the reliance on technology, any disruption to our neuromonitoring equipment or the Internet could harm our service operations and our reputation among our customers. Further, any disruption to our computer systems could adversely impact the performance of our neurophysiologists.
In addition, IOM services are directly billed to Medicare and commercial payers, which brings with it additional risks associated with proper billing practice regulations, HIPAA compliance, corporate practice of medicine laws, and new collections risk associated with third-party payers. Due to the breadth of many healthcare laws and regulations, our IOM business could also be subject to healthcare fraud regulation and enforcement by both the federal government and the states in which we conduct our business, including under the Anti-Kickback Statute, the federal false claims laws and state law equivalents. If our operations are found to be in violation of any of the laws described in the previous sentence or any other governmental regulations that apply to us, we may be subject to penalties, including civil and criminal penalties, damages, fines and the curtailment or restructuring of our operations. Any penalties, damages, fines, curtailment or restructuring of our operations could adversely affect our ability to operate our business and our financial results.
Our employee shareowners, consultants, distributors and other commercial partners may engage in misconduct or other improper activities, including non-compliance with regulatory standards and requirements.
We are exposed to the risk that our employee shareowners, consultants, distributors and other commercial partners may engage in fraudulent or illegal activity. Misconduct by these parties could include intentional, reckless or negligent conduct or other unauthorized activities that violate the regulations of the FDA and non-U.S. regulators, including those laws requiring the reporting of true, complete and accurate information to such regulators, manufacturing standards, healthcare fraud and abuse laws and regulations in the United States and abroad or laws that require the true, complete and accurate reporting of financial information or data. In particular, sales, marketing and business arrangements in the healthcare industry, including the sale of medical devices, are subject to extensive laws and regulations intended to prevent fraud, misconduct, kickbacks, self-dealing and other abusive practices. These laws and regulations may restrict or prohibit a wide range of pricing, discounting, marketing and promotion, sales commission, customer incentive programs and other business arrangements. It is not always possible to identify and deter misconduct by employees, sales agencies, distributors and other third parties, and the precautions we take to detect and prevent this activity may not be effective in controlling unknown or unmanaged risks or losses or in protecting us from governmental investigations or other actions or lawsuits stemming from a failure to comply with these laws or regulations. If any such actions are instituted against us and we are not successful in defending ourselves or asserting our rights, those actions could result in the imposition of significant fines or other sanctions, including the imposition of civil, criminal and administrative penalties, damages, monetary fines, possible exclusion from participation in Medicare, Medicaid and other federal healthcare programs, contractual damages, reputational harm, diminished profits and future earnings and curtailment of operations, any of which could adversely affect our ability to operate our business and our results of operations. Whether or not we are successful in defending against such actions or investigations, we could incur substantial costs, including legal fees, and divert the attention of management in defending ourselves against any of these claims or investigations.
Risks Related to our Commercial Operations and Plans for Future Growth
If we are unable to maintain and expand our network of direct and independent sales representatives, we may not be able to generate anticipated sales.
In the United States, we sell our products through a combination of exclusive independent sales agents and directly-employed sales personnel. Our international sales force is comprised of independent sales agents, directly-employed sales personnel, as well as exclusive and non-exclusive independent third-party distributors. We expect these sales representatives to develop long-lasting relationships with the spine surgeons they serve. If our sales representatives fail to adequately promote, market and sell our products, or fail to develop lasting relationships with spine surgeons, our sales could significantly decrease or fail to increase. Further, we may terminate sales representatives from time to time, which could subject us to claims and lawsuits. Asserting or defending against these types of claims and lawsuits may result in significant legal fees and expenses, and if we are unsuccessful, we could be liable for damages.
20
We face significant challenges and risks in managing our geographically dispersed distribution network and retaining the individuals who make up that network. In the past, we have experienced departures of sales representatives, which have had a negative impact on our results. If sales representatives were to depart and be retained by one of our competitors, we may be unable to prevent them from helping competitors solicit business from our existing customers, which could further adversely affect our sales. Because of the intense competition for their services, we may be unable to recruit or retain sales representatives to work with us. Failure to hire or retain qualified sales representatives would prevent us from expanding our business and generating sales.
We may be unable to manage our future growth effectively, which could make it difficult to execute our business strategy.
We intend to grow our business operations and we may experience periods of rapid growth and expansion. This anticipated future growth could create a strain on our organizational, administrative and operational infrastructure, including manufacturing operations, quality control, technical support and customer service, sales force management and general and financial administration. We may not be able to maintain the quality or delivery timelines of our products or satisfy customer demand as it grows. Our ability to manage our growth properly will require us to continue to improve our operational, financial and management controls, as well as our reporting systems and procedures.
If our commercial operations and sales volume grow, we will need to continue to increase our workflow capacity for manufacturing, customer service, billing and general process improvements and expand our internal quality assurance program, among other things. We will also need to purchase additional equipment, some of which can take several months or more to procure, set up and validate, and increase our manufacturing, maintenance, software and computing capacity to meet increased demand. These increases in scale, expansion of personnel, purchase of equipment or process enhancements may not be successfully implemented.
Our reliance on a limited number of suppliers and manufacturers could limit our ability to meet demand for our products in a timely manner or within our budget.
We rely on a limited number of third-party suppliers and manufacturers to supply and manufacture a majority of our products, and we may not be able to find replacements or immediately transition to alternative suppliers. Many of our key products are manufactured at single locations, with limited alternate facilities. Further, for reasons of quality assurance or cost effectiveness, we purchase certain components and raw materials from sole suppliers.
To be successful, we rely on our suppliers to provide us with products and components in substantial quantities, in compliance with regulatory requirements, in accordance with agreed upon specifications, at acceptable cost and on a timely basis. In the event we experience delays, shortages, or stoppages of supply with any supplier, we would be forced to identify a suitable alternative supplier which could take significant time and result in significant expense. In addition, our anticipated growth could strain the ability of suppliers to deliver an increasingly large supply of products, materials and components. If we are required to transition to new third-party suppliers for certain components of our products, the use of components or materials furnished by these alternative suppliers could require us to alter our operations. Any such interruption or alteration could harm our reputation, business, financial condition and results of operations. In addition, if we are required to change the manufacturer of a critical component of our products, we will be required to verify that the new manufacturer maintains facilities, procedures and operations that comply with our quality and applicable regulatory requirements, which could further impede our ability to manufacture our products in a timely manner. Transitioning to a new supplier could be time-consuming and expensive, may result in interruptions in our operations and product delivery, could affect the performance specifications of our products or could require that we modify the design of those systems.
Performance issues, service interruptions or price increases by our shipping carriers could adversely affect our business and harm our reputation and ability to provide our services on a timely basis.
Expedited, reliable shipping is essential to our operations. We rely heavily on providers of transport services for reliable and secure point-to-point transport of our products to our customers and for tracking of these shipments. Should a carrier encounter delivery performance issues such as loss, damage or destruction of any products, it could be costly to replace such products in a timely manner and such occurrences may damage our reputation and lead to decreased demand for our products and increased cost and expense to our business. In addition, any significant increase in shipping rates could adversely affect our operating margins and results of operations. Similarly, strikes, severe weather, natural disasters or other service interruptions affecting delivery services we use would adversely affect our ability to process orders for our products on a timely basis.
21
Manufacturing risks may adversely affect our ability to manufacture products and could reduce our gross margins and negatively affect our operating results.
We currently manufacture a portion of our products at our manufacturing facility in Dayton, Ohio. In 2015, we added an approximately 180,000 square foot manufacturing facility in West Carrollton, Ohio, in order to expand our internal manufacturing efforts and this new facility commenced limited commercial scale production in the fourth quarter of 2016. As part of our business strategy, we intend to expand our ability to manufacture our current and new products with exceptional quality and in sufficient quantities to meet demand, while complying with regulatory requirements and managing manufacturing costs. We are subject to numerous risks relating to our manufacturing capabilities, including both those of our own manufacturing facilities and those of our third party suppliers, such as:
|
|
• |
problems with quality control and assurance; |
|
|
• |
defects in product components that we source from third-party suppliers; |
|
|
• |
delays in obtaining components from third-party suppliers and component supply shortages; |
|
|
• |
failing to predict demand accurately, resulting in a failure to increase production of products to meet demand; |
|
|
• |
potential adverse effects on existing business relationships with current third-party suppliers as we expand our in-house manufacturing capabilities; |
|
|
• |
maintaining control over manufacturing expenses as production expands; |
|
|
• |
difficulties associated with compliance with local, state, federal and foreign regulatory requirements; |
|
|
• |
the inability to modify production lines to enable the efficient manufacture of new products or to quickly implement changes to current products in response to regulatory requirements; and |
|
|
• |
potential damage to or destruction of our, or our suppliers’ manufacturing equipment or manufacturing facilities. |
These risks may be exacerbated by our limited experience with in-house manufacturing processes and procedures. In addition, as we seek to expand our manufacturing capabilities, we will have to continue to invest additional resources to hire and train personnel and enhance our production processes. If we fail to increase our manufacturing capacity efficiently, our profit margins will shrink, which will negatively affect our operating results.
The loss of key employee shareowners, or our inability to recruit, hire and retain skilled and experienced personnel, could negatively impact our ability to effectively manage and expand our business.
Our success depends on the skills, experience and performance of the members of our executive management team and other key employee shareowners. Their individual and collective efforts will be important as we continue to develop our products and as we expand our commercial activities. The loss or incapacity of existing members of our executive management team could negatively impact our operations, particularly if we experience difficulties in hiring qualified successors. We do not maintain key man life insurance with respect to any of our employee shareowners.
Our research and development programs and operations depend on our ability to attract and retain highly skilled engineers and technicians. We may not be able to attract or retain qualified managers, engineers and technicians in the future due to the competition for qualified personnel among medical device businesses, particularly in California. We also face competition from universities and public and private research institutions in recruiting and retaining highly qualified personnel. Recruiting and retention difficulties can limit our ability to support our commercial, manufacturing and research and development programs. All of our U.S. employee shareowners are employed on an at-will basis, which means that either we or the employee shareowner may terminate his or her employment at any time. The loss of key employee shareowners, the failure of any key employee shareowners to perform or our inability to attract and retain skilled employee shareowners, as needed, or an inability to effectively plan for and implement a succession plan for key employee shareowners could harm our business.
22
We face risks associated with our international business.
During the year ended December 31, 2016, $130.4 million or approximately 14% of our net revenue was attributable to our international customers. We are seeking to increase our international sales over the foreseeable future. Our international business operations are subject to a variety of risks, including:
|
|
• |
difficulties in staffing and managing foreign and geographically dispersed operations; |
|
|
• |
having to comply with various U.S. and international laws, including the U.S. Foreign Corrupt Practices Act of 1977, or the FCPA, and anti-money laundering laws; |
|
|
• |
having to comply with export control laws, including, but not limited to, the Export Administration Regulations and trade sanctions against embargoed countries, which are administered by the Office of Foreign Assets Control within the Department of the Treasury, as well as the laws and regulations administered by the Department of Commerce; |
|
|
• |
differing regulatory requirements for obtaining clearances or approvals to market our products; |
|
|
• |
changes in, or uncertainties relating to, foreign rules and regulations that may impact our ability to sell our products, perform services or repatriate profits to the United States; |
|
|
• |
tariffs and trade barriers, export regulations and other regulatory and contractual limitations on our ability to sell our products in certain foreign markets; |
|
|
• |
fluctuations in foreign currency exchange rates; |
|
|
• |
limitations on or increase of withholding and other taxes on remittances and other payments by foreign subsidiaries or joint ventures; |
|
|
• |
differing multiple payer reimbursement regimes, government payers or patient self-pay systems; |
|
|
• |
differing labor laws and standards; |
|
|
• |
complex data privacy requirements; |
|
|
• |
economic, political or social instability in foreign countries and regions; |
|
|
• |
an inability, or reduced ability, to protect our intellectual property, including any effect of compulsory licensing imposed by government action; and |
|
|
• |
availability of government subsidies or other incentives that benefit competitors in their local markets that are not available to us. |
The FCPA and similar anti-bribery laws in non-U.S. jurisdictions generally prohibit companies and their intermediaries from making improper payments for the purpose of obtaining or retaining business. The FCPA also imposes accounting standards and requirements on publicly traded U.S. corporations and their foreign affiliates, which are intended to prevent the diversion of corporate funds to the payment of bribes and other improper payments. Because of the predominance of government-sponsored healthcare systems around the world, many of our customer relationships outside of the United States are with governmental entities and are therefore subject to such anti-bribery laws. Our internal control policies and procedures may not always protect us from reckless or criminal acts committed by our employee shareowners, distributors or agents. In recent years, both the United States and foreign government regulators have increased regulation, enforcement, inspections and governmental investigations of the medical device industry, including increased United States government oversight and enforcement of the FCPA. Despite implementation of a comprehensive global healthcare compliance program, we may be subject to more regulation, enforcement, inspections and investigations by governmental authorities in the future.
Any failure to comply with applicable legal and regulatory obligations in the United States or abroad could adversely affect us in a variety of ways that include, but are not limited to, significant criminal, civil and administrative penalties, including imprisonment of individuals, fines and penalties, denial of export privileges, seizure of shipments and restrictions on certain business activities, disgorgement and other remedial measures, disruptions of our operations, significant management distraction. Also, the failure to comply with applicable legal and regulatory obligations could result in the disruption of our distribution and sales activities. Any reduction in international sales, or our failure to further develop our international markets, could have a material adverse effect on our business, results of operations and financial condition.
23
Our results may be impacted by changes in foreign currency exchange rates.
As we increasingly compete in markets outside of the United States, we are and will be exposed to foreign currency exchange risk related to our foreign operations. A significant portion of our foreign subsidiaries’ operating expenses are incurred in foreign currencies. If the U.S. dollar weakens, our consolidated operating expenses would increase. An increase in the value of the U.S. dollar relative to foreign currencies could require us to reduce our selling price or risk making our products less competitive in international markets or our costs could increase. Also, if our international sales increase, we may enter into a greater number of transactions denominated in non-U.S. dollars, which could expose us to foreign currency risks, including changes in currency exchange rates. If we are unable to address these risks and challenges effectively, our international operations may not be successful and our business could be harmed.
If we fail to properly manage our anticipated international growth, our business could suffer.
We have invested, and expect to increase our investment for the foreseeable future, in our expansion into international markets. To execute our anticipated growth in international markets we must:
|
|
• |
manage the complexities associated with a larger, faster growing and more geographically diverse organization; |
|
|
• |
expand our clinical development resources to manage and execute increasingly global, larger and more complex clinical trials; |
|
|
• |
manage our directly-employed sales personnel as well as independent distributors and sales agents operating in international markets often pursuant to laws, regulations and customs that may be different than those that are customary for our United States operations; |
|
|
• |
expand our sales and marketing presence in international markets generally to avoid revenue concentration in a small number of markets that would subject us to the risk of business disruption as a result of economic or political problems in concentrated locations; |
|
|
• |
upgrade our internal business processes and capabilities (e.g., information technology platform and systems, product distribution and tracking) to create scalability and properly handle the transaction volumes that our growing geographically diverse organization demands; and |
|
|
• |
expend time and resources to receive product approvals and clearances to sell and promote products. |
We expect that our operating expenses will continue to increase as we continue to expand into international markets. International markets may be slower than domestic markets in adopting our products and are expected, in many instances, to yield lower profit margins when compared to our domestic operations. We have only limited experience in expanding into international markets as well as marketing and operating our products and services in such markets.
Additionally, our international endeavors may involve significant risks and uncertainties, including distraction of Company management from domestic operations, insufficient revenue to offset the expenses associated with our international strategy, and issues not discovered in our due diligence of new markets or ventures. Because expansion into international markets is inherently risky, no assurance can be given that such strategies and initiatives will be successful and will not materially adversely affect our financial condition and operating results. Even if our international expansion is successful, our expenses may increase at a greater pace than our revenue and our operating results could be harmed.
Further, our anticipated growth internationally will place additional strain on our suppliers and manufacturers, resulting in increased need for us to carefully monitor quality assurance. Any failure by us to manage our international growth effectively could have an adverse effect on our ability to achieve our development and commercialization goals.
Cyber security risks and the failure to maintain the confidentiality, integrity, and availability of our computer hardware, software, and Internet applications and related tools and functions could result in harm to our business and/or subject us to costs, fines or lawsuits.
We rely on sophisticated information technology systems and network infrastructure to operate and manage our business. We also maintain personally identifiable information (PII) about our employee shareowners, and given the nature of our business, we have access to PHI. Our business therefore depends on the continuous, effective, reliable, and secure operation of our computer hardware, software, networks, Internet servers, and related infrastructure. To the extent that our hardware or software malfunctions or access to our data by internal personnel, suppliers or customers through the Internet is interrupted or compromised, our business could suffer.
24
The integrity and protection of our customer, personnel, financial, research and development, and other confidential data is critical to our business and our customers and employees have a high expectation that we will adequately protect their personal information. The regulatory environment governing information, security and privacy laws is increasingly demanding and continues to evolve. Although our computer and communications hardware is protected through physical and software safeguards, it is still vulnerable to system malfunction, computer viruses, and cyber-attacks. These events could lead to the unauthorized access of our information technology systems and result in the misappropriation or unauthorized disclosure of confidential information belonging to us, our employee shareowners, partners, customers, or our suppliers. The techniques used by criminal elements to attack computer systems are sophisticated, change frequently and may originate from less regulated and remote areas of the world. As a result, we may not be able to address these techniques proactively or implement adequate preventative measures. If our information technology systems are compromised, we could be subject to fines, damages, litigation and enforcement actions and we could lose trade secrets or other confidential information, the occurrence of which could harm our business.
Our operations are vulnerable to interruption or loss due to natural or other disasters, power loss, strikes and other events beyond our control.
We conduct a significant portion of our activities, including administration and data processing, at facilities located in Southern California, an area that has experienced major earthquakes, fires and other natural disasters. A major earthquake, fire or other disaster (such as a major flood, tsunami, or terrorist attack) affecting our facilities, or those of our suppliers, could significantly disrupt our operations, and delay or prevent product shipment or installation during the time required to repair, rebuild or replace our facilities or those of our suppliers. These delays could be lengthy and costly. If any of our customers’ facilities are negatively impacted by a disaster, shipments of our products could be delayed. Additionally, customers may delay purchases of our products until operations return to normal. Even if we are able to quickly respond to a disaster, the ongoing effects of the disaster could create some uncertainty in the operations of our business. In addition, our facilities may be subject to a shortage of available electrical power and other energy supplies. Any shortages may increase our costs for power and energy supplies or could result in blackouts, which could disrupt the operations of our affected facilities and harm our business. In addition, concerns about terrorism, the effects of a terrorist attack, political turmoil or an outbreak of epidemic diseases could have a negative effect on our operations, those of our suppliers and customers and the ability to travel, which could harm our business, financial condition and results of operations.
Our insurance policies are expensive and protect us only from some business risks, which will leave us exposed to significant uninsured liabilities.
We do not carry insurance for all categories of risk that our business may encounter. Some of the policies we currently maintain include general liability, foreign liability, employee benefits liability, property, umbrella, workers’ compensation, products liability and directors’ and officers’ insurance. We do not know, however, if we will be able to maintain existing insurance with adequate levels of coverage. Any significant uninsured liability may require us to pay substantial amounts, which would adversely affect our cash position and results of operations.
We bear the risk of warranty claims on our products.
We bear the risk of express and implied warranty claims on products we supply, including equipment and component parts manufactured by third parties. We may not be successful in claiming recovery under any warranty or indemnity provided to us by our suppliers or vendors in the event of a successful warranty claim against us by a customer or that any recovery from such vendor or supplier would be adequate. In addition, warranty claims brought by our customers related to third-party components may arise after our ability to bring corresponding warranty claims against such suppliers expire, which could result in additional costs to us. There is a risk that warranty claims made against us will exceed our warranty reserve and our business, financial condition and results of operations could be harmed.
25
Risks Related to Litigation and Intellectual Property
Defending against litigation or other proceedings or third-party claims of intellectual property infringement could require us to spend significant time and money, and if we are unsuccessful, we may be obligated to pay damages and halt sales of our products.
Significant litigation regarding patent rights occurs in our industry and our commercial success depends in part on not infringing the patents or violating the other proprietary rights of others. We have received in the past, and expect to receive in the future, claims from our competitors alleging infringement of their intellectual property rights as part of business strategies designed to impede our successful commercialization of updated and new products and entry into new markets. A patent infringement suit brought against us or any of our strategic partners or licensees may force us or such strategic partners or licensees to stop or delay developing, manufacturing or selling potential products that are claimed to infringe a third-party’s intellectual property, unless that party grants us or our strategic partners or licensees rights to use its intellectual property. In such cases, we may be required to obtain licenses to patents or proprietary rights of others in order to continue to commercialize our products. However, we may not be able to obtain any licenses required under any patents or proprietary rights of third parties on acceptable terms, or at all, and any licenses may require substantial royalties or other payments by us. Even if our strategic partners, licensees or we were able to obtain rights to the third-party’s intellectual property, these rights may be non-exclusive, thereby giving our competitors access to the same intellectual property. Ultimately, we may be unable to commercialize some of our potential products or may have to cease some of our business operations as a result of patent infringement claims, which could severely harm our business.
Moreover, we may become party to future adversarial proceedings regarding our patent portfolio or the patents of third parties. Such proceedings could include supplemental examination or contested post-grant proceedings such as inter partes review, reexamination, interference or derivation proceedings before the U.S. Patent and Trademark Office and challenges in U.S. District Court. Patents may be subjected to opposition, post-grant review or comparable proceedings lodged in various foreign, both national and regional, patent offices. The legal threshold for initiating litigation or contested proceedings may be low, so that even lawsuits or proceedings with a low probability of success might be initiated. Litigation and contested proceedings can also be expensive and time-consuming, and our adversaries in these proceedings may have the ability to dedicate substantially greater resources to prosecuting these legal actions than we can.
Any lawsuits resulting from such allegations could subject us to significant liability for damages and invalidate our proprietary rights. Any potential intellectual property litigation also could force us to do one or more of the following:
|
|
• |
stop making, selling or using products or technologies that allegedly infringe the asserted intellectual property; |
|
|
• |
lose the opportunity to license our technology to others or to collect royalty payments based upon successful protection and assertion of our intellectual property rights against others; |
|
|
• |
incur significant legal expenses; |
|
|
• |
pay substantial damages or royalties to the party whose intellectual property rights we may be found to be infringing; |
|
|
• |
pay the attorney’s fees and costs of litigation to the party whose intellectual property rights we may be found to be infringing; |
|
|
• |
redesign those products that contain the allegedly infringing intellectual property, which could be costly, disruptive and/or infeasible; or |
|
|
• |
attempt to obtain a license to the relevant intellectual property from third parties, which may not be available on reasonable terms or at all. |
Any litigation or claim against us, even those without merit, may cause us to incur substantial costs, and could place a significant strain on our financial resources, divert the attention of management from our core business and harm our reputation. In addition, we generally indemnify our customers and international distributors with respect to infringement by our products of the proprietary rights of third parties. If third parties assert infringement claims against our customers or distributors, we may be required to initiate or defend protracted and costly litigation on behalf of our customers or distributors, regardless of the merits of these claims. If any of these claims succeed or settle, we may be forced to pay damages or settlement payments on behalf of our customers or distributors or may be required to obtain licenses for the products they use. If we cannot obtain all necessary licenses on commercially reasonable terms, our customers may be forced to stop using our products.
26
We are currently, and may in the future be, subject to claims and lawsuits that could cause us to incur significant legal expenses and result in harm to our business.
We are currently subject to a purported securities class action lawsuit, shareholder derivative litigation, and various commercial and product liability lawsuits, and we may be subject to additional claims and lawsuits in the future. In addition, we, as well as certain of our officers and sales representatives, are subject to claims or lawsuits from time to time. Regardless of the outcome, these lawsuits may result in significant legal fees and expenses and could divert management’s time and other resources. If the claims contained in these lawsuits are successfully asserted against us, we could be liable for damages and be required to alter or cease certain of our business practices or product lines. Any of these outcomes could cause our business, financial performance and cash position to be negatively impacted. Litigation may also harm our relationships with existing customers and subject us to negative publicity, each of which could harm our business and financial results.
Our ability to protect our intellectual property and proprietary technology through patents and other means is uncertain.
Our success depends significantly on our ability to protect our proprietary rights to the technologies used in our products and procedural solutions. We rely on patent protection, as well as a combination of copyright, trade secret and trademark laws, and nondisclosure, confidentiality and other contractual restrictions to protect our proprietary technology. However, these legal means afford only limited protection and may not adequately protect our rights or permit us to gain or keep any competitive advantage. If we do not adequately protect our intellectual property and proprietary technology, competitors may be able to use our technologies and erode or negate any competitive advantage we may have, which could harm our business and ability to achieve profitability.
Our pending U.S. and foreign patent applications may not issue as patents at all or not in a form that will be advantageous to us or may issue and be subsequently successfully challenged by others and invalidated. Our existing patents and any patents issued in the future may not have claims with a scope sufficient to protect our products, any additional features we develop for our products or any new products. Both the patent application process and the process of managing patent disputes can be time consuming and expensive. Other parties may have developed technologies that may be related or competitive to our technology, may have filed or may file patent applications and may have received or may receive patents that overlap or conflict with our patent applications, either by claiming the same methods or devices or by claiming subject matter that could dominate our patent position.
If we seek to enforce our intellectual property rights through litigation or other proceedings, it could require us to spend significant time and money, with uncertain results.
In the event a competitor infringes upon our patent or other intellectual property rights, enforcing those rights may be costly, difficult and time consuming. We may not have sufficient resources to enforce our intellectual property rights or to defend our patents against a challenge. Our ability to enforce our patent rights depends on our ability to detect infringement. It may be difficult to detect infringers who do not advertise the components that are used in their products. Moreover, it may be difficult or impossible to obtain evidence of infringement in a competitor’s or potential competitor’s product. The medical device industry is characterized by the existence of a large number of patents and frequent litigation based on allegations of patent infringement. It is not unusual for parties to exchange letters surrounding allegations of intellectual property infringement and licensing arrangements. In addition, the patent positions of medical device companies, including our patent position, may involve complex legal and factual questions, and, therefore, the scope, validity and enforceability of any patent claims that we have or may obtain cannot be predicted with certainty.
27
Recent changes in U.S. patent laws may limit our ability to obtain, defend and/or enforce our patents.
Recent patent reform legislation could increase the uncertainties and costs surrounding the prosecution of our patent applications and the enforcement or defense of our issued patents. The Leahy-Smith America Invents Act, or the Leahy-Smith Act, includes a number of significant changes to U.S. patent law. These include provisions that affect the way patent applications are prosecuted and also affect patent litigation. The U.S. Patent and Trademark Office recently developed new regulations and procedures to govern administration of the Leahy-Smith Act, and many of the substantive changes to patent law associated with the Leahy-Smith Act, and in particular, the first to file provisions, which only became effective on March 16, 2013. The first to file provisions limit the rights of an inventor to patent an invention if not the first to file an application for patenting that invention, even if such invention was the first invention. Accordingly, it is not clear what, if any, impact the Leahy-Smith Act will have on the operation of our business. The pool of prior art available to inhibit or limit our ability to obtain issued patents on the technology utilized in our products is expected to expand and the grace period for filing a patent application has been reduced in some ways. It is now possible for a situation to arise in which a competitor is able to obtain patent rights to technology which we invented first. Furthermore, the newly enacted patent laws have expanded the types of post grant challenges of issued patents and these proceedings may provide our competitors with additional opportunities to challenge the validity of our issued patents.
Additionally, the Leahy-Smith Act and its implementation could increase the uncertainties and costs surrounding the enforcement and defense of our issued patents. For example, the Leahy-Smith Act provides that an administrative tribunal known as the Patent Trial and Appeals Board, or PTAB, provides a venue for challenging the validity of patents at a cost that is much lower than district court litigation and on timelines that are much faster. Although it is not clear what, if any, long-term impact the PTAB proceedings will have on the operation of our business, the initial results of patent challenge proceedings before the PTAB since its inception in 2013 have resulted in the invalidation of many U.S. patent claims. The availability of the PTAB as a lower-cost, faster and potentially more potent tribunal for challenging patents could increase the likelihood that our own patents will be challenged, thereby increasing the uncertainties and costs of maintaining and enforcing them.
Further, competitors may challenge our issued patents through post-grant challenge procedures (domestically) and/or opposition proceedings (internationally). The Leahy-Smith Act amended the post-grant challenge procedures in the U.S. to eliminate inter partes reexamination, maintain ex parte reexamination, and add inter partes review making it easier for third-parties to challenge issued patents. We are currently engaged in various such proceedings with respect to our issued patents and the Leahy-Smith Act and its implementation could increase the uncertainties and costs surrounding the enforcement or defense of our issued patents.
If we are unable to protect the confidentiality of our trade secrets, our business and competitive position could be harmed.
In addition to patent protection, we also rely upon copyright and trade secret protection, as well as non-disclosure agreements and invention assignment agreements with our employee shareowners, consultants and third parties, to protect our confidential and proprietary information. In addition to contractual measures, we try to protect the confidential nature of our proprietary information using physical and technological security measures. Such measures may not, for example, in the case of misappropriation of a trade secret by an employee or third party with authorized access, provide adequate protection for our proprietary information. Our security measures may not prevent an employee or consultant from misappropriating our trade secrets and providing them to a competitor, and recourse we take against such misconduct may not provide an adequate remedy to protect our interests fully. Unauthorized parties may also attempt to copy or reverse engineer certain aspects of our products that we consider proprietary. Enforcing a claim that a party illegally disclosed or misappropriated a trade secret can be difficult, expensive and time-consuming, and the outcome is unpredictable. In addition, trade secrets may be independently developed by others in a manner that could prevent legal recourse by us. If any of our confidential or proprietary information, such as our trade secrets, were to be disclosed or misappropriated, or if any such information was independently developed by a competitor, our business and competitive position could be harmed.
We may not be able to enforce our intellectual property rights throughout the world.
The laws of some foreign countries do not protect intellectual property rights to the same extent as the laws of the United States. Many companies have encountered significant problems in protecting and defending intellectual property rights in certain foreign jurisdictions. This could make it difficult for us to stop infringement of our foreign patents, if obtained, or the misappropriation of our other intellectual property rights. For example, some foreign countries have compulsory licensing laws under which a patent owner must grant licenses to third parties. In addition, some countries limit the enforceability of patents against third parties, including government agencies or government contractors. In these countries, patents may provide limited or no benefit. Patent protection must ultimately be sought on a country-by-country basis, which is an expensive and time-consuming process with uncertain outcomes. Accordingly, we may choose not to seek patent protection in certain countries, and we will not have the benefit of patent protection in such countries.
Proceedings to enforce our patent rights in foreign jurisdictions could result in substantial costs and divert our efforts and attention from other aspects of our business. Accordingly, our efforts to protect our intellectual property rights in such countries may be inadequate. In addition, changes in the law and legal decisions by courts in the United States and foreign countries may affect our ability to obtain adequate protection for our technology and the enforcement of our intellectual property.
28
Third parties may assert ownership or commercial rights to inventions we develop.
Third parties may in the future make claims challenging the inventorship or ownership of our intellectual property. We have written agreements with collaborators that provide for the ownership of intellectual property arising from our collaborations. In addition, we may face claims by third parties that our agreements with employee shareowners, contractors or consultants obligating them to assign intellectual property to us are ineffective or in conflict with prior or competing contractual obligations of assignment, which could result in ownership disputes regarding intellectual property we have developed or will develop and interfere with our ability to capture the commercial value of such intellectual property. Litigation may be necessary to resolve an ownership dispute, and if we are not successful, we may be precluded from using certain intellectual property or may lose our exclusive rights in that intellectual property. Either outcome could harm our business and competitive position.
Third parties may assert that our employees or consultants have wrongfully used or disclosed confidential information or misappropriated trade secrets.
We employ individuals who previously worked with other companies, including our competitors or potential competitors. Although we try to ensure that our employee shareowners and consultants do not use the proprietary information or know-how of others in their work for us, we may be subject to claims that we or our personnel, consultants or independent contractors have inadvertently or otherwise used or disclosed intellectual property, including trade secrets or other proprietary information, of a former employer or other third party. Litigation may be necessary to defend against these claims. If we fail in defending any such claims or settling those claims, in addition to paying monetary damages or a settlement payment, we may lose valuable intellectual property rights or personnel. Even if we are successful in defending against such claims, litigation could result in substantial costs and/or be a distraction to management and other employee shareowners.
If personal injury lawsuits are brought against us, our business may be harmed, and we may be required to pay damages that exceed our insurance coverage.
Our business exposes us to potential product liability claims that are inherent in the testing, manufacture and sale of medical devices for surgical procedures, and potential malpractice claims that are inherent in the IOM services provided through our subsidiary, NuVasive Clinical Services. These surgeries involve significant risk of serious complications, including bleeding, nerve injury, paralysis and even death. We could become the subject of product liability lawsuits alleging that component failures, malfunctions, manufacturing flaws, design defects or inadequate disclosure of product-related risks or product-related information resulted in an unsafe condition or injury to patients. Additionally, our IOM services business could become the subject of medical malpractice lawsuits alleging negligence on the part of our neurophysiologists and/or oversight physicians.
We have had, and continue to have, a small number of personal injury claims relating to our products and clinical services, none of which either individually, or in the aggregate, have resulted, or do we believe will result, in a material negative impact on our business. In the future, we may be subject to additional personal injury claims, some of which may have a negative impact on our business. Regardless of the merit or eventual outcome, personal injury claims may result in:
|
|
• |
decreased demand for our products; |
|
|
• |
injury to our reputation; |
|
|
• |
significant litigation costs; |
|
|
• |
substantial monetary awards to or costly settlements with patients; |
|
|
• |
product recalls; |
|
|
• |
material defense costs; |
|
|
• |
loss of revenue; |
|
|
• |
increased insurance costs; |
|
|
• |
the inability to commercialize new products or product candidates; and |
|
|
• |
diversion of management attention from pursuing our business strategy. |
Our existing insurance coverage for personal injury claims may be inadequate to protect us from any liabilities we might incur. If a personal injury claim or series of claims is brought against us for uninsured liabilities or in excess of our insurance coverage, our business could suffer. In addition, we may not be able to maintain insurance coverage at a reasonable cost or in sufficient amounts or scope to protect us against losses. Any claims against us, regardless of their merit, could severely harm our financial condition, strain our management and other resources and adversely affect or eliminate the prospects for commercialization of our IOM business or sales of a product or product candidate that is the subject of any such claim.
29
Risks Related to Regulatory and Compliance
We are subject to rigorous FDA and other governmental regulations regarding the development, manufacture, and sale of our products and we may incur significant expenses to comply with these regulations and develop products that satisfy these regulations.
The medical devices we manufacture and market are subject to rigorous regulation by the FDA and numerous other federal, state and foreign governmental authorities, including regulations that cover, among other things, the composition, labeling, testing, clinical study, manufacturing, packaging, marketing and distribution of our products.
We are required to register with the FDA as a device manufacturer and tissue bank. As a result, we are subject to periodic inspection by the FDA for compliance with the FDA’s Quality System Regulation (QSR) and Good Tissue Practices requirements, which require manufacturers of medical devices and tissue banks to adhere to certain regulations, including testing, quality control and documentation procedures. Our compliance with applicable regulatory requirements is subject to continual review and is rigorously monitored through periodic inspections by the FDA. In the European Community, we are required to maintain certain ISO certifications in order to sell our products, and are subject to periodic inspections by Notified Bodies to obtain and maintain these certifications. If we or our suppliers fail to adhere to QSR, ISO or other applicable regulations and standards, it could negatively impact product production and regulatory clearances and could result in fines. Further our products could be subject to recall by the FDA or other regulatory bodies, or voluntarily by us, in the event of a material deficiency or defect in design, manufacture, labeling of a product or in the event that a product poses an unacceptable risk to health. These and other consequences could have a material adverse effect on our sales and results of operations.
Most medical devices must receive FDA clearance or approval before they can be commercially marketed. In addition, the FDA may require testing and surveillance programs to monitor the effects of approved products that have been commercialized, and can prevent or limit further marketing of a product based upon the results of such post-marketing programs. In addition, the Federal Medical Device Reporting Regulations require us to provide information to the FDA whenever there is evidence that reasonably suggests that a device may have caused or contributed to a death or serious injury or, if a malfunction were to occur, that could cause or contribute to a death or serious injury. Furthermore, most major markets for medical devices outside the United States require clearance, approval or compliance with certain standards before a product can be commercially marketed. The process of obtaining regulatory approvals to market a medical device, particularly from the FDA and certain foreign governmental authorities, can be costly and time-consuming, and approvals may not be granted for future products or product improvements on a timely basis, if at all. Delays in receipt of, or failure to obtain, approvals for future products or product improvements could result in delayed realization of product revenue or in substantial additional costs, which could have a material adverse effect on our business or results of operations or prospects. At any time after approval of a product, the FDA may conduct periodic inspections to determine compliance with both QSR requirements and/or current Medical Device Reporting regulations. If we fail to comply with our reporting obligations, the FDA could take action, including warning letters, untitled letters, administrative actions, criminal prosecution, imposition of civil monetary penalties, revocation of our device clearance, seizure of our products or delay in clearance of future products. Product clearances or approvals by the FDA can be withdrawn due to failure to comply with regulatory standards or the occurrence of unforeseen problems following initial clearance or approval.
Also, the procurement and transplantation of allograft bone tissue is subject to the criminal statute National Organ Transplant Act and state rules and regulations which govern, among other things, payments we make to vendors in consideration for the services they provide in connection with the recovery and screening of donors. Failure to comply with such laws could result in enforcement action against us and a disruption to these product lines (and the revenue associated therewith).
Failure or alleged failure to comply with FDA and other governmental regulations can result in investigations and other regulatory proceedings, which are expensive and could divert management attention.
If the FDA or other governmental authorities in the United States or abroad believes we are not conducting our business in compliance with applicable laws or regulations, such governmental authority can initiate investigations or other regulatory proceedings. Responding to such investigations and proceedings may cause us to incur substantial costs, and could place a significant strain on our financial resources and divert the attention of management from our core business. We could be subject to proceedings to detain or seize our products, product recalls, or operating restrictions, Moreover, governmental authorities can ban or request the recall, repair, replacement or refund of the cost of any device or product we manufacture or distribute. Any of the foregoing actions could result in decreased sales as a result of negative publicity and product liability claims, and could have a material adverse effect on our financial condition, results of operations and prospects.
We are subject to federal, state and foreign fraud and abuse laws and health information privacy and security laws, which, if violated, could subject us to substantial penalties.
There are numerous U.S. federal and state, as well as foreign, laws pertaining to healthcare fraud and abuse, including anti-kickback, false claims and physician transparency laws. Our relationships with physicians, providers and hospitals are subject to scrutiny under these laws. We may also be subject to patient privacy regulation by both the federal government and the states and foreign jurisdictions in which we conduct our business.
30
Healthcare fraud and abuse laws are broad in scope and are subject to evolving interpretation, which could require us to incur substantial costs to monitor compliance or to alter our practices if they are found not to be in compliance. Violations of these laws may be punishable by criminal or civil sanctions, including substantial fines, imprisonment and exclusion from participation in governmental healthcare programs. Despite implementation of a comprehensive global healthcare compliance program, we cannot provide assurance that any of the healthcare fraud and abuse laws will not change or be interpreted in the future in a manner which restricts or adversely affects our business activities or relationships with healthcare professionals, nor can we make any assurances that authorities will not challenge or investigate our current or future activities under these laws.
In July 2015, we entered into a settlement agreement with the DOJ pursuant to which we paid $13.5 million to resolve an investigation into possible false or otherwise improper claims submitted to Medicare and Medicaid. We admitted no wrongdoing as part of the settlement. In August 2015, we received a CID issued by the DOJ pursuant to the federal False Claims Act. The CID requires the delivery of a wide range of documents and information related to an investigation by the DOJ concerning allegations that we assisted a physician group customer in submitting improper claims for reimbursement and made improper payments to the physician group in violation of the Anti-Kickback Statute. We are cooperating with the DOJ. No assurance can be given as to the timing or outcome of this investigation. Responding to government requests and investigations requires considerable resources, including the time and attention of management. If we were to become the subject of an enforcement action, including any action resulting from the investigation by the DOJ, it could result in negative publicity, penalties, fines, the exclusion of our products from reimbursement under federally-funded programs and/or prohibitions on our ability to sell our products, which could have a material adverse effect on our results of operations, financial condition and liquidity.
We may fail to obtain or maintain foreign regulatory approvals to market our products in other countries.
We currently market our products internationally and intend to expand our international marketing. International jurisdictions require separate regulatory approvals and compliance with numerous and varying regulatory requirements. The approval procedures vary among countries and may involve requirements for additional testing. Clearance or approval by the FDA does not ensure approval or certification by regulatory authorities in other countries or jurisdictions, and approval or certification by one foreign regulatory authority does not ensure approval or certification by regulatory authorities in other foreign countries or by the FDA. The foreign regulatory approval or certification process may include all of the risks associated with obtaining FDA clearance or approval. We may not obtain foreign regulatory approvals on a timely basis, if at all. We may not be able to file for regulatory approvals or certifications and may not receive necessary approvals to commercialize our products in any market. If we fail to receive necessary approvals or certifications to commercialize our products in foreign jurisdictions on a timely basis, or at all, our business, results of operations and financial condition could be adversely affected.
If we fail to obtain, or experience significant delays in obtaining, FDA clearances or approvals for our future products or product enhancements, our ability to commercially distribute and market our products could suffer.
The process of obtaining regulatory clearances or approvals to market a medical device, particularly from the FDA, can be costly and time consuming, and there can be no assurance that such clearances or approvals will be granted on a timely basis, if at all. In particular, the FDA permits commercial distribution of a new, non-exempt, non-Class I medical device only after the device has received clearance under Section 510(k) of the Federal Food, Drug and Cosmetic Act, or receives approval under the premarket approval application (PMA) process. If clinical trials of our current or future product candidates do not produce results necessary to support regulatory approval, we will be unable to commercialize these products, which could have a material adverse effect on our financial results.
The FDA will clear marketing of a medical device through the 510(k) process if it is demonstrated that the new product is substantially equivalent to other 510(k)-cleared products. The PMA process is more costly, lengthy and uncertain than the 510(k) clearance process. Additionally, any modification to a 510(k)-cleared device that could significantly affect its safety or efficacy, or that would constitute a major change in its intended use, requires a new 510(k) clearance or, possibly, a PMA. The FDA may not agree with any of our decisions regarding whether new clearances or approvals are necessary. Our failure to comply with such regulations could lead to the imposition of injunctions, suspensions or loss of regulatory approvals, product recalls, termination of distribution, or product seizures. In the most egregious cases, criminal sanctions or closure of our manufacturing facilities are possible.
31
The misuse or off-label use of our products may harm our reputation in the marketplace, result in injuries that lead to product liability suits or result in costly investigations, fines or sanctions by regulatory bodies if we are deemed to have engaged in the promotion of these uses, any of which could be costly to our business.
Pursuant to FDA regulations, we can only market our products for cleared or approved uses. Although physicians are permitted to use medical devices for indications other than those cleared or approved by the FDA based on their medical judgment, we are prohibited from promoting products for such off-label uses. We train our marketing personnel and independent sales representatives and distributors to not promote our products for uses outside of the FDA-cleared indications. Although we believe our marketing, promotional materials and training programs for physicians do not constitute promotion of unapproved uses of our products, if the FDA or any foreign regulatory body determines that our marketing, promotional materials or training programs constitute promotion of an off-label use, we could be subject to significant fines in addition to regulatory enforcement actions. It is also possible that other federal, state or foreign enforcement authorities might take action under other regulatory authority, such as false claims laws, if they consider our business activities to constitute promotion of an off-label use, which could result in significant penalties, including, but not limited to, criminal, civil and administrative penalties, damages, fines, disgorgement, exclusion from participation in government healthcare programs and the curtailment of our operations.
In addition, there may be increased risk of injury to patients if physicians attempt to use our products off-label. Furthermore, the use of our products for indications other than those cleared by the FDA or approved by any foreign regulatory body may not effectively treat such conditions, which could harm our reputation in the marketplace among physicians and patients.
If we or our suppliers fail to comply with the FDA’s quality system regulations or equivalent regulations and standards internationally, the manufacture and processing of our products could be delayed and we may be subject to an enforcement action by the FDA or other government agencies.
We and our suppliers are required to comply with the QSR and other applicable standards and requirements, which cover the methods and documentation of the design, testing, production or processing, control, quality assurance, labeling, packaging, storage and shipping of our products. The FDA and other regulatory bodies enforce compliance with regulatory requirements and standards through periodic inspections. If we or one of our suppliers fail an inspection or if any corrective action plan is not sufficient, the release of our products could be delayed. We have undergone inspections by the FDA and other regulatory bodies regarding our allograft business and FDA inspections regarding our medical device activities. In connection with these inspections as well as prior inspections, regulatory agencies have requested minor corrective actions, which we have implemented. There can be no assurance that the FDA will not subject us to further enforcement action and the FDA and other regulatory agencies may impose additional inspections at any time.
Additionally, we are the legal manufacturer of record for the products that are distributed and labeled by us, regardless of whether the products are manufactured by us or our suppliers. Thus, a failure by us or our suppliers to comply with applicable regulatory requirements can result in enforcement action against us by the FDA, which may include any of the following sanctions:
|
|
• |
fines, injunctions, and civil penalties; |
|
|
• |
recall or seizure of our products; |
|
|
• |
operating restrictions, partial suspension or total shutdown of production; |
|
|
• |
refusing our request for 510(k) clearance or premarket approval of new products; |
|
|
• |
withdrawing 510(k) clearance or premarket approvals that are already granted; and |
|
|
• |
criminal prosecution. |
We or our suppliers may be the subject of claims for non-compliance with FDA regulations in connection with the processing or distribution of allograft products.
It is possible that allegations may be made against us or against donor recovery groups or tissue banks, including those with which we have a contractual relationship, claiming that the acquisition or processing of tissue for allograft products does not comply with applicable FDA regulations or other relevant statutes and regulations. Allegations like these could cause regulators or other authorities to take investigative or other action against us, or could cause negative publicity for us or our industry in general. These actions or any negative publicity could cause us to incur substantial costs, divert the attention of management from our business, harm our reputation and cause the market price of our shares to decline.
32
Compliance with SEC regulations relating to “conflict minerals” may increase our costs and adversely affect our business.
We are subject to SEC regulations that require us to determine whether our products contain certain specified minerals, referred to under the regulations as “conflict minerals”, and, if so, to perform an extensive inquiry into our supply chain, in an effort to determine whether or not such conflict minerals originate from the Democratic Republic of Congo (“DRC”), or an adjoining country. Compliance with these regulations has increased our costs, and we expect our costs may increase in the future. We have determined that certain of our products contain such specified minerals. As of the date of our conflict minerals report for the 2015 calendar year, we were unable to determine whether or not such minerals originate from the DRC or an adjoining country. We are continuing to conduct inquiries into our supply chain in connection with the preparation of our conflict minerals report for 2016, which must be audited by an independent auditor pursuant to existing government auditing standards. Compliance with these requirements has been time-consuming for management and our supply chain personnel (as well as time-consuming for our suppliers), and we expect that compliance will continue to require the expenditure of significant amounts of time and money by us and them. In addition, to the extent any of our disclosures are perceived by the market to be “negative,” it may cause customers to refuse to purchase our products. Further, if we determine to make any changes to products, processes, or sources of supply, it may result in additional costs, which may adversely affect our business.
Legislative or regulatory reforms may make it more difficult and costly for us to obtain regulatory clearances or approvals for our products or to produce, market or distribute our products after clearance or approval is obtained.
From time to time, legislation is drafted and introduced in Congress that could significantly change the statutory provisions governing the regulation of medical devices or the reimbursement thereof. In addition, the FDA regulations and guidance are often revised or reinterpreted by the FDA in ways that may significantly affect our business and our products. Any new statutes, regulations or revisions or reinterpretations of existing regulations may impose additional costs or lengthen review times of any future products or make it more difficult to manufacture, market or distribute our products or future products. We cannot determine what effect changes in regulations, statutes, legal interpretation or policies, when and if promulgated, enacted or adopted may have on our business in the future. Such changes could, among other things, require:
|
|
• |
additional testing prior to obtaining clearance or approval; |
|
|
• |
changes to manufacturing methods; |
|
|
• |
recall, replacement or discontinuance of our products or future products; or |
|
|
• |
additional record keeping. |
Any of these changes could require substantial time and cost and could harm our business and our financial results.
Our relationships with physician consultants, owners and investors could be subject to additional scrutiny from regulatory enforcement authorities and could subject us to possible administrative, civil or criminal sanctions.
Federal and state laws and regulations impose restrictions on our relationships with physicians who are consultants, owners and investors. We have entered into consulting agreements, license agreements and other agreements with physicians in which we provided equity awards or cash or both as compensation. Some of the physicians with which we have such consulting and other agreements are affiliated with some of our customers. Finally, we have other arrangements with physicians, including for research and development grants and for other purposes as well.
We could be adversely affected if regulatory agencies were to interpret our financial relationships with these physicians, who may be in a position to influence the ordering of and use of our products for which governmental reimbursement may be available, as being in violation of applicable laws. If our relationships with physicians are found to be in violation of the laws and regulations that apply to us, we may be required to restructure the arrangements and could be subject to administrative, civil and criminal penalties, including exclusion from participation in government healthcare programs and the curtailment or restructuring of our operations, any of which could negatively impact our ability to operate our business and our results of operations.
33
Our business involves the use of hazardous materials and we and our third-party manufacturers must comply with environmental laws and regulations, which may be expensive and restrict how we do business.
Our third-party manufacturers’ activities and our own activities involve the controlled storage, use and disposal of hazardous materials. We and our manufacturers are subject to federal, state, local and foreign laws and regulations governing the use, generation, manufacture, storage, handling and disposal of these hazardous materials. We currently carry no insurance specifically covering environmental claims relating to the use of hazardous materials, but we do reserve funds to address these claims at both the federal and state levels. Although we believe that our safety procedures for handling and disposing of these materials and waste products comply with the standards prescribed by these laws and regulations, we cannot eliminate the risk of accidental injury or contamination from the use, storage, handling or disposal of hazardous materials. In the event of an accident, state or federal or other applicable authorities may curtail our use of these materials and interrupt our business operations. In addition, if an accident or environmental discharge occurs, or if we discover contamination caused by prior operations, including by prior owners and operators of properties we acquire, we could be liable for cleanup obligations, damages and fines. If such unexpected costs are substantial, this could significantly harm our financial condition and results of operations.
Risks Related to Our Financial Results and Need for Financing
We may be unable to grow our revenue or earnings as anticipated, which may have a material adverse effect on our future operating results.
We have experienced rapid growth since our inception, and have increased our revenue from $38.4 million in 2004, the year of our initial public offering, to $962.1 million in 2016. Our ability to achieve future growth will depend upon, among other things, the success of our growth strategies, which we cannot assure will be successful. In addition, we may have more difficulty maintaining our prior rate of growth of revenue or recent levels of profitability and cash flow. Our future success will depend upon various factors, including the strength of our brand image, the market success of our current and future products, competitive conditions and our ability to manage increased revenue, if any, or implement our growth strategy. In addition, we anticipate significantly expanding our infrastructure and adding personnel in connection with our anticipated growth, which we expect will cause our selling, general and administrative expenses to increase in absolute dollars and as a percentage of revenue. Because these expenses are generally fixed, particularly in the short-to-medium term, our operating and financial results may be adversely impacted if we do not achieve our anticipated growth.
The sale of Convertible Senior Notes significantly increased our amount of long-term debt, and our financial condition and results of operations could be adversely affected if we do not efficiently manage our liabilities.
In June 2011, we issued $402.5 million aggregate principal amount of our 2.75% Convertible Senior Notes due in 2017 (the 2017 Notes). Additionally, in March 2016, we issued $650 million aggregate principal amount of our 2.25% Convertible Senior Notes due in 2021 (the 2021 Notes). Although we have repurchased a significant portion of the aggregate principal amount of the 2017 Notes, we continue to have a substantial amount of long-term debt as a result of the sale of the 2017 and 2021 Notes. Our maintenance of such debt could adversely affect our financial condition and results of operations.
In addition, there are a large number of shares of common stock reserved for issuance upon the potential conversion of our 2017 Notes and our 2021 Notes and the warrants that we issued as part of the related bond hedge transactions. The issuance of these shares may depress the market price of our common stock.
If we fail to comply with the covenants and other obligations under our credit facility, the lenders may be able to accelerate amounts owed under the facilities and may foreclose upon the assets securing our obligations.
In February 2016, we entered into a credit agreement with Bank of America, N.A., or Bank of America, that provides for secured revolving facility loans, multicurrency loan options and letters of credit in an aggregate amount of up to $150.0 million. The credit agreement also contains an expansion feature, which allows us to increase the aggregate principal amount of the credit facility provided we remain in compliance with the underlying financial covenants. All of our assets and the assets of our material domestic subsidiaries and certain material international subsidiaries are pledged as collateral under the credit facility (subject to customary exceptions) and each of our material domestic subsidiaries guarantee the credit facility. The covenants set forth in the credit agreement restrict, among other things, our ability to: create liens on assets, incur additional indebtedness, make investments, make acquisitions and other fundamental changes, sell and dispose of property or assets, pay dividends and other distributions, change the business conducted, engage in certain transactions with affiliates, enter into burdensome agreements, limit certain use of proceeds, amend organizational documents, change accounting policies or reporting practices, modify or terminate documents related to certain indebtedness, enter into sale and leaseback transactions, fund sanctions and use proceeds for any breach of anti-corruption laws. If we fail to comply with the covenants and our other obligations under the credit facility, Bank of America would be able to accelerate the required repayment of amounts due under the loan agreement and, if they are not repaid, could foreclose upon our assets securing our obligations under the credit facility.
34
We may need additional financing in the future to meet our capital needs or to make opportunistic acquisitions and such financing may not be available on favorable terms, if at all, and may be dilutive to existing stockholders.
In furtherance of our growth strategy and global expansion efforts, we intend to continue to invest in our business, including through acquisitions and strategic transactions. These investments will be expensive, and we may need to seek additional financing in the future to meet our capital needs. As of December 31, 2016, we had $153.6 million in cash and cash equivalents. Subsequent to December 31, 2016, we anticipate making a payment of $30.0 million to former stockholders of Ellipse Technologies under the merger agreement in connection with the acquisition of Ellipse Technologies. We may seek to raise capital from public and private debt and equity offerings, borrowings under our existing or future credit facilities or other sources. We may be unable to obtain any desired additional financing on terms favorable to us, if at all. If adequate funds are not available on acceptable terms, we may be unable to fund our expansion, successfully develop or enhance products or respond to competitive pressures, any of which could negatively affect our business. If we raise additional funds through the issuance of equity securities, our stockholders will experience dilution of their ownership interest. If we raise additional funds by issuing debt, we may be subject to limitations on our operations due to restrictive covenants. Additionally, our ability to make scheduled payments or refinance our obligations will depend on our operating and financial performance, which in turn is subject to prevailing economic conditions and financial, business and other factors beyond our control.
We could be subject to changes in tax rates, the adoption, evolution or change of new and/or amended U.S. or international tax legislation or exposure to additional tax liabilities.
We are subject to taxes in the United States and numerous foreign jurisdictions, including the Netherlands, where a number of our subsidiaries are located. Significant judgment is required to determine and estimate our worldwide tax liabilities. Due to economic and political conditions, tax rates in various jurisdictions may be subject to significant change. Our effective income tax rates have been, and could in the future be adversely affected by changes in tax laws or interpretations of those tax laws, by stock-based compensation and other non-deductible expenses, by changes in the mix of earnings in countries with differing statutory tax rates, or by changes in the valuation of our deferred tax assets and liabilities.
As part of our globalization initiative, we have centralized international operations in the Netherlands and have entered into intercompany transfer pricing arrangements, including the licensing of intangibles. We intend to continue to streamline our international operations to better align with and support our international business activities and markets through changes in how we develop, license and use our intangible property and how we structure our international procurement and customer service functions. We anticipate a negative impact to our effective tax rate over the next several years while achieving an overall reduction to our effective tax rate over the longer term. There can be no assurance that the taxing authorities of the jurisdictions in which we operate or will operate or to which we are otherwise deemed to have sufficient tax presence will not challenge the tax benefits that we ultimately expect to realize as a result of our international structure. In addition, future changes to U.S. or non-U.S. tax laws, including proposed legislation to reform the U.S. taxation of international business, could negatively impact the anticipated tax benefits of our international structure. Any long term benefits to our tax rate will also depend on our ability to achieve our anticipated international growth projections and to operate our business in a manner consistent with our international structure and intercompany transfer pricing arrangements. If we do not operate our business consistent with the structure and applicable tax provisions, we may fail to achieve the financial efficiencies that we anticipate as a result of the structure and our future operating results and financial condition may be negatively impacted.
Finally, we may be subject in the future to examination of our income tax returns by the Internal Revenue Service and other taxing authorities which may result in the assessment of additional income taxes. We regularly assess the likelihood of an adverse outcome resulting from these examinations to determine the adequacy of our provision for taxes. There can be no assurance as to the outcome of these examinations. If our effective tax rates were to increase, particularly in the U.S. or the Netherlands or if the ultimate determination of our taxes owed is for an amount in excess of amounts previously accrued, our financial condition, cash flows or results of operations could be adversely affected.
35
Risks Related to the Securities Markets and Ownership of Our Common Stock
We expect that the price of our common stock will fluctuate substantially, potentially adversely affecting the ability of investors to sell their shares.
The market price of our common stock may be subject to wide fluctuations, which may negatively affect the ability of investors to sell our shares at consistent prices. Fluctuation in the stock price may occur due to many factors, including, without limitation:
|
|
• |
general market conditions and other factors related to the economy or otherwise, including factors unrelated to our operating performance or the operating performance of our competitors; |
|
|
• |
people’s expectations, favorable or unfavorable, as to the likely unit growth of the spine sector; |
|
|
• |
negative stock market reactions to the results of litigation; |
|
|
• |
negative publicity regarding spine surgeon’s practices or outcomes, whether warranted or not, that cast the sector in a negative light; |
|
|
• |
the introduction of new products or product enhancements by us or our competitors; |
|
|
• |
changes in the availability of third-party reimbursement in the United States or other countries; |
|
|
• |
disputes or other developments with respect to intellectual property rights or other potential legal actions; |
|
|
• |
our ability to develop, obtain regulatory clearance or approval for, and market new and enhanced products on a timely basis; |
|
|
• |
quarterly variations in our or our competitor’s results of operations; |
|
|
• |
sales of large blocks of our common stock, including sales by our executive officers and directors; |
|
|
• |
announcements of technological or medical innovations for the treatment of spine pathology; |
|
|
• |
changes in governmental regulations or in the status of our regulatory approvals, clearances or applications; |
|
|
• |
the acquisition or divestiture of businesses, products, assets or technology by us or by our competitors; |
|
|
• |
litigation (including intellectual property litigation) and any associated negative verdicts or ruling; |
|
|
• |
announcements of actions by the FDA or other regulatory agencies; and |
|
|
• |
changes in earnings or operating margin estimates or recommendations by us or by securities analysts. |
Anti-takeover provisions in our organizational documents and Delaware law may discourage or prevent a change of control, even if an acquisition would be beneficial to our stockholders, which could affect our stock price adversely and prevent attempts by our stockholders to replace or remove our current management.
Our certificate of incorporation and bylaws contain provisions that could delay or prevent a change of control of our company or changes in our board of directors that our stockholders might consider favorable. Some of these provisions:
|
|
• |
authorize the issuance of preferred stock which can be created and issued by the board of directors without prior stockholder approval, with rights senior to those of the common stock; |
|
|
• |
provide for a classified board of directors, with each director serving a staggered three-year term; |
|
|
• |
provide that our stockholders may remove our directors only for cause; |
|
|
• |
prohibit our stockholders from filling board vacancies, calling special stockholder meetings, or taking action by written consent; |
|
|
• |
prohibit our stockholders from making certain changes to our certificate of incorporation or bylaws except with 66 2/3% stockholder approval; and |
|
|
• |
require advance written notice of stockholder proposals and director nominations. |
In addition, we are subject to the provisions of Section 203 of the Delaware General Corporation Law, which may prohibit certain business combinations with stockholders owning 15% or more of our outstanding voting stock. These and other provisions in our certificate of incorporation, our bylaws and Delaware law could make it more difficult for stockholders or potential acquirers to obtain control of our board of directors or initiate actions that are opposed by our then-current board of directors, including delay or impede a merger, tender offer, or proxy contest involving our company. Any delay or prevention of a change of control transaction or changes in our board of directors could cause the market price of our common stock to decline.
36
We do not intend to pay cash dividends.
We have never declared or paid cash dividends on our capital stock. We currently intend to retain all available funds and any future earnings for use in the operation and expansion of our business and do not anticipate paying any cash dividends in the foreseeable future. In addition, the terms of any future debt or credit facility may preclude us from paying any dividends. As a result, capital appreciation, if any, of our common stock will be our stockholders’ source of potential gain for the foreseeable future.
Item 1B.Unresolved Staff Comments
None.
The following table sets forth our principal properties as of December 31, 2016, all of which are leased unless otherwise noted as owned:
|
Primary Use |
Square Footage |
|
|
Location |
|
|
Manufacturing facilities (2) |
|
180,000 |
|
|
West Carrollton, OH |
|
Corporate office and training facilities (1) |
|
154,000 |
|
|
San Diego, CA |
|
Fulfillment and warehouse operations (2) |
|
100,000 |
|
|
Memphis, TN |
|
Office facilities |
|
53,000 |
|
|
Aliso Viejo, CA |
|
Office facilities and warehouse |
|
25,000 |
|
|
Japan |
|
Office facilities and warehouse |
|
23,000 |
|
|
Germany |
|
Office facilities |
|
12,000 |
|
|
Ann Arbor, MI |
|
Office facilities |
|
11,000 |
|
|
Australia |
|
Office facilities |
|
11,000 |
|
|
Columbia, MD |
|
Office facilities |
|
11,000 |
|
|
Netherlands |
|
Office facilities |
|
10,000 |
|
|
Brazil |
|
Office facilities |
|
7,000 |
|
|
UK |
|
|
|
|
|
|
|
|
(1) Our corporate headquarters |
|
|
|
|
|
|
(2) Owned |
|
|
|
|
|
For a description of our material pending legal proceedings, refer to “Note 11. Contingencies” in the Notes to Consolidated Financial Statements included in this Annual Report.
Item 4.Mine Safety Disclosures
Not applicable.
PART II
Item 5.Market for the Registrant’s Common Equity, Related Stockholder Matters and Issuer Purchases of Equity Securities
Common Stock Market Price
Our common stock is traded on the NASDAQ Global Select Market under the symbol “NUVA.” The following table presents the high and low per share sale prices of our common stock during the periods indicated, as reported on NASDAQ.
|
|
|
High |
|
|
|
|
Low |
|
||
|
2015 |
|
|
|
|
|
|
|
|
|
|
|
First Quarter |
|
$ |
51.23 |
|
|
|
|
$ |
42.64 |
|
|
Second Quarter |
|
|
51.25 |
|
|
|
|
|
41.52 |
|
|
Third Quarter |
|
|
56.61 |
|
|
|
|
|
46.06 |
|
|
Fourth Quarter |
|
|
55.98 |
|
|
|
|
|
44.22 |
|
|
2016 |
|
|
|
|
|
|
|
|
|
|
|
First Quarter |
|
$ |
55.53 |
|
|
|
|
$ |
36.81 |
|
|
Second Quarter |
|
|
60.09 |
|
|
|
|
|
47.87 |
|
|
Third Quarter |
|
|
69.00 |
|
|
|
|
|
59.02 |
|
|
Fourth Quarter |
|
|
69.50 |
|
|
|
|
|
56.70 |
|
37
We had approximately 86 stockholders of record as of January 31, 2017. We believe that the number of beneficial owners is substantially greater than the number of record holders because a large portion of our common stock is held of record through brokerage firms in “street name.”
Recent Sales of Unregistered Securities
During the fourth quarter of 2016, we did not issue any securities that were not registered under the Securities Act of 1933, as amended (the Securities Act).
Dividend Policy
We have never declared or paid any cash dividends on our capital stock. We currently intend to retain future earnings, if any, for development of our business and do not anticipate that we will declare or pay cash dividends on our capital stock in the foreseeable future.
Equity Compensation Plan Information
The following table provides certain information with respect to all of our compensation plans in effect as of December 31, 2016:
|
Plan Category |
|
(A) Number of Securities to be Issued Upon Exercise of Outstanding Options, Warrants and Rights |
|
|
(B) Weighted Average Exercise Price of Outstanding Options, Warrants and Rights |
|
|
(C) Number of Securities Remaining Available for Future Issuance Under Equity Compensation Plans (excluding securities reflected in column(A)) |
|
|
|||
|
Equity Compensation Plans approved by stockholders |
|
|
2,559,805 |
|
(1) |
$ |
34.93 |
|
|
|
5,781,029 |
|
(2)(3) |
|
Equity Compensation Plans not approved by stockholders |
|
|
— |
|
|
|
— |
|
|
|
— |
|
|
|
Total |
|
|
2,559,805 |
|
|
$ |
34.93 |
|
|
|
5,781,029 |
|
|
|
|
(1) |
Consists of shares subject to outstanding stock options, restricted stock units and performance restricted stock units under the NuVasive 2004 Amended and Restated Equity Incentive Plan, the NuVasive 2014 Equity Incentive Plan, and the Ellipse Technologies 2015 Incentive Award Plan, some of which are vested and some of which remain subject to the vesting and/or performance criteria of the respective equity award. |
|
|
|
(2) |
Consists of shares available for future issuance under the NuVasive 2014 Equity Incentive Plan, the Ellipse Technologies 2015 Incentive Award Plan, and the Amended and Restated 2004 Employee Stock Purchase Plan (ESPP). As of December 31, 2016, an aggregate of 2,958,287 shares of common stock were available for issuance under the NuVasive 2014 Equity Incentive Plan, 1,425,024 shares of common stock were available for issuance under the Ellipse Technologies 2015 Incentive Award Plan, and 1,397,718 shares of common stock were available for issuance under the 2004 Amended and Restated Employee Stock Purchase Plan. |
|
|
|
(3) |
The NuVasive 2004 Amended and Restated Equity Incentive Plan terminated in February 2014, upon the tenth anniversary of its effective date, and we are no longer granting awards under that plan. However, awards granted under the plan will remain outstanding until they are exercised, issued, terminated, cancelled or they expire. Pursuant to the terms of the plan, shares subject to awards granted under the NuVasive 2004 Amended and Restated Equity Incentive Plan may be utilized for future grants of awards under the NuVasive 2014 Equity Incentive Plan, to the extent such awards are terminated, cancelled or they expire, or shares subject thereto are withheld to cover taxes. During the year ended December 31, 2016, we registered 2,200,637 of such shares for re-use under the NuVasive 2014 Equity Incentive Plan. |
|
38
The following graph compares the cumulative total stockholder return data on our common stock with the cumulative return of (i) The NASDAQ Stock Market Composite Index, and (ii) NASDAQ Medical Equipment Index over the five year period ending December 31, 2016. The graph assumes that $100 was invested on December 31, 2011 in our common stock and in each of the comparative indices. The stock price performance on the following graph is not necessarily indicative of future stock price performance.
The following graph and related information shall not be deemed “soliciting material” or be deemed to be “filed” with the Commission, nor shall such information be incorporated by reference into any future filing, except to the extent that we specifically incorporate it by reference into such filing.
COMPARISON OF 5 YEAR CUMULATIVE TOTAL RETURN*
AMONG NUVASIVE, INC.,
THE NASDAQ COMPOSITE INDEX
AND THE NASDAQ MEDICAL EQUIPMENT INDEX
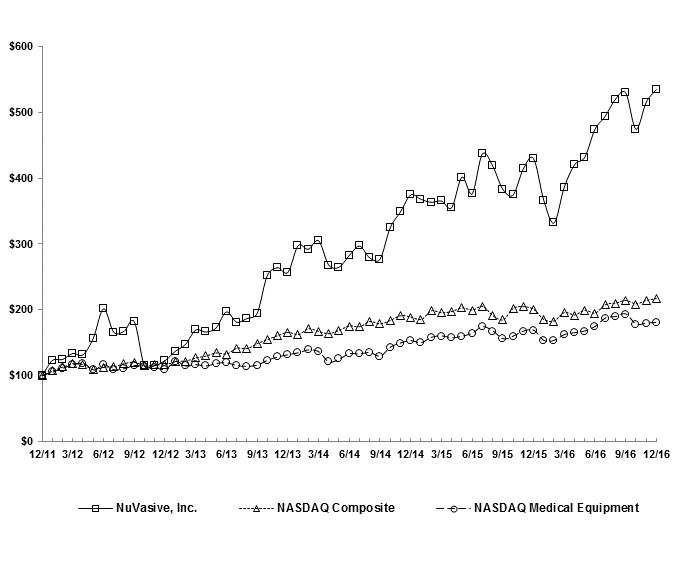
|
* |
$100 invested on December 31, 2011 in stock or index, including reinvestment of dividends. |
39
The selected consolidated financial data set forth in the table below has been derived from our audited financial statements. The data set forth below should be read in conjunction with “Management’s Discussion and Analysis of Financial Condition and Results of Operations” and our audited financial statements and notes thereto appearing elsewhere in this report.
|
|
|
Year Ended December 31, |
|
|||||||||||||||||
|
|
|
2016 (1) |
|
|
2015 |
|
|
2014 |
|
|
2013 |
|
|
2012 |
|
|||||
|
|
|
(In thousands, except per share amounts) |
|
|||||||||||||||||
|
Statement of Operations Data: |
|
|
|
|
|
|
|
|
|
|
|
|
|
|
|
|
|
|
|
|
|
Total revenues |
|
$ |
962,072 |
|
|
$ |
811,113 |
|
|
$ |
762,415 |
|
|
$ |
685,173 |
|
|
$ |
620,255 |
|
|
Gross profit |
|
|
721,979 |
|
|
|
616,634 |
|
|
|
580,057 |
|
|
|
504,689 |
|
|
|
466,846 |
|
|
Consolidated net income (loss) |
|
|
35,426 |
|
|
|
65,290 |
|
|
|
(17,496 |
) |
|
|
6,985 |
|
|
|
2,442 |
|
|
Net income (loss) attributable to NuVasive, Inc. |
|
|
37,147 |
|
|
|
66,291 |
|
|
|
(16,720 |
) |
|
|
7,902 |
|
|
|
3,144 |
|
|
Net income (loss) per share attributable to NuVasive, Inc.: |
|
|
|
|
|
|
|
|
|
|
|
|
|
|
|
|
|
|
|
|
|
Basic |
|
$ |
0.74 |
|
|
$ |
1.36 |
|
|
$ |
(0.36 |
) |
|
$ |
0.18 |
|
|
$ |
0.07 |
|
|
Diluted |
|
$ |
0.69 |
|
|
$ |
1.26 |
|
|
$ |
(0.36 |
) |
|
$ |
0.17 |
|
|
$ |
0.07 |
|
|
|
|
December 31, |
|
|||||||||||||||||
|
|
|
2016 (1) |
|
|
2015 |
|
|
2014 |
|
|
2013 |
|
|
2012 |
|
|||||
|
|
|
(In thousands, except per share amounts) |
|
|||||||||||||||||
|
Balance Sheet Data: |
|
|
|
|
|
|
|
|
|
|
|
|
|
|
|
|
|
|
|
|
|
Working capital |
|
$ |
332,946 |
|
|
$ |
603,210 |
|
|
$ |
490,972 |
|
|
$ |
418,856 |
|
|
$ |
349,474 |
|
|
Total assets |
|
|
1,570,804 |
|
|
|
1,289,649 |
|
|
|
1,343,459 |
|
|
|
1,179,568 |
|
|
|
1,163,785 |
|
|
Senior Convertible Notes (net of current portion) |
|
|
564,412 |
|
|
|
376,542 |
|
|
|
360,746 |
|
|
|
346,060 |
|
|
|
332,404 |
|
|
Non-current liabilities (excluding convertible notes) |
|
|
63,371 |
|
|
|
111,288 |
|
|
|
119,456 |
|
|
|
111,478 |
|
|
|
119,528 |
|
|
Non-controlling interests (2) |
|
|
— |
|
|
|
— |
|
|
|
— |
|
|
|
— |
|
|
|
10,003 |
|
|
Total equity (3) |
|
|
700,524 |
|
|
|
702,202 |
|
|
|
648,358 |
|
|
|
604,878 |
|
|
|
537,575 |
|
|
|
(1) |
The selected consolidated financial data set forth for the year ended December 31, 2016 includes the operations and results of Ellipse Technologies, Inc., BNN Holdings Corp. and our other acquisitions from their respective dates of acquisition. See Note 5 to the Consolidated Financial Statements included in this Annual Report for further discussion. |
|
|
|
(2) |
On June 13, 2013, the non-controlling interest in Progentix Orthobiology, B.V. became non-redeemable and therefore was reclassified out of mezzanine equity to its own component of total equity within the Company’s Consolidated Balance Sheet. |
|
|
|
(3) |
The Company elected to early adopt ASU 2016-09 in the second quarter of 2016. As a result, the Company recorded a modified retrospective adjustment of $16.6 million to deferred tax assets and accumulated deficit as of January 1, 2016. See Note 1 to the Consolidated Financial Statements included in this Annual Report for further discussion. |
|
40
Item 7.Management’s Discussion and Analysis of Financial Condition and Results of Operations
As noted earlier, this Annual Report, including the following discussion and analysis, may contain forward-looking statements that involve risks, uncertainties, assumptions and other factors which, if they do not materialize or prove correct, could cause our results to differ from historical results or those expressed or implied by such forward-looking statements. Please review this Annual Report and the following discussion and analysis in light of the forward-looking statements provisions outlined at the outset of Part I.
You should read the following discussion and analysis of our financial condition and results of operations in conjunction with the Consolidated Financial Statements and the Notes to those statements included in this Annual Report.
Overview
We are a leading medical device company in the global spine surgery market, focused on developing minimally-disruptive surgical products and procedurally-integrated solutions for spine surgery. Currently, our marketed product portfolio is focused on applications for spine fusion surgery, including biologics used to aid in the spinal fusion process. For the year ended December 31, 2016, we generated global revenues of $962.1 million, including sales in over 40 countries.
Our principal product offering includes a minimally-disruptive surgical platform called Maximum Access Surgery, or MAS. The MAS platform combines three categories of solutions that collectively minimize soft tissue disruption during spine fusion surgery, provide maximum visualization and are designed to enable safe and reproducible outcomes for the surgeon and the patient. The platform includes our proprietary software-driven nerve detection and avoidance systems, NVM5, and Intraoperative Monitoring, or IOM, services and support; MaXcess, an integrated split-blade retractor system; and a wide variety of specialized implants and biologics. Many of our products, including the individual components of our MAS platform can also be used in open or traditional spine surgery. Our spine surgery product line offerings, which include products for the thoracolumbar and the cervical spine, are primarily used to enable surgeon access to the spine to perform restorative and fusion procedures in a minimally-disruptive fashion. In May 2015, we launched Integrated Global Alignment, or iGA, in which products and computer assisted technology under our MAS platform help achieve more precise spinal alignment. Our biologics products, which are used to aid in the spinal fusion process or bone healing process, include allograft (donated human tissue) and synthetic offerings.
We believe our MAS platform and its related offerings provide a unique and comprehensive solution for the safe and reproducible minimally-disruptive surgical treatment of spine disorders by enabling surgeons to access the spine in a manner that affords both direct visualization and detection and avoidance of critical nerves. The fundamental difference between our MAS platform, which is sometimes referred to in the industry as “minimally invasive surgery” or “MIS”, is the ability to customize safe and reproducible access to the spine while allowing surgeons to continue to use instruments that are familiar to them and effective during surgery. Accordingly, the MAS platform does not force surgeons to reinvent or learn new approaches that add complexity and undermine safety, ease of use and/or efficacy. We have dedicated and continue to dedicate significant resources toward training spine surgeons around the world; both those who are new to our MAS and other product platforms, as well as ongoing education for MAS-trained surgeons attending advanced courses. An important ongoing objective of ours has been to maintain a leading position in access and nerve avoidance, as well as to pioneer and remain the ongoing leader in minimally invasive spine surgery. Our MAS platform, with the unique advantages provided by our nerve monitoring systems, enables an innovative lateral procedure known as eXtreme Lateral Interbody Fusion, or XLIF, in which surgeons access the spine for a fusion procedure from the side of the patient’s body, rather than from the front or back. It has been demonstrated clinically that XLIF and other procedures facilitated by our MAS platform decrease trauma and blood loss, and lead to faster overall patient recovery times compared to open spine surgery.
41
We continue to focus significant research and development efforts to expand our MAS and other product platforms and advance the applications of our unique technology into procedurally-integrated surgical solutions that improve clinical and economic outcomes. During 2016, we acquired businesses and technologies to further expand our product and services offerings and drive growth in our business:
|
|
• |
In February 2016, we acquired Ellipse Technologies, Inc., or Ellipse Technologies, which developed and commercialized expandable growing rod implant systems that can be non-invasively lengthened following implantation with precise, incremental adjustments via an external remote controller using magnetic technology called MAGnetic External Control, or MAGEC. Following the acquisition, these product offerings are now sold by our NuVasive Specialized Orthopedics division, or NSO. |
|
|
• |
In July 2016, we acquired BNN Holdings Corp., or BNN Holdings, which through its subsidiaries and affiliates, owns and operates Biotronic NeuroNetwork, a patient-centric healthcare organization that provides intraoperative neurophysiological monitoring services to surgeons and healthcare facilities across the U.S. Following the acquisition, we combined the service offerings of Biotronic NeuroNetwork with our existing IOM business, Impulse Monitoring, Inc., under the newly created division NuVasive Clinical Services, or NCS. |
|
|
• |
In September 2016, we acquired the LessRay software technology suite, which is designed to be integrated into current surgeon workflow and utilizes an algorithm to drive image registration and help surgeons and hospital staff manage radiation exposure using low-dose image quality enhancement. This technology is expected to become an integral component of our IOM service and MAS platform. |
We expect to continue to pursue business and technology acquisition targets and strategic partnerships.
Revenues and Operations
To date, the majority of our revenues are derived from the sale of implants, biologics and disposables and we expect this trend to continue for the foreseeable future. Additionally, with our acquisition of BNN Holdings on July 1, 2016, we expect our IOM service and support revenue to increase compared to previous periods. We loan our proprietary software-driven nerve monitoring systems and surgical instrument sets at no cost to surgeons and hospitals that purchase disposables and implants for use in individual procedures. In addition, we often place our proprietary software-driven nerve monitoring systems, MaXcess and other MAS instrument sets with hospitals for an extended period at no up-front cost to them. Our implants, biologics and disposables are currently sold and shipped from our distribution and warehousing operations. We generally recognize revenue for implants, biologics and disposables upon receiving acknowledgement of a purchase order and upon completion of delivery. Our service revenue is recognized in the period the service is performed for the amount of payment we expect to receive. We sell MAS instrument sets, MaXcess devices, and our proprietary software-driven nerve monitoring systems, however this does not make up a material part of our business.
The majority of our operations are located and the majority of our sales have been generated in the United States. We sell our products in the United States through a sales force comprised primarily of exclusive independent sales agents and directly-employed sales representatives, both engaged to sell only NuVasive products. Our sales force provides a delivery and consultative service to our surgeon and hospital customers and is compensated based on sales and product placements in their territories. Sales force commissions are reflected in the sales, marketing and administrative operating expense line item within our statement of operations. We continue to invest in international expansion with the focus on European, Asia-Pacific and Latin American markets. Our international sales force is comprised of directly-employed sales personnel, independent sales agents, as well as exclusive and non-exclusive independent third-party distributors. As of December 31, 2016, we did not have any significant backlog.
Critical Accounting Policies
Our discussion and analysis of our financial condition and results of operations is based upon our audited Consolidated Financial Statements, which have been prepared in accordance with generally accepted accounting principles in the United States (GAAP). The preparation of these financial statements requires us to make estimates and judgments that affect the reported amounts of assets, liabilities, revenues and expenses. On an ongoing basis, we evaluate our estimates including those related to revenue recognition, bad debts, inventories, valuation of financial instruments, goodwill, intangibles, property and equipment, stock-based compensation, income taxes, and legal proceedings. We base our estimates on historical experience and on various other assumptions we believe to be reasonable under the circumstances, the results of which form the basis for making judgments about the carrying values of assets and liabilities not readily apparent from other sources. Actual results may differ from these estimates.
We believe the following accounting policies to be critical to the judgments and estimates used in the preparation of our Consolidated Financial Statements.
42
In accordance with the Commission’s guidance, we recognize revenue when all four of the following criteria are met: (i) persuasive evidence that an arrangement exists; (ii) delivery of the products and/or services has occurred; (iii) the selling price is fixed or determinable; and (iv) collectability is reasonably assured. Specifically, revenue from the sale of implants and disposables is generally recognized upon acknowledgement of a purchase order from the hospital indicating product use or implantation or upon shipment to third-party customers who immediately accept title. Revenue from our monitoring services is recognized in the period the service is performed for the amount of payment we expect to receive. Revenue from the sale of our instrument sets is recognized upon receipt of a purchase order and the subsequent shipment to customers who immediately accept title. Instrument sales account for an immaterial amount of annual sales.
Allowance for Doubtful Accounts and Sales Return Reserve
We maintain an allowance for doubtful accounts for estimated losses resulting from the inability of our customers to make required payments. The allowance for doubtful accounts is reviewed quarterly and is estimated based on the aging of account balances, collection history and known trends with current customers and in the economy in general. As a result of this review, the allowance is adjusted on a specific identification basis for significant accounts and a general reserve approach for non-significant accounts. We also review the overall quality and age of those invoices not specifically identified. In determining the provision for invoices not specifically reviewed, we analyze historical collection experience and current economic trends. An increase to the allowance for doubtful accounts results in a corresponding charge to sales, marketing and administrative expenses. If the historical data used to calculate the allowance provided for doubtful accounts does not reflect our future ability to collect outstanding receivables or if the financial condition of customers were to deteriorate, resulting in impairment of their ability to make payments, an increase in the provision for doubtful accounts may be required. We maintain a relatively large customer base that mitigates the risk of concentration with any one particular customer. Historically, our reserves have been adequate to cover losses.
In addition, we establish a reserve for estimated sales returns and pricing adjustments that is recorded as a reduction to revenue. This reserve is maintained to account for future return of products or pricing adjustments on products sold in the current period. This reserve is reviewed quarterly and is estimated based on an analysis of our historical experience and expected future trends. Historically, our reserves have been adequate to account for returns and pricing adjustments.
Inventory
Inventory consists primarily of purchased finished goods, which includes specialized implants and disposables, and is stated at the lower of cost or market determined by utilizing a standard cost method which approximates the weighted average cost. We review the components of our inventory on a periodic basis for excess and obsolescence and record a reserve for the identified items.
Excess and Obsolete Inventory
We provide an inventory reserve for estimated obsolescence and excess inventory based upon historical turnover and assumptions about future demand for our products and market conditions. Our allograft products have shelf lives ranging from two to five years and are subject to demand fluctuations based on the availability and demand for alternative products. Our inventory, which consists primarily of disposables and specialized implants, is at risk of obsolescence following the introduction and development of new or enhanced products. Our estimates and assumptions for excess and obsolete inventory are reviewed and updated on a quarterly basis. The estimates we use for demand are also used for near-term capacity planning and inventory purchasing and are consistent with our revenue forecasts. Increases in the reserve for excess and obsolete inventory result in a corresponding charge to cost of goods sold. Historically our reserves have been adequate to cover losses.
A stated goal of our business is to focus on continual product innovation and to obsolete our own products. While we believe this provides a competitive edge, it also results in the risk that our products and related capital instruments will become obsolete prior to sale or to the end of their anticipated useful lives.
Fair Value of Financial Instruments
ASC Topic 820, Fair Value Measurements and Disclosures, defines fair value and requires us to establish a framework for measuring fair value and disclosure about fair value measurements. The framework requires the valuation of assets and liabilities subject to fair value measurements using a three tiered approach and fair value measurement be classified and disclosed in one of the following three categories. Inputs to valuation techniques are observable or unobservable. Observable inputs reflect market data obtained from independent sources, while unobservable inputs reflect our market assumptions.
Level 1: Quoted prices (unadjusted) in active markets that are accessible at the measurement date for assets or liabilities.
Level 2: Observable prices that are based on inputs not quoted on active markets, but corroborated by market data.
Level 3: Unobservable inputs are used when little or no market data is available.
Carrying value of the financial instruments measured and classified within Level 1 is based on quoted prices.
43
The types of instruments that trade in markets that are not considered to be active, but are valued based on quoted market prices, broker or dealer quotations, or alternative pricing sources with reasonable levels of price transparency are generally classified within Level 2 of the fair value hierarchy.
Certain contingent consideration liabilities are classified within Level 3 of the fair value hierarchy because they use unobservable inputs. For those liabilities, fair value is determined using a probability-weighted discounted cash flow model, the significant inputs which are not observable in the market.
Valuation of Goodwill and Intangible Assets with Indefinite Lives
Our goodwill represents the excess of the cost over the fair value of net assets acquired from our business combinations. The determination of the value of goodwill and intangible assets arising from business combinations and asset acquisitions requires extensive use of accounting estimates and judgments to allocate the purchase price to the fair value of the net tangible and intangible assets acquired, including capitalized in-process research and development, or IPR&D. Intangible assets acquired in a business combination that are used for IPR&D activities are considered indefinite lived until the completion or abandonment of the associated research and development efforts. Upon reaching the end of the relevant research and development project, we will amortize the acquired in-process research and development over its estimated useful life or expense the acquired in-process research and development should the research and development project be unsuccessful with no future alternative use.
Goodwill and IPR&D are not amortized; however, they are assessed for impairment using fair value measurement techniques on an annual basis or more frequently if facts and circumstance warrant such a review. The goodwill or IPR&D are considered to be impaired if we determine that the carrying value of the reporting unit or IPR&D exceeds its respective fair value.
We perform our goodwill impairment analysis at the reporting unit level, which aligns with our reporting structure and availability of discrete financial information. We perform our annual impairment analysis by either doing a qualitative assessment of a reporting unit’s fair value from the last quantitative assessment to determine if there is potential impairment, or comparing a reporting unit’s estimated fair value to its carrying amount. We may do a qualitative assessment when the results of the previous quantitative test indicated the reporting unit’s estimated fair value was significantly in excess of the carrying value of its net assets and we do not believe there have been significant changes in the reporting unit’s operations that would significantly decrease its estimated fair value or significantly increase its net assets. If a quantitative assessment is performed the evaluation includes management estimates of cash flow projections based on internal future projections and/or use of a market approach by looking at market values of comparable companies. Key assumptions for these projections include revenue growth, future gross and operating margin growth, and its weighted cost of capital and terminal growth rates. The revenue and margin growth is based on increased sales of new and existing products as we maintain our investment in research and development. Additional assumed value creators may include increased efficiencies from capital spending. The resulting cash flows are discounted using a weighted average cost of capital. Operating mechanisms and requirements to ensure that growth and efficiency assumptions will ultimately be realized are also considered in the evaluation, including timing and probability of regulatory approvals for our products to be commercialized. Our market capitalization is also considered as a part of this analysis.
Our annual evaluation for impairment of goodwill consists of two reporting units; the Progentix reporting unit and the remainder of the Company. In accordance with our policy, we completed our most recent annual evaluation for impairment as of October 1, 2016 and determined that no impairment existed, and it was determined that no reporting unit of the Company was at risk of impairment when assessing the unit’s fair value compared to its carrying value. In addition, no indicators of impairments were noted through December 31, 2016 and consequently, no impairment charge has been recorded during the year.
Valuation of Intangible Assets
Our intangible assets are comprised primarily of purchased technology, customer relationships, manufacturing know-how and trade secrets, and trade name and trademarks. We make significant judgments in relation to the valuation of intangible assets resulting from business combinations and asset acquisitions.
Intangible assets are amortized on a straight-line basis over their estimated useful lives of 1 to 17 years. We base the useful lives and related amortization or depreciation expense on the period of time we estimate the assets will generate revenues or otherwise be used by the Company. We also periodically review the lives assigned to our intangible assets to ensure that our initial estimates do not exceed any revised estimated periods from which we expect to realize cash flows from the technologies. If a change were to occur in any of the above-mentioned factors or estimates, the likelihood of a material change in our reported results would increase.
44
We evaluate our intangible assets with finite lives for indications of impairment whenever events or changes in circumstances indicate that the carrying value may not be recoverable. Factors that could trigger an impairment review include significant under-performance relative to expected historical or projected future operating results, significant changes in the manner of our use of the acquired assets or the strategy for our overall business or significant negative industry or economic trends. If this evaluation indicates that the value of the intangible asset may be impaired, we make an assessment of the recoverability of the net carrying value of the asset over its remaining useful life. If this assessment indicates that the intangible asset is not recoverable, based on the estimated undiscounted future cash flows of the technology over the remaining amortization period, we reduce the net carrying value of the related intangible asset to fair value and may adjust the remaining amortization period.
During the year ended December 31, 2014, we recorded an impairment charge of $10.7 million related to developed technology acquired from Cervitech in 2009. The primary factor contributing to this impairment charge was the reduction in management’s revenue estimate and the related decrease to the estimated cash flows for this technology.
Significant judgment is required in the forecasts of future operating results that are used in the discounted cash flow valuation models. It is possible that plans may change and estimates used may prove to be inaccurate. If our actual results, or the plans and estimates used in future impairment analyses, are lower than the original estimates used to assess the recoverability of these assets, we could incur additional impairment charges.
Valuation of Stock-Based Compensation
Stock-based compensation expense for equity-classified awards, principally related to restricted stock units, or RSUs, and performance restricted stock units, or PRSUs, is measured at the grant date based on the estimated fair value of the award and is recognized over the employee’s requisite service period on an accelerated basis. The fair value of equity instruments that are expected to vest is recognized and amortized over the requisite service period. We have granted awards with up to five year graded or cliff vesting terms (in each case, with service through the date of vesting being required). No exercise price or other monetary payment is required for receipt of the shares issued in settlement of the respective award; instead, consideration is furnished in the form of the participant’s service to the Company.
The fair value of RSUs including PRSUs with pre-defined performance criteria is based on the stock price on the date of grant whereas the expense for PRSU with pre-defined performance criteria is adjusted with the probability of achievement of such performance criteria at each period end. The fair value of the PRSUs that are earned based on the achievement of pre-defined market conditions for total shareholder return, is estimated on the date of grant using a Monte Carlo valuation model. The key assumptions in applying this model are an expected volatility and a risk-free interest rate.
Stock-based compensation expense is adjusted from the grant date to exclude expense for awards that are expected to be forfeited. The forfeiture estimate is adjusted as necessary through the vesting date so that full compensation cost is recognized only for awards that vest. We assess the reasonableness of the estimated forfeiture rate at least annually, with any change to be made on a cumulative basis in the period the estimated forfeiture rates change. We considered our historical experience of pre-vesting forfeitures on awards by each homogenous group of shareowners as the basis to arrive at our estimated annual pre-vesting forfeiture rates.
We estimate the fair value of stock options issued under our equity incentive plans and shares issued to shareowners under our employee stock purchase plan, or ESPP, using a Black-Scholes option-pricing model on the date of grant. The Black-Scholes option-pricing model incorporates various and highly sensitive assumptions including expected volatility, expected term and risk-free interest rates. The expected volatility is based on the historical volatility of our common stock over the most recent period commensurate with the estimated expected term of our stock options and ESPP which is derived from historical experience. The risk-free interest rate for periods within the contractual life of the option is based on the U.S. Treasury yield in effect at the time of grant. We have never declared or paid dividends and have no plans to do so in the foreseeable future.
Stock-based compensation expense was $26.9 million, $26.2 million, and $33.7 million for 2016, 2015, and 2014, respectively. Stock-based compensation expense for 2016 and 2015 was relatively consistent. Stock-based compensation expense decreased $7.5 million in 2015 compared to 2014. This decrease in 2015 was primarily attributed to an increase in award forfeitures, including several sizeable awards held by key executives that left the Company during 2015.
As of December 31, 2016, there was approximately $18.5 million and $29.5 million of unrecognized compensation expense for RSUs and PRSUs, respectively, which is expected to be recognized over a weighted-average period of approximately 2.0 years and 2.6 years, respectively. In addition, as of December 31, 2016, there was $0.8 million of unrecognized compensation expense for shares expected to be issued under the ESPP which is expected to be recognized through April 2017. There was no unrecognized amortization expense for stock options as of December 31, 2016.
Accounting for Income Taxes
The asset and liability approach is used to recognize deferred tax assets and liabilities for the expected future tax consequences of temporary differences between the carrying amounts and the tax bases of assets and liabilities. Tax law and rate changes are reflected in income in the period such changes are enacted. We include interest and penalties related to income taxes, including unrecognized tax benefits, within income tax expense.
45
Our income tax returns are based on calculations and assumptions that are subject to examination by the Internal Revenue Service and other tax authorities. In addition, the calculation of our tax liabilities involves dealing with uncertainties in the application of complex tax regulations. We recognize liabilities for uncertain tax positions based on a two-step process. The first step is to evaluate the tax position for recognition by determining if the weight of available evidence indicates that it is more likely than not that the position will be sustained on audit, including resolution of related appeals or litigation processes, if any. The second step is to measure the tax benefit as the largest amount that is more than 50% likely of being realized upon settlement. While we believe we have appropriate support for the positions taken on our tax returns, we regularly assess the potential outcomes of examinations by tax authorities in determining the adequacy of its provision for income taxes. We continually assess the likelihood and amount of potential adjustments and adjusts the income tax provision, income taxes payable and deferred taxes in the period in which the facts that give rise to a revision become known.
Significant judgment is required in determining our provision for income taxes, our deferred tax assets and liabilities and the valuation allowance recorded against our net deferred tax assets. Deferred tax assets and liabilities are determined using the enacted tax rates in effect for the years in which those tax assets are expected to be realized. A valuation allowance is established when it is more likely than not the future realization of all or some of the deferred tax assets will not be achieved. The evaluation of the need for a valuation allowance is performed on a jurisdiction-by-jurisdiction basis, and includes a review of all available positive and negative evidence. Factors reviewed include projections of pre-tax book income for the foreseeable future, determination of cumulative pre-tax book income after permanent differences, earnings history, and reliability of forecasting.
Based on our review, we concluded that it was more likely than not that we would be able to realize the benefit of our domestic and foreign deferred tax assets, with the primary exception of California, in the future. This conclusion was based on historical and projected operating performance, as well as our expectation that our operations will generate sufficient taxable income in future periods to realize the tax benefits associated with the deferred tax assets well within the statutory carryover periods. But, due to the inclusion of foreign losses, lower state apportionment, and the generation of research credits in California, we concluded that it is not more likely than not that we will be able to utilize our California deferred tax assets. Therefore, we have maintained a full valuation allowance on our California deferred tax assets as of December 31, 2016.
We will continue to assess the need for a valuation allowance on our deferred tax assets by evaluating both positive and negative evidence that may exist. Any adjustment to the net deferred tax asset valuation allowance would be recorded in the statement of operations for the period that the adjustment is determined to be required.
Legal Proceedings
We are involved in a number of legal actions arising out of the normal course of our business. The outcomes of these legal actions are not within our complete control and may not be known for prolonged periods of time. In some actions, the claimants seek damages as well as other relief, including injunctions barring the sale of products that are the subject of the lawsuit, that could require significant expenditures or result in lost revenues. In accordance with authoritative guidance, we disclose information regarding each material claim where the likelihood of a loss contingency is probable or reasonably possible. An estimated loss contingency is accrued in our financial statements if it is both probable that a liability has been incurred and the amount of the loss can be reasonably estimated. If a loss is reasonably possible and can be reasonably estimated, the estimated loss or range of loss is disclosed in the notes to the Consolidated Financial Statements. In most cases, significant judgment is required to estimate the amount and timing of a loss to be recorded. Our significant legal proceedings are discussed in Note 11 to the Consolidated Financial Statements included in this Annual Report.
The above listing is not intended to be a comprehensive list of all of our accounting policies. In many cases, the accounting treatment of a particular transaction is specifically dictated by GAAP. See our Consolidated Financial Statements and Notes thereto included in this Annual Report, which contain accounting policies and other disclosures required by GAAP.
46
Revenue
|
|
|
Year Ended December 31, |
|
|
2015 to 2016 |
|
|
2014 to 2015 |
|
|||||||||||||||||||
|
|
|
2016 |
|
|
2015 |
|
|
2014 |
|
|
$ Change |
|
|
% Change |
|
|
$ Change |
|
|
% Change |
|
|||||||
|
|
|
(Dollars in thousands) |
|
|
|
|
|
|
|
|
|
|
|
|
|
|
|
|
|
|||||||||
|
Spinal Hardware |
|
$ |
674,057 |
|
|
$ |
559,388 |
|
|
$ |
522,683 |
|
|
$ |
114,669 |
|
|
|
20 |
% |
|
$ |
36,705 |
|
|
|
7 |
% |
|
Surgical Support |
|
|
288,015 |
|
|
|
251,725 |
|
|
|
239,732 |
|
|
|
36,290 |
|
|
|
14 |
% |
|
|
11,993 |
|
|
|
5 |
% |
|
Total Revenue |
|
$ |
962,072 |
|
|
$ |
811,113 |
|
|
$ |
762,415 |
|
|
$ |
150,959 |
|
|
|
19 |
% |
|
$ |
48,698 |
|
|
|
6 |
% |
Our spinal hardware product line offerings include our implants and fixation products, and following the acquisition of Ellipse Technologies, include the MAGEC-EOS spinal bracing and lengthening system and the PRECICE limb lengthening system. Our surgical support product line offerings include IOM services, disposables and biologics, all of which are used to aid spinal surgery.
The continued adoption of minimally invasive procedures for spine has led to the expansion of our procedure volume. In addition, increased market acceptance in our international markets contributed to the increase in revenues for the periods presented. We expect continued adoption of our innovative minimally invasive procedures and deeper penetration into existing accounts and international markets as our sales force executes on our strategy of selling the full mix of our products and services. However, the continued consolidation and increased purchasing power of our hospital customers and group purchasing organizations, the continued existence of physician-owned distributorships, recent changes in the public and private insurance markets regarding reimbursement, and ongoing policy and legislative changes in the United States have created less predictability in the lumbar portion of the spine market and have limited the domestic spine market’s procedural growth rate. Accordingly, we believe that our growth in revenue in 2017 will come primarily from share gains in the shift toward less invasive spinal surgery, revenue from new products and services, and international growth.
Our total revenues increased $151.0 million in 2016 compared to 2015 and $48.7 million in 2015 compared to 2014, representing total revenue growth of 19% and 6%, respectively. To date, foreign currency fluctuations have not materially impacted our overall revenues as a percentage of growth year over year.
Revenue from our spinal hardware product line offerings increased $114.7 million, or 20%, in 2016 compared to 2015. Revenue associated with our 2016 acquisitions accounted for approximately 11% of the increase in spinal hardware revenue for the year ended December 31, 2016 as compared to 2015, which included a $4.8 million purchase order from an organization established by certain former stockholders of Ellipse Technologies. See Note 4 to the Consolidated Financial Statements included in this Annual Report for further discussion on the purchase order. Product volume for our spinal hardware business, excluding 2016 acquisitions, increased our revenue by approximately 11%, offset by unfavorable changes in price of approximately 2% for the year ended December 31, 2016 as compared to 2015. Foreign currency fluctuation from 2015 to 2016 did not have a material impact on spinal hardware revenue.
Revenue from our spinal hardware product line offerings increased $36.7 million, or 7%, in 2015 compared to 2014 as the result of increased product volume of approximately 11%, offset by unfavorable changes of approximately 2% in both price and foreign currency fluctuation, for the year ended December 31, 2015 as compared to 2014.
Revenue from our surgical support product line offerings increased $36.3 million, or 14%, in 2016 compared to 2015. Revenue associated with our 2016 acquisitions accounted for approximately 11% of the increase in surgical support revenue for the year ended December 31, 2016 as compared to 2015. Product and service volume for our surgical support business, excluding 2016 acquisitions, increased our revenue by approximately 4%, offset by unfavorable changes in price of approximately 1% compared to the same period in 2015. Foreign currency fluctuation from 2015 to 2016 did not have a material impact on surgical support revenue.
Revenue from our surgical support product line offerings increased $12.0 million, or 5%, in 2015 compared to 2014 as the result of increased product and service volume of approximately 7%, offset by unfavorable changes of approximately 1% in both price and foreign currency fluctuation, for the year ended December 31, 2015 as compared to 2014.
47
Cost of Goods Sold, excluding amortization of purchased technology
|
|
|
Year Ended December 31, |
|
|
2015 to 2016 |
|
|
2014 to 2015 |
|
|||||||||||||||||||
|
|
|
2016 |
|
|
2015 |
|
|
2014 |
|
|
$ Change |
|
|
% Change |
|
|
$ Change |
|
|
% Change |
|
|||||||
|
|
|
(Dollars in thousands) |
|
|
|
|
|
|
|
|
|
|
|
|
|
|
|
|
|
|||||||||
|
Cost of Goods Sold |
|
$ |
240,093 |
|
|
$ |
194,479 |
|
|
$ |
182,358 |
|
|
$ |
45,614 |
|
|
|
23 |
% |
|
$ |
12,121 |
|
|
|
7 |
% |
|
% of total revenue |
|
|
25 |
% |
|
|
24 |
% |
|
|
24 |
% |
|
|
|
|
|
|
|
|
|
|
|
|
|
|
|
|
Cost of goods sold consists primarily of purchased goods, raw materials, labor and overhead associated with product manufacturing, inventory-related costs and royalty expenses, as well as the cost of providing IOM services, which includes personnel and physician oversight costs. We primarily procure and manufacture our goods in the United States, and accordingly, foreign currency fluctuations have not materially impacted our cost of goods sold.
Cost of goods sold increased $45.6 million, or 23%, during the year ended December 31, 2016 compared to 2015. Cost of goods sold for our business, excluding our 2016 acquisitions, increased as a result of the growth in volume, slightly offset with favorable shifts in purchase price, for an overall increase of approximately 13%. Inventory expense associated with the purchase accounting for our acquisition of Ellipse Technologies accounted for approximately 8% of the total increase compared to 2015. The cost of goods sold associated with the operations of our 2016 acquisitions accounted for approximately 14% of the total increase during the year ended December 31, 2016 compared to 2015. The overall increases in cost of goods sold were partially offset by decreases in other cost of goods sold expenses of approximately 11%, related to reductions in costs from the repeal of the Affordable Care Act’s medical device tax in 2016, expiring royalty obligations for certain product lines, and other non-recurring inventory related items including obsolescence of certain products in 2015 resulting from newer product launches.
Cost of goods sold increased $12.1 million, or 7%, during the year ended December 31, 2015 compared to 2014. The increase was primarily due to increased volume and obsolescence of existing products due to new product launches in 2015, partially offset by expiring royalty obligations for certain product lines and sales price decreases in 2015. Cost of goods sold as a percentage of revenue remained relatively consistent for the year ended December 31, 2015 compared to 2014 for the reasons described above.
On a long term basis, we expect cost of goods sold, as a percentage of revenue, to decrease moderately.
48
|
|
|
Year Ended December 31, |
|
|
2015 to 2016 |
|
|
2014 to 2015 |
|
|||||||||||||||||||
|
|
|
2016 |
|
|
2015 |
|
|
2014 |
|
|
$ Change |
|
|
% Change |
|
|
$ Change |
|
|
% Change |
|
|||||||
|
|
|
(Dollars in thousands) |
|
|
|
|
|
|
|
|
|
|
|
|
|
|
|
|
|
|||||||||
|
Sales, marketing, and administrative |
|
$ |
533,624 |
|
|
$ |
457,280 |
|
|
$ |
456,700 |
|
|
$ |
76,344 |
|
|
|
17 |
% |
|
$ |
580 |
|
|
|
0 |
% |
|
% of total revenue |
|
|
55 |
% |
|
|
56 |
% |
|
|
60 |
% |
|
|
|
|
|
|
|
|
|
|
|
|
|
|
|
|
|
Research and development |
|
|
47,999 |
|
|
|
35,833 |
|
|
|
37,486 |
|
|
|
12,166 |
|
|
|
34 |
% |
|
|
(1,653 |
) |
|
|
4 |
% |
|
% of total revenue |
|
|
5 |
% |
|
|
4 |
% |
|
|
5 |
% |
|
|
|
|
|
|
|
|
|
|
|
|
|
|
|
|
|
Amortization of intangibles |
|
|
42,001 |
|
|
|
12,516 |
|
|
|
13,571 |
|
|
|
29,485 |
|
|
|
236 |
% |
|
|
(1,055 |
) |
|
|
8 |
% |
|
Impairment of intangible assets |
|
|
— |
|
|
|
— |
|
|
|
10,708 |
|
|
|
— |
|
|
* |
|
|
|
(10,708 |
) |
|
* |
|
||
|
Litigation liability |
|
|
(43,310 |
) |
|
|
(41,826 |
) |
|
|
30,000 |
|
|
|
(1,484 |
) |
|
|
4 |
% |
|
|
(71,826 |
) |
|
|
239 |
% |
|
Business transition costs |
|
|
18,138 |
|
|
|
13,748 |
|
|
|
13,448 |
|
|
|
4,390 |
|
|
|
32 |
% |
|
|
300 |
|
|
|
2 |
% |
Sales, Marketing and Administrative
Sales, marketing and administrative expenses consist primarily of compensation costs, commissions and training costs for shareowners engaged in sales, marketing and customer support functions. The expense also includes commissions to sales representatives, freight expenses, surgeon training costs, depreciation expense for property and equipment such as surgical instrument sets, and administrative expenses for both shareowners and third party service providers.
Sales, marketing and administrative expenses increased by $76.3 million or 17% during the year ended December 31, 2016 compared to the same period in 2015, primarily related to a $49.2 million increase in shareowner compensation due to increased headcount and commissions to our direct sales representatives from increased sales. Other costs which increased as a function of the increase in revenue and international expansion, such as distributor commissions, freight, and travel, in the aggregate, accounted for approximately 3% of the increase compared to 2015. The sales, marketing and administrative expenses associated with our 2016 acquisitions, which is included in the results discussed herein, accounted for approximately 11% of the increase in sales, marketing and administrative expenses compared to 2015.
Sales, marketing and administrative expenses increased by $0.6 million during the year ended December 31, 2015 compared to the same period in 2014, primarily related to increases of $4.3 million in distributor commissions, which is a function of the increase in revenue and international expansion, $3.6 million increase in depreciation of loaned systems and instrument sets, $3.6 million increase in expenses for third party service providers, and an increase of $0.5 million in compensation expense. These increases were partially offset by a $2.1 million decrease in freight costs, a $4.0 million decrease in legal expenses mostly resulting from settled litigation in 2015, and a decrease of $5.3 million in other general operating expenses.
On a long-term basis, we expect total sales, marketing and administrative costs, as a percentage of revenue, to decrease moderately. To date, foreign currency fluctuations have not materially impacted our sales, marketing and administrative expenses.
Research and Development
Research and development expense consists primarily of product research and development, clinical trial and study costs, regulatory and clinical functions, and compensation and other shareowner related expenses. In the last several years, we have introduced numerous new products and product enhancements that have significantly expanded our MAS platform, including iGA, and our comprehensive product portfolio. We have also acquired complementary and strategic assets and technology, particularly in the area of spinal hardware products. We continue to invest in research and development programs.
Research and development expense increased by $12.2 million or 34% in 2016 compared to 2015. The increase in spending is primarily due to product related expenses associated with NSO, as well as increased spending for our other technologies.
Research and development expense decreased by $1.7 million or 4% in 2015 compared to 2014. The decrease is primarily related to decreases in shareowner compensation and travel expenses, and reduction in expense related to prototypes for new product launches that occurred in 2015. These decreases were partially offset by increases in equipment expenses related to iGA software development projects and other research and development projects and grants.
Research and development costs as a percentage of revenue remained relatively consistent with the previous year. On a long-term basis, we expect total research and development costs as a percentage of revenue to increase moderately in support of our ongoing development and regulatory approval efforts.
49
Amortization of Intangible Assets
Amortization of intangible assets relates to the amortization of finite-lived intangible assets acquired. Amortization expense increased $29.5 million in 2016 compared to 2015 due to our 2016 acquisitions including Ellipse Technologies and BNN Holdings. Amortization expense decreased $1.1 million in 2015 compared to 2014, primarily due to certain intangible assets reaching the end of their useful lives. During the year ended December 31, 2016, we acquired $251.2 million in definite-lived intangible assets, and began amortizing the assets over their respective useful lives.
We expect future amortization of our current intangible assets as a percentage of revenue to be relatively consistent, excluding future acquisitions.
Impairment of Intangible Assets
During the year ended December 31, 2014 we recorded $10.7 million of impairment charges related to intangible assets acquired from Cervitech in 2009. The primary factor contributing to these impairment charges were the reduction in management's estimates of current and future revenue and the related cash flows due to updated views of the competitive and regulatory landscape in the cervical market.
Litigation Liability Gain (Loss)
During the year ended December 31, 2016, we settled our ongoing litigation with Medtronic. Under the terms of the settlement, we paid Medtronic $45.0 million, which resulted in a gain of $43.3 million as we eliminated our previous accrual of $88.3 million related to this matter. Litigation liability gain of $41.8 million for the year ended December 31, 2015 primarily related to the recognition of a $56.4 million gain stemming from a favorable appeal in the first phase of the Medtronic litigation, which revised the award for lost profits and convoyed sales, and a gain of $2.8 million in litigation accrual change related to the settlement of the NeuroVision trademark litigation reducing the accrual from $30.0 million to $27.2 million. The litigation liability gains were partially offset by litigation liability losses of $13.8 million in connection with a definitive settlement agreement we entered into with the U.S. Department of Justice, or DOJ, to settle the investigation brought by the Office of the Inspector General of the U.S. Department of Health and Human Services and $3.6 million in a general litigation matter. See Note 11 and Note 12 to the Consolidated Financial Statements included in this Annual Report for further discussion.
Business Transition Costs
We incur certain costs related to acquisition, integration and business transition activities which include severance, relocation, consulting, leasehold exit costs, third party merger and acquisitions costs and other costs directly associated with such activities. During the year ended December 31, 2016, we incurred $18.1 million of such costs, which consisted primarily of acquisition and integration activities, and $7.3 million of fair value adjustments on contingent consideration liabilities associated with our 2016 acquisitions. During the year ended December 31, 2015, we incurred $13.7 million of business transition costs, which included $3.0 million in restructuring and impairment charges associated with the exit of our New Jersey location and termination of the respective lease, and a $3.4 million charge associated with the resignation of our former Chief Executive Officer and Chairman of the Board. The $3.4 million charge includes certain severance and compensation-related charges, net of certain forfeitures of previously recognized equity-based compensation. During the year ended December 31, 2014, we incurred $13.4 million of business transition costs, which included $6.4 million related to the restructuring and impairment charges associated with our exit of the New Jersey location and termination of the respective lease, and approximately $4.2 million in accelerated depreciation associated with abandoned leasehold improvements related to our consolidation of our San Diego headquarters.
50
Interest and Other Expense, Net
|
|
|
Year Ended December 31, |
|
|
2015 to 2016 |
|
|
2014 to 2015 |
|
|||||||||||||||||||
|
|
|
2016 |
|
|
2015 |
|
|
2014 |
|
|
$ Change |
|
|
% Change |
|
|
$ Change |
|
|
% Change |
|
|||||||
|
|
|
(Dollars in thousands) |
|
|
|
|
|
|
|
|
|
|
|
|
|
|
|
|
|
|||||||||
|
Interest income |
|
$ |
1,091 |
|
|
$ |
1,589 |
|
|
$ |
968 |
|
|
$ |
(498 |
) |
|
|
31 |
% |
|
$ |
621 |
|
|
|
64 |
% |
|
Interest expense |
|
|
(40,520 |
) |
|
|
(29,078 |
) |
|
|
(27,911 |
) |
|
|
(11,442 |
) |
|
|
39 |
% |
|
|
(1,167 |
) |
|
|
4 |
% |
|
Loss on repurchases of convertible notes |
|
|
(19,085 |
) |
|
|
— |
|
|
|
— |
|
|
|
(19,085 |
) |
|
* |
|
|
* |
|
|
* |
|
|||
|
Other (expense) income, net |
|
|
(305 |
) |
|
|
425 |
|
|
|
(2,411 |
) |
|
|
(730 |
) |
|
|
172 |
% |
|
|
2,836 |
|
|
|
118 |
% |
|
Total interest and other expense, net |
|
$ |
(58,819 |
) |
|
$ |
(27,064 |
) |
|
$ |
(29,354 |
) |
|
$ |
(31,755 |
) |
|
|
(117 |
)% |
|
$ |
2,290 |
|
|
|
8 |
% |
|
% of total revenue |
|
|
6 |
% |
|
|
3 |
% |
|
|
4 |
% |
|
|
|
|
|
|
|
|
|
|
|
|
|
|
|
|
Total interest expense increased by $11.4 million during the year ended December 31, 2016 compared to the same period in 2015 as a result of issuance of the 2021 Senior Convertible Notes in March 2016. Additionally, a loss of $19.1 million was recognized during the year ended December 31, 2016 related to the repurchase of a portion of the 2017 Senior Convertible Notes. Other (expense) income, net, includes foreign currency exchange and derivative instrument (losses) gains of $(0.3) million, net of foreign currency hedges during the year ended December 31, 2016 and $0.3 million during the year ended December 31, 2015. Our currency exposures vary, but are primarily concentrated in the pound sterling, the euro, the Australian dollar, the Singapore dollar, and the yen. The total interest and other expense, net, for all years presented included marginal income earned on marketable securities.
Total interest and other expense, net, decreased by $2.3 million for the year ended December 31, 2015 compared to the same period in 2014. The interest expense increased by $1.2 million during the year ended December 31, 2015, compared to 2014 for the same period due to amortization of the debt discount. Other (expense) income, net increased $2.8 million during the year ended December 31, 2015 compared to 2014 due to the losses on foreign currency rate changes in 2014 of $2.6 million, net of hedges, compared to a gain on foreign currency rate changes, net of hedges, of $0.3 million in 2015.
Income Tax Expense
|
|
|
Year Ended December 31, |
|
|
2015 to 2016 |
|
|
2014 to 2015 |
|
|||||||||||||||||||
|
|
|
2016 |
|
|
2015 |
|
|
2014 |
|
|
$ Change |
|
|
% Change |
|
|
$ Change |
|
|
% Change |
|
|||||||
|
|
|
(Dollars in thousands) |
|
|
|
|
|
|
|
|
|
|
|
|
|
|
|
|
|
|||||||||
|
Income tax expense |
|
$ |
29,282 |
|
|
$ |
46,729 |
|
|
$ |
6,286 |
|
|
$ |
(17,447 |
) |
|
|
37 |
% |
|
$ |
40,443 |
|
|
|
643 |
% |
|
Effective income tax rate |
|
|
45 |
% |
|
|
42 |
% |
|
|
(56 |
)% |
|
|
|
|
|
|
|
|
|
|
|
|
|
|
|
|
The provision for income taxes as a percentage of pre-tax income from continuing operations was 45% for the year ended December 31, 2016 compared with 42% for the year ended December 31, 2015. The effective tax rate for 2016 is higher than 2015 primarily due to current year increases in non-deductible acquisition related costs, offset by current year share-based compensation windfall tax benefits and the non-recurrence of prior year reserve and valuation allowance releases.
The provision for income taxes as a percentage of pre-tax income from continuing operations was 42% for the year ended December 31, 2015 compared with negative 56% for the year ended December 31, 2014. The effective tax rate for 2015 is more normalized and higher than 2014 primarily due to small prior year domestic earnings offset by larger foreign losses in jurisdictions where we get little to no tax benefit.
We are subject to audits by federal, state, local, and foreign tax authorities. We believe that adequate provisions have been made for any adjustments that may result from tax examinations. However, the outcome of tax audits cannot be predicted with certainty. Should any issues addressed in our tax audits be resolved in a manner not consistent with Management’s expectations, we could be required to adjust our provision for income taxes in the period such resolution occurs.
We expect our future effective income tax rate to exceed the U.S federal and statutory income tax rates due to various factors, including non-deductible expenses, state income taxes, net of federal benefits, and the continuing impacts of the implementation of our planned globalization initiative which became effective in January 2014. The initiative involved establishing new international operations and entering into new intercompany transfer pricing arrangements, including the transfer of intangibles. We continue to streamline our international operations, including procurement, logistics and customer service functions, in an effort to improve overall operational efficiencies. As international tax rules and regulations change, the Company may be subjected to changes in tax rates.
51
Liquidity, Cash Flows and Capital Resources
Liquidity and Capital Resources
Our principal sources of liquidity are our existing cash, cash equivalents and marketable securities, cash generated from operations, proceeds from our convertible notes issuances, and access to our revolving line of credit. We expect that cash provided by operating activities may fluctuate in future periods as a result of a number of factors, including fluctuations in our operating results, working capital requirements and capital deployment decisions. We have historically invested our cash primarily in the U.S. treasuries and government agencies, corporate debt, and money market funds. Certain of these investments are subject to general credit, liquidity and other market risks. The general condition of the financial markets and the economy may increase those risks and may affect the value and liquidity of investments and restrict ability to access the capital markets.
Our future capital requirements will depend on many factors including our rate of revenue growth, the timing and extent of spending to support development efforts, the expansion of sales, marketing and administrative activities, the timing of introductions of new products and enhancements to existing products, successful vertical integration of our manufacturing process, the continuing market acceptance of our products, the expenditures associated with possible future acquisitions or other business combination transactions, the outcome of current and future litigation, the evolution of our globalization initiative, and continuous international expansions of our business. We believe that our cash flow from operations and growing operations will continue to fund the ongoing core business. As current borrowing sources become due, we may be required to access the capital markets for additional funding. As we assess inorganic growth strategies, we may need to supplement our internally generated cash flow with outside sources. In the event that we are required to access the debt market, we believe we can do so at reasonable borrowing rates. As part of our liquidity strategy, we will continue to monitor our current level of earnings and cash flow generation as well as our ability to access the market in light of those earning levels.
A substantial portion of our operations are located in the United States, and the majority of our sales and cash generation since inception have been made in the United States. Accordingly, we do not have material net cash flow exposures to foreign currency rate fluctuations. However, as our business in markets outside of the United States continues to increase, we will be exposed to foreign currency exchange risk related to our foreign operations. Fluctuations in the rate of exchange between the United States dollar and foreign currencies, primarily in the pound sterling, the euro, the Australian dollar, the Singapore dollar, and the yen, could adversely affect our financial results, including our revenues, revenue growth rates, gross margins, income and losses as well as assets and liabilities. We enter into forward currency contracts to partially offset the impact from fluctuations of the foreign currency rates on our third party and short-term intercompany receivables and payables between our domestic and international operations. We currently do not hedge future forecasted transactions but will continue to assess whether that strategy is appropriate. At December 31, 2016, the cash balance held by our foreign subsidiaries with currencies other than the United States dollar was approximately $26.4 million and it is our intention to indefinitely reinvest all of current foreign earnings in order to partially support foreign working capital and to expand our existing operations outside the United States. As of December 31, 2016, our account receivable balance held by our foreign subsidiaries with currencies other than the United States dollar was approximately $23.3 million. We have operations in markets in which there is governmental financial instability which could impact funds that flow into the medical reimbursement system. In addition, loss of financial stability within these markets could lead to delays in reimbursement or inability to remit payment due to currency controls. Specifically, we have operations and/or sales in Puerto Rico, Brazil, Argentina and Venezuela. We do not have any material financial exposure to one customer or one country that would significantly hinder our liquidity.
During the year ended December 31, 2016, we entered into a settlement and patent license agreement with Medtronic to settle ongoing litigation. Under the terms of the settlement, we paid Medtronic $45.0 million, which resulted in a gain of $43.3 million as we eliminated our previous accrual of $88.3 million related to this matter. See Note 11 to the Consolidated Financial Statements included in this Annual Report for further discussion.
On August 31, 2015, we received a civil investigative demand, or CID, issued by the DOJ pursuant to the federal False Claims Act. The CID requires the delivery of a wide range of documents and information related to an investigation by the DOJ concerning allegations that we assisted a physician group customer in submitting improper claims for reimbursement and made improper payments to the physician group in violation of the Anti-Kickback Statute. We are cooperating with the DOJ. No assurance can be given as to the timing or outcome of this investigation, and the probable outcome of this matter cannot be determined.
52
We are involved in a number of legal actions and investigations arising out of the normal course of our business as discussed in Note 11 of the Consolidated Financial Statements included in this Annual Report. Due to the inherent uncertainties associated with pending legal actions and investigations, we cannot predict the outcome, and, with respect to certain pending litigation or claims where no liability has been accrued, to make a meaningful estimate of the reasonably possible loss or range of loss that could result from an unfavorable outcome, other than those matters disclosed in this Annual Report. We have no material accruals for pending litigation or claims for which accrual amounts are not disclosed in our Consolidated Financial Statements included in this Annual Report. It is reasonably possible, however, that an unfavorable outcome that exceeds our current accrual estimate, if any, for one or more of the matters described in our Consolidated Financial Statements included in this Annual Report could have a material adverse effect on our liquidity and access to capital resources. Additionally, it is possible that as part of the ongoing legal appeals process, regardless of our assessment of the probability of a loss, we could be required to set aside funds in an escrow or purchase a performance bond. These requirements to escrow funding could have an adverse impact on our ability to access our current liquidity or impact our access to additional capital resources.
We currently have $63.3 million in principal outstanding of senior convertible notes that will mature on July 1, 2017. Holders of the notes may elect to convert at any time beginning January 1, 2017. It is our intent to settle all conversions through combination settlement, whereby we would repay the principal amount in cash and the excess conversion value in shares of common stock. During 2016, we repurchased approximately $339.1 million in principal of these notes for $441.5 million, including accrued interest. Additionally, a minimal amount of holders of the 2017 Notes had elected to convert their notes in 2016 for which we settled through combination settlement. Refer to the below section subtitled “2.75% Senior Convertible Notes due 2017” for further details.
On September 12, 2016, we completed an acquisition of an imaging software and technology platform known as LessRay. In connection with the acquisition we recorded a purchase accounting fair value estimate of $33.8 million for contingent consideration liabilities related to the achievement of certain regulatory and commercial milestones. We anticipate these milestones will become payable at varying times between 2017 and 2020. We expect the imaging software and technology platform to be incorporated into our MAS platform to form a foundational element in our imaging, navigation and automation platform development strategy.
On July 1, 2016, we completed our acquisition of BNN Holdings for an upfront payment of $98.0 million, which was funded through cash and investments on hand. In connection with the closing, we used approximately $92.5 million (net of cash acquired and amounts retained for acquired provisional obligations) of our available cash and investments on hand to pay the upfront payment to security holders of BNN Holdings, as well as related transaction fees and expenses.
On February 11, 2016, we acquired Ellipse Technologies for an upfront payment of $380.0 million (including holdbacks for retained employment of Ellipse Technologies leadership that is to be expensed and is not considered part of the final purchase price) and a potential milestone payment of $30.0 million payable in 2017 related to the achievement of specific revenue targets. In connection with the closing, we used approximately $380.1 million (net of cash acquired) of our available cash and investments on hand to pay the upfront payment to security holders of Ellipse Technologies, as well as related transaction fees and expenses. The revenue-based milestone was achieved as of December 31, 2016, and we expect to pay the $30.0 million milestone payment by April 2017. See Note 4 to the Consolidated Financial Statements included in this Annual Report for further discussion on the milestone payment.
In furtherance of our initiative to increase the amount of products that we self-manufacture, in 2015, we added an approximately 180,000 square foot manufacturing facility in West Carrollton, Ohio; and throughout 2016, we have worked to build out and equip the new facility and initial production is underway.
53
Cash, cash equivalents and marketable securities were $153.6 million and $470.1 million at December 31, 2016 and December 31, 2015, respectively. We believe that our existing cash and cash equivalents and available liquidity will be sufficient to meet our anticipated cash needs for the next 12 months. We could have varying needs for cash as a result of the achievement of certain acquisition related milestones. We anticipate funding these milestones from cash on hand and operations, however, we have the ability to fund these from our existing line of credit if necessary. The change in liquidity during the year ended December 31, 2016 of $316.5 million was mainly driven by the funding of our acquisition of Ellipse Technologies of approximately $380.1 million (net of cash acquired), $441.5 million repurchase of a portion of our outstanding 2017 Notes, $92.5 million (net of cash acquired and amounts retained for acquired provisional obligations) for the acquisition of BNN Holdings, $66.3 million net for the call spread on the sale and purchase of warrants and bond hedge in connection with our issuance of Senior Convertible Notes due 2021, which we refer to as the 2021 Notes, $24.7 million cash tax payments on behalf of shareowners with net share settlement, and ordinary seasonal payments such as annual bonuses, offset by inflows of $634.1 million in net proceeds from the issuance of the 2021 Notes and cash flow from operations. At December 31, 2016, we have cash totaling $7.4 million in restricted accounts which are not available to us to meet any ongoing capital requirements if and when needed. Future litigation or requirements to escrow funds could materially impact our liquidity and our ability to invest in and run our business on an ongoing basis.
Cash Flows
The following table summarizes our Consolidated Statements of Cash Flows (in thousands):
|
|
|
Year Ended December 31, |
|
|
2015 to 2016 |
|
|
2014 to 2015 |
|
|||||||||||||||||||
|
|
|
2016 |
|
|
2015 |
|
|
2014 |
|
|
$ Change |
|
|
% Change |
|
|
$ Change |
|
|
% Change |
|
|||||||
|
Cash provided by operating activities |
|
$ |
156,295 |
|
|
$ |
88,727 |
|
|
$ |
115,548 |
|
|
$ |
67,568 |
|
|
|
76 |
% |
|
$ |
(26,821 |
) |
|
|
23 |
% |
|
Cash used in investing activities |
|
|
(304,885 |
) |
|
|
(7,514 |
) |
|
|
(104,825 |
) |
|
|
(297,371 |
) |
|
|
3,958 |
% |
|
|
97,311 |
|
|
|
93 |
% |
|
Cash (used in) provided by financing activities |
|
|
110,823 |
|
|
|
(30,344 |
) |
|
|
30,277 |
|
|
|
141,167 |
|
|
|
465 |
% |
|
|
(60,621 |
) |
|
|
200 |
% |
|
Effect of exchange rate changes on cash |
|
|
(929 |
) |
|
|
(917 |
) |
|
|
(1,438 |
) |
|
|
(12 |
) |
|
|
1 |
% |
|
|
521 |
|
|
|
36 |
% |
|
Increase (decrease) in cash and cash equivalents |
|
$ |
(38,696 |
) |
|
$ |
49,952 |
|
|
$ |
39,562 |
|
|
$ |
(88,648 |
) |
|
|
177 |
% |
|
$ |
10,390 |
|
|
|
26 |
% |
Cash flows from operating activities
Cash provided by operating activities was $156.3 million for the year ended December 31, 2016, compared to $88.7 million for the same period in 2015. The $67.6 million increase in cash provided by operating activities was primarily due to income tax payments in the prior year shifting to income tax refunds in the current year.
Cash provided by operating activities was $88.7 million in 2015, compared to $115.5 million in 2014. The decrease of $26.8 million in cash provided by operating activities was primarily due to increases in cash income tax obligations and the payment of litigation settlements, partially offset by cash generated from operations and accrual adjustments.
Cash flows used in investing activities
Cash used in investing activities was $304.9 million for the year ended December 31, 2016, compared to $7.5 million used for the same period in 2015. The $297.4 million increase in cash used in investing activities was primarily due to the $380.1 million cash payment (net of cash received) to fund the acquisition of Ellipse Technologies, the $92.5 million cash payment (net of cash acquired and amounts retained for acquired provisional obligations) for the acquisition of BNN Holdings, and $22.0 million used in other acquisition related investments including purchases of intangible assets. The funding of these acquisitions and investments was partially offset by a net increase of $176.5 million cash received related to activities within investment portfolios over the periods presented.
Cash used in investing activities was $7.5 million in 2015, compared to $104.8 million in 2014. The $97.3 million decrease in cash used in investing activities in 2015 as compared to 2014 is primarily due to the proceeds resulting from transferring $114.1 million of restricted cash and investments into unrestricted cash and investment accounts, and a $25.9 million increase in proceeds from the sales and maturities of marketable securities, offset by $17.3 million increase in purchases of property, plant, and equipment, and $32.0 million in cash paid for intangible assets, including payment of $27.4 million for intangible assets that were payable at December 31, 2014.
For 2017, we expect capital expenditures to support expansions of our business globally to be in the range of $95.0 million to $105.0 million which is expected to be sourced by the cash generated from operations and the credit facility, as described below in section “Revolving Senior Credit Facility”.
54
Cash flows from financing activities
Cash provided by financing activities was $110.8 million for the year ended December 31, 2016, compared to $30.3 million cash used for the same period in 2015. The $141.2 million increase in cash provided by financing activities was primarily due to the net proceeds from the issuance of the 2021 Notes of $634.1 million, offset by the use of $66.3 million net for the call spread on the sale and purchase of warrants and bond hedge in connection with the 2021 Notes issuance. Additionally, we used approximately $441.5 million in 2016 to repurchase a portion of the outstanding 2017 Notes, including accrued interest.
Our equity incentive plans allow for “net share settlement” of certain equity awards whereby, in lieu of (i) making cash payments in satisfaction of the exercise price owed respective to non-qualified stock option awards, or (ii) open market selling award shares to generate cash proceeds for use in satisfaction of statutory tax obligations respective to an award’s settlement or exercise, we offset the award shares being settled in a respective transaction by the number of shares of our common stock with a value equal to the respective obligation, and, in the case of taxes, making a cash payment to the respective taxing authority on behalf of the shareowner using our cash on hand. The net share settlement is accounted for with the cost of any award shares that are net settled being included in treasury stock and reported as a reduction in total equity at the time of settlement.
During 2017, we approximate at least $15.0 million of such cash tax payments will be made, however the actual remittance can be largely different depending on our share price at the date of RSU or PRSU release or option exercises or actual volume of such activities. We anticipate using cash generated from operating activities and the credit facility to fund all such payments.
Cash provided by financing activities was $30.3 million in 2015, compared to cash used in financing activities of $30.3 million in 2014. The $60.6 million increase in cash used in financing activities is primarily due to purchases of treasury shares of $56.9 million in 2015 for employee minimum tax withholding payments, and decrease in cash proceeds received in the exercise of employee stock options.
Senior Convertible Notes
2.25% Senior Convertible Notes due 2021
In March 2016, we issued $650.0 million principal amount of unsecured senior convertible notes with a stated interest rate of 2.25% and a maturity date of March 15, 2021. The net proceeds from the offering, after deducting initial purchasers' discounts and costs directly related to the offering, were approximately $634.1 million. Interest on the 2021 Notes began accruing upon issuance and is payable semi-annually. The 2021 Notes may be settled in cash, stock, or a combination thereof, solely at our discretion. It is our current intent and policy to settle all conversions through combination settlement, which involves satisfying the principal amount outstanding with cash and any note conversion value over the principal amount in shares of our common stock. The initial conversion rate of the 2021 Notes is 16.7158 shares per $1,000 principal amount, which is equivalent to a conversion price of approximately $59.82 per share, subject to adjustments. Prior to September 15, 2020, holders may convert their 2021 Notes only under the following conditions: (a) during any calendar quarter beginning June 30, 2016, if the reported sale price of our common stock for at least 20 days out of 30 consecutive trading days ending on the last trading day of the immediately preceding calendar quarter is greater than 130% of the conversion price on each applicable trading day; (b) during the five business day period in which the trading price of the 2021 Notes falls below 98% of the product of (i) the last reported sale price of our common stock and (ii) the conversion rate on that date; and (c) upon the occurrence of specified corporate events, as defined in the 2021 Notes. From September 15, 2020 and until the close of business on the second scheduled trading day immediately preceding March 15, 2021, holders may convert their 2021 Notes at any time (regardless of the foregoing circumstances). We may not redeem the 2021 Notes prior to March 20, 2019. We may redeem the 2021 Notes, at our option, in whole or in part on or after March 20, 2019 until the close of business on the business day immediately preceding September 15, 2020 if the last reported sale price of our common stock has been at least 130% of the conversion price then in effect for at least 20 trading days during any 30 consecutive trading day period ending on, and including, the trading day immediately preceding the date on which we deliver written notice of a redemption. The redemption price will be equal to 100% of the principal amount of such 2021 Notes to be redeemed plus accrued and unpaid interest to, but excluding, the redemption date. No principal payments are due on the 2021 Notes prior to maturity. Other than restrictions relating to certain fundamental changes and consolidations, mergers or asset sales and customary anti-dilution adjustments, the 2021 Notes do not contain any financial covenants and do not restrict us from paying dividends or issuing or repurchasing any of our other securities. We are unaware of any current events or market conditions that would allow holders to convert the 2021 Notes. The impact of the convertible feature will be dilutive to our earnings per share when our stock price average for the period is greater than the conversion price.
In connection with the offering of the 2021 Notes, we entered into the 2021 Hedge with the 2021 Counterparties, entitling us to purchase up to 10,865,270 shares of our own common stock at an initial stock price of $59.82 per share, each of which is subject to adjustment. The cost of the 2021 Hedge was $111.2 million. The 2021 Hedge will expire on March 15, 2021. The 2021 Hedge is expected to reduce the potential equity dilution upon conversion of the 2021 Notes if the daily volume-weighted average price per share of our common stock exceeds the strike price of the 2021 Hedge. Our assumed exercise of the 2021 Hedge is considered anti-dilutive since the effect of the inclusion would always be anti-dilutive with respect to the calculation of diluted earnings per share.
55
In addition, we sold the 2021 Warrants to the 2021 Counterparties to acquire up to 10,865,270 common shares of our stock. The 2021 Warrants will expire on various dates from June 2021 through December 2021 and may be settled in cash or net shares. It is our current intent and policy to settle all conversions in shares of our common stock. We received $44.9 million in cash proceeds from the sale of the 2021 Warrants. The 2021 Warrants could have a dilutive effect on our earnings per share to the extent that the price of our common stock during a given measurement period exceeds the strike price of the 2021 Warrants, which is $80.00 per share.
2.75% Senior Convertible Notes due 2017
In June 2011, we issued $402.5 million principal amount of Senior Convertible Notes, which we refer to as the 2017 Notes, with a stated interest rate of 2.75% and a maturity date of July 1, 2017. The net proceeds from the offering, after deducting initial purchasers’ discounts and costs directly related to the offering, were approximately $359.2 million. The 2017 Notes may be settled in cash, stock, or a combination thereof, solely at our discretion. It is our current intent and policy to settle all conversions through combination settlement, which involves repayment of an amount of cash equal to the principal amount and any excess of the conversion value over the principal amount in shares of common stock. The initial conversion rate of the 2017 Notes is 23.7344 shares per $1,000 principal amount, or equivalent to conversion price of approximately $42.13 per share, which is subject to adjustment. Beginning January 1, 2017 and until the close of business on the second scheduled trading day immediately preceding July 1, 2017, holders may convert their 2017 Notes at any time. Prior to January 1, 2017, holders may convert their 2017 Notes only under the conditions as described in Note 6 to the Consolidated Financial Statements included in this Annual Report, which includes our common stock trading at 130% of the conversion price for 20 out of 30 consecutive trading days. It is our current intent and policy to settle all conversions through combination settlement, which involves satisfying the principal amount outstanding with cash and any note conversion value over the principal amount in shares of our common stock. The impact of the convertible feature will be dilutive to our earnings per share when our stock price average for the period is greater than the conversion price. Interest on the 2017 Notes began accruing upon issuance and is payable semi-annually on January 1st and July 1st each year. At December 31, 2016, holders of the 2017 Notes were in a convertible position, as the reported sale price of the our common stock for 20 days out of the last 30 consecutive trading days ending with December 31, 2016 exceeded 130% of the $42.13 per share conversion price on each applicable trading day. At December 31, 2016, a minimal amount of holders of the 2017 Notes had elected to convert their notes. We settled such conversions through the combination settlement described above. The 2017 Notes are recorded as current liabilities on the December 31, 2016 Consolidated Balance Sheet.
In connection with the offering of the 2017 Notes, we entered into convertible note hedge transactions, which we refer to as the 2017 Hedge, with the initial purchasers and/or their affiliates, which we refer to as the 2017 Counterparties, entitling us to purchase up to 9,553,096 shares of our common stock at an initial stock price of $42.13 per share, each of which is subject to adjustment. The cost of the 2017 Hedge was $80.1 million. The 2017 Hedge expires on July 1, 2017. The 2017 Hedge is expected to reduce the potential equity dilution upon conversion of the 2017 Notes if the daily volume-weighted average price per share of our common stock exceeds the strike price of the 2017 Hedge. Our assumed exercise of the 2017 Hedge is considered anti-dilutive since the effect of the inclusion would always be anti-dilutive with respect to the calculation of diluted earnings per share.
In addition, we sold warrants, which we refer to as the 2017 Warrants, to the 2017 Counterparties to acquire up to 477,654 shares of our Series A Participating Preferred Stock, at an initial strike price of $988.51 per share, subject to adjustment. Each share of Series A Participating Preferred Stock is initially convertible into 20 shares of our common stock. The 2017 Warrants expire on various dates from September 2017 through January 2018 and may be settled in cash or net shares. It is our current intent and policy to settle all conversions in shares of our common stock, should the conversion occur. We received $47.9 million in cash proceeds from the sale of the 2017 Warrants. The 2017 Warrants could have a dilutive effect on our earnings per share to the extent that the price of our common stock during a given measurement period (the quarter or year-to-date period) exceeds the strike price of the 2017 Warrants, which is $49.43 per share.
In March 2016, we used approximately $345.2 million of the net proceeds from the 2021 Notes offering to repurchase approximately $276.8 million in principal amount outstanding of the $402.5 million 2017 Notes.
In the fourth quarter of 2016, we used approximately $96.3 million of cash on hand to repurchase an additional $62.3 million in principal amount outstanding of the 2017 Notes. As of December 31, 2016, we had $63.3 million principal amount of 2017 Notes outstanding.
56
Revolving Senior Credit Facility
In February 2016, we entered into a credit agreement, which we refer to as the Credit Agreement, for a revolving senior credit facility, which we refer to as the Facility, that provides for secured revolving loans, multicurrency loan options and letters of credit in an aggregate amount of up to $150.0 million. The Credit Agreement also contains an expansion feature, which allows us to increase the aggregate principal amount of the Facility provided we remain in compliance with the underlying financial covenants. The Facility matures on February 8, 2021, and includes a sub-limit of $15.0 million for letters of credit and a sub-limit of $5.0 million for swing line loans. All of our assets and assets of our material domestic subsidiaries and certain material international subsidiaries are pledged as collateral under the Facility (subject to customary exceptions) pursuant to the terms set forth in the Security and Pledge Agreement executed in favor of the administrative agent by the Company. Each of our material domestic and international subsidiaries guarantees the Facility. At December 31, 2016 we did not carry any outstanding revolving loan under the Facility.
Borrowings under the Facility are used by us to provide financing for working capital and other general corporate purposes, including potential mergers and acquisitions. Loans under the Facility bear interest, at our option, at either LIBOR (determined in accordance with the Credit Agreement) plus an applicable margin ranging from 1.00 % - 2.00 % per annum subject to our applicable consolidated leverage ratio or the Base Rate (determined in accordance with the Credit Agreement), plus an applicable margin ranging from 0.0% - 1.25% per annum subject to our applicable consolidated leverage ratio. The Facility has a commitment fee, which accrues at a rate of 0.2% - 0.4% per annum (determined in accordance with the Credit Agreement) based on our current leverage ratio.
The Credit Agreement contains affirmative, negative and financial covenants, and events of default customary for financings of this type. The financial covenants require us to maintain ratios of consolidated earnings before interest, taxes, depreciation and amortization (EBITDA) to consolidated interest expense, and to consolidated debt, respectively, as defined in the Credit Agreement, at varying scales throughout the life of the Credit Agreement. The Facility grants the lenders preferred first priority liens and security interests in our capital stock, intercompany debt and all of our present and future property and assets, including each guarantor. We are currently in compliance with the Credit Agreement covenants.
Contractual Obligations and Commitments
Contractual obligations and commitments represent future cash commitments and liabilities under agreements with third parties, including our 2017 Notes, 2021 Notes, operating leases and other contractual obligations.
The following table summarizes our long-term contractual obligations and commitments as of December 31, 2016 (in thousands):
|
|
|
|
|
|
|
Payments Due by Period |
|
|||||||||||||
|
|
|
Total |
|
|
Less Than 1 Year |
|
|
1 to 3 Years |
|
|
4 to 5 Years |
|
|
After 5 Years |
|
|||||
|
Convertible Notes (1) |
|
$ |
779,130 |
|
|
$ |
77,942 |
|
|
$ |
43,875 |
|
|
$ |
657,313 |
|
|
$ |
— |
|
|
Operating leases |
|
|
57,875 |
|
|
|
12,275 |
|
|
|
27,107 |
|
|
|
13,872 |
|
|
|
4,621 |
|
|
Capital leases |
|
|
1,649 |
|
|
|
631 |
|
|
|
1,018 |
|
|
|
— |
|
|
|
— |
|
|
Achieved milestones in connection with acquisitions |
|
|
30,000 |
|
|
|
30,000 |
|
|
|
— |
|
|
|
— |
|
|
|
— |
|
|
Other long-term liabilities |
|
|
3,530 |
|
|
|
— |
|
|
|
3,530 |
|
|
|
— |
|
|
|
— |
|
|
Total |
|
$ |
872,184 |
|
|
$ |
120,848 |
|
|
$ |
75,530 |
|
|
$ |
671,185 |
|
|
$ |
4,621 |
|
57
Total contractual obligations and commitments listed in the table above excludes the following liabilities:
|
|
• |
Potential contingent consideration payments pursuant to certain merger, purchase, and product development agreements, other than the milestone payment under the merger agreement for the acquisition of Ellipse Technologies. See Notes 4 and 7 to the Consolidated Financial Statements included in this Annual Report for further discussion on the contingent consideration obligations and product development agreements, respectively. |
|
|
• |
Potential performance based long-term cash incentive awards granted to certain executive officers. These awards are contingent upon future Company performance and totaled $5.3 million in the Consolidated Balance Sheet as of December 31, 2016. |
|
|
• |
Amounts related to uncertain tax benefits were excluded because we cannot make a reasonably reliable estimate regarding the timing of settlements with taxing authorities, if any. Such liabilities are included in the Consolidated Balance Sheet as of December 31, 2016, and considered immaterial to the overall financial statements. See Note 9 to the Consolidated Financial Statements included in this Annual Report for further discussion of our provision for income taxes. |
|
|
• |
Certain amounts related to tax liabilities in foreign jurisdictions were excluded because we cannot make a reasonably reliable estimate regarding the timing of settlements with taxing authorities, if any. Such liabilities totaling $6.5 million, including interest and penalties, are included in the Consolidated Balance Sheet as of December 31, 2016. |
The expected timing of payments of the obligations discussed above is estimated based on current information. Timing of payment and actual amounts paid may be different depending on the time of receipt of services or changes to agreed-upon amounts for some obligations.
Off-Balance Sheet Arrangements
As of December 31, 2016, we did not have any off-balance sheet activities.
Item 7A.Quantitative and Qualitative Disclosures About Market Risk
Interest Rate Sensitivity and Risk
Our exposure to interest rate risk at December 31, 2016 is related to our investment portfolio which consists largely of cash equivalents in the form of debt instruments of high quality corporate issuers and the U.S. government and its agencies. Due to the short-term nature of these investments, we have assessed that there is no material exposure to interest rate risk arising from our investments. Fixed rate investments and borrowings may have their fair market value adversely impacted from changes in interest rates. At December 31, 2016, we do not hold any material asset-backed investment securities and in 2016, we did not realize any losses related to asset-backed investment securities. Based upon our overall interest rate exposure as of December 31, 2016, a change of 10 percent in interest rates, assuming the amount of our investment portfolio and overall economic environment remains constant, would not have a material effect on interest income.
The primary objective of our investment activities is to preserve the principal while at the same time maximizing yields without significantly increasing the risk. To achieve this objective, we maintain our portfolio of cash equivalents and investments in instruments that meet high credit quality standards, as specified in our investment policy. None of our investments are held for trading purposes. Our policy also limits the amount of credit exposure to any one issue, issuer and type of instrument.
As of December 31, 2016, we only held investments in securities of a short-term nature classified as cash equivalents. During the periods presented, we did not hold any investments that were in a significant unrealized loss position and no impairment charges were recorded. Realized gains and losses and interest income related to marketable securities were immaterial during all periods presented.
Market Price Sensitive Instruments
In order to reduce the potential equity dilution, we entered into the 2017 Hedge and 2021 Hedge in connection with the issuance of the 2017 Notes and 2021 Notes, respectively, entitling us to purchase our common stock. Upon conversion of our convertible notes, the 2017 Hedge and 2021 Hedge are expected to reduce the equity dilution if the daily volume-weighted average price per share of our common stock exceeds the strike price of the applicable hedge. We also entered into warrant transactions with the counterparties of the 2017 Hedge and 2021 Hedge entitling them to acquire shares of our common stock. The warrant transactions could have a dilutive effect on our earnings per share to the extent that the price of our common stock during a given measurement period (the quarter or year to date period) exceeds the strike price of the warrants. See Note 6 to the Consolidated Financial Statements included in this Annual Report for further discussion.
58
Foreign Currency Exchange Risk
A substantial portion of our operations are located in the United States, and the majority of our sales since inception have been made in the United States dollars. Accordingly, we have assessed that we do not have any material net exposure to foreign currency rate fluctuations. However, as our business in markets outside of the United States continues to increase, we will be exposed to foreign currency exchange risk related to our foreign operations. Fluctuations in the rate of exchange between the United States dollar and foreign currencies, primarily the pound sterling the euro, the Australian dollar and the yen, could adversely affect our financial results, including our revenues, revenue growth rates, gross margins, income and losses as well as assets and liabilities. In addition, loss of financial stability within these markets could lead to delays in reimbursement or inability to remit payment due to currency controls. Specifically, we have operations in Puerto Rico, Brazil, Argentina and Venezuela that have financial instability or currency controls. We do not have any material financial exposure to one customer or one country that would significantly hinder our liquidity.
We translate the financial statements of our foreign subsidiaries with functional currencies other than the United States dollar into the United States dollar for consolidation using end-of-period exchange rates for assets and liabilities and average exchange rates during each reporting period for results of operations. Net gains or losses resulting from the translation of foreign financial statements and the effect of exchange rate changes on intercompany receivables and payables of a long-term investment nature are recorded as a separate component of stockholders’ equity. These adjustments will affect net income only upon sale or liquidation of the underlying investment in foreign subsidiaries. Exchange rate fluctuations resulting from the translation of the short-term intercompany balances between domestic entities and our foreign subsidiaries are recorded as foreign currency transaction gains or losses and are included in other income (expense) in the Consolidated Statement of Operations. For those short-term intercompany balances, we enter into the foreign currency forward contracts to partially offset the impact from fluctuation of the foreign currency rates. The notional amount of the outstanding foreign currency forward contracts was $15.1 million as of December 31, 2016, which was settled in January 2017. During the year ended December 31, 2016, a gain of $0.7 million was recognized in other income due to the change in the fair value of the derivative instruments, and the fair value of the hedge contracts we held was immaterial on our Consolidated Balance Sheet as of December 31, 2016. The notional principal amounts provide one measure of the transaction volume outstanding as of period end, but do not represent the amount of our exposure to market loss. The estimates of fair value are based on applicable and commonly used pricing models using prevailing financial market information. The amounts ultimately realized upon settlement of these financial instruments, together with the gains and losses on the underlying exposures, will depend on actual market conditions during the remaining life of the instruments. The financial exposures by exchange rate fluctuations are monitored and managed by us as an integral part of our overall risk management program, which recognizes the unpredictability of financial markets and seeks to reduce potentially adverse effects on our results.
Item 8.Financial Statements and Supplementary Data
The Consolidated Financial Statements and supplementary data required by this item are set forth at the pages indicated in Item 15.
Item 9.Changes in and Disagreements with Accountants on Accounting and Financial Disclosure
None.
Item 9A.Controls and Procedures
Disclosure Controls and Procedures
We maintain disclosure controls and procedures that are designed to ensure that information required to be disclosed in our reports under the Securities Exchange Act of 1934, as amended (Exchange Act) is recorded, processed, summarized and reported within the timelines specified in the Commission’s rules and forms, and that such information is accumulated and communicated to our management, including our Chief Executive Officer and Chief Financial Officer, as appropriate, to allow timely decisions regarding required disclosure. In designing and evaluating the disclosure controls and procedures, management recognized that any controls and procedures, no matter how well designed and operated, can only provide reasonable assurance of achieving the desired control objectives, and in reaching a reasonable level of assurance, management necessarily was required to apply its judgment in evaluating the cost-benefit relationship of possible controls and procedures.
Under the supervision and with the participation of our management, including our Chief Executive Officer and our Chief Financial Officer, we carried out an evaluation of the effectiveness of the Company’s disclosure controls and procedures (as defined in SEC Rules 13a — 15(e) and 15d — 15(e) of the Exchange Act) as of December 31, 2016. Based on such evaluation, our management has concluded as of December 31, 2016, the Company’s disclosure controls and procedures are effective.
59
Management’s Report on Internal Control over Financial Reporting
Our management is responsible for establishing and maintaining adequate internal control over financial reporting as defined in Rule 13a-15(f) under the Exchange Act. Internal control over financial reporting refers to the process designed by, or under the supervision of, our Chief Executive Officer and Chief Financial Officer, and effected by our board of directors, management and other personnel, to provide reasonable assurance regarding the reliability of financial reporting and the preparation of financial statements for external purposes in accordance with U.S. generally accepted accounting principles.
Management has used the framework set forth in the report entitled Internal Control — Integrated Framework published by the Committee of Sponsoring Organizations of the Treadway Commission (2013 framework) to evaluate the effectiveness of the Company’s internal control over financial reporting. On May 14, 2013, the Committee of Sponsoring Organizations of the Treadway Commission published a 2013 framework and related illustrative documents. We adopted the new framework during 2014. Management has concluded that the Company’s internal control over financial reporting, excluding our acquisition of BNN Holdings, was effective as of December 31, 2016, based on those criteria. Ernst & Young LLP, the Company’s independent registered public accounting firm, has issued an attestation report on the Company’s internal control over financial reporting which is included herein.
Changes in Internal Control over Financial Reporting
We are involved in ongoing evaluations of internal controls. In anticipation of the filing of this Form 10-K, our Chief Executive Officer and Chief Financial Officer, with the assistance of other members of our management, performed an evaluation of any change in internal control over financial reporting that occurred during our last fiscal quarter that has materially affected, or is likely to materially affect, our internal controls over financial reporting. There has been no change to our internal control over financial reporting during our most recent fiscal quarter that has materially affected, or is reasonably likely to materially affect, our internal control over financial reporting.
60
REPORT OF INDEPENDENT REGISTERED PUBLIC ACCOUNTING FIRM
The Board of Directors and Stockholders of NuVasive, Inc.
We have audited NuVasive, Inc.’s internal control over financial reporting as of December 31, 2016, based on criteria established in Internal Control—Integrated Framework issued by the Committee of Sponsoring Organizations of the Treadway Commission (2013 framework) (the COSO criteria). NuVasive, Inc.’s management is responsible for maintaining effective internal control over financial reporting, and for its assessment of the effectiveness of internal control over financial reporting included in the accompanying Management’s Report on Internal Control over Financial Reporting. Our responsibility is to express an opinion on the company’s internal control over financial reporting based on our audit.
We conducted our audit in accordance with the standards of the Public Company Accounting Oversight Board (United States). Those standards require that we plan and perform the audit to obtain reasonable assurance about whether effective internal control over financial reporting was maintained in all material respects. Our audit included obtaining an understanding of internal control over financial reporting, assessing the risk that a material weakness exists, testing and evaluating the design and operating effectiveness of internal control based on the assessed risk, and performing such other procedures as we considered necessary in the circumstances. We believe that our audit provides a reasonable basis for our opinion.
A company’s internal control over financial reporting is a process designed to provide reasonable assurance regarding the reliability of financial reporting and the preparation of financial statements for external purposes in accordance with generally accepted accounting principles. A company’s internal control over financial reporting includes those policies and procedures that (1) pertain to the maintenance of records that, in reasonable detail, accurately and fairly reflect the transactions and dispositions of the assets of the company; (2) provide reasonable assurance that transactions are recorded as necessary to permit preparation of financial statements in accordance with generally accepted accounting principles, and that receipts and expenditures of the company are being made only in accordance with authorizations of management and directors of the company; and (3) provide reasonable assurance regarding prevention or timely detection of unauthorized acquisition, use, or disposition of the company’s assets that could have a material effect on the financial statements.
Because of its inherent limitations, internal control over financial reporting may not prevent or detect misstatements. Also, projections of any evaluation of effectiveness to future periods are subject to the risk that controls may become inadequate because of changes in conditions, or that the degree of compliance with the policies or procedures may deteriorate.
In our opinion, NuVasive, Inc. maintained, in all material respects, effective internal control over financial reporting as of December 31, 2016, based on the COSO criteria.
We also have audited, in accordance with the standards of the Public Company Accounting Oversight Board (United States), the consolidated balance sheets of NuVasive, Inc. as of December 31, 2016 and 2015, and the related consolidated statements of operations, comprehensive income (loss), equity, and cash flows for each of the three years in the period ended December 31, 2016 of NuVasive, Inc. and our report dated February 9, 2017 expressed an unqualified opinion thereon.
/s/ Ernst & Young LLP
San Diego, California
February 9, 2017
61
None.
PART III
Certain information required by Part III is omitted from this report because the Company will file a definitive proxy statement within 120 days after the end of its fiscal year pursuant to Regulation 14A (the Proxy Statement) for its 2017 annual meeting of stockholders, and certain information included in the Proxy Statement is incorporated herein by reference.
Item 10.Directors, Executive Officers and Corporate Governance
We have adopted a Code of Ethical Business Conduct for all officers, directors and shareowners. The Code of Ethical Business Conduct is available on our website, www.nuvasive.com. We intend to disclose future amendments to, or waivers from, provisions of our Code of Ethical Business Conduct that apply to our Principal Executive Officer, Principal Financial Officer, Principal Accounting Officer, or Controller, or persons performing similar functions, within four business days of such amendment or waiver.
The other information required by this Item 10 will be set forth in the Proxy Statement and is incorporated in this report by reference.
Item 11.Executive Compensation
The information required by this item will be set forth in the Proxy Statement and is incorporated in this report by reference.
Item 12.Security Ownership of Certain Beneficial Owners and Management and Related Stockholder Matters
The information required by this item will be set forth in the Proxy Statement and is incorporated in this report by reference.
Item 13.Certain Relationships and Related Transactions, and Director Independence
The information required by this item will be set forth in the Proxy Statement and is incorporated in this report by reference.
Item 14.Principal Accounting Fees and Services
The information required by this item will be set forth in the Proxy Statement and is incorporated in this report by reference.
PART IV
Item 15.Exhibits, Financial Statement Schedules
|
|
(a) |
The following documents are filed as a part of this report: |
|
|
(1) |
Report of Independent Registered Public Accounting Firm |
Consolidated Balance Sheets as of December 31, 2016 and 2015
Consolidated Statements of Operations for the years ended December 31, 2016, 2015 and 2014
Consolidated Statements of Comprehensive Income (Loss) for the years ended December 31, 2016, 2015 and 2014
Consolidated Statements of Equity for the years ended December 31, 2016, 2015 and 2014
Consolidated Statements of Cash Flows for the years ended December 31, 2016, 2015 and 2014
Notes to Consolidated Financial Statements
|
|
(2) |
Financial Statement Schedules: Schedule II — Valuation Accounts |
All other financial statement schedules have been omitted because they are not applicable, not required or the information required by such schedules is shown in the financial statements or the notes thereto.
62
See Item 15, subsection (b) below.
(b) The following exhibits are filed as part of this report:
|
Exhibit Number |
|
|
|
Description |
|
|
2.1† |
|
Agreement and Plan of Merger, dated January 4, 2016, by and among the Company, Magneto Acquisition Corporation, a Delaware corporation and wholly-owned subsidiary of the Company, Ellipse Technologies, Inc., and Fortis Advisors LLC, a Delaware limited liability corporation, in its capacity as the equity holders’ representative (incorporated by reference to our Current Report on Form 8-K filed with the Commission on February 11, 2016) |
|||
|
2.2 |
|
Agreement and Plan of Merger, dated June 6, 2016, by and among the Company, Bionic Acquisition Corporation, a Delaware corporation and wholly-owned subsidiary of the Company, BNN Holdings Corp., and GPP I-BNN, LLC, a Delaware limited liability corporation, in its capacity as the security holders’ agent to BNN Holdings Corp. (incorporated by reference to our Current Report on Form 8-K filed with the Commission on July 5, 2016) |
|||
|
3.1 |
|
Restated Certificate of Incorporation (incorporated by reference to our Quarterly Report on Form 10-Q filed with the Commission on August 13, 2004) |
|||
|
3.2 |
|
Certificate of Amendment to the Restated Certificate of Incorporation (incorporated by reference to our Current Report on Form 8-K filed with the Commission on September 28, 2011) |
|||
|
3.3 |
|
Restated Bylaws (incorporated by reference to our Current Report on Form 8-K filed with the Commission on January 6, 2012) |
|||
|
3.4 |
|
Amendment No. 1 to the Restated Bylaws (incorporated by reference to our Current Report on Form 8-K filed with the Commission on May 19, 2014) |
|||
|
3.5 |
|
Amendment No. 2 to the Restated Bylaws (incorporated by reference to our Current Report on Form 8-K filed with the SEC on August 1, 2016) |
|||
|
4.1 |
|
Specimen Common Stock Certificate (incorporated by reference to our Annual Report on Form 10-K filed with the Commission on March 16, 2006) |
|||
|
4.2 |
|
Certificate of Designations of Series A Participating Preferred Stock filed with the Delaware Secretary of State on June 28, 2011 (incorporated by reference to our Current Report on Form 8-K filed with the Commission on June 29, 2011) |
|||
|
4.3 |
|
Indenture dated June 28, 2011 between the Company and U.S. National Association (incorporated by reference to our Current Report on Form 8-K filed with the Commission on June 29, 2011) |
|||
|
4.4 |
|
Form of 2.75% Convertible Senior Note due 2017 (incorporated by reference to our Current Report on Form 8-K filed with the Commission on June 29, 2011) |
|||
|
4.5 |
|
Indenture, dated March 16, 2016, between the Company and Wilmington Trust, National Association, as Trustee (incorporated by reference to our Current Report on Form 8-K filed with the Commission on March 16, 2016) |
|||
|
4.6 |
|
Form of 2.25% Convertible Senior Note due 2021 (incorporated by reference to our Current Report on Form 8-K filed with the Commission on March 16, 2016) |
|||
|
10.1# |
|
2004 Amended and Restated Equity Incentive Plan (incorporated by reference to our Quarterly Report on Form 10-Q filed with the Commission on July 26, 2012) |
|||
|
10.2# |
|
Amendment No. 1 to the 2004 Amended and Restated Equity Incentive Plan (incorporated by reference to our Annual Report on Form 10-K filed with the Commission on March 3, 2014) |
|||
|
10.3# |
|
Form of Stock Option Award Notice under the 2004 Amended and Restated Equity Incentive Plan (incorporated by reference to Amendment No. 1 to our Registration Statement on Form S-1 filed with the Commission on April 8, 2004) |
|||
63
|
Exhibit Number |
|
|
|
Description |
|
|
10.4# |
|
Form of Option Exercise and Stock Purchase Agreement under the 2004 Amended and Restated Equity Incentive Plan (incorporated by reference to Amendment No. 1 to our Registration Statement on Form S-1 filed with the Commission on April 8, 2004) |
|||
|
10.5# |
|
Form of Restricted Stock Unit Award Agreement under the 2004 Amended and Restated Equity Incentive Plan (incorporated by reference to our Annual Report on Form 10-K filed with the Commission on February 26, 2010) |
|||
|
10.6# |
|
Form of Restricted Stock Grant Notice and Restricted Stock Agreement under the 2004 Amended and Restated Equity Incentive Plan (incorporated by reference to Amendment No.1 to our Registration Statement on Form S-1 filed with the Commission on April 8, 2004) |
|||
|
10.7# |
|
NuVasive, Inc. 2004 Amended and Restated Employee Stock Purchase Plan (incorporated by reference to our Quarterly Report on Form 10-Q filed with the Commission on October 30, 2014) |
|||
|
10.8# |
|
2014 Equity Incentive Plan (incorporated by reference to Exhibit A to our Definitive Proxy Statement filed with the Commission on March 27, 2014) |
|||
|
10.9# |
|
Form of Performance Restricted Stock Unit Agreement (with accompanying Form Notice of Grant) under the 2014 Equity Incentive Plan (incorporated by reference to our Quarterly Report on Form 10-Q filed with the Commission on May 4, 2015) |
|||
|
10.10# |
|
Form of Executive Restricted Stock Unit Agreement (with accompanying Form Notice of Grant) under the 2014 Equity Incentive Plan (incorporated by reference to our Quarterly Report on Form 10-Q filed with the Commission on May 4, 2015) |
|||
|
10.11# |
|
Form of Performance Cash Award Agreement (with accompanying Form Notice of Grant) under the 2014 Equity Incentive Plan (incorporated by reference to our Quarterly Report on Form 10-Q filed with the Commission on May 4, 2015) |
|||
|
10.12# |
|
Form of Performance Restricted Stock Unit Agreement (with accompanying Notice of Grant) for grants after February 11, 2016 under the 2014 Equity Incentive Plan (incorporated by reference to our Annual Report on Form 10-K filed with the Commission on February 11, 2016) |
|||
|
10.13# |
|
Form of Executive Restricted Stock Unit Agreement (with accompanying Form Notice of Grant) for grants after February 11, 2016 under the 2014 Equity Incentive Plan (incorporated by reference to our Annual Report on Form 10-K filed with the Commission on February 11, 2016) |
|||
|
10.14# |
|
Form of Performance Cash Award Agreement (with accompanying Form Notice of Grant) for grants after February 11, 2016 under the 2014 Equity Incentive Plan (incorporated by reference to our Annual Report on Form 10-K filed with the Commission on February 11, 2016) |
|||
|
10.15# |
|
Form of Performance Restricted Stock Unit Agreement (with accompanying Notice of Grant) for grants after February 8, 2017 under the 2014 Equity Incentive Plan |
|||
|
10.16# |
|
Form of Executive Restricted Stock Unit Agreement (with accompanying Form Notice of Grant) for grants after February 8, 2017 under the 2014 Equity Incentive Plan |
|||
|
10.17# |
|
Form of Performance Cash Award Agreement (with accompanying Form Notice of Grant) for grants after February 8, 2017 under the 2014 Equity Incentive Plan |
|||
|
10.18# |
|
NuVasive, Inc. 2014 Executive Incentive Compensation Plan (incorporated by reference to Exhibit B to our Definitive Proxy Statement filed with the Commission on March 27, 2014) |
|||
|
10.19# |
|
2015 Ellipse Technologies, Inc. Incentive Award Plan (incorporated by reference to our Registration Statement on Form S-8 filed with the Commission on February 11, 2016) |
|||
|
10.20# |
|
Form of Indemnification Agreement between the Company and its directors and certain executives thereof (incorporated by reference to our Current Report on Form 8-K filed with the Commission on May 19, 2014) |
|||
|
10.21# |
|
NuVasive, Inc. Amended and Restated Executive Severance Plan (incorporated by reference to our Current Report on Form 8-K filed with the Commission on August 6, 2015) |
|||
|
10.22# |
|
Form of Change in Control Agreement between the Company and certain executives thereof (incorporated by reference to our Current Report on Form 8-K filed with the Commission on May 19, 2014) |
|||
64
|
Exhibit Number |
|
|
|
Description |
|
|
10.23# |
|
NuVasive, Inc. Deferred Compensation Plan (incorporated by reference to our Current Report on Form 8-K filed with the Commission on August 6, 2015) |
|||
|
10.24# |
|
Letter Agreement dated May 22, 2015 between the Company and Gregory T. Lucier (incorporated by reference to our Current Report on Form 8-K filed with the Commission on May 26, 2015) |
|||
|
10.25# |
|
Letter Agreement dated September 11, 2016 between the Company and Patrick S. Miles (incorporated by reference to our Quarterly Report on Form 10-Q filed with the Commission on October 26, 2016) |
|||
|
10.26# |
|
Notice of Grant of Share Purchase Matching Performance Restricted Stock Units and Award Agreement granted to Gregory T. Lucier on May 22, 2015 (incorporated by reference to our Current Report on Form 8-K filed with the Commission on May 26, 2015) |
|||
|
10.27# |
|
Notice of Grant of “Inducement” Performance Restricted Stock Units and Award Agreement granted to Gregory T. Lucier on May 22, 2015 (incorporated by reference to our Current Report on Form 8-K filed with the Commission on May 26, 2015) |
|||
|
10.28# |
|
Notice of Grant of Share Purchase Matching Performance Restricted Stock Units and Award Agreement granted to Patrick S. Miles on September 11, 2016 (incorporated by reference to our Quarterly Report on Form 10-Q filed with the Commission on October 26, 2016) |
|||
|
10.29# |
|
Non-Employee Director Cash Compensation Plan (incorporated by reference to our Annual Report on Form 10-K filed with the Commission on March 3, 2014) |
|||
|
10.30 |
|
Lease Agreement for Sorrento Summit dated November 6, 2007 between the Company and HCPI/Sorrento, LLC (incorporated by reference to our Quarterly Report on Form 10-Q filed with the Commission on November 8, 2007) |
|||
|
10.31 |
|
Confirmation for base call option transaction dated June 22, 2011 between the Company and Bank of America, N.A. (incorporated by reference to our Current Report on Form 8-K filed with the Commission on June 29, 2011) |
|||
|
10.32 |
|
Confirmation for additional call option transaction dated June 24, 2011, between the Company and Bank of America, N.A. (incorporated by reference to our Current Report on Form 8-K filed with the Commission on June 29, 2011) |
|||
|
10.33 |
|
Confirmation for base call option transaction dated June 22, 2011 between the Company and Goldman, Sachs & Co. (incorporated by reference to our Current Report on Form 8-K filed with the Commission on June 29, 2011) |
|||
|
10.34 |
|
Confirmation for additional call option transaction dated June 24, 2011 between the Company and Goldman, Sachs & Co. (incorporated by reference to our Current Report on Form 8-K filed with the Commission on June 29, 2011) |
|||
|
10.35 |
|
Confirmation for base warrant transaction dated June 22, 2011 between the Company and Bank of America, N.A. (incorporated by reference to our Current Report on Form 8-K filed with the Commission on June 29, 2011) |
|||
|
10.36 |
|
Confirmation for additional warrant transaction dated June 24, 2011 between the Company and Bank of America, N.A. (incorporated by reference to our Current Report on Form 8-K filed with the Commission on June 29, 2011) |
|||
|
10.37 |
|
Confirmation for base warrant transaction dated June 22, 2011 between the Company and Goldman, Sachs & Co. (incorporated by reference to our Current Report on Form 8-K filed with the Commission on June 29, 2011) |
|||
|
10.38 |
|
Confirmation for additional warrant transaction dated June 24, 2011 between the Company and Goldman, Sachs & Co. (incorporated by reference to our Current Report on Form 8-K filed with the Commission on June 29, 2011) |
|||
|
10.39 |
|
Credit Agreement, dated February 8, 2016, by and among the Company, as the Borrower, Certain Subsidiaries of the Company, Bank of America, N.A. and each of those additional Lenders that are a party to such agreement (incorporated by reference to our Current Report on Form 8-K filed with the Commission on February 11, 2016) |
|||
|
10.40 |
|
Security and Pledge Agreement, dated February 8, 2016, by and among the Company, as the Borrower, and Certain Subsidiaries of the Company in favor of Bank of America, N.A. (incorporated by reference to our Current Report on Form 8-K filed with the Commission on February 11, 2016) |
|||
|
10.41 |
|
Amendment No. 1 to Credit Agreement, dated March 9, 2016, by and among the Company, as the Borrower, the Other Loan Parties, Bank of America, N.A. and each of those additional Lenders that are a party to such agreement (incorporated by reference to our Current Report on Form 8-K filed with the Commission on March 9, 2016) |
|||
65
|
Exhibit Number |
|
|
|
Description |
|
|
10.42 |
|
Confirmation for base call option transaction, dated March 10, 2016, by and between the Company and Bank of America, N.A. (incorporated by reference to our Current Report on Form 8-K filed with the Commission on March 16, 2016) |
|||
|
10.43 |
|
Confirmation for additional call option transaction, dated March 11, 2016, by and between the Company and Bank of America, N.A. (incorporated by reference to our Current Report on Form 8-K filed with the Commission on March 16, 2016) |
|||
|
10.44 |
|
Confirmation for base call option transaction, dated March 10, 2016, by and between the Company and Goldman, Sachs & Co. (incorporated by reference to our Current Report on Form 8-K filed with the Commission on March 16, 2016) |
|||
|
10.45 |
|
Confirmation for additional call option transaction, dated March 11, 2016, by and between the Company and Goldman, Sachs & Co. (incorporated by reference to our Current Report on Form 8-K filed with the Commission on March 16, 2016) |
|||
|
10.46 |
|
Confirmation for base warrant transaction, dated March 10, 2016, by and between the Company and Bank of America, N.A. (incorporated by reference to our Current Report on Form 8-K filed with the Commission on March 16, 2016) |
|||
|
10.47 |
|
Confirmation for additional warrant transaction, dated March 11, 2016, by and between the Company and Bank of America, N.A. (incorporated by reference to our Current Report on Form 8-K filed with the Commission on March 16, 2016) |
|||
|
10.48 |
|
Confirmation for base warrant transaction, dated March 10, 2016, by and between the Company and Goldman, Sachs & Co. (incorporated by reference to our Current Report on Form 8-K filed with the Commission on March 16, 2016) |
|||
|
10.49 |
|
Confirmation for additional warrant transaction, dated March 11, 2016, by and between the Company and Goldman, Sachs & Co. (incorporated by reference to our Current Report on Form 8-K filed with the Commission on March 16, 2016) |
|||
|
10.50 |
|
Preferred Stock Purchase Agreement dated January 13, 2009 among the Company, Progentix Orthobiology, B.V. and the sellers listed on Schedule A thereto (incorporated by reference to our Annual Report on Form 10-K filed with the Commission on February 26, 2010) |
|||
|
10.51† |
|
Option Purchase Agreement dated January 13, 2009 among the Company, Progentix Orthobiology, B.V. and the sellers listed on Schedule A thereto (incorporated by reference to our Annual Report on Form 10-K filed with the Commission on February 26, 2010) |
|||
|
10.52† |
|
Exclusive Distribution Agreement dated January 13, 2009 between the Company and Progentix Orthobiology, B.V. (incorporated by reference to our Quarterly Report on Form 10-Q filed with the Commission on May 8, 2009) |
|||
|
10.53† |
|
Settlement and License Agreement dated April 25, 2013 among the Company, Medtronic Sofamor Danek USA, Inc., Warsaw Orthopedic, Inc., Medtronic Puerto Rico Operations Co. and Medtronic Sofamor Danek Deggendorf, GmbH (incorporated by reference to our Quarterly Report on Form 10-Q filed with the Commission on July 30, 2013) |
|||
|
10.54† |
|
Settlement and Patent License Agreement dated July 13, 2016 between the Company and Medtronic plc together with its wholly owned subsidiaries Medtronic Sofamor Danek USA, Inc., Warsaw Orthopedic, Inc., Medtronic Puerto Rico Operations Co., and Medtronic Sofamor Danek Deggendorf GmbH (incorporated by reference to our Quarterly Report on Form 10-Q filed with the Commission on October 26, 2016) |
|||
|
21.1 |
|
List of subsidiaries of the Company |
|||
|
23.1 |
|
Consent of Independent Registered Public Accounting Firm |
|||
|
31.1 |
|
Certification of Chief Executive Officer pursuant to Rule 13a-14(a) and 15d-14(a) of the Securities Exchange Act of 1934, as amended |
|||
|
31.2 |
|
Certification of Chief Financial Officer pursuant to Rule 13a-14(a) and 15d-14(a) of the Securities Exchange Act of 1934, as amended |
|||
|
32.1* |
|
Certifications of the Chief Executive Officer and Chief Financial Officer pursuant to Rule 13a-14(b) of the Securities Exchange Act of 1934, as amended, and 18 U.S.C. section 1350 |
|||
66
|
Exhibit Number |
|
|
|
Description |
|
|
101 |
|
XBRL Instance Document |
|||
|
101 |
|
XBRL Taxonomy Extension Schema Document |
|||
|
101 |
|
XBRL Taxonomy Calculation Linkbase Document |
|||
|
101 |
|
XBRL Taxonomy Label Linkbase Document |
|||
|
101 |
|
XBRL Taxonomy Presentation Linkbase Document |
|||
|
101 |
|
XBRL Taxonomy Definition Linkbase Document |
|||
|
† |
Certain confidential information contained in this exhibit was omitted by means of redacting a portion of the text and replacing it with an asterisk. We have filed separately with the Commission an unredacted copy of the exhibit. |
|
# |
Indicates management contract or compensatory plan. |
|
* |
These certifications are being furnished solely to accompany this annual report pursuant to 18 U.S.C. Section 1350, and are not being filed for purposes of Section 18 of the Securities Exchange Act of 1934 and are not to be incorporated by reference into any filing of NuVasive, Inc., whether made before or after the date hereof, regardless of any general incorporation language in such filing. |
67
Pursuant to the requirements of Section 13 or 15(d) of the Securities Exchange Act of 1934, the Registrant has duly caused this report to be signed on its behalf by the undersigned, thereunto duly authorized.
|
|
|
|
NUVASIVE, INC. |
|
Date: February 9, 2017 |
|
|
|
|
By: /s/ Gregory T. Lucier |
|||
|
|
|
|
Gregory T. Lucier |
|
Chairman and Chief Executive Officer |
|||
|
(Principal Executive Officer) |
|||
|
Date: February 9, 2017 |
|
|
|
|
By: /s/ Quentin S. Blackford |
|||
|
|
|
|
Quentin S. Blackford |
|
Executive Vice President and |
|||
|
Chief Financial Officer |
|||
|
(Principal Financial Officer) |
|||
|
Date: February 9, 2017 |
|
|
|
|
By: /s/ Jereme M. Sylvain |
|||
|
|
|
|
Jereme M. Sylvain |
|
Vice President, Corporate Controller and |
|||
|
Chief Accounting Officer |
|||
|
(Principal Accounting Officer) |
68
KNOW ALL PERSONS BY THESE PRESENTS, that each person whose signature appears below constitutes and appoints Gregory T. Lucier and Quentin S. Blackford, jointly and severally, his or her attorneys-in-fact, each with the power of substitution, for him or her in any and all capacities, to sign any amendments to this Report on Form 10-K, and to file the same, with exhibits thereto and other documents in connection therewith with the Securities and Exchange Commission, hereby ratifying and confirming all that each of said attorneys-in-fact, or his or her substitute or substitutes may do or cause to be done by virtue hereof.
Pursuant to the requirements of the Securities Exchange Act of 1934, this report has been signed below by the following persons on behalf of the registrant and in the capacities and on the dates indicated.
|
Signature |
|
Title |
|
Date |
|
|
/s/ Gregory T. Lucier |
|
Chairman and Chief Executive Officer |
|
February 9, 2017 |
|
|
Gregory T. Lucier |
|
(Principal Executive Officer) |
|
|
|
|
|
|
|
|
|
|
|
/s/ Quentin S. Blackford |
|
Executive Vice President and Chief Financial Officer |
|
February 9, 2017 |
|
|
Quentin S. Blackford |
|
(Principal Financial Officer) |
|
|
|
|
|
|
|
|
|
|
|
/s/ Jereme M. Sylvain |
|
Vice President, Corporate Controller and Chief Accounting Officer |
|
February 9, 2017 |
|
|
Jereme M. Sylvain |
|
(Principal Accounting Officer) |
|
|
|
|
|
|
|
|
|
|
|
/s/ Robert F. Friel |
|
Director |
|
February 9, 2017 |
|
|
Robert F. Friel |
|
|
|
|
|
|
|
|
|
|
|
|
|
/s/ Vickie L. Capps |
|
Director |
|
February 9, 2017 |
|
|
Vickie L. Capps |
|
|
|
|
|
|
|
|
|
|
|
|
|
/s/ Peter C. Farrell, Ph.D, AM |
|
Director |
|
February 9, 2017 |
|
|
Peter C. Farrell, Ph.D, AM |
|
|
|
|
|
|
|
|
|
|
|
|
|
/s/ Lesley H. Howe |
|
Director |
|
February 9, 2017 |
|
|
Lesley H. Howe |
|
|
|
|
|
|
|
|
|
|
|
|
|
/s/ Leslie V. Norwalk, Esq. |
|
Director |
|
February 9, 2017 |
|
|
Leslie V. Norwalk, Esq. |
|
|
|
|
|
|
|
|
|
|
|
|
|
/s/ Daniel J. Wolterman |
|
Director |
|
February 9, 2017 |
|
|
Daniel J. Wolterman |
|
|
|
|
|
|
|
|
|
|
|
|
|
/s/ Donald J. Rosenberg |
|
Director |
|
February 9, 2017 |
|
|
Donald J. Rosenberg |
|
|
|
|
|
|
|
|
|
|
|
|
|
/s/ Patrick S. Miles |
|
Director |
|
February 9, 2017 |
|
|
Patrick S. Miles |
|
|
|
|
|
|
|
|
|
|
|
|
|
/s/ Michael D. O'Halleran |
|
Director |
|
February 9, 2017 |
|
|
Michael D. O'Halleran |
|
|
|
|
|
69
INDEX TO CONSOLIDATED FINANCIAL STATEMENTS
70
REPORT OF INDEPENDENT REGISTERED PUBLIC ACCOUNTING FIRM
The Board of Directors and Stockholders of NuVasive, Inc.
We have audited the accompanying consolidated balance sheets of NuVasive, Inc. as of December 31, 2016 and 2015, and the related consolidated statements of operations, comprehensive income (loss), equity, and cash flows for each of the three years in the period ended December 31, 2016. These financial statements are the responsibility of the Company’s management. Our responsibility is to express an opinion on these financial statements based on our audits.
We conducted our audits in accordance with the standards of the Public Company Accounting Oversight Board (United States). Those standards require that we plan and perform the audit to obtain reasonable assurance about whether the financial statements are free of material misstatement. An audit includes examining, on a test basis, evidence supporting the amounts and disclosures in the financial statements. An audit also includes assessing the accounting principles used and significant estimates made by management, as well as evaluating the overall financial statement presentation. We believe that our audits provide a reasonable basis for our opinion.
In our opinion, the financial statements referred to above present fairly, in all material respects, the consolidated financial position of NuVasive, Inc. at December 31, 2016 and 2015, and the consolidated results of its operations and its cash flows for each of the three years in the period ended December 31, 2016, in conformity with U.S. generally accepted accounting principles.
As discussed in Note 1 to the consolidated financial statements, the Company changed its method for accounting for employee share based payments as a result of the adoption of the amendments to the FASB Accounting Standards Codification resulting from Accounting Standards Update No. 2016-09, “Improvements to Employee Share-Based Payment,” effective January 1, 2016.
We also have audited, in accordance with the standards of the Public Company Accounting Oversight Board (United States), NuVasive, Inc.’s internal control over financial reporting as of December 31, 2016, based on criteria established in Internal Control — Integrated Framework issued by the Committee of Sponsoring Organizations of the Treadway Commission (2013 framework) and our report dated February 9, 2017 expressed an unqualified opinion thereon.
/s/ Ernst & Young LLP
San Diego, California
February 9, 2017
71
CONSOLIDATED BALANCE SHEETS
(In thousands, except par value and shares)
|
|
|
December 31, |
|
|||||
|
|
|
2016 |
|
|
2015 |
|
||
|
ASSETS |
|
|
|
|
|
|
|
|
|
Current assets: |
|
|
|
|
|
|
|
|
|
Cash and cash equivalents |
|
$ |
153,643 |
|
|
$ |
192,339 |
|
|
Short-term marketable securities |
|
|
— |
|
|
|
165,423 |
|
|
Accounts receivable, net of allowances of $8,912 and $5,320, respectively |
|
|
171,595 |
|
|
|
127,595 |
|
|
Inventory, net |
|
|
208,249 |
|
|
|
168,140 |
|
|
Prepaid income taxes |
|
|
31,926 |
|
|
|
40,540 |
|
|
Prepaid expenses and other current assets |
|
|
10,030 |
|
|
|
8,790 |
|
|
Total current assets |
|
|
575,443 |
|
|
|
702,827 |
|
|
Property and equipment, net |
|
|
181,524 |
|
|
|
141,441 |
|
|
Long-term marketable securities |
|
|
— |
|
|
|
112,332 |
|
|
Intangible assets, net |
|
|
291,143 |
|
|
|
85,076 |
|
|
Goodwill |
|
|
485,685 |
|
|
|
154,281 |
|
|
Deferred tax assets |
|
|
5,810 |
|
|
|
83,691 |
|
|
Restricted cash and investments |
|
|
7,405 |
|
|
|
5,615 |
|
|
Other assets |
|
|
23,794 |
|
|
|
17,404 |
|
|
Total assets |
|
$ |
1,570,804 |
|
|
$ |
1,302,667 |
|
|
LIABILITIES AND EQUITY |
|
|
|
|
|
|
|
|
|
Current liabilities: |
|
|
|
|
|
|
|
|
|
Accounts payable and accrued liabilities |
|
$ |
77,585 |
|
|
$ |
60,986 |
|
|
Contingent consideration liabilities |
|
|
49,742 |
|
|
|
— |
|
|
Accrued payroll and related expenses |
|
|
51,000 |
|
|
|
37,640 |
|
|
Income tax liabilities |
|
|
2,469 |
|
|
|
990 |
|
|
Short-term senior convertible notes |
|
|
61,701 |
|
|
|
— |
|
|
Total current liabilities |
|
|
242,497 |
|
|
|
99,616 |
|
|
Long-term senior convertible notes |
|
|
564,412 |
|
|
|
372,920 |
|
|
Deferred and income tax liabilities, non-current |
|
|
18,607 |
|
|
|
8,602 |
|
|
Non-current litigation liabilities |
|
|
— |
|
|
|
88,261 |
|
|
Other long-term liabilities |
|
|
44,764 |
|
|
|
14,425 |
|
|
Commitments and contingencies |
|
|
|
|
|
|
|
|
|
Stockholders’ equity: |
|
|
|
|
|
|
|
|
|
Preferred stock, $0.001 par value; 5,000,000 shares authorized, none outstanding |
|
|
— |
|
|
|
— |
|
|
Common stock, $0.001 par value; 120,000,000 shares authorized at December 31, 2016 and December 31, 2015, 55,184,660 and 52,616,471 issued and outstanding at December 31, 2016 and December 31, 2015, respectively |
|
|
55 |
|
|
|
53 |
|
|
Additional paid-in capital |
|
|
1,010,238 |
|
|
|
989,387 |
|
|
Accumulated other comprehensive loss |
|
|
(10,631 |
) |
|
|
(12,112 |
) |
|
Accumulated deficit |
|
|
(66,859 |
) |
|
|
(104,006 |
) |
|
Treasury stock at cost; 4,758,828 shares and 3,316,794 shares at December 31, 2016 and December 31, 2015, respectively |
|
|
(237,867 |
) |
|
|
(161,788 |
) |
|
Total NuVasive, Inc. stockholders’ equity |
|
|
694,936 |
|
|
|
711,534 |
|
|
Non-controlling interests |
|
|
5,588 |
|
|
|
7,309 |
|
|
Total equity |
|
|
700,524 |
|
|
|
718,843 |
|
|
Total liabilities and equity |
|
$ |
1,570,804 |
|
|
$ |
1,302,667 |
|
See accompanying notes to Consolidated Financial Statements.
72
CONSOLIDATED STATEMENTS OF OPERATIONS
(In thousands, except per share amounts)
|
|
|
Year Ended December 31, |
|
|||||||||
|
|
|
2016 |
|
|
2015 |
|
|
2014 |
|
|||
|
Revenue |
|
$ |
962,072 |
|
|
$ |
811,113 |
|
|
$ |
762,415 |
|
|
Cost of goods sold (excluding below amortization of intangible assets) |
|
|
240,093 |
|
|
|
194,479 |
|
|
|
182,358 |
|
|
Gross profit |
|
|
721,979 |
|
|
|
616,634 |
|
|
|
580,057 |
|
|
Operating expenses: |
|
|
|
|
|
|
|
|
|
|
|
|
|
Sales, marketing and administrative |
|
|
533,624 |
|
|
|
457,280 |
|
|
|
456,700 |
|
|
Research and development |
|
|
47,999 |
|
|
|
35,833 |
|
|
|
37,486 |
|
|
Amortization of intangible assets |
|
|
42,001 |
|
|
|
12,516 |
|
|
|
13,571 |
|
|
Impairment of intangible assets |
|
|
— |
|
|
|
— |
|
|
|
10,708 |
|
|
Litigation liability (gain) loss |
|
|
(43,310 |
) |
|
|
(41,826 |
) |
|
|
30,000 |
|
|
Business transition costs |
|
|
18,138 |
|
|
|
13,748 |
|
|
|
13,448 |
|
|
Total operating expenses |
|
|
598,452 |
|
|
|
477,551 |
|
|
|
561,913 |
|
|
Interest and other expense, net: |
|
|
|
|
|
|
|
|
|
|
|
|
|
Interest income |
|
|
1,091 |
|
|
|
1,589 |
|
|
|
968 |
|
|
Interest expense |
|
|
(40,520 |
) |
|
|
(29,078 |
) |
|
|
(27,911 |
) |
|
Loss on repurchases of convertible notes |
|
|
(19,085 |
) |
|
|
— |
|
|
|
— |
|
|
Other (expense) income, net |
|
|
(305 |
) |
|
|
425 |
|
|
|
(2,411 |
) |
|
Total interest and other expense, net |
|
|
(58,819 |
) |
|
|
(27,064 |
) |
|
|
(29,354 |
) |
|
Income (loss) before income taxes |
|
|
64,708 |
|
|
|
112,019 |
|
|
|
(11,210 |
) |
|
Income tax expense |
|
|
(29,282 |
) |
|
|
(46,729 |
) |
|
|
(6,286 |
) |
|
Consolidated net income (loss) |
|
$ |
35,426 |
|
|
$ |
65,290 |
|
|
$ |
(17,496 |
) |
|
Add back net loss attributable to non-controlling interests |
|
$ |
(1,721 |
) |
|
$ |
(1,001 |
) |
|
$ |
(776 |
) |
|
Net income (loss) attributable to NuVasive, Inc. |
|
$ |
37,147 |
|
|
$ |
66,291 |
|
|
$ |
(16,720 |
) |
|
|
|
|
|
|
|
|
|
|
|
|
|
|
|
Net income (loss) per share attributable to NuVasive, Inc.: |
|
|
|
|
|
|
|
|
|
|
|
|
|
Basic |
|
$ |
0.74 |
|
|
$ |
1.36 |
|
|
$ |
(0.36 |
) |
|
Diluted |
|
$ |
0.69 |
|
|
$ |
1.26 |
|
|
$ |
(0.36 |
) |
|
Weighted average shares outstanding: |
|
|
|
|
|
|
|
|
|
|
|
|
|
Basic |
|
|
50,077 |
|
|
|
48,687 |
|
|
|
46,715 |
|
|
Diluted |
|
|
54,102 |
|
|
|
52,424 |
|
|
|
46,715 |
|
See accompanying notes to Consolidated Financial Statements.
73
CONSOLIDATED STATEMENTS OF COMPREHENSIVE INCOME (LOSS)
(In thousands)
|
|
|
Year Ended December 31, |
|
|||||||||
|
|
|
2016 |
|
|
2015 |
|
|
2014 |
|
|||
|
Consolidated net income (loss) |
|
$ |
35,426 |
|
|
$ |
65,290 |
|
|
$ |
(17,496 |
) |
|
Other comprehensive income (loss): |
|
|
|
|
|
|
|
|
|
|
|
|
|
Unrealized gain (loss) on marketable securities, net of tax |
|
|
330 |
|
|
|
(344 |
) |
|
|
(161 |
) |
|
Translation adjustments, net of tax |
|
|
1,151 |
|
|
|
(2,098 |
) |
|
|
(6,271 |
) |
|
Other comprehensive income (loss): |
|
|
1,481 |
|
|
|
(2,442 |
) |
|
|
(6,432 |
) |
|
Total consolidated comprehensive income (loss) |
|
|
36,907 |
|
|
|
62,848 |
|
|
|
(23,928 |
) |
|
Net loss attributable to non-controlling interests |
|
|
1,721 |
|
|
|
1,001 |
|
|
|
776 |
|
|
Comprehensive income (loss) attributable to NuVasive, Inc. |
|
$ |
38,628 |
|
|
$ |
63,849 |
|
|
$ |
(23,152 |
) |
See accompanying notes to Consolidated Financial Statements.
74
CONSOLIDATED STATEMENTS OF EQUITY
(In thousands)
|
|
|
|
|
|
|
|
|
|
|
Additional |
|
|
Other |
|
|
|
|
|
|
|
|
|
|
|
|
|
|
NuVasive, Inc. |
|
|
Non- |
|
|
|
|
|
||||
|
|
|
Common Stock |
|
|
Paid-in |
|
|
Comprehensive |
|
|
Accumulated |
|
|
Treasury Stock |
|
|
Stockholders' |
|
|
Controlling |
|
|
Total |
|
||||||||||||||||
|
|
|
Shares |
|
|
Amount |
|
|
Capital |
|
|
Income (Loss) |
|
|
Deficit |
|
|
Shares |
|
|
Amount |
|
|
Equity |
|
|
Interests |
|
|
Equity |
|
||||||||||
|
Balance at December 31, 2013 |
|
|
44,943 |
|
|
$ |
45 |
|
|
$ |
769,203 |
|
|
$ |
(3,238 |
) |
|
$ |
(170,218 |
) |
|
|
— |
|
|
$ |
— |
|
|
$ |
595,792 |
|
|
$ |
9,086 |
|
|
$ |
604,878 |
|
|
Issuance of common stock under employee and director stock option and purchase plans |
|
|
2,660 |
|
|
|
3 |
|
|
|
30,106 |
|
|
|
— |
|
|
|
— |
|
|
|
(233 |
) |
|
|
(10,537 |
) |
|
|
19,572 |
|
|
|
— |
|
|
|
19,572 |
|
|
Stock-based compensation expense |
|
|
— |
|
|
|
— |
|
|
|
33,687 |
|
|
|
— |
|
|
|
— |
|
|
|
— |
|
|
|
— |
|
|
|
33,687 |
|
|
|
— |
|
|
|
33,687 |
|
|
Tax benefits related to stock-based compensation awards |
|
|
— |
|
|
|
— |
|
|
|
10,988 |
|
|
|
— |
|
|
|
— |
|
|
|
— |
|
|
|
— |
|
|
|
10,988 |
|
|
|
— |
|
|
|
10,988 |
|
|
Issuance of common stock in connection with royalty milestone achievement |
|
|
88 |
|
|
|
— |
|
|
|
3,161 |
|
|
|
— |
|
|
|
— |
|
|
|
— |
|
|
|
— |
|
|
|
3,161 |
|
|
|
- |
|
|
|
3,161 |
|
|
Net loss attributable to NuVasive, Inc. |
|
|
— |
|
|
|
— |
|
|
|
— |
|
|
|
— |
|
|
|
(16,720 |
) |
|
|
— |
|
|
|
— |
|
|
|
(16,720 |
) |
|
|
— |
|
|
|
(16,720 |
) |
|
Net loss attributable to non-controlling interests |
|
|
— |
|
|
|
— |
|
|
|
— |
|
|
|
— |
|
|
|
— |
|
|
|
— |
|
|
|
— |
|
|
|
— |
|
|
|
(776 |
) |
|
|
(776 |
) |
|
Other comprehensive loss |
|
|
— |
|
|
|
— |
|
|
|
— |
|
|
|
(6,432 |
) |
|
|
— |
|
|
|
— |
|
|
|
— |
|
|
|
(6,432 |
) |
|
|
— |
|
|
|
(6,432 |
) |
|
Balance at December 31, 2014 |
|
|
47,691 |
|
|
$ |
48 |
|
|
$ |
847,145 |
|
|
$ |
(9,670 |
) |
|
$ |
(186,938 |
) |
|
|
(233 |
) |
|
$ |
(10,537 |
) |
|
$ |
640,048 |
|
|
$ |
8,310 |
|
|
$ |
648,358 |
|
|
Issuance of common stock under employee and director stock option and purchase plans |
|
|
4,925 |
|
|
|
5 |
|
|
|
106,434 |
|
|
|
— |
|
|
|
— |
|
|
|
(3,083 |
) |
|
|
(151,251 |
) |
|
|
(44,812 |
) |
|
|
— |
|
|
|
(44,812 |
) |
|
Stock-based compensation expense |
|
|
— |
|
|
|
— |
|
|
|
25,364 |
|
|
|
— |
|
|
|
— |
|
|
|
— |
|
|
|
— |
|
|
|
25,364 |
|
|
|
— |
|
|
|
25,364 |
|
|
Tax benefits related to stock-based compensation awards |
|
|
— |
|
|
|
— |
|
|
|
10,444 |
|
|
|
— |
|
|
|
— |
|
|
|
— |
|
|
|
— |
|
|
|
10,444 |
|
|
|
— |
|
|
|
10,444 |
|
|
Net income attributable to NuVasive, Inc. |
|
|
— |
|
|
|
— |
|
|
|
— |
|
|
|
— |
|
|
|
66,291 |
|
|
|
— |
|
|
|
— |
|
|
|
66,291 |
|
|
|
— |
|
|
|
66,291 |
|
|
Net loss attributable to non-controlling interests |
|
|
— |
|
|
|
— |
|
|
|
— |
|
|
|
— |
|
|
|
— |
|
|
|
— |
|
|
|
— |
|
|
|
— |
|
|
|
(1,001 |
) |
|
|
(1,001 |
) |
|
Other comprehensive loss |
|
|
— |
|
|
|
— |
|
|
|
— |
|
|
|
(2,442 |
) |
|
|
— |
|
|
|
— |
|
|
|
— |
|
|
|
(2,442 |
) |
|
|
— |
|
|
|
(2,442 |
) |
|
Balance at December 31, 2015 |
|
|
52,616 |
|
|
$ |
53 |
|
|
$ |
989,387 |
|
|
$ |
(12,112 |
) |
|
$ |
(120,647 |
) |
|
|
(3,316 |
) |
|
$ |
(161,788 |
) |
|
$ |
694,893 |
|
|
$ |
7,309 |
|
|
$ |
702,202 |
|
|
Adjustment for modified retrospective adoption of accounting standard |
|
|
— |
|
|
|
— |
|
|
|
— |
|
|
|
— |
|
|
|
16,641 |
|
|
|
— |
|
|
|
— |
|
|
|
16,641 |
|
|
|
— |
|
|
|
16,641 |
|
|
Balance at December 31, 2015, as adjusted |
|
|
52,616 |
|
|
$ |
53 |
|
|
$ |
989,387 |
|
|
$ |
(12,112 |
) |
|
$ |
(104,006 |
) |
|
|
(3,316 |
) |
|
$ |
(161,788 |
) |
|
$ |
711,534 |
|
|
$ |
7,309 |
|
|
$ |
718,843 |
|
|
Issuance of common stock under employee and director stock option and purchase plans |
|
|
2,480 |
|
|
|
2 |
|
|
|
60,720 |
|
|
|
— |
|
|
|
— |
|
|
|
(1,443 |
) |
|
|
(76,079 |
) |
|
|
(15,357 |
) |
|
|
— |
|
|
|
(15,357 |
) |
|
Stock-based compensation expense |
|
|
— |
|
|
|
— |
|
|
|
24,981 |
|
|
|
— |
|
|
|
— |
|
|
|
— |
|
|
|
— |
|
|
|
24,981 |
|
|
|
— |
|
|
|
24,981 |
|
|
Tax benefits related to convertible note repurchase |
|
|
— |
|
|
|
— |
|
|
|
13,374 |
|
|
|
— |
|
|
|
— |
|
|
|
— |
|
|
|
— |
|
|
|
13,374 |
|
|
|
— |
|
|
|
13,374 |
|
|
Issuance of common stock in connection with royalty milestone achievement |
|
|
88 |
|
|
|
— |
|
|
|
5,761 |
|
|
|
— |
|
|
|
— |
|
|
|
— |
|
|
|
— |
|
|
|
5,761 |
|
|
|
— |
|
|
|
5,761 |
|
|
Issuance of common stock through conversion of notes payable |
|
|
1 |
|
|
|
— |
|
|
|
— |
|
|
|
— |
|
|
|
— |
|
|
|
— |
|
|
|
— |
|
|
|
— |
|
|
|
— |
|
|
|
— |
|
|
Sale of warrants |
|
|
— |
|
|
|
— |
|
|
|
44,850 |
|
|
|
— |
|
|
|
— |
|
|
|
— |
|
|
|
— |
|
|
|
44,850 |
|
|
|
— |
|
|
|
44,850 |
|
|
Convertible note hedge |
|
|
— |
|
|
|
— |
|
|
|
(111,150 |
) |
|
|
— |
|
|
|
— |
|
|
|
— |
|
|
|
— |
|
|
|
(111,150 |
) |
|
|
— |
|
|
|
(111,150 |
) |
|
Equity component of convertible note issuance |
|
|
— |
|
|
|
— |
|
|
|
84,784 |
|
|
|
— |
|
|
|
— |
|
|
|
— |
|
|
|
— |
|
|
|
84,784 |
|
|
|
— |
|
|
|
84,784 |
|
|
Equity component of convertible note repurchase |
|
|
— |
|
|
|
— |
|
|
|
(100,524 |
) |
|
|
— |
|
|
|
— |
|
|
|
— |
|
|
|
— |
|
|
|
(100,524 |
) |
|
|
— |
|
|
|
(100,524 |
) |
|
Debt issuance costs attributable to convertible feature |
|
|
— |
|
|
|
— |
|
|
|
(1,931 |
) |
|
|
— |
|
|
|
— |
|
|
|
— |
|
|
|
— |
|
|
|
(1,931 |
) |
|
|
— |
|
|
|
(1,931 |
) |
|
Securities registration fees |
|
|
— |
|
|
|
— |
|
|
|
(14 |
) |
|
|
— |
|
|
|
— |
|
|
|
— |
|
|
|
— |
|
|
|
(14 |
) |
|
|
— |
|
|
|
(14 |
) |
|
Net income attributable to NuVasive, Inc. |
|
|
— |
|
|
|
— |
|
|
|
— |
|
|
|
— |
|
|
|
37,147 |
|
|
|
— |
|
|
|
— |
|
|
|
37,147 |
|
|
|
— |
|
|
|
37,147 |
|
|
Net loss attributable to non-controlling interests |
|
|
— |
|
|
|
— |
|
|
|
— |
|
|
|
— |
|
|
|
— |
|
|
|
— |
|
|
|
— |
|
|
|
— |
|
|
|
(1,721 |
) |
|
|
(1,721 |
) |
|
Other comprehensive income |
|
|
— |
|
|
|
— |
|
|
|
— |
|
|
|
1,481 |
|
|
|
— |
|
|
|
— |
|
|
|
— |
|
|
|
1,481 |
|
|
|
— |
|
|
|
1,481 |
|
|
Balance at December 31, 2016 |
|
|
55,185 |
|
|
$ |
55 |
|
|
$ |
1,010,238 |
|
|
$ |
(10,631 |
) |
|
$ |
(66,859 |
) |
|
|
(4,759 |
) |
|
$ |
(237,867 |
) |
|
$ |
694,936 |
|
|
$ |
5,588 |
|
|
$ |
700,524 |
|
See accompanying notes to Consolidated Financial Statements.
75
CONSOLIDATED STATEMENTS OF CASH FLOWS
(In thousands)
|
|
|
Year Ended December 31, |
|
|||||||||
|
|
|
2016 |
|
|
2015 |
|
|
2014 |
|
|||
|
Operating activities: |
|
|
|
|
|
|
|
|
|
|
|
|
|
Consolidated net income (loss) |
|
$ |
35,426 |
|
|
$ |
65,290 |
|
|
$ |
(17,496 |
) |
|
Adjustments to reconcile net income (loss) to net cash provided by operating activities: |
|
|
|
|
|
|
|
|
|
|
|
|
|
Depreciation and amortization |
|
|
102,713 |
|
|
|
65,915 |
|
|
|
65,837 |
|
|
Deferred income tax expense (benefit) |
|
|
26,265 |
|
|
|
34,757 |
|
|
|
(23,231 |
) |
|
Loss on repurchases of convertible notes |
|
|
19,085 |
|
|
|
— |
|
|
|
— |
|
|
Amortization of non-cash interest |
|
|
22,721 |
|
|
|
17,851 |
|
|
|
16,490 |
|
|
Stock-based compensation |
|
|
26,924 |
|
|
|
26,203 |
|
|
|
33,687 |
|
|
Impairment of intangible assets |
|
|
— |
|
|
|
— |
|
|
|
10,708 |
|
|
Reserves on current assets |
|
|
11,408 |
|
|
|
9,454 |
|
|
|
1,856 |
|
|
Other non-cash adjustments |
|
|
16,928 |
|
|
|
17,581 |
|
|
|
13,191 |
|
|
Changes in operating assets and liabilities, net of effects from acquisitions: |
|
|
|
|
|
|
|
|
|
|
|
|
|
Accounts receivable |
|
|
(33,250 |
) |
|
|
(9,463 |
) |
|
|
(18,465 |
) |
|
Inventory |
|
|
(22,636 |
) |
|
|
(25,984 |
) |
|
|
(21,343 |
) |
|
Prepaid expenses and other current assets |
|
|
(5,665 |
) |
|
|
1,239 |
|
|
|
(5,183 |
) |
|
Accounts payable and accrued liabilities |
|
|
11,854 |
|
|
|
7,742 |
|
|
|
5,855 |
|
|
Accrued royalties |
|
|
471 |
|
|
|
(46,092 |
) |
|
|
12,410 |
|
|
Accrued payroll and related expenses |
|
|
8,849 |
|
|
|
(192 |
) |
|
|
7,179 |
|
|
Litigation liability |
|
|
(88,450 |
) |
|
|
(36,270 |
) |
|
|
30,000 |
|
|
Income taxes |
|
|
23,652 |
|
|
|
(39,304 |
) |
|
|
4,053 |
|
|
Net cash provided by operating activities |
|
|
156,295 |
|
|
|
88,727 |
|
|
|
115,548 |
|
|
Investing activities: |
|
|
|
|
|
|
|
|
|
|
|
|
|
Acquisition of Ellipse Technologies, net of cash acquired |
|
|
(380,080 |
) |
|
|
— |
|
|
|
— |
|
|
Other acquisitions and investments |
|
|
(108,591 |
) |
|
|
(1,357 |
) |
|
|
(500 |
) |
|
Purchases of intangible assets |
|
|
(5,918 |
) |
|
|
(32,020 |
) |
|
|
— |
|
|
Proceeds from sales of property and equipment |
|
|
— |
|
|
|
40 |
|
|
|
241 |
|
|
Purchases of property and equipment |
|
|
(88,372 |
) |
|
|
(75,772 |
) |
|
|
(58,424 |
) |
|
Purchases of marketable securities |
|
|
(128,956 |
) |
|
|
(427,945 |
) |
|
|
(217,158 |
) |
|
Proceeds from sales of marketable securities |
|
|
407,032 |
|
|
|
411,471 |
|
|
|
174,816 |
|
|
Proceeds from sales of restricted investments |
|
|
— |
|
|
|
180,694 |
|
|
|
— |
|
|
Purchases of restricted investments |
|
|
— |
|
|
|
(62,625 |
) |
|
|
(3,800 |
) |
|
Net cash used in investing activities |
|
|
(304,885 |
) |
|
|
(7,514 |
) |
|
|
(104,825 |
) |
|
Financing activities: |
|
|
|
|
|
|
|
|
|
|
|
|
|
Incremental tax benefits related to stock-based compensation awards |
|
|
— |
|
|
|
15,185 |
|
|
|
11,896 |
|
|
Proceeds from the issuance of common stock |
|
|
9,492 |
|
|
|
12,106 |
|
|
|
23,354 |
|
|
Payment of contingent consideration |
|
|
(422 |
) |
|
|
(514 |
) |
|
|
(498 |
) |
|
Purchase of treasury stock |
|
|
(24,734 |
) |
|
|
(56,929 |
) |
|
|
(3,782 |
) |
|
Proceeds from issuance of convertible debt, net of issuance costs |
|
|
634,140 |
|
|
|
— |
|
|
|
— |
|
|
Proceeds from sale of warrants |
|
|
44,850 |
|
|
|
— |
|
|
|
— |
|
|
Purchase of convertible note hedge |
|
|
(111,150 |
) |
|
|
— |
|
|
|
— |
|
|
Repurchases of convertible notes |
|
|
(439,519 |
) |
|
|
— |
|
|
|
— |
|
|
Proceeds from revolving line of credit |
|
|
50,000 |
|
|
|
— |
|
|
|
— |
|
|
Repayments on revolving line of credit |
|
|
(50,000 |
) |
|
|
— |
|
|
|
— |
|
|
Other financing activities |
|
|
(1,834 |
) |
|
|
(192 |
) |
|
|
(693 |
) |
|
Net cash provided by (used in) financing activities |
|
|
110,823 |
|
|
|
(30,344 |
) |
|
|
30,277 |
|
|
Effect of exchange rate changes on cash |
|
|
(929 |
) |
|
|
(917 |
) |
|
|
(1,438 |
) |
|
(Decrease) increase in cash and cash equivalents |
|
|
(38,696 |
) |
|
|
49,952 |
|
|
|
39,562 |
|
|
Cash and cash equivalents at beginning of year |
|
|
192,339 |
|
|
|
142,387 |
|
|
|
102,825 |
|
|
Cash and cash equivalents at end of year |
|
$ |
153,643 |
|
|
$ |
192,339 |
|
|
$ |
142,387 |
|
|
Supplemental disclosure of non-cash transactions: |
|
|
|
|
|
|
|
|
|
|
|
|
|
Intangible asset purchase |
|
$ |
— |
|
|
$ |
— |
|
|
$ |
27,389 |
|
|
Issuance of common stock in connection with royalty milestone achievement |
|
$ |
5,761 |
|
|
$ |
— |
|
|
$ |
3,161 |
|
|
Supplemental cash flow information: |
|
|
|
|
|
|
|
|
|
|
|
|
|
Interest paid |
|
$ |
13,249 |
|
|
$ |
11,069 |
|
|
$ |
11,069 |
|
|
Income taxes (refunded) paid |
|
$ |
(20,499 |
) |
|
$ |
36,303 |
|
|
$ |
13,640 |
|
See accompanying notes to Consolidated Financial Statements.
76
NOTES TO CONSOLIDATED FINANCIAL STATEMENTS
1. Organization and Significant Accounting Policies
Description of Business
NuVasive, Inc. (the “Company” or “NuVasive”) was incorporated in Delaware on July 21, 1997, and began commercializing its products in 2001. The Company’s principal product offering includes a minimally-disruptive surgical platform called Maximum Access Surgery, or MAS. The MAS platform combines three categories of solutions that collectively minimize soft tissue disruption during spine fusion surgery, provide maximum visualization and are designed to enable safe and reproducible outcomes for the surgeon and the patient. The platform includes the Company’s proprietary software-driven nerve detection and avoidance systems and Intraoperative Monitoring (“IOM”) services and support; MaXcess, an integrated split-blade retractor system; and a wide variety of specialized implants and biologics. In May 2015, the Company launched Integrated Global Alignment (“iGA”); in which products and computer assisted technology under the MAS platform help achieve more precise spinal alignment. The individual components of the MAS platform, and many of the Company’s products, can also be used in open or traditional spine surgery. The Company continues to focus research and development efforts to expand its MAS product platform and advance the applications of its unique technology into procedurally-integrated surgical solutions. The Company dedicates significant resources toward training spine surgeons on its unique technology and products.
The Company’s primary business model is to loan its MAS systems to surgeons and hospitals that purchase implants, biologics and disposables for use in individual procedures. In addition, for larger customers, the Company’s proprietary nerve monitoring systems, MaXcess and surgical instrument sets are placed with hospitals for an extended period at no up-front cost to them. The Company also offers a range of bone allograft in patented saline packaging, disposables and spine implants, which include its branded CoRoent products and fixation devices such as rods, plates and screws. The Company sells MAS instrument sets, MaXcess and nerve monitoring systems to hospitals, however, such sales are immaterial to the Company’s results of operations.
On February 11, 2016, the Company acquired Ellipse Technologies, Inc. (“Ellipse Technologies”), which operates as a wholly owned subsidiary under the renamed legal entity NuVasive Specialized Orthopedics, Inc. (“NSO”). NSO designs and sells expandable growing rod implant systems that can be non-invasively lengthened following implantation with precise, incremental adjustments via an external remote controller using magnetic technology called MAGnetic External Control, or MAGEC. The technology platform provides the basis of NSO’s core product offerings, including MAGEC-EOS, which allows for the minimally invasive treatment of early-onset and adolescent scoliosis, as well as the PRECICE limb lengthening system, which allows for the correction of long bone limb length discrepancy, as well as enhanced bone healing in patients that have experienced traumatic injury.
In July 2016, the Company acquired BNN Holdings Corp., which through its subsidiaries and affiliates, owns and operates Biotronic NeuroNetwork, a patient-centric healthcare organization that provides intraoperative neurophysiological monitoring services to surgeons and healthcare facilities across the U.S. The Company combined the service offerings of Biotronic NeuroNetwork with its Impulse Monitoring, Inc. business under the newly created division NuVasive Clinical Services (“NCS”).
In September 2016, the Company acquired the LessRay software technology suite, which is designed to be integrated into current surgeon workflow and utilizes an algorithm to drive image registration and help surgeons and hospital staff manage radiation exposure using low-dose image quality enhancement. This technology is expected to become an integral component of the IOM service and MAS platform although, sales related to this technology are currently immaterial to the Company’s results of operations.
The Company intends to continue development on a wide variety of projects intended to broaden surgical applications for greater procedural integration of its MAS techniques and additional applications of the MAGEC technology. Such applications include tumor, trauma, and deformity, as well as increased fixation options, sagittal alignment products, imaging and navigation. The Company also expects to continue expanding its other product and services offerings as it executes on its strategy to offer customers an end-to-end, integrated procedural solution for spine surgery.
Basis of Presentation and Principles of Consolidation
The accompanying Consolidated Financial Statements include the accounts of the Company and its majority-owned or controlled subsidiaries, collectively referred to as either NuVasive or the Company. The Company translates the financial statements of its foreign subsidiaries using end-of-period exchange rates for assets and liabilities and average exchange rates during each reporting period for results of operations. When there is a portion of equity in an acquired subsidiary not attributable, directly or indirectly, to the respective parent entity, the Company records the fair value of the non-controlling interests at the acquisition date and classifies the amounts attributable to non-controlling interests separately in equity in the Company's Consolidated Financial Statements. Any subsequent changes in a parent's ownership interest while the parent retains its controlling financial interest in its subsidiary are accounted for as equity transactions. All significant intercompany balances and transactions have been eliminated in consolidation.
77
The Company has reclassified historically presented product line revenue to conform to the current period presentation. The Company has also reclassified certain operating expenses into business transition costs. Both reclassifications have no impact on previously reported results of operations or financial position. Refer to “Recently Adopted Accounting Standards” below for information regarding historical financial information adjusted for a change in accounting policy.
Use of Estimates
To prepare financial statements in conformity with generally accepted accounting principles (“GAAP”) accepted in the United States, management must make estimates and assumptions that affect the amounts reported in the financial statements and accompanying notes. Actual results could differ from those estimates.
Recent Accounting Pronouncements Not Yet Adopted
In May 2014, the Financial Accounting Standards Board (“FASB”) issued Accounting Standard Update No. 2014-09, Revenue from Contracts with Customers (“ASU 2014-09”), an updated standard on revenue recognition. ASU 2014-09 provides enhancements to the quality and consistency of how revenue is reported by companies while also improving comparability in the financial statements of companies reporting using International Financial Reporting Standards or GAAP. The main purpose of the new standard is for companies to recognize revenue to depict the transfer of goods or services to customers in amounts that reflect the consideration to which a company expects to be entitled in exchange for those goods or services. The new standard also will result in enhanced disclosures about revenue, provide guidance for transactions that were not previously addressed comprehensively and improve guidance for multiple-element arrangements. In August 2015, the FASB issued ASU No. 2015-14, Revenue from Contracts with Customers: Deferral of the Effective Date, which deferred the effective date of the new revenue standard for periods beginning after December 15, 2016 to December 15, 2017, with early adoption permitted but not earlier than the original effective date. Accordingly, the updated standard is effective for the Company in the first quarter of fiscal 2018. The Company performed a preliminary assessment of the impact of ASU 2014-09 on the Consolidated Financial Statements, and considered all items outlined in the standard. In assessing the impact, the Company has outlined all revenue generating activities, mapped those activities to deliverables and traced those deliverables to the standard. The Company is now assessing what impact the change in standard will have on those deliverables. The Company will continue to evaluate the future impact and method of adoption of ASU 2014-09 and related amendments on the Consolidated Financial Statements and related disclosures throughout 2017. The Company will adopt the new standard beginning January 2018.
In January 2016, the FASB issued Accounting Standards Update No. 2016-01, Financial Instruments-Overall: Recognition and Measurement of Financial Assets and Financial Liabilities (“ASU 2016-01”), which requires that (i) all equity investments, other than equity-method investments, in unconsolidated entities generally be measured at fair value through earnings and (ii) when the fair value option has been elected for financial liabilities, changes in fair value due to instrument-specific credit risk will be recognized separately in other comprehensive income. Additionally, the ASU 2016-01 changes the disclosure requirements for financial instruments. The new standard will be effective for the Company starting in the first quarter of fiscal 2019. Early adoption is permitted for certain provisions. The Company is in the process of determining the effects the adoption will have on its Consolidated Financial Statements as well as whether to adopt certain provisions early.
In February 2016, the FASB issued Accounting Standards Update No. 2016-02, Leases, which outlines a comprehensive lease accounting model and supersedes the current lease guidance. The new accounting standard requires lessees to recognize lease liabilities and corresponding right-of-use assets for all leases with lease terms of greater than twelve months. It also changes the definition of a lease and expands the disclosure requirements of lease arrangements. The new accounting standard must be adopted using the modified retrospective approach and will be effective for the Company starting in the first quarter of fiscal 2019. Early adoption is permitted. The Company is in the process of determining the effects the adoption will have on its Consolidated Financial Statements as well as whether to adopt the new guidance early.
In June 2016, the FASB issued Accounting Standards Update No. 2016-13, Financial Instruments – Credit Losses, which changes the accounting for recognizing impairments of financial assets. Under the new guidance, credit losses for certain types of financial instruments will be estimated based on expected losses. The new guidance also modifies the impairment models for available-for-sale debt securities and for purchased financial assets with credit deterioration since their origination. The new guidance will be effective for the Company starting in the first quarter of fiscal 2021. Early adoption is permitted starting in the first quarter of fiscal 2020. The Company is in the process of determining the effects the adoption will have on its Consolidated Financial Statements as well as whether to adopt the new guidance early.
78
In August 2016, the FASB issued Accounting Standards Update No. 2016-15, Classification of Certain Cash Receipts and Cash Payments (“ASU 2016-15”), which eliminates the diversity in practice related to the classification of certain cash receipts and payments for debt prepayment or extinguishment costs, the maturing of a zero coupon bond, the settlement of contingent liabilities arising from a business combination, proceeds from insurance settlements, distributions from certain equity method investees and beneficial interests obtained in a financial asset securitization. ASU 2016-15 designates the appropriate cash flow classification, including requirements to allocate certain components of these cash receipts and payments among operating, investing and financing activities. The retrospective transition method, requiring adjustment to all comparative periods presented, is required unless it is impracticable for some of the amendments, in which case those amendments would be prospectively as of the earliest date practicable. This update is effective for annual periods beginning after December 15, 2017, and interim periods within those fiscal years, with early adoption permitted, including adoption in an interim period. The Company does not expect the adoption to have any significant impact on its Consolidated Financial Statements.
In October 2016, the FASB issued Accounting Standards Update No. 2016-16, Intra-Entity Transfers of Assets Other Than Inventory (“ASU 2016-16”), which aims to improve the accounting for the income tax consequences of intra-entity transfers of assets other than inventory. This amendment requires an entity to recognize the income tax consequences of an intra-entity transfer of an asset other than inventory when the transfer occurs. The amendments in this update should be applied on a modified retrospective basis through a cumulative-effect adjustment directly to retained earnings as of the beginning of the period of adoption. This update is effective for annual periods beginning after December 15, 2017, and interim periods within those fiscal years with early adoption permitted, including adoption in an interim period. The Company is considering early adoption of ASU 2016-16 in the first quarter 2017, which would result in a modified retrospective adjustment increasing accumulated deficit and decreasing prepaid income taxes by approximately $11.6 million at the time of adoption.
In November 2016, the FASB issued Accounting Standards Update No. 2016-18, Restricted Cash, which requires entities to show the changes in the total of cash, cash equivalents, restricted cash and restricted cash equivalents in the statement of cash flows. As a result, entities will no longer present transfers between cash and cash equivalents and restricted cash and restricted cash equivalents in the statement of cash flows. The amendments in this update should be applied using a retrospective transition method to each period presented. This update is effective for annual periods beginning after December 15, 2017, and interim periods within those fiscal years with early adoption permitted, including adoption in an interim period. The Company does not believe the effects of the adoption will have a material effect on its Consolidated Financial Statements and is assessing whether to adopt the new guidance early.
In January 2017, the FASB issued Accounting Standards Update No. 2017-01, Clarifying the Definition of a Business, which clarifies and provides a more robust framework to use in determining when a set of assets and activities is a business. The amendments in this update should be applied prospectively on or after the effective date. This update is effective for annual periods beginning after December 15, 2017, and interim periods within those periods. Early adoption is permitted for acquisition or deconsolidation transactions occurring before the issuance date or effective date and only when the transactions have not been reported in issued or made available for issuance financial statements. The Company does not expect the adoption to have any significant impact on its Consolidated Financial Statements, and is in the process of determining whether to adopt the new guidance early.
Recently Adopted Accounting Standards
In April 2014, the FASB issued Accounting Standards Update No. 2015-03 amended requirements that require debt issuance costs, related to a recognized debt liability, to be presented in the balance sheet as a direct deduction from the carrying amount of that debt liability, effective for the Company beginning January 1, 2016 applied retroactively for all Consolidated Balance Sheets presented. The Company applied the amended presentation requirements in the first quarter 2016, which does not have a material impact on its financial statements. This change resulted in a reclassification of debt issuance costs from other assets to senior convertible notes on the Consolidated Balance Sheets presented. See Note 6 to the Consolidated Financial Statements included in this Annual Report for revised presentation.
79
In March 2016, the FASB issued Accounting Standards Update 2016-09, Improvements to Employee Share-Based Payment Accounting (“ASU 2016-09”), which simplifies the accounting for employee share-based payments. The new standard requires the immediate recognition of all excess tax benefits and deficiencies in the income statement, and requires classification of excess tax benefits as an operating activity as opposed to a financing activity in the statements of cash flows. The provisions of the new standard are effective for the Company beginning January 1, 2017, with early adoption permitted. The Company elected to early adopt ASU 2016-09 in the second quarter 2016, which requires any adjustments to be recorded as of the beginning of fiscal 2016. As a result, the Company recorded a modified retrospective adjustment of $16.6 million to deferred tax assets and accumulated deficit as of January 1, 2016, and a retrospective adjustment to the previously reported first quarter 2016 provision for income taxes of approximately $5.5 million for the recognition of excess tax benefits in the provision for income taxes rather than additional paid-in capital. This resulted in a decrease in net loss per share of $0.11 for the three months ended March 31, 2016. The Company elected to apply the change in classification for excess tax benefits in the statement of cash flows on a prospective basis, and elected to continue estimating stock-based compensation award forfeitures in determining the amount of compensation cost to be recognized each period.
Revenue Recognition
In accordance with the Securities and Exchange Commission’s guidance, the Company recognizes revenue when all four of the following criteria are met: (i) persuasive evidence that an arrangement exists; (ii) delivery of the products and/or services has occurred; (iii) the selling price is fixed or determinable; and (iv) collectability is reasonably assured. Specifically, revenue from the sale of implants, biologics and disposables is generally recognized upon acknowledgment of a purchase order from the hospital indicating product use or implantation or upon shipment to third-party customers who immediately accept title. Revenue from monitoring services is recognized in the period the service is performed for the amount of payment expected to be received. Revenue from the sale of instrument sets is recognized upon receipt of a purchase order and the subsequent shipment to customers who immediately accept title.
Accounts Receivable and Related Valuation Accounts
Accounts receivable in the accompanying Consolidated Balance Sheets are presented net of allowances for doubtful accounts. The Company performs credit evaluations of its customers’ financial condition and, generally, requires no collateral from its customers. The Company makes judgments as to its ability to collect outstanding receivables and provides an allowance for specific receivables if and when collection becomes doubtful. Provisions are made based upon a specific review of all significant outstanding invoices as well as a review of the overall quality and age of those invoices not specifically reviewed. In determining the provision for invoices not specifically reviewed, the Company analyzes historical collection experience and current economic trends.
In addition, the Company establishes a reserve for estimated sales returns and price adjustments that is recorded as a reduction to revenue. This reserve is maintained to account for the future return and price adjustments of products sold in the current period.
Concentration of Credit Risk and Significant Customers
Financial instruments, which potentially subject the Company to concentrations of credit risk, consist primarily of cash and cash equivalents, short-term and long-term marketable securities and accounts receivable. The Company limits its exposure to credit loss by placing its cash and investments with high credit quality financial institutions. Additionally, the Company has established guidelines regarding diversification of its investments and their maturities, which are designed to maintain principal and maximize liquidity. Additionally, the Company has a diverse customer base and no single customer represented greater than ten percent of sales or accounts receivable for any of the periods presented.
Fair Value of Financial Instruments
The Company’s financial instruments consist principally of cash and cash equivalents, marketable securities, restricted investments, derivatives, contingent considerations, accounts receivable, accounts payable, accrued expenses, and Senior Convertible Notes.
The Company measures certain assets and liabilities in accordance with authoritative guidance which requires fair value measurements to be classified and disclosed in one of the following three categories:
Level 1: Quoted prices (unadjusted) in active markets that are accessible at the measurement date for assets or liabilities.
Level 2: Observable prices that are based on inputs not quoted on active markets, but corroborated by market data.
Level 3: Unobservable inputs are used when little or no market data is available.
Assets and liabilities are classified based on the lowest level of input that is significant to the fair value measurements. The Company reviews the fair value hierarchy classification on a quarterly basis. Changes in the ability to observe valuation inputs may result in a reclassification of levels for certain assets or liabilities within the fair value hierarchy. The Company did not have any transfers of assets and liabilities between the levels of the fair value measurement hierarchy during the years presented.
80
The Company considers all highly liquid investments that are readily convertible into cash and have an original maturity of three months or less at the time of purchase to be cash equivalents.
Inventory
Inventory consists primarily of purchased finished goods, which includes specialized implants and disposables, and is stated at the lower of cost or market determined by utilizing a standard cost method which approximates the weighted average cost. The Company reviews the components of its inventory on a periodic basis for excess and obsolescence and adjusts inventory to its net realizable value as necessary.
Goodwill and Intangible Assets
The Company’s goodwill represents the excess of the cost over the fair value of net assets acquired from its business combinations. The determination of the value of goodwill and intangible assets arising from business combinations and asset acquisitions requires extensive use of accounting estimates and judgments to allocate the purchase price to the fair value of the net tangible and intangible assets acquired, including capitalized in-process research and development (IPR&D). Intangible assets acquired in a business combination that are used for in-process research and development activities are considered indefinite lived until the completion or abandonment of the associated research and development efforts. Upon reaching the end of the relevant research and development project, the Company will amortize the acquired IPR&D over its estimated useful life or expense the acquired in-process research and development should the research and development project be unsuccessful with no future alternative use.
Goodwill and IPR&D are not amortized; however, they are assessed for impairment using fair value measurement techniques on an annual basis or more frequently if facts and circumstance warrant such a review. The goodwill or IPR&D are considered to be impaired if the Company determines that the carrying value of the reporting unit or IPR&D exceeds its respective fair value.
The Company performs its goodwill impairment analysis at the reporting unit level, which aligns with the Company’s reporting structure and availability of discrete financial information. The Company performs its annual impairment analysis by either comparing a reporting unit’s estimated fair value to its carrying amount or doing a qualitative assessment of a reporting unit’s fair value from the last quantitative assessment to determine if there is potential impairment. The Company may do a qualitative assessment when the results of the previous quantitative test indicated the reporting unit’s estimated fair value was significantly in excess of the carrying value of its net assets and it does not believe there have been significant changes in the reporting unit’s operations that would significantly decrease its estimated fair value or significantly increase its net assets. If a qualitative assessment is performed the evaluation includes management estimates of cash flow projections based on internal future projections and/or use of a market approach by looking at market values of comparable companies. Key assumptions for these projections include revenue growth, future gross and operating margin growth, and its weighted cost of capital and terminal growth rates. The revenue and margin growth is based on increased sales of new and existing products as the Company maintains investments in research and development. Additional assumed value creators may include increased efficiencies from capital spending. The resulting cash flows are discounted using a weighted average cost of capital. Operating mechanisms and requirements to ensure that growth and efficiency assumptions will ultimately be realized are also considered in the evaluation, including timing and probability of regulatory approvals for Company products to be commercialized. The Company’s market capitalization is also considered as a part of its analysis.
The Company’s annual evaluation for impairment of goodwill consists of two reporting units; the Progentix reporting unit and the remainder of the Company (the “primary reporting unit”). In accordance with the Company’s policy, the most recent annual evaluation for impairment using the discounted cash flow valuation methodology based on discounted cash flows as of October 1, 2016 was completed, and it was determined that no impairment existed and that no reporting unit of the Company was at risk of impairment when assessing the unit’s fair value compared to its carrying value. In addition, no indicators of impairments were noted through December 31, 2016 and consequently, no impairment charge has been recorded during the year.
Intangible assets with a finite life, such as acquired technology, customer relationships, manufacturing know-how, licensed technology, supply agreements and certain trade names and trademarks, are amortized on a straight-line basis over their estimated useful life, ranging from 1 to 17 years. In determining the useful lives of intangible assets, the Company considers the expected use of the assets and the effects of obsolescence, demand, competition, anticipated technological advances, changes in surgical techniques, market influences and other economic factors. For technology based intangible assets, the Company considers the expected life cycles of products which incorporate the corresponding technology. Trademarks and trade names that are related to products are assigned lives consistent with the period in which the products bearing each brand are expected to be sold.
Intangible assets with a finite life are tested for impairment whenever events or circumstances indicate that the carrying amount may not be recoverable. During the year ended December 31, 2014, the Company recorded an impairment charge of $10.7 million related to the developed technology acquired from Cervitech in 2009. The primary factors contributing to this impairment charge were the reduction in the Company revenue estimate and related decrease to estimated cash flows for the technology.
81
See Note 2 to the Consolidated Financial Statements included in this Annual Report for further discussion on goodwill and intangible assets.
Property and Equipment
Property and equipment are carried at cost less accumulated depreciation. Depreciation is computed using the straight-line method over the estimated useful lives of the assets, ranging from 2 to 20 years. The Company depreciates leasehold improvements over their estimated useful lives or the term of the applicable lease, whichever is shorter. Leased property meeting certain capital lease criteria is capitalized, and the net present value of the related lease payments is recorded as a liability. Amortization of assets under capital leases is recorded using the straight-line method over the shorter of the estimated useful lives or the lease terms. Maintenance and repairs are expensed as incurred.
The Company reviews property, plant and equipment for impairment whenever events or changes in circumstances indicate that the carrying value of an asset may not be recoverable. An impairment loss would be recognized when estimated future undiscounted cash flows relating to the asset are less than its carrying amount. An impairment loss is measured as the amount by which the carrying amount of an asset exceeds its fair value.
Income Taxes
The asset and liability approach is used to recognize deferred tax assets and liabilities for the expected future tax consequences of temporary differences between the carrying amounts and the tax bases of assets and liabilities. Tax law and rate changes are reflected in income in the period such changes are enacted. The Company includes interest and penalties related to income taxes, including unrecognized tax benefits, within income tax expense.
The Company’s income tax returns are based on calculations and assumptions that are subject to examination by the Internal Revenue Service and other tax authorities. In addition, the calculation of the Company’s tax liabilities involves dealing with uncertainties in the application of complex tax regulations. The Company recognizes liabilities for uncertain tax positions based on a two-step process. The first step is to evaluate the tax position for recognition by determining if the weight of available evidence indicates that it is more likely than not that the position will be sustained on audit, including resolution of related appeals or litigation processes, if any. The second step is to measure the tax benefit as the largest amount that is more than 50% likely of being realized upon settlement. While the Company believes it has appropriate support for the positions taken on its tax returns, the Company regularly assesses the potential outcomes of examinations by tax authorities in determining the adequacy of its provision for income taxes. The Company continually assesses the likelihood and amount of potential adjustments and adjusts the income tax provision, income taxes payable and deferred taxes in the period in which the facts that give rise to a revision become known.
Significant judgment is required in determining the Company’s provision for income taxes, deferred tax assets and liabilities and the valuation allowance recorded against net deferred tax assets. Deferred tax assets and liabilities are determined using the enacted tax rates in effect for the years in which those tax assets are expected to be realized. A valuation allowance is established when it is more likely than not the future realization of all or some of the deferred tax assets will not be achieved. The evaluation of the need for a valuation allowance is performed on a jurisdiction-by-jurisdiction basis, and includes a review of all available positive and negative evidence. Factors reviewed include projections of pre-tax book income for the foreseeable future, determination of cumulative pre-tax book income after permanent differences, earnings history, and reliability of forecasting.
See Note 9 to the Consolidated Financial Statements included in this Annual Report for further discussion on income taxes.
Loss Contingencies
An estimated loss contingency is accrued and disclosed in the Company’s financial statements if it is probable or disclosed if it is reasonably possible that a liability has been incurred and the amount of the loss can be reasonably estimated. Based on the Company’s assessment, it has adequately accrued an amount for contingent liabilities currently in existence. The Company does not accrue amounts for liabilities that it does not believe are probable and only discloses those matters it considers material to its overall financial position. In most cases, significant judgment is required to estimate the amount and timing of a loss to be recorded.
The Company is involved in a number of legal actions arising in the normal course of business. The outcomes of these legal actions are not within the Company’s complete control and may not be known for prolonged periods of time. In some actions, the claimants seek damages as well as other relief, including injunctions barring the sale of products that are the subject of the lawsuit, that could require significant expenditures or result in lost revenues. Litigation is inherently unpredictable, and unfavorable resolutions could occur. As a result, assessing contingencies is highly subjective and requires judgment about future events. The amount of ultimate loss may exceed the Company’s current accruals, and it is possible that its cash flows or results of operations could be materially affected in any particular period by the unfavorable resolution of one or more of these contingencies.
See Note 11 to the Consolidated Financial Statements included in this Annual Report for further discussion on legal proceedings.
82
Comprehensive income (loss) is defined as the change in equity during a period from transactions and other events and circumstances from non-owner sources. Comprehensive income (loss) includes net of tax, unrealized gains or losses on the Company’s marketable securities and foreign currency translation adjustments. The cumulative translation adjustments included in accumulated other comprehensive loss were $10.6 million, $11.6 million, and $9.5 million at December 31, 2016, 2015, and 2014, respectively.
Research and Development
Research and development costs are expensed as incurred. To the extent the Company purchases research and development assets with a future alternative use the Company will capitalize and amortize the assets over its useful life.
Product Shipment Costs
Product shipment costs, included in sales, marketing and administrative expense in the accompanying Consolidated Statements of Operations, were $24.5 million, $21.6 million, and $23.6 million for the years ended December 31, 2016, 2015, and 2014, respectively. The majority of the Company’s shipping costs are related to the loaning of instrument sets, which are not typically sold as part of the Company’s core sales offering. Amounts billed to customers for shipping and handling of products are reflected in revenues and are not significant for any period presented.
Business Transition Costs
The Company incurs certain costs related to acquisition, integration and business transition activities which include severance, relocation, consulting, leasehold exit costs, third party merger and acquisitions costs and other costs directly associated with such activities. During the year ended December 31, 2016, the Company incurred $18.1 million of such costs, which consisted primarily of acquisition and integration activities, and $7.3 million of fair value adjustments on contingent consideration liabilities associated with the Company’s 2016 acquisitions. During the year ended December 31, 2015, the Company incurred $13.7 million of business transition costs, which included $3.0 million in restructuring and impairment charges associated with the exit of its New Jersey location and termination of the respective lease, and a $3.4 million charge associated with the resignation of the Company’s former Chief Executive Officer and Chairman of the Board. The $3.4 million charge includes certain severance and compensation-related charges, net of certain forfeitures of previously recognized equity-based compensation. During the year ended December 31, 2014, the Company incurred $13.4 million of business transition costs, which included $6.4 million related to the restructuring and impairment charges associated with the exit of its New Jersey location and termination of the respective lease, and approximately $4.2 million in accelerated depreciation associated with abandoned leasehold improvements related to the consolidation of the Company’s San Diego headquarters.
As of December 31, 2016, the total recorded liability associated with the early lease termination for the Company’s New Jersey location was $2.4 million compared to $4.1 million at December 31, 2015. The liability consists of future rental payments through 2017. The current portion of the liability is recorded within accounts payable and accrued liabilities and the long-term portion is recorded within other long-term liabilities in the Consolidated Balance Sheets for the periods presented.
Stock-based Compensation
Stock-based compensation expense for equity-classified awards, principally related to restricted stock units (“RSUs”) and performance restricted stock units (“PRSUs”), is measured at the grant date based on the estimated fair value of the award and is recognized over the employee’s requisite service period on an accelerated basis. The fair value of equity instruments that are expected to vest is recognized and amortized over the requisite service period. The Company has granted awards with up to five year graded or cliff vesting terms (in each case, with service through the date of vesting being required). No exercise price or other monetary payment is required for receipt of the shares issued in settlement of the respective award; instead, consideration is furnished in the form of the participant’s service to the Company.
The fair value of RSUs including PRSUs with pre-defined performance criteria is based on the stock price on the date of grant whereas the expense for PRSU with pre-defined performance criteria is adjusted with the probability of achievement of such performance criteria at each period end. The fair value of the PRSUs that are earned based on the achievement of pre-defined market conditions for total shareholder return is estimated on the date of grant using a Monte Carlo valuation model. The key assumptions in applying this model are an expected volatility and a risk-free interest rate.
Stock-based compensation expense is adjusted from the grant date to exclude expense for awards that are expected to be forfeited. The forfeiture estimate is adjusted as necessary through the vesting date so that full compensation cost is recognized only for awards that vest. The Company assesses the reasonableness of the estimated forfeiture rate at least annually, with any change to be made on a cumulative basis in the period the estimated forfeiture rates change. The Company considered its historical experience of pre-vesting forfeitures on awards by each homogenous group of shareowners as the basis to arrive at its estimated annual pre-vesting forfeiture rates.
83
The Company estimates the fair value of stock options issued under its equity incentive plans and shares issued to shareowners under its employee stock purchase plan (“ESPP”) using a Black-Scholes option-pricing model on the date of grant. The Black-Scholes option-pricing model incorporates various and highly sensitive assumptions including expected volatility, expected term and risk-free interest rates. The expected volatility is based on the historical volatility of the Company’s common stock over the most recent period commensurate with the estimated expected term of the Company’s stock options and ESPP which is derived from historical experience. The risk-free interest rate for periods within the contractual life of the option is based on the U.S. Treasury yield in effect at the time of grant. The Company has never declared or paid dividends and has no plans to do so in the foreseeable future.
See Note 8 to the Consolidated Financial Statements included in this Annual Report for further discussion on stockholder equity and stock-based compensation.
Net Income (Loss) Per Share
The Company computes basic net income (loss) per share using the weighted-average number of common shares outstanding during the period. Diluted net income (loss) assumes the conversion, exercise or issuance of all potential common stock equivalents, unless the effect of inclusion would be anti-dilutive. For purposes of this calculation, common stock equivalents include the Company’s stock options, unvested RSUs, including those with performance and market conditions, warrants, and the shares to be issued upon the conversion of the Senior Convertible Notes. The contingently issuable shares are included in basic net income (loss) per share as of the date that all necessary conditions have been satisfied and are included in the denominator for dilutive calculation for the entire period if such shares would be issuable as of the end of the reporting period assuming the end of the reporting period was the end of the contingency period.
The following table sets forth the computation of basic and diluted earnings (loss) per share (in thousands, except share data):
|
|
|
Year Ended December 31, |
|
|||||||||
|
|
|
2016 |
|
|
2015 |
|
|
2014 |
|
|||
|
Numerator: |
|
|
|
|
|
|
|
|
|
|
|
|
|
Net income (loss) available to NuVasive, Inc. |
|
$ |
37,147 |
|
|
$ |
66,291 |
|
|
$ |
(16,720 |
) |
|
Denominator for basic and diluted net income (loss) per share: |
|
|
|
|
|
|
|
|
|
|
|
|
|
Weighted average common shares outstanding for basic |
|
|
50,077 |
|
|
|
48,687 |
|
|
|
46,715 |
|
|
Dilutive potential common stock outstanding: |
|
|
|
|
|
|
|
|
|
|
|
|
|
Stock options and ESPP |
|
|
314 |
|
|
|
1,089 |
|
|
|
— |
|
|
RSUs |
|
|
1,273 |
|
|
|
1,157 |
|
|
|
— |
|
|
Warrants |
|
|
1,297 |
|
|
|
177 |
|
|
|
— |
|
|
Senior Convertible Notes |
|
|
1,141 |
|
|
|
1,314 |
|
|
|
— |
|
|
Weighted average common shares outstanding for diluted |
|
|
54,102 |
|
|
|
52,424 |
|
|
|
46,715 |
|
|
Basic net income (loss) per share attributable to NuVasive, Inc. |
|
$ |
0.74 |
|
|
$ |
1.36 |
|
|
$ |
(0.36 |
) |
|
Diluted net income (loss) per share attributable to NuVasive, Inc. |
|
$ |
0.69 |
|
|
$ |
1.26 |
|
|
$ |
(0.36 |
) |
The following weighted outstanding common stock equivalents were not included in the calculation of net income (loss) per diluted share because their effects were anti-dilutive (in thousands):
|
|
|
Year Ended December 31, |
|
|||||||||
|
|
|
2016 |
|
|
2015 |
|
|
2014 |
|
|||
|
Stock options, ESPP, and RSUs |
|
|
912 |
|
|
|
40 |
|
|
|
8,902 |
|
|
Warrants |
|
|
13,253 |
|
|
|
4,777 |
|
|
|
9,553 |
|
|
Senior Convertible Notes |
|
|
7,550 |
|
|
|
— |
|
|
|
9,553 |
|
|
Total |
|
|
21,715 |
|
|
|
4,817 |
|
|
|
28,008 |
|
84
Property and Equipment, net
Property and equipment, net, consisted of the following (in thousands, except years):
|
|
|
|
December 31, |
|
|||||
|
|
Useful Life |
|
2016 |
|
|
2015 |
|
||
|
Instrument sets |
4 |
|
$ |
249,592 |
|
|
$ |
214,893 |
|
|
Machinery and equipment |
5 to 7 |
|
|
37,837 |
|
|
|
26,871 |
|
|
Computer equipment and software |
3 to 7 |
|
|
71,258 |
|
|
|
55,480 |
|
|
Leasehold improvements |
2 to 15 |
|
|
21,278 |
|
|
|
17,331 |
|
|
Furniture and fixtures |
3 to 7 |
|
|
7,625 |
|
|
|
5,884 |
|
|
Building and improvements |
10 to 20 |
|
|
16,558 |
|
|
|
10,875 |
|
|
Land |
— |
|
|
541 |
|
|
|
1,288 |
|
|
|
|
|
|
404,689 |
|
|
|
332,622 |
|
|
Less: accumulated depreciation and amortization |
|
|
|
(223,165 |
) |
|
|
(191,181 |
) |
|
|
|
|
$ |
181,524 |
|
|
$ |
141,441 |
|
Property and equipment mainly consisted of instrument sets, which are loaned to surgeons and hospitals that purchase implants, biologics and disposables for use in individual surgical procedures.
Depreciation expense was $57.1 million, $49.8 million, and $52.3 million for the years ended December 31, 2016, 2015 and 2014, respectively. At December 31, 2016 and 2015, gross assets recorded under capital leases of $1.5 million are included in machinery and equipment. Depreciation of the assets under capital leases is included in depreciation expense. The Company depreciates leasehold improvements over their estimated useful lives or the term of the applicable lease, whichever is shorter.
Included in business transition costs, in the Consolidated Statements of Operations, during the year ended December 31, 2014 was $4.2 million of accelerated depreciation resulting from the Company’s consolidation of its offices located in San Diego, California into one corporate headquarters. This project commenced during the year ended December 31, 2014 and completed in 2015. As a result, certain long-lived assets, primarily leasehold improvements, were abandoned and replaced during the respective construction period. In accordance with the authoritative guidance, the Company shortened the depreciable lives of the impacted assets, which resulted in $4.2 million of accelerated depreciation, which was included in total operating expenses, during the year ended December 31, 2014, that would have otherwise been recorded in future periods. There is no impact to the Company’s Consolidated Statements of Operations over the life of the respective assets. The net effect of this change in estimate on net income and earnings per share for the year ended December 31, 2014 was $1.8 million and $0.04, respectively. No accelerated depreciation was recorded in 2016 or 2015.
Capitalized internal-use software costs include only those direct costs associated with the actual development or acquisition of computer software for internal use, including costs associated with the design, coding, installation, and testing of the system. At December 31, 2016 and 2015, the Company had $24.2 million and $17.6 million in unamortized capitalized internal-use software costs, respectively. Amortization expense related to capitalized internal-use software costs was $7.4 million, $7.3 million and $7.7 million for the years ended December 31, 2016, 2015 and 2014, respectively.
85
Goodwill and Intangible Assets
Goodwill and intangible assets as of December 31, 2016 consisted of the following (in thousands, except years):
|
|
|
Weighted- |
|
|
|
|
|
|
|
|
|
|
|
|
|
|
|
Average |
|
|
|
|
|
|
|
|
|
|
|
|
|
|
|
Amortization |
|
|
|
|
|
|
|
|
|
|
|
|
|
|
|
Period |
|
Gross |
|
|
Accumulated |
|
|
Intangible |
|
|||
|
|
|
(in years) |
|
Amount |
|
|
Amortization |
|
|
Assets, net |
|
|||
|
Intangible Assets Subject to Amortization: |
|
|
|
|
|
|
|
|
|
|
|
|
|
|
|
Developed technology |
|
8 |
|
$ |
247,148 |
|
|
$ |
(66,833 |
) |
|
$ |
180,315 |
|
|
Manufacturing know-how and trade secrets |
|
13 |
|
|
20,572 |
|
|
|
(13,604 |
) |
|
|
6,968 |
|
|
Trade name and trademarks |
|
9 |
|
|
25,200 |
|
|
|
(7,478 |
) |
|
|
17,722 |
|
|
Customer relationships |
|
9 |
|
|
117,018 |
|
|
|
(30,880 |
) |
|
|
86,138 |
|
|
Total intangible assets subject to amortization |
|
9 |
|
$ |
409,938 |
|
|
$ |
(118,795 |
) |
|
$ |
291,143 |
|
|
Intangible Assets Not Subject to Amortization: |
|
|
|
|
|
|
|
|
|
|
|
|
|
|
|
Goodwill |
|
|
|
|
|
|
|
|
|
|
|
|
485,685 |
|
|
Total goodwill and intangible assets, net |
|
|
|
|
|
|
|
|
|
|
|
$ |
776,828 |
|
Goodwill and intangible assets as of December 31, 2015 consisted of the following (in thousands, except years):
|
|
|
Weighted- |
|
|
|
|
|
|
|
|
|
|
|
|
|
|
|
Average |
|
|
|
|
|
|
|
|
|
|
|
|
|
|
|
Amortization |
|
|
|
|
|
|
|
|
|
|
|
|
|
|
|
Period |
|
Gross |
|
|
Accumulated |
|
|
Intangible |
|
|||
|
|
|
(in years) |
|
Amount |
|
|
Amortization |
|
|
Assets, net |
|
|||
|
Intangible Assets Subject to Amortization: |
|
|
|
|
|
|
|
|
|
|
|
|
|
|
|
Developed technology |
|
9 |
|
$ |
92,648 |
|
|
$ |
(37,382 |
) |
|
$ |
55,266 |
|
|
Manufacturing know-how and trade secrets |
|
12 |
|
|
21,787 |
|
|
|
(13,296 |
) |
|
|
8,491 |
|
|
Trade name and trademarks |
|
11 |
|
|
9,500 |
|
|
|
(5,068 |
) |
|
|
4,432 |
|
|
Customer relationships |
|
8 |
|
|
44,752 |
|
|
|
(27,865 |
) |
|
|
16,887 |
|
|
Total intangible assets subject to amortization |
|
10 |
|
$ |
168,687 |
|
|
$ |
(83,611 |
) |
|
$ |
85,076 |
|
|
Intangible Assets Not Subject to Amortization: |
|
|
|
|
|
|
|
|
|
|
|
|
|
|
|
Goodwill |
|
|
|
|
|
|
|
|
|
|
|
|
154,281 |
|
|
Total goodwill and intangible assets, net |
|
|
|
|
|
|
|
|
|
|
|
$ |
239,357 |
|
Total expense related to the amortization of intangible assets which is recorded in both cost of goods sold and operating expenses in the Consolidated Statements of Operations depending on the functional nature of the intangible, was $45.6 million, $16.1 million and $13.6 million for the years ended December 31, 2016, 2015 and 2014, respectively.
During the year ended December 31, 2016, in connection with acquisitions and other investments, the Company recorded additions to definite-lived intangible assets and goodwill of $241.3 million and $330.5 million, respectively. Goodwill recorded in business combinations is primarily attributable to synergies expected to arise after the acquisition. See Note 5 to the Consolidated Financial Statements included in this Annual Report for further discussion on assets acquired in business combinations and asset acquisitions.
86
The changes to goodwill are comprised of the following (in thousands):
|
(in thousands) |
|
|
|
|
December 31, 2015 |
|
|
|
|
Gross goodwill |
$ |
162,581 |
|
|
Accumulated impairment loss |
|
(8,300 |
) |
|
|
|
154,281 |
|
|
Changes to gross goodwill |
|
|
|
|
Increases recorded in business combinations |
|
330,488 |
|
|
Changes resulting from foreign currency fluctuations |
|
916 |
|
|
|
|
331,404 |
|
|
December 31, 2016 |
|
|
|
|
Gross goodwill |
|
493,985 |
|
|
Accumulated impairment loss |
|
(8,300 |
) |
|
|
$ |
485,685 |
|
Total future amortization expense related to intangible assets subject to amortization at December 31, 2016 is set forth in the table below (in thousands):
|
|
|
|
|
|
|
|
|
2017 |
|
|
|
$ |
48,751 |
|
|
2018 |
|
|
|
|
46,658 |
|
|
2019 |
|
|
|
|
44,973 |
|
|
2020 |
|
|
|
|
44,517 |
|
|
2021 |
|
|
|
|
42,598 |
|
|
Thereafter through 2026 |
|
|
|
|
63,646 |
|
|
Total future amortization expense |
|
|
|
$ |
291,143 |
|
Accounts Payable and Accrued Liabilities
Accounts payable and accrued liabilities consisted of the following (in thousands):
|
|
|
December 31, |
|
|||||
|
|
|
2016 |
|
|
2015 |
|
||
|
Accrued expenses |
|
$ |
42,355 |
|
|
$ |
31,187 |
|
|
Accounts payable |
|
|
9,121 |
|
|
|
6,792 |
|
|
Distributor commissions payable |
|
|
8,836 |
|
|
|
8,502 |
|
|
Other taxes payable |
|
|
7,789 |
|
|
|
6,386 |
|
|
Royalties payable |
|
|
4,877 |
|
|
|
4,454 |
|
|
Others |
|
|
4,607 |
|
|
|
3,665 |
|
|
Accounts payable and accrued liabilities |
|
$ |
77,585 |
|
|
$ |
60,986 |
|
87
3. Marketable Securities
The composition of marketable securities is as follows (in thousands, except years):
|
|
|
Contractual Maturity (in Years) |
|
Amortized Cost |
|
|
Gross Unrealized Gains |
|
|
Gross Unrealized Losses |
|
|
Fair Value |
|
||||
|
December 31, 2016: |
|
|
|
|
|
|
|
|
|
|
|
|
|
|
|
|
|
|
|
Classified as current assets |
|
|
|
|
|
|
|
|
|
|
|
|
|
|
|
|
|
|
|
Certificates of deposit |
|
Less than 1 |
|
$ |
— |
|
|
$ |
— |
|
|
$ |
— |
|
|
$ |
— |
|
|
Corporate notes |
|
Less than 1 |
|
|
— |
|
|
|
— |
|
|
|
— |
|
|
|
— |
|
|
Commercial paper |
|
Less than 1 |
|
|
— |
|
|
|
— |
|
|
|
— |
|
|
|
— |
|
|
Securities of government-sponsored entities |
|
Less than 1 |
|
|
— |
|
|
|
— |
|
|
|
— |
|
|
|
— |
|
|
Short-term marketable securities |
|
|
|
|
— |
|
|
|
— |
|
|
|
— |
|
|
|
— |
|
|
Classified as non-current assets |
|
|
|
|
|
|
|
|
|
|
|
|
|
|
|
|
|
|
|
Certificates of deposit |
|
1 to 2 |
|
|
— |
|
|
|
— |
|
|
|
— |
|
|
|
— |
|
|
Corporate notes |
|
1 to 2 |
|
|
— |
|
|
|
— |
|
|
|
— |
|
|
|
— |
|
|
Securities of government-sponsored entities |
|
1 to 2 |
|
|
— |
|
|
|
— |
|
|
|
— |
|
|
|
— |
|
|
Long-term marketable securities |
|
|
|
|
— |
|
|
|
— |
|
|
|
— |
|
|
|
— |
|
|
Total marketable securities at December 31, 2016 |
|
|
|
$ |
— |
|
|
$ |
— |
|
|
$ |
— |
|
|
$ |
— |
|
|
|
|
|
|
|
|
|
|
|
|
|
|
|
|
|
|
|
|
|
|
December 31, 2015: |
|
|
|
|
|
|
|
|
|
|
|
|
|
|
|
|
|
|
|
Classified as current assets |
|
|
|
|
|
|
|
|
|
|
|
|
|
|
|
|
|
|
|
Certificates of deposit |
|
Less than 1 |
|
$ |
6,615 |
|
|
$ |
— |
|
|
$ |
— |
|
|
$ |
6,615 |
|
|
Corporate notes |
|
Less than 1 |
|
|
108,739 |
|
|
|
5 |
|
|
|
(173 |
) |
|
|
108,571 |
|
|
Commercial paper |
|
Less than 1 |
|
|
21,991 |
|
|
|
— |
|
|
|
— |
|
|
|
21,991 |
|
|
Securities of government-sponsored entities |
|
Less than 1 |
|
|
28,284 |
|
|
|
— |
|
|
|
(38 |
) |
|
|
28,246 |
|
|
Short-term marketable securities |
|
|
|
|
165,629 |
|
|
|
5 |
|
|
|
(211 |
) |
|
|
165,423 |
|
|
Classified as non-current assets |
|
|
|
|
|
|
|
|
|
|
|
|
|
|
|
|
|
|
|
Certificates of deposit |
|
1 to 2 |
|
|
12,392 |
|
|
|
— |
|
|
|
— |
|
|
|
12,392 |
|
|
Corporate notes |
|
1 to 2 |
|
|
43,857 |
|
|
|
— |
|
|
|
(109 |
) |
|
|
43,748 |
|
|
Securities of government-sponsored entities |
|
1 to 2 |
|
|
56,412 |
|
|
|
— |
|
|
|
(220 |
) |
|
|
56,192 |
|
|
Long-term marketable securities |
|
|
|
|
112,661 |
|
|
|
— |
|
|
|
(329 |
) |
|
|
112,332 |
|
|
Total marketable securities at December 31, 2015 |
|
|
|
$ |
278,290 |
|
|
$ |
5 |
|
|
$ |
(540 |
) |
|
$ |
277,755 |
|
As of December 31, 2016, the Company had liquidated its short-term and long-term marketable securities, and only held investments in securities classified as cash equivalents. During the periods presented, the Company did not hold any investments that were in a significant unrealized loss position and no impairment charges were recorded. Realized gains and losses and interest income related to marketable securities were immaterial during all periods presented.
Foreign Currency and Derivative Financial Instruments
The Company translates the financial statements of its foreign subsidiaries using end-of-period exchange rates for assets and liabilities and average exchange rates during each reporting period for results of operations.
Some of the Company’s reporting entities conduct a portion of their business in currencies other than the entity’s functional currency. These transactions give rise to receivables and payables that are denominated in currencies other than the entity’s functional currency. The value of these receivables and payables is subject to changes in currency exchange rates from the point at which the transactions are originated until the settlement in cash. Both realized and unrealized gains and losses in the value of these receivables and payables are included in the determination of net income. Net currency exchange gains (losses), which includes gains and losses from derivative instruments, were $(0.3) million, $0.3 million and $(2.6) million for the years ended December 31, 2016, 2015 and 2014, respectively, and are included in other income (expense) in the Consolidated Statements of Operations.
As of December 31, 2016, 2015, and 2014 a notional principal amount of $15.1 million, $8.5 million, and $26.0 million respectively, was outstanding to hedge currency risk relative to foreign receivables and payables. Derivative instrument net gains on the Company’s forward exchange contracts were $0.7 million, $1.7 million, and $0.7 million for the years ended December 31, 2016, 2015 and 2014, respectively, and are included in other income (expense) in the Consolidated Statements of Operations.
88
The following table summarizes the fair values of derivative instruments at December 31, 2016 and 2015:
|
|
|
Asset Derivatives |
|
|
Liability Derivatives |
|
||||||||||||||
|
|
|
|
|
Fair Value |
|
|
|
|
Fair Value |
|
||||||||||
|
|
|
Balance Sheet |
|
December 31, |
|
|
December 31, |
|
|
Balance Sheet |
|
December 31, |
|
|
December 31, |
|
||||
|
(in thousands) |
|
Location |
|
2016 |
|
|
2015 |
|
|
Location |
|
2016 |
|
|
2015 |
|
||||
|
Derivatives instruments not designated as cash flow hedges |
|
|
|
|
|
|
|
|
|
|
|
|
|
|
|
|
|
|
|
|
|
Forward exchange contracts |
|
Other current assets |
|
$ |
— |
|
|
$ |
46 |
|
|
Other current liabilities |
|
$ |
166 |
|
|
$ |
— |
|
|
Total derivatives |
|
|
|
$ |
— |
|
|
$ |
46 |
|
|
|
|
$ |
166 |
|
|
$ |
— |
|
The Company’s currency exposures vary, but are primarily concentrated in the pound sterling, the euro, the Australian dollar, the Singapore dollar, and the yen. The Company will continuously monitor the costs and the impact of foreign currency risks upon the financial results as part of the Company’s risk management program. The Company does not use derivative financial instruments for speculation or trading purposes or for activities other than risk management. The Company does not require and is not required to pledge collateral for these financial instruments and does not carry any master netting arrangements to mitigate the credit risk.
4. Fair Value Measurements
The fair values of the Company’s assets and liabilities, including cash equivalents, marketable securities, restricted investments, derivatives, and contingent considerations are measured at fair value on a recurring basis, and are determined under the fair value categories as follows (in thousands):
|
|
|
|
|
|
|
Quoted Price in |
|
|
Significant Other |
|
|
Significant |
|
|||
|
|
|
|
|
|
|
Active Market |
|
|
Observable Inputs |
|
|
Unobservable |
|
|||
|
|
|
Total |
|
|
(Level 1) |
|
|
(Level 2) |
|
|
Inputs (Level 3) |
|
||||
|
December 31, 2016: |
|
|
|
|
|
|
|
|
|
|
|
|
|
|
|
|
|
Cash Equivalents: |
|
|
|
|
|
|
|
|
|
|
|
|
|
|
|
|
|
Money market funds |
|
$ |
72,866 |
|
|
$ |
72,866 |
|
|
$ |
— |
|
|
$ |
— |
|
|
Corporate notes |
|
|
4,551 |
|
|
|
— |
|
|
|
4,551 |
|
|
|
— |
|
|
Commercial paper |
|
|
21,471 |
|
|
|
— |
|
|
|
21,471 |
|
|
|
— |
|
|
Securities of government-sponsored entities |
|
|
5,995 |
|
|
|
— |
|
|
|
5,995 |
|
|
|
— |
|
|
Total cash equivalents |
|
$ |
104,883 |
|
|
$ |
72,866 |
|
|
$ |
32,017 |
|
|
$ |
— |
|
|
|
|
|
|
|
|
|
|
|
|
|
|
|
|
|
|
|
|
December 31, 2015: |
|
|
|
|
|
|
|
|
|
|
|
|
|
|
|
|
|
Cash Equivalents, Marketable Securities: |
|
|
|
|
|
|
|
|
|
|
|
|
|
|
|
|
|
Money market funds |
|
$ |
68,425 |
|
|
$ |
68,425 |
|
|
$ |
— |
|
|
$ |
— |
|
|
Certificates of deposit |
|
|
19,007 |
|
|
|
19,007 |
|
|
|
— |
|
|
|
— |
|
|
Corporate notes |
|
|
152,319 |
|
|
|
— |
|
|
|
152,319 |
|
|
|
— |
|
|
Commercial paper |
|
|
21,991 |
|
|
|
— |
|
|
|
21,991 |
|
|
|
— |
|
|
Securities of government-sponsored entities |
|
|
115,929 |
|
|
|
— |
|
|
|
115,929 |
|
|
|
— |
|
|
Total cash equivalents and marketable securities |
|
$ |
377,671 |
|
|
$ |
87,432 |
|
|
$ |
290,239 |
|
|
$ |
— |
|
The carrying amounts of certain financial instruments such as cash and cash equivalents, accounts receivable, prepaid expenses, other current assets, accounts payable, accrued expenses, and other current liabilities as of December 31, 2016 and December 31, 2015 approximate their related fair values due to the short-term maturities of these instruments.
The fair value of certain financial instruments was measured and classified within Level 1of the fair value hierarchy based on quoted prices. Certain financial instruments classified within Level 2 of the fair value hierarchy include the types of instruments that trade in markets that are not considered to be active, but are valued based on quoted market prices, broker or dealer quotations, or alternative pricing sources with reasonable levels of price transparency.
To manage foreign currency exposure risks, the Company uses derivatives for activities in entities that have short-term intercompany receivables and payables denominated in a currency other than the entity’s functional currency. The fair value is based on a quoted market price (Level 1). See Note 3 to the Consolidated Financial Statements included in this Annual Report for further discussion on the hedge transactions.
89
The fair value, based on a quoted market price (Level 1), of the Company’s outstanding Senior Convertible Notes due 2017 at December 31, 2016 and December 31, 2015 was approximately $102.7 million and $551.4 million, respectively. During the year ended December 31, 2016, the Company repurchased approximately $339.1 million in principal amount outstanding of the 2017 Notes. See Note 6 to the Consolidated Financial Statements included in this Annual Report for further discussion. The fair value, based on a quoted market price (Level 1), of the Company’s outstanding Senior Convertible Notes due 2021 at December 31, 2016 was approximately $827.6 million. The carrying value of the Company’s Senior Convertible Notes is discussed in Note 6 to the Consolidated Financial Statements included in this Annual Report.
Contingent Consideration Liabilities
The fair value of contingent consideration liabilities assumed in business combinations is recorded as part of the purchase price consideration of the acquisition, and is determined using a discounted cash flow model or probability simulation model. The significant inputs of such models are not observable in the market, such as certain financial metric growth rates, volatility rates, projections associated with the applicable milestone, the interest rate, and the related probabilities and payment structure in the contingent consideration arrangement. Fair value adjustments to contingent consideration liabilities are recorded through operating expenses in the Consolidated Statement of Operations. Contingent consideration arrangements assumed by an asset purchase will be measured and accrued when such contingency is resolved.
During the year ended December 31, 2016, the Company initially recorded additional contingent consideration liabilities of $61.2 million in connection with certain acquisitions, including $33.8 million in connection with the acquisition of the LessRay software technology suite and $18.8 million in connection with the acquisition of Ellipse Technologies. At December 31, 2016, the contingent consideration liabilities were $67.5 million, and were recorded in the Consolidated Balance Sheet commensurate with the respective payable terms. See Note 5 to the Consolidated Financial Statements included in this Annual Report for further discussion on contingent consideration liabilities assumed in business combinations.
The Company’s acquisition of Ellipse Technologies included a purchase price of $380.0 million and a potential milestone payment of $30.0 million payable in 2017 related to the achievement of a specific revenue target. During the quarter ended December 31, 2016, the Company received a purchase order from an organization established by certain former stockholders of Ellipse Technologies for the purchase of $4.8 million of products with their stated purpose to be donated for use in spinal deformity procedures for children in underprivileged communities. As the order complied with the Company’s standards and procedures, and the purchaser fully paid for the order in advance of shipment, the Company processed and delivered the order and recognized the revenue associated with the order during the quarter ended December 31, 2016 in accordance with ASC 605, Revenue Recognition. The milestone payment under the merger agreement, which was contingent on meeting a specific revenue target for 2016, would not have been achieved without this order. The milestone payment, in the amount of $30.0 million, will be paid pro-rata to the former stockholders of Ellipse Technologies in accordance with the merger agreement. A number of Company employees, including the CEO of NuVasive Specialized Orthopedics, were employees and stockholders of Ellipse Technologies prior to the acquisition and will receive their pro-rata share of the milestone payment. In assessing the order, the Company considered that (i) the customer is an entity established by certain former stockholders of Ellipse Technologies and (ii) the CEO of NuVasive Specialized Orthopedics, an executive officer of the Company, will receive approximately 3% of the milestone payment. The Company determined that the order did not constitute a related party transaction under ASC 850, Related Parties because none of the Company’s officers or related parties have the ability to control or significantly influence the customer.
The following table sets forth the changes in the estimated fair value of the Company’s liabilities measured on a recurring basis using significant unobservable inputs (Level 3) (in thousands):
|
|
|
|
|
|||||
|
|
|
2016 |
|
|
2015 |
|
||
|
Fair value measurement at January 1 |
|
$ |
— |
|
|
$ |
644 |
|
|
Contingent consideration liability recorded upon acquisition |
|
|
61,242 |
|
|
|
431 |
|
|
Change in fair value measurement |
|
|
7,265 |
|
|
|
— |
|
|
Changes resulting from foreign currency fluctuations |
|
|
126 |
|
|
|
(36 |
) |
|
Contingent consideration paid or settled |
|
|
(1,132 |
) |
|
|
(1,039 |
) |
|
Fair value measurement at December 31 |
|
$ |
67,501 |
|
|
$ |
— |
|
90
Non-financial assets and liabilities measured on a nonrecurring basis
Certain non-financial assets and liabilities are measured at fair value, usually with Level 3 inputs including the discounted cash flow method or cost method, on a nonrecurring basis in accordance with authoritative guidance. These include items such as nonfinancial assets and liabilities initially measured at fair value in a business combination and non-financial long-lived assets measured at fair value for an impairment assessment. In general, non-financial assets, including goodwill, intangible assets and property and equipment, are measured at fair value when there is an indication of impairment and are recorded at fair value only when any impairment is recognized. The carrying values of the Company’s capital lease obligations approximated their estimated fair value as of December 31, 2016 and 2015. The Company has obligations under certain consultancy arrangements based on achievement of specified milestones. There was no accrual as of December 31, 2016 or 2015, related to these obligations.
During the years ended December 31, 2015 and 2014, the Company recognized impairment charges related to leasehold improvement write-offs associated with the lease termination for its New Jersey facility, of approximately $0.9 million and $2.2 million, respectively. The impairments are recorded in business transition costs within the total operating expenses on the Consolidated Statements of Operations. During the year ended December 31, 2014, the Company recorded an impairment charge of $10.7 million related to the developed technology acquired from Cervitech in 2009. See Note 1 to the Consolidated Financial Statements included in this Annual Report for further discussion on impairment analysis and charges related to intangible assets and leasehold improvements.
5. Business Combinations
The Company recognizes the assets acquired, liabilities assumed, and any non-controlling interest at fair value at the date of acquisition. Certain acquisitions contained contingent consideration arrangements that required the Company to assess the acquisition date fair value of the contingent consideration liabilities, which was recorded as part of the purchase price allocation of the acquisition, with subsequent fair value adjustments to the contingent consideration recorded in the Consolidated Statements of Operations. See Note 4 to the Consolidated Financial Statements included in this Annual Report for further discussion on contingent consideration liabilities.
Acquisition of Ellipse Technologies, Inc.
On February 11, 2016, the Company acquired all of the stock interest in Ellipse Technologies, Inc., which now operates as a wholly owned subsidiary of the Company under the renamed legal entity NuVasive Specialized Orthopedics, Inc. (“NSO”), for a purchase price of $380.0 million (including holdbacks for retained employment of Ellipse Technologies leadership that is to be expensed and is not considered part of the final purchase price) and a potential milestone payment of $30.0 million payable in cash in 2017 related to the achievement of a specific revenue target. A cash payment of $382.2 million, which included additional amounts for cash on hand and traditional working capital adjustments, was transferred at the closing. Subsequent to the closing payment, the Company received $0.6 million from the escrow for traditional working capital adjustments finalized after the closing.
NSO designs and sells expandable growing rod implant systems that can be non-invasively lengthened following implantation with precise, incremental adjustments via an external remote controller using magnetic technology called MAGnetic External Control, or MAGEC. The technology platform provides the basis of NSO’s core product offerings, including MAGEC-EOS, which allows for the minimally invasive treatment of early-onset and adolescent scoliosis, as well as the PRECICE limb lengthening system, which allows for the correction of long bone limb length discrepancy, as well as enhanced bone healing in patients that have experienced traumatic injury.
91
The Company applied certain assumptions and findings in the valuation outcome for the assets acquired and liabilities assumed, for which the allocation of the purchase price is based on the fair values, as follows:
|
(in thousands) |
|
|
|
|
|
Cash paid for purchase |
|
$ |
381,579 |
|
|
|
|
|
|
|
|
Accounts receivable |
|
|
7,148 |
|
|
Inventory |
|
|
22,451 |
|
|
Other current assets |
|
|
1,855 |
|
|
Property, plant and equipment, net |
|
|
6,725 |
|
|
Definite-lived intangible assets: |
|
|
|
|
|
Developed technology |
|
|
133,900 |
|
|
Customer relationships |
|
|
33,200 |
|
|
Trade names |
|
|
16,200 |
|
|
Goodwill |
|
|
241,905 |
|
|
Deferred tax assets |
|
|
18,471 |
|
|
Other assets |
|
|
1,868 |
|
|
Contingent consideration liability |
|
|
18,800 |
|
|
Deferred tax liabilities |
|
|
75,160 |
|
|
Other liabilities assumed |
|
|
8,184 |
|
|
|
|
|
|
|
|
|
|
$ |
381,579 |
|
Goodwill recognized in this transaction is not deductible for income tax purposes. Goodwill largely consists of expected revenue synergies resulting from the combination of product portfolios, cost synergies related to elimination of redundant facilities, functions and staffing; use of the Company’s existing commercial infrastructure to expand sales of NSO’s products; and the assembled workforce. The intangible assets acquired will be amortized on a straight-line basis over weighted-average useful lives of seven years, nine years and seven years for technology-based intangible assets, customer-related intangible assets, and trade name intangible assets, respectively. The estimated fair values of the intangible assets acquired were primarily determined using the income approach based on significant inputs that were not observable market data.
In connection with the acquisition, a contingent liability of $18.8 million was recorded as of the acquisition date for the potential revenue-based milestone payment. The liability was fair valued using the Monte Carlo simulation based on specific revenue achievement scenarios and discount factors. Changes in fair value of the liability over the measurement period were recorded in the results of operations in the Consolidated Statements of Operations. The revenue-based milestone was achieved as of December 31, 2016, and the Company adjusted the fair value of the contingent consideration liability to $30.0 million in current liabilities in the Consolidated Balance Sheet which represents the full amount of the milestone obligation under the merger agreement. The Company expects to pay this milestone by April 2017.
Acquisition costs of $4.0 million were recognized in business transition costs as incurred. The Company’s results of operations included the operating results of NSO, since the date of acquisition, of $57.5 million of revenue for the year ended December 31, 2016 and net income of $3.9 million for the year ended December 31, 2016 in the Consolidated Statement of Operations.
The following table presents the unaudited pro forma results for the years ended December 31, 2016 and December 31, 2015. The unaudited pro forma financial information combines the results of operations of NuVasive and Ellipse Technologies as though the companies had been combined as of January 1, 2015, and the unaudited pro forma information is presented for informational purposes only and is not indicative of the results of operations that would have been achieved if the acquisition had taken place at such times. The unaudited pro forma results presented include non-recurring adjustments directly attributable to the business combination, some of which are presented in the comparable period results instead of the current period by nature of such adjustments. The adjustments for amortization charges for acquired intangible assets were $26.0 million for the year ended December 31, 2015. The adjustments to cost of sales for increased fair value of acquired inventory of $(14.7) million and $14.7 million for the years ended December 31, 2016 and December 31, 2015, respectively, were amortized over the period in which underlying products were sold. The year ended December 2015 also includes an adjustment of $4.0 million for acquisition related expenses. Additionally, the years ended December 31, 2016 and 2015 include immaterial adjustments to revenue for deferred revenue adjustments, and related tax effects to the pre-tax income. The pre-acquisition accounting policies of Ellipse Technologies were materially similar to the Company, with the differences adjusted to reflect the accounting policies of the Company in the unaudited pro forma results presented.
92
|
|
Years Ended December 31, |
|
||||||
|
|
|
2016 |
|
|
2015 |
|
||
|
(in thousands, except per share amounts) |
|
(unaudited) |
|
|
(unaudited) |
|
||
|
Revenues |
|
$ |
968,179 |
|
|
$ |
854,673 |
|
|
Net income attributable to NuVasive, Inc. |
|
|
38,045 |
|
|
|
11,675 |
|
|
Net income per share attributable to NuVasive, Inc.: |
|
|
|
|
|
|
|
|
|
Basic |
|
$ |
0.76 |
|
|
$ |
0.24 |
|
|
Diluted |
|
$ |
0.70 |
|
|
$ |
0.22 |
|
Other Acquisitions
On July 1, 2016, the Company acquired all of the stock interest in BNN Holdings Corp., for a purchase price of $98.0 million. BNN Holdings Corp., through its subsidiaries and affiliates, owns and operates Biotronic NeuroNetwork, a patient-centric healthcare organization that provides intraoperative neurophysiological monitoring services to surgeons and healthcare facilities across the U.S. A cash payment of $94.0 million was transferred at the closing, which represented the total purchase consideration, net of amounts retained for certain acquired provisional obligations, additional amounts for cash on hand and traditional working capital adjustments. Subsequent to the closing payment, the Company paid an additional $0.4 million from the escrow for traditional working capital adjustments finalized after the closing. The acquisition was not considered material to the overall Consolidated Financial Statements.
The Company combined the service offerings of Biotronic NeuroNetwork with its Impulse Monitoring, Inc. business under the newly created division NuVasive Clinical Services (“NCS”).
The Company has completed other acquisitions that were not considered material to the overall Consolidated Financial Statements during the year ended December 31, 2016. These acquisitions have been included in the Consolidated Financial Statements from the respective dates of acquisition. The Company does not believe that collectively the acquisitions made during the year, excluding NSO, are material to the overall financial statements.
For certain acquisitions completed during the year ended December 31, 2016, the Company is still in the process of finalizing the purchase price allocation given the timing of the acquisition and the size and scope of the assets and liabilities subject to valuation. While the Company does not expect material changes in the valuation outcome, certain assumptions and findings that were in place at the date of acquisition could result in changes in the purchase price allocation.
Progentix Orthobiology, B.V.
In 2009, the Company completed the purchase of forty percent (40%) of the capital stock of Progentix, a company organized under the laws of the Netherlands, from existing shareholders pursuant to a Preferred Stock Purchase Agreement for $10.0 million in cash (the “Initial Investment”). As of December 31, 2016, the Company has loaned Progentix cumulatively $5.3 million at an interest at a rate of 6% per year. The Company is not obligated to provide additional funding. Concurrently, with the Initial Investment, the Company and Progentix entered into a Distribution Agreement (as amended, the “Distribution Agreement”), whereby Progentix appointed the Company as its exclusive distributor for certain Progentix products. The Distribution Agreement is in effect for a term of ten years unless terminated earlier in accordance with its terms.
In accordance with authoritative guidance, the Company has determined that Progentix is a variable interest entity (“VIE”), as it does not have the ability to finance its activities without additional subordinated financial support and its equity investors will not absorb their proportionate share of expected losses and will be limited in the receipt of the potential residual returns of Progentix.
Total assets and liabilities of Progentix included in the accompanying Consolidated Balance Sheets are as follows (in thousands):
|
|
|
December 31, |
|
|||||
|
|
|
2016 |
|
|
2015 |
|
||
|
Total current assets |
|
$ |
334 |
|
|
$ |
353 |
|
|
Identifiable intangible assets, net |
|
|
10,900 |
|
|
|
13,048 |
|
|
Goodwill |
|
|
12,654 |
|
|
|
12,654 |
|
|
Accounts payable & accrued expenses |
|
|
551 |
|
|
|
574 |
|
|
Deferred tax liabilities, net |
|
|
880 |
|
|
|
1,496 |
|
|
Non-controlling interests |
|
|
5,588 |
|
|
|
7,309 |
|
93
The following is a reconciliation of equity attributable to the non-controlling interests (in thousands):
|
|
|
Year Ended December 31, |
|
|||||
|
|
|
2016 |
|
|
2015 |
|
||
|
Non-controlling interests at beginning of period |
|
$ |
7,309 |
|
|
$ |
8,310 |
|
|
Less: Net (loss) attributable to the non-controlling interests |
|
|
(1,721 |
) |
|
|
(1,001 |
) |
|
Non-controlling interests at end of period |
|
$ |
5,588 |
|
|
$ |
7,309 |
|
NuVasive Clinical Services and Physician Practices
The Company maintains contractual relationships with several physician practices (“PCs”) which were inherited through the 2011 acquisition of Impulse Monitoring, Inc. and the 2016 acquisition of BNN Holdings Corp. In accordance with authoritative guidance, the Company has determined that the PCs are VIEs and the therefore, the accompanying Consolidated Financial Statements include the accounts of the PCs from the date of acquisition. During the periods presented, the results of the PCs were immaterial to the Company’s financials. The creditors of the PCs have claims only on the assets of the PCs, which are not material, and the assets of the PCs are not available to the Company.
6. Indebtedness
The carrying values of the Company’s Senior Convertible Notes are as follows (in thousands):
|
(in thousands) |
|
December 31, 2016 |
|
|
December 31, 2015 |
|
||
|
2.75% Senior Convertible Notes due 2017: |
|
|
|
|
|
|
|
|
|
Principal amount |
|
$ |
63,317 |
|
|
$ |
402,500 |
|
|
Unamortized debt discount |
|
|
(1,417 |
) |
|
|
(25,958 |
) |
|
Unamortized debt issuance costs |
|
|
(199 |
) |
|
|
(3,622 |
) |
|
|
|
|
61,701 |
|
|
|
372,920 |
|
|
2.25% Senior Convertible Notes due 2021: |
|
|
|
|
|
|
|
|
|
Principal amount |
|
|
650,000 |
|
|
|
— |
|
|
Unamortized debt discount |
|
|
(72,713 |
) |
|
|
— |
|
|
Unamortized debt issuance costs |
|
|
(12,875 |
) |
|
|
— |
|
|
|
|
|
564,412 |
|
|
|
— |
|
|
Total Senior Convertible Notes |
|
$ |
626,113 |
|
|
$ |
372,920 |
|
|
|
|
|
|
|
|
|
|
|
|
Less Current Portion: |
|
|
(61,701 |
) |
|
|
— |
|
|
Long-term Senior Convertible Notes |
|
$ |
564,412 |
|
|
$ |
372,920 |
|
2.25% Senior Convertible Notes due 2021
In March 2016, the Company issued $650.0 million principal amount of unsecured Senior Convertible Notes with a stated interest rate of 2.25% and a maturity date of March 15, 2021 (the "2021 Notes"). The net proceeds from the offering, after deducting initial purchasers' discounts and costs directly related to the offering, were approximately $634.1 million. The 2021 Notes may be settled in cash, stock, or a combination thereof, solely at the Company's discretion. It is the Company's current intent and policy to settle all conversions through combination settlement, which involves satisfying the principal amount outstanding with cash and any note conversion value over the principal amount in shares of the Company's common stock. The initial conversion rate of the 2021 Notes is 16.7158 shares per $1,000 principal amount, which is equivalent to a conversion price of approximately $59.82 per share, subject to adjustments. The Company uses the treasury share method for assumed conversion of the 2021 Notes to compute the weighted average shares of common stock outstanding for diluted earnings per share. The Company also entered into transactions for convertible note hedge (the "2021 Hedge") and warrants (the "2021 Warrants") concurrently with the issuance of the 2021 Notes.
The cash conversion feature of the 2021 Notes required bifurcation from the Notes and was initially accounted for as an equity instrument classified to stockholders’ equity, which resulted in recognizing $84.8 million in additional paid-in-capital during 2016.
The interest expense recognized on the 2021 Notes during the year ended December 31, 2016 includes $11.5 million, $12.1 million and $1.9 million for the contractual coupon interest, the accretion of the debt discount and the amortization of the debt issuance costs, respectively. The effective interest rate on the 2021 Notes is 5.8%, which includes the interest on the notes, amortization of the debt discount and debt issuance costs. Interest on the 2021 Notes began accruing upon issuance and is payable semi-annually.
94
Prior to September 15, 2020, holders may convert their 2021 Notes only under the following conditions: (a) during any calendar quarter beginning June 30, 2016, if the reported sale price of the Company's common stock for at least 20 days out of 30 consecutive trading days ending on the last trading day of the immediately preceding calendar quarter is greater than 130% of the conversion price on each applicable trading day; (b) during the five business day period in which the trading price of the 2021 Notes falls below 98% of the product of (i) the last reported sale price of the Company's common stock and (ii) the conversion rate on that date; and (c) upon the occurrence of specified corporate events, as defined in the 2021 Notes. From September 15, 2020 and until the close of business on the second scheduled trading day immediately preceding March 15, 2021, holders may convert their 2021 Notes at any time (regardless of the foregoing circumstances). The Company may not redeem the 2021 Notes prior to March 20, 2019. The Company may redeem the 2021 Notes, at its option, in whole or in part on or after March 20, 2019 until the close of business on the business day immediately preceding September 15, 2020 if the last reported sale price of the Company’s common stock has been at least 130% of the conversion price then in effect for at least 20 trading days during any 30 consecutive trading day period ending on, and including, the trading day immediately preceding the date on which the Company delivers written notice of a redemption. The redemption price will be equal to 100% of the principal amount of such 2021 Notes to be redeemed plus accrued and unpaid interest to, but excluding, the redemption date. No principal payments are due on the 2021 Notes prior to maturity. Other than restrictions relating to certain fundamental changes and consolidations, mergers or asset sales and customary anti-dilution adjustments, the 2021 Notes do not contain any financial covenants and do not restrict the Company from paying dividends or issuing or repurchasing any of its other securities. The Company is unaware of any current events or market conditions that would allow holders to convert the 2021 Notes.
The Company used a portion of the net proceeds from the 2021 Notes offering to repurchase a portion of the 2017 Notes. The Company intends to use the remainder of the net proceeds from the 2021 Notes offering for general corporate purposes. For more details, refer to “Repurchase of Senior Convertible Notes due 2017”.
2021 Hedge
In connection with the offering of the 2021 Notes, the Company entered into the hedge transaction with the initial purchasers and/or their affiliates (the "2021 Counterparties") entitling the Company to purchase up to 10,865,270 shares of the Company's common stock at an initial stock price of $59.82 per share, each of which is subject to adjustment. The cost of the 2021 Hedge was $111.2 million and accounted for as an equity instrument by recognizing $111.2 million in additional paid-in-capital during 2016. The 2021 Hedge will expire on March 15, 2021. The 2021 Hedge is expected to reduce the potential equity dilution upon conversion of the 2021 Notes if the daily volume-weighted average price per share of the Company's common stock exceeds the strike price of the 2021 Hedge. An assumed exercise of the 2021 Hedge by the Company is considered anti-dilutive since the effect of the inclusion would always be anti-dilutive with respect to the calculation of diluted earnings per share.
2021 Warrants
The Company sold warrants to the 2021 Counterparties to acquire up to 10,865,270 shares of the Company’s common stock. The 2021 Warrants will expire on various dates from June 2021 through December 2021 and may be settled in cash or net shares. It is the Company's current intent and policy to settle all conversions in shares of the Company’s common stock. The Company received $44.9 million in cash proceeds from the sale of the 2021 Warrants, which was recorded in additional paid-in-capital. The 2021 Warrants could have a dilutive effect on the Company's earnings per share to the extent that the price of the Company's common stock during a given measurement period exceeds the strike price of the 2021 Warrants, which is $80.00 per share. The Company uses the treasury share method for assumed conversion of its 2021 Warrants to compute the weighted average common shares outstanding for diluted earnings per share.
Repurchases of Senior Convertible Notes due 2017
In March 2016, the Company used approximately $345.2 million of the net proceeds from the 2021 Notes offering to repurchase approximately $276.8 million principal amount outstanding of the Senior Convertible Notes due 2017, the associated conversion feature of the repurchased notes (which is recorded in additional paid-in capital), and the accrued interest on the repurchased notes. Subsequently, in the fourth quarter of 2016, the Company used approximately $96.3 million of cash on hand to repurchase an additional $62.3 million in principal amount outstanding, the associated conversion feature of the repurchased notes (which is recorded in additional paid-in capital), and the accrued interest on the repurchased notes. The repurchases of 2017 Notes during the year ended December 31, 2016 resulted in a loss of approximately $19.1 million, which the Company recorded in other expense on the accompanying Consolidated Statements of Operations for the year ended December 31, 2016. The loss for the repurchases includes the related debt issuance costs that were previously capitalized in connection with the issuance of the 2017 Notes. The remaining balances resulting from the aggregate repurchase of a portion of the 2017 Notes were $63.3 million, $1.4 million, and $0.2 million of principal outstanding, debt discount, and debt issuance costs, respectively.
95
2.75% Senior Convertible Notes due 2017
In June 2011, the Company issued $402.5 million principal amount of Senior Convertible Notes with a stated interest rate of 2.75% and a maturity date of July 1, 2017 (the “2017 Notes”). The net proceeds from the offering, after deducting initial purchasers’ discounts and costs directly related to the offering, were approximately $359.2 million. The 2017 Notes may be settled in cash, stock, or a combination thereof, solely at the Company’s discretion. It is the Company’s current intent and policy to settle all conversions through combination settlement, which involves satisfying the principal amount outstanding with cash and any note conversion value over the principal amount in shares of the Company’s common stock. The initial conversion rate of the 2017 Notes is 23.7344 shares per $1,000 principal amount, which is equivalent to a conversion price of approximately $42.13 per share, subject to adjustments. The Company uses the treasury share method for assumed conversion of the 2017 Notes to compute the weighted average shares of common stock outstanding for diluted earnings per share. The Company also entered into transactions for convertible note hedge (the “2017 Hedge”) and warrants (the “2017 Warrants”) concurrently with the issuance of the 2017 Notes.
The cash conversion feature of the 2017 Notes required bifurcation from the Notes and was initially accounted for as a derivative liability and debt discount of $88.9 million upon issuance of the Notes without authorization of issuing additional common stocks for the conversion. Upon obtaining stockholder approval for the additional authorized shares of the Company’s common stock, the derivative liability was reclassified to stockholders’ equity, which resulted in recognizing cumulatively $39.5 million in other income for change in fair value measurement and $49.4 million in additional paid-in-capital during 2011.
The interest expense recognized on the 2017 Notes during the year ended December 31, 2016 includes $4.9 million, $7.5 million and $1.0 million for the contractual coupon interest, the accretion of the debt discount and the amortization of debt issuance costs, respectively. The interest expense recognized on the 2017 Notes during the year ended December 31, 2015 includes $11.1 million, $15.8 million and $2.1 million for the contractual coupon interest, the accretion of the debt discount and the amortization of the debt issuance costs, respectively. The effective interest rate on the 2017 Notes is 8.0%, which includes the interest on the notes, amortization of the debt discount and debt issuance costs. Interest on the 2017 Notes began accruing upon issuance and is payable semi-annually.
Prior to January 1, 2017, holders may convert their 2017 Notes only under the following conditions: (a) during any calendar quarter beginning October 1, 2011, if the reported sale price of the Company’s common stock for at least 20 days out of 30 consecutive trading days ending on the last trading day of the immediately preceding calendar quarter is greater than 130% of the conversion price on each applicable trading day; (b) during the five business day period in which the trading price of the 2017 Notes falls below 98% of the product of (i) the last reported sale price of the Company’s common stock and (ii) the conversion rate on that date; and (c) upon the occurrence of specified corporate events, as defined in the 2017 Notes. From January 1, 2017 and until the close of business on the second scheduled trading day immediately preceding July 1, 2017, holders may convert their 2017 Notes at any time (regardless of the foregoing circumstances). The Company may not redeem the 2017 Notes prior to maturity. Other than restrictions relating to certain fundamental changes and consolidations, mergers or asset sales and customary anti-dilution adjustments, the 2017 Notes do not contain any financial covenants and do not restrict the Company from paying dividends or issuing or repurchasing any of its other securities. At December 31, 2016, holders of the 2017 Notes were in a convertible position, as the reported sale price of the Company’s common stock for 20 days out of the last 30 consecutive trading days ending with December 31, 2016 exceeded 130% of the $42.13 per share conversion price on each applicable trading day. At December 31, 2016, a minimal amount of holders of the 2017 Notes had elected to convert their notes. The Company settled such conversions through the combination settlement described above. The 2017 Notes are recorded as current liabilities on the December 31, 2016 Consolidated Balance Sheet.
2017 Hedge
In connection with the offering of the 2017 Notes, the Company entered into the 2017 Hedge with the initial purchasers and/or their affiliates (the “2017 Counterparties”) entitling the Company to purchase up to 9,553,096 shares of the Company’s common stock at an initial stock price of $42.13 per share, each of which is subject to adjustment. The cost of the 2017 Hedge was $80.1 million and accounted for as derivative assets upon issuance of the 2017 Notes. Upon obtaining stockholder approval for the additional authorized shares of the Company’s common stock, the derivative asset was reclassified to stockholders’ equity, which resulted in recognizing cumulatively $37.1 million in other expense for the change in fair value measurement and $43.0 million in additional paid-in-capital during 2011. The 2017 Hedge will expire on July 1, 2017. The 2017 Hedge is expected to reduce the potential equity dilution upon conversion of the 2017 Notes if the daily volume-weighted average price per share of the Company’s common stock exceeds the strike price of the 2017 Hedge. An assumed exercise of the 2017 Hedge by the Company is considered anti-dilutive since the effect of inclusion would always be anti-dilutive with respect to the calculation of diluted earnings per share.
96
The Company sold warrants to the 2017 Counterparties to acquire up to 477,654 shares of the Company’s Series A Participating Preferred Stock at an initial strike price of $988.51 per share, subject to adjustment. Each share of Series A Participating Preferred Stock is convertible into 20 shares of the Company’s common stock, or up to 9,553,080 common shares in total. The 2017 Warrants will expire on various dates from September 2017 through January 2018 and may be settled in cash or net shares. It is the Company’s current intent and policy to settle all conversions in shares of the Company’s common stock. The Company received $47.9 million in cash proceeds from the sale of the 2017 Warrants, which was recorded in additional paid-in-capital. The 2017 Warrants could have a dilutive effect on the Company’s earnings per share to the extent that the price of the Company’s common stock during a given measurement period exceeds the strike price of the 2017 Warrants. The Company uses the treasury share method for assumed conversion of its 2017 Warrants to compute the weighted average common shares outstanding for diluted earnings per share.
Revolving Senior Credit Facility
In February 2016, the Company entered into a Credit Agreement (the “Credit Agreement”) for a revolving senior credit facility (the “Facility”) that provides for secured revolving loans, multicurrency loan options and letters of credit in an aggregate amount of up to $150.0 million. The Credit Agreement also contains an expansion feature, which allows the Company to increase the aggregate principal amount of the Facility provided the Company remains in compliance with the underlying financial covenants. The Facility matures February 8, 2021, and includes a sub-limit of $15.0 million for letters of credit and a sub-limit of $5.0 million for swing line loans. All assets of the Company and its material domestic and certain material international subsidiaries are pledged as collateral under the Facility (subject to customary exceptions) pursuant to the term set forth in the Security and Pledge Agreement (the “Security Agreement”) executed in favor of the administrative agent by the Company. Each of the Company’s material domestic subsidiaries guarantees the Facility. At December 31, 2016 the Company does not carry any outstanding revolving loans under the Facility.
Borrowings under the Facility are used by us to provide financing for working capital and other general corporate purposes, including potential mergers and acquisitions. Loans under the Facility bear interest, at the option of the Company, at either LIBOR (determined in accordance with the Credit Agreement) plus an applicable margin ranging from 1.00 % - 2.00 % per annum subject to Company’s applicable consolidated leverage ratio or the Base Rate (determined in accordance with the Credit Agreement), plus an applicable margin ranging from 0.0% - 1.25% per annum subject to Company’s applicable consolidated leverage ratio. The Facility has a commitment fee, which accrues at a rate of 0.2% - 0.4% per annum (determined in accordance with the Credit Agreement) based on the Company’s current leverage ratio.
The Credit Agreement contains affirmative, negative and financial covenants, and events of default customary for financings of this type. The financial covenants require the Company to maintain ratios of consolidated earnings before interest, taxes, depreciation and amortization (EBITDA) in relation to consolidated interest expense and consolidated debt, respectively, as defined in the Credit Agreement, at varying scales throughout the life of the Credit Agreement. The Facility grants the lenders preferred first priority liens and security interests in capital stock, intercompany debt and all of the present and future property and assets of the Company and each guarantor. The Company is currently in compliance with the Credit Agreement covenants.
7. Commitments
Leases
The Company leases office facilities and equipment under various operating and capital lease agreements. The initial terms of these leases range from 2 year to 15 years and generally provide for periodic rent increases and renewal options. Certain leases require the Company to pay taxes, insurance and maintenance. In connection with certain operating leases, the Company has security deposits recorded and maintained as restricted cash totaling $7.2 million as of December 31, 2016.
Rent expense is recognized on a straight-line basis over the term of the lease. Accordingly, rent expense recognized in excess of rent paid is reflected as a liability in the accompanying Consolidated Balance Sheets. Rent expense, including costs directly associated with the facility leases, was approximately $10.6 million, $9.3 million, and $11.5 million for the years ended December 31, 2016, 2015, and 2014, respectively.
97
The Company’s future minimum annual lease payments under capital and operating leases, including payments for costs directly associated with the facility leases, for years ending after December 31, 2016 are as follows (in thousands):
|
|
|
Capital |
|
|
Operating |
|
||
|
|
|
Leases |
|
|
Leases |
|
||
|
2017 |
|
$ |
630 |
|
|
$ |
12,273 |
|
|
2018 |
|
|
580 |
|
|
|
9,398 |
|
|
2019 |
|
|
429 |
|
|
|
9,048 |
|
|
2020 |
|
|
10 |
|
|
|
8,662 |
|
|
2021 |
|
|
— |
|
|
|
7,131 |
|
|
Thereafter |
|
|
— |
|
|
|
11,362 |
|
|
Total minimum lease payments |
|
$ |
1,649 |
|
|
$ |
57,874 |
|
|
Less amount representing interest |
|
|
(200 |
) |
|
|
|
|
|
Present value of obligations under capital leases |
|
|
1,449 |
|
|
|
|
|
|
Less current portion |
|
|
(512 |
) |
|
|
|
|
|
Long-term capital lease obligations |
|
$ |
937 |
|
|
|
|
|
Licensing and Purchasing Agreements
The Company is contingently obligated to make payments of up to $11.8 million in cash if specified future events occur or conditions are met as provided in certain consulting, purchase and/or product develop agreements. Not all of the respective agreements specify milestone payment timelines. The Company has also entered into certain consulting arrangements to pay up to approximately $18.7 million in the aggregate in the event that specified revenue-based milestones are achieved prior to 2024. Any such payment will be made in a combination of cash and the Company’s common shares as provided in the agreements. Any payments in satisfaction of theses contingent obligations are considered a cost of goods sold and are recognized as and if milestones are achieved. These agreements expire on various dates through 2024.
Executive Severance Plans
The Company has employment contracts with key executives and maintains severance plans that provide for the payment of severance and other benefits if terminated for reasons other than cause, as defined in those agreements and plans. Certain agreements call for payments that are based on historical compensation, accordingly, the amount of the contractual commitment will change over time commensurate with the executive’s applicable earnings. At December 31, 2016, future commitments for such key executives were approximately $30.2 million. In certain circumstances, the agreements call for the acceleration of equity vesting. Those figures are not reflected in the above information.
8. Stockholders’ Equity
Common Stock
There were 120,000,000 shares of common stock authorized at December 31, 2016 and 2015.
Preferred Stock
There are 5,000,000 shares of preferred stock authorized and none issued or outstanding at December 31, 2016 and 2015.
On June 28, 2011, in connection with the issuance of the 2017 Warrants, the Company amended its Restated Certificate of Incorporation to designate 477,654 shares of the Company’s authorized preferred stock, par value $0.001 per share, as Series A Participating Preferred Stock (the “Series A Preferred Stock”). The Series A Preferred Stock will automatically convert into shares of the Company’s common stock. The holders of Series A Preferred Stock (collectively, the Preferred Holders) are entitled to receive dividends when and if declared by the Board of Directors. The preferred dividends are payable in preference and in priority to any dividends on the Company’s common stock. Shares of Series A Preferred Stock are convertible into 20 shares of common stock, subject to certain anti-dilution adjustments. Preferred Holders vote on an equivalent basis with common stockholders on an as-converted basis. The Preferred Holders are entitled to receive liquidation preferences at the rate of $648.20 per share. Liquidation payments to the Preferred Holders have priority and are made in preference to any payments to the holders of common stock.
98
In March 2014, the Compensation Committee (the "Compensation Committee") of the Board of Directors of the Company adopted the 2014 Equity Incentive Plan of NuVasive, Inc. (the "2014 EIP"), replacing the 2004 Amended and Restated Equity Incentive Plan (the “2004 EIP”). No further awards may be granted under the 2004 EIP; however, that plan continues to govern all awards previously issued under it (of which awards remain outstanding). The 2014 EIP provides the Company with the ability to grant various types of equity awards to its workforce (including, without limitation, restricted stock units (“RSUs”), restricted stock awards, performance awards, and deferred stock awards). The 2014 EIP also provides for the issuance of performance RSUs (“PRSUs”) to be granted subject to time- and/or performance-based vesting requirements. In addition, the award agreements under the 2014 EIP generally provide for the acceleration of 50% of the unvested equity awards of all shareowners upon a change in control and the vesting of the remaining unvested equity awards for those shareowners that are involuntarily terminated within a year of the change in control.
Each of the 2004 EIP and the 2014 EIP allow for “net share settlement” of certain equity awards whereby, in lieu of (i) making cash payments in satisfaction of the exercise price owed respective to non-qualified stock option awards, or (ii) open market selling award shares to generate cash proceeds for use in satisfaction of statutory tax obligations respective to an award’s settlement or exercise, the company offsets the award shares being settled in a respective transaction by the number of shares of company stock with a value equal to the respective obligation, and, in the case of taxes, making a cash payment to the respective taxing authority on behalf of the shareowner using Company cash. The net share settlement is accounted for with the cost of any award shares that are net settled being included in treasury stock and reported as a reduction in total equity at the time of settlement.
In connection with the acquisition of Ellipse Technologies in February 2016 (see Note 5 to the Consolidated Financial Statements included in this Annual Report for further discussion), the Company assumed the Ellipse Technologies, Inc. 2015 Incentive Award Plan and the shares thereunder, subject to an equity exchange adjustment, for future awards by the Company.
The compensation cost that has been included in the statement of operations for the Company’s stock-based compensation plans was as follows (in thousands):
|
|
|
Year Ended December 31, |
|
|||||||||
|
|
|
2016 |
|
|
2015 |
|
|
2014 |
|
|||
|
Sales, marketing and administrative expense |
|
$ |
25,466 |
|
|
$ |
24,817 |
|
|
$ |
31,514 |
|
|
Research and development expense |
|
|
1,231 |
|
|
|
1,157 |
|
|
|
1,841 |
|
|
Cost of goods sold |
|
|
227 |
|
|
|
229 |
|
|
|
332 |
|
|
Stock-based compensation expense before taxes |
|
|
26,924 |
|
|
|
26,203 |
|
|
|
33,687 |
|
|
Related income tax benefits |
|
|
(10,770 |
) |
|
|
(10,481 |
) |
|
|
(13,475 |
) |
|
Stock-based compensation expense, net of taxes |
|
$ |
16,154 |
|
|
$ |
15,722 |
|
|
$ |
20,212 |
|
As of December 31, 2016, there was $18.5 million and $29.5 million of unrecognized compensation expense for RSUs and PRSUs, respectively, which is expected to be recognized over a weighted-average period of approximately 2.0 years and 2.6 years, respectively. In addition, as of December 31, 2016, there was $0.8 million of unrecognized compensation expense for shares expected to be issued under the ESPP which is expected to be recognized through April 2017. There was no unamortized expense for stock options as of December 31, 2016.
The Company adopted ASU 2016-09, Improvements to Employee Share-Based Payment Accounting, which provided for the change in classification for excess tax benefits in the Consolidated Statements of Cash Flows on a prospective basis. The excess tax benefits reported as a financing cash inflow for the years ended December 31, 2015 and 2014 were $15.2 million and $11.9 million, respectively, and accordingly, the Company did not report such financing cash flows for the year ended December 31, 2016. See Note 1 to the Consolidated Financial Statements included in this Annual Report for further discussion.
Restricted Stock Units
The total fair value of RSUs that vested during the year ended December 31, 2016, 2015, and 2014 was $31.2 million, $39.0 million and $27.5 million, respectively.
99
Following is a summary of RSU activity for the year ended December 31, 2016 (in thousands, except per share amounts):
|
|
|
|
|
|
|
Weighted |
|
|
|
|
|
|
|
|
|
Average |
|
|
|
|
|
Number of |
|
|
Grant Date |
|
||
|
|
|
Shares |
|
|
Fair Value |
|
||
|
Outstanding at December 31, 2015 |
|
|
1,349 |
|
|
$ |
31.82 |
|
|
Granted |
|
|
529 |
|
|
|
46.06 |
|
|
Vested |
|
|
(627 |
) |
|
|
25.54 |
|
|
Forfeited |
|
|
(155 |
) |
|
|
36.52 |
|
|
Outstanding at December 31, 2016 |
|
|
1,096 |
|
|
$ |
41.16 |
|
For the majority of RSUs, shares are issued on the vesting dates net of the amount of shares needed to satisfy statutory tax withholding requirements to be paid by the Company on behalf of the employees. The total shares withheld related to vested RSUs were approximately 227,000, 330,000, and 29,000 in 2016, 2015, and 2014, respectively, and were based on the value of the awards on their vesting dates as determined by the Company’s closing stock price. Total payments for the employees’ tax obligations to the taxing authorities related to vesting RSUs were $11.4 million, $15.4 million and $1.1 million in 2016, 2015 and 2014, respectively.
Performance-Based Restricted Stock Units
The Company has granted PRSUs since 2012 for which the ultimate issuance amount is determined by the Company’s Compensation Committee upon its certification of Company performance against a pre-determined matrix, including revenue targets, total shareholder return, or earnings per share over pre-determined periods of time. Share payout levels range from 0 to 250% depending on the respective terms of an award. Based upon the company’s actual performance against the performance conditions, approximately 117,000 shares of common stock vested on each of March 1, 2013, March 1, 2014, and March 1, 2015 for PRSUs granted in 2012, and approximately 470,000 shares of common stock vested on each of February 1, 2014 and February 1, 2015 for PRSUs granted in 2013, in each case in the aggregate for all award recipients. On February 1, 2016, based upon the company’s actual performance against the performance conditions, approximately 102,000 shares of common stock vested for PRSUs granted in 2014.
In 2015 and 2016, the Company granted PRSU awards with five year cliff vesting terms to its Chief Executive Officer and Vice Chairman, respectively, for which the performance criteria was not based on Company specific performance metrics, and as such, the Company recorded the award as a long-term liability as expensed over the service period. No amounts have been paid out on this award, or are expected to become due until 2020 and 2021.
The total fair value of performance awards vested during 2016, 2015, and 2014 was $12.6 million, $27.1 million and $21.6 million, respectively.
Following is a summary of PRSU activity for the year ended December 31, 2016 (in thousands, except per share amounts):
|
|
|
|
|
|
|
Maximum Number |
|
|
|
|
|
|
|
|
|
Shares |
|
|
of Shares Eligible to be Issued |
|
|
Average Grant Date Fair Value |
|
|||
|
Outstanding at December 31, 2015 |
|
|
803 |
|
|
|
1,357 |
|
|
$ |
46.42 |
|
|
Awarded at target |
|
|
392 |
|
|
|
651 |
|
|
|
45.11 |
|
|
Vested |
|
|
(145 |
) |
|
|
(179 |
) |
|
|
39.78 |
|
|
Forfeited |
|
|
(179 |
) |
|
|
(276 |
) |
|
|
44.22 |
|
|
Outstanding at December 31, 2016 |
|
|
871 |
|
|
|
1,553 |
|
|
$ |
46.76 |
|
For the majority of PRSUs, shares are issued on the vesting dates net of the amount of shares needed to satisfy statutory tax withholding requirements to be paid by the Company on behalf of the employees. The total shares withheld related to vesting PRSUs were approximately 58,000 and 292,000 in 2016 and 2015, respectively, and were based on the value of the awards on their vesting dates as determined by the Company’s closing stock price. Total payments for the employees’ tax obligations to the taxing authorities related to vesting PRSUs were $2.7 million and $13.5 million in 2016 and 2015, respectively. No shares were withheld from vesting PRSUs in 2014.
Stock Options
The Company has not granted any stock options since 2011. The stock options previously granted are exercisable for a period of up to ten years after the date of grant.
100
The aggregate intrinsic value of outstanding stock options at December 31, 2016 is based on the Company’s closing stock price on December 31, 2016 of $67.36. The Company received $3.0 million, $6.2 million and $17.5 million in proceeds from the exercise of stock options during the years ended December 31, 2016, 2015 and 2014, respectively. The total intrinsic value of stock options exercised was $29.0 million, $63.4 million, and $17.6 million during the years ended December 31, 2016, 2015 and 2014, respectively. There were no stock options that vested during the year ended December 31, 2016. The total fair value of stock options that vested during the year ended December 31, 2015 and 2014 was $0.3 million and $3.5 million, respectively.
Following is a summary of stock option activity for the year ended December 31, 2016 under all stock plans (in thousands, except years and per share amounts):
|
|
|
|
|
|
|
|
|
|
|
Weighted-Average |
|
|
|
|
|
|
|
|
|
|
|
|
|
|
|
|
|
Remaining |
|
|
|
|
|
|
|
|
|
|
|
|
|
Weighted |
|
|
Contractual |
|
|
Aggregate |
|
|||
|
|
|
|
|
|
|
Avg. Exercise |
|
|
Term |
|
|
Intrinsic |
|
|||
|
|
|
Shares |
|
|
Price |
|
|
(Years) |
|
|
Value |
|
||||
|
Outstanding at December 31, 2015 |
|
|
1,970 |
|
|
$ |
34.91 |
|
|
|
2.99 |
|
|
$ |
37,820 |
|
|
Exercised |
|
|
(1,556 |
) |
|
|
34.95 |
|
|
|
|
|
|
|
|
|
|
Cancelled |
|
|
(4 |
) |
|
|
18.92 |
|
|
|
|
|
|
|
|
|
|
Outstanding at December 31, 2016 |
|
|
410 |
|
|
|
34.93 |
|
|
|
2.47 |
|
|
$ |
13,292 |
|
|
Exercisable at December 31, 2016 |
|
|
410 |
|
|
$ |
34.93 |
|
|
|
2.47 |
|
|
$ |
13,292 |
|
|
Vested or expected to vest at December 31, 2016 |
|
|
410 |
|
|
$ |
34.93 |
|
|
|
2.47 |
|
|
$ |
13,292 |
|
For the majority of stock options, shares are issued on the exercise dates net of the amount of shares needed to satisfy each of the exercise price (in lieu of cash) and statutory tax withholding requirements, the latter to be paid by the Company on behalf of the employee. The total shares withheld related to exercised stock options were approximately 1,157,000, 2,461,000, and 205,000 in 2016, 2015, and 2014, respectively, and were based on the value of the stock options on their exercise dates as determined by the Company’s closing stock price. Total cash payments for the employees’ tax obligations to the taxing authorities related to exercised stock options were $10.7 million, $28.0 million, and $2.7 million, in 2016, 2015, and 2014, respectively.
Employee Stock Purchase Plan
The NuVasive, Inc. 2004 Amended and Restated Employee Stock Purchase Plan (the “ESPP”), provides eligible employees with a means of acquiring equity in the Company at a discounted purchase price using their own accumulated payroll deductions. Under the terms of the ESPP, employees can elect to have up to 15% of their annual compensation, up to a maximum of $21,250 per year, withheld to purchase shares of Company common stock for a purchase price equal to 85% of the lower of the fair market value per share (at closing) of Company common stock on (i) the commencement date of the two-year or six-month offering period (depending on the purchase period enrolled) or (ii) the respective purchase date. In the years ended December 31, 2016, 2015 and 2014, 152,000, 209,000, and 268,000 shares, respectively, were purchased under the ESPP.
The weighted average assumptions used to estimate the fair value of stock options granted and stock purchase rights under the ESPP are as follows:
|
|
|
Year Ended December 31, |
|
|||||||||
|
|
|
2016 |
|
|
2015 |
|
|
2014 |
|
|||
|
ESPP |
|
|
|
|
|
|
|
|
|
|
|
|
|
Volatility |
|
|
29 |
% |
|
|
40 |
% |
|
|
46 |
% |
|
Expected term (years) |
|
|
0.5 |
|
|
|
1.2 |
|
|
|
1.3 |
|
|
Risk free interest rate |
|
|
0.4 |
% |
|
|
0.2 |
% |
|
|
0.2 |
% |
|
Expected dividend yield |
|
|
— |
% |
|
|
— |
% |
|
|
— |
% |
101
Common Stock Reserved for Future Issuance
The following table summarizes common shares reserved for issuance on exercise or conversion at December 31, 2016 (in thousands):
|
Issued and outstanding stock options |
|
|
410 |
|
|
Issued and outstanding RSUs and PRSUs |
|
|
2,150 |
|
|
Available for issuance under the ESPP |
|
|
1,398 |
|
|
Available for future grant |
|
|
4,383 |
|
|
2017 Notes |
|
|
1,954 |
|
|
2017 Warrants |
|
|
19,106 |
|
|
2021 Notes |
|
|
14,396 |
|
|
2021 Warrants |
|
|
32,596 |
|
|
Total shares reserved for future issuance |
|
|
76,393 |
|
Pursuant to the terms of the 2014 EIP, shares subject to awards granted under the 2004 EIP may be utilized for future grants of awards under the 2014 EIP, to the extent such awards are terminated, cancelled or they expire, or shares subject thereto are withheld to cover taxes. During the year ended December 31, 2016, the Company filed a registration statement with the Securities and Exchange Commission with respect to 2.2 million of such shares for future issuance under the 2014 EIP. These shares are reflected in the number of shares available for future grants.
9. Income Taxes
Total income (loss) before income taxes summarized by region for the years ended December 31 is as follows (in thousands):
|
|
|
Year Ended December 31, |
|
|||||||||
|
|
|
2016 |
|
|
2015 |
|
|
2014 |
|
|||
|
United States |
|
$ |
77,538 |
|
|
$ |
128,489 |
|
|
$ |
11,462 |
|
|
Foreign |
|
|
(12,830 |
) |
|
|
(16,470 |
) |
|
|
(22,672 |
) |
|
Total income (loss) before income taxes |
|
$ |
64,708 |
|
|
$ |
112,019 |
|
|
$ |
(11,210 |
) |
The income tax provision (benefit) for the years ended December 31 consists of the following (in thousands):
|
|
|
Year Ended December 31, |
|
|||||||||
|
|
|
2016 |
|
|
2015 |
|
|
2014 |
|
|||
|
Current: |
|
|
|
|
|
|
|
|
|
|
|
|
|
Federal |
|
$ |
(14,837 |
) |
|
$ |
1,480 |
|
|
$ |
32,387 |
|
|
State |
|
|
1,283 |
|
|
|
178 |
|
|
|
3,359 |
|
|
Foreign |
|
|
2,350 |
|
|
|
2,090 |
|
|
|
2,259 |
|
|
Total current provision |
|
|
(11,204 |
) |
|
|
3,748 |
|
|
|
38,005 |
|
|
Deferred: |
|
|
|
|
|
|
|
|
|
|
|
|
|
Federal |
|
|
40,338 |
|
|
|
42,719 |
|
|
|
(28,604 |
) |
|
State |
|
|
1,453 |
|
|
|
4,433 |
|
|
|
(2,296 |
) |
|
Foreign |
|
|
(2,583 |
) |
|
|
(698 |
) |
|
|
(1,528 |
) |
|
Total deferred provision |
|
|
39,208 |
|
|
|
46,454 |
|
|
|
(32,428 |
) |
|
Changes in tax rate |
|
|
(216 |
) |
|
|
266 |
|
|
|
(84 |
) |
|
Changes in valuation allowance |
|
|
1,494 |
|
|
|
(3,739 |
) |
|
|
793 |
|
|
Total provision |
|
$ |
29,282 |
|
|
$ |
46,729 |
|
|
$ |
6,286 |
|
102
The differences between the income tax provision at the United States federal statutory tax rate and the Company’s effective tax rate for the years ended December 31 are the following (in thousands):
|
|
|
Year Ended December 31, |
|
|||||||||
|
|
|
2016 |
|
|
2015 |
|
|
2014 |
|
|||
|
Tax provision at federal statutory rate |
|
$ |
22,648 |
|
|
$ |
39,207 |
|
|
$ |
(3,923 |
) |
|
Globalization initiative |
|
|
6,290 |
|
|
|
9,039 |
|
|
|
9,244 |
|
|
Acquisition related charges |
|
|
5,167 |
|
|
|
— |
|
|
|
— |
|
|
State income tax |
|
|
3,243 |
|
|
|
4,264 |
|
|
|
827 |
|
|
Valuation allowance |
|
|
1,494 |
|
|
|
(3,739 |
) |
|
|
793 |
|
|
Income tax reserves |
|
|
759 |
|
|
|
2,301 |
|
|
|
657 |
|
|
Compensation expense |
|
|
(8,013 |
) |
|
|
(2,115 |
) |
|
|
1,428 |
|
|
Income tax credits and incentives |
|
|
(3,426 |
) |
|
|
(1,754 |
) |
|
|
(2,198 |
) |
|
Non-deductible meals and entertainment |
|
|
1,013 |
|
|
|
638 |
|
|
|
521 |
|
|
Foreign earnings taxed as non-United States rates |
|
|
605 |
|
|
|
(494 |
) |
|
|
(199 |
) |
|
Other |
|
|
(498 |
) |
|
|
(618 |
) |
|
|
(864 |
) |
|
Total provision |
|
$ |
29,282 |
|
|
$ |
46,729 |
|
|
$ |
6,286 |
|
Significant components of the Company’s deferred tax assets and liabilities at December 31 are composed of the following (in thousands):
|
|
|
December 31, |
|
|||||
|
|
|
2016 |
|
|
2015 |
|
||
|
Deferred tax assets: |
|
|
|
|
|
|
|
|
|
Litigation and related accrual |
|
$ |
— |
|
|
$ |
34,054 |
|
|
Share-based compensation |
|
|
18,227 |
|
|
|
23,641 |
|
|
Inventory |
|
|
16,324 |
|
|
|
13,344 |
|
|
Net operating loss carryforwards |
|
|
9,976 |
|
|
|
3,484 |
|
|
General business and other credit carryforwards |
|
|
21,215 |
|
|
|
5,425 |
|
|
Deferred rent |
|
|
4,347 |
|
|
|
5,154 |
|
|
Original issue discount |
|
|
8,817 |
|
|
|
— |
|
|
Other |
|
|
20,589 |
|
|
|
14,739 |
|
|
Gross deferred tax assets |
|
|
99,495 |
|
|
|
99,841 |
|
|
Less valuation allowance |
|
|
(10,544 |
) |
|
|
(7,290 |
) |
|
Net deferred tax assets |
|
|
88,951 |
|
|
|
92,551 |
|
|
Deferred tax liabilities: |
|
|
|
|
|
|
|
|
|
Depreciation |
|
|
(29,888 |
) |
|
|
(24,361 |
) |
|
Original issue discount |
|
|
— |
|
|
|
(1,090 |
) |
|
Acquired intangibles |
|
|
(69,428 |
) |
|
|
(295 |
) |
|
Other |
|
|
(1,687 |
) |
|
|
(1,278 |
) |
|
Total deferred tax liabilities |
|
|
(101,003 |
) |
|
|
(27,024 |
) |
|
Consolidated net deferred tax (liabilities) assets |
|
$ |
(12,052 |
) |
|
$ |
65,527 |
|
|
Add deferred tax liability, net, attributable to non-controlling interests |
|
|
528 |
|
|
|
897 |
|
|
Net deferred tax (liabilities) assets |
|
$ |
(11,524 |
) |
|
$ |
66,424 |
|
The following table summarizes the activity related to the Company’s unrecognized tax benefits (in thousands):
|
|
|
Year Ended December 31, |
|
|||||||||
|
|
|
2016 |
|
|
2015 |
|
|
2014 |
|
|||
|
Gross unrecognized tax benefits at January 1 |
|
$ |
12,448 |
|
|
$ |
12,372 |
|
|
$ |
4,504 |
|
|
Increases in tax positions for prior years |
|
|
1,716 |
|
|
|
2,614 |
|
|
|
5,294 |
|
|
Decreases in tax positions for prior years |
|
|
(270 |
) |
|
|
(3,156 |
) |
|
|
— |
|
|
Increases in tax positions for current year relating to ongoing operations |
|
|
6,205 |
|
|
|
618 |
|
|
|
2,574 |
|
|
Increases in tax positions for current year relating to acquisitions |
|
|
3,223 |
|
|
|
— |
|
|
|
— |
|
|
Gross unrecognized tax benefits at December 31 |
|
$ |
23,322 |
|
|
$ |
12,448 |
|
|
$ |
12,372 |
|
103
Included in the gross uncertain tax benefits balance at December 31, 2016 are $0.4 million of tax deductions for which there is uncertainty only regarding the timing of the tax benefit. In the event these deductions are deferred to a later period, it would accelerate the payment of cash to the taxing authority. Other than potential interest and penalties, such deferral would have no impact on tax expense. At December 31, 2016, 2015, and 2014, $12.5 million, $7.2 million, and $7.2 million, respectively, of the Company’s total unrecognized tax benefits, if recognized, would affect the effective income tax rate.
In accordance with the disclosure requirements as described in ASC Topic 740, Income Taxes, the Company has classified uncertain tax positions as non-current income tax liabilities unless expected to be paid in one year. The Company’s continuing practice is to recognize interest and/or penalties related to income tax matters in income tax expense. For the years ended December 31, 2016 and December 31, 2015, the Company recognized approximately $0.3 million and $0.1 million, respectively, in interest and penalties as income tax expense in the Consolidated Statements of Operations. The Company did not recognize any interest and penalties in 2014. The Company had approximately $0.5 million and $0.1 million for the payment of interest and penalties accrued at December 31, 2016 and December 31, 2015, respectively, in the Consolidated Balance Sheets.
The Company does not anticipate there will be a significant change in unrecognized tax benefits within the next 12 months.
The Company is subject to routine compliance reviews on various tax matters around the world in the ordinary course of business. Currently, income tax audits are being conducted in the state of New York and the state of Louisiana. U.S. and most foreign jurisdictions remain subject to examination in all years due to prior year net operating losses and R&D credits.
The undistributed earnings of the Company’s foreign subsidiaries as of December 31, 2016 are immaterial. In the event the Company is required to repatriate funds from outside of the United States, such repatriation would not generate additional United States tax liabilities, but could be subject to local laws and customs generating immaterial tax consequences in the subsidiaries’ jurisdictions.
At December 31, 2016, the Company had $42.7 million, $106.0 million and $8.6 million of federal, state and foreign net operating loss carryforwards, respectively, which will begin to expire in 2018, 2017, and 2018, respectively. Reserves of $52.7 million are recorded against California net operating losses of $52.7 million due to uncertainty surrounding their realization.
There were also federal and California income tax credit carryforwards of $18.2 million and $16.2 million, respectively. The federal credits will begin to expire in 2020. The California credits can be carried forward indefinitely. Reserves of $16.2 million are recorded against the California credits due to uncertainty surrounding their realization.
Due to the “change of ownership” provision of the Tax Reform Act of 1986, utilization of the Company’s net operating loss and credit carryforwards may be subject to an annual limitation against taxable income in future periods. As a result of any future ownership changes, the annual limitation of loss and credit carryforwards may cause them to expire before ultimately becoming available to reduce future income tax liabilities.
10. Business Segment, Product and Geographic Information
The Company operates in one segment based upon the Company’s organizational structure, the way in which the operations and investments are managed and evaluated by the chief operating decision maker (“CODM”) as well as the lack of availability of discrete financial information at a lower level. The Company’s CODM reviews revenue at the product line offering level, and manufacturing, operating income and expenses, and net income at the Company wide level to allocate resources and assess the Company’s overall performance. The Company shares common, centralized support functions, including finance, human resources, legal, information technology, and corporate marketing, all of which report directly to the CODM. Accordingly, decision-making regarding the Company’s overall operating performance and allocation of Company resources is assessed on a consolidated basis. As such, the Company operates as one reporting segment. The Company has disclosed the revenues for each of its product line offerings to provide the reader of the financial statements transparency into the operations of the Company.
The Company reports under two distinct product lines; spinal hardware and surgical support. The Company’s spinal hardware product line offerings include implants and fixation products, and following the acquisition of Ellipse Technologies, also include the MAGEC- EOS spinal bracing and lengthening system and the PRECICE limb lengthening system. The Company’s surgical support product offerings include IOM services, disposables and biologics, all of which are used to aid spinal surgery.
Revenue by product line was as follows (in thousands):
|
|
|
Year Ended December 31, |
|
|||||||||
|
|
|
2016 |
|
|
2015 |
|
|
2014 |
|
|||
|
Spinal Hardware |
|
$ |
674,057 |
|
|
$ |
559,388 |
|
|
$ |
522,683 |
|
|
Surgical Support |
|
|
288,015 |
|
|
|
251,725 |
|
|
|
239,732 |
|
|
Total Revenue |
|
$ |
962,072 |
|
|
$ |
811,113 |
|
|
$ |
762,415 |
|
104
Revenue and property and equipment, net, by geographic area were as follows (in thousands):
|
|
|
Revenue |
|
|
Property and Equipment, Net |
|
||||||||||||||
|
|
|
Year Ended December 31, |
|
|
December 31, |
|
||||||||||||||
|
|
|
2016 |
|
|
2015 |
|
|
2014 |
|
|
2016 |
|
|
2015 |
|
|||||
|
United States |
|
$ |
831,718 |
|
|
$ |
714,768 |
|
|
$ |
667,850 |
|
|
$ |
148,227 |
|
|
$ |
113,037 |
|
|
International (excludes Puerto Rico) |
|
|
130,354 |
|
|
|
96,345 |
|
|
|
94,565 |
|
|
|
33,297 |
|
|
|
28,404 |
|
|
Total |
|
$ |
962,072 |
|
|
$ |
811,113 |
|
|
$ |
762,415 |
|
|
$ |
181,524 |
|
|
$ |
141,441 |
|
11. Contingencies
The Company is subject to potential liabilities under government regulations and various claims and legal actions that are pending or may be asserted from time-to-time. These matters arise in the ordinary course and conduct of the Company’s business and include, for example, commercial, intellectual property, environmental, securities and employment matters. The Company intends to continue to defend itself vigorously in such matters. Furthermore, the Company regularly assesses contingencies to determine the degree of probability and range of possible loss for potential accrual in its financial statements. During the year December 31, 2016, the Company settled its ongoing litigation with Medtronic. As a result of the settlement, the Company paid $45.0 million to Medtronic and accordingly recorded a gain of $43.3 million related to the settlement by reducing its previous accrual of $88.3 million related to the matter.
During the year ended December 31 2015, the Company had a gain of $56.4 million related to a litigation accrual change resulting from the legal proceedings in the first phase of the Medtronic litigation whereby the damages awarded by the jury was overturned, and a gain of $2.8 million in litigation accrual change related to settlement of the NeuroVision trademark litigation. These amounts were offset by a litigation charge of $13.8 million related to the Office of the Inspector General of the U.S. Department of Health and Human Services investigation and a $3.3 million litigation charge in a general litigation matter. Refer to both the subsequent sections herein titled “Legal Proceedings” and to Note 12 to the Consolidated Financial Statements for further information.
An estimated loss contingency is accrued in the Company’s financial statements if it is probable that a liability has been incurred and the amount of the loss can be reasonably estimated. Based on the Company’s assessment, it has adequately accrued an amount for contingent liabilities currently in existence. The Company does not accrue amounts for liabilities that it does not believe are probable or that it considers immaterial to its overall financial position. Litigation is inherently unpredictable, and unfavorable resolutions could occur. As a result, assessing contingencies is highly subjective and requires judgment about future events. The amount of ultimate loss may exceed the Company’s current accruals, and it is possible that its cash flows or results of operations could be materially affected in any particular period by the unfavorable resolution of one or more of these contingencies.
Legal Proceedings
Medtronic Sofamor Danek USA, Inc. Litigation
In August 2008, Warsaw Orthopedic, Inc., Medtronic Sofamor Danek USA, Inc. and other Medtronic related entities (collectively, “Medtronic”) filed a patent infringement lawsuit against the Company (the “Medtronic Litigation”), alleging that certain of the Company’s products or methods, including the XLIF procedure, infringe, or contribute to the infringement of, various U.S. patents assigned or licensed to Medtronic. The Company brought counterclaims against Medtronic alleging infringement of certain of the Company’s patents. On July 13, 2016, the Company entered into a settlement and patent license agreement (the “2016 Settlement Agreement”) with Medtronic to settle the Medtronic Litigation. The Company no longer has any remaining liability or restricted cash related to this matter.
The Medtronic Litigation was administratively broken into three phases. The initial trial on the first phase of the case concluded in September 2011 in the U.S. District Court for the Southern District of California (the “District Court”), and a jury delivered an unfavorable verdict against the Company with respect to certain Medtronic patents and a favorable verdict with respect to one Company patent, including a monetary damages award of approximately $101.2 million to Medtronic.
Both parties appealed the verdict, and the Company entered into an escrow arrangement and transferred $113.3 million of cash into a restricted escrow account in March 2012 to secure the amount of judgment, plus prejudgment interest, during pendency of the appeal. In March 2015, the U.S. Court of Appeals for the Federal Circuit issued a decision upholding the jury’s findings of liability as to all patents, but overturning the damage award against the Company as improper (the “Court of Appeals Decision”). The case was remanded back to the District Court for further proceedings and a retrial to determine a proper damages award. As a result of the Court of Appeals Decision, the parties agreed to release all of the escrow funds related to this matter back to the Company. During the year ended December 31, 2015, the Company transferred all of the funds in escrow related to this matter, approximately $114.1 million, from long-term restricted cash and investments into its unrestricted investment accounts. In March 2015, the Company sought reexamination of certain claims of one of the Medtronic patents at issue and for which the Company was found to have infringed. On June 15, 2016, the District Court stayed remand proceedings and retrial of this first phase of the case pending the reexamination.
105
The second phase of the case involved one Medtronic cervical plate patent. In April 2013, the Company and Medtronic entered into a settlement agreement fully resolving the second phase of the case. As part of the settlement, the Company received a license to practice various patent families that collectively represent a majority of Medtronic’s patent rights related to cervical plate technology. In exchange for these license rights, the Company made a one-time payment to Medtronic of $7.5 million in May 2013. In addition, Medtronic will receive a royalty on certain cervical plate products sold by the Company, including the Helix and Gradient lines of products.
The third phase of the case involved Medtronic filing additional patent claims in the U.S. District Court for the Northern District of Indiana in August 2012 alleging that certain Company spinal implants (including its CoRoent XL family of spinal implants), the Company’s Osteocel Plus bone graft product, and the Company’s XLIF procedure and use of MaXcess IV retractor during the XLIF procedure infringe several Medtronic patents.
Under the terms of the 2016 Settlement Agreement, the Company paid Medtronic $45.0 million, and the parties released each other from, inter alia, any and all past patent infringement arising from the Medtronic Litigation. As a result, the Company adjusted its litigation accrual from $88.3 million to $45.0 million and recorded a $43.3 million gain in the Consolidated Statement of Operations for the year ended December 31, 2016. Pursuant to the 2016 Settlement Agreement, the parties granted each other irrevocable, worldwide, nonexclusive, paid-up, royalty-free licenses to practice certain of their respective patents as to certain of their respective existing product lines, subject to specified exceptions and limitations. The 2016 Settlement Agreement also provides that, subject to certain limitations and exceptions, and for a period of seven years, neither party will assert against the other certain claims for patent infringement (generally claims related to spinal implants and related instruments, biologics and neuromonitoring) other than through a specified dispute resolution process, with the right to thereafter pursue claims outside that process subject to certain limitations and exceptions. Further, Medtronic has agreed that, for a period of five years, and subject to limitations and exceptions, it will not assert against the Company certain other claims for patent infringement other than through a specified dispute resolution process, with the right to thereafter pursue claims outside that process subject to certain limitations and exceptions.
Trademark Infringement Litigation
On September 25, 2009, Neurovision Medical Products, Inc. (“NMP”) filed a lawsuit against the Company in the U.S. District Court for the Central District of California (the “Central District Court”) alleging trademark infringement and unfair competition. NMP sought cancellation of NuVasive’s “NeuroVision” trademark registrations, injunctive relief and damages based on NMP’s common law use of the “NeuroVision” mark. The matter was tried in October 2010 and an unfavorable jury verdict was delivered against the Company. The verdict awarded damages to NMP of $60.0 million, and the Company appealed the judgment. The judgment was reversed and vacated on appeal, and a new trial was conducted in the Central District Court. In April 2014, a jury returned a verdict in favor of NMP on its claims against the Company in the amount of $30.0 million. The Central District Court also entered an order canceling the Company’s NeuroVision trademark registrations. In July 2015, the Company agreed to settle all outstanding matters with NMP for $27.2 million. The Company adjusted its litigation accrual from $30.0 million to $27.2 million at June 30, 2015, which resulted in a $2.8 million gain which was recorded in the Consolidated Statement of Operations during the three months ended June 30, 2015. The Company previously escrowed funds totaling $32.5 million to secure the amount of judgment, and cover potential attorney’s fees and costs. Those funds accrued interest and were included in short-term restricted cash and investments in the Consolidated Balance Sheets until funding of the settlement which occurred during the three months ended September 30, 2015. The Company no longer has any remaining liability or restricted cash related to this matter.
Securities Litigation
On August 28, 2013, a purported securities class action lawsuit was filed in the U.S. District Court for the Southern District of California naming the Company and certain of its current and former executive officers for allegedly making false and materially misleading statements regarding the Company’s business and financial results, specifically relating to the purported improper submission of false claims to Medicare and Medicaid. The operative complaint asserts a putative class period stemming from October 22, 2008 to July 30, 2013. The complaint alleges violations of Sections 10(b) and 20(a) of the Securities Exchange Act of 1934, as amended, and Rule 10b-5 promulgated thereunder and seeks unspecified monetary relief, interest, and attorneys’ fees. On February 13, 2014, Brad Mauss, the lead plaintiff in the case (“Plaintiff”), filed an Amended Class Action Complaint for Violations of the Federal Securities Laws. The Company answered the complaint on August 25, 2016, and discovery is proceeding. Plaintiffs filed motions for class certification on October 28, 2016 and the Company’s opposition papers were filed on January 9, 2017. Trial has been set for December 18, 2017. At December 31, 2016, the probable outcome of this litigation cannot be determined, nor can the Company estimate a range of potential loss. In accordance with authoritative guidance on the evaluation of loss contingencies, the Company has not recorded an accrual related to this litigation.
106
Shareholder Derivative Litigation
On September 28, 2016, a shareholder derivative complaint was filed by James Borta in the Superior Court of California for the County of San Diego naming certain of the Company’s current and former executive officers and directors for allegedly breaching their fiduciary duties by, among other things, making allegedly false and misleading statements about the Company’s business, operations, and prospects. The derivative complaint is based upon the same factual allegations as the securities class action litigation and names the Company as a nominal defendant. The Company demurred to the complaint on December 16, 2016 and the plaintiff filed an opposition on January 6, 2017. At December 31, 2016, the probable outcome of this litigation cannot be determined, nor can the Company estimate a range of potential loss. In accordance with authoritative guidance on the evaluation of loss contingencies, the Company has not recorded an accrual related to this litigation.
Madsen Medical, Inc. Litigation
On February 22, 2016, an unfavorable jury verdict was delivered against the Company in its litigation in the U.S. District Court for the Southern District of California against Madsen Medical, Inc. (“MMI”), a former sales agent. Specifically, the jury awarded MMI $7.5 million in lost profits for tortious interference, $14.0 million for unjust enrichment, $20.0 million in punitive damages, and approximately $0.3 million in damages for breach of contract. On March 18, 2016, the trial court entered judgment in favor of MMI in the amount of $27.8 million, which amount excluded the $14.0 million disgorgement awarded by the jury. On July 5, 2016, the trial court also awarded MMI attorney’s fees and costs of approximately $1.1 million. The Company’s post-trial motions for judgment as a matter of law and/or for a new trial were denied, and the Company has filed a notice of appeal of both the verdict and the court’s subsequent award of attorney’s fees and costs. During pendency of any appeals, the Company has secured a bond to cover the amount of the judgment and attorneys’ fees and costs.
Historically the Company had believed the likelihood of a loss in this case was remote given the underlying facts of the case, however, during the quarter ended March 31, 2016, the judgment entered caused the Company to reassess its position. The Company, based on its own assessment as well as that of outside counsel, believes that the judgment will be vacated on appeal, and accordingly, at December 31, 2016, the Company believes that the outcome of the case does not constitute a probable nor an estimable loss associated with the litigation but rather a reasonably possible loss rather than a remote loss as historically contemplated. Therefore, the Company has not recorded a loss contingency but has assessed a reasonable range of potential loss, which would be from zero to the current amount entered as a judgment, as well as attorney’s fees and interest, in accordance with the accounting guidance required by ASC 450, Contingencies.
12. Regulatory Matters
In 2013, the Company received a federal administrative subpoena from the Office of the Inspector General of the U.S. Department of Health and Human Services (OIG) in connection with an investigation into possible false or otherwise improper claims submitted to Medicare and Medicaid. In April 2015, the Company announced that it had reached an agreement in principle with the U.S. Department of Justice (“DOJ”) to settle this matter, and in July 2015, the Company entered into a definitive settlement agreement. Under the terms of the agreement, the Company agreed to pay $13.5 million plus fees and accrued interest of approximately $0.3 million to resolve this matter. The settlement was not an admission of liability or wrongdoing by the Company, and the Company was not required to enter into a corporate integrity agreement with the OIG as part of the settlement. In accordance with the authoritative guidance on the evaluation of loss contingencies, the Company recorded a $13.8 million litigation charge related to this matter, which is included in the Consolidated Statements of Operations during the year ended December 31, 2015, and funded the $13.8 million settlement during the year ended December 31, 2015.
On August 31, 2015, the Company received a civil investigative demand (“CID”) issued by the DOJ pursuant to the federal False Claims Act. The CID requires the delivery of a wide range of documents and information related to an investigation by the DOJ concerning allegations that the Company assisted a physician group customer in submitting improper claims for reimbursement and made improper payments to the physician group in violation of the Anti-Kickback Statute. The Company is cooperating with the DOJ. No assurance can be given as to the timing or outcome of this investigation. At December 31, 2016, the probable outcome of this matter cannot be determined, nor can the Company estimate a range of potential loss. In accordance with authoritative guidance on the evaluation of loss contingencies, the Company has not recorded an accrual related to this matter.
107
13. Quarterly Data (unaudited)
The following quarterly financial data, in the opinion of management, reflects all adjustments, consisting of normal recurring adjustments necessary, for a fair presentation of results for the periods presented (in thousands, except per share amounts):
|
|
|
Year Ended December 31, 2016 (1) |
|
|||||||||||||
|
|
|
First Quarter (2)(3) |
|
|
Second Quarter (4) |
|
|
Third Quarter |
|
|
Fourth Quarter (3)(5) |
|
||||
|
Revenue |
|
$ |
215,104 |
|
|
$ |
236,210 |
|
|
$ |
239,649 |
|
|
$ |
271,109 |
|
|
Gross profit |
|
|
160,878 |
|
|
|
176,465 |
|
|
|
180,453 |
|
|
|
204,183 |
|
|
Consolidated net (loss) income |
|
|
(3,825 |
) |
|
|
29,790 |
|
|
|
3,495 |
|
|
|
5,966 |
|
|
Net (loss) income attributable to NuVasive, Inc. |
|
|
(3,368 |
) |
|
|
30,213 |
|
|
|
3,926 |
|
|
|
6,376 |
|
|
Basic net (loss) income per common share attributable to NuVasive, Inc. |
|
|
(0.07 |
) |
|
|
0.60 |
|
|
0.08 |
|
|
0.13 |
|
||
|
Diluted net (loss) income per common share attributable to NuVasive, Inc. |
|
|
(0.07 |
) |
|
|
0.57 |
|
|
0.07 |
|
|
0.11 |
|
||
|
|
|
Year Ended December 31, 2015 |
|
|||||||||||||
|
|
|
First Quarter (6) |
|
|
Second Quarter |
|
|
Third Quarter |
|
|
Fourth Quarter |
|
||||
|
Revenue |
|
$ |
192,383 |
|
|
$ |
202,910 |
|
|
$ |
200,538 |
|
|
$ |
215,282 |
|
|
Gross profit |
|
|
146,719 |
|
|
|
154,495 |
|
|
|
151,371 |
|
|
|
164,049 |
|
|
Consolidated net income |
|
|
31,397 |
|
|
|
10,040 |
|
|
|
12,750 |
|
|
|
11,103 |
|
|
Net income attributable to NuVasive, Inc. |
|
|
31,560 |
|
|
|
10,268 |
|
|
|
12,960 |
|
|
|
11,503 |
|
|
Basic net income per common share attributable to NuVasive, Inc. |
|
|
0.66 |
|
|
|
0.21 |
|
|
0.26 |
|
|
|
0.23 |
|
|
|
Diluted net income per common share attributable to NuVasive, Inc. |
|
|
0.61 |
|
|
|
0.20 |
|
|
0.24 |
|
|
|
0.22 |
|
|
|
(1) |
The unaudited quarterly financial data set forth for the year ended December 31, 2016 includes the operations and results of Ellipse Technologies, BNN Holdings and the Company’s other acquisitions from their respective dates of acquisition. See Note 5 to the Consolidated Financial Statements included in this Annual Report for further discussion. |
|
(2) |
The Company elected to early adopt ASU 2016-09 in the second quarter of 2016. As a result, the Company recorded a retrospective adjustment to the previously reported first quarter 2016 provision for income taxes of approximately $5.5 million for the recognition of excess tax benefits in the provision for income taxes rather than additional paid-in capital and a decrease in net loss per share of $0.11 for the three months ended March 31, 2016. See Note 1 to the Consolidated Financial Statements included in this Annual Report for further discussion. |
|
(3) |
Consolidated financial results include losses from repurchases of Senior Convertible Notes due 2017 of $17.4 million and $1.7 million in the first and fourth quarters of fiscal year 2016, respectively. |
|
(4) |
Consolidated financial results include a litigation liability gain of $43.3 million in connection with the settlement of all outstanding litigation matters with Medtronic. |
|
(5) |
Consolidated financial results include a purchase order for $4.8 million from an organization established by certain former stockholders of Ellipse Technologies. See Note 4 to the Consolidated Financial Statements included in this Annual Report for further discussion on the purchase order. |
|
(6) |
Consolidated financial results include a litigation liability gain of $56.4 million stemming from a favorable appeal in the first phase of the Medtronic litigation, and a litigation liability loss of $13.8 million in connection with the OIG investigation. |
108
|
Exhibit Number |
|
|
|
Description |
|
||
|
2.1† |
|
Agreement and Plan of Merger, dated January 4, 2016, by and among the Company, Magneto Acquisition Corporation, a Delaware corporation and wholly-owned subsidiary of the Company, Ellipse Technologies, Inc., and Fortis Advisors LLC, a Delaware limited liability corporation, in its capacity as the equityholders’ representative (incorporated by reference to our Current Report on Form 8-K filed with the Commission on February 11, 2016) |
|||||
|
2.2 |
|
Agreement and Plan of Merger, dated June 6, 2016, by and among the Company, Bionic Acquisition Corporation, a Delaware corporation and wholly-owned subsidiary of the Company, BNN Holdings Corp., and GPP I-BNN, LLC, a Delaware limited liability corporation, in its capacity as the security holders’ agent to BNN Holdings Corp. (incorporated by reference to our Current Report on Form 8-K filed with the Commission on July 5, 2016) |
|||||
|
3.1 |
|
Restated Certificate of Incorporation (incorporated by reference to our Quarterly Report on Form 10-Q filed with the Commission on August 13, 2004) |
|||||
|
3.2 |
|
Certificate of Amendment to the Restated Certificate of Incorporation (incorporated by reference to our Current Report on Form 8-K filed with the Commission on September 28, 2011) |
|||||
|
3.3 |
|
Restated Bylaws (incorporated by reference to our Current Report on Form 8-K filed with the Commission on January 6, 2012) |
|||||
|
3.4 |
|
Amendment No. 1 to the Restated Bylaws (incorporated by reference to our Current Report on Form 8-K filed with the Commission on May 19, 2014) |
|||||
|
3.5 |
|
Amendment No. 2 to the Restated Bylaws (incorporated by reference to our Current Report on Form 8-K filed with the SEC on August 1, 2016) |
|||||
|
4.1 |
|
Specimen Common Stock Certificate (incorporated by reference to our Annual Report on Form 10-K filed with the Commission on March 16, 2006) |
|||||
|
4.2 |
|
Certificate of Designations of Series A Participating Preferred Stock filed with the Delaware Secretary of State on June 28, 2011 (incorporated by reference to our Current Report on Form 8-K filed with the Commission on June 29, 2011) |
|||||
|
4.3 |
|
Indenture dated June 28, 2011 between the Company and U.S. National Association (incorporated by reference to our Current Report on Form 8-K filed with the Commission on June 29, 2011) |
|||||
|
4.4 |
|
Form of 2.75% Convertible Senior Note due 2017 (incorporated by reference to our Current Report on Form 8-K filed with the Commission on June 29, 2011) |
|||||
|
4.5 |
|
Indenture, dated March 16, 2016, between the Company and Wilmington Trust, National Association, as Trustee (incorporated by reference to our Current Report on Form 8-K filed with the Commission on March 16, 2016) |
|||||
|
4.6 |
|
Form of 2.25% Convertible Senior Note due 2021 (incorporated by reference to our Current Report on Form 8-K filed with the Commission on March 16, 2016) |
|||||
|
10.1# |
|
2004 Amended and Restated Equity Incentive Plan (incorporated by reference to our Quarterly Report on Form 10-Q filed with the Commission on July 26, 2012) |
|||||
|
10.2# |
|
Amendment No. 1 to the 2004 Amended and Restated Equity Incentive Plan (incorporated by reference to our Annual Report on Form 10-K filed with the Commission on March 3, 2014) |
|||||
|
10.3# |
|
Form of Stock Option Award Notice under the 2004 Amended and Restated Equity Incentive Plan (incorporated by reference to Amendment No. 1 to our Registration Statement on Form S-1 filed with the Commission on April 8, 2004) |
|||||
|
10.4# |
|
Form of Option Exercise and Stock Purchase Agreement under the 2004 Amended and Restated Equity Incentive Plan (incorporated by reference to Amendment No. 1 to our Registration Statement on Form S-1 filed with the Commission on April 8, 2004) |
|||||
|
10.5# |
|
Form of Restricted Stock Unit Award Agreement under the 2004 Amended and Restated Equity Incentive Plan (incorporated by reference to our Annual Report on Form 10-K filed with the Commission on February 26, 2010) |
|||||
|
10.6# |
|
Form of Restricted Stock Grant Notice and Restricted Stock Agreement under the 2004 Amended and Restated Equity Incentive Plan (incorporated by reference to Amendment No.1 to our Registration Statement on Form S-1 filed with the Commission on April 8, 2004) |
|||||
|
10.7# |
|
NuVasive, Inc. 2004 Amended and Restated Employee Stock Purchase Plan (incorporated by reference to our Quarterly Report on Form 10-Q filed with the Commission on October 30, 2014) |
|||||
109
|
Exhibit Number |
|
|
|
Description |
|
||
|
10.8# |
|
2014 Equity Incentive Plan (incorporated by reference to Exhibit A to our Definitive Proxy Statement filed with the Commission on March 27, 2014) |
|||||
|
10.9# |
|
Form of Performance Restricted Stock Unit Agreement (with accompanying Form Notice of Grant) under the 2014 Equity Incentive Plan (incorporated by reference to our Quarterly Report on Form 10-Q filed with the Commission on May 4, 2015) |
|||||
|
10.10# |
|
Form of Executive Restricted Stock Unit Agreement (with accompanying Form Notice of Grant) under the 2014 Equity Incentive Plan (incorporated by reference to our Quarterly Report on Form 10-Q filed with the Commission on May 4, 2015) |
|||||
|
10.11# |
|
Form of Performance Cash Award Agreement (with accompanying Form Notice of Grant) under the 2014 Equity Incentive Plan (incorporated by reference to our Quarterly Report on Form 10-Q filed with the Commission on May 4, 2015) |
|||||
|
10.12# |
|
Form of Performance Restricted Stock Unit Agreement (with accompanying Notice of Grant) for grants after February 11, 2016 under the 2014 Equity Incentive Plan (incorporated by reference to our Annual Report on Form 10-K filed with the Commission on February 11, 2016) |
|||||
|
10.13# |
|
Form of Executive Restricted Stock Unit Agreement (with accompanying Form Notice of Grant) for grants after February 11, 2016 under the 2014 Equity Incentive Plan (incorporated by reference to our Annual Report on Form 10-K filed with the Commission on February 11, 2016) |
|||||
|
10.14# |
|
Form of Performance Cash Award Agreement (with accompanying Form Notice of Grant) for grants after February 11, 2016 under the 2014 Equity Incentive Plan (incorporated by reference to our Annual Report on Form 10-K filed with the Commission on February 11, 2016) |
|||||
|
10.15# |
|
Form of Performance Restricted Stock Unit Agreement (with accompanying Notice of Grant) for grants after February 8, 2017 under the 2014 Equity Incentive Plan |
|||||
|
10.16# |
|
Form of Executive Restricted Stock Unit Agreement (with accompanying Form Notice of Grant) for grants after February 8, 2017 under the 2014 Equity Incentive Plan |
|||||
|
10.17# |
|
Form of Performance Cash Award Agreement (with accompanying Form Notice of Grant) for grants after February 8, 2017 under the 2014 Equity Incentive Plan |
|||||
|
10.18# |
|
NuVasive, Inc. 2014 Executive Incentive Compensation Plan (incorporated by reference to Exhibit B to our Definitive Proxy Statement filed with the Commission on March 27, 2014) |
|||||
|
10.19# |
|
2015 Ellipse Technologies, Inc. Incentive Award Plan (incorporated by reference to our Registration Statement on Form S-8 filed with the Commission on February 11, 2016) |
|||||
|
10.20# |
|
Form of Indemnification Agreement between the Company and its directors and certain executives thereof (incorporated by reference to our Current Report on Form 8-K filed with the Commission on May 19, 2014) |
|||||
|
10.21# |
|
NuVasive, Inc. Amended and Restated Executive Severance Plan (incorporated by reference to our Current Report on Form 8-K filed with the Commission on August 6, 2015) |
|||||
|
10.22# |
|
Form of Change in Control Agreement between the Company and certain executives thereof (incorporated by reference to our Current Report on Form 8-K filed with the Commission on May 19, 2014) |
|||||
|
10.23# |
|
NuVasive, Inc. Deferred Compensation Plan (incorporated by reference to our Current Report on Form 8-K filed with the Commission on August 6, 2015) |
|||||
|
10.24# |
|
Letter Agreement dated May 22, 2015 between the Company and Gregory T. Lucier (incorporated by reference to our Current Report on Form 8-K filed with the Commission on May 26, 2015) |
|||||
|
10.25# |
|
Letter Agreement dated September 11, 2016 between the Company and Patrick S. Miles (incorporated by reference to our Quarterly Report on Form 10-Q filed with the Commission on October 26, 2016) |
|||||
|
10.26# |
|
Notice of Grant of Share Purchase Matching Performance Restricted Stock Units and Award Agreement granted to Gregory T. Lucier on May 22, 2015 (incorporated by reference to our Current Report on Form 8-K filed with the Commission on May 26, 2015) |
|||||
|
10.27# |
|
Notice of Grant of “Inducement” Performance Restricted Stock Units and Award Agreement granted to Gregory T. Lucier on May 22, 2015 (incorporated by reference to our Current Report on Form 8-K filed with the Commission on May 26, 2015) |
|||||
110
|
Exhibit Number |
|
|
|
Description |
|
||
|
10.28# |
|
Notice of Grant of Share Purchase Matching Performance Restricted Stock Units and Award Agreement granted to Patrick S. Miles on September 11, 2016 (incorporated by reference to our Quarterly Report on Form 10-Q filed with the Commission on October 26, 2016) |
|||||
|
10.29# |
|
Non-Employee Director Cash Compensation Plan (incorporated by reference to our Annual Report on Form 10-K filed with the Commission on March 3, 2014) |
|||||
|
10.30 |
|
Lease Agreement for Sorrento Summit dated November 6, 2007 between the Company and HCPI/Sorrento, LLC (incorporated by reference to our Quarterly Report on Form 10-Q filed with the Commission on November 8, 2007) |
|||||
|
10.31 |
|
Confirmation for base call option transaction dated June 22, 2011 between the Company and Bank of America, N.A. (incorporated by reference to our Current Report on Form 8-K filed with the Commission on June 29, 2011) |
|||||
|
10.32 |
|
Confirmation for additional call option transaction dated June 24, 2011, between the Company and Bank of America, N.A. (incorporated by reference to our Current Report on Form 8-K filed with the Commission on June 29, 2011) |
|||||
|
10.33 |
|
Confirmation for base call option transaction dated June 22, 2011 between the Company and Goldman, Sachs & Co. (incorporated by reference to our Current Report on Form 8-K filed with the Commission on June 29, 2011) |
|||||
|
10.34 |
|
Confirmation for additional call option transaction dated June 24, 2011 between the Company and Goldman, Sachs & Co. (incorporated by reference to our Current Report on Form 8-K filed with the Commission on June 29, 2011) |
|||||
|
10.35 |
|
Confirmation for base warrant transaction dated June 22, 2011 between the Company and Bank of America, N.A. (incorporated by reference to our Current Report on Form 8-K filed with the Commission on June 29, 2011) |
|||||
|
10.36 |
|
Confirmation for additional warrant transaction dated June 24, 2011 between the Company and Bank of America, N.A. (incorporated by reference to our Current Report on Form 8-K filed with the Commission on June 29, 2011) |
|||||
|
10.37 |
|
Confirmation for base warrant transaction dated June 22, 2011 between the Company and Goldman, Sachs & Co. (incorporated by reference to our Current Report on Form 8-K filed with the Commission on June 29, 2011) |
|||||
|
10.38 |
|
Confirmation for additional warrant transaction dated June 24, 2011 between the Company and Goldman, Sachs & Co. (incorporated by reference to our Current Report on Form 8-K filed with the Commission on June 29, 2011) |
|||||
|
10.39 |
|
Credit Agreement, dated February 8, 2016, by and among the Company, as the Borrower, Certain Subsidiaries of the Company, Bank of America, N.A. and each of those additional Lenders that are a party to such agreement (incorporated by reference to our Current Report on Form 8-K filed with the Commission on February 11, 2016) |
|||||
|
10.40 |
|
Security and Pledge Agreement, dated February 8, 2016, by and among the Company, as the Borrower, and Certain Subsidiaries of the Company in favor of Bank of America, N.A. (incorporated by reference to our Current Report on Form 8-K filed with the Commission on February 11, 2016) |
|||||
|
10.41 |
|
Amendment No. 1 to Credit Agreement, dated March 9, 2016, by and among the Company, as the Borrower, the Other Loan Parties, Bank of America, N.A. and each of those additional Lenders that are a party to such agreement (incorporated by reference to our Current Report on Form 8-K filed with the Commission on March 9, 2016) |
|||||
|
10.42 |
|
Confirmation for base call option transaction, dated March 10, 2016, by and between the Company and Bank of America, N.A. (incorporated by reference to our Current Report on Form 8-K filed with the Commission on March 16, 2016) |
|||||
|
10.43 |
|
Confirmation for additional call option transaction, dated March 11, 2016, by and between the Company and Bank of America, N.A. (incorporated by reference to our Current Report on Form 8-K filed with the Commission on March 16, 2016) |
|||||
|
10.44 |
|
Confirmation for base call option transaction, dated March 10, 2016, by and between the Company and Goldman, Sachs & Co. (incorporated by reference to our Current Report on Form 8-K filed with the Commission on March 16, 2016) |
|||||
|
10.45 |
|
Confirmation for additional call option transaction, dated March 11, 2016, by and between the Company and Goldman, Sachs & Co. (incorporated by reference to our Current Report on Form 8-K filed with the Commission on March 16, 2016) |
|||||
|
10.46 |
|
Confirmation for base warrant transaction, dated March 10, 2016, by and between the Company and Bank of America, N.A. (incorporated by reference to our Current Report on Form 8-K filed with the Commission on March 16, 2016) |
|||||
111
|
Exhibit Number |
|
|
|
Description |
|
||
|
10.47 |
|
Confirmation for additional warrant transaction, dated March 11, 2016, by and between the Company and Bank of America, N.A. (incorporated by reference to our Current Report on Form 8-K filed with the Commission on March 16, 2016) |
|||||
|
10.48 |
|
Confirmation for base warrant transaction, dated March 10, 2016, by and between the Company and Goldman, Sachs & Co. (incorporated by reference to our Current Report on Form 8-K filed with the Commission on March 16, 2016) |
|||||
|
10.49 |
|
Confirmation for additional warrant transaction, dated March 11, 2016, by and between the Company and Goldman, Sachs & Co. (incorporated by reference to our Current Report on Form 8-K filed with the Commission on March 16, 2016) |
|||||
|
10.50 |
|
Preferred Stock Purchase Agreement dated January 13, 2009 among the Company, Progentix Orthobiology, B.V. and the sellers listed on Schedule A thereto (incorporated by reference to our Annual Report on Form 10-K filed with the Commission on February 26, 2010) |
|||||
|
10.51† |
|
Option Purchase Agreement dated January 13, 2009 among the Company, Progentix Orthobiology, B.V. and the sellers listed on Schedule A thereto (incorporated by reference to our Annual Report on Form 10-K filed with the Commission on February 26, 2010) |
|||||
|
10.52† |
|
Exclusive Distribution Agreement dated January 13, 2009 between the Company and Progentix Orthobiology, B.V. (incorporated by reference to our Quarterly Report on Form 10-Q filed with the Commission on May 8, 2009) |
|||||
|
10.53† |
|
Settlement and License Agreement dated April 25, 2013 among the Company, Medtronic Sofamor Danek USA, Inc., Warsaw Orthopedic, Inc., Medtronic Puerto Rico Operations Co. and Medtronic Sofamor Danek Deggendorf, GmbH (incorporated by reference to our Quarterly Report on Form 10-Q filed with the Commission on July 30, 2013) |
|||||
|
10.54† |
|
Settlement and Patent License Agreement dated July 13, 2016 between the Company and Medtronic plc together with its wholly owned subsidiaries Medtronic Sofamor Danek USA, Inc., Warsaw Orthopedic, Inc., Medtronic Puerto Rico Operations Co., and Medtronic Sofamor Danek Deggendorf GmbH (incorporated by reference to our Quarterly Report on Form 10-Q filed with the Commission on October 26, 2016) |
|||||
|
21.1 |
|
List of subsidiaries of the Company |
|||||
|
23.1 |
|
Consent of Independent Registered Public Accounting Firm |
|||||
|
31.1 |
|
Certification of Chief Executive Officer pursuant to Rule 13a-14(a) and 15d-14(a) of the Securities Exchange Act of 1934, as amended |
|||||
|
31.2 |
|
Certification of Chief Financial Officer pursuant to Rule 13a-14(a) and 15d-14(a) of the Securities Exchange Act of 1934, as amended |
|||||
|
32.1* |
|
Certifications of the Chief Executive Officer and Chief Financial Officer pursuant to Rule 13a-14(b) of the Securities Exchange Act of 1934, as amended, and 18 U.S.C. section 1350 |
|||||
|
101 |
|
XBRL Instance Document |
|||||
|
101 |
|
XBRL Taxonomy Extension Schema Document |
|||||
|
101 |
|
XBRL Taxonomy Calculation Linkbase Document |
|||||
|
101 |
|
XBRL Taxonomy Label Linkbase Document |
|||||
|
101 |
|
XBRL Taxonomy Presentation Linkbase Document |
|||||
|
101 |
|
XBRL Taxonomy Definition Linkbase Document |
|||||
|
† |
Certain confidential information contained in this exhibit was omitted by means of redacting a portion of the text and replacing it with an asterisk. We have filed separately with the Commission an unredacted copy of the exhibit. |
|
# |
Indicates management contract or compensatory plan. |
|
* |
These certifications are being furnished solely to accompany this annual report pursuant to 18 U.S.C. Section 1350, and are not being filed for purposes of Section 18 of the Securities Exchange Act of 1934 and are not to be incorporated by reference into any filing of NuVasive, Inc., whether made before or after the date hereof, regardless of any general incorporation language in such filing. |
112