Attached files
| file | filename |
|---|---|
| EX-99.1 - EX-99.1 - SITE Centers Corp. | d430910dex991.htm |
| 8-K - FORM 8-K - SITE Centers Corp. | d430910d8k.htm |
Exhibit 99.2

DDR CORP.
2Q17
CONFERENCE CALL
DDR considers portions of this information to be forward-looking statements within the meaning of
Section 27A of the Securities Act of 1933 and Section 21E of the Securities Exchange Act of 1934, both as amended, with respect to the Company’s expectations for future periods. Although the Company believes that the expectations
reflected in such forward-looking statements are based upon reasonable assumptions, it can give no assurance that its expectations will be achieved. For this purpose, any statements contained herein that are not historical fact may be deemed to be
forward-looking statements. There are a number of important factors that could cause our results to differ materially from those indicated by such forward-looking statements, including among other factors, local conditions such as supply of space or
a reduction in demand for real estate in the area; competition from other available space; dependence on rental income from real property; the loss of, significant downsizing of or bankruptcy of a major tenant; redevelopment and construction
activities may not achieve a desired return on investment; our ability to buy or sell assets on commercially reasonable terms; our ability to complete acquisitions or dispositions of assets under contract; our ability to secure equity or debt
financing on commercially acceptable terms or at all; our ability to enter into definitive agreements with regard to our financing and joint venture arrangements or our failure to satisfy conditions to the completion of these arrangements; the
success of our deleveraging strategy; any impact or results from the Company’s portfolio transition or any change in strategy; and the finalization of the financial statements for the period ended June 30, 2017. For additional factors that
could cause the results of the Company to differ materially from these indicated in the forward-looking statements, please refer to the Company’s Form 10-K for the year ended December 31, 2016. The
Company undertakes no obligation to publicly revise these forward-looking statements to reflect events or circumstances that arise after the date hereof.
In
addition, this presentation includes certain non-GAAP financial measures. Reconciliations of these non-GAAP financial measures to the most directly comparable GAAP
measures can be found in the Company’s earnings press release and supplement issued today. This release and the
Company’s quarterly financial supplement
are available on the website at www.ddr.com.
2 SAFE HARBOR STATEMENT
2Q17 SUMMARY
+ 2Q17
RESULTS COMMENTARY & LEASING UPDATE 4
+ FIVE-MONTH PROGRESS REPORT 6
+ BALANCE SHEET & GUIDANCE UPDATE 10
+ PORTFOLIO REVIEW CONCLUSIONS
13
3
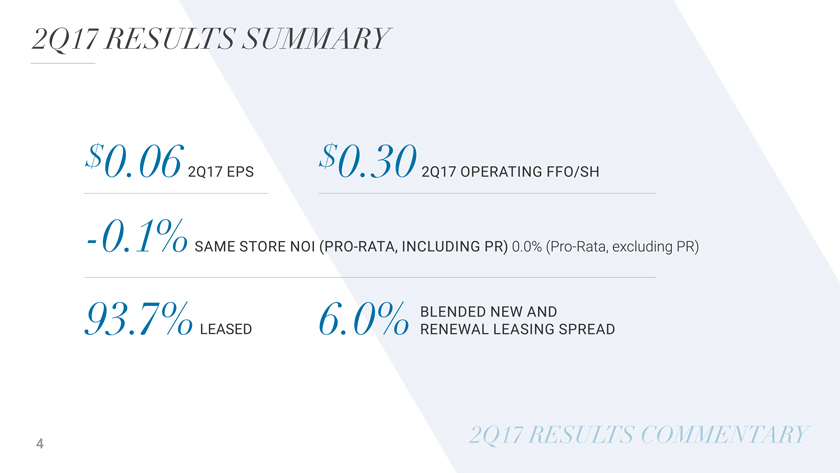
2Q17 RESULTS SUMMARY
$0.06 $
2Q17 EPS 0.302Q17 OPERATING FFO/SH
-0.1% SAME STORE NOI (PRO-RATA, INCLUDING PR) 0.0% (Pro-Rata, excluding PR) BLENDED NEW AND
93.7%LEASED 6.0% RENEWAL LEASING SPREAD
4 2Q17 RESULTS COMMENTARY
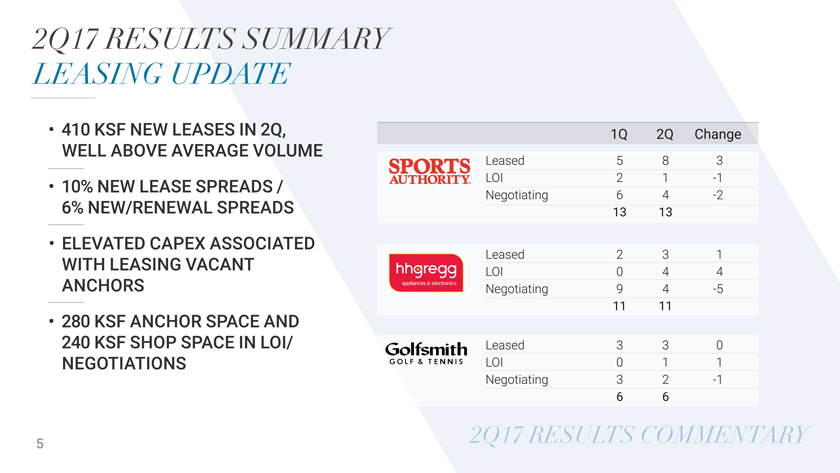
2Q17 RESULTS SUMMARY LEASING UPDATE
• 410 KSF NEW LEASES IN 2Q, 1Q 2Q Change WELL ABOVE AVERAGE VOLUME
Leased 5 8 3
• 10% NEW LEASE SPREADS / LOI 2 1 -1
Negotiating 6 4 -2
6% NEW/RENEWAL SPREADS 13 13
• ELEVATED CAPEX ASSOCIATED
WITH LEASING VACANT Leased 2 3 1
LOI 0 4 4 ANCHORS Negotiating 9 4 -5
11 11
• 280 KSF ANCHOR SPACE AND
240 KSF SHOP SPACE IN LOI/ Leased 3 3 0 NEGOTIATIONS LOI 0 1 1
Negotiating 3
2 -1
6 6
5 2Q17 RESULTS COMMENTARY
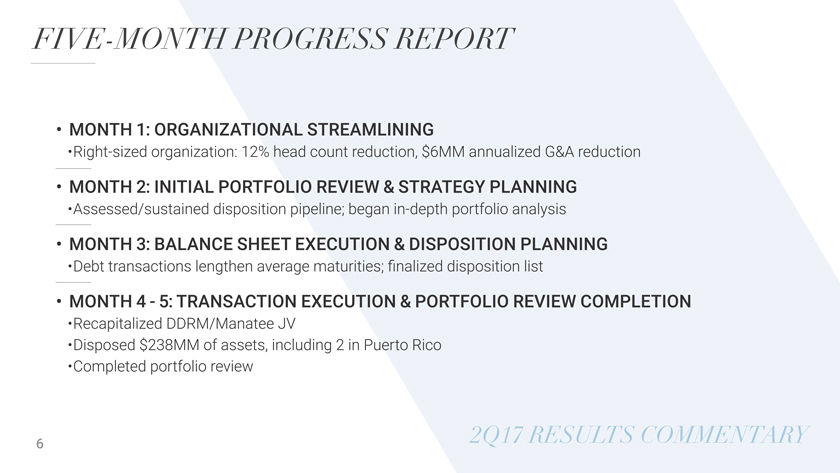
FIVE-MONTH PROGRESS REPORT
• MONTH 1: ORGANIZATIONAL STREAMLINING
•Right-sized organization: 12% head count reduction, $6MM annualized G&A reduction
• MONTH 2: INITIAL PORTFOLIO REVIEW & STRATEGY PLANNING
•Assessed/sustained
disposition pipeline; began in-depth portfolio analysis
• MONTH 3: BALANCE SHEET EXECUTION & DISPOSITION
PLANNING
•Debt transactions lengthen average maturities; finalized disposition list
• MONTH 4—5: TRANSACTION EXECUTION & PORTFOLIO REVIEW COMPLETION
•Recapitalized DDRM/Manatee JV
•Disposed $238MM of assets,
including 2 in Puerto Rico
•Completed portfolio review
6 2Q17 RESULTS
COMMENTARY
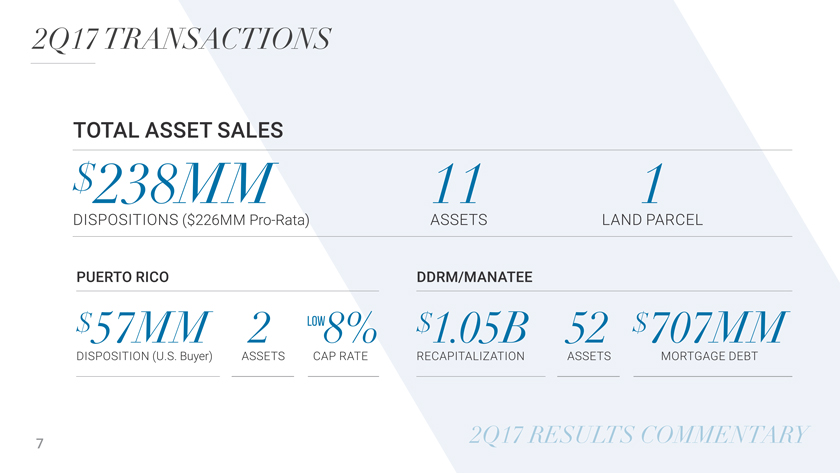
2Q17 TRANSACTIONS
TOTAL
ASSET SALES
$238MM 11 1
DISPOSITIONS ($226MM
Pro-Rata) ASSETS LAND PARCEL
PUERTO RICO DDRM/MANATEE
$57MM 2 LOW8% $1.05B 52 $707MM
DISPOSITION (U.S. Buyer) ASSETS CAP RATE RECAPITALIZATION
ASSETS MORTGAGE DEBT
7 2Q17 RESULTS COMMENTARY
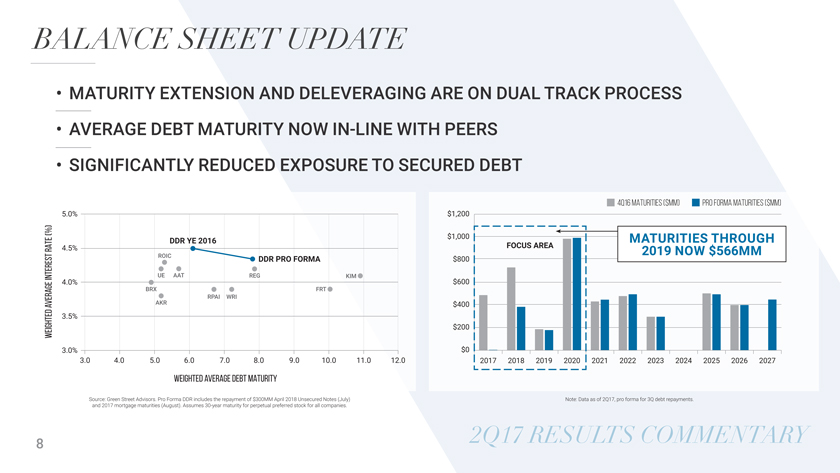
BALANCE SHEET UPDATE
• MATURITY EXTENSION AND DELEVERAGING ARE ON DUAL TRACK PROCESS
•
AVERAGE DEBT MATURITY NOW IN-LINE WITH PEERS
• SIGNIFICANTLY REDUCED EXPOSURE TO SECURED DEBT
4Q16 MATURITIES ($MM) PRO FORMA MATURITIES ($MM)
5.0% $1,200
(%) $1,000 MATURITIES THROUGH
DDR YE 2016
RATE 4.5% FOCUS AREA
ROIC DDR PRO FORMA $800 2019 NOW $566MM
INTEREST UE AAT REG KIM
4.0% $600
BRX FRT RPAI WRI
AVERAGE AKR $400
3.5%
WEIGHTED $200
3.0% $0
3.0 4.05.0 6.07.0 8.09.0 10.0 11.0 12.0 2017 2018 2019 2020 2021 2022 2023 2024 2025
2026 2027
WEIGHTED AVERAGE DEBT MATURITY
Source: Green Street Advisors. Pro
Forma DDR includes the repayment of $300MM April 2018 Unsecured Notes (July) Note: Data as of 2Q17, pro forma for 3Q debt repayments. and 2017 mortgage maturities (August). Assumes 30-year maturity for
perpetual preferred stock for all companies.
8 2Q17 RESULTS COMMENTARY
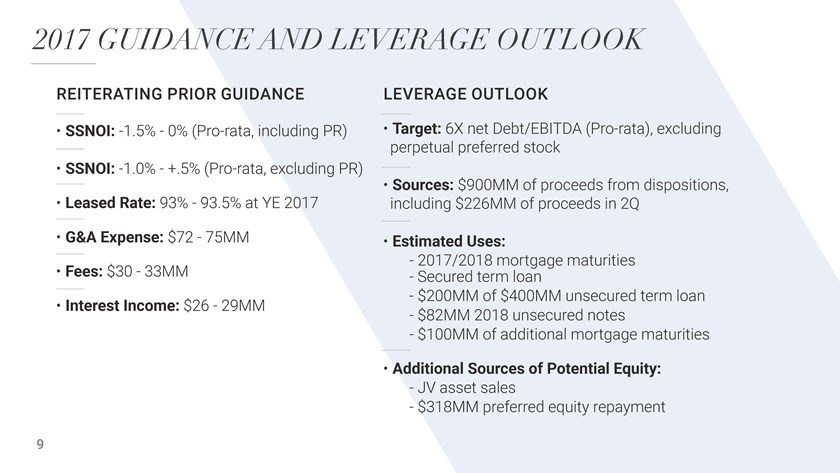
2017 GUIDANCE AND LEVERAGE OUTLOOK REITERATING PRIOR GUIDANCE SSNOI: -1.5% - 0% (Pro-rata,
including PR) SSNOI: -1.0% - +.5% (Pro-rata, excluding PR) Leased Rate: 93% - 93.5% at YE 2017 G&A Expense: $72 - 75MM Fees: $30 - 33MM Interest Income: $26 - 29MM LEVERAGE OUTLOOK Target: 6X net Debt/EBITDA (Pro-rata), excluding perpetual
preferred stock Sources: $900MM of proceeds from dispositions, including $226MM of proceeds in 2Q Estimated Uses: - - Secured 2017/2018 term mortgage loan maturities - $200MM of $400MM unsecured term loan - $82MM 2018 unsecured notes - $100MM of
additional mortgage maturities Additional Sources of Potential Equity: - JV asset sales - $318MM preferred equity repayment 9
9

PORTFOLIO REVIEW
10
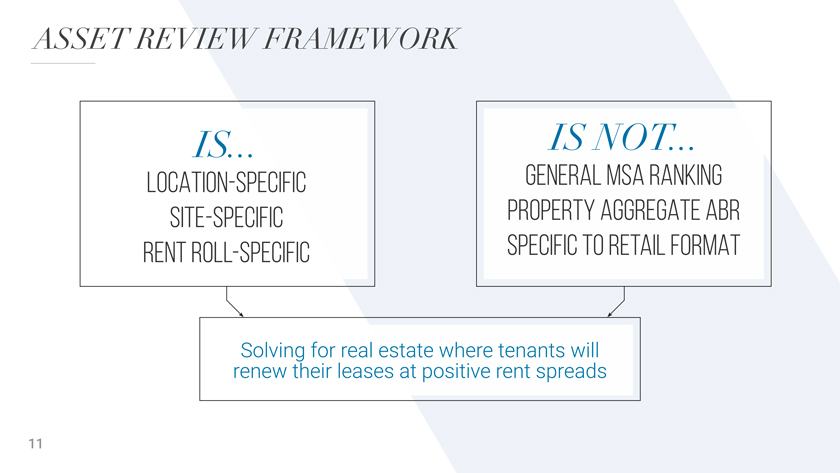
ASSET REVIEW FRAMEWORK
IS... IS NOT
LOCATION-SPECIFIC GENERAL MSA RANKING SITE-SPECIFIC PROPERTY
AGGREGATE ABR RENT ROLL-SPECIFIC SPECIFIC TO RETAIL FORMAT
Solving for real estate where tenants will renew their leases at positive rent spreads
11
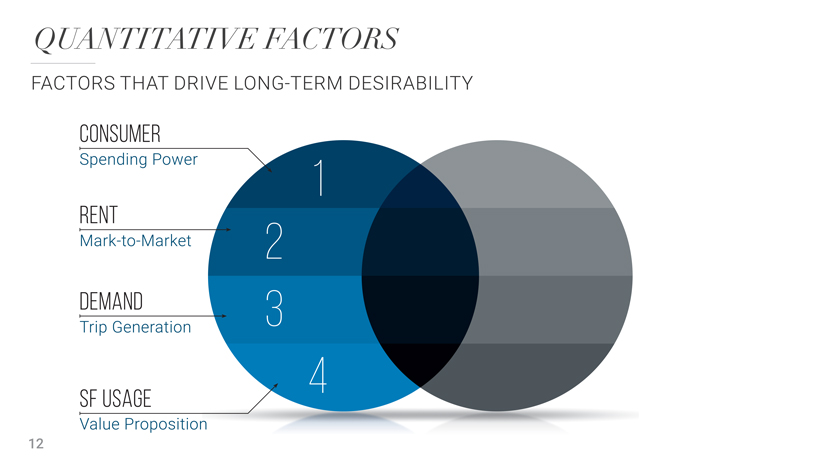
QUANTITATIVE FACTORS
FACTORS THAT DRIVE LONG-TERM DESIRABILITY
CONSUMER
Spending Power 1
RENT
Mark-to-Market 2
DEMAND 3
Trip Generation
4
SF USAGE
Value Proposition
12
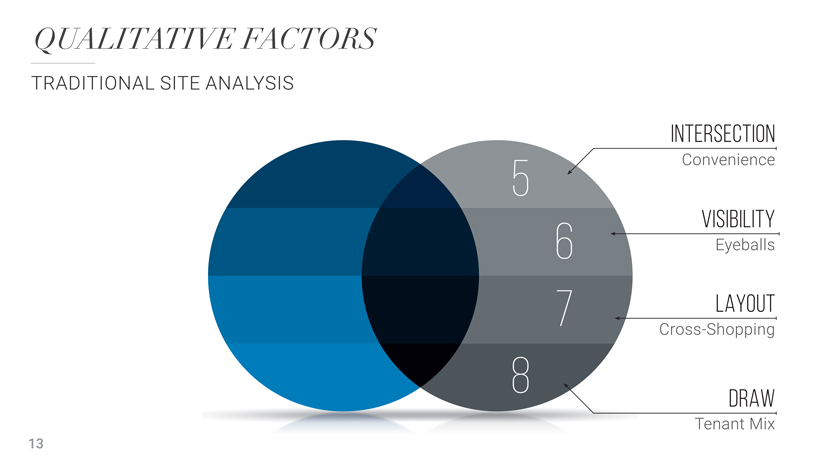
QUALITATIVE FACTORS
TRADITIONAL SITE ANALYSIS
INTERSECTION
5 Convenience
VISIBILITY
6 Eyeballs
7 LAYOUT
Cross-Shopping
8
DRAW
Tenant Mix
13
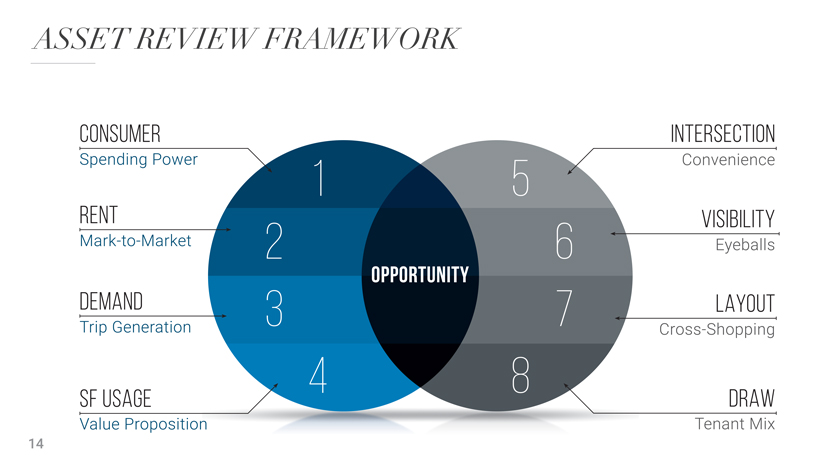
ASSET REVIEW FRAMEWORK
CONSUMER INTERSECTION
Spending Power 1 5 Convenience
RENT VISIBILITY
Mark-to-Market 2 6 Eyeballs
OPPORTUNITY
DEMAND 3 7 LAYOUT
Trip Generation Cross-Shopping
4 8
SF USAGE DRAW
Value Proposition Tenant Mix
14
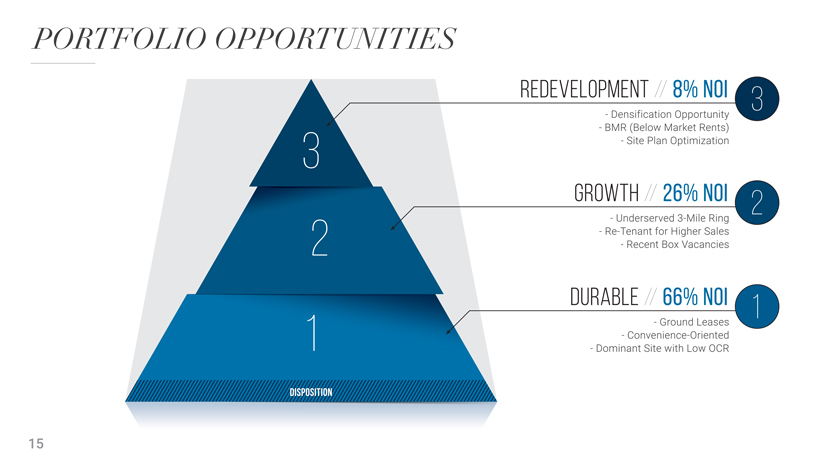
PORTFOLIO OPPORTUNITIES
REDEVELOPMENT // 8% NOI 3
- Densification Opportunity
- BMR (Below Market Rents)
3 - Site Plan Optimization
GROWTH // 26% NOI 2
- Underserved 3-Mile Ring
- Re-Tenant for Higher Sales
2 -
Recent Box Vacancies
DURABLE // 66% NOI 1
- Ground Leases
1 - Convenience-Oriented
- Dominant Site with Low OCR
DISPOSITION
15
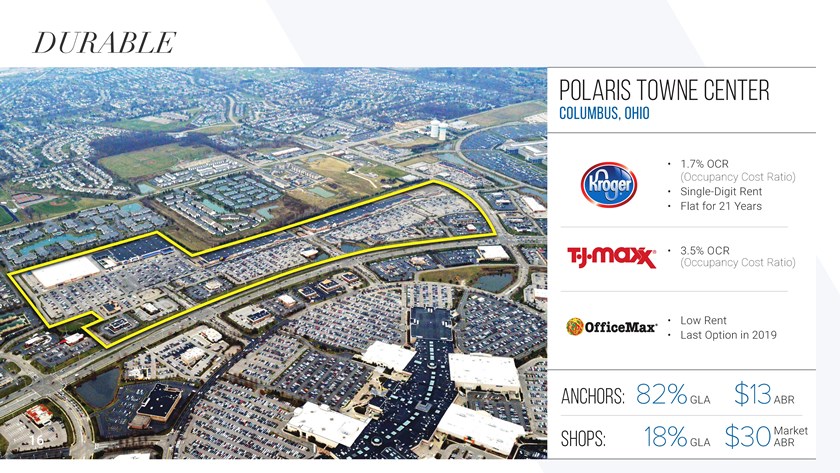
DURABLE
POLARIS TOWNE
CENTER
COLUMBUS, OHIO
• 1.7%
OCR
(Occupancy Cost Ratio)
• Single-Digit Rent
• Flat for 21 Years
• (Occupancy 3.5% OCR Cost Ratio)
• Low Rent
• Last Option in 2019
ANCHORS: 82% GLA $13ABR
Market
16 SHOPS: 18% GLA $30ABR
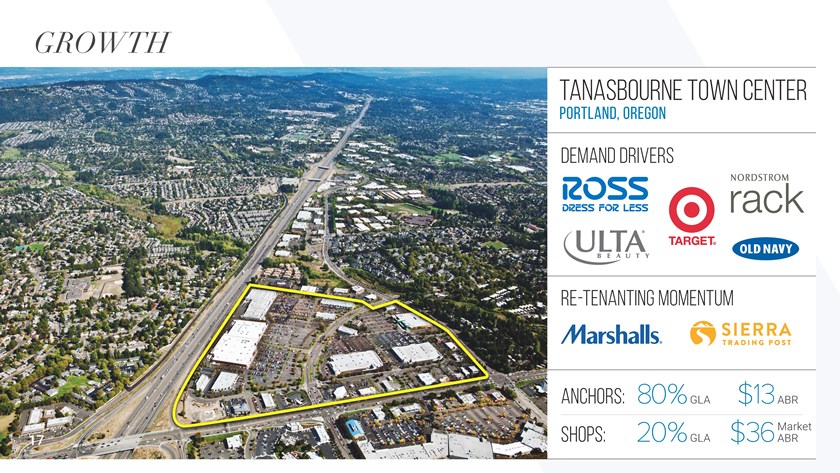
GROWTH
TANASBOURNE TOWN
CENTER
PORTLAND, OREGON
DEMAND DRIVERS
RE-TENANTING MOMENTUM
ANCHORS: 80% GLA $13ABR
17 SHOPS: 20% GLA $36ABR Market
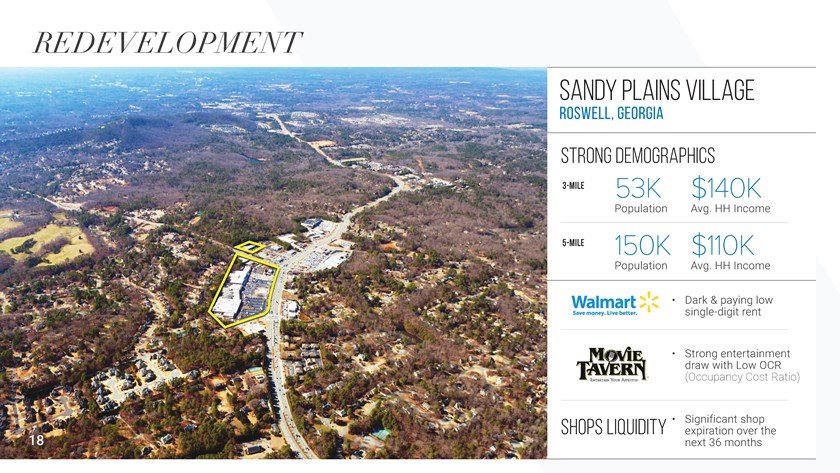
REDEVELOPMENT
SANDY
PLAINS VILLAGE
ROSWELL, GEORGIA
STRONG DEMOGRAPHICS
3-MILE 53K $140K
Population Avg. HH Income
5-MILE 150K $110K
Population Avg. HH Income
• Dark single-digit & paying rent low
• draw Strong with entertainment Low OCR
(Occupancy Cost Ratio)
SHOPS LIQUIDITY • Significant expiration over
shop the 18 next 36 months