Attached files
| file | filename |
|---|---|
| 8-K - 8-K SMARTFINANCIAL INC. EARNINGS RELEASE 2Q2017 - SMARTFINANCIAL INC. | a2017q2earningsreleasecover.htm |
| EX-99.1 - EXHIBIT 99.1 - SMARTFINANCIAL INC. | a2017q2earningsrelease-ex9.htm |

Second Quarter 2017 Earnings Call
July 26, 2017

Important Information
Forward Looking Statements
This presentation contains forward-looking statements. SmartFinancial cautions you that a number of important factors could cause actual results to
differ materially from those currently anticipated in any forward-looking statement. Such factors include, but are not limited to: the expected
revenue synergies and cost savings from the proposed merger with Capstone may not be fully realized or may take longer than anticipated to be
realized; the disruption from the proposed Capstone merger with customers, suppliers or employees or other business partners’ relationships; the
risk of successful integration of our business with that of Capstone after consummation of the proposed merger; the failure of SmartFinancial’s or
Capstone’s shareholders to approve the merger agreement; changes in management’s plans for the future, prevailing economic and political
conditions, particularly in our market area; credit risk associated with our lending activities; changes in interest rates, loan demand, real estate values
and competition; changes in accounting principles, policies, and guidelines; changes in any applicable law, rule, regulation or practice with respect to
tax or legal issues; and other economic, competitive, governmental, regulatory and technological factors affecting our operations, pricing, products
and services and other factors that may be described in our Annual Reports on Form 10-K and Quarterly Reports on Form 10-Q as filed with the
Securities and Exchange Commission from time to time. The forward-looking statements are made as of the date of this presentation, and, except as
may be required by applicable law or regulation, SmartFinancial assumes no obligation to update the forward-looking statements or to update the
reasons why actual results could differ from those projected in the forward-looking statements.
Non-GAAP Measures
Statements included in this presentation include non-GAAP financial measures and should be read along with the accompanying tables, which
provide a reconciliation of non-GAAP financial measures to GAAP financial measures. SmartFinancial management uses non-GAAP financial
measures, including: (i) net operating earnings available to common shareholders; (ii) operating efficiency ratio; and (iii) tangible common equity, in
its analysis of the company's performance. Net operating earnings available to common shareholders excludes the following from net income
available to common shareholders: securities gains and losses, merger and conversion costs, OREO gain and losses, and the income tax effect of
adjustments. The operating efficiency ratio excludes securities gains and losses, merger and conversion costs, and adjustment for OREO gains and
losses from the efficiency ratio. Adjusted allowance for loan losses adds net acquisition accounting fair value discounts to the allowance for loan
losses. Tangible common equity excludes total preferred stock, preferred stock paid in capital, goodwill, and other intangible assets. Management
believes that non-GAAP financial measures provide additional useful information that allows readers to evaluate the ongoing performance of the
company and provide meaningful comparisons to its peers. Non-GAAP financial measures should not be considered as an alternative to any measure
of performance or financial condition as promulgated under GAAP, and investors should consider SmartFinancial's performance and financial
condition as reported under GAAP and all other relevant information when assessing the performance or financial condition of the company. Non-
GAAP financial measures have limitations as analytical tools, and investors should not consider them in isolation or as a substitute for analysis of the
results or financial condition as reported under GAAP.
2

Important Information
Important Information for Investors and Shareholders
In connection with the proposed merger, SmartFinancial has filed with the Securities and Exchange Commission (“SEC”) a registration statement on
Form S-4 containing a joint proxy statement/prospectus of Capstone Bancshares, Inc. and SmartFinancial. A definitive joint proxy
statement/prospectus will be mailed to shareholders of both SmartFinancial and Capstone. Shareholders of SmartFinancial and Capstone are urged
to read the joint proxy statement/prospectus and other documents filed with the SEC carefully and in their entirety because they contain important
information. Shareholders may obtain free copies of the registration statement and the joint proxy statement/prospectus and other documents filed
with the SEC by SmartFinancial through the website maintained by the SEC at http://www.sec.gov. Copies of the documents filed with the SEC by
SmartFinancial are also available free of charge on SmartFinancial’s website at www.smartfinancialinc.com or by contacting SmartFinancial’s Investor
Relations Department at (423) 385-3009.
SmartFinancial, Capstone, their directors and executive officers, and other members of management and employees may be considered participants
in the solicitation of proxies in connection with the proposed transaction. Information about the directors and executive officers of SmartFinancial is
set forth in SmartFinancial’s proxy statement for its 2017 annual shareholders meeting. Other information regarding the participants in the proxy
solicitations and a description of their direct and indirect interests, by security holdings or otherwise, are contained in the joint proxy
statement/prospectus and other relevant materials filed with the SEC.
3

SMBK at-a-glance
• Core franchise in East Tennessee – SmartBank founded in 2007
• Corporate Headquarters – Knoxville, Tennessee
• 14 Branch Offices located in Knoxville, Pigeon Forge/Gatlinburg and Chattanooga/Cleveland
regions in TN with FL offices in Pensacola, Destin and Panama City.
• SmartBank $1B+ platform was created through an East TN Merger of Equals completed in
2016.
• Business Strategy
• Create a valuable Southeastern banking franchise through organic growth in strong markets coupled with an
acquisition model positioning our company as a partner of choice for banks our region.
• Continually improve earnings and efficiency metrics as we build out our model.
• Disciplined growth strategy with a focus on strong credit metrics.
• Build a solid franchise in all of our markets focusing on strong core deposit growth.
• Create a strong, consistent culture with an environment where top performers want to work.
• Notable planned acquisition of Alabama-based company that creates scale in our Southern
region and allows leverage to our infrastructure.
4

SmartFinancial Strategic Focus
• Core franchise in
East Tennessee.
• Cleveland branch
acquisition fills gap
between Knoxville
and Chattanooga.
• Geography
provides multiple
opportunities to fill
in between
Tennessee and
Florida.
• Strong capital
position and
management team
provide the means
to execute.
5

SmartFinancial Strategic Focus
6
2007 20162012
1/8/2007
SmartBank
opened first office
in Pigeon Forge,
Tennessee
2015
8/31/2015
Merger with
Cornerstone
Bancshares
completed, pushing
SMBK past $1.0B
asset mark
10/19/2012
FDIC-assisted
acquisition of
GulfSouth Private
Bank completed
($159M assets at
closure)
12/17/2015
SMBK
listed on
Nasdaq
Capital
Market
2/29/2016
Charter
combination of
SmartBank and
Cornerstone
Community
Bank
completed
1/13/2017
Announced
lift-out of
Cleveland-
based
banking
team
12/9/2016
Announced
pending
acquisition of
Cleveland, TN
/ Bradley
County branch
($32M loans to
be acquired)
2017
1/31/2017
$33MM
common
stock
capital
raise
completed
5/23/2017
SmartFinancial
announced
definitive
agreement with
Capstone
Bancshares

Second Quarter 2017 Highlights
• Net income available to common shareholders of $1.6 million during 2Q17 compared to
$0.9 million during 2Q16.
• Net operating earnings (Non-GAAP) available to common shareholders of $1.6 increased
over 170% year over year.
• Gross loan growth of $58 million for the quarter included over $35 million in organic
growth.
• Closed acquisition of Cleveland, Tennessee, branch with book value of over $24 million
in both loans and deposits with about $1 million of intangible assets.
• Increased net interest margin, taxable equivalent, during the quarter to 4.15 percent.
• Asset quality outstanding with nonperforming assets to total assets of just 0.31%.
7

Summary Results
0.00%
0.20%
0.40%
0.60%
0.80%
ROAA
3.70%
3.75%
3.80%
3.85%
3.90%
Net interest income / average assets
0.00%
0.10%
0.20%
0.30%
0.40%
0.50%
Noninterest income / average assets
2.80%
3.00%
3.20%
3.40%
3.60%
Noninterest expense / average assets
8

Earnings Profile – Second Quarter 2017
• Net income increased 38% year
over year.
• Net interest income up over 7%
year over year primarily due to
average loan balances that were up
11%.
• Provision up due to loan growth.
• Increases non-interest income
compared to prior periods primarily
due to gains from higher sales
volumes of SBA and mortgage
loans.
2Q17 1Q17 2Q16
Total interest income 11,517$ 10,949$ 10,669$
Total interest expense 1,269 1,129 1,057
Net interest income 10,249 9,820 9,612
Provision for loan losses 298 12 218
Net interest income after provision for loan losses 9,951 9,808 9,394
Total noninterest income 1,253 927 961
Total noninterest expense 8,829 8,145 8,472
Earnings before income taxes 2,374 2,590 1,883
Income tax expense 726 946 691
Net income 1,648 1,644 1,192
Dividends on preferred stock — 195 270
Net income available to common shareholders 1,648$ 1,449$ 922$
Net income per common share
Basic 0.20$ 0.19$ 0.16$
Diluted 0.20 0.19 0.15
9

Net Interest Income
• Net interest margin, taxable equivalent, increased
quarter to quarter due to higher loan balances and
higher yields on securities, and reductions in FHLB
advances and other borrowings.
• Compared to a year ago earning asset yields are up
4bps while cost of interest bearing liabilities are up
9bps.
2Q17 1Q17 2Q16
Loans 5.17% 5.11% 5.32%
Investment securities and interest-bearing due
from banks 2.04% 1.70% 1.59%
Federal funds and other 1.69% 4.47% 3.51%
Earning Asset Yields 4.66% 4.54% 4.62%
Total interest-bearing deposits 0.65% 0.60% 0.56%
Securities sold under agreement to repurchase 0.32% 0.35% 0.30%
Federal Home Loan Bank advances and other
borrowings 1.27% 0.82% 1.03%
Total interest-bearing liabilities 0.65% 0.60% 0.56%
Net interest margin 4.15% 4.07% 4.16%
Cost of Funds 0.54% 0.49% 0.46%
Average Yields and Rates
3.50%
3.75%
4.00%
4.25%
2Q16 3Q16 4Q16 1Q17 2Q17
Net Interest Margin
Net interest margin, TEY
Net interest margin, TEY- ex purchase acct. adj
2Q17 1Q17 2Q16
Net intere t income 10,249$ 9,820$ 9,612$
Average Earning Assets 992,133 979,535 928,670
10

Noninterest Income
• 2Q17 Noninterest income was all core, undistorted by gains on securities or gains on the sale of
foreclosed assets.
• Quarterly recurring core noninterest income of service charges, gains on the sale of loans, and other
noninterest income has trended higher over the last four quarters from approximately $866
thousand in 2Q16 over $1.2 million in 2Q17.
$0
$200,000
$400,000
$600,000
$800,000
$1,000,000
$1,200,000
$1,400,000
2Q16 3Q16 4Q16 1Q17 2Q17
Noninterest Income
Gain (loss) on sale of foreclosed assets
Gain on securites
Other non-interest income
Gain on sale of loans and other assets
Service charges on deposit accounts
Core Recurring Trend
11

Noninterest Expense
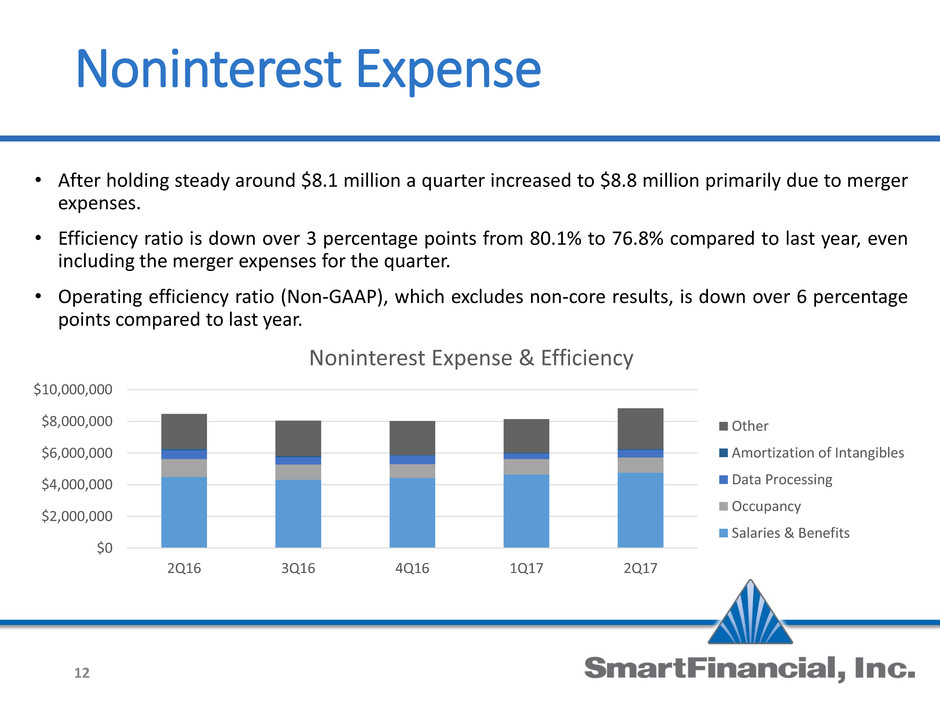
• After holding steady around $8.1 million a quarter increased to $8.8 million primarily due to merger
expenses.
• Efficiency ratio is down over 3 percentage points from 80.1% to 76.8% compared to last year, even
including the merger expenses for the quarter.
• Operating efficiency ratio (Non-GAAP), which excludes non-core results, is down over 6 percentage
points compared to last year.
$0
$2,000,000
$4,000,000
$6,000,000
$8,000,000
$10,000,000
2Q16 3Q16 4Q16 1Q17 2Q17
Noninterest Expense & Efficiency
Other
Amortization of Intangibles
Data Processing
Occupancy
Salaries & Benefits
12

Balance Sheet
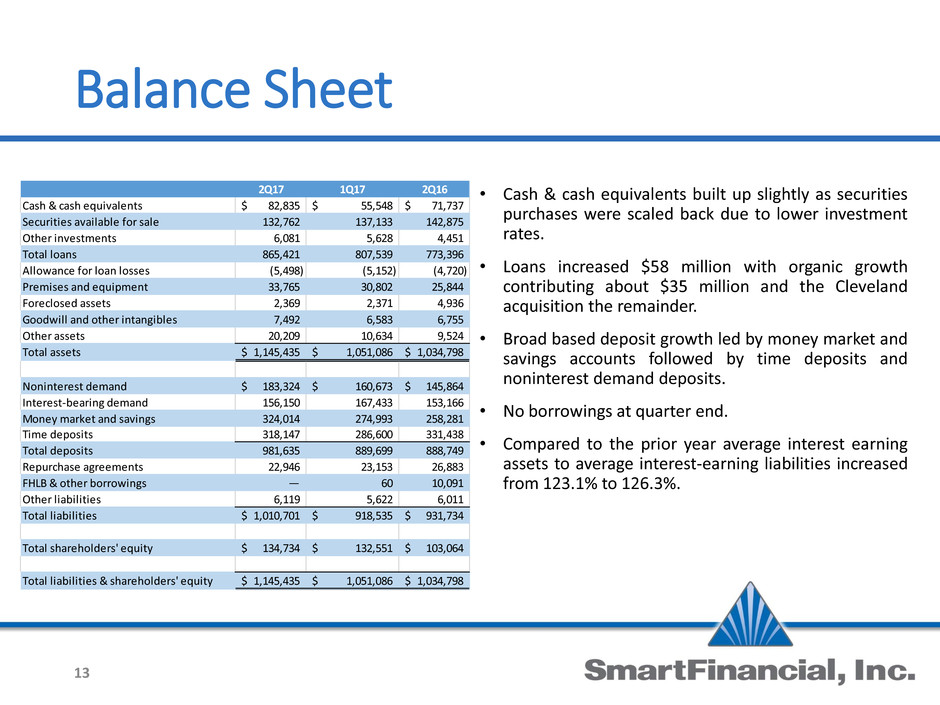
• Cash & cash equivalents built up slightly as securities
purchases were scaled back due to lower investment
rates.
• Loans increased $58 million with organic growth
contributing about $35 million and the Cleveland
acquisition the remainder.
• Broad based deposit growth led by money market and
savings accounts followed by time deposits and
noninterest demand deposits.
• No borrowings at quarter end.
• Compared to the prior year average interest earning
assets to average interest-earning liabilities increased
from 123.1% to 126.3%.
2Q17 1Q17 2Q16
Cash & cash equivalents 82,835$ 55,548$ 71,737$
Securities available for sale 132,762 137,133 142,875
Other investments 6,081 5,628 4,451
Total loans 865,421 807,539 773,396
Allowance for loan losses (5,498) (5,152) (4,720)
Premises and equipment 33,765 30,802 25,844
Foreclosed assets 2,369 2,371 4,936
Goodwill and other intangibles 7,492 6,583 6,755
Other assets 20,209 10,634 9,524
Total assets 1,145,435$ 1,051,086$ 1,034,798$
Noninterest demand 183,324$ 160,673$ 145,864$
Interest-bearing demand 156,150 167,433 153,166
Money market and savings 324,014 274,993 258,281
Time deposits 318,147 286,600 331,438
Total deposits 981,635 889,699 888,749
Repurchase agreements 22,946 23,153 26,883
FHLB & other borrowings — 60 10,091
Other liabilities 6,119 5,622 6,011
Total liabilities 1,010,701$ 918,535$ 931,734$
Total shareholders' quity 134,734$ 132,551$ 103,064$
Total liabilities & shareholders' equity 1,145,435$ 1,051,086$ 1,034,798$
13

Loan Portfolio
• Loan growth of over $90 million year over year, about 12%.
• Growth over the last year has been broad based with increases in C&I, CRE, and Consumer RE.
• The bank’s Commercial Real Estate 100 & 300 ratios dropped even further.
$0
$100,000
$200,000
$300,000
$400,000
$500,000
$600,000
$700,000
$800,000
$900,000
$1,000,000
2Q16 3Q16 4Q16 1Q17 2Q17
Portfolio Composition
Other
Consumer RE
CRE, non-owner occupied
CRE, owner occupied
C&D
C&I
14

Asset Quality
• Excellent asset quality with nonperforming assets at just 0.31% of total assets.
• Nonperforming assets down over 50% year over year.
• Purchase accounting discounts are significantly higher than ALLL.
0.00%
0.20%
0.40%
0.60%
0.80%
$0
$2,000
$4,000
$6,000
$8,000
2Q16 3Q16 4Q16 1Q17 2Q17
Nonperforming Assets
Foreclosed assets
Nonperforming loans
Nonperforming assets to total assets
15
0.50%
0.55%
0.60%
0.65%
0.70%
0.75%
$0
$4,000
$8,000
$12,000
2Q16 3Q16 4Q16 1Q17 2Q17
Loan Discounts
Allowance for loan losses (GAAP)
Net acquisition accounting fair value discounts to loans
Allowance for loan losses to loans

Deposits
• Well diversified deposit mix with growth of money market, savings, and noninterest demand
replacing mostly wholesale time deposits.
• After keeping cost of funds steady for three quarters cost of funds starting to creep up driven by
isolated money market accounts and floating rate municipal demand deposit accounts.
0.40%
0.60%
0.80%
1.00%
1.20%
1.40%
$-
$200,000
$400,000
$600,000
$800,000
$1,000,000
$1,200,000
2Q16 3Q16 4Q16 1Q17 2Q17
Deposit Composition
Time deposits
Money market and savings
Interest-bearing demand
Noninterest demand
Cost of Funds
Fed Funds Target
16

Capstone Summary Transaction Terms
17
Acquiror: SmartFinancial, Inc.
Target: Tuscaloosa, AL based Capstone Bancshares, Inc.
Transaction Value(1): $84.8 million
Consideration Mix: Approximately $69.0 million in stock(1)
(2,899,107 SMBK shares issued) and $15.8
million in cash
Valuation
Multiples(1)(2):
159% of Tangible Book Value
22.0x LTM Earnings
New Board Seats: 2 (Steven B. Tucker and J. Beau Wicks)
Required Approvals: Customary regulatory approvals, SmartFinancial
shareholders and Capstone shareholders
Expected Closing: Q4 2017
Transaction
Terms
(1) Based on 4,263,393 Capstone shares, 262,324 Capstone options (weighted average strike price of
$10.00), and SMBK’s closing price of $22.70 on May 19, 2017
(2) Based on Capstone Bancshares, Inc. financials as of March 31, 2017

Deal Assumptions and Impact
18
Cost Savings: 25%, with 85% phased-in in 2018 and 100%
thereafter
Merger Related
Expenses:
$5.0 million after-tax
Significant Purch.
Acct. Mark:
$9.3 million loan credit mark down
$2.3 million loan fair value adjustment
Core Deposit
Intangible:
$4.2 million
Earnings Accretion: +25% in each of the first two years (excl.
merger charges)
TBV Dilution: ~7.5%, earned back over ~3 years (crossover)
Deal
Assumptions
Estimated
Financial
Impact

Pro Forma Branch Map
19
SMBK (14)
Capstone (8)
• Capstone brings the
vibrant Tuscaloosa
market to
complement existing
Tennessee and
Florida markets.
• Capstone’s CEO,
Robert Kuhn, will be
the Regional
President for
Alabama and the
Florida Panhandle
which will enhance
SmartBank’s
geographic profile.
• Pro forma footprint
allows for additional
opportunities for
market expansion.

Tuscaloosa Market Highlights
20
Tuscaloosa Market Overview Companies with Presence in Western Alabama
SMBK Chairman Miller Welborn was raised in
Tuscaloosa and has strong ties to the area
Tuscaloosa, AL is home to the flagship campus of the
University of Alabama, one of the largest universities in
the country
• Over 37,000 students
In 1993, Mercedes-Benz selected Tuscaloosa as the
headquarters for its U.S.-based manufacturing
operations
• Located approximately 20 miles from
downtown Tuscaloosa
• ~3,600 employees
DCH Regional Medical center opened in Tuscaloosa in
1923 and today serves as one of West Alabama’s
premier hospitals
• +500 bed facility
• Over 3,600 employees

21
SmartBank Named Top Workplace

Conclusions
• Second quarter net income increased 38% compared to a year ago.
• Third and fourth quarter forecast:
• Loan growth driven by: Robust pipeline, New production personnel, Over $128 million in
unfunded commitments.
• Merger expenses estimated at $0.3 million a quarter.
• Lower effective tax rate should mostly offset merger expenses.
• Improved loan mix with less CRE which will allow continued growth.
• SMBK continues focus on long-term shareholder value by:
• Building the foundation for organic growth and profitability
• Exploring expansion to strategic markets
• Q&A
22

Non-GAAP Reconciliations
2Q16 3Q16 4Q16 1Q17 2Q17
Net interest income -ex purchase acct. adj.
Net interest income (GAAP) 9,612$ 9,665$ 9,856$ 9,820$ 10,248$
Taxable equivalent adjustment (463) (34) (177) 58 21
net interest income TEY 9,149 9,631 $9,679 9,878 10,269
purchase accounting adjustments (597) (450) (430) (540) (696)
Net interest income -ex purchase acct. adj. 8,552$ 9,181$ 9,249$ 9,338$ 9,573$
Loan Discount Data
Allowance for loan losses (GAAP) 4,720$ 4,964$ 5,105$ 5,152$ 5,498$
Net acqui ition accounting fair value discounts to loans 11,053 10,742 10,271 9,831 9,086
Tangible Common Equity
Shareholders' equity (GAAP) 103,064$ 105,170$ 105,240$ 132,551$ 134,734$
Less preferred stock & preferred stock paid in capital 12,000 12,000 12,000 — —
Less goodwill and other intangible assets 6,754 6,675 6,636 6,583 7,492
Tangible common equity (Non-GAAP) 84,310$ 86,495$ 86,604$ 125,968$ 127,242$
23

Non-GAAP Reconciliations
2Q16 3Q16 4Q16 1Q17 2Q17
Operating Earnings
Net income (loss) (GAAP) 1,192$ 1,611$ 1,647$ 1,644$ 1,648$
Purchased loan accounting adjustments (597) (450) (430) (540) (696)
Securities (gains) losses (98) (18) — — —
Merger and conversion costs 153 — — — 420
Foreclosed assets (gains) losses 4 (130) (6) 15 —
Income tax effect of adjustments 206 229 167 201 265
Net operating earnings (Non-GAAP) 860 1,242 1,378 1,320 1,637
Dividends on preferred stock (270) (270) (270) (195) —
Net operating earnings available to common shareholders
(Non-GAAP) 590$ 972$ 1,108$ 1,125$ 1,637$
Net operating earnings per common share:
Basic 0.11$ 0.19$ 0.24$ 0.15$ 0.20$
Diluted 0.10 0.19 0.23 0.15 0.20
Operating Efficiency Ratio
Efficiency ratio (GAAP) 80.13% 74.06% 74.29% 75.79% 76.77%
Adjustment for amortization of intangibles -1.10% -0.99% -0.49% -0.65% -0.69%
Adjustment for taxable equivalent yields -0.16% -0.18% -0.26% -0.25% -0.22%
Adjustment for purchased loan accounting adjustments1 7.05% 5.59% 5.36% 6.63% 7.88%
Adjustment for securities (gains) losses 1.16% 0.23% —% —% —%
Adjustment for merger and conversion costs -1.81% —% —% —% -4.76%
Adjustment for OREO (gains) losses -0.05% 1.62% 0.08% -0.18% —%
Operating efficiency ratio (Non-GAAP) 85.22% 80.33% 78.98% 81.34% 78.98%
24

Second Quarter 2017
25
Supplemental Information

Loan & Deposit Composition 2Q17
C&I
12%
C&D
12%
CRE,
owner
occupied
24%
CRE, non-
owner
occupied
27%
Consumer
RE
24%
Other
1%
Loans
Noninteres
t demand
19%
Interest-
bearing
demand
16%
Money market
and savings
33%
Time
deposits
32%
Deposits
26

Loan Composition History 2Q17 1Q17 4Q16 3Q16 2Q16
Gross Loans
C&I 105,129$ 90,649$ 85,696$ 83,471$ 87,253$
C&D 101,151 115,675 117,748 128,727 115,385
CRE, owner occupied 211,469 197,032 181,840 172,397 177,052
CRE, non-owner occupied 233,707 210,901 233,021 222,592 212,315
Consumer RE 206,667 186,344 187,557 182,952 174,013
Other 7,298 6,938 7,515 7,263 7,377
Total Loans, gross 865,421$ 807,539$ 813,377$ 797,402$ 773,395$
27

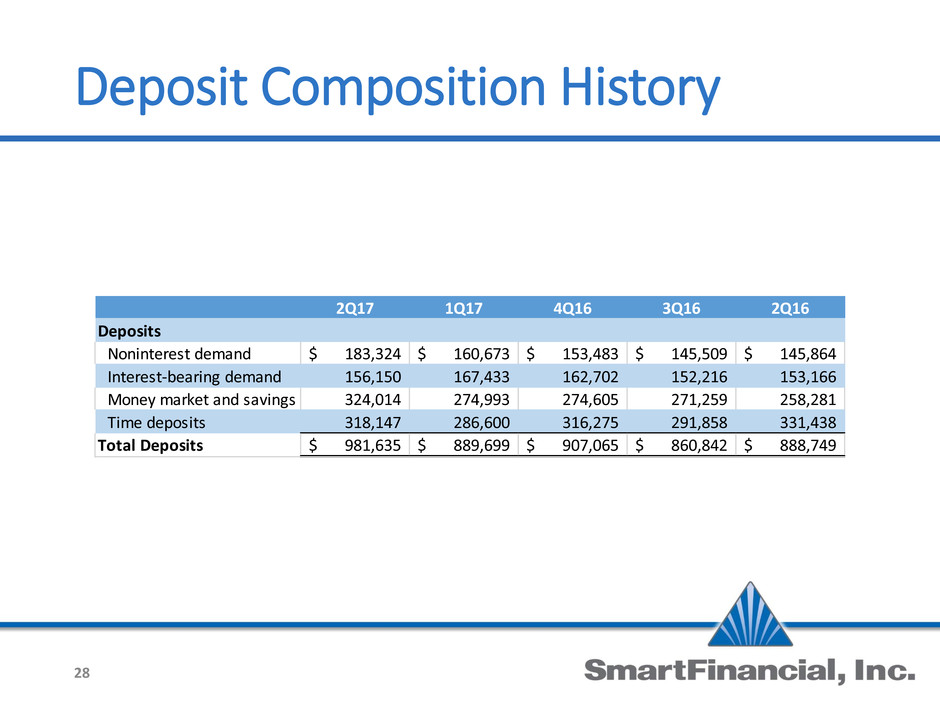
Deposit Composition History
2Q17 1Q17 4Q16 3Q16 2Q16
Deposits
Noninterest demand 183,324$ 160,673$ 153,483$ 145,509$ 145,864$
Interest-bearing demand 156,150 167,433 162,702 152,216 153,166
Money market and savings 324,014 274,993 274,605 271,259 258,281
Time deposits 318,147 286,600 316,275 291,858 331,438
Total Deposits 981,635$ 889,699$ 907,065$ 860,842$ 888,749$
28

CRE Ratios
• Declining trend in CRE ratios has been a result of targeted focus by lending teams across Bank’s
geography to primarily prospect opportunities within the owner occupied CRE and Commercial and
Industrial portfolio segments.
• This strategy was implemented to further diversify the bank’s loan portfolio by reducing existing
concentrations within the CRE segment.
50.00%
75.00%
100.00%
125.00%
150.00%
Q4
2
0
1
4
Q1
2
0
1
5
Q2
2
0
1
5
Q3
2
0
1
5
Q4
2
0
1
5
Q1
2
0
1
6
Q2
2
0
1
6
Q3
2
0
1
6
Q4
2
0
1
6
Q1
2
0
1
7
Q2
2
0
1
7
100 Ratio
29
200.00%
250.00%
300.00%
350.00%
400.00%
Q4
2
0
1
4
Q1
2
0
1
5
Q2
2
0
1
5
Q3
2
0
1
5
Q4
2
0
1
5
Q1
2
0
1
6
Q2
2
0
1
6
Q3
2
0
1
6
Q4
2
0
1
6
Q1
2
0
1
7
Q2
2
0
1
7
300 Ratio

Management Team
30
Billy Carroll
President & CEO
Miller Welborn
Chairman of the Board
C. Bryan Johnson
Chief Financial Officer
Rhett Jordan
Chief Credit Officer
Gary Petty
Chief Risk Officer
Greg Davis
Chief Lending Officer
