Attached files
| file | filename |
|---|---|
| EX-10.8 - EX-10.8 - Lamb Weston Holdings, Inc. | lw-20170528ex10893df70.htm |
| EX-32.2 - EX-32.2 - Lamb Weston Holdings, Inc. | lw-20170528ex322f1b3e9.htm |
| EX-32.1 - EX-32.1 - Lamb Weston Holdings, Inc. | lw-20170528ex32131d868.htm |
| EX-31.2 - EX-31.2 - Lamb Weston Holdings, Inc. | lw-20170528ex3121368d2.htm |
| EX-31.1 - EX-31.1 - Lamb Weston Holdings, Inc. | lw-20170528ex311c1d54d.htm |
| EX-23.1 - EX-23.1 - Lamb Weston Holdings, Inc. | lw-20170528ex231649bfb.htm |
| EX-21.1 - EX-21.1 - Lamb Weston Holdings, Inc. | lw-20170528ex2116050d5.htm |
| EX-12.1 - EX-12.1 - Lamb Weston Holdings, Inc. | lw-20170528ex121b91a8b.htm |
| EX-10.7 - EX-10.7 - Lamb Weston Holdings, Inc. | lw-20170528ex1078785dc.htm |
| EX-10.24 - EX-10.24 - Lamb Weston Holdings, Inc. | lw-20170528ex102466583.htm |
| EX-10.23 - EX-10.23 - Lamb Weston Holdings, Inc. | lw-20170528ex1023ddfbb.htm |
| EX-10.22 - EX-10.22 - Lamb Weston Holdings, Inc. | lw-20170528ex102223549.htm |
| EX-10.21 - EX-10.21 - Lamb Weston Holdings, Inc. | lw-20170528ex10212dffd.htm |
UNITED STATES
SECURITIES AND EXCHANGE COMMISSION
WASHINGTON, D.C. 20549
FORM 10-K
(Mark One)
|
☒ |
ANNUAL REPORT PURSUANT TO SECTION 13 OR 15(d) OF THE SECURITIES EXCHANGE ACT OF 1934 |
For the fiscal year ended May 28, 2017
OR
|
☐ |
TRANSITION REPORT PURSUANT TO SECTION 13 OR 15(d) OF THE SECURITIES EXCHANGE ACT OF 1934 |
For the transition period from to
Commission File Number: 1-37830
LAMB WESTON HOLDINGS, INC.
(Exact name of registrant as specified in its charter)
|
Delaware |
61-1797411 |
|
(State or other jurisdiction of |
(I.R.S. Employer |
|
599 S. Rivershore Lane |
83616 |
|
(Address of principal executive offices) |
(Zip Code) |
(208) 938-1047
(Registrant’s telephone number, including area code)
Securities registered pursuant to section 12(b) of the Act:
|
Title of each class |
|
Name of each exchange on which registered |
|
Common Stock, $1.00 par value |
|
New York Stock Exchange |
Securities registered pursuant to section 12(g) of the Act: None
Indicate by check mark if the registrant is a well-known seasoned issuer, as defined in Rule 405 of the Securities Act. Yes ☐ No ☒
Indicate by check mark if the registrant is not required to file reports pursuant to Section 13 or Section 15(d) of the Act. Yes ☐ No ☒
Indicate by check mark whether the registrant (1) has filed all reports required to be filed by Section 13 or 15(d) of the Securities Exchange Act of 1934 during the preceding 12 months (or for such shorter period that the registrant was required to file such reports), and (2) has been subject to such filing requirements for the past 90 days. Yes ☒ No ☐
Indicate by check mark whether the registrant has submitted electronically and posted on its corporate Website, if any, every Interactive Data File required to be submitted and posted pursuant to Rule 405 of Regulation S-T (232.405 of this chapter) during the preceding 12 months (or for such shorter period that the registrant was required to submit and post such files). Yes ☒ No ☐
Indicate by check mark if disclosure of delinquent filers pursuant to Item 405 of Regulation S-K (229.405 of this chapter) is not contained herein, and will not be contained, to the best of registrant's knowledge, in definitive proxy or information statements incorporated by reference in Part III of this Form 10-K or any amendment to this Form 10‑K. ☐
Indicate by check mark whether the registrant is a large accelerated filer, an accelerated filer, a non-accelerated filer, or a smaller reporting company. See the definitions of “large accelerated filer,” “accelerated filer,” “smaller reporting company,” and “emerging growth company” in Rule 12b-2 of the Exchange Act. (Check one):
|
Large accelerated filer |
☐ |
|
Accelerated filer |
☐ |
|
Non-accelerated filer |
☒ |
(Do not check if a smaller reporting company) |
Smaller reporting company |
☐ |
|
|
|
|
Emerging growth company |
☐ |
If an emerging growth company, indicate by check mark if the registrant has elected not to use the extended transition period for complying with any new or revised financial accounting standards provided pursuant to Section 13(a) of the Exchange Act. ☐
Indicate by check mark whether the registrant is a shell company (as defined in Rule 12b-2 of the Act). Yes ☐ No ☒
The aggregate market value of the voting common stock of Lamb Weston Holdings, Inc. held by non-affiliates on November 27, 2016 (the last business day of the Registrant's most recently completed second fiscal quarter) was approximately $4.76 billion based upon the closing sale price on the New York Stock Exchange on such date.
As of July 17, 2017, the Registrant had 146,104,057 shares of common stock, par value $1.00 per share, outstanding.
Documents Incorporated by Reference
Portions of the Registrant's definitive proxy statement to be filed with the Securities and Exchange Commission in connection with its 2017 Annual Meeting of Stockholders are incorporated by reference into Part III of this report.
All reports we file with the U.S. Securities and Exchange Commission (“SEC”) are available free of charge via the Electronic Data Gathering Analysis and Retrieval (EDGAR) System on the SEC’s website at www.sec.gov. We also provide copies of our SEC filings at no charge upon request and make electronic copies of our reports available through our website at www.lambweston.com as soon as reasonably practicable after filing such material with the SEC.
2
Forward-Looking Statements
This Annual Report on Form 10-K contains forward-looking statements within the meaning of the federal securities laws. Words such as “will,” “may,” “expect,” “would,” “could,” “intend,” “plan,” “believe,” “estimate,” “deliver,” “target,” “outlook,” and variations of such words and similar expressions are intended to identify forward-looking statements. These forward-looking statements are based on management’s current expectations and are subject to uncertainty and changes in circumstances. We undertake no responsibility for updating these statements. Readers of this report should understand that these statements are not guarantees of performance or results. Many factors could affect our actual financial results and cause them to vary materially from the expectations contained in the forward-looking statements, including those set forth in this report. These risks and uncertainties include, among other things: our ability to successfully execute our long-term value creation strategy; the competitive environment and related conditions in the markets in which we operate; political and economic conditions of the countries in which we conduct business and other factors related to our international operations; disruption of our access to export mechanisms; our ability to complete proposed acquisitions or integrate acquired businesses or execute on large capital projects; our future debt levels; the availability and prices of raw materials; changes in our relationships with our growers or significant customers; the success of our joint ventures; actions of governments and regulatory factors affecting our businesses; the ultimate outcome of litigation or any product recalls; levels of pension, labor and people-related expenses; our ability to pay regular quarterly cash dividends and the amounts and timing of any future dividends; and other risks described in our reports filed from time to time with the SEC, including those described under the heading “Item 1A. Risk Factors” in this report. We caution readers not to place undue reliance on any forward-looking statements included in this report, which speak only as of the date of this report.
Lamb Weston Holdings, Inc. (“we,” “us,” “our,” “the “Company,” or “Lamb Weston”), along with its joint venture partners, is a leading global producer, distributor, and marketer of value-added frozen potato products and is headquartered in Eagle, Idaho. We are the number one supplier of value-added frozen potato products in North America – the largest market for frozen potato products in the world. We are also a leading supplier of value-added frozen potato products internationally, with a strong and growing presence in high-growth emerging markets. We offer a broad product portfolio to a diverse channel and customer base in over 100 countries. French fries represent the majority of our value-added frozen potato product portfolio.
We were organized as a Delaware corporation in July 2016, as a wholly owned subsidiary of Conagra Brands, Inc. (formerly, ConAgra Foods, Inc., “Conagra”). On November 9, 2016, we separated from Conagra and became an independent publicly traded company through the pro rata distribution by Conagra of 100% of our outstanding common stock to Conagra stockholders (“Separation”). Each Conagra stockholder of record on November 1, 2016 (“record date”) received one share of our common stock for every three shares of Conagra common stock held on the record date. As a result of the Separation, approximately 146 million shares of our common stock were distributed on November 9, 2016, to Conagra stockholders. On November 10, 2016, our common stock began trading under the ticker symbol “LW” on the New York Stock Exchange (“NYSE”).
In connection with the Separation, we entered into a separation and distribution agreement and several other agreements with Conagra, including a transition services agreement, tax matters agreement, employee matters agreement, and trademark license agreement. These agreements govern the relationship between us and Conagra following the Separation and provide for the allocation of various assets, liabilities, rights and obligations of the parties. These agreements also include arrangements for transition services to be provided by Conagra to Lamb Weston. For a discussion of these agreements, see the section entitled “Relationship with ConAgra After the Spinoff” in our registration statement on Form 10, as amended, as filed with the SEC on October 17, 2016 (“Form 10”), and Note 3, Related Party Transactions, of the Notes to Combined and Consolidated Financial Statements in “Part II, Item 8. Financial Statements and Supplementary Data” in this Form 10-K.
3
In connection with the Separation, Conagra transferred substantially all of the assets and liabilities and operations of the Lamb Weston business to us. Combined financial statements for Lamb Weston for periods prior to the Separation were prepared on a stand-alone basis and were derived from Conagra’s consolidated financial statements and accounting records. The combined financial statements for Lamb Weston contained in this report for periods prior to the Separation reflect our financial position, results of operations, comprehensive income, and cash flows as our business was operated as part of Conagra prior to the Separation and include allocations for a portion of Conagra’s shared corporate general and administrative expenses. Following the Separation, our consolidated financial statements include the accounts of Lamb Weston Holdings, Inc. and its wholly owned subsidiaries. The combined financial position, results of operations, and cash flows as of dates and for periods prior to the Separation may not be indicative of what our financial position, results of operations and cash flows would have been as a separate stand-alone public company during the periods presented, nor are they indicative of what our financial position, results of operations and cash flows may be in the future. Information related to the Separation and its effect on our financial statements are discussed throughout this Form 10‑K.
Segments
We have four reportable segments: Global, Foodservice, Retail, and Other. For segment financial information see Note 14, Segments, of the Notes to Combined and Consolidated Financial Statements in “Part II, Item 8. Financial Statements and Supplementary Data” of this Form 10‑K.
Global
Our Global segment includes branded and private label frozen potato products sold in North America and international markets. This segment includes the top 100 North American based restaurant chains and international customers comprised of global and regional restaurant chains, foodservice distributors, and retailers. We have included non-U.S. and non-Canadian retail and foodservice customers in the Global segment due to efficiencies associated with coordinating sales to all customer types within specific markets, as well as due to these customers’ smaller scale and dependence on local economic conditions. The Global segment’s product portfolio includes frozen potatoes, sweet potatoes, and appetizers sold under the Lamb Weston® brand, as well as many customer labels.
Foodservice
Our Foodservice segment includes branded and private label frozen potato products sold throughout the United States and Canada. The Foodservice segment’s primary products are frozen potatoes, sweet potatoes, commercial ingredients, and appetizer items sold under the Lamb Weston® brand, as well as many customer labels. Our products are sold primarily to commercial distributors, restaurant chains outside the top 100 North American based restaurant chains, and non-commercial channels.
Retail
Our Retail segment includes consumer facing retail branded and private label frozen potato products sold primarily to grocery, mass merchants, club, and specialty retailers. The Retail segment’s primary products are frozen potatoes and sweet potato items sold under our owned or licensed brands, including Grown in Idaho® and Alexia®, other licensed equities comprised of brand names of major North American restaurant chains, and the retailers’ own brands.
Other
The Other reporting segment primarily includes our vegetable and dairy businesses.
4
Joint Venture Relationships
We conduct business through two unconsolidated joint ventures and include our share of the earnings of these affiliates as equity method investment earnings in our combined and consolidated financial statements based on our economic ownership interest in each of these joint ventures. These two joint ventures produce and market value-added frozen potato products for retail and foodservice customers:
|
· |
We hold a fifty percent ownership interest in Lamb-Weston/Meijer v.o.f. (“Lamb-Weston/Meijer”), a joint venture with Meijer Frozen Foods B.V., headquartered in the Netherlands, which manufactures and sells frozen potato products principally in Europe. |
|
· |
We hold a fifty percent ownership interest in Lamb-Weston/RDO Frozen (“Lamb-Weston/RDO”), a potato processing venture with RDO Frozen Co. We provide all sales and marketing services to Lamb-Weston/RDO and receive a fee for these services based on a percentage of the net sales of the venture. |
In addition, we hold a 49.99% interest in Lamb Weston BSW, LLC (“Lamb Weston BSW”), a potato processing venture with Ochoa Ag Unlimited Foods, Inc. (“Ochoa”). We provide all sales and marketing services to Lamb Weston BSW. Lamb Weston BSW is a variable interest entity, and we have determined that we are the primary beneficiary of the entity. We consolidate the financial statements of Lamb Weston BSW. For more information, see Note 6, Investments in Joint Ventures, of the Notes to Combined and Consolidated Financial Statements in “Part II, Item 8. Financial Statements and Supplementary Data” of this Form 10-K.
Sales, Distribution and Customers
We benefit from strong relationships with a diverse set of customers. We sell our products through a combined network of internal sales personnel and independent brokers, agents, and distributors to chain restaurants, wholesale, grocery, mass merchants, club, specialty retailers, and foodservice distributors and institutions, including businesses, educational institutions, independent restaurants, regional chain restaurants, and convenience stores. We have long-tenured relationships with leading quick service and fast casual restaurants, global foodservice distributors, large grocery retailers, and mass merchants.
Our largest customer, McDonald’s Corporation, accounted for approximately 11%, of our consolidated net sales in each of fiscal years 2017, 2016, and 2015. No other customer accounted for more than 10% of our fiscal 2017, 2016, and 2015 consolidated net sales. Accounts receivable from one customer accounted for 10% and 11% of our consolidated accounts receivable at May 28, 2017 and May 29, 2016, respectively. Accounts receivable from an additional customer accounted for 11% of our consolidated accounts receivable at May 29, 2016.
International Operations
Excluding our joint ventures, we sell our products to consumers in approximately 60 countries. At May 28, 2017, we had operations in twelve countries, with manufacturing and processing facilities in three countries. Foreign net sales, including sales by domestic segments to customers located outside of the United States and Canada, were approximately $663.5 million, $615.9 million, and $557.0 million in fiscal 2017, 2016, and 2015, respectively. Our long-lived assets located outside of the United States are not significant. See Note 14, Segments, of the Notes to Combined and Consolidated Financial Statements in “Part II, Item 8. Financial Statements and Supplementary Data” of this Form 10-K for additional information on our U.S. and non-U.S. operations. Also see “Item 2. Properties,” for more information on our manufacturing and other facilities. For a discussion of risks related to our operations outside the United States, see “Item 1A. Risk Factors” of this Form 10-K.
5
Research and Development
We leverage our research and development resources for both growth and efficiency initiatives. We seek to drive growth through innovation by creating new products, enhancing the quality of existing products, and participating in joint menu planning exercises with our customers. We also emphasize sustainability in our research and development activities, and continue to drive processing innovations aimed at reducing waste and water usage. Research and development expense was $10.6 million, $6.7 million, and $7.2 million in fiscal 2017, 2016, and 2015, respectively.
Raw Materials and Packaging
Our primary raw materials are potatoes, edible oils, energy, and packaging. We source a significant amount of our raw potatoes under both strategic, long-term grower relationships and shorter-term annual contracts. In the United States, most of the potato crop used in value-added products is grown in Idaho, Oregon, and Washington. European growing regions for the necessary potatoes are concentrated in the Netherlands, Belgium, Germany, France, and the United Kingdom. We believe that the grower network to which we have access provides a sufficient source of raw potato inputs year-to-year. We source edible oils through strategic relationships with key suppliers, and we source energy and packaging materials through multiple suppliers under a variety of agreement types.
The prices paid for these raw materials, as well as other raw materials used in making our products, generally reflect factors such as weather, commodity market fluctuations, currency fluctuations, tariffs, and the effects of governmental agricultural programs. Although the prices of raw materials can be expected to fluctuate as a result of these factors, we believe such raw materials to be in adequate supply.
From time to time, we have faced increased costs for our significant raw materials, packaging and energy inputs. We seek to mitigate higher input costs through long-term relationships, contract strategies, and hedging activities where an active market for an input exists, as well as through our productivity and pricing initiatives.
Manufacturing
We own and operate 15 manufacturing facilities for our products. See "Item 2. Properties" for more information about our manufacturing facilities.
In addition to our own manufacturing facilities, we source a portion of our products under “co-packing” agreements, a common industry practice in which manufacturing is outsourced to other companies. We regularly evaluate our co-packing arrangements to ensure the most cost-effective manufacturing of our products and to utilize company-owned manufacturing facilities most effectively.
Backlog
We manufacture primarily to fill customer orders from finished goods inventories. While at any given time there may be some backlog of orders due to the seasonal nature of our manufacturing activities and associated inventory, such backlog is not material in respect to annual net sales, and the changes of backlog orders from time to time are not significant.
Competition
The value-added frozen potato products industry in both North America and international markets is highly competitive. Competitors include large national and international frozen potato product companies, as well as local and regional companies. Significant competitors include the J.R. Simplot Company, McCain Foods, Cavendish Farms, and The Kraft Heinz Company. Some of our competitors are larger and have substantially more financial, sales and marketing, and other resources. We compete with producers of similar products on the basis of, among other things, customer service,
6
value, product innovation, product quality, food safety, brand recognition and loyalty, price, and the ability to identify and satisfy customer preferences. The markets in which we operate are expected to remain highly competitive for the foreseeable future. See also “Item 1A. Risk Factors – Risks Relating to Our Business – Increased competition may result in reduced sales or profits” of this Form 10-K.
Trademarks, Licenses and Patents
Our trademarks are material to our business and are protected by registration or other means in the United States and most other geographic markets where the related food items are sold. Depending on the country, trademarks generally remain valid for as long as they are in use and their registration status is maintained. Trademark registrations generally are for renewable, fixed terms. Our significant trademarks include: Lamb Weston, Lamb’s Supreme, Lamb Weston Seeing Possibilities in Potatoes (and design), Lamb’s Seasoned, LW Private Reserve, Stealth Fries, and Sweet Things. We also sell certain products under brands, such as Grown in Idaho, which we license from third parties, as well as Alexia, which we license from Conagra under a trademark license agreement that we entered into in connection with the Separation.
We own numerous patents worldwide. We consider our portfolio of patents, patent applications, patent licenses under patents owned by third parties, proprietary trade secrets, technology, know-how processes, and related intellectual property rights to be material to our operations. Patents, issued or applied for, cover inventions ranging from basic packaging techniques to processes relating to specific products and to the products themselves. Our issued patents extend for varying periods according to the date of the patent application filing or grant and the legal term of patents in the various countries where patent protection is obtained. The actual protection afforded by a patent, which can vary from country to country, depends upon the type of patent, the scope of its coverage as determined by the patent office or courts in the country, and the availability of legal remedies in the country. While we consider our patent portfolio to be material to our business, the loss of one patent or a group of related patents would not have a material adverse effect on our business.
Seasonality
Our product contribution margin percentage, inventory levels, net sales, and cash flows are affected by seasonality. In general, our product contribution margin percentage tends to be highest in the third quarter, reflecting the benefit of freshly-harvested potatoes. We typically harvest potatoes in the Pacific Northwest in August through December, which is primarily in our second quarter. Freshly-harvested potatoes process better in our production lines and are not subject to storage or secondary transport costs. We typically hold about 60 days of finished goods inventory on a first-in-first-out basis, so the relatively favorable costs incurred from our second fiscal quarter harvest flow through our income statement in the third quarter. Inventory levels also tend to be higher in the third quarter, requiring more working capital at that time. In general, net sales and cash flows tend to be higher in the fourth quarter, reflecting customer and consumer buying patterns.
Employees
As of June 30, 2017, we had approximately 6,500 employees, excluding our joint ventures. Approximately 400 of these employees work outside of the United States. Approximately 27% of our hourly employees are parties to collective bargaining agreements on terms that we believe are typical for the industry in which we operate. Most of the union workers at our facilities are represented under contracts that expire at various times throughout the next several years. Approximately 8% expire in fiscal 2018. As these agreements expire, we believe they will be renegotiated on terms satisfactory to us.
7
Executive Officers
The following are our executive officers as of July 20, 2017:
|
Name |
|
Title |
|
Age |
|
Timothy R. McLevish |
|
Executive Chairman |
|
62 |
|
Thomas P. Werner |
|
Director, President and Chief Executive Officer |
|
51 |
|
Robert M. McNutt |
|
Senior Vice President and Chief Financial Officer |
|
57 |
|
Micheline C. Carter |
|
Senior Vice President and Chief Human Resources Officer |
|
51 |
|
Rodney W. Hepponstall |
|
Senior Vice President and General Manager, Foodservice and Retail Business Units |
|
50 |
|
Richard A. Martin |
|
Senior Vice President and Chief Supply Chain Officer |
|
60 |
|
Sharon L. Miller |
|
Senior Vice President and General Manager, Global Business Unit |
|
51 |
|
Michael J. Smith |
|
Senior Vice President, Growth and Strategy |
|
40 |
|
Eryk J. Spytek |
|
Senior Vice President, General Counsel and Corporate Secretary |
|
49 |
Timothy R. McLevish has served as our Executive Chairman since November 2016. Before joining Lamb Weston, he was a consultant to Walgreens Boots Alliance, Inc. (formerly Walgreen Co.), a pharmacy-led, health and wellbeing enterprise, from March 2015 to October 2016, where he provided advice and counsel to their chief executive officer on matters relating to strategy, business development, and M&A. Before this role, Mr. McLevish served as Chief Financial Officer of Walgreens Boots Alliance, Inc. from January 2015 to March 2015 and Executive Vice President and Chief Financial Officer of Walgreen Co. from August 2014 to December 2014. From October 2007 to April 2014, Mr. McLevish held various positions within Kraft Foods Group, Inc. and Kraft Foods Inc., food and beverage companies, including Executive Vice President and Chief Financial Officer. Before joining Kraft Foods, Mr. McLevish was the Senior Vice President and Chief Financial Officer of Ingersoll-Rand Company Limited, a diversified industrial company, from March 2002 to October 2007. Mr. McLevish currently serves on the boards of directors for Kennametal Inc. since 2004 and R.R. Donnelley & Sons Company since 2016. He previously served on the boards of Conagra from July 2015 to November 2016, US Foods Holding Corp. from May 2016 to July 2016, and URS Corporation from November 2012 to October 2014.
Thomas P. Werner has served as our President and Chief Executive Officer and a member of our Board of Directors since November 2016. He previously served as President, Commercial Foods, for Conagra, since May 2015. In that role, he led the company’s Lamb Weston and Foodservice businesses, as well as its previously divested Spicetec Flavors & Seasonings and J.M. Swank operations. Mr. Werner also served as interim President of Conagra’s Private Brands from June 2015 through its divestiture in February 2016. Before his appointment as President, Commercial Foods, Mr. Werner served as Senior Vice President of Finance for Conagra’s Private Brands and Commercial Foods operating segments from June 2013 to April 2015, and Senior Vice President of Finance for Lamb Weston from May 2011 until June 2013.
Robert M. McNutt has served as our Senior Vice President and Chief Financial Officer since January 2017. Prior to joining Lamb Weston, Mr. McNutt served as Chief Financial Officer of Expera Specialty Solutions, LLC, a specialty paper company, from September 2013 to December 2016. Mr. McNutt served as Senior Vice President and Chief Financial Officer for Greif, Inc., an industrial packaging company, from January 2011 to July 2013, and as Senior Vice President and Chief Financial Officer for Boise Inc., a packaging and paper products manufacturer, from February 2008 to January 2011.
Micheline C. Carter has served as our Senior Vice President and Chief Human Resources Officer since November 2016. Ms. Carter joined Lamb Weston in September 2016. From July 2012 until September 2016, she served in a variety of roles with The Kraft Heinz Company, a food and beverage company, including as Head of U.S. People and Performance and Global Corporate Functions from November 2015 to September 2016, Vice President of Human Resources, Global
8
Corporate Functions from August 2015 until October 2015, Vice President of Human Resources, Cheese & Dairy from January 2015 until July 2015, and Senior Director Human Resources & Global Exports from July 2012 until January 2015. Before joining The Kraft Heinz Company, Ms. Carter served from February 2011 until July 2012 as Senior Director Human Resources, Solar Energy & Solar Materials with MEMC Electronic Materials, Inc. (now known as SunEdison, Inc.), a supplier of silicon wafers to semiconductor and photovoltaic cell companies. Before that, Ms. Carter served in a variety of roles with J. C. Penney Company, Inc., an apparel and home furnishings retailer, Yum! Brands, Inc., an operator of fast food companies, and Texas Instruments Incorporated, a semiconductor design and manufacturing company.
Rodney W. Hepponstall has served as our Senior Vice President and General Manager, Foodservice and Retail Business Units since October 2016. Prior to that, Mr. Hepponstall served as Conagra’s Vice President and General Manager, Foodservice from October 2011 until September 2016. Before joining Conagra in 2011, Mr. Hepponstall served as Vice President at Bimbo Bakeries USA, a bakery products company, from September 2008 to September 2011, and as Senior Vice President of Foodservice and Retail at Maple Leaf Foods Inc., a consumer protein company, from 1999 to 2008.
Richard A. Martin has served as our Senior Vice President and Chief Supply Chain Officer since September 2016. Mr. Martin joined Conagra as a Manufacturing Manager in 1994, and from 1997 to 2003, he served as Plant Manager of several of our facilities. Mr. Martin also served as Director of Operations from 2003 to 2005, Vice President, Manufacturing from 2005 to 2011, and Vice President, Global Operations from 2011 until 2016. Before joining Lamb Weston, Mr. Martin spent 15 years at General Foods Corporation and Kraft Foods Inc., food and beverage companies, in a variety of engineering and manufacturing positions.
Sharon L. Miller has served as our Senior Vice President and General Manager, Global Business Unit since September 2016. Before that, she served as Conagra’s Vice President and General Manager, Lamb Weston Global Business Unit since 2015. Since joining Conagra in 1999, Ms. Miller has held various leadership positions, including Vice President of Sales for Lamb Weston's European joint venture, Lamb-Weston/Meijer v.o.f. Prior to that, Ms. Miller was a key sales and business leader within Lamb Weston in both the United States and Canada. She also has held various sales positions with North American foodservice distributors.
Michael J. Smith has served as our Senior Vice President, Growth and Strategy since September 2016. Mr. Smith also served as Vice President and General Manager of Lamb Weston Retail from May 2011 to September 2016, Vice President and General Manager of Conagra’s Private Brands from March 2014 to February 2016, and Vice President of Global Marketing of Lamb Weston from July 2012 to March 2014. Prior to joining Conagra in 2007, Mr. Smith held various brand management roles at Dean Foods Company, a food and beverage company, and its WhiteWave division from May 2003 until December 2007.
Eryk J. Spytek has served as our Senior Vice President, General Counsel and Corporate Secretary since October 2016. From June 2015 until October 2016, Mr. Spytek was Of Counsel at Winston & Strawn LLP, a law firm. Before returning to Winston & Strawn LLP, he served from December 2009 until April 2015 in a variety of roles with Mead Johnson Nutrition Company, a manufacturer of infant formula, including as Vice President, Deputy General Counsel and Assistant Secretary from April 2013 to April 2015 and as Vice President, Associate General Counsel and Assistant Secretary from December 2009 to April 2013. Before that, Mr. Spytek served as Senior Vice President, General Counsel and Secretary at SIRVA, Inc., a moving and relocation services provider, from February 2006 to February 2009. Before joining SIRVA, Inc., Mr. Spytek was a partner at Winston & Strawn LLP.
Ethics and Governance
We have adopted a code of conduct that applies to all of our employees, as well as a code of ethics for senior corporate financial officers that applies to our Chief Executive Officer, Chief Financial Officer, and Controller. These codes are available on our website at www.lambweston.com through the “Investors—Corporate Governance” link. We
9
will disclose any waiver we grant to our Chief Executive Officer, Chief Financial Officer, or Controller under our codes, or certain amendments to the codes, on our website at www.lambweston.com.
In addition, we adopted Corporate Governance Principles and charters for the Audit Committee, Nominating and Corporate Governance Committee, and Compensation Committee. All of these materials are available on our website at www.lambweston.com and will be provided free of charge to any stockholder requesting a copy by writing to: Corporate Secretary, Lamb Weston Holdings, Inc., 599 S. Rivershore Lane, Eagle, Idaho 83616.
The information on our website is not, and shall not be deemed to be, a part of this Form 10-K or incorporated into any other filings we make with the SEC.
Food Safety and Labeling
We are subject to extensive regulation, including, among other things, the Food, Drug and Cosmetic Act, as amended by the Food Safety Modernization Act, the Public Health Security and Bioterrorism Preparedness and Response Act of 2002, and the rules and regulations promulgated thereunder by the U.S. Food and Drug Administration (“FDA”). This comprehensive and evolving regulatory program governs, among other things, the manufacturing, composition and ingredients, labeling, packaging, and safety of food, including compliance with current Good Manufacturing Practices. In addition, the Nutrition Label Reform Act of 2016 prescribes the format and content in which specific nutrition information is required to appear on the labels of food products. We are also subject to regulation by certain other governmental agencies, including the U.S. Department of Agriculture.
Our operations and products are also subject to state and local regulation, including the registration and licensing of plants, enforcement by state health agencies of various state standards, and the registration and inspection of facilities. Compliance with federal, state, and local regulation is costly and time-consuming. Enforcement actions for violations of federal, state, and local regulations may include seizure and condemnation of products, cease and desist orders, injunctions, or monetary penalties. We believe that our practices are sufficient to maintain compliance with applicable government regulations.
Environmental, Health and Safety Regulations
We are subject to a number of federal, state, and local laws and other regulations relating to the protection of the environment and the safety and health of personnel and the public. These requirements apply to a broad range of our activities, including: the discharge of pollutants into the air and water; the identification, generation, storage, handling, transportation, disposal, recordkeeping, labeling, and reporting of, and emergency response in connection with, hazardous materials; noise emissions from our facilities; and safety and health standards, practices, and procedures that apply to the workplace and the operation of our facilities.
In order to comply with these requirements, we may need to spend substantial amounts of money and other resources from time to time to (i) construct or acquire new equipment, (ii) acquire or amend permits to authorize facility operations, (iii) modify, upgrade, or replace existing and proposed equipment, and (iv) clean up or decommission our facilities or other locations in accordance with regulatory requirements. Our capital and operating budgets include costs and expenses associated with complying with these laws and other requirements.
Available Information
We make available, free of charge on our website at www.lambweston.com, our annual reports on Form 10-K, quarterly reports on Form 10-Q, current reports on Form 8-K, and amendments to those reports filed or furnished pursuant to Section 13(a) or 15(d) of the Securities Exchange Act of 1934, as soon as reasonably practicable after we electronically file them with, or furnish them to, the SEC. We use our website, through the “Investors” link, as a channel for routine distribution of important information, including news releases, analyst presentations, and financial information. The
10
information on our website is not, and shall not be deemed to be, a part of this Form 10-K or incorporated into any other filings we make with the SEC.
Our business is subject to various risks and uncertainties. Any of the risks and uncertainties described below could materially and adversely affect our business, financial condition and results of operations and should be considered in evaluating us. While we believe we have identified and discussed below the material risks affecting our business, there may be additional risks and uncertainties that we do not presently know or that we do not currently believe to be material that may adversely affect our business, financial condition or results of operations in the future.
Risks Relating to Our Business
Increased competition may result in reduced sales or profits.
Our business, value-added frozen potato products, is highly competitive. Our principal competitors have substantial financial, sales and marketing, and other resources. A strong competitive response from one or more of our competitors to our marketplace efforts could result in us reducing pricing, increasing promotional activity or losing market share. Competitive pressures also may restrict our ability to increase prices, including in response to commodity and other input cost increases or additional improvements in product quality. Our profits could decrease if a reduction in prices or increased costs are not counterbalanced with increased sales volume.
Increased industry capacity may result in reduced sales or profits.
In recent years, market demand for value-added frozen potato products has exceeded industry capacity to produce these products. As additional industry capacity comes online, or market demand otherwise decreases, we may face competitive pressures that would restrict our ability to increase or maintain prices. Our profits would decrease as a result of a reduction in prices or sales volume.
Our business, financial condition and results of operations could be adversely affected by the political and economic conditions of the countries in which we conduct business and other factors related to our international operations, including foreign currency risks and trade barriers.
We conduct a substantial and growing amount of business with customers located outside the United States and Canada, including through our joint ventures. A primary growth strategy for our business is increasing our international sales and operations. During fiscal 2017, 2016, and 2015, net sales outside the United States and Canada, primarily in Japan, China, Korea, Mexico, and Taiwan, accounted for approximately 20% of our net sales. These amounts do not include any impact of unconsolidated net sales associated with our joint ventures.
Many factors relating to our international sales and operations, many of which factors are outside of our control, could have a material adverse impact on our business, financial condition, and results of operations, including:
|
· |
foreign exchange rates, foreign currency exchange and transfer restrictions, which may unpredictably and adversely impact our combined operating results, asset and liability balances, and cash flow in our combined and consolidated financial statements, even if their value has not changed in their original currency; |
|
· |
our combined and consolidated financial statements are presented in U.S. dollars and we must translate the assets, liabilities, revenue and expenses into U.S. dollars for external reporting purposes; |
11
|
· |
negative economic developments in economies around the world and the instability of governments, including the threat of wars, terrorist attacks, epidemics or civil unrest; |
|
· |
pandemics, such as the flu, which may adversely affect our workforce as well as our local suppliers and customers; |
|
· |
earthquakes, tsunamis, floods or other major disasters that may limit the supply of raw materials that are purchased abroad for use in our international operations or domestically; |
|
· |
changes in trade, monetary and fiscal policies of the United States and foreign governments, including modification or termination of trade agreements or treaties, creation of new trade agreements or treaties, trade regulations, and tariffs, quotas, import or export licensing requirements, and other trade barriers imposed by governments; |
|
· |
increased costs, disruptions in shipping or reduced availability of freight transportation; |
|
· |
differing labor standards in the international markets in which we operate; |
|
· |
differing levels of protection of intellectual property across the international markets in which we operate; |
|
· |
difficulties and costs associated with complying with U.S. laws and regulations applicable to entities with overseas operations, including the Foreign Corrupt Practices Act; |
|
· |
the threat that our operations or property could be subject to nationalization and expropriation; |
|
· |
varying regulatory, tax, judicial and administrative practices in the international markets in which we operate; |
|
· |
difficulties associated with operating under a wide variety of complex foreign laws, treaties and regulations; and |
|
· |
potentially burdensome taxation. |
Any of these factors could have an adverse effect on our business, financial condition, and results of operations.
Disruption of our access to export mechanisms could have an adverse impact on our business, financial condition, and results of operations.
To serve our customers globally, we rely in part on our international joint venture partnerships, but also on exports from the United States. During fiscal 2017, export sales accounted for 21% of our total net sales. Circumstances beyond our control, such as a labor dispute at a port, could prevent us from exporting our products in sufficient quantities to meet customer opportunities. We have access to production overseas through our facility in China and joint venture in Europe, but we may be unsuccessful in mitigating any future disruption to export mechanisms. If this occurs, we may be unable to adequately supply all of our customer opportunities, which could adversely affect our business, financial condition, and results of operations.
Our substantial debt may limit cash flow available to invest in the ongoing needs of our business and could prevent us from fulfilling our debt obligations.
We incurred substantial indebtedness in connection with the spinoff. As of May 28, 2017, we had approximately $2,402.9 million of long-term debt, including current portion, recorded on our Combined and Consolidated Balance Sheet.
12
We have the ability under our existing revolving credit facility to incur additional substantial debt. Our level of debt could have important consequences. For example, it could:
|
· |
make it more difficult for us to make payments on our debt; |
|
· |
require us to dedicate a substantial portion of our cash flow from operations to the payment of debt service, reducing the availability of our cash flow to fund working capital, capital expenditures, acquisitions, and other general corporate purposes; |
|
· |
increase our vulnerability to adverse economic or industry conditions; |
|
· |
limit our ability to obtain additional financing in the future to enable us to react to changes in our business; or |
|
· |
place us at a competitive disadvantage compared to businesses in our industry that have less debt. |
The agreements governing our debt contain various covenants that impose restrictions on us that may affect our ability to operate our business.
The credit agreement governing our term loan and revolving credit facility and the indentures governing our senior notes contain covenants that, among other things, limit our ability to:
|
· |
borrow money or guarantee debt; |
|
· |
create liens; |
|
· |
pay dividends on or redeem or repurchase stock; |
|
· |
make specified types of investments and acquisitions; |
|
· |
enter into or permit to exist contractual limits on the ability of our subsidiaries to pay dividends to us; |
|
· |
enter into transactions with affiliates; and |
|
· |
sell assets or merge with other companies. |
These restrictions on our ability to operate our business could harm our business by, among other things, limiting our ability to take advantage of financing, merger and acquisition, and other corporate opportunities. Various risks, uncertainties, and events beyond our control could affect our ability to comply with these covenants. Failure to comply with any of the covenants in our existing or future financing agreements could result in a default under those agreements and under other agreements containing cross-default provisions. A default would permit lenders to accelerate the maturity of the debt under these agreements and to foreclose upon any collateral securing the debt. Under these circumstances, we might not have sufficient funds or other resources to satisfy all of our obligations. In addition, the limitations imposed by financing agreements on our ability to incur additional debt and to take other actions might significantly impair our ability to obtain other financing.
Additionally, any failure to meet required payments on our debt, or failure to comply with any covenants in the instruments governing our debt, could result in a downgrade to our credit ratings. A downgrade in our credit ratings could limit our access to capital and increase our borrowing costs.
13
Our business relies on a potato crop that has a concentrated growing region.
Ideal growing conditions for the potatoes necessary for our value-added products (e.g., French fries) are concentrated in a few geographic regions globally. In the United States, most of the potato crop used in value-added products is grown in Idaho, Oregon, and Washington. European growing regions for the necessary potatoes are concentrated in the Netherlands, Belgium, Germany, France, and the United Kingdom. Recent agronomic developments have opened new growing regions, but the capital intensive nature of our industry’s production processes has kept production highly concentrated in the historical growing regions. Unfavorable crop conditions in any one region could lead to significant demand on the other regions for production. Our inability to mitigate any such conditions by leveraging our production capabilities in other regions could negatively impact our ability to meet customer needs and could decrease our profitability.
Our business is affected by potato crop performance.
Our primary input is potatoes and every year, we must procure potatoes that meet the quality standards for processing into value-added products. Environmental and climate conditions, such as soil quality, moisture, and temperature, affect the quality of the potato crop on a year-to-year basis. As a result, we source potatoes from specific regions of the United States and specific countries abroad, including the Netherlands, Belgium, Germany, France, and the United Kingdom, where we believe the optimal potato growing conditions exist. However, severe weather conditions during the planting and growing season in these regions can significantly affect potato crop performance. Potatoes are also susceptible to pest diseases and insects that can cause crop failure, decreased yields, and negatively affect the physical appearance of the potatoes. We have deep experience in agronomy and actively work to monitor and manage the potato crop. However, if a weather or pest-related event occurs in a particular crop year, and our agronomic programs are insufficient to mitigate the impacts thereof, we may have insufficient potatoes to meet our customer opportunities, and our competitiveness and profitability could decrease. Alternatively, overly favorable growing conditions can lead to high per acre yields and over-supply. An increased supply of potatoes could lead to overproduction of finished goods or destruction of unused potatoes at a loss.
Increases in commodity costs may have a negative impact on profits.
A significant portion of our cost of goods comes from commodities such as oil and energy. Commodities are subject to price volatility caused by commodity market fluctuations, supply and demand, currency fluctuations, external conditions such as weather and changes in governmental agricultural and energy policies and regulations. Commodity price increases will increase operating costs. We may not be able to increase our product prices and achieve cost savings that fully offset these increased costs; and increasing prices may result in reduced sales volume, reduced margins and profitability. We have experience in hedging against commodity price increases. There is currently no active derivatives market for potatoes in the United States. In addition, these practices and experience reduce, but do not eliminate, the risk of negative profit impacts from commodity price increases. As a result, the risk management procedures that we use may not always work as we intend.
If we do not achieve the appropriate cost structure in the highly competitive value-added frozen potato product category, our profitability could decrease.
Our future success and earnings growth depend in part on our ability to maintain the appropriate cost structure and operate efficiently in the highly competitive value-added frozen potato product category. We continue to implement profit-enhancing initiatives that improve the efficiency of our supply chain and general and administrative functions. These initiatives are focused on cost-saving opportunities in procurement, manufacturing, logistics, and customer service, as well as general and administrative overhead levels. However, gaining additional efficiencies may become more difficult over time. Our failure to reduce costs through productivity gains or the elimination of redundant costs could adversely affect our profitability and weaken our competitive position.
14
Changes in our relationships with our growers could adversely affect us.
We expend considerable resources to develop and maintain relationships with many potato growers. In some instances, we have entered into long-term agreements with growers; however, a portion of our potato needs are typically sourced on an annual basis. To the extent we are unable to maintain positive relationships with our long-term growers, contracted growers deliver less supply than we expect, or we are unable to secure sufficient potatoes from uncontracted growers in a given year, we may not have sufficient potato supply to satisfy our business opportunities. To obtain sufficient potato supply, we may be required to purchase potatoes at prices substantially higher than expected, or forgo sales to some market segments, which would reduce our profitability. If we forgo sales to such market segments, we may lose customers and may not be able to replace them later.
Changes in our relationships with significant customers could adversely affect us.
We maintain a diverse customer base across our four reporting segments. Customers include global, national and regional quick serve and fast casual restaurants as well as small, independently operated restaurants, multinational, broadline foodservice distributors as well as regional foodservice distributors, and major food retailers. Some of these customers independently represent a meaningful portion of our sales. While we contract annually or biannually with many of our foodservice customers, loss of a significant customer could materially impact the business. In addition, shelf space at food retailers is not guaranteed. During each of fiscal 2017, 2016, and 2015 our largest customer, McDonald’s Corporation and its affiliates, accounted for approximately 11% of our net sales. There can be no assurance that our customers will continue to purchase our products in the same quantities or on the same terms as in the past. The loss of a significant customer or a material reduction in sales to a significant customer could materially and adversely affect our business, financial condition, and results of operations.
The sophistication and buying power of some of our customers could have a negative impact on profits.
Some of our customers are large and sophisticated, with buying power and negotiating strength. These customers may be more capable of resisting price increases and more likely to demand lower pricing, increased promotional programs, or specialty tailored products. In addition, some of these customers (e.g., larger distributors and supermarkets) have the scale to develop supply chains that permit them to operate with reduced inventories or to develop and market their own brands. We continue to implement initiatives to counteract these pressures, including efficiency programs and investments in innovation and quality. However, if we are unable to counteract the negotiating strength of these customers, our profitability could decline.
We must identify changing consumer preferences and consumption trends and develop and offer food products to our customers that help meet those preferences.
Consumer preferences evolve over time and our success depends on our ability to identify the tastes and dietary habits of consumers and offer products that appeal to those preferences. We need to continue to respond to these changing consumer preferences, and support our customers in their efforts to evolve to meet those preferences. For example, as consumers focus on freshly prepared foods, some restaurants may choose to limit the frying capabilities of their kitchens. As a result, we would need to evolve our product offering to provide alternatives that work in such a preparation environment. In addition, our products contain carbohydrates, sodium, genetically modified ingredients, added sugars, saturated fats, and preservatives, the diet and health effects of which remain the subject of public scrutiny. We must continue to reformulate our products, introduce new products and create product extensions without a loss of the taste, texture, and appearance that consumers demand in value-added potato products. All of these efforts require significant research and development and marketing investments. If our products fail to meet consumer preferences or customer requirements, or we fail to introduce new and improved products on a timely basis, then the return on those investments will be less than anticipated, which could materially and adversely affect our business, financial condition, and results of operations.
15
A portion of our business is, and several of our growth strategies will be, conducted through joint ventures that do not operate solely for our benefit.
We have built our company, in part, through the creation of joint ventures, some of which we do not control. In these relationships, we share ownership and management of a company that operates for the benefit of all owners, rather than our exclusive benefit. Through our extensive experience in operating our business through joint ventures, we understand that joint ventures often take additional resources and procedures for information sharing and decision-making. If our joint venture partners begin to take actions that have negative impacts on the joint venture, or begin to disagree with the strategies we have developed to grow these businesses, we may have limited ability to influence and mitigate those decisions and our ability to achieve our growth strategies may be negatively impacted.
If we are unable to complete acquisitions that strategically fit our business objectives, or integrate acquired businesses or execute on large capital projects, our financial results could be materially and adversely affected.
From time to time, we evaluate acquisition candidates that may strategically fit our business objectives. Our acquisition activities may present financial, managerial, and operational risks. Those risks include: (i) diversion of management attention from existing businesses, (ii) difficulties integrating personnel and financial and other systems, (iii) difficulties implementing effective control environment processes, (iv) adverse effects on existing business relationships with suppliers and customers, (v) inaccurate estimates of fair value made in the accounting for acquisitions and amortization of acquired intangible assets, which would reduce future reported earnings, (vi) potential loss of customers or key employees of acquired businesses, and (vii) indemnities and potential disputes with the sellers. If we are unable to complete acquisitions or successfully integrate and develop acquired businesses or execute on large capital projects, our financial results could be materially and adversely affected.
New regulations imposed by the FDA or EFSA around acrylamide formation in French fried potato products could adversely affect us.
The regulation of food products, both within the United States and internationally, continues to be a focus for governmental scrutiny. The presence and/or formation of acrylamide in French fried potato products has become a global regulatory issue as both the FDA and the European Food Safety Authority (“EFSA”) have issued guidance to the food processing industry to work to reduce conditions that favor the formation of this naturally occurring compound. Acrylamide formation is the result of heat processing reactions that give “browned foods” their desirable flavor. Acrylamide formation occurs in many food types in the human diet, including but not limited to breads, toast, cookies, coffee, crackers, potatoes, and olives. Currently, the regulatory approach to acrylamide has generally been to encourage the industry to achieve as low as reasonably achievable content levels through process control (temperature) and material testing (low sugar and low asparagine). However, limits for acrylamide content have been established for some food types in the State of California, and point of sale consumer warnings are required if products exceed those limits. If the global regulatory approach to acrylamide changes and stringent legal limits are established, our manufacturing costs could increase. In addition, if consumer perception regarding the safety of our products is negatively impacted due to regulation, sales of our products could possibly decrease.
If we fail to comply with the many laws applicable to our business, we may face lawsuits or incur significant fines and penalties.
Our facilities and products are subject to many laws and regulations administered by the U.S. Department of Agriculture, the FDA, the Occupational Safety and Health Administration, and other federal, state, local, and foreign governmental agencies relating to the processing, packaging, storage, distribution, advertising, labeling, quality, and safety of food products, the health and safety of our employees, and the protection of the environment. Our failure to comply with applicable laws and regulations could subject us to lawsuits, administrative penalties, and civil remedies, including fines, injunctions, and recalls of our products.
16
Our operations are also subject to extensive and increasingly stringent regulations administered by the Environmental Protection Agency, and comparable state agencies, which pertain to the discharge of materials into the environment and the handling and disposition of wastes. Failure to comply with these regulations can have serious consequences, including civil and administrative penalties and negative publicity. Changes in applicable laws or regulations or evolving interpretations thereof, including increased government regulations to limit carbon dioxide and other greenhouse gas emissions as a result of concern over climate change, may result in increased compliance costs, capital expenditures, and other financial obligations for us, which could affect our profitability or impede the production or distribution of our products, which could adversely affect our business, financial condition, and results of operations.
Litigation could expose us to significant costs and adversely affect our business, financial condition, and results of operations.
We are, or may become, party to various lawsuits and claims arising in the ordinary course of business, which may include lawsuits or claims relating to commercial liability, product recalls, product liability, product claims, employment matters, environmental matters, or other aspects of our business. Litigation is inherently unpredictable, and although we may believe we have meaningful defenses in these matters, we may incur judgments or enter into settlements of claims that could have a material adverse effect on our business, financial condition, and results of operations. The costs of responding to or defending litigation may be significant and may divert the attention of management away from our strategic objectives. There may also be adverse publicity associated with litigation that may decrease customer confidence in our business, regardless of whether the allegations are valid or whether we are ultimately found liable. As a result, litigation may have a material adverse effect on our business, financial condition, and results of operations.
We may be subject to product liability claims and product recalls, which could negatively impact our relationships with customers and harm our business.
We sell food products for human consumption, which involves risks such as product contamination or spoilage, product tampering, other adulteration of food products, mislabeling, and misbranding. We may voluntarily recall or withdraw products from the market in certain circumstances, which would cause us to incur associated costs; those costs could be meaningful. We may also be subject to litigation, requests for indemnification from our customers, or liability if the consumption or inadequate preparation of any of our products causes injury, illness, or death. A significant product liability judgment or a widespread product recall may negatively impact our sales and profitability for a period of time depending on the costs of the recall, the destruction of product inventory, product availability, competitive reaction, customer reaction, and consumer attitudes. Even if a product liability claim is unsuccessful or is not fully pursued, the negative publicity surrounding any assertion that our products caused illness or injury could adversely affect our reputation with existing and potential customers and our corporate and brand image.
Additionally, as a manufacturer and marketer of food products, we are subject to extensive regulation by the FDA and other national, state and local government agencies. The Food, Drug & Cosmetic Act and the Food Safety Modernization Act and their respective regulations govern, among other things, the manufacturing, composition and ingredients, packaging and safety of food products. Some aspects of these laws use a strict liability standard for imposing sanctions on corporate behavior; meaning that no intent is required to be established. If we fail to comply with applicable laws and regulations, we may be subject to civil remedies, including fines, injunctions, recalls, or seizures, as well as criminal sanctions, any of which could have a material adverse effect on our business, financial condition, and results of operations.
Damage to our reputation as a trusted partner to customers and good corporate citizen could have a material adverse effect on our business, financial condition, and results of operations.
Our customers rely on us and our co-manufacturers to manufacture safe, high quality food products. Product contamination or tampering, the failure to maintain high standards for product quality, safety, and integrity, or allegations of product quality issues, mislabeling or contamination, even if untrue, may damage the reputation of our customers, and
17
ultimately our reputation as a trusted industry partner. Damage to either could reduce demand for our products or cause production and delivery disruptions.
Our reputation could also be adversely impacted by any of the following, or by adverse publicity (whether or not valid) relating thereto: the failure to maintain high ethical, social, and environmental standards for our operations and activities; our research and development efforts; our environmental impact, including use of agricultural materials, packaging, energy use, and waste management; our failure to comply with local laws and regulations; our failure to maintain an effective system of internal controls; or our failure to provide accurate and timely financial information. Damage to our reputation or loss of customer confidence in our products for any of these or other reasons could result in decreased demand for our products and could have a material adverse effect on our business, financial condition, and results of operations, as well as require additional resources to rebuild our reputation.
Our results could be adversely impacted as a result of increased pension, labor and people-related expenses.
Inflationary pressures and any shortages in the labor market could increase labor costs, which could have a material adverse effect on our operating results or financial condition. Our labor costs include the cost of providing employee benefits in the United States and foreign jurisdictions, including pension, health and welfare, and severance benefits. Changes in interest rates, mortality rates, health care costs, early retirement rates, investment returns, and the market value of plan assets can affect the funded status of our defined benefit plans and cause volatility in the future funding requirements of the plans. A significant increase in our obligations or future funding requirements could have a negative impact on our results of operations and cash flows from operations. Additionally, the annual costs of benefits vary with increased costs of health care and the outcome of collectively-bargained wage and benefit agreements.
We anticipate upgrading our information technology infrastructure, and expect to implement a new enterprise resource planning system. Problems with the transition, design or implementation of this upgrade could interfere with our business and operations and adversely affect our financial condition.
Under a transition services agreement entered into in connection with the Separation, Conagra currently provides us with information technology services, which, under the agreement, terminates on February 28, 2018. We are currently investigating upgrade options for our information technology infrastructure, including a long-term plan to implement a new enterprise resource planning (“ERP”) system and other complementary information technology systems after we transition from Conagra, which we expect to implement in fiscal 2019. We may experience difficulties as we transition to new upgraded systems and processes. These disruptions may include loss of data; difficulty in processing customer orders, shipping products, or providing services and support to our customers; difficulty in billing and tracking our orders; difficulty in completing financial reporting and filing reports with the SEC in a timely manner; or challenges in otherwise running our business. We may also experience decreases in productivity as our personnel implement and become familiar with new systems. Any disruptions, delays, or deficiencies in the transition, design, and implementation of an upgraded information technology infrastructure, or a new ERP system, particularly any disruptions, delays, or deficiencies that impact our operations, could have a material adverse effect on our business, financial condition, and results of operations. Even if we do not encounter adverse effects, the transition, design, and implementation of an upgraded information technology infrastructure, or new ERP system, may be much more costly than we anticipated.
18
There are inherent limitations on the effectiveness of our controls.
We do not expect that our disclosure controls or our internal control over financial reporting will prevent or detect all errors and all fraud. A control system, no matter how well-designed and operated, can provide only reasonable, not absolute, assurance that the control system’s objectives will be met. The design of a control system must reflect the fact that resource constraints exist, and the benefits of controls must be considered relative to their costs. In addition, beginning with our Annual Report on Form 10-K for our fiscal year ending May 27, 2018, we will be required to furnish a report by management on the effectiveness of our internal control over financial reporting pursuant to Section 404 of the Sarbanes-Oxley Act of 2002. We are in the process of designing, implementing, and testing the internal control over financial reporting required to comply with this obligation, which process is time consuming, costly, and complicated.
Because of the inherent limitations in all control systems, no evaluation of controls can provide absolute assurance that misstatements due to error or fraud will not occur or that all control issues and instances of fraud, if any, have been detected. The design of any system of controls is based in part on certain assumptions about the likelihood of future events, and there can be no assurance that any design will succeed in achieving its stated goals under all potential future conditions. Projections of any evaluation of the effectiveness of controls to future periods are subject to risks. Over time, controls may become inadequate due to changes in conditions or deterioration in the degree of compliance with policies or procedures. If our controls become inadequate, we could fail to meet our financial reporting obligations, our reputation may be adversely affected, our business, financial condition, and results of operations could be adversely affected, and the market price of our stock could decline.
If we are unable to attract and retain key personnel, our business could be materially and adversely affected.
Our success depends on our ability to attract and retain personnel with professional and technical expertise, such as agricultural and food manufacturing experience, as well as finance, marketing, and other senior management professionals. The market for these employees is competitive, and we could experience difficulty from time to time in hiring and retaining the personnel necessary to support our business. If we do not succeed in retaining our current employees and attracting new high-quality employees, our business could be materially and adversely affected.
The potential disruption from cyber attacks and information security problems present new risks.
We are increasingly dependent on information technology networks and systems, to process, transmit, and store electronic and financial information, to manage and support a variety of business processes and activities, and to comply with regulatory, legal, and tax requirements. If we do not allocate and effectively manage the resources necessary to build and sustain the proper technology infrastructure and to maintain and protect the related automated and manual control processes, we could be subject to billing and collection errors, business disruptions, or damage resulting from security breaches. If any of our significant information technology systems suffer severe damage, disruption, or shutdown and our business continuity plans do not effectively resolve the issues in a timely manner, our product sales, financial condition, and results of operations may be materially and adversely affected and we could experience delays in reporting our financial results. In addition, there is a risk of business interruption, litigation risks, and reputational damage from leakage of confidential information.
Climate change, or legal, regulatory, or market measures to address climate change, may negatively affect our business and operations.
There is growing concern that carbon dioxide and other greenhouse gases in the atmosphere may have an adverse impact on global temperatures, weather patterns, and the frequency and severity of extreme weather, and natural disasters. In the event that climate change has a negative effect on agricultural productivity, we may be subject to decreased availability or less favorable pricing for certain commodities that are necessary for our products, such as potatoes and oils. In addition, water is an important part of potato processing. We may be subjected to decreased availability or less favorable pricing for water, which could impact our manufacturing and distribution operations. The increasing concern
19
over climate change also may result in more regional, federal, and/or global legal and regulatory requirements to reduce or mitigate the effects of greenhouse gases, as well as more stringent regulation of water rights. In the event that such regulation is enacted and is more aggressive than the sustainability measures that we are currently undertaking to monitor our emissions, improve our energy efficiency, and reduce and reuse water, we may experience significant increases in our costs of operation and delivery.
Deterioration of general economic conditions could harm our business and results of operations.
Our business and results of operations may be adversely affected by changes in national or global economic conditions, including interest rates, access to capital markets, consumer spending rates, energy availability and costs (including fuel surcharges), and the effects of governmental initiatives to manage economic conditions.
Volatility in financial markets and deterioration of national and global economic conditions could impact our business and operations in a variety of ways, including as follows:
|
· |
decreased demand in the restaurant business, particularly fast food and casual dining, which may adversely affect our business; |
|
· |
volatility in commodity and other input costs could substantially impact our result of operations; |
|
· |
volatility in the financial markets or interest rates could substantially impact our pension costs and required pension contributions; |
|
· |
it may become more costly or difficult to obtain debt or equity financing to fund operations or investment opportunities, or to refinance our debt in the future, in each case on terms and within a time period acceptable to us; and |
|
· |
it may become more costly to access funds internationally. |
Impairment in the carrying value of goodwill or other intangibles could result in the incurrence of impairment charges and negatively impact our net worth.
As of May 28, 2017, we had goodwill of $133.0 million and other intangibles of $37.2 million. The net carrying value of goodwill represents the fair value of acquired businesses in excess of identifiable assets and liabilities as of the acquisition date (or subsequent impairment date, if applicable). The net carrying value of other intangibles represents the fair value of trademarks, customer relationships and other acquired intangibles as of the acquisition date (or subsequent impairment date, if applicable), net of accumulated amortization. Goodwill and other acquired intangibles expected to contribute indefinitely to our cash flows are not amortized, but must be evaluated by management at least annually for impairment. Amortized intangible assets are evaluated for impairment whenever events or changes in circumstance indicate that the carrying amounts of these assets may not be recoverable. Impairments to goodwill and other intangible assets may be caused by factors outside our control, such as increasing competitive pricing pressures, lower than expected revenue and profit growth rates, changes in industry earnings before interest, depreciation and amortization (“EBITDA”) multiples, changes in discount rates based on changes in cost of capital (interest rates, etc.), or the bankruptcy of a significant customer and could result in the incurrence of impairment charges and negatively impact our net worth.
20
Risks Relating to our Recent Spinoff
We may be unable to achieve some or all of the benefits that we expect to achieve from the spinoff. We have incurred additional expenses to create the corporate infrastructure necessary to operate as an independent public company, and we will experience increased ongoing costs in connection with being an independent public company.
We believe that, as an independent public company, we are able to, among other matters, better focus our resources on our specific business, long-term opportunities and growth strategies, design and implement corporate strategies and policies targeted to our operational focus and strategic priorities, and implement and maintain a capital structure and financial policy designed to meet our specific needs. However, we may be unable to achieve some or all of these benefits. In addition, in connection with the spinoff, we have incurred transaction and related costs of approximately $31.8 million ($26.5 million in fiscal 2017 and $5.3 million in fiscal 2016), which are not considered part of our ongoing operations. We expect to incur additional ongoing costs related to operating as an independent public company and replacing the services previously provided by Conagra.
Prior to the spinoff, our business used Conagra’s corporate infrastructure and services to support our business functions. The expenses related to establishing and maintaining this infrastructure were spread across all of Conagra’s businesses and charged to us on a cost-allocation basis. Except for certain services provided to us on a transitional basis pursuant to a transition services agreement, we no longer have access to Conagra’s infrastructure or services, and we must establish our own. The services historically provided to us by Conagra have included treasury and cash management, procurement, information technology, general accounting and finance, payroll and human resources, legal and communications, real estate and facilities, and other general and administrative stewardship. We cannot assure you that all these functions will be successfully executed by Conagra during the transition period or that we will not have to expend significant efforts or costs materially in excess of those estimated in the transition services agreement. Any interruption in these services could have a material adverse effect on our financial condition, results of operations, or cash flows. In addition, at the end of this transition period, we will need to perform these functions ourselves or hire third parties to perform these functions on our behalf.
If we are unable to achieve some or all of the benefits that we expect to achieve as an independent company, do not achieve them in the time we expect, or incur significant unanticipated costs related to operating as an independent company, our business, financial condition, results of operations, or cash flows could be materially and adversely affected.
We have a limited operating history as an independent public company, and our historical financial information is not necessarily indicative of our future financial condition, results of operations, or cash flows nor do they reflect what our financial condition, results of operations or cash flows would have been as an independent public company during the periods presented.
Our historical financial statements do not necessarily reflect what our financial condition, results of operations, or cash flows would have been as an independent public company during the periods presented and is not necessarily indicative of our future financial condition, results of operations, or cash flows. This is primarily a result of the following factors:
|
· |
our historical combined financial results reflect allocations of expenses for services historically provided by Conagra, and may not fully reflect the increased costs associated with being an independent public company, including significant changes in our cost structure, management, financing arrangements, and business operations as a result of our spinoff from Conagra; |
|
· |
our working capital requirements and capital expenditures historically have been satisfied as part of Conagra’s corporate-wide capital access, capital allocation, and cash management programs; our debt structure and cost of debt and other capital is significantly different from that reflected in our historical combined financial statements; and |
21
|
· |
the historical combined financial information may not fully reflect the effects of certain liabilities that were incurred or assumed by us and may not fully reflect the effects of certain assets that were transferred to, and liabilities that were assumed by, Conagra. |
If the spinoff is taxable to Conagra as a result of a breach by us of any covenant or representation made by us in the tax matters agreement, we will generally be required to indemnify Conagra; the obligation to make a payment on this indemnification obligation could have a material adverse effect on us.
It was intended that the spinoff, together with certain related transactions, would qualify as a tax-free “reorganization” within the meaning of Section 368(a)(1)(D) of the Internal Revenue Code of 1986, as amended (“Code”) and a tax-free distribution within the meaning of Section 355 of the Code. In connection with the spinoff, Conagra received an opinion of tax counsel to the effect that those transactions will qualify for their intended tax treatment. However, an opinion of tax counsel does not preclude the Internal Revenue Service (“IRS”) or the courts from adopting a contrary position. The tax opinion relied on certain representations, covenants, and assumptions, including those relating to our and Conagra’s past and future conduct; if any of those representations, covenants or assumptions is inaccurate, the tax consequences of the spinoff could differ from the intended tax treatment. If the spinoff and/or certain related transactions fail to qualify for tax-free treatment, for any reason, Conagra and/or holders of its common stock would be subject to tax as a result of the spinoff and certain related transactions.
If the spinoff and/or the related transactions are not treated as tax-free transactions or are taxable to Conagra due to a breach by us (or any of our subsidiaries) of any covenant or representation made by us in the tax matters agreement, we will generally be required to indemnify Conagra for all tax-related losses suffered by Conagra in connection with the spinoff. In addition, we will not control the resolution of any tax contest relating to taxes suffered by Conagra in connection with the spinoff, and we may not control the resolution of tax contests relating to any other taxes for which we may ultimately have an indemnity obligation under a tax matters agreement. In the event that Conagra suffers tax-related losses in connection with the spinoff that must be indemnified by us under the tax matters agreement, the indemnification liability could have a material adverse effect on us.
We are subject to significant restrictions under the tax matters agreement.
In connection with the spinoff, we entered into a tax matters agreement with Conagra. The tax matters agreement generally prohibits us, during the two-year period following the spinoff, from taking certain actions that could cause the spinoff and certain related transactions to fail to qualify as tax-free transactions. These restrictions include:
|
· |
we may not cause or permit certain business combinations or transactions to occur; |
|
· |
we may not discontinue the active conduct of our business (within the meaning of Section 355(b)(2) of the Code); |
|
· |
we may not sell or otherwise issue our common stock, other than pursuant to issuances that satisfy certain regulatory safe harbors set forth in Treasury regulations related to stock issued to employees and retirement plans; |
|
· |
we may not redeem or otherwise acquire any of our common stock, other than pursuant to certain open-market repurchases of less than 20% of our common stock (in the aggregate); and |
|
· |
we may not amend our certificate of incorporation (or other organizational documents) or take any other action, whether through a stockholder vote or otherwise, affecting the voting rights of our common stock. |
22
In addition, during the five-year period following the spinoff, we may not retire, repurchase, or significantly modify our senior notes. Further, more generally, we may not take any action that could reasonably be expected to cause the spinoff and certain related transactions to fail to qualify as tax-free transactions under Section 368(a)(1)(D) and Section 355 of the Code. If we take any of the actions above and the actions result in tax-related losses to Conagra, we generally will be required to indemnify Conagra for such tax-related losses under the tax matters agreement. Due to these restrictions and indemnification obligations under the tax matters agreement, we may be limited in our ability to pursue strategic transactions, equity or convertible debt financings or other transactions that may otherwise be in our best interests. Also, our potential indemnity obligation to Conagra might discourage, delay or prevent a change of control that our stockholders may consider favorable.
We are subject to continuing contingent liabilities following the spinoff, including potential indemnification liabilities to Conagra, and these liabilities could materially and adversely affect our business, financial condition, results of operations, and cash flows.
In connection with the spinoff, we entered into a separation and distribution agreement with Conagra that provides for, among other things, the principal corporate transactions required to effect the spinoff, certain conditions to the spinoff, and provisions governing the relationship between our company and Conagra with respect to and resulting from the spinoff. Among other things, the separation and distribution agreement provides for indemnification obligations designed to make us financially responsible for substantially all liabilities that may exist relating to the Lamb Weston business, whether incurred prior to or after the spinoff, and whether known or unknown at the time of the spinoff, as well as those obligations of Conagra assumed by us pursuant to the separation and distribution agreement. If we are required to indemnify Conagra under the circumstances set forth in the separation and distribution agreement, or meaningful unknown liabilities surface, we may be subject to substantial liabilities.
In addition, under the Code and applicable Treasury regulations, each corporation that was a member of the Conagra consolidated tax reporting group during any taxable period or portion of any taxable period ending on or before the completion of the spinoff is jointly and severally liable for the federal income tax liability of the entire Conagra consolidated tax reporting group for that taxable period. Similar rules may apply for state, local, and non-U.S. tax purposes. In addition, the tax matters agreement with Conagra allocates the responsibility for prior period taxes of any Conagra consolidated, combined, unitary or other tax reporting group between us and Conagra. However, if Conagra is unable to pay any prior period taxes for which it is responsible under the tax matters agreement, we could be required to pay the entire amount of those taxes, which could materially and adversely affect our business, financial condition, results of operations, and cash flows.
In connection with the Separation, Conagra will indemnify us for certain liabilities. However, there can be no assurance that the indemnity will be sufficient to insure us against the full amount of such liabilities, or that Conagra’s ability to satisfy its indemnification obligations will not be impaired in the future.
Pursuant to the separation and distribution agreement, Conagra agreed to indemnify us for certain liabilities. However, third parties could seek to hold us responsible for any of the liabilities that Conagra has agreed to retain, and there can be no assurance that the indemnity from Conagra will be sufficient to protect us against the full amount of those liabilities, or that Conagra will be able to fully satisfy its indemnification obligations. Moreover, even if we ultimately succeed in recovering from Conagra any amounts for which we are held liable, we may be temporarily required to bear these losses ourselves. If Conagra is unable to satisfy its indemnification obligations, the underlying liabilities could have a material adverse effect on our business, financial condition, results of operations, or cash flows.
Further, Conagra’s insurers may deny coverage to us for liabilities associated with occurrences prior to the spinoff. Even if we ultimately succeed in recovering from such insurance providers, we may be required to temporarily bear such loss of coverage.
23
ITEM 1B. UNRESOLVED STAFF COMMENTS
Not applicable.
We are headquartered in Eagle, Idaho and at May 28, 2017, we own and lease operating plants, office and support facilities, and farms in the following locations:
|
Location |
|
Type of Facility |
|
Number of Facilities |
|
Owned/ Leased |
|
|
|
|
|
|
|
|
|
Domestic: |
|
|
|
|
|
|
|
American Falls, ID |
|
Plant |
|
1 |
|
Owned (1) |
|
Boardman, OR |
|
Plant |
|
3 |
|
Owned (3) |
|
Boise, ID |
|
Office/Support Facility |
|
1 |
|
Leased (1) |
|
Connell, WA |
|
Plant |
|
1 |
|
Owned (1) |
|
Delhi, LA |
|
Plant |
|
1 |
|
Owned (1) |
|
Eagle, ID |
|
Office/Support Facility |
|
1 |
|
Leased (1) |
|
Hermiston, OR |
|
Plant |
|
1 |
|
Owned (1) |
|
Hong Kong, China |
|
Office/Support Facility |
|
1 |
|
Leased (1) |
|
Kennewick, WA |
|
Office/Support Facility |
|
8 |
|
Owned (1), Leased (7) |
|
Mexico City, Mexico |
|
Office/Support Facility |
|
1 |
|
Leased (1) |
|
Naperville, IL |
|
Office/Support Facility |
|
1 |
|
Leased (1) |
|
Pasco, WA |
|
Plant |
|
2 |
|
Owned (2) |
|
Paterson, WA |
|
Plant, Office/Support Facility, Farm |
|
6 |
|
Owned (1), Leased (5) |
|
Quincy, WA |
|
Plant |
|
1 |
|
Owned (1) |
|
Richland, WA |
|
Plant, Office/Support Facility |
|
3 |
|
Owned (3) |
|
Twin Falls, ID |
|
Plant |
|
1 |
|
Owned (1) |
|
|
|
|
|
|
|
|
|
International: |
|
|
|
|
|
|
|
Beijing, China |
|
Office/Support Facility |
|
1 |
|
Leased (1) |
|
Shangdu, China |
|
Plant, Farm |
|
2 |
|
Owned (1), Leased (1) |
|
Shanghai, China |
|
Office/Support Facility |
|
1 |
|
Leased (1) |
|
Singapore |
|
Office/Support Facility |
|
1 |
|
Leased (1) |
|
Taber, Canada |
|
Plant |
|
1 |
|
Owned (1) |
|
Tokyo, Japan |
|
Office/Support Facility |
|
1 |
|
Leased (1) |
We use our farms as a source of raw materials, to better understand the costs of growing potatoes, and to deploy agronomic research. Our facilities vary in age and condition, and each of them has an active maintenance program to ensure a safe operating environment and to keep the facilities in good condition. All our buildings are in satisfactory operating condition to conduct our business as intended.
Our manufacturing assets are shared across all reporting segments. Therefore, we do not identify or allocate assets by operating segment. For more information, see Note 14, Segments, of the Notes to Combined and Consolidated Financial Statements in “Part II, Item 8. Financial Statements and Supplementary Data” of this Form 10-K.
In addition to the facilities noted above, our joint ventures own or lease warehouses and distribution facilities in Canada, China, the Netherlands, and the United States.
24
For information regarding our legal proceedings, see Note 15, Commitments, Contingencies, Guarantees, and Legal Proceedings, of the Notes to Combined and Consolidated Financial Statements in “Part II, Item 8. Financial Statements and Supplementary Data" of this Form 10-K.
ITEM 4. MINE SAFETY DISCLOSURES
None.
ITEM 5. MARKET FOR REGISTRANT’S COMMON EQUITY, RELATED STOCKHOLDER MATTERS AND ISSUER PURCHASES OF EQUITY SECURITIES
Our common stock is listed on the NYSE under the ticker symbol “LW.” At July 17, 2017, there were 14,058 holders of record of our common stock. Information regarding the market price of our common stock and dividends declared since the Separation is included in Note 16, Quarterly Financial Data (Unaudited), of the Notes to Combined and Consolidated Financial Statements in “Part II, Item 8. Financial Statements and Supplementary Data" of this Form 10-K.
Dividend Policy
We expect to continue to pay regular cash dividends, although there is no assurance as to the timing or level of future dividend payments. The declaration of dividends is subject to the discretion of our Board of Directors and depends on various factors, including our net earnings, capital requirements, financial condition, future prospects and other factors that our Board of Directors deems relevant to its analysis and decision making.
Purchases of Equity Securities by the Issuer
The following table presents information related to our repurchases of common stock made during the thirteen weeks ended May 28, 2017:
|
|
|
|
|
|
|
|
|
Total Number of |
|
Approximate Dollar |
||
|
|
|
Total Number |
|
Average |
|
Shares |
|
Value of Maximum |
||||
|
|
|
of Shares (or |
|
Price Paid |
|
Purchased as Part of |
|
Number of Shares that |
||||
|
|
|
units) |
|
per Share |
|
Publicly Announced |
|
May Yet be Purchased |
||||
|
Period |
|
Purchased (a) |
|
(or unit) |
|
Plans or Programs |
|
Under the Program |
||||
|
February 27, 2017 through March 26, 2017 |
|
|
— |
|
|
— |
|
|
— |
|
|
— |
|
March 27, 2017 through April 23, 2017 |
|
|
— |
|
|
— |
|
|
— |
|
|
— |
|
April 24, 2017 through May 28, 2017 |
|
|
2,357 |
|
|
42.20 |
|
|
— |
|
|
— |
|
Total |
|
|
2,357 |
|
$ |
42.20 |
|
|
— |
|
|
— |
|
(a) |
We issue restricted stock units (“RSUs”) as part of our equity incentive plans. In our combined and consolidated financial statements, we treat shares of common stock withheld for tax purposes on behalf of our employees in connection with the vesting of RSUs as common stock repurchases because they reduce the number of shares that would have been issued upon vesting. |
Performance Graph
The following graph and table compares the cumulative total return on our common stock with the cumulative total return of the Standard & Poor’s (“S&P”) 400 Midcap Index and the S&P Packaged Food Index, which we consider to be our peer group. This graph covers the period from November 10, 2016 (the first day our common stock began trading
25
on NYSE) through May 26, 2017 (the last trading day of our fiscal year). The graph and table assume that $100 was invested in our common stock, the S&P 400 Midcap Index, and the S&P Packaged Food Index on November 10, 2016, and that all dividends were reinvested.
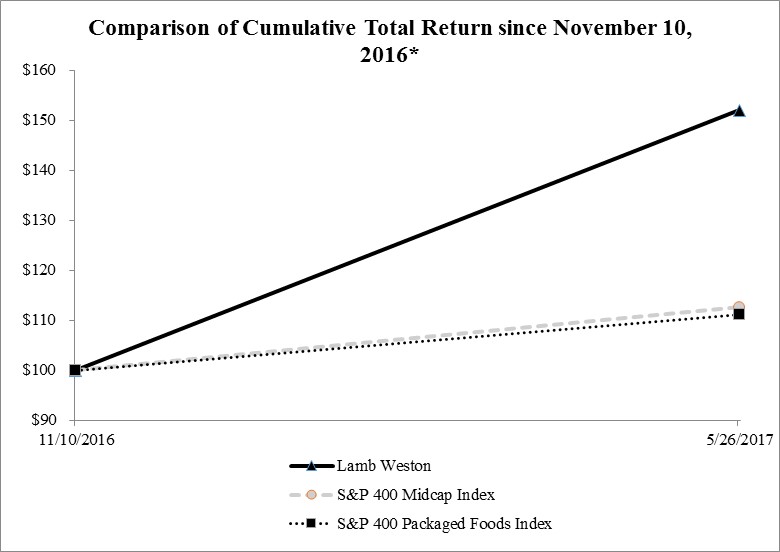
|
|
|
November 10, |
|
May 28, |
||
|
|
|
2016 |
|
2017 |
||
|
Lamb Weston |
|
$ |
100.00 |
|
$ |
151.99 |
|
S&P 400 Midcap Index |
|
$ |
100.00 |
|
$ |
112.44 |
|
S&P Packaged Food Index |
|
$ |
100.00 |
|
$ |
111.15 |
The above performance graph and other information furnished under this Part II, Item 5 of this Form 10-K shall not be deemed to be “soliciting material” or to be “filed” with the SEC or subject to Regulation 14A or 14C, or to the provisions of Section 18 of the Securities Exchange Act of 1934.
26
ITEM 6. SELECTED FINANCIAL DATA
The following table sets forth selected historical financial data of Lamb Weston (dollars in millions, except per share data). The information contained in the table should be read in conjunction with the disclosures in "Part II, Item 7. Management’s Discussion and Analysis of Financial Condition and Results of Operations" and "Part II, Item 8. Financial Statements and Supplementary Data" of this Form 10-K.
|
|
|
|
|
|
|
|
|
|
|
|
|
|
|
(unaudited) |
|
|
For the Fiscal Years Ended May |
|
2017 |
|
2016 |
|
2015 |
|
2014 |
|
2013 |
|||||
|
Statement of Earnings Data: |
|
|
|
|
|
|
|
|
|
|
|
|
|
|
|
|
Net sales |
|
$ |
3,168.0 |
|
$ |
2,993.8 |
|
$ |
2,925.0 |
|
$ |
2,815.2 |
|
$ |
2,778.4 |
|
Income from operations |
|
|
518.3 |
|
|
373.3 |
|
|
381.4 |
|
|
363.7 |
|
|
428.8 |
|
Income before income taxes and equity method earnings |
|
|
457.1 |
|
|
367.4 |
|
|
375.3 |
|
|
358.4 |
|
|
423.5 |
|
Equity method investment earnings |
|
|
53.3 |
|
|
71.7 |
|
|
42.7 |
|
|
29.6 |
|
|
35.7 |
|
Income tax expense |
|
|
170.2 |
|
|
144.5 |
|
|
140.4 |
|
|
117.7 |
|
|
151.9 |
|
Net income attributable to Lamb Weston Holdings, Inc. |
|
|
326.9 |
|
|
285.3 |
|
|
268.3 |
|
|
260.9 |
|
|
298.3 |
|
Earnings per share (a) |
|
|
|
|
|
|
|
|
|
|
|
|
|
|
|
|
Basic |
|
|
2.22 |
|
|
1.92 |
|
|
1.83 |
|
|
1.77 |
|
|
2.03 |
|
Diluted |
|
|
2.22 |
|
|
1.92 |
|
|
1.83 |
|
|
1.77 |
|
|
2.03 |
|
Dividends declared per common share |
|
|
0.375 |
|
|
N/A |
|
|
N/A |
|
|
N/A |
|
|
N/A |
|
Balance Sheet Data: |
|
|
|
|
|
|
|
|
|
|
|
|
|
|
|
|
Total assets |
|
|
2,485.6 |
|
|
2,158.3 |
|
|
2,055.9 |
|
|
1,930.0 |
|
|
1,866.5 |
|
Long-term debt, excluding current portion |
|
|
2,365.0 |
|
|
104.6 |
|
|
86.5 |
|
|
124.3 |
|
|
120.5 |
|
Non-GAAP Financial Information: (b) |
|
|
|
|
|
|
|
|
|
|
|
|
|
|
|
|
EBITDA |
|
|
664.9 |
|
|
531.6 |
|
|
511.2 |
|
|
463.1 |
|
|
533.4 |
|
Adjusted EBITDA including unconsolidated joint ventures (c) |
|
|
707.1 |
|
|
593.4 |
|
|
526.1 |
|
|
502.5 |
|
|
560.0 |
|
(a) |
Earnings per share prior to the Separation in fiscal 2017 was calculated based on 146 million shares of Lamb Weston common stock that were distributed to Conagra shareholders on November 9, 2016. |
|
(b) |
EBITDA and Adjusted EBITDA including unconsolidated joint ventures are non-GAAP financial measures. See the discussion of non-GAAP financial measures and the reconciliations under “Item 7. Management’s Discussion and Analysis of Financial Condition and Results of Operations – Reconciliations of Non-GAAP Financial Measures to Reported Amounts” of this Form 10-K. |
|
(c) |
Adjusted EBITDA including unconsolidated joint ventures includes comparability items which are not considered part of our ongoing operations. For more information on these costs see “Item 7. Management’s Discussion and Analysis of Financial Condition and Results of Operations” of this Form 10-K. |
ITEM 7. MANAGEMENT’S DISCUSSION AND ANALYSIS OF FINANCIAL CONDITION AND RESULTS OF OPERATIONS
The following discussion and analysis is intended to provide a summary of significant factors relevant to our financial performance and condition. The discussion and analysis should be read together with our combined and consolidated financial statements and related notes in “Part II, Item 8. Financial Statements and Supplementary Data" of this Form 10-K. Results for the fiscal year ended May 28, 2017 are not necessarily indicative of results that may be attained in the future.
27
Overview
Lamb Weston, along with its joint venture partners, is a leading global producer, distributor, and marketer of value-added frozen potato products and is headquartered in Eagle, Idaho. We are the number one supplier of value-added frozen potato products in North America – the largest market for frozen potato products in the world. We are also a leading supplier of value-added frozen potato products internationally, with a strong and growing presence in high-growth emerging markets. We offer a broad product portfolio to a diverse channel and customer base in over 100 countries. French fries represent the majority of our value-added frozen potato product portfolio.
Unless otherwise expressly stated or the context otherwise requires, references to “we,” “our,” “us,” “the Company” and “Lamb Weston” refer to Lamb Weston Holdings, Inc. and its consolidated subsidiaries or, in the case of information as of dates or for periods prior to the Separation, the combined and consolidated entities of the Lamb Weston business of Conagra and certain other assets and liabilities that had been historically held at the Conagra corporate level but were specifically identifiable and attributable to the Lamb Weston business.
Management’s discussion and analysis of our results of operations and financial condition, which we refer to in this filing as “MD&A,” is provided as a supplement to the combined and consolidated financial statements and related notes included elsewhere in this Form 10-K to help provide an understanding of our financial condition, changes in financial condition and results of our operations. Our MD&A is based on financial data derived from the financial statements prepared in accordance with U.S. generally accepted accounting principles (“GAAP”) and certain other financial data (Adjusted EBITDA including unconsolidated joint ventures) that is prepared using non-GAAP measures.
Lamb Weston’s management uses Adjusted EBITDA including unconsolidated joint ventures and pro forma Adjusted EBITDA including unconsolidated joint ventures to evaluate the Company’s performance excluding the impact of certain non-cash charges and other special items in order to have comparable financial results to analyze changes in our underlying business between reporting periods. The Company includes this non-GAAP financial measure because management believes it is useful to investors in that it provides for greater transparency with respect to supplemental information used by management in its financial and operational decision making. We believe that the presentation of this non-GAAP financial measure, when used in conjunction with GAAP financial measures, is a useful financial analysis tool that can assist investors in assessing the Company’s operating performance and underlying prospects. Adjusted EBITDA including unconsolidated joint ventures should not be considered a substitute for net income. See “Reconciliations of Non-GAAP Financial Measures to Reported Amounts” below for the definition of Adjusted EBITDA including unconsolidated joint ventures and a reconciliation of this non-GAAP financial measure to net income.
Separation from Conagra
On November 9, 2016, we separated from Conagra and became an independent publicly traded company through the pro rata distribution by Conagra of 100% of our outstanding common stock to Conagra stockholders. Each Conagra stockholder of record on November 1, 2016 received one share of our common stock for every three shares of Conagra common stock held on the record date. As a result, approximately 146 million shares of our common stock were distributed on November 9, 2016, to Conagra stockholders. On November 10, 2016, our common stock began trading under the ticker symbol “LW” on the NYSE.
In connection with the Separation, we entered into a separation and distribution agreement and several other agreements with Conagra, including a transition services agreement, tax matters agreement, employee matters agreement, and trademark license agreement. These agreements govern the relationship between us and Conagra following the Separation and provide for the allocation of various assets, liabilities, rights and obligations. These agreements also include arrangements for transition services to be provided by Conagra to Lamb Weston. For a discussion of these agreements, see the section entitled “Relationship with ConAgra After the Spinoff” in the Form 10 and Note 3, Related Party Transactions, of the Notes to Combined Consolidated Financial Statements in “Part II, Item 8. Financial Statements and Supplementary Data” in this Form 10-K.
28
In connection with the Separation, Conagra transferred substantially all of the assets and liabilities and operations of the Lamb Weston business to us. Combined financial statements prior to the Separation were prepared on a stand-alone basis and were derived from Conagra’s consolidated financial statements and accounting records. The combined financial statements contained in this report reflect our financial position, results of operations, comprehensive income and cash flows as our business was operated as part of Conagra prior to the Separation and an allocation of a portion of Conagra’s shared corporate general and administrative expenses. Following the Separation, our consolidated financial statements include the accounts of Lamb Weston Holdings, Inc. and its wholly owned subsidiaries. The combined financial position, results of operations, and cash flows as of dates and for periods prior to the Separation may not be indicative of what our financial position, results of operations, and cash flows would have been as a separate stand-alone public company during the periods presented, nor are they indicative of what our financial position, results of operations, and cash flows may be in the future. Information related to the Separation and its effect on our financial statements are discussed throughout this Form 10‑K.
Executive Summary
Fiscal 2017 net sales increased 6% to $3,168.0 million, compared with $2,993.8 million in the prior year. Income from operations increased 39% to $518.3 million, compared with $373.3 million in the prior year. Net income attributable to Lamb Weston increased 15% to $326.9 million, or $2.22 per diluted share, in fiscal 2017, compared with $285.3 million of net income, or $1.92 per diluted share, in fiscal 2016.
Fiscal 2017 included $26.5 million ($16.7 million after-tax) of expense for costs (primarily professional fees) related to the Separation and a $3.1 million ($2.0 million after-tax) non-cash gain on assets. In fiscal 2016, we recognized $5.3 million ($3.3 million after-tax) of expenses for costs related to the Separation and $59.5 million ($37.5 million after-tax) of non-cash charges reflecting Lamb Weston’s portion of the actuarial losses in excess of 10% of Conagra’s pension liability for Conagra sponsored plans. In addition, fiscal 2016 included a $17.7 million non-cash gain ($13.3 million after-tax) related to the settlement of a pension plan of our Lamb-Weston/Meijer joint venture.
Excluding these comparability items, net income increased 9% to $341.6 million, or $2.32 per diluted share, in fiscal 2017, compared with fiscal 2016. The increase is primarily due to higher income from operations, driven by favorable year-over-year price/mix, volume growth and supply chain efficiency savings. The increase was partially offset by higher interest expense as well as higher selling, general and administrative expenses related to incremental costs incurred as a stand-alone public company and higher incentive compensation costs attributable to our operating performance.
Adjusted EBITDA including unconsolidated joint ventures in fiscal 2017 was $707.1 million, a 19% increase compared with fiscal 2016. The increase in Adjusted EBITDA including unconsolidated joint ventures was driven by growth in income from operations.
Demand for frozen potato products continues to grow around the world. We expect to meet the increase in demand by investing in additional capacity. We began operating a new line in Boardman, Oregon during the third quarter of fiscal 2017, and we expect to begin operating a new line in Richland, Washington during the second quarter of fiscal 2018. Additionally, through our Lamb-Weston/Meijer joint venture, we recently expanded capacity in our facility at Bergen op Zoom, the Netherlands, and are participating in a joint venture that is constructing a new production facility in Lipetsk, a special economic zone in south Moscow, the Russian Federation. We expect the Lipetsk plant to be operational in the second half of fiscal 2018. In June 2017, our Lamb-Weston/Meijer joint venture also acquired the potato processing business of Oerlemans Foods, which included a potato processing facility located in Broekhuizenvorst, the Netherlands.
29
Markets
We operate in the global value-added frozen potato products industry, with the majority of our sales derived from products sold to customers in North America, and the remainder sold to customers primarily in Europe, Asia, Latin America, and the Middle East.
In general, demand for frozen potato products grew steadily in fiscal 2017. In North America, volume demand growth was driven by quick service restaurant chains (“QSRs”) and casual dining restaurant chains expanding potato product offerings through both innovation and increased focus on certain eating occasions, namely breakfast. Internationally, demand growth was driven by increased access to consumers through continued expansion in these markets by both North America-based QSRs, local QSRs, and restaurant chains. In addition, in emerging markets, demand growth was driven by increased affordability due to higher per capita incomes and increased appeal of Western-style food offerings and diets.
In this environment of growing volume demand, the excess available capacity to produce frozen potato products tightened in fiscal 2017, especially in North America, which has led to increased prices across the industry. A number of frozen potato product manufacturers, including Lamb Weston and Lamb-Weston/Meijer, have expanded, or are in the process of expanding production capacity.
Outlook
For fiscal 2018, we expect the operating environment to be generally favorable given the continued growth in volume demand and high industry manufacturing capacity utilization levels. A number of manufacturers have announced intentions to add production capacity over the next five years, largely in Europe, North America, and China, which is likely to ease the industry’s near-term production constraints. In addition, compared with fiscal 2017, we expect a higher rate of inflation for many of our commodity and input costs, as well as for packaging, edible oil, manufacturing, transportation, warehousing and other manufacturing costs. We also expect higher interest expense associated with our capital structure after the Separation and higher selling, general and administrative costs as a result of a full year of stand-alone public company costs.
Results of Operations
We have four reportable segments: Global, Foodservice, Retail, and Other. For each period presented, we report net sales and product contribution margin by segment. Net sales and product contribution margin are the primary measures reported to our chief operating decision maker for purposes of allocating resources to our segments and assessing their performance. We define product contribution margin as net sales less cost of sales and advertising and promotion expenses. For additional information on our reportable segments, see Note 14, Segments, of the Notes to Combined and Consolidated Financial Statements in “Part II, Item 8. Financial Statements and Supplementary Data” in this Form 10-K.
30
Fiscal Year Ended May 28, 2017 compared to Fiscal Year Ended May 29, 2016
Net Sales and Product Contribution Margin
(dollars in millions)
|
|
|
For the Fiscal Years Ended May |
||||||||||||||
|
|
|
Net Sales |
|
Product Contribution Margin |
||||||||||||
|
|
|
2017 |
|
2016 |
|
Inc/(Dec) |
|
2017 |
|
2016 |
|
Inc/(Dec) |
||||
|
Global |
|
$ |
1,624.8 |
|
$ |
1,549.4 |
|
5% |
|
$ |
343.0 |
|
$ |
296.5 |
|
16% |
|
Foodservice |
|
|
1,030.0 |
|
|
946.0 |
|
9% |
|
|
333.1 |
|
|
254.7 |
|
31% |
|
Retail |
|
|
384.9 |
|
|
372.1 |
|
3% |
|
|
78.3 |
|
|
69.6 |
|
13% |
|
Other |
|
|
128.3 |
|
|
126.3 |
|
2% |
|
|
9.5 |
|
|
21.0 |
|
(55%) |
|
Total |
|
$ |
3,168.0 |
|
$ |
2,993.8 |
|
6% |
|
$ |
763.9 |
|
$ |
641.8 |
|
19% |
Net Sales
Lamb Weston’s net sales for fiscal 2017 were $3,168.0 million, an increase of $174.2 million, or 6%, compared with fiscal 2016. Net sales in fiscal 2017 reflect a 4% increase in price/mix and volume growth of 2%, with growth across all business segments.
Global net sales increased $75.4 million, or 5%, to $1,624.8 million, compared with $1,549.4 million in fiscal 2016. Net sales in fiscal 2017 reflect a 4% increase in sales volume, driven by growth domestically, which included organic growth and new business with major restaurant chains, as well as growth in international markets. Additionally, net sales in fiscal 2017 reflect a 1% increase in price/mix associated with price increases in both domestic and international markets, as well as actions to improve customer and product mix.
Foodservice net sales increased $84.0 million, or 9%, to $1,030.0 million, compared with $946.0 million in fiscal 2016. Net sales in fiscal 2017 reflect an 8% increase related to favorable pricing, as well as actions to improve customer and product mix. Sales volume increased 1%, which related to growth of small and mid-sized restaurant chain operators, as well as regional and independent food distributors.
Retail net sales increased $12.8 million, or 3%, to $384.9 million, compared with $372.1 million in fiscal 2016. Net sales in fiscal 2017 reflect a 2% increase related to favorable pricing and customer mix changes due to the increase of licensed brands and trade efficiencies. Sales volume increased 1%, primarily driven by growth of licensed and private label products.
Net sales in our Other segment increased $2.0 million, or 2%, to $128.3 million, compared with $126.3 million in fiscal 2016, primarily due to favorable product mix in our vegetable business.
Product Contribution Margin
Global product contribution margin increased $46.5 million, or 16%, to $343.0 million in fiscal 2017, as a result of favorable price/mix, supply chain efficiency savings, and volume growth. Global cost of sales was $1,276.0 million, or 2% higher in fiscal 2017, as compared to fiscal 2016, largely due to higher volume, partially offset by supply chain efficiency savings. Advertising and promotion spending was $1.1 million lower in 2017, as compared to fiscal 2016, driven by the timing of costs related to our global rebranding in fiscal 2016.
Foodservice product contribution margin increased $78.4 million, or 31%, to $333.1 million in fiscal 2017 as a result of favorable price/mix, supply chain efficiency savings, and volume growth. Cost of sales was $690.1 million, or
31
1% higher in fiscal 2017, as compared to fiscal 2016, largely due to higher volume, partially offset by supply chain efficiency savings. Advertising and promotion spending was $0.3 million lower in fiscal 2017, compared with fiscal 2016.
Retail product contribution margin increased $8.7 million, or 13%, to $78.3 million due to favorable price/mix. Cost of sales was $297.0 million, or 2% higher in fiscal 2017 as compared to fiscal 2016, largely due to higher volume and higher supply chain costs. Advertising and promotion spending was $1.7 million lower in fiscal 2017, compared with fiscal 2016, due to the timing of marketing and promotional spending.
Other product contribution margin decreased $11.5 million, or 55%, in fiscal 2017, due primarily to the unrealized mark-to-market expense adjustment related to our commodity option contracts and lower sales volumes.
Selling, General and Administrative Expenses
Selling, general and administrative expenses decreased $25.9 million, or 9%, in fiscal 2017 compared with fiscal 2016. Fiscal 2017 included $26.5 million ($16.7 million after-tax) of expenses for costs related to the Separation, primarily related to professional fees, and a $3.1 million ($2.0 million after-tax) non-cash gain on assets. Fiscal 2016 included $64.9 million ($45.3 million after-tax) of expenses, primarily comprised of $59.5 million of actuarial losses related to a pension liability and $5.3 million of costs related to the spinoff from Conagra. Excluding these costs for each fiscal year, and the non-cash gain on assets, in fiscal 2017, selling, general and administrative expenses increased $15.6 million, or 7%, versus the prior year largely due to incremental costs associated with being a stand-alone public company, as well as higher incentive compensation costs attributable to our operating performance.
Interest Expense, Net
Interest expense, net was $61.2 million in fiscal 2017, an increase of $55.3 million compared with fiscal 2016. The increase in interest expense, net was the result of the new debt incurred in connection with the Separation. For more information, see Note 9, Debt and Financing Obligations, of the Notes to Combined and Consolidated Financial Statements in “Part II, Item 8. Financial Statements and Supplementary Data” in this Form 10-K. For the period prior to the Separation, interest expense was included for only the legal entities that comprised the Lamb Weston business, and did not include any allocated interest expense from Conagra.
Income Taxes
Income tax expense for fiscal 2017 and 2016 was $170.2 million and $144.5 million, respectively. The effective tax rate (calculated as the ratio of income tax expense to pre-tax income, inclusive of equity method investment earnings) was approximately 33% for both fiscal 2017 and 2016. The effective tax rate varies from the U.S. federal statutory tax rate of 35% principally due to the impact of U.S. state taxes, the domestic manufacturers’ deduction, foreign taxes, and other permanent differences.
Equity Method Investment Earnings
We conduct meaningful business through unconsolidated joint ventures and include our share of the earnings based on our economic ownership interest in them. Lamb Weston’s share of earnings from its equity method investments was $53.3 million and $71.7 million for fiscal 2017 and 2016, respectively. Equity method investment earnings for fiscal 2017 were lower due to a $17.7 million non-cash gain related to the settlement of a pension plan of Lamb-Weston/Meijer in fiscal 2016. In fiscal 2017, the effect of higher raw potato costs in Europe were essentially offset by higher pricing and cost savings initiatives. For more information about our joint ventures, see Note 6, Investments in Joint Ventures, of the Notes to Combined and Consolidated Financial Statements in “Part II, Item 8. Financial Statements and Supplementary Data” in this Form 10-K.
32
Fiscal Year Ended May 29, 2016 compared to Fiscal Year Ended May 31, 2015
Net Sales and Product Contribution Margin
|
|
|
For the Fiscal Years Ended May |
||||||||||||||
|
|
|
Net Sales |
|
Product Contribution Margin |
||||||||||||
|
|
|
2016 |
|
2015 |
|
Inc/(Dec) |
|
2016 |
|
2015 |
|
Inc/(Dec) |
||||
|
Global |
|
$ |
1,549.4 |
|
$ |
1,512.9 |
|
2% |
|
$ |
296.5 |
|
$ |
253.7 |
|
17% |
|
Foodservice |
|
|
946.0 |
|
|
929.0 |
|
2% |
|
|
254.7 |
|
|
246.0 |
|
4% |
|
Retail |
|
|
372.1 |
|
|
355.6 |
|
5% |
|
|
69.6 |
|
|
47.6 |
|
46% |
|
Other |
|
|
126.3 |
|
|
127.5 |
|
(1%) |
|
|
21.0 |
|
|
20.6 |
|
2% |
|
Total |
|
$ |
2,993.8 |
|
$ |
2,925.0 |
|
2% |
|
$ |
641.8 |
|
$ |
567.9 |
|
13% |
Lamb Weston’s net sales for fiscal 2016 were $2,993.8 million, an increase of $68.8 million, or 2%, compared to fiscal 2015. Net sales in fiscal 2016 reflect 5% organic volume growth, which was partially offset by a decrease of 2% due to the inclusion of an additional week in fiscal 2015, and a 1% decrease in price/mix.
Global net sales increased $36.5 million, or 2%, in fiscal 2016, compared to fiscal 2015. Net sales in fiscal 2016 reflect a 6% increase in volume, driven by strong volume growth in our sales to international markets due to the impact of a West Coast port labor dispute in the prior fiscal year, the full-year impact of fiscal 2015 new business, additional new channel penetration in Mexico, and organic and ramp-up growth in China. The increase in volume was partially offset by a 2% sales decrease due to the inclusion of an additional week in fiscal 2015. In addition, price/mix declined 2%, primarily due to (i) negative mix impacts of lower Japan business, (ii) pricing concessions with a major customer in Japan to maintain our share, (iii) lower net sales prices on new chain business, and (iv) domestic price concessions in connection with strategic decisions to maintain exclusivity or increase share.
Foodservice net sales increased $17.0 million, or 2%, in fiscal 2016 as compared to fiscal 2015. Results for fiscal 2016 reflected 5% growth due to organic volume growth, largely due to increased demand for frozen potato products with our key distributors. The volume increase was partially offset by a decrease of 2% due to the inclusion of an additional week of sales in fiscal 2015, and a 1% decrease in price/mix.
Retail net sales increased $16.5 million, or 5%, in fiscal 2016 as compared to fiscal 2015. Results for fiscal 2016 reflected 7% growth due to increased volume and pricing in our branded and private label portfolios. The increase was partially offset by a decrease of 2% due to the inclusion of an additional week in fiscal 2015.
Other net sales decreased $1.2 million, or 1%, in fiscal 2016 as compared to fiscal 2015. Results for fiscal 2016 primarily reflected a reduction due to the inclusion of an additional week of sales in fiscal 2015.
Product Contribution Margin
Global product contribution margin increased $42.8 million, or 17%, in fiscal 2016 as compared to fiscal 2015, as a result of favorable volume, lower commodity input, transportation, and conversion costs, as well as the impact of costs associated with a West Coast port labor dispute in fiscal 2015. Cost of goods sold was $8.8 million, or 1%, lower in fiscal 2016 as compared to fiscal 2015, driven by a decrease in commodity input, transportation, and conversion costs, partially offset by an increase from higher volume. Advertising and promotion spending was $2.4 million higher in fiscal 2016 as compared to fiscal 2015, driven by costs related to our global rebranding.
Foodservice product contribution margin increased $8.7 million, or 4%, in fiscal 2016 as compared to fiscal 2015, due to favorable volume, as well as lower commodity input, transportation, and conversion costs. Cost of goods sold was $6.2 million, or 1%, higher in fiscal 2016 as compared to fiscal 2015, driven by an increase from higher volume, partially
33
offset by a decrease in commodity input, transportation and conversion costs. Advertising and promotion spending was $2.1 million higher in fiscal 2016 as compared to fiscal 2015, driven by costs related to our global rebranding.
Retail product contribution margin increased $22.0 million, or 46%, in fiscal 2016 as compared to fiscal 2015, due to favorable volume and price/mix, as well as lower commodity input, transportation, and conversion costs. Cost of goods sold was $7.2 million, or 2%, lower in fiscal 2016 as compared to fiscal 2015, driven by a decrease in commodity input, transportation, and conversion costs, partially offset by an increase from higher volume. Advertising and promotion spending was $1.6 million higher in fiscal 2016 as compared to fiscal 2015, driven by additional marketing and promotional spending related to our Alexia brand.
Other product contribution margin increased $0.4 million, or 2%, in fiscal 2016 as compared to fiscal 2015, as the decrease in net sales was more than offset by a $1.5 million, or 1%, decrease in cost of goods sold.
Selling, General & Administrative Expenses
Selling, general and administrative expenses increased $88.2 million, or 43%, in fiscal 2016 compared with fiscal 2015. Fiscal 2016 included $64.9 million ($45.3 million after-tax) of expenses, primarily comprised of $59.5 million of actuarial losses of a pension liability and $5.3 million of costs related to the Separation. Fiscal 2015 included $0.7 million ($0.7 million after-tax) of expenses for costs related to the Separation, primarily related to professional fees. Excluding these costs for each fiscal year, in fiscal 2016, selling, general and administrative expenses increased $23.3 million, or 11%, largely due to an increase in the expense allocation from Conagra and higher incentive compensation as compared to the prior year.
Interest Expense, Net
Net interest expense was $5.9 million and $6.1 million for fiscal 2016 and 2015, respectively.
Income Taxes
Lamb Weston’s income tax expense was $144.5 million and $140.4 million in fiscal 2016 and 2015, respectively. The effective tax rate (calculated as the ratio of income tax expense to pre-tax income including equity method investment earnings) was 33% and 34% in fiscal 2016 and fiscal 2015, respectively. The effective tax rate varies from the U.S. federal statutory tax rate of 35% principally due to the impact of U.S. state taxes, the domestic manufacturers’ deduction, foreign taxes and other permanent differences.
Equity Method Investment Earnings
Equity method investment earnings were $71.7 million and $42.7 million in fiscal 2016 and 2015, respectively. Equity method investment earnings for fiscal 2016 included a gain of $17.7 million related to the settlement of a pension plan of Lamb-Weston/Meijer. Excluding this comparability item, the increase in fiscal 2016 compared to fiscal 2015 reflected higher profits for Lamb-Weston/Meijer.
Liquidity and Capital Resources
Prior to the Separation, transfers to and from Conagra’s cash management system were reflected in “Net transfers (to) from Conagra” on the Combined and Consolidated Statements of Cash Flows. Conagra funded our cash needs up to November 9, 2016, the date of the Separation (“Separation Date”). Our primary uses of cash are for operations, capital expenditures, cash dividends on our common stock and debt service. We believe that net cash generated from operating activities, cash on hand, available borrowings under our revolving credit facility, and available capital through access to capital markets will be adequate to meet our liquidity and capital requirements, including payment of any dividends declared for at least the next twelve months.
34
In fiscal 2017, we generated $456.3 million of operating cash flow and made $287.4 million of capital expenditures, which included expenditures for significant expansions at our Boardman, Oregon and Richland, Washington facilities. The Separation from Conagra left us with a significant amount of debt. Despite this, we paid $27.4 million of dividends and ended the year with $57.1 million of cash and cash equivalents and $493.7 million of aggregate liquidity from unused borrowing capacity under the revolving credit facility, net of letters of credit. At May 28, 2017 and May 29, 2016, we had $35.1 million and $33.6 million, respectively, of cash held in foreign subsidiaries, whose earnings are considered to be indefinitely reinvested. Repatriation of these funds to the United States would subject these funds to U.S. federal income taxes. Determination of the amount of unrecognized deferred tax liabilities related to investments in these foreign subsidiaries is not practicable.
Cash Flows
Below is a summary table of our cash flows, followed by a discussion of the sources and uses of cash through operating, investing, and financing activities (dollars in millions):
|
|
|
For the Fiscal Years Ended May |
|||||||
|
|
|
2017 |
|
2016 |
|
|
2015 |
||
|
Net cash flows provided by (used for): |
|
|
|
|
|
|
|
|
|
|
Operating activities |
|
$ |
446.9 |
|
$ |
382.3 |
|
$ |
353.7 |
|
Investing activities |
|
|
(285.3) |
|
|
(144.3) |
|
|
(171.2) |
|
Financing activities |
|
|
(142.0) |
|
|
(232.8) |
|
|
(177.7) |
|
|
|
|
19.6 |
|
|
5.2 |
|
|
4.8 |
|
Effect of exchange rate changes on cash and cash equivalents |
|
|
1.1 |
|
|
0.6 |
|
|
(1.2) |
|
Net increase (decrease) in cash and cash equivalents |
|
$ |
20.7 |
|
$ |
5.8 |
|
$ |
3.6 |
Operating Activities
Fiscal 2017 Compared with Fiscal 2016
The major components of cash provided by operations are earnings from operations adjusted for non-cash income and expense items and changes in working capital. Cash generated from operating activities increased $64.6 million to $446.9 million in fiscal 2017, compared with $382.3 million in fiscal 2016. Earnings from continuing operations, adjusted for non-cash income and expense and other items, increased $78.3 million due to favorable price/mix, supply chain efficiency savings, and volume growth. Cash provided by operating assets and liabilities decreased $13.7 million in fiscal 2017, compared with fiscal 2016. The decrease in cash provided by changes in operating assets and liabilities was driven primarily by more cash required for taxes based on operating performance, a build-up of inventory ahead of planned production outages to implement capital projects, and an increase in prepaid expenses and other current assets related to the timing of grower prepayments, partially offset by increases in accounts payable and accrued expenses, which related primarily to higher incentive compensation attributable to our operating performance.
Fiscal 2016 Compared with Fiscal 2015
Cash generated from operating activities totaled $382.3 million in fiscal 2016, as compared to $353.7 million generated in fiscal 2015. The increase in fiscal 2016, compared to fiscal 2015, was due, in part, to higher net income. Also, the increase in inventory balances during fiscal 2015 was greater than fiscal 2016, primarily due to lower volumes in international shipments due to the slowdown from the West Coast port labor dispute in fiscal 2015, as well as deflation in commodity inputs for fiscal 2016. Total dividends received from equity method investments in fiscal 2016 and 2015 were $37.9 million and $12.0 million, respectively.
35
Investing Activities
Fiscal 2017 Compared with Fiscal 2016
Investing activities used $285.3 million of cash in fiscal 2017, compared with $144.3 million in fiscal 2016. The increase related primarily to our plant capacity expansions at our Boardman, Oregon and Richland, Washington facilities in fiscal 2017. The chopped and formed production line in Boardman, Oregon started up in the third quarter of fiscal 2017, and we expect to have our French fry line in Richland, Washington operational by late calendar 2017.
We expect capital investments in fiscal 2018 to be approximately $225 million, excluding acquisitions. These expenditures could increase or decrease as a result of a number of factors, including our financial results, future economic conditions, and our regulatory compliance requirements. At May 28, 2017 we had commitments for capital expenditures of $81.7 million. We believe that cash-on-hand combined with cash flows from operations will be sufficient to fund these commitments.
The manufacturing assets of Lamb Weston are shared across all reporting segments. Output from these facilities used by each reporting segment can change from fiscal year to fiscal year. Therefore, it is impracticable to allocate those assets to the reporting segments, as well as disclose total assets by segment.
Fiscal 2016 Compared with Fiscal 2015
Investing activities used $144.3 million in fiscal 2016, compared to $171.2 million in fiscal 2015. Investing activities in fiscal 2016 consisted primarily of capital expenditures of $152.3 million. Investing activities in fiscal 2015 consisted primarily of capital expenditures of $114.7 million and the acquisition of a potato manufacturer in China totaling $74.9 million. Changes in capital expenditures are due to the nature and timing of significant plant expansions and improvements from year to year.
Financing Activities
Fiscal 2017 Compared with Fiscal 2016
During fiscal 2017, cash used for financing activities totaled $142.0 million, compared with $232.8 million during fiscal 2016. The year-over-year change in financing activities primarily related to the Separation in fiscal 2017, whereas in fiscal 2016, cash was primarily used for transfers to Conagra, as we were part of Conagra’s cash management system through the Separation Date. We had $38.8 million of net transfers to Conagra in fiscal 2017, compared with $236.8 million of net transfers in fiscal 2016.
In fiscal 2017, we issued $2,341.0 million of debt in connection with the Separation, of which $1,542.9 million of proceeds were distributed directly to Conagra (including $25.4 million that Conagra used to pay debt issuance costs) and are considered a noncash financing activity for Lamb Weston. We received $798.1 million of cash proceeds from the debt issuance. We used the $798.1 million of proceeds, together with borrowings on the revolving credit facility, to fund an $823.5 million cash payment to Conagra on the Separation Date. We paid $2.8 million of net short-term borrowings, $12.3 million of debt issuance costs and $27.4 million of dividends on our common stock. Cash distributions to noncontrolling interests were $12.2 million and $8.3 million in fiscal 2017 and 2016, respectively, and we made $23.8 million and $39.1 million of debt repayments in fiscal 2017 and 2016, respectively.
For more information about the debt issued in connection with the Separation, including among other items, interest rates, maturity dates, and covenants, see Note 9, Debt and Financing Obligations, of the Notes to the Combined and Consolidated Financial Statements in “Part II, Item 8. Financial Statements and Supplementary Data” of this Form 10-K. At May 28, 2017, we were in compliance with the financial covenant ratios and other covenants contained in the Credit Agreement.
36
Fiscal 2016 Compared with Fiscal 2015
Cash used for financing activities was $232.8 million in fiscal 2016, compared to $177.7 million in fiscal 2015. Financing activities in fiscal 2016 included the issuance of long-term debt totaling $30.0 million and the repayment of long-term debt totaling $39.1 million. Cash used for financing activities include net cash outflows from Lamb Weston to Conagra totaling $236.8 million for fiscal 2016. Cash distributions paid to the noncontrolling interest of Lamb Weston BSW were $8.3 million, and there were net issuances of short-term borrowings totaling $21.4 million.
Off-Balance Sheet Arrangements
We do not have any off-balance sheet arrangements as of May 28, 2017 that are reasonably likely to have a current or future material effect on our financial condition, results of operations, liquidity, capital expenditures, or capital resources.
Investments in Joint Ventures
Lamb Weston has interests in certain entities that we have determined to be variable interest entities, but for which we are not the primary beneficiary. We do not consolidate the financial statements of these entities. For more information about our investments in joint ventures, see Note 6, Investments in Joint Ventures, of the Notes to the Combined and Consolidated Financial Statements in “Part II, Item 8. Financial Statements and Supplementary Data” of this Form 10-K.
Obligations and Commitments
As part of our ongoing operations, we enter into arrangements that obligate us to make future payments under contracts such as lease agreements, debt agreements, potato supply agreements, and unconditional purchase obligations (i.e., obligations to transfer funds in the future for fixed or minimum quantities of goods or services at fixed or minimum prices). The unconditional purchase obligation arrangements are entered into in the normal course of business in order to ensure adequate levels of sourced product are available.
37
A summary of our contractual obligations as of May 28, 2017, is as follows (dollars in millions):
|
|
|
Payments Due by Period (a) |
|
|||||||||||||
|
|
|
|
|
|
Less than |
|
|
|
|
|
|
|
After 5 |
|
||
|
Contractual Obligations |
|
Total |
|
1 Year |
|
1-3 Years |
|
3-5 Years |
|
Years |
|
|||||
|
Short-term borrowings |
|
$ |
22.0 |
|
$ |
22.0 |
|
$ |
— |
|
$ |
— |
|
$ |
— |
|
|
Long-term debt, including current portion, excluding financing obligations (b) |
|
|
2,362.1 |
|
|
35.2 |
|
|
70.8 |
|
|
568.9 |
|
|
1,687.2 |
|
|
Interest on long-term debt (c) |
|
|
761.6 |
|
|
99.3 |
|
|
195.8 |
|
|
183.0 |
|
|
283.5 |
|
|
Operating leases (d) |
|
|
68.8 |
|
|
17.7 |
|
|
26.7 |
|
|
12.1 |
|
|
12.3 |
|
|
Financing obligations (e) |
|
|
75.9 |
|
|
2.7 |
|
|
4.9 |
|
|
4.5 |
|
|
63.8 |
|
|
Purchase obligations (f) |
|
|
460.8 |
|
|
74.2 |
|
|
100.2 |
|
|
48.0 |
|
|
238.4 |
|
|
Capital commitments |
|
|
81.7 |
|
|
81.7 |
|
|
— |
|
|
— |
|
|
— |
|
|
Other long-term liabilities reflected on our Combined and Consolidated Balance Sheet (g): |
|
|
|
|
|
|
|
|
|
|
|
|
|
|
|
|
|
Compensation and benefits (h) |
|
|
23.8 |
|
|
— |
|
|
8.6 |
|
|
1.3 |
|
|
13.9 |
|
|
Other (i) |
|
|
12.1 |
|
|
— |
|
|
1.9 |
|
|
1.8 |
|
|
8.4 |
|
|
Total |
|
$ |
3,868.8 |
|
$ |
332.8 |
|
$ |
408.9 |
|
$ |
819.6 |
|
$ |
2,307.5 |
|
|
(a) |
The table assumes amounts included in the “Less than 1 Year” column represent obligations for our fiscal year 2018. The remaining columns correspond to our fiscal year ends as follows: “1-3 Years” represents fiscal 2019 and 2020, “3-5 Years” represents fiscal 2021 and 2022, and “After 5 Years” represents fiscal 2023 and thereafter. |
|
(b) |
The table assumes our long-term debt is held to maturity and includes the current portion of long-term debt. Amounts are reported gross and do not include unamortized debt issuance costs of $35.1 million at May 28, 2017. See Note 9, Debt Financing Obligations, of the Notes to the Combined and Consolidated Financial Statements in “Part II, Item 8. Financial Statements and Supplementary Data” of this Form 10-K. |
|
(c) |
Amounts represent estimated future interest payments as of May 28, 2017, assuming our long-term debt is held to maturity and using interest rates in effect at May 28, 2017. See “Item 7A. Quantitative and Qualitative Disclosures About Market Risk” for the impact of changes in interest rates on our future cash flows. |
|
(d) |
We enter into operating leases in the normal course of business. We lease some of our warehouses and operating facilities, as well as other property and equipment, under operating leases. Some lease agreements provide us with the option to renew the lease or purchase the leased property. Our operating lease obligations would change if we exercised these renewal options and/or if we entered into additional operating lease agreements. |
|
(e) |
Includes interest payments associated with financing obligations of $33.8 million. |
|
(f) |
Amount includes open purchase orders and agreements, some of which are not legally binding and/or may be cancellable. Such agreements are generally settleable in the ordinary course of business in less than one year. Excludes purchase commitments under potato supply agreements due to uncertainty of pricing and quantity. Potato supply agreements have maximum contracted pricing with deductions for certain quality attributes, and quantities purchased are determined by the yields produced on contracted acres. Total purchases under potato supply agreements were $596.1 million, $571.0 million, and $581.0 million in fiscal 2017, 2016, and 2015, respectively. |
|
(g) |
Long-term deferred income taxes of $90.5 million are excluded from this table, because the timing of their future cash outflows are uncertain. |
|
(h) |
Amounts primarily consist of pension, post-retirement obligations, stock-based payment obligations, and deferred compensation plans. See Note 7, Employee Benefit Plans and Other Post-retirement Benefits, and Note 10, Stock-based Compensation, of the Notes to the Combined and Consolidated Financial Statements in “Part II, Item 8. Financial Statements and Supplementary Data” of this Form 10-K. |
38
|
(i) |
Long-term workers compensation of $10.0 million and unrecognized tax benefits of $8.9 million are excluded from this table because the timing of their future cash outflows are uncertain. Amount also excludes $16.4 million of a deferred gain as the amount is non-cash. |
Reconciliations of Non-GAAP Financial Measures to Reported Amounts
To supplement the financial information included in this MD&A, we have presented Adjusted EBITDA including unconsolidated joint ventures, which is considered a non-GAAP financial measure. This non-GAAP financial measure should be viewed in addition to, and not as an alternative for, financial measures prepared in accordance with GAAP. This non-GAAP financial measure may differ from similarly titled non-GAAP financial measures presented by other companies, and other companies may not define this non-GAAP financial measure the same way. This measure is not a substitute for comparable GAAP financial measures, such as net income (loss), and there are limitations to using non-GAAP financial measures.
39
The following table reconciles net income to Adjusted EBITDA including unconsolidated joint ventures.
|
|
|
For the Fiscal Years Ended May |
|||||||||||||
|
|
|
|
|
|
|
|
|
|
|
|
|
|
|
(unaudited) |
|
|
|
|
2017 |
|
2016 |
|
2015 |
|
2014 |
|
2013 |
|||||
|
Net income attributable to Lamb Weston Holdings, Inc. |
|
$ |
326.9 |
|
$ |
285.3 |
|
$ |
268.3 |
|
$ |
260.9 |
|
$ |
298.3 |
|
Income attributable to noncontrolling interests |
|
|
13.3 |
|
|
9.3 |
|
|
9.3 |
|
|
9.4 |
|
|
9.0 |
|
Equity method investment earnings |
|
|
(53.3) |
|
|
(71.7) |
|
|
(42.7) |
|
|
(29.6) |
|
|
(35.7) |
|
Interest expense, net |
|
|
61.2 |
|
|
5.9 |
|
|
6.1 |
|
|
5.3 |
|
|
5.3 |
|
Income tax expense |
|
|
170.2 |
|
|
144.5 |
|
|
140.4 |
|
|
117.7 |
|
|
151.9 |
|
Income from operations |
|
|
518.3 |
|
|
373.3 |
|
|
381.4 |
|
|
363.7 |
|
|
428.8 |
|
Depreciation and amortization |
|
|
106.6 |
|
|
95.9 |
|
|
96.4 |
|
|
79.2 |
|
|
77.9 |
|
Items impacting comparability (a) |
|
|
|
|
|
|
|
|
|
|
|
|
|
|
|
|
Expenses related to the Separation |
|
|
26.5 |
|
|
5.3 |
|
|
— |
|
|
— |
|
|
— |
|
Non-cash gain on assets |
|
|
(3.1) |
|
|
— |
|
|
— |
|
|
— |
|
|
— |
|
Expense related to actuarial losses in excess of 10% of related pension liability |
|
|
— |
|
|
59.5 |
|
|
— |
|
|
3.4 |
|
|
— |
|
Expenses related to SCAE Plan |
|
|
— |
|
|
0.1 |
|
|
0.7 |
|
|
2.1 |
|
|
0.3 |
|
Expense related to the impairment of a previously idled production facility |
|
|
— |
|
|
— |
|
|
— |
|
|
13.9 |
|
|
— |
|
Expense related to the impairment of certain assets received in connection with the bankruptcy of an onion products supplier |
|
|
— |
|
|
— |
|
|
— |
|
|
8.9 |
|
|
10.1 |
|
Gain related to the sale of land received in connection with the bankruptcy of an onion products supplier |
|
|
— |
|
|
— |
|
|
— |
|
|
(5.1) |
|
|
— |
|
Adjusted EBITDA (b) |
|
|
648.3 |
|
|
534.1 |
|
|
478.5 |
|
|
466.1 |
|
|
517.1 |
|
|
|
|
|
|
|
|
|
|
|
|
|
|
|
|
|
|
Unconsolidated Joint Ventures |
|
|
|
|
|
|
|
|
|
|
|
|
|
|
|
|
Equity method investment earnings |
|
|
53.3 |
|
|
71.7 |
|
|
42.7 |
|
|
29.6 |
|
|
35.7 |
|
Interest expense, income tax expense, and depreciation and amortization |
|
|
|
|
|
|
|
|
|
|
|
|
|
|
|
|
included in equity method investment earnings |
|
|
22.5 |
|
|
18.2 |
|
|
17.6 |
|
|
19.6 |
|
|
19.6 |
|
Items impacting comparability (c) |
|
|
|
|
|
|
|
|
|
|
|
|
|
|
|
|
Gain related to pension plan settlement |
|
|
— |
|
|
(17.7) |
|
|
— |
|
|
— |
|
|
— |
|
Add: Adjusted EBITDA from unconsolidated joint ventures |
|
|
75.8 |
|
|
72.2 |
|
|
60.3 |
|
|
49.2 |
|
|
55.3 |
|
|
|
|
|
|
|
|
|
|
|
|
|
|
|
|
|
|
Consolidated Joint Ventures |
|
|
|
|
|
|
|
|
|
|
|
|
|
|
|
|
Income attributable to noncontrolling interests |
|
|
(13.3) |
|
|
(9.3) |
|
|
(9.3) |
|
|
(9.4) |
|
|
(9.0) |
|
Interest expense, income tax expense, and depreciation and amortization |
|
|
|
|
|
|
|
|
|
|
|
|
|
|
|
|
included in income attributable to noncontrolling interests |
|
|
(3.7) |
|
|
(3.6) |
|
|
(3.4) |
|
|
(3.4) |
|
|
(3.4) |
|
Subtract: EBITDA from consolidated joint ventures |
|
|
(17.0) |
|
|
(12.9) |
|
|
(12.7) |
|
|
(12.8) |
|
|
(12.4) |
|
|
|
|
|
|
|
|
|
|
|
|
|
|
|
|
|
|
Adjusted EBITDA including unconsolidated joint ventures |
|
$ |
707.1 |
|
$ |
593.4 |
|
$ |
526.1 |
|
$ |
502.5 |
|
$ |
560.0 |
|
(a) |
Fiscal 2017 and 2016 include $26.5 million and $5.3 million, respectively, of expenses related to the Separation. In all periods, the expenses related primarily to professional fees. |
Fiscal 2017 includes a $3.1 million non-cash gain on assets.
Fiscal 2016 and 2014 include $59.5 million and $3.4 million, respectively, of charges reflecting Lamb Weston’s portion of actuarial losses in excess of 10% of Conagra’s pension liability for Conagra sponsored plans.
Fiscal 2016, 2015, 2014, and 2013 include $0.1 million, $0.7 million, $2.1 million, and $0.3 million, respectively, related to costs incurred in connection with Conagra’s initiative to improve selling, general and administrative effectiveness and efficiencies, which is referred to as the Supply Chain and Administrative Efficiency Plan (“SCAE Plan”).
Fiscal 2014 includes $13.9 million related to a non-cash impairment of a previously idled small production facility, classified within selling, general and administrative expenses.
40
Fiscal 2014 and 2013 include $8.9 million and $10.1 million, respectively, related to a non-cash impairment in connection with the impairment of certain assets received in connection with the bankruptcy of an onion products supplier, classified within selling, general and administrative expenses.
Fiscal 2015 includes a $5.1 million non-cash gain on the sale of land received in connection with the bankruptcy of an onion products supplier, classified within selling, general and administrative expenses.
|
(b) |
Adjusted EBITDA includes EBITDA from consolidated joint ventures. |
|
(c) |
Fiscal 2016 includes a $17.7 million non-cash gain related to the settlement of a pension plan at our Lamb-Weston/Meijer joint venture. |
Critical Accounting Estimates
Management’s discussion and analysis of financial condition and results of operations are based upon the Company’s combined and consolidated financial statements, which have been prepared in accordance with GAAP. The preparation of these financial statements requires us to make estimates and judgments that affect the reported amounts of assets, liabilities, revenues, and expenses, and related disclosures of contingent assets and liabilities. On an ongoing basis, we evaluate our estimates, including those related to our trade promotions, goodwill and intangible assets, income taxes, and allocations made as part of the carve out of Lamb Weston for periods prior to the Separation, among others. We base our estimates on historical experiences combined with management’s understanding of current facts and circumstances, the results of which form the basis for making judgments about the carrying values of assets and liabilities that are not readily apparent from other sources. Actual results may differ from these estimates under different assumptions or conditions.
Critical accounting estimates are those that are most important to the portrayal of our financial condition and operating results. These estimates require management’s most difficult, subjective, or complex judgments. We review the development, selection, and disclosure of our critical accounting estimates with the Audit Committee of our Board of Directors. We believe that of our significant accounting policies, the following involve a higher degree of judgment and/or complexity.
Sales Incentives and Trade Promotion Allowances
We promote our products with advertising, consumer incentives, and trade promotions. Sales promotions include, but are not limited to, discounts, coupons, rebates, and volume-based incentives. The estimates for sales incentives are based principally on historical sales and coupon utilization and redemption rates, influenced by judgments about current market conditions such as competitive activity in specific product categories.
Trade promotion programs include introductory marketing funds such as slotting fees, cooperative marketing programs, temporary price reductions, and other activities conducted by our customers to promote our products. The cost of these programs are recognized as a reduction to revenue with a corresponding accrued liability based on estimates made at the time of shipment or coupon release. Estimates of trade promotion liabilities for promotional program costs incurred, but unpaid, are generally based on estimates of the quantity of customer sales, timing of promotional activities, current and past trade-promotion spending patterns, the interpretation of historical spending trends by customer and category, and forecasted costs for activities within the promotional programs. Estimates made by management in accounting for these costs are based primarily on our historical experience with marketing programs, with consideration given to current circumstances and industry trends.
The determination of sales incentive and trade promotion costs requires judgment and may change in the future as a result of changes in customer promotion participation, particularly for new programs related to the introduction of new products. Final determination of the total cost of promotion is dependent upon customers providing information about proof of performance and other information related to the promotional event.
41
Goodwill and Intangible Asset Impairment
Goodwill
At May 28, 2017, we had $133.0 million of goodwill, of which $74.8 million, $42.8 million, $10.9 million and $4.5 million, was recorded in our Global, Foodservice, Retail, and Other segments, respectively.
We maintain four reporting units for purposes of our goodwill impairment testing, Global, Foodservice, Retail and Other, which are the same as our operating segments discussed in Note 14, Segments, of the Notes to Combined and Consolidated Financial Statements in “Part II, Item 8. Financial Statements and Supplementary Data” of this Form 10-K. We test goodwill for impairment annually in the fourth quarter or sooner if events or changes in circumstances indicate that the carrying value of the asset may exceed fair value.
In conducting our goodwill impairment analysis for our total company and each reporting unit, we utilize the income approach, based on a discounted cash flow model (Level 3 measurement). The fair value for our total company was also calculated using the market approach based primarily on comparable company EBITDA multiples (Level 2 measurement) and was compared to and supported our total company fair value based upon the discounted cash flow approach. We believe that the discounted cash flow model captures our estimates regarding the results of our future prospects; however, we also considered the market's expectations based on observable market information. The discounted cash flow model estimates the projected future cash flows to be generated by our reporting units, discounted to present value using a discount rate for a potential market participant. The following assumptions are key to our estimates of fair value:
Business Projections. The discounted cash flow model utilizes business projections that are developed internally by management for use in managing the business. These projections include significant assumptions such as estimates of future revenues, profits, income taxes, and capital expenditures. Our forecasts take into consideration recent sales data for existing products, planned timing of capital projects, and key economic indicators to estimate future production volumes, selling prices and key input costs for our manufactured products. Our pricing assumptions are estimated based upon an assessment of industry supply and demand dynamics for our products.
Growth Rates. A growth rate is used to calculate the terminal value in the discounted cash flow model. Revenue growth assumptions (along with profitability and cash flow assumptions) were based on historical trends for the reporting units and management’s expectations for future growth.
Discount Rates. Future cash flows are discounted at a rate that is consistent with a weighted average cost of capital for a potential market participant. The weighted average cost of capital is an estimate of the overall after-tax rate of return required by equity and debt holders of a business enterprise. The discount rates selected are based on existing conditions within our industry and reflect adjustments for potential risk premiums in those markets as well as weighting of the market cost of equity versus debt.
Based on the results of the quantitative goodwill impairment test, we determined that the fair value of our Global, Foodservice, Retail, and Other reporting units were substantially in excess of the carrying amount, and therefore, no goodwill impairment existed.
Non-amortizing Intangible Assets
At both May 28, 2017 and May 29, 2016, we had $18.0 million of non-amortizing intangible assets. We review intangible assets with indefinite useful lives for impairment during the fourth quarter or sooner if events or changes in circumstances indicate that the carrying value of the asset may exceed fair value. In conducting our indefinite lived
42
intangible impairment analysis, we utilize a “relief from royalty” methodology. This methodology determines the fair value of each brand through use of a discounted cash flow model that incorporates an estimated “royalty rate” we would be able to charge a third party for the use of the particular brand. The following assumptions are key to our estimates of fair value:
Business Projections. The relief of royalty methodology utilizes future net sales that are developed based on business projections. Estimating future net sales requires significant judgment by management in such areas as future economic conditions, product pricing, and consumer trends.
Royalty Rate. A royalty rate for each brand is determined based on the royalty rate that would be charged to a third party. The royalty rate is applied to forecast revenue to estimate cash flows.
Discount Rates. Future cash flows are discounted at a rate that is consistent with a weighted average cost of capital for a potential market participant. The weighted average cost of capital is an estimate of the overall after-tax rate of return required by equity and debt holders of a business enterprise. The discount rates selected are based on existing conditions within our industry and reflect adjustments for potential risk premiums in those markets as well as weighting of the market cost of equity versus debt.
Based on the results of the quantitative annual assessment of intangible assets with indefinite useful lives, we determined that the fair value was substantially in excess of the carrying amount, and therefore, no impairment existed.
If management's estimates of future operating results materially change or if there are changes to other assumptions, the estimated fair value of goodwill and non-amortizing intangible assets could change significantly. Such change could result in impairment charges in future periods, which could have a significant non-cash impact on our operating results and financial condition. We cannot predict the occurrence of future events that might adversely affect the reported value of our goodwill and intangible assets. As additional information becomes known, we may change our estimates.
Income Taxes
We compute the provision for income taxes using the asset and liability method, under which deferred tax assets and liabilities are recognized for the expected future tax consequences of temporary differences between the financial reporting and tax bases of assets and liabilities and for operating losses. We measure deferred tax assets and liabilities using the currently enacted tax rates that apply to taxable income in effect for the years in which those tax assets or liabilities are expected to be realized or settled.
We apply judgment in the recognition and measurement of deferred income taxes balances. We assess the likelihood that we will be able to recover our deferred tax assets. If recovery is not estimated to be achievable on a more likely than not basis, we record a valuation allowance against the deferred tax assets that we estimate will not ultimately be recoverable. The estimated recovery of a portion of our deferred tax assets is impacted by objective historical evidence as well as subjective evidence including management’s future plans with respect to holding or disposing of certain investments and future taxable income forecasts. Therefore, future changes in the objective and subjective evidence could affect our assessment of the recoverability of deferred tax assets and our provision for taxes.
We use a two-step process to recognize liabilities for uncertain tax positions. The first step is to evaluate the tax position for recognition by determining whether, based on the technical merits of the position, the weight of available evidence indicates that it is more likely than not that the position will be sustained on examination by the taxing authorities, including resolution of related appeals or litigation processes, if any. If we determine that a tax position will more likely than not be sustained on examination, the second step requires us to estimate and measure the tax benefit as the largest amount that is more than 50% likely to be realized upon ultimate settlement. We consider many factors when evaluating
43
and estimating our tax positions and tax benefits, which may require periodic adjustments and may not accurately forecast actual outcomes. We recognize interest and penalties related to unrecognized tax benefits within the provision for income taxes in our combined and consolidated statements of income. Determining whether an uncertain tax position is effectively settled requires judgment. Such a change in recognition or measurement would result in the recognition of a tax benefit or an additional charge to the tax provision.
We have not recognized U.S. deferred income taxes on certain undistributed non-U.S. earnings because we plan to indefinitely reinvest such earnings outside the United States. Remittances of non-U.S. earnings are based on estimates and judgments of projected cash flow needs, as well as the working capital and investment requirements of our non-U.S. and U.S. operations. Material changes in our estimates of cash, working capital, and investment needs in various jurisdictions could require repatriation of indefinitely reinvested non-U.S. earnings, which would be subject to U.S. income taxes and applicable non-U.S. income and withholding taxes.
Further information on income taxes is provided in Note 4, Income Taxes, of the Notes to Combined Consolidated Financial Statements in “Part II, Item 8. Financial Statements and Supplementary Data” of this Form 10 K.
Cost Allocations
Conagra provided a variety of services to Lamb Weston, such as treasury and cash management, procurement, information technology, general accounting and finance, payroll and human resources, legal and communications, real estate and facilities, and other general and administrative stewardship. To the extent that costs were not directly attributable to us (direct costs primarily include restructuring charges and employee benefits for Lamb Weston personnel which include certain stock-based compensation, pension and post-retirement benefits, healthcare and workers’ compensation), Conagra allocated certain selling, general and administrative costs to us based on specific metrics correlated with the cost of these services (e.g., employee headcount, net sales, square footage of office space, etc.).
The above allocations were consistent with historical allocations for Lamb Weston; however, Conagra does not historically allocate certain other corporate costs to its various segments. For any remaining indirect corporate costs which supported Lamb Weston, we were allocated additional selling, general and administrative costs using an equal weighting between the Lamb Weston product contribution margin (net sales less cost of goods sold and advertising and promotion expenses) and Lamb Weston total assets relative to consolidated Conagra product contribution margin and total assets.
Although it is not practicable to estimate what such costs would have been if Lamb Weston had operated as a separate entity, we consider such allocations to have been made on a reasonable basis.
New and Recently Adopted Accounting Standards
For a listing of our new and recently adopted accounting standards, see Note 1, Nature of Operations and Summary of Significant Accounting Policies, of the Notes to Combined and Consolidated Financial Statements in “Part II, Item 8. Financial Statements and Supplementary Data” of this Form 10‑K.
ITEM 7A. QUANTITATIVE AND QUALITATIVE DISCLOSURES ABOUT MARKET RISK
Our operations are exposed to market risks from adverse changes in commodity prices affecting the cost of raw materials and energy, foreign currency exchange rates, and interest rates. In the normal course of business, we periodically enter into derivatives to minimize these risks, but not for trading purposes.
Based on our open commodity contract hedge positions as of May 28, 2017, a hypothetical 10 percent decline in market prices applied to the fair value of the instruments would result in a charge to “Cost of sales” of approximately $4.4 million ($2.8 million net of income tax benefit). It should be noted that any change in the fair value of the contracts, real or hypothetical, would be substantially offset by an inverse change in the value of the underlying hedged item.
44
At May 28, 2017, we had $1,688.7 million of fixed-rate and $695.4 million of variable-rate debt outstanding. We have interest rate risk associated with our variable-rate debt. A one percent increase in interest rates related to variable-rate debt would have resulted in an increase in interest expense and a corresponding decrease in income before taxes of approximately $7.1 million annually.
For more information about our market risks, see Note 9, Debt and Financing Obligations, and Note 12, Derivative Financial Instruments, of the Notes to Combined and Consolidated Financial Statements in “Part II, Item 8. Financial Statements and Supplementary Data” of this Form 10‑K.
45
ITEM 8. FINANCIAL STATEMENTS AND SUPPLEMENTAY DATA
| 47 | ||
| 48 | ||
| 49 | ||
|
Combined and Consolidated Balance Sheets as of May 28, 2017 and May 29, 2016 |
50 | |
| 51 | ||
| 52 | ||
| 53 | ||
46
Report of Independent Registered Public Accounting Firm
The Board of Directors and Stockholders
Lamb Weston Holdings, Inc.:
We have audited the accompanying combined and consolidated balance sheets of Lamb Weston Holdings, Inc. and subsidiaries (the Company), as of May 28, 2017 and May 29, 2016, and the related combined and consolidated statements of earnings, comprehensive income, stockholders’ equity, and cash flows for each of the fiscal years in the three-year period ended May 28, 2017. In connection with our audits of the combined and consolidated financial statements, we also have audited the financial statement schedule. These combined and consolidated financial statements and financial statement schedule are the responsibility of the Company’s management. Our responsibility is to express an opinion on these combined and consolidated financial statements and financial statement schedule based on our audits.
We conducted our audits in accordance with standards of the Public Company Accounting Oversight Board (United States). Those standards require that we plan and perform the audit to obtain reasonable assurance about whether the financial statements are free of material misstatement. An audit includes examining, on a test basis, evidence supporting the amounts and disclosures in the financial statements. An audit also includes assessing the accounting principles used and significant estimates made by management, as well as evaluating the overall financial statement presentation. We believe that our audits provide a reasonable basis for our opinion.
In our opinion, the combined and consolidated financial statements referred to above present fairly, in all material respects, the financial position of Lamb Weston Holdings, Inc. and subsidiaries as of May 28, 2017 and May 29, 2016, and the results of their operations and their cash flows for each of the fiscal years in the three-year period ended May 28, 2017, in conformity with U.S. generally accepted accounting principles. Also in our opinion, the related financial statement schedule, when considered in relation to the basic combined and consolidated financial statements taken as a whole, presents fairly, in all material respects, the information set forth therein.
/s/ KPMG LLP
Seattle, Washington
July 25, 2017
47
Lamb Weston Holdings, Inc.
Combined and Consolidated Statements of Earnings
(dollars in millions, except per-share amounts)
|
|
|
For the Fiscal Years Ended May |
|||||||
|
|
|
2017 |
|
2016 |
|
2015 |
|||
|
Net sales |
|
$ |
3,168.0 |
|
$ |
2,993.8 |
|
$ |
2,925.0 |
|
Cost of sales |
|
|
2,381.5 |
|
|
2,326.4 |
|
|
2,337.7 |
|
Gross profit |
|
|
786.5 |
|
|
667.4 |
|
|
587.3 |
|
Selling, general and administrative expenses |
|
|
268.2 |
|
|
294.1 |
|
|
205.9 |
|
Income from operations |
|
|
518.3 |
|
|
373.3 |
|
|
381.4 |
|
Interest expense, net |
|
|
61.2 |
|
|
5.9 |
|
|
6.1 |
|
Income before income taxes and equity method earnings |
|
|
457.1 |
|
|
367.4 |
|
|
375.3 |
|
Income tax expense |
|
|
170.2 |
|
|
144.5 |
|
|
140.4 |
|
Equity method investment earnings |
|
|
53.3 |
|
|
71.7 |
|
|
42.7 |
|
Net income |
|
|
340.2 |
|
|
294.6 |
|
|
277.6 |
|
Less: Income attributable to noncontrolling interests |
|
|
13.3 |
|
|
9.3 |
|
|
9.3 |
|
Net income attributable to Lamb Weston Holdings, Inc. |
|
$ |
326.9 |
|
$ |
285.3 |
|
$ |
268.3 |
|
Earnings per share |
|
|
|
|
|
|
|
|
|
|
Basic |
|
$ |
2.22 |
|
$ |
1.92 |
|
$ |
1.83 |
|
Diluted |
|
$ |
2.22 |
|
$ |
1.92 |
|
$ |
1.83 |
|
Dividends declared per common share |
|
$ |
0.3750 |
|
$ |
— |
|
$ |
— |
See Notes to Combined and Consolidated Financial Statements.
48
Lamb Weston Holdings, Inc.
Combined and Consolidated Statements of Comprehensive Income (Loss)
(dollars in millions)
|
|
|
For the Fiscal Years Ended May |
|||||||||||||||||||||||||
|
|
|
2017 |
|
2016 |
|
2015 |
|||||||||||||||||||||
|
|
|
|
|
|
Tax |
|
|
|
|
|
|
|
Tax |
|
|
|
|
|
|
|
Tax |
|
|
|
|||
|
|
|
Pre-Tax |
|
(Expense) |
|
After-Tax |
|
Pre-Tax |
|
(Expense) |
|
After-Tax |
|
Pre-Tax |
|
(Expense) |
|
After-Tax |
|||||||||
|
|
|
Amount |
|
Benefit |
|
Amount |
|
Amount |
|
Benefit |
|
Amount |
|
Amount |
|
Benefit |
|
Amount |
|||||||||
|
Net income |
|
$ |
510.4 |
|
$ |
(170.2) |
|
$ |
340.2 |
|
$ |
439.1 |
|
$ |
(144.5) |
|
$ |
294.6 |
|
$ |
418.0 |
|
$ |
(140.4) |
|
$ |
277.6 |
|
Other comprehensive income (loss): |
|
|
|
|
|
|
|
|
|
|
|
|
|
|
|
|
|
|
|
|
|
|
|
|
|
|
|
|
Reclassification of pension and post-retirement benefits out of accumulated other comprehensive income (loss) |
|
|
— |
|
|
— |
|
|
— |
|
|
(5.3) |
|
|
1.3 |
|
|
(4.0) |
|
|
— |
|
|
— |
|
|
— |
|
Unrealized pension and post-retirement benefit obligations |
|
|
1.6 |
|
|
(0.6) |
|
|
1.0 |
|
|
7.2 |
|
|
(1.8) |
|
|
5.4 |
|
|
3.9 |
|
|
(1.0) |
|
|
2.9 |
|
Unrealized currency translation losses |
|
|
(1.1) |
|
|
— |
|
|
(1.1) |
|
|
(5.5) |
|
|
— |
|
|
(5.5) |
|
|
(28.7) |
|
|
— |
|
|
(28.7) |
|
Comprehensive income (loss) |
|
|
510.9 |
|
|
(170.8) |
|
|
340.1 |
|
|
435.5 |
|
|
(145.0) |
|
|
290.5 |
|
|
393.2 |
|
|
(141.4) |
|
|
251.8 |
|
Less: Comprehensive income attributable to noncontrolling interests |
|
|
13.3 |
|
|
— |
|
|
13.3 |
|
|
9.3 |
|
|
— |
|
|
9.3 |
|
|
9.3 |
|
|
— |
|
|
9.3 |
|
Comprehensive income (loss) attributable to Lamb Weston |
|
$ |
497.6 |
|
$ |
(170.8) |
|
$ |
326.8 |
|
$ |
426.2 |
|
$ |
(145.0) |
|
$ |
281.2 |
|
$ |
383.9 |
|
$ |
(141.4) |
|
$ |
242.5 |
See Notes to Combined and Consolidated Financial Statements.
49
Lamb Weston Holdings, Inc.
Combined and Consolidated Balance Sheets
(dollars in millions except share data)
|
|
|
For the Fiscal Years Ended May |
||||
|
|
|
2017 |
|
2016 |
||
|
ASSETS |
|
|
|
|
|
|
|
Current assets: |
|
|
|
|
|
|
|
Cash and cash equivalents |
|
$ |
57.1 |
|
$ |
36.4 |
|
Receivables, less allowance for doubtful accounts of $0.5 and $0.5 |
|
|
185.2 |
|
|
186.5 |
|
Inventories |
|
|
525.0 |
|
|
498.9 |
|
Prepaid expenses and other current assets |
|
|
90.9 |
|
|
58.2 |
|
Total current assets |
|
|
858.2 |
|
|
780.0 |
|
Property, plant and equipment, net |
|
|
1,271.2 |
|
|
1,043.1 |
|
Goodwill |
|
|
133.0 |
|
|
133.9 |
|
Intangible assets, net |
|
|
37.2 |
|
|
39.6 |
|
Equity method investments |
|
|
178.6 |
|
|
155.2 |
|
Other assets |
|
|
7.4 |
|
|
6.5 |
|
Total assets |
|
$ |
2,485.6 |
|
$ |
2,158.3 |
|
|
|
|
|
|
|
|
|
LIABILITIES AND STOCKHOLDERS' EQUITY (DEFICIT) |
|
|
|
|
|
|
|
Current liabilities: |
|
|
|
|
|
|
|
Short-term borrowings |
|
$ |
22.0 |
|
$ |
24.9 |
|
Current portion of long-term debt and financing obligations |
|
|
37.9 |
|
|
13.5 |
|
Accounts payable |
|
|
295.0 |
|
|
238.0 |
|
Accrued liabilities |
|
|
200.5 |
|
|
133.2 |
|
Total current liabilities |
|
|
555.4 |
|
|
409.6 |
|
Long-term liabilities: |
|
|
|
|
|
|
|
Long-term debt, excluding current portion |
|
|
2,365.0 |
|
|
104.6 |
|
Deferred income taxes |
|
|
90.5 |
|
|
144.0 |
|
Other noncurrent liabilities |
|
|
71.2 |
|
|
52.1 |
|
Total long-term liabilities |
|
|
2,526.7 |
|
|
300.7 |
|
Commitments and contingencies |
|
|
|
|
|
|
|
Redeemable noncontrolling interest |
|
|
50.7 |
|
|
47.4 |
|
Stockholders' equity: |
|
|
|
|
|
|
|
Common stock of $1.00 par value, 600,000,000 shares authorized; 146,080,901 shares issued |
|
|
146.1 |
|
|
— |
|
Parent companies' invested equity |
|
|
— |
|
|
1,409.8 |
|
Additional distributed capital |
|
|
(904.8) |
|
|
— |
|
Retained earnings |
|
|
121.0 |
|
|
— |
|
Accumulated other comprehensive loss |
|
|
(9.3) |
|
|
(9.2) |
|
Treasury stock, at cost, 6,143 common shares |
|
|
(0.2) |
|
|
— |
|
Total stockholders' equity (deficit) |
|
|
(647.2) |
|
|
1,400.6 |
|
Total liabilities and stockholders’ equity |
|
$ |
2,485.6 |
|
$ |
2,158.3 |
See Notes to Combined and Consolidated Financial Statements.
50
Lamb Weston Holdings, Inc.
Combined and Consolidated Statements of Stockholders’ Equity
(dollars in millions except share data)
|
|
|
|
|
|
|
|
|
|
|
|
Parent |
|
Additional |
|
|
|
|
Accumulated |
|
|
|
|||
|
|
|
|
|
|
|
|
|
Treasury |
|
Companies' |
|
Paid-in |
|
|
|
|
Other |
|
|
|
||||
|
|
|
Common Stock Issued |
|
Stock |
|
Equity |
|
(Distributed) |
|
Retained |
|
Comprehensive |
|
Total |
||||||||||
|
|
|
Shares |
|
Amount |
|
Amount |
|
Investment |
|
Capital |
|
Earnings |
|
Loss |
|
Equity |
||||||||
|
Balance at May 25, 2014 |
|
|
— |
|
$ |
— |
|
$ |
— |
|
$ |
1,244.3 |
|
$ |
— |
|
$ |
— |
|
$ |
20.7 |
|
$ |
1,265.0 |
|
Net income |
|
|
— |
|
|
— |
|
|
— |
|
|
268.3 |
|
|
— |
|
|
— |
|
|
— |
|
|
268.3 |
|
Net transactions with parent |
|
|
— |
|
|
— |
|
|
— |
|
|
(148.3) |
|
|
— |
|
|
— |
|
|
— |
|
|
(148.3) |
|
Increase in redemption value of noncontrolling interests in excess of earnings allocated |
|
|
— |
|
|
— |
|
|
— |
|
|
(1.7) |
|
|
— |
|
|
— |
|
|
— |
|
|
(1.7) |
|
Pension benefit obligations of equity method investee |
|
|
— |
|
|
— |
|
|
— |
|
|
— |
|
|
— |
|
|
— |
|
|
2.9 |
|
|
2.9 |
|
Unrealized currency translation losses |
|
|
— |
|
|
— |
|
|
— |
|
|
— |
|
|
— |
|
|
— |
|
|
(28.7) |
|
|
(28.7) |
|
Balance at May 31, 2015 |
|
|
— |
|
$ |
— |
|
$ |
— |
|
$ |
1,362.6 |
|
$ |
— |
|
$ |
— |
|
$ |
(5.1) |
|
$ |
1,357.5 |
|
Net income |
|
|
— |
|
|
— |
|
|
— |
|
|
285.3 |
|
|
— |
|
|
— |
|
|
— |
|
|
285.3 |
|
Net transactions with parent |
|
|
— |
|
|
— |
|
|
— |
|
|
(233.3) |
|
|
— |
|
|
— |
|
|
— |
|
|
(233.3) |
|
Increase in redemption value of noncontrolling interests in excess of earnings allocated |
|
|
— |
|
|
— |
|
|
— |
|
|
(4.8) |
|
|
— |
|
|
— |
|
|
— |
|
|
(4.8) |
|
Reclassification of pension and post-retirement benefits out of accumulated other comprehensive income (loss) |
|
|
— |
|
|
— |
|
|
— |
|
|
— |
|
|
— |
|
|
— |
|
|
(4.0) |
|
|
(4.0) |
|
Pension and other post-retirement benefits |
|
|
— |
|
|
— |
|
|
— |
|
|
— |
|
|
— |
|
|
— |
|
|
5.4 |
|
|
5.4 |
|
Unrealized currency translation losses |
|
|
— |
|
|
— |
|
|
— |
|
|
— |
|
|
— |
|
|
— |
|
|
(5.5) |
|
|
(5.5) |
|
Balance at May 29, 2016 |
|
|
— |
|
$ |
— |
|
$ |
— |
|
$ |
1,409.8 |
|
$ |
— |
|
$ |
— |
|
$ |
(9.2) |
|
$ |
1,400.6 |
|
Net income |
|
|
— |
|
|
— |
|
|
— |
|
|
151.1 |
|
|
— |
|
|
175.8 |
|
|
— |
|
|
326.9 |
|
Issuance of common stock at separation |
|
|
146,046,395 |
|
|
146.0 |
|
|
— |
|
|
— |
|
|
(146.0) |
|
|
— |
|
|
— |
|
|
— |
|
Non-cash debt exchange |
|
|
— |
|
|
— |
|
|
— |
|
|
(1,542.9) |
|
|
— |
|
|
— |
|
|
— |
|
|
(1,542.9) |
|
Cash distribution to Conagra at Separation |
|
|
— |
|
|
— |
|
|
— |
|
|
(823.5) |
|
|
— |
|
|
— |
|
|
— |
|
|
(823.5) |
|
Net transactions with Conagra |
|
|
— |
|
|
— |
|
|
— |
|
|
806.0 |
|
|
(762.0) |
|
|
— |
|
|
— |
|
|
44.0 |
|
Increase in redemption value of noncontrolling interests in excess of earnings allocated |
|
|
— |
|
|
— |
|
|
— |
|
|
(0.5) |
|
|
(1.6) |
|
|
— |
|
|
— |
|
|
(2.1) |
|
Unrealized pension and post-retirement benefit obligations |
|
|
— |
|
|
— |
|
|
— |
|
|
— |
|
|
— |
|
|
— |
|
|
1.0 |
|
|
1.0 |
|
Unrealized currency translation losses |
|
|
— |
|
|
— |
|
|
— |
|
|
— |
|
|
— |
|
|
— |
|
|
(1.1) |
|
|
(1.1) |
|
Common stock dividends declared |
|
|
— |
|
|
— |
|
|
— |
|
|
— |
|
|
— |
|
|
(54.8) |
|
|
— |
|
|
(54.8) |
|
Exercise of stock options, issuance of other stock awards |
|
|
34,506 |
|
|
0.1 |
|
|
(0.2) |
|
|
— |
|
|
0.5 |
|
|
— |
|
|
— |
|
|
0.4 |
|
Stock-based compensation expense after Separation |
|
|
— |
|
|
— |
|
|
— |
|
|
— |
|
|
4.1 |
|
|
— |
|
|
— |
|
|
4.1 |
|
Other |
|
|
— |
|
|
— |
|
|
— |
|
|
— |
|
|
0.2 |
|
|
— |
|
|
— |
|
|
0.2 |
|
Balance at May 28, 2017 |
|
|
146,080,901 |
|
$ |
146.1 |
|
$ |
(0.2) |
|
$ |
— |
|
$ |
(904.8) |
|
$ |
121.0 |
|
$ |
(9.3) |
|
$ |
(647.2) |
51
Lamb Weston Holdings, Inc.
Combined and Consolidated Statements of Cash Flows
(dollars in millions)
|
|
|
For the Fiscal Years Ended May |
|||||||
|
|
|
2017 |
|
2016 |
|
2015 |
|||
|
Cash flows from operating activities |
|
|
|
|
|
|
|
|
|
|
Net income |
|
$ |
340.2 |
|
$ |
294.6 |
|
$ |
277.6 |
|
Adjustments to reconcile net income to net cash provided by operating activities: |
|
|
|
|
|
|
|
|
|
|
Depreciation and amortization of intangibles and debt issuance costs |
|
|
109.1 |
|
|
95.9 |
|
|
96.4 |
|
Stock-based compensation expense |
|
|
15.4 |
|
|
8.9 |
|
|
6.9 |
|
Earnings of joint ventures in excess of distributions |
|
|
(22.3) |
|
|
(33.8) |
|
|
(30.7) |
|
Deferred income taxes |
|
|
14.8 |
|
|
20.7 |
|
|
23.7 |
|
Other |
|
|
(4.8) |
|
|
(12.2) |
|
|
(5.9) |
|
Changes in operating assets and liabilities, net of acquisitions: |
|
|
|
|
|
|
|
|
|
|
Receivables |
|
|
1.2 |
|
|
(15.1) |
|
|
3.5 |
|
Inventories |
|
|
(26.1) |
|
|
(10.7) |
|
|
(43.8) |
|
Income taxes payable/receivable, net |
|
|
(16.1) |
|
|
— |
|
|
— |
|
Prepaid expenses and other current assets |
|
|
(11.9) |
|
|
3.5 |
|
|
7.6 |
|
Accounts payable |
|
|
12.1 |
|
|
7.5 |
|
|
1.3 |
|
Accrued liabilities |
|
|
35.3 |
|
|
23.0 |
|
|
17.1 |
|
Net cash provided by operating activities |
|
$ |
446.9 |
|
$ |
382.3 |
|
$ |
353.7 |
|
Cash flows from investing activities |
|
|
|
|
|
|
|
|
|
|
Additions to property, plant and equipment |
|
|
(287.4) |
|
|
(152.3) |
|
|
(114.7) |
|
Acquisition of business, net of cash acquired |
|
|
— |
|
|
— |
|
|
(74.9) |
|
Proceeds from sale of assets |
|
|
2.1 |
|
|
8.0 |
|
|
18.4 |
|
Net cash used for investing activities |
|
$ |
(285.3) |
|
$ |
(144.3) |
|
$ |
(171.2) |
|
Cash flows from financing activities |
|
|
|
|
|
|
|
|
|
|
(Repayments) proceeds from short-term borrowings, net |
|
|
(2.8) |
|
|
21.4 |
|
|
(12.6) |
|
Proceeds from issuance of debt |
|
|
798.1 |
|
|
30.0 |
|
|
— |
|
Debt repayments |
|
|
(23.8) |
|
|
(39.1) |
|
|
(3.1) |
|
Payments of debt issuance costs |
|
|
(12.3) |
|
|
— |
|
|
— |
|
Net transfers (to) from Conagra |
|
|
(38.8) |
|
|
(236.8) |
|
|
(150.7) |
|
Cash distribution to Conagra at Separation |
|
|
(823.5) |
|
|
— |
|
|
— |
|
Dividends paid |
|
|
(27.4) |
|
|
— |
|
|
— |
|
Cash distributions paid to noncontrolling interest |
|
|
(12.2) |
|
|
(8.3) |
|
|
(11.3) |
|
Other |
|
|
0.7 |
|
|
— |
|
|
— |
|
Net cash used for financing activities |
|
$ |
(142.0) |
|
$ |
(232.8) |
|
$ |
(177.7) |
|
Effect of exchange rate changes on cash and cash equivalents |
|
|
1.1 |
|
|
0.6 |
|
|
(1.2) |
|
Net increase (decrease) in cash and cash equivalents |
|
|
20.7 |
|
|
5.8 |
|
|
3.6 |
|
Cash and cash equivalents, beginning of the period |
|
|
36.4 |
|
|
30.6 |
|
|
27.0 |
|
Cash and cash equivalents, end of period |
|
$ |
57.1 |
|
$ |
36.4 |
|
$ |
30.6 |
See Notes to Combined and Consolidated Financial Statements.
52
Notes to Combined and Consolidated Financial Statements
1. NATURE OF OPERATIONS AND SUMMARY OF SIGNIFICANT ACCOUNTING POLICIES
Lamb Weston Holdings, Inc. (“we,” “us,” “our,” the “Company,” or “Lamb Weston”), along with its joint venture partners, is a leading global producer, distributor, and marketer of value-added frozen potato products and is headquartered in Eagle, Idaho. We have four reportable segments: Global, Foodservice, Retail, and Other. See Note 14, Segments, for additional information on our reportable segments.
On November 9, 2016, Lamb Weston separated from Conagra Brands, Inc. (formerly, ConAgra Foods, Inc., “Conagra”) and became an independent publicly traded company through the pro rata distribution by Conagra of 100% of the outstanding common stock of Lamb Weston to Conagra stockholders (“Separation”). Each Conagra stockholder of record on November 1, 2016 (“record date”) received one share of Lamb Weston common stock for every three shares of Conagra common stock held on the record date. As a result of the Separation, approximately 146 million shares of Lamb Weston common stock were distributed on November 9, 2016, to Conagra stockholders. Information related to the Separation and its effect on our financial statements are discussed throughout these Notes to Combined and Consolidated Financial Statements.
Basis of Presentation and Principles of Combination and Consolidation
These Combined and Consolidated Financial Statements present the financial results of Lamb Weston for the fiscal years ended May 28, 2017, May 29, 2016, and May 31, 2015 (“fiscal 2017, 2016, and 2015”), and have been prepared in accordance with generally accepted accounting principles in the United States of America (“GAAP”). The fiscal year end of Lamb Weston ends the last Sunday in May. The fiscal years for the Combined and Consolidated Financial Statements presented consist of a 52-week period for fiscal 2017 and 2016, and a 53-week period for fiscal 2015.
The financial statements include all adjustments (consisting only of normal recurring adjustments) that management considers necessary for a fair presentation of such financial statements. The preparation of financial statements involves the use of estimates and accruals. Actual results may vary from those estimates.
Prior to Separation
Prior to the Separation from Conagra on November 9, 2016 (“Separation Date”), the combined financial statements of Lamb Weston were prepared using the specific accounting records of the entities within Conagra that comprised the business of Lamb Weston. In some cases, principally foreign locations, those business activities were contained within entities that were engaged in other business activities of Conagra. Because a direct ownership relationship did not exist among the various units comprising Lamb Weston, Conagra and its subsidiaries’ equity investment is shown in lieu of stockholders’ equity in the combined financial statements. Intercompany investments, accounts, and transactions between the various legal entities comprising the Lamb Weston business have been eliminated.
Prior to the Separation Date, Lamb Weston’s combined financial statements included accounts specifically attributed to Lamb Weston and a portion of Conagra’s shared corporate general and administrative expenses. These shared services included, but were not limited to, legal, finance, internal audit, financial reporting, income tax accounting and advisory, insurance, information technology, treasury, and human resources functions. Shared corporate general and administrative expenses not specifically identifiable to the Lamb Weston business were allocated to Lamb Weston. The allocations were determined on a basis that we consider were reasonable reflections of the utilization of services provided by Conagra. However, these allocations may not reflect the costs and expenses that Lamb Weston would have incurred as a stand-alone public company. A more detailed discussion of the relationship with Conagra, including a description of the costs which have been allocated to Lamb Weston and the methods of cost allocation, is included in Note 3, Related Party Transactions.
53
As further described in Note 3, prior to the Separation Date, Lamb Weston engaged in various intercompany transactions with Conagra and its affiliates, including the sale and purchase of certain products, the procurement of certain materials and services, cash transfers related to Conagra’s centralized cash management process and expense allocations. As Conagra did not settle intercompany transactions with its businesses on a routine basis, all amounts due to (from) Conagra are classified as “Parent companies’ invested equity” in the Combined and Consolidated Balance Sheet. Changes in parent companies’ equity investment arising from cash transactions are presented as “Net transfers (to) from Conagra” in financing activities in the accompanying Combined and Consolidated Statements of Cash Flows, notwithstanding that advances from Conagra were utilized to fund Lamb Weston’s working capital requirements.
After Separation
Subsequent to the Separation Date, our consolidated financial statements include the accounts of Lamb Weston and all of its majority-owned subsidiaries. In addition, the accounts of all variable interest entities for which we are the primary beneficiary are included in our Combined and Consolidated Financial Statements from the date such determination was made. Intercompany investments, accounts, and transactions have been eliminated.
Certain amounts in the prior period Combined and Consolidated Financial Statements and Notes to Combined and Consolidated Financial Statements have been reclassified to conform with the current period presentation. To conform with the current year presentation, we reclassified the amount associated with the redeemable noncontrolling interest in Lamb Weston BSW, LLC from “Other noncurrent liabilities” to “Redeemable noncontrolling interest” on the May 29, 2016 Combined and Consolidated Balance Sheet. For additional information, see Note 6, Investments in Joint Ventures.
Use of Estimates
The preparation of the combined and consolidated financial statements in conformity with GAAP requires us to make certain estimates and assumptions that affect the reported amounts of assets, liabilities, revenues, and expenses, including allocations from Conagra. On an ongoing basis, we evaluate our estimates, including but not limited to those related to provisions for income taxes, estimates of sales incentives and trade promotion allowances, and the valuation of goodwill and intangible assets. We base our estimates on historical experience and on various other assumptions that we believe to be reasonable under the circumstances. We adjust such estimates and assumptions when facts and circumstances dictate. As future events and their effects cannot be determined with precision, actual results could differ significantly from these estimates. Changes in these estimates will be reflected in the consolidated financial statements in future periods.
Revenue Recognition
Revenue is recognized when title and risk of loss are transferred to customers upon delivery based on terms of sale and collectibility is reasonably assured. Revenue is recognized as the net amount to be received after deducting estimated amounts for discounts, trade allowances, and returns of damaged and out-of-date products.
Shipping and Handling
Shipping and handling costs, such as freight to our customers’ destinations, are included in “Cost of sales” in the Combined and Consolidated Statements of Earnings. When shipping and handling costs are included in the sales price charged for our products, they are recognized in “Net sales”.
Sales Incentives and Trade Promotion Allowances
We promote our products with advertising, consumer incentives, and trade promotions. Sales promotions include, but are not limited to, discounts, coupons, rebates, and volume-based incentives. The estimates for sales incentives are based principally on historical sales and coupon utilization and redemption rates, influenced by judgments about current market conditions such as competitive activity in specific product categories.
54
Trade promotion programs include introductory marketing funds such as slotting fees, cooperative marketing programs, temporary price reductions, and other activities conducted by our customers to promote our products. The cost of these programs are recognized as a reduction to revenue with a corresponding accrued liability based on estimates made at the time of shipment or coupon release. Estimates of trade promotion liabilities for promotional program costs incurred, but unpaid, are generally based on estimates of the quantity of customer sales, timing of promotional activities, current and past trade-promotion spending patterns, the interpretation of historical spending trends by customer and category, and forecasted costs for activities within the promotional programs. Estimates made by management in accounting for these costs are based primarily on our historical experience with marketing programs, with consideration given to current circumstances and industry trends.
The determination of sales incentive and trade promotion costs requires judgment and may change in the future as a result of changes in customer promotion participation, particularly for new programs related to the introduction of new products. Final determination of the total cost of promotion is dependent upon customers providing information about proof of performance and other information related to the promotional event.
Advertising and Promotion
Advertising and promotion expenses totaled $22.6 million, $25.6 million, and $19.4 million in fiscal 2017, 2016, and 2015, respectively, and are included in selling, general and administrative expenses.
Research and Development
Research and development costs are expensed as incurred and totaled $10.6 million, $6.7 million, and $7.2 million in fiscal 2017, 2016, and 2015, respectively.
Stock-Based Payments
Compensation expense resulting from all stock-based compensation transactions are measured and recorded in the combined and consolidated financial statements based on the grant date fair value of the equity or liability instruments issued. Compensation expense is recognized over the period the employee provides service in exchange for the award.
Cash and Cash Equivalents
Cash and all highly liquid investments with an original maturity of three months or less at the date of acquisition, including short-term time deposits and government agency and corporate obligations, are classified as cash and cash equivalents. Book overdraft balances are classified in “Accounts payable” in our Combined and Consolidated Balance Sheets and are reported as a component of operating cash flows for accounts payable in our Combined and Consolidated Statements of Cash Flows as they do not represent bank overdrafts. Cash equivalents are stated at cost, which approximates market. Cash equivalents totaled $57.1 million and $36.4 million at May 28, 2017 and May 29, 2016, respectively. At May 28, 2017 and May 29, 2016, we had $35.1 million and $33.6 million, respectively, of cash at our operations outside the United States.
Trade Accounts Receivable and Allowance for Doubtful Accounts
Trade accounts receivable are stated at the amount we expect to collect based on our past experience, as well as reliance on the Perishable Agricultural Commodities Act, which was enacted to help promote fair trade in the fruit and vegetable industry by establishing a code of fair business practices. The collectability of our accounts receivable is based upon a combination of factors. In circumstances where a specific customer is unable to meet its financial obligations (e.g., bankruptcy filings, substantial downgrading of credit sources), a specific reserve for bad debts is recorded against amounts due to the Company to reduce the net recorded receivable to the amount that we reasonably believe will be collected. For
55
all other customers, reserves for bad debts are recognized based on historical collection experience. If collection experience deteriorates, the estimate of the recoverability of amounts due could be reduced. We periodically review our allowance for doubtful accounts and adjustments to the valuation allowance are recorded as income or expense. Trade accounts receivable balances that remain outstanding after we have used reasonable collection efforts are written off through a charge to the valuation allowance and a credit to accounts receivable. At both May 28, 2017 and May 29, 2016, the allowance for doubtful accounts was $0.5 million.
Inventories
Inventories are valued at the lower of cost (determined using the first-in, first-out method) or market and include all costs directly associated with manufacturing products: materials, labor, and manufacturing overhead.
The components of inventories were as follows: (dollars in millions):
|
|
|
May 28, |
|
May 29, |
||
|
|
|
2017 |
|
2016 |
||
|
Raw materials and packaging |
|
$ |
84.5 |
|
$ |
86.2 |
|
Finished goods |
|
|
409.7 |
|
|
384.3 |
|
Supplies and other |
|
|
30.8 |
|
|
28.4 |
|
Inventories |
|
$ |
525.0 |
|
$ |
498.9 |
Property, Plant and Equipment
Property, plant and equipment are recorded at cost. Cost includes expenditures for major improvements and replacements and the amount of interest cost associated with significant capital additions. The amount of interest capitalized from construction in progress was $5.2 million, $2.7 million, and $1.5 million in fiscal 2017, 2016, and 2015, respectively. Repairs and maintenance costs are expensed as incurred.
The components of property, plant and equipment were as follows (dollars in millions):
|
|
|
May 28, |
|
May 29, |
||
|
|
|
2017 |
|
2016 |
||
|
Land and land improvements |
|
$ |
139.8 |
|
$ |
136.5 |
|
Buildings, machinery, and equipment |
|
|
1,917.7 |
|
|
1,776.1 |
|
Furniture, fixtures, office equipment, and other |
|
|
62.6 |
|
|
53.1 |
|
Construction in progress |
|
|
229.4 |
|
|
68.5 |
|
Property, plant and equipment, at cost |
|
|
2,349.5 |
|
|
2,034.2 |
|
Less accumulated depreciation |
|
|
(1,078.3) |
|
|
(991.1) |
|
Property, plant and equipment, net |
|
$ |
1,271.2 |
|
$ |
1,043.1 |
56
Depreciation is computed on the straight-line method over the estimated useful lives of the respective classes of assets as follows:
|
Land improvements |
|
1-40 years |
|
Buildings |
|
15-40 years |
|
Machinery and equipment |
|
3-20 years |
|
Furniture, fixtures, office equipment, and other |
|
5-15 years |
We recorded $104.3 million, $93.9 million, and $93.8 million of depreciation expense in fiscal 2017, 2016, and 2015, respectively. At May 28, 2017 and May 29, 2016, purchases of property, plant and equipment included in accounts payable were $60.4 million and $15.5 million, respectively.
Long-Lived Asset Impairment
We review long-lived assets for impairment upon the occurrence of events or changes in circumstances which indicate that the carrying amount of the assets may not be fully recoverable, measured by comparing their net book value to the undiscounted projected future cash flows generated by their use. Impaired assets are recorded at their estimated fair value.
Goodwill and Other Identifiable Intangible Assets
We capitalize certain intangible assets, primarily goodwill, customer relationships, and brands and trademarks, based on their estimated fair value at the date of acquisition. Amortization is provided for customer relationships, licensing arrangements, and intellectual property on a straight-line basis over periods ranging from one to 16 years. Amortization for land rights are over 44 years.
Goodwill and other identifiable intangible assets with indefinite lives (e.g., brands or trademarks) are not amortized. We test for impairment annually in the fourth quarter or sooner if events or changes in circumstances indicate the carrying amount of the asset may be impaired. Additionally, we evaluate the remaining useful lives of our finite-lived purchased intangible assets to determine whether any adjustments to the useful lives are necessary. We concluded that none of the goodwill or intangible assets were impaired in the fiscal 2017, 2016, and 2015 annual impairment tests. See Note 5, Goodwill and Other Identifiable Intangible Assets, for additional information.
Fair Values of Financial Instruments
Unless otherwise specified, Lamb Weston believes the carrying value of financial instruments approximates their fair value. See Note 11, Fair Value Measurements, for additional information.
Foreign Currency
Most of our foreign subsidiaries use the local currency of their respective countries as their functional currency. Assets and liabilities are translated at exchange rates prevailing at the balance sheet dates. Revenues, costs, and expenses are translated into U.S. dollars using daily exchange rates. Gains and losses resulting from the translation of our combined and consolidated balance sheets are recorded as a component of accumulated other comprehensive income.
Foreign currency transactions resulted in losses of $2.7 million and $2.6 million in fiscal 2017 and 2016, respectively, and a gain of $0.6 million in fiscal 2015. These amounts were recorded in “Selling, general and administrative expenses” in the Combined and Consolidated Statements of Earnings.
57
Income Taxes
We recognize current tax liabilities and assets based on an estimate of taxes payable or refundable in the current year for each of the jurisdictions in which we transact business. As part of the determination of our current tax liability, management exercises considerable judgment in evaluating positions taken in the tax returns. We recognize the effect of income tax positions only if those positions are more likely than not of being sustained. Recognized income tax positions are measured at the largest amount that is greater than 50% likely of being realized. Changes in recognition or measurement are reflected in the period in which the change in judgment occurs.
We also recognize deferred tax assets and liabilities for the estimated future tax effects attributable to temporary differences (e.g., the difference in book basis versus tax basis of fixed assets resulting from differing depreciation methods). If appropriate, we recognize valuation allowances to reduce deferred tax assets to amounts that are more likely than not to be ultimately realized, based on our assessment of estimated future taxable income, including the consideration of available tax planning strategies.
New and Recently Issued Accounting Standards
Accounting Standards Adopted
In March 2016, the Financial Accounting Standards Board (“FASB”) issued Accounting Standards Update (“ASU”) 2016-09, Improvements to Employee Share-Based Payment Accounting, which simplified the accounting for income taxes, among other changes, related to stock based compensation. Conagra (and therefore Lamb Weston) early adopted ASU 2016-09 in the first quarter of fiscal 2017, with an effective date of May 30, 2016. The adoption did not have a material impact on our financial statements.
In November 2015, the FASB issued ASU 2015-17 Balance Sheet Classification of Deferred Taxes. This ASU requires entities to present all deferred tax assets and liabilities as noncurrent. Conagra (and therefore Lamb Weston) early adopted ASU 2015-17 effective May 30, 2016, and we have reflected our deferred tax assets and liabilities as noncurrent in our Combined and Consolidated Balance Sheets.
In April 2015, the FASB issued ASU 2015-03 (Topic 835): Simplifying the Presentation of Debt Issuance Costs. This ASU conforms the presentation of debt issuance costs with that required for debt discounts under U.S. GAAP. Under the ASU, debt issuance costs are presented in the balance sheet as a direct deduction from the related liability rather than as an asset. We applied this guidance retrospectively, as required. No reclassifications of balances at May 29, 2016, were necessary with the adoption of ASU 2015-03. See Note 9, Debt and Financing Obligations, for more information.
Accounting Standards Not Yet Adopted
In March 2017, the FASB issued ASU 2017-07, Compensation—Retirement Benefits (Topic 715): Improving the Presentation of Net Periodic Pension Cost and Net Periodic Postretirement Benefit Cost. This ASU requires employers to disaggregate the service cost component from the other components of net benefit cost and report it in the same line item(s) as other employee compensation costs arising from services rendered during the period. The other components of net benefit cost are required to be presented in the income statement separately from the service cost component and outside a subtotal of income from operations. These components will not be eligible for capitalization in assets. Employers are also required to disclose the line(s) used to present the other components of net periodic benefit cost, if the components are not presented separately in the income statement. It is effective for fiscal years beginning after December 15, 2017. We will adopt this standard at the beginning of fiscal 2019 and do not expect it to have a material impact on our financial statements.
In January 2017, the FASB issued Accounting Standards Update ASU 2017-04, Intangibles - Goodwill and Other (Topic 350): Simplifying the Test for Goodwill Impairment. This ASU is intended to simplify the accounting for goodwill
58
impairment by removing the requirement to perform a hypothetical purchase price allocation. A goodwill impairment will now be the amount by which the reporting unit's carrying value exceeds its fair value, not to exceed the carrying amount of goodwill. All other goodwill impairment guidance will remain largely unchanged. This new standard will be applied prospectively and is effective for annual or interim goodwill impairment tests in fiscal years beginning after December 15, 2019. Early adoption is permitted after January 1, 2017. We do not expect this guidance to have a material impact on our financial statements.
In August 2016, the FASB issued Accounting Standards Update ASU 2016-15, Statement of Cash Flows (Topic 230): Classification of Certain Cash Receipts and Cash Payments. This ASU adds or clarifies guidance on the classification of certain cash receipts and payments in the statement of cash flows. It is effective for annual periods beginning after December 15, 2017, and interim periods within those annual periods, with early adoption permitted. We do not expect this guidance to have a material impact on our financial statements.
In February 2016, the FASB issued FASB Accounting Standard Codification (“ASC”) Topic 842, Leases, which requires lessees to reflect most leases on their balance sheet as assets and obligations. The effective date for the standard is for fiscal years beginning after December 15, 2018. Early adoption is permitted. The standard is to be applied under the modified retrospective method, with elective reliefs, which requires application of the new guidance for all periods presented. We expect the adoption will result in a material increase in the assets and liabilities on our consolidated balance sheets due to the recognition of right-of-use assets and lease liabilities principally for certain leases currently accounted for as operating leases. We are continuing to evaluate the magnitude and other potential impacts of the standard on our financial statements and notes to the financial statements.
In May 2014, the FASB issued ASU 2014-09, Revenue from Contracts with Customers, which was issued to achieve a consistent application of revenue recognition within the United States, resulting in a single revenue model to be applied by reporting companies under U.S. GAAP. Under the new model, recognition of revenue occurs when a customer obtains control of promised goods or services in an amount that reflects the consideration to which the entity expects to be entitled in exchange for those goods or services. In addition, the new standard requires that reporting companies disclose the nature, amount, timing, and uncertainty of revenue, and cash flows arising from contracts with customers. We have established a transition team to analyze the impact of the standard on our revenue contracts by reviewing our current accounting policies and practices and identifying potential differences that would result from applying the requirements of the new standard. We expect to finalize our assessment and determine our adoption method by December 31, 2017. The new standard becomes effective for our fiscal year beginning May 28, 2018. We do not plan to early adopt.
There were no other accounting standards recently issued that had or are expected to have a material impact on our financial statements.
59
2. EARNINGS PER SHARE
The following table sets forth the computation of basic and diluted earnings per common share for the periods presented (dollars and shares in millions):
|
|
|
For the Fiscal Years Ended May |
|||||||
|
|
|
2017 |
|
2016 |
|
2015 |
|||
|
Numerator: |
|
|
|
|
|
|
|
|
|
|
Net income attributable to Lamb Weston Holdings, Inc. |
|
$ |
326.9 |
|
$ |
285.3 |
|
$ |
268.3 |
|
Less: Increase in redemption value of noncontrolling interests in excess of earnings allocated |
|
|
2.1 |
|
|
4.8 |
|
|
1.7 |
|
Net income available to Lamb Weston common stockholders |
|
$ |
324.8 |
|
$ |
280.5 |
|
$ |
266.6 |
|
|
|
|
|
|
|
|
|
|
|
|
Denominator (a): |
|
|
|
|
|
|
|
|
|
|
Basic weighted average common shares outstanding |
|
|
146.1 |
|
|
146.0 |
|
|
146.0 |
|
Add: Dilutive effect of employee incentive plans (b) |
|
|
0.5 |
|
|
— |
|
|
— |
|
Diluted weighted average common shares outstanding |
|
|
146.6 |
|
|
146.0 |
|
|
146.0 |
|
|
|
|
|
|
|
|
|
|
|
|
Earnings per share |
|
|
|
|
|
|
|
|
|
|
Basic |
|
$ |
2.22 |
|
$ |
1.92 |
|
$ |
1.83 |
|
Diluted |
|
$ |
2.22 |
|
$ |
1.92 |
|
$ |
1.83 |
|
(a) |
Earnings per share for fiscal 2016 and 2015 was calculated based on approximately 146 million shares of Lamb Weston common stock that were distributed to Conagra stockholders on November 9, 2016. |
|
(b) |
Potentially dilutive shares of common stock from employee incentive plans are determined by applying the treasury stock method to the assumed exercise of outstanding stock options and the assumed vesting of outstanding restricted stock units and performance awards. As of May 28, 2017, we did not have any stock-based awards that were antidilutive. Lamb Weston had no stock-based awards outstanding prior to the Separation. |
3. RELATED PARTY TRANSACTIONS
Prior to the Separation, our business was included in the Commercial Foods segment of Conagra. As a result, our transactions with Conagra were considered related party transactions. In connection with the Separation, we entered into a separation and distribution agreement, as well as various other agreements that govern our relationships with Conagra going forward, including a transition services agreement, tax matters agreement, employee matters agreement, and trademark license agreement. Under the transition services agreement, Conagra provides a number of corporate staff services to us based on direct and indirect costs associated with rendering those services. These services include information technology, accounting, and human resource services. The fiscal year ended May 28, 2017, included $4.2 million of expenses related to the transition services agreement. The transition services agreement expires in March 2018. Information included in the remainder of this Note 3 with respect to Conagra is limited to our related party transactions with Conagra prior to the Separation Date.
Prior to the Separation Date, Conagra allocated certain selling, general and administrative costs to Lamb Weston based on specific metrics correlated with the cost of services it provided or costs incurred on behalf of the Company (e.g., employee headcount, net sales, and square footage of office space). Allocations based upon these metrics resulted in $7.7 million, $53.9 million, and $41.2 million of selling, general and administrative costs allocated to Lamb Weston in fiscal 2017, 2016, and 2015, respectively. Beginning in fiscal 2017, certain departmental charges, which were previously allocated, were directly absorbed by Lamb Weston.
60
The above allocations were consistent with historical allocations for Lamb Weston; however, Conagra did not historically allocate certain other corporate costs to its various segments. For any remaining indirect corporate costs that supported Lamb Weston, Conagra allocated additional selling, general and administrative costs using an equal weighting between Lamb Weston product contribution margin (net sales less cost of sales and advertising and promotion expenses) and Lamb Weston total assets relative to consolidated Conagra product contribution margin and total assets. Allocations of indirect corporate costs were $17.3 million, $107.6 million, and $37.7 million in fiscal 2017, 2016, and 2015, respectively, and were recorded in selling, general and administrative costs. The fiscal 2016 amount includes a $59.5 million charge reflecting an allocation to Lamb Weston of a portion of the actuarial losses in excess of 10% of Conagra’s pension liability for Conagra’s company sponsored plans. Although it is not practicable to estimate what such costs would have been if Lamb Weston had operated as a separate public company, Lamb Weston considers such allocations to have been made on a reasonable basis. The allocations discussed above ceased after the Separation Date.
The Combined and Consolidated Balance Sheet as of May 29, 2016 and the fiscal 2017, 2016, and 2015 Combined and Consolidated Statements of Earnings for the periods up to the Separation Date, include only the specific debt and interest expense of the legal entities that comprise Lamb Weston, and do not include any allocated interest expense or third-party debt of Conagra. Interest expense included in Lamb Weston’s results of operations was $61.2 million, $5.9 million, and $6.1 million for fiscal 2017, 2016, and 2015, respectively.
Prior to the Separation, Conagra did not settle intercompany transactions with its subsidiaries on a routine basis. As a result, all amounts due to (from) Conagra are classified as “Parent companies’ invested equity” on the Combined and Consolidated Balance Sheet as of May 29, 2016. It reflects all changes in parent companies’ invested equity for all transactions between Conagra and Lamb Weston, including direct and allocated charges from Conagra to Lamb Weston, intercompany cash transfers, derivative hedging activities performed by Conagra for the benefit of Lamb Weston, sales of potatoes, vegetables, and other products for use by other Conagra affiliates, and net cash management activities. In addition, these financial statements reflect the sale of certain branded products manufactured for distribution by other Conagra affiliates. Income tax payments were made by Conagra on Lamb Weston’s behalf. Income taxes payable were settled in parent companies’ invested equity when payments were made by Conagra.
Included in net sales are sales to Conagra of $8.4 million, $25.7 million, and $26.1 million for fiscal 2017, 2016, and 2015, respectively. The related cost of sales were $3.4 million, $21.4 million, and $22.2 million, respectively. Lamb Weston also made purchases from Conagra of $7.9 million, $18.5 million, and $27.2 million in fiscal 2017, 2016, and 2015, respectively.
4. INCOME TAXES
For periods ended on or prior to the Separation Date, we were a member of Conagra’s consolidated group and our U.S. taxable income will be included in the consolidated U.S. federal income tax return of Conagra as well as in returns to be filed by Conagra with certain state and local taxing jurisdictions. Our foreign income tax returns are filed on a separate company basis. For periods prior to the Separation Date, our income tax liability was computed and presented herein under the “separate return method” as if we were a separate tax paying entity.
In connection with the Separation, we entered into a tax matters agreement. Under the tax matters agreement, Conagra is generally responsible for all taxes associated with consolidated federal and state filings (and will be entitled to all related refunds of taxes) imposed on Conagra and its subsidiaries (including subsidiaries that were transferred to Lamb Weston at Separation) with respect to the taxable periods (or portions thereof) ended on or prior to November 9, 2016. Also, pursuant to this agreement, Lamb Weston is generally responsible for all taxes associated with separately filed foreign, state, and local tax filings (and will be entitled to all related refunds of taxes) imposed on Lamb Weston and its subsidiaries ended on or prior to November 9, 2016.
61
Pre-tax income (loss) consisted of the following (dollars in millions):
|
|
|
For the Fiscal Years Ended May |
|||||||
|
|
|
2017 |
|
2016 |
|
2015 |
|||
|
United States |
|
$ |
467.5 |
|
$ |
384.7 |
|
$ |
382.7 |
|
Foreign |
|
|
42.9 |
|
|
54.4 |
|
|
35.3 |
|
|
|
$ |
510.4 |
|
$ |
439.1 |
|
$ |
418.0 |
The provision for income taxes included the following (dollars in millions):
|
|
|
For the Fiscal Years Ended May |
|||||||
|
|
|
2017 |
|
2016 |
|
2015 |
|||
|
Current |
|
|
|
|
|
|
|
|
|
|
U.S. Federal |
|
$ |
132.0 |
|
$ |
100.0 |
|
$ |
92.3 |
|
State and local |
|
|
13.9 |
|
|
12.0 |
|
|
13.1 |
|
Foreign |
|
|
9.5 |
|
|
11.8 |
|
|
11.3 |
|
Total current provision for taxes |
|
|
155.4 |
|
|
123.8 |
|
|
116.7 |
|
|
|
|
|
|
|
|
|
|
|
|
Deferred |
|
|
|
|
|
|
|
|
|
|
U.S. Federal |
|
|
9.7 |
|
|
17.6 |
|
|
23.8 |
|
State and local |
|
|
3.2 |
|
|
(1.3) |
|
|
2.3 |
|
Foreign |
|
|
1.9 |
|
|
4.4 |
|
|
(2.4) |
|
Total deferred provision for taxes |
|
$ |
14.8 |
|
$ |
20.7 |
|
$ |
23.7 |
|
Total provision for taxes |
|
$ |
170.2 |
|
$ |
144.5 |
|
$ |
140.4 |
Income taxes computed by applying the U.S. Federal statutory rates to income from continuing operations before income taxes are reconciled to the provision for income taxes set forth in the Combined and Consolidated Statements of Earnings as follows (dollars in millions):
|
|
|
For the Fiscal Years Ended May |
|||||||
|
|
|
2017 |
|
2016 |
|
2015 |
|||
|
Provision computed at U.S. Federal statutory rate of 35% |
|
$ |
178.6 |
|
$ |
153.7 |
|
$ |
146.3 |
|
Increase (reduction) in rate resulting from: |
|
|
|
|
|
|
|
|
|
|
State and local taxes, net of federal benefit |
|
|
11.4 |
|
|
7.1 |
|
|
10.2 |
|
Tax credits and domestic manufacturers deduction |
|
|
(11.0) |
|
|
(9.5) |
|
|
(9.2) |
|
Effect of taxes on foreign operations |
|
|
(7.8) |
|
|
(2.8) |
|
|
(3.0) |
|
Other |
|
|
(1.0) |
|
|
(4.0) |
|
|
(3.9) |
|
|
|
$ |
170.2 |
|
$ |
144.5 |
|
$ |
140.4 |
|
Effective income tax rate (a) |
|
|
33% |
|
|
33% |
|
|
34% |
|
(a) |
The effective income tax rate is calculated as the ratio of income tax expense to pre-tax income, inclusive of equity method investment earnings. |
Income taxes paid, net of refunds, were $170.0 million, $124.7 million, and $115.1 million in fiscal 2017, 2016, and 2015, respectively.
62
Deferred and Current Income Taxes
Deferred income taxes reflect the net tax effects of temporary differences between the carrying amounts of assets and liabilities for financial reporting purposes and the amounts for income tax purposes. Deferred income tax assets and liabilities at May 28, 2017 and May 29, 2016 are summarized as follows (dollars in millions):
|
|
|
May 28, 2017 |
|
May 29, 2016 |
||||||||
|
|
|
Assets |
|
Liabilities |
|
Assets |
|
Liabilities |
||||
|
Property, plant and equipment |
|
$ |
— |
|
$ |
159.8 |
|
$ |
— |
|
$ |
155.5 |
|
Goodwill and other intangible assets (a) |
|
|
125.0 |
|
|
— |
|
|
— |
|
|
23.0 |
|
Compensation and benefit related liabilities |
|
|
20.3 |
|
|
— |
|
|
11.7 |
|
|
— |
|
Accrued expenses and other liabilities |
|
|
22.5 |
|
|
— |
|
|
23.4 |
|
|
— |
|
Deferred revenue previously recognized for tax |
|
|
8.2 |
|
|
— |
|
|
7.2 |
|
|
— |
|
Net operating loss carryforwards (b) |
|
|
17.0 |
|
|
— |
|
|
12.6 |
|
|
— |
|
Debt issuance cost |
|
|
— |
|
|
8.3 |
|
|
— |
|
|
— |
|
Other |
|
|
0.9 |
|
|
17.4 |
|
|
8.0 |
|
|
13.9 |
|
|
|
|
193.9 |
|
|
185.5 |
|
|
62.9 |
|
|
192.4 |
|
Less: Valuation allowance (a) (c) |
|
|
(98.4) |
|
|
— |
|
|
(12.3) |
|
|
— |
|
Net deferred taxes (d) |
|
$ |
95.5 |
|
$ |
185.5 |
|
$ |
50.6 |
|
$ |
192.4 |
|
(a) |
In connection with the Separation, Lamb Weston recognized a step-up in tax basis in certain assets, which resulted in a $75.0 million net decrease in deferred tax liabilities (a deferred tax asset of $155.0 million, offset by a valuation allowance of $80.0 million) and a corresponding increase in equity. The step-up in tax basis is related to a deferred intercompany transaction arising in 2008, which until the Separation Date, was eliminated within Conagra’s consolidated financial statements and federal tax filings. |
|
(b) |
Lamb Weston has approximately $46.9 million of gross ($11.1 million after-tax) foreign net operating loss carryforwards, of which the majority expire by fiscal 2021. Lamb Weston also has approximately $102.2 million of gross ($5.9 million after-tax) state capital loss carryovers which will expire in fiscal 2021. |
|
(c) |
The valuation allowance also includes the portion of the net operating loss carryforwards that we do not believe we are not more likely than not to realize. The net impact on income tax expense related to changes in the valuation allowance, including net operating loss carryforwards were charges of $2.8 million and $3.4 million in fiscal 2017 and 2016, respectively. |
|
(d) |
Deferred tax assets of $0.5 million and $2.2 million, as of May 28, 2017 and May 29, 2016, respectively, were presented in “Other assets”. Deferred tax liabilities of $90.5 million and $144.0 million, as of May 28, 2017 and May 29, 2016, respectively, were presented in “Deferred income taxes” as a long-term liability. The deferred tax asset and liability net position is determined by tax jurisdiction. |
As of May 28, 2017, we had not recognized U.S. deferred income taxes on a cumulative total of approximately $118 million of undistributed earnings and other basis differences for certain non-U.S. subsidiaries. Determining the unrecognized deferred tax liability in these non-U.S. subsidiaries that are indefinitely reinvested is not practicable. We currently intend to indefinitely reinvest those earnings and other basis differences in operations outside the U.S.
63
Uncertain Tax Positions
The aggregate changes in the gross amount of unrecognized tax benefits, excluding interest and penalties consisted of the following (dollars in millions):
|
|
For the Fiscal Years Ended May |
||||
|
|
2017 |
|
|
2016 |
|
|
Beginning Balance |
$ |
3.8 |
|
$ |
4.3 |
|
Decreases from positions established during prior fiscal years |
|
— |
|
|
(0.5) |
|
Increases from positions established during current and prior fiscal years |
|
2.2 |
|
|
0.6 |
|
Decreases relating to settlements with taxing authorities |
|
— |
|
|
(0.2) |
|
Reductions resulting from lapse of applicable statute of limitations |
|
(0.9) |
|
|
(0.3) |
|
Other adjustments to liability resulting from the Separation |
|
1.8 |
|
|
(0.1) |
|
Ending Balance (a) |
$ |
6.9 |
|
$ |
3.8 |
|
(a) |
If the $6.9 million and $3.8 million of unrecognized tax benefits as of May 28, 2017 and May 29, 2016, were recognized in a future period, it would result in a tax benefit of $6.2 million and $2.4 million, respectively, and a reduction in the effective tax rate. The ending balance excludes $2.8 million of gross interest and penalties at both May 28, 2017 and May 29, 2016. Lamb Weston accrues interest and penalties associated with uncertain tax positions as part of income tax expense. |
Lamb Weston conducts business and files tax returns in numerous countries, states, and local jurisdictions. While Lamb Weston has little history of audits on a standalone basis, Conagra has completed its U.S. federal income tax audit for tax years through fiscal 2015 and all resulting significant items for fiscal 2015 and prior years have been settled with the U.S. Internal Revenue Service. Other major jurisdictions where we conduct business generally have statutes of limitations ranging from three to five years.
Although the timing of the resolutions and/or closures of audits is highly uncertain, it is reasonably possible that certain U.S. federal and non-U.S. tax audits may be concluded within the next 12 months, which could increase or decrease the balance of our gross unrecognized tax benefits. The estimated impact of income tax expense and net income is not expected to be significant.
5. GOODWILL AND OTHER IDENTIFIABLE INTANGIBLE ASSETS
Changes in the carrying amount of goodwill were as follows (dollars in millions):
|
|
|
|
|
|
|
|
|
|
|
|
|
|
|
|
|
|
|
|
Global |
|
Foodservice |
|
Retail |
|
Other |
|
Total |
|||||
|
Balance at May 29, 2016 |
|
$ |
75.7 |
|
$ |
42.8 |
|
$ |
10.9 |
|
$ |
4.5 |
|
$ |
133.9 |
|
Foreign currency translation adjustment |
|
|
(0.9) |
|
|
— |
|
|
— |
|
|
— |
|
|
(0.9) |
|
Balance at May 28, 2017 |
|
$ |
74.8 |
|
$ |
42.8 |
|
$ |
10.9 |
|
$ |
4.5 |
|
$ |
133.0 |
64
Other identifiable intangible assets were as follows (dollars in millions):
|
|
|
May 28, 2017 |
|
May 29, 2016 |
||||||||||||
|
|
|
Weighted |
|
|
|
|
|
|
|
Weighted |
|
|
|
|
|
|
|
|
|
Average |
|
Gross |
|
|
|
|
Average |
|
Gross |
|
|
|
||
|
|
|
Useful Life |
|
Carrying |
|
Accumulated |
|
Useful Life |
|
Carrying |
|
Accumulated |
||||
|
|
|
(in years) |
|
Amount |
|
Amortization |
|
(in years) |
|
Amount |
|
Amortization |
||||
|
Non-amortizing intangible assets (a) |
|
n/a |
|
$ |
18.0 |
|
$ |
— |
|
n/a |
|
$ |
18.0 |
|
$ |
— |
|
Amortizing intangible assets (b) |
|
14 |
|
|
34.9 |
|
|
15.7 |
|
14 |
|
|
35.1 |
|
|
13.5 |
|
|
|
|
|
$ |
52.9 |
|
$ |
15.7 |
|
|
|
$ |
53.1 |
|
$ |
13.5 |
|
(a) |
Non-amortizing intangible assets are comprised of brands and trademarks. |
|
(b) |
Amortizing intangible assets are principally composed of customer relationships, licensing arrangements, and intellectual property. Amortization expense was $2.3 million, $1.9 million, and $2.6 million in fiscal 2017, 2016, and 2015, respectively. |
Total intangible assets, net of amortization, excluding goodwill, as of May 28, 2017 and May 29, 2016, were $37.2 million and $39.6 million, respectively. Foreign intangible assets are affected by foreign currency translation. Estimated intangible asset amortization expense is $1.8 million in each year in fiscal 2018 – 2022, with $10.2 million of amortization recognized thereafter.
Impairment Testing
We test goodwill and non-amortizing intangible assets for impairment annually in the fourth quarter or sooner if events or changes in circumstances indicate that the carrying value of the asset may exceed fair value. Additionally, when we experience changes to our business or operating environment, we evaluate the remaining useful lives of our finite-lived purchased intangible assets to determine whether any adjustments to the useful lives are necessary. We completed our tests in the fourth quarter and there was no indication of goodwill or intangible asset impairment.
6. INVESTMENTS IN JOINT VENTURES
Variable Interest Entity - Consolidated
We hold a 49.99% interest in Lamb Weston BSW, LLC (“Lamb Weston BSW”), a potato processing venture with Ochoa Ag Unlimited Foods, Inc. (“Ochoa”). We provide all sales and marketing services to Lamb Weston BSW. Under certain circumstances, we could be required to compensate Ochoa for lost profits resulting from significant production shortfalls. Commencing on June 1, 2018, or on an earlier date under certain circumstances, we have a contractual right to purchase the remaining equity interest in Lamb Weston BSW from Ochoa (“call option”). We are currently subject to a contractual obligation to purchase all of Ochoa’s equity investment in Lamb Weston BSW at the option of Ochoa (“put option”). The purchase prices under the call option and the put option (“options”) are based on the book value of Ochoa’s equity interest at the date of exercise, as modified by an agreed-upon rate of return for the holding period of the investment balance. The agreed-upon rate of return varies depending on the circumstances under which any of the options are exercised.
Our variable interests in Lamb Weston BSW include an equity investment in the venture, the options, certain fees paid to Lamb Weston by Lamb Weston BSW for sales and marketing services, the contingent obligation related to production shortfalls and the contingent obligation to fund additional equity contributions or purchase the underlying notes associated with certain Lamb Weston BSW financings. Our maximum exposure to loss as a result of our involvement with this venture is equal to our equity investment in the venture, the balance of any promissory notes extended to the venture which are subject to our purchase obligation, and the amount, if any, by which the put option exercise price exceeds the fair value of the non-controlling interest in Lamb Weston BSW upon its exercise. Also, in the event of a production
65
shortfall, we could be required to compensate Ochoa for lost profits. It is not possible to determine the maximum exposure to losses from the potential exercise of the put option or from potential production shortfalls. However, we do not expect to incur material losses resulting from these potential exposures.
Lamb Weston and Lamb Weston BSW purchase potatoes from a shareholder of Ochoa. The aggregate amounts of such purchases were $62.9 million, $58.6 million, and $61.1 million in fiscal 2017, 2016, and 2015, respectively. Additionally, Lamb Weston and Lamb Weston BSW utilize storage facilities and water treatment services from a shareholder of Ochoa. The aggregate amount of such costs were $5.1 million, $5.1 million, and $4.9 million in fiscal 2017, 2016, and 2015, respectively.
Lamb Weston BSW is a variable interest entity, and we have determined that we are the primary beneficiary of the entity. We consolidate the financial statements of Lamb Weston BSW. The amounts presented for Lamb Weston BSW in the table below exclude intercompany balances eliminated in consolidation and include the non-controlling interest at redemption value as reported in the Combined and Consolidated Balance Sheets (dollars in millions):
|
|
|
May 28, |
|
May 29, |
||
|
|
|
2017 |
|
2016 |
||
|
Cash and equivalents |
|
$ |
10.9 |
|
$ |
4.3 |
|
Receivables, less allowance for doubtful accounts (a) |
|
|
0.1 |
|
|
0.1 |
|
Inventories |
|
|
1.9 |
|
|
1.2 |
|
Prepaid expenses and other current assets |
|
|
0.4 |
|
|
0.4 |
|
Property, plant and equipment, net |
|
|
49.4 |
|
|
52.2 |
|
Goodwill |
|
|
18.8 |
|
|
18.8 |
|
Intangible assets, net |
|
|
4.5 |
|
|
5.2 |
|
Total assets |
|
$ |
86.0 |
|
$ |
82.2 |
|
Notes payable |
|
$ |
— |
|
$ |
1.0 |
|
Current portion of long-term debt |
|
|
1.5 |
|
|
0.5 |
|
Accounts payable |
|
|
11.6 |
|
|
10.9 |
|
Accrued liabilities |
|
|
2.0 |
|
|
1.7 |
|
Long-term debt, excluding current portion |
|
|
28.0 |
|
|
29.5 |
|
Total liabilities |
|
$ |
43.1 |
|
$ |
43.6 |
|
Redeemable noncontrolling interest (b) |
|
$ |
50.7 |
|
$ |
47.4 |
|
|
|
|
|
|
|
|
|
(a) |
As of May 28, 2017 and May 29, 2016, affiliate receivables of $24.0 million and $25.8 million, respectively, are not included above as they are eliminated in consolidation. |
|
(b) |
Represents the amount that our joint venture partner, Ochoa, had the right to put its equity interest to Lamb Weston on May 28, 2017 and May 29, 2016. |
The liabilities recognized as a result of consolidating the Lamb Weston BSW entity do not represent additional claims on Lamb Weston’s general assets. In connection with the Lamb Weston BSW long-term debt, we have entered into an agreement with the financial institution which provides that in the event that Lamb Weston BSW fails to comply with certain financial covenants or repayment terms, we are required to either make certain additional equity contributions to Lamb Weston BSW or to purchase the underlying notes. The assets recognized as a result of consolidating Lamb Weston BSW are the property of the venture and are not available to Lamb Weston for any other purpose.
Variable Interest Entity - Not Consolidated
We hold a 50% interest in Lamb-Weston/RDO Frozen (“Lamb Weston RDO”), a potato processing venture based in the United States. We provide all sales and marketing services to Lamb Weston RDO, and we receive a fee for these
66
services based on a percentage of the net sales of the venture. The fees received were $13.9 million, $13.2 million, and $11.7 million in fiscal 2017, 2016, and 2015, respectively. These fees are recorded as a reduction to selling, general and administrative expense. Our ownership interest in this venture is included in “Equity method investments” in our Combined and Consolidated Balance Sheets. The balance of Lamb Weston’s investment was $17.2 million and $16.9 million at May 28, 2017 and May 29, 2016, respectively, representing our maximum exposure to loss as a result of our involvement with this venture. The capital structure of Lamb Weston RDO includes owners’ equity of $34.4 million and $33.9 million as of May 28, 2017 and May 29, 2016, respectively; and term borrowings from banks of $59.3 million and $41.1 million as of May 28, 2017 and May 29, 2016, respectively.
We have determined that Lamb Weston RDO is a variable interest entity, but Lamb Weston is not the primary beneficiary. Lamb Weston does not have the power to direct the activities that most significantly impact the economic performance of the joint venture. Accordingly, we do not consolidate the financial statements of this entity. We use equity method accounting to account for our ownership in Lamb Weston RDO.
Other Investments
We also hold a 50% ownership interest in Lamb-Weston/Meijer v.o.f. (“Lamb-Weston/Meijer”), a joint venture with Meijer Frozen Foods B.V., headquartered in the Netherlands, which manufactures and sells frozen potato products principally in Europe. We account for this investment using equity method accounting.
Transactions with Joint Ventures
The carrying value of our equity method investments, which include Lamb Weston RDO and Lamb-Weston/Meijer, at May 28, 2017 and May 29, 2016, was $178.6 million and $155.2 million, respectively. These amounts are included in “Equity method investments” in our Combined and Consolidated Balance Sheets. In fiscal 2017, 2016, and 2015, we had sales and payments to our equity method investments of $30.1 million and $11.7 million, $15.0 million and $11.9 million, and $7.8 million and $12.8 million, respectively. Total dividends from our equity method investments were $31.0 million, $37.9 million, and $12.0 million for fiscal 2017, 2016, and 2015, respectively. As of May 28, 2017 and May 29, 2016, we had receivables from our joint ventures of $8.4 million and $4.1 million, respectively.
Summarized combined financial information for our equity method investments on a 100% basis is as follows:
|
|
|
For the Fiscal Years Ended May |
||||
|
|
|
2017 |
|
2016 |
||
|
Net sales |
|
$ |
992.6 |
|
$ |
917.3 |
|
Gross margin |
|
|
190.9 |
|
|
167.0 |
|
Earnings before income taxes (a) |
|
|
106.6 |
|
|
143.3 |
|
|
|
May 28, |
|
May 29, |
||
|
|
|
2017 |
|
2016 |
||
|
Current assets |
|
$ |
325.2 |
|
$ |
304.8 |
|
Noncurrent assets |
|
|
312.5 |
|
|
294.8 |
|
Current liabilities |
|
|
209.0 |
|
|
202.2 |
|
Noncurrent liabilities |
|
|
71.7 |
|
|
81.7 |
|
(a) |
Fiscal 2016 includes a $35.4 million non-cash gain related to the settlement of a pension plan of the Company’s Lamb-Weston/Meijer joint venture. Our Combined and Consolidated Statements of Earnings reflect our potion of this gain, or $17.7 million. |
67
7. EMPLOYEE BENEFIT PLANS AND OTHER POST-RETIREMENT BENEFITS
Prior to Separation
Prior to the Separation Date, Conagra offered plans that were shared amongst its businesses, including Lamb Weston. The participation of Lamb Weston employees in Conagra’s plans until the Separation Date, is reflected in the financial statements as though Lamb Weston participated in a multiemployer plan with Conagra. Accordingly, a proportionate share of the service cost associated with these plans is reflected in the combined and consolidated financial statements. Additionally, the remaining cost elements (e.g., interest) are included in Conagra’s allocations of indirect costs (see Note 3, Related Party Transactions).
In Connection With and/or After Separation
In connection with the Separation, Conagra retained the pension liabilities related to Lamb Weston participants in the Conagra salaried employee pension plan and the vested benefits attributable to Lamb Weston hourly employee plan participants. On the Separation Date, Conagra transferred $7.4 million of qualified and nonqualified pension liabilities related to nonqualified benefits and Lamb Weston hourly participants’ unvested benefits. The liabilities were transferred to a new defined benefit pension plan for certain hourly employees that continue to accrue benefits and a new nonqualified defined benefit pension plan that provides unfunded supplemental retirement benefits to certain executives. The hourly plan is open to new participants. No assets were transferred to the plans.
Other Post-retirement Benefits
In connection with the Separation, Conagra transferred $3.2 million of liabilities for certain retiree health care and dental benefits granted to Lamb Weston employees. These employees are generally eligible for benefits upon retirement and completion of a specified number of years of creditable service. The plans are closed to new entrants.
Other Plans
Under the transition services agreement with Conagra, our employees continue to participate in Conagra’s defined contribution plan (“the Plan”) until we establish a separate plan sponsored by Lamb Weston. The Plan covers all of Lamb Weston’s eligible U.S. employees. The purpose of the Plan is to encourage employees to save for their future retirement needs. Lamb Weston generally matches 100% of the first 6% of the employee’s contribution election and also provides an additional 3% company contribution to eligible participants, regardless of employee participation level. The Plan’s matching contributions have a five-year graded vesting with 20% vesting each year through year five when employees will be 100% vested in all past and future company matching contributions. Since the Separation, we made $6.0 million of matching contributions to the Plan in fiscal 2017. Prior to Separation and during fiscal 2016 and 2015, matching contributions were paid to the Plan by Conagra.
We sponsor a deferred compensation savings plan, which is an unfunded nonqualified defined contribution plan. The plan permits eligible employees to continue to make deferrals and receive company matching contributions when their contributions to the defined contribution plan are stopped due to limitations under U.S. tax law. With the exception of a $0.7 million Rabbi Trust that was transferred to us from Conagra, participant deferrals and company matching contributions are not invested in separate trusts, but are paid directly from our general assets at the time benefits become due and payable. At May 28, 2017 and May 29, 2016, we had $8.8 million and $7.9 million, respectively, of liabilities attributable to participation in our deferred compensation plan recorded on our Consolidated Balance Sheets.
Obligations and Funded Status of Defined Benefit Pension and Other Post-retirement Benefits Plans
The funded status of our plans is based on company contributions, benefit payments, the plan asset investment return, the discount rate used to measure the liability, and expected participant longevity. The following table, which includes only company-sponsored defined benefit and other post-retirement benefit plans, reconciles the beginning and
68
ending balances of the projected benefit obligation and the fair value of plan assets. We recognize the unfunded status of these plans on the Consolidated Balance Sheets, and we recognize changes in funded status in the year changes occur through the Consolidated Statements of Comprehensive Income (dollars in millions):
|
|
|
For the Fiscal Years Ended |
||||
|
|
|
May 28, 2017 |
||||
|
|
|
Pension Plan |
|
Post-Retirement Plan |
||
|
Change in Benefit Obligation |
|
|
|
|
|
|
|
Benefit obligation at beginning of year |
|
$ |
— |
|
$ |
— |
|
Net transfer from Conagra |
|
|
7.4 |
|
|
3.2 |
|
Service cost |
|
|
4.4 |
|
|
— |
|
Interest cost |
|
|
0.1 |
|
|
0.1 |
|
Participant contributions |
|
|
— |
|
|
— |
|
Actuarial gain |
|
|
(1.8) |
|
|
(0.8) |
|
Benefit obligation at fiscal year-end |
|
$ |
10.1 |
|
$ |
2.5 |
|
Accumulated benefit obligation |
|
$ |
10.1 |
|
$ |
2.5 |
|
|
|
|
|
|
|
|
|
Change in Plan Assets |
|
|
|
|
|
|
|
Fair value of plan assets at beginning of year |
|
$ |
— |
|
$ |
— |
|
Company contributions |
|
|
4.5 |
|
|
— |
|
Fair value of plan assets at end of year |
|
$ |
4.5 |
|
$ |
— |
|
|
|
|
|
|
|
|
|
Unfunded status |
|
$ |
(5.6) |
|
$ |
(2.5) |
|
|
|
|
|
|
|
|
|
Amounts Recognized in Combined and Consolidated Balance Sheets |
|
|
|
|
|
|
|
Other noncurrent liabilities |
|
$ |
(5.6) |
|
$ |
(2.5) |
|
Amounts Recognized in Accumulated Other Comprehensive Loss (Pre-tax) |
|
|
|
|
|
|
|
Actuarial net gain |
|
$ |
1.0 |
|
$ |
0.8 |
|
Prior service benefit |
|
|
— |
|
|
(0.2) |
|
Total |
|
$ |
1.0 |
|
$ |
0.6 |
Components of Net Periodic Benefit Cost and Other Comprehensive (Income) Loss
For the period after the Separation Date, the components of net periodic benefit cost were as follows (dollars in millions):
|
|
|
Pension Plan |
|
|
Service cost |
|
$ |
4.4 |
|
Interest cost |
|
|
0.1 |
|
Expected return on plan assets |
|
|
— |
|
Net periodic benefit cost |
|
$ |
4.5 |
69
Components of net periodic benefit cost for our post-retirement benefits were insignificant for the period after the Separation Date.
For the period after the Separation Date, the components of other comprehensive income (loss) were as follows (dollars in millions):
|
|
|
For the Fiscal Years Ended |
||||
|
|
|
May 28, 2017 |
||||
|
|
|
Pension Plan |
|
Post-Retirement Plan |
||
|
Actuarial net gain |
|
$ |
1.0 |
|
$ |
0.8 |
|
Amortization of prior service benefit |
|
|
— |
|
|
(0.2) |
|
Total recognized in other comprehensive income (loss) |
|
$ |
1.0 |
|
$ |
0.6 |
Assumptions
The actuarial assumptions used in determining the benefit obligations and net periodic pension cost for our defined benefit and post-retirement plans are as follows:
|
|
|
For the Fiscal Years Ended |
||||
|
|
|
May 28, 2017 |
||||
|
|
|
Pension Plan |
|
Post-Retirement Plan |
||
|
Weighted-Average Assumptions Used to Determine Benefit Obligations at May 28, 2017: |
|
|
|
|
|
|
|
Discount rate |
|
|
4.33% |
|
|
3.50% |
|
Weighted-Average Assumptions Used to Determine Net Periodic Benefit Cost at May 28, 2017: |
|
|
|
|
|
|
|
Discount rate |
|
|
3.81% |
|
|
3.18% |
|
Long-term rate of return on plan assets |
|
|
7.50% |
|
|
N/A |
Discount Rate Assumption. The discount rate reflects the current rate at which the pension obligations could be settled on the measurement date: May 28, 2017. The discount rate assumption used to calculate the present value of pension and post-retirement benefit obligations reflects the rates available on high-quality bonds on May 28, 2017. The bonds included in the models reflect anticipated investments that would be made to match the expected monthly benefit payments over time. The plans’ projected cash flows were duration-matched to these models to develop an appropriate discount rate. The discount rate we will use in fiscal 2018 to calculate the net periodic pension benefit and post-retirement benefit cost is 4.33% and 3.50%, respectively.
Asset Return Assumption. The Employee Benefit Investments Council is in the process of establishing our investment strategy and related asset allocation policies. The expected return on plan assets reflects the expected long-term rates of return based on investments Conagra has historically held in the plan and the investment returns we expect once our investment policy is finalized. We will adjust the expected long-term rate of return when there are changes in expected returns on the plan investments. The weighted-average expected return on plan assets we will use in our calculation of fiscal 2018 net periodic pension benefit cost is 7.50%.
70
Health Care Cost Trend Rate Assumptions. We review external data and historical trends for health care costs to determine our healthcare cost trend rate assumptions. We assumed health care cost trend rates for our post-retirement benefit plan as follows:
|
|
|
2017 |
|
|
Health care cost trend rate (Pre65/Post65) |
|
|
9.0/6.5% |
|
Ultimate health care cost trend rate |
|
|
4.5% |
|
Year that the rate reaches the ultimate trend rate |
|
|
2024 |
A one-percentage point increase in the assumed health care cost trend rate would have an insignificant effect on the 2017 postretirement benefit obligation.
Investment Policies and Strategies and Fair Value Measurements of Plan Assets
In May 2017, we contributed $4.5 million to our pension plan. Our Employee Benefits Investments Council is responsible for establishing and overseeing our investment policy. At May 28, 2017, the fair value of our pension plan assets, which consist entirely of cash and cash equivalents (Level 1), was $4.5 million.
Funding and Cash Flows
We make pension plan contributions that are sufficient to fund our actuarially determined costs, generally equal to the minimum amounts required by the Employee Retirement Income Security Act (“ERISA”). From time to time, we may make discretionary contributions based on the funded status of the plans, tax deductibility, income from operations, and other factors. In fiscal 2017, we made $4.5 million of contributions to our qualified plan, which exceeded our 2017 minimum contribution requirements.
The following are estimated benefit payments to be paid to current plan participants by year (dollars in millions). Qualified pension benefit payments are paid from plan assets, while nonqualified pension benefit payments are paid by the Company.
|
|
|
Pension Plan |
|
Post-Retirement Plan |
||
|
2018 |
|
$ |
0.1 |
|
$ |
0.0 |
|
2019 |
|
|
0.1 |
|
|
0.1 |
|
2020 |
|
|
0.2 |
|
|
0.1 |
|
2021 |
|
|
0.4 |
|
|
0.2 |
|
2022 |
|
|
0.6 |
|
|
0.2 |
|
Succeeding 5 years |
|
|
7.1 |
|
|
1.1 |
We have $1.6 million of required minimum qualified pension contributions in fiscal 2018.
71
Pension Cost Financial Statement Presentation
Allocated pension costs (benefits) incurred by Conagra prior to November 9, 2016 and pension costs recognized after the Separation Date are included in the Combined and Consolidated Statements of Earnings as follows (dollars in millions):
|
|
|
For the Fiscal Years Ended May |
|||||||
|
|
|
2017 |
|
2016 |
|
2015 |
|||
|
Cost of sales (a) |
|
$ |
9.6 |
|
$ |
12.0 |
|
$ |
11.3 |
|
Selling, general and administrative expenses (a) |
|
|
(5.5) |
|
|
53.9 |
|
|
(5.4) |
|
Total |
|
$ |
4.1 |
|
$ |
65.9 |
|
$ |
5.9 |
|
(a) |
Pension service costs are allocated to operations as reflected in cost of sales above. Expected returns on pension assets and interest costs are reflected in “Selling, general and administrative expenses” in the Combined and Consolidated Statements of Earnings. Fiscal 2016 includes $59.5 million of charges reflecting Lamb Weston’s portion of the actuarial losses in excess of 10% of Conagra’s pension liability for Conagra sponsored plans. |
8. ACCRUED LIABILITIES
The components of accrued liabilities were as follows (dollars in millions):
|
|
|
May 28, |
|
May 29, |
||
|
|
|
2017 |
|
2016 |
||
|
Compensation and benefits |
|
$ |
80.1 |
|
$ |
64.8 |
|
Accrued trade promotions |
|
|
40.5 |
|
|
35.6 |
|
Dividends payable |
|
|
27.4 |
|
|
— |
|
Accrued interest |
|
|
10.2 |
|
|
0.6 |
|
Franchise, property, and sales and use taxes |
|
|
9.8 |
|
|
12.0 |
|
Income taxes payable |
|
|
4.7 |
|
|
— |
|
Other |
|
|
27.8 |
|
|
20.2 |
|
Accrued liabilities |
|
$ |
200.5 |
|
$ |
133.2 |
72
9. DEBT AND FINANCING OBLIGATIONS
At May 28, 2017 and May 29, 2016, our debt, including financing obligations, was as follows (dollars in millions):
|
|
|
May 28, |
|
May 29, |
||
|
|
|
2017 |
|
2016 |
||
|
Short-term borrowings: |
|
|
|
|
|
|
|
Revolving credit facility |
|
$ |
4.5 |
|
$ |
— |
|
Other credit facilities |
|
|
17.5 |
|
|
24.9 |
|
|
|
|
22.0 |
|
|
24.9 |
|
Long-term debt: |
|
|
|
|
|
|
|
Term loan facility, due 2021 |
|
|
666.6 |
|
|
— |
|
4.625% senior notes, due 2024 |
|
|
833.0 |
|
|
— |
|
4.875% senior notes, due 2026 |
|
|
833.0 |
|
|
— |
|
6.25% installment notes, due 2017 |
|
|
— |
|
|
10.1 |
|
LIBOR plus a margin (1.90% to 2.30%) and 4.34%, installment notes due on various dates through June 2031 |
|
|
29.5 |
|
|
30.0 |
|
|
|
|
2,362.1 |
|
|
40.1 |
|
Financing obligations: |
|
|
|
|
|
|
|
4.35% lease financing obligation due May 2030 |
|
|
68.2 |
|
|
69.7 |
|
2.00% to 3.32% lease financing obligations due on various dates through 2040 |
|
|
7.7 |
|
|
8.3 |
|
|
|
|
75.9 |
|
|
78.0 |
|
|
|
|
|
|
|
|
|
Total debt and financing obligations |
|
|
2,460.0 |
|
|
143.0 |
|
Debt issuance costs |
|
|
(35.1) |
|
|
— |
|
Short-term borrowings |
|
|
(22.0) |
|
|
(24.9) |
|
Current portion of long-term debt and financing obligations |
|
|
(37.9) |
|
|
(13.5) |
|
Long-term debt, excluding current portion |
|
$ |
2,365.0 |
|
$ |
104.6 |
In November 2016, as part of the Separation, Lamb Weston issued $2,341.0 million of debt, which included $1,666.0 million of aggregate principal amount of 4.625% and 4.875% senior notes (together, “Senior Notes”) and $675.0 million of borrowings under a five-year senior secured credit agreement (“Credit Agreement”) with a syndicate of lenders. The Credit Agreement consists of a five-year amortizing $675.0 million term loan facility (“Term Loan Facility”) and a five-year non-amortizing $500.0 million revolving credit facility (“Revolving Credit Facility” and, together with the Term Loan Facility, “Credit Facilities”). The Credit Agreement is secured by security interests and liens on substantially all of our and each guarantor’s assets, as long as Lamb Weston remains below investment grade by both Moody’s and Standard & Poor’s. Of the $1,666.0 million of Senior Notes, $1,542.9 million aggregate principal amount from the Senior Notes were distributed directly to Conagra, and we used the proceeds of $123.1 million of Senior Notes, together with $700.4 million of borrowings under the Credit Facilities, to fund an $823.5 million cash payment to Conagra at the time of the Separation. The $1,542.9 million of Senior Notes distributed directly to Conagra was considered a non-cash financing activity for Lamb Weston.
We issued the following debt in connection with the Separation:
|
· |
Revolving Credit Facility: A five-year nonamortizing $500.0 million revolving credit facility with variable annual interest, under which $4.5 million was outstanding on May 28, 2017. In addition to paying interest, we pay an annual commitment fee for undrawn amounts at a rate of 0.25% to 0.40% depending on our consolidated net leverage ratio. |
73
|
· |
Term Loan Facility: A five-year $675.0 million term loan amortizing in equal quarterly installments for a total of 5% annually, commencing in March 2017, with the balance payable in November 2021. |
|
· |
4.625% Senior Notes: An eight-year $833.0 million senior debt obligation with fixed annual interest, due November 1, 2024. |
|
· |
4.875% Senior Notes: A ten-year $833.0 million senior debt obligation with fixed annual interest, due November 1, 2026. |
Credit Facilities
Borrowings under the Credit Facilities bear interest at a floating rate per annum based upon the Base Rate or the Eurocurrency rate, in each case, plus an applicable margin which varies based upon our consolidated net leverage ratio. Margins range from 0.500% to 1.250% for Base Rate loans and from 1.500% to 2.250% for Eurocurrency Rate loans. The Base Rate is defined as the highest of (a) Bank of America’s prime rate, (b) the federal funds rate plus 0.500%, and (c) the Eurocurrency Rate with a term of one month plus 1.0%.
Upon the occurrence of an event of default, among other things, amounts outstanding under the Credit Agreement may be accelerated and the commitments may be terminated. Our obligations under the Credit Agreement are guaranteed by certain of our direct and indirect domestic subsidiaries on the terms set forth in the Credit Agreement. The Credit Agreement has a maturity date of November 9, 2021.
At May 28, 2017, we had $4.5 million of borrowings outstanding under our Revolving Credit Facility. At May 28, 2017, we had $493.7 million of availability on our Revolving Credit Facility, which is net of outstanding letters of credit of $1.8 million. For the period from November 28, 2016 through May 28, 2017, borrowings under our Revolving Credit Facility ranged from a low of $4.5 million to a high of $100.0 million. For the period from November 9, 2016, through May 28, 2017, the weighted average interest rate for our outstanding borrowings under the Revolving Credit Facility was 3.03%.
We are required to maintain the following financial covenant ratios under the Credit Agreement:
|
· |
Total net leverage ratio of 5.50 to 1.00, decreasing ratably to 4.50 to 1.00 on August 25, 2019 through maturity; and |
|
· |
Interest coverage ratio of 2.75 to 1.00. |
Our obligations under the Credit Facilities are guaranteed jointly and severally on a senior secured basis by each of our existing and future direct or indirect wholly owned domestic restricted subsidiaries, subject to an exclusion of immaterial subsidiaries.
The Credit Agreement and the indentures governing the Senior Notes contain covenants that, subject to exceptions, limit our ability and the ability of our subsidiaries to, among other things, incur, assume or guarantee additional indebtedness, pay distributions on, redeem or repurchase capital stock or redeem or repurchase subordinated debt, make loans and investments, incur or suffer to exist liens, sell, transfer or otherwise dispose of assets, enter into agreements that restrict distributions or other payments from restricted subsidiaries to us, engage in transactions with affiliates, designate subsidiaries as unrestricted or restricted, and consolidate, merge, amalgamate or transfer all or substantially all of our assets.
74
4.625% and 4.875% Senior Notes
The Senior Notes are senior unsecured obligations and rank equally with all of our present and future senior indebtedness, senior to all our future subordinated indebtedness and effectively subordinated to all of our present and future senior secured indebtedness (including all borrowings with respect to the Credit Facilities to the extent of the value of the assets securing such indebtedness). Interest on the Senior Notes is due semiannually. Upon a change of control (as defined in the indentures governing the Senior Notes), we must offer to repurchase the Senior Notes at 101% of the principal amount, plus accrued and unpaid interest.
We may redeem all or a portion of the 4.625% Senior Notes at any time on or after November 1, 2021, at declining prices starting at 102.313%, plus accrued and unpaid interest. We may redeem all or a portion of the 4.875% Senior Notes at any time on or after November 1, 2021, at declining prices starting at 102.438%, plus accrued and unpaid interest. Prior to November 1, 2021, we may redeem Senior Notes of either series, in whole at any time or in part, from time to time, at a price equal to 100% of the principal amount thereof, plus a make-whole premium, plus accrued and unpaid interest. We may also redeem up to 35% of the aggregate principal amount of either series of Senior Notes on or prior to November 1, 2019 in an aggregate amount equal to the net proceeds from certain equity offerings at redemption prices equal to 104.625% for the 4.625% Senior Notes and 104.875% for the 4.875% Senior Notes, plus, in each case, accrued and unpaid interest.
The Senior Notes are jointly and severally guaranteed on a senior unsecured basis by our domestic subsidiaries that guarantee our obligations under the Credit Agreement.
Other
The aggregate minimum principal maturities of our long-term debt, including current portion, for the next five fiscal years and thereafter, are as follows (dollars in millions):
|
|
|
|
|
Financing |
|
|
|
||
|
|
|
Debt (a) |
|
Obligations |
|
Total |
|||
|
2018 |
|
$ |
57.2 |
|
$ |
2.7 |
|
$ |
59.9 |
|
2019 |
|
|
35.4 |
|
|
2.5 |
|
|
37.9 |
|
2020 |
|
|
35.4 |
|
|
2.4 |
|
|
37.8 |
|
2021 |
|
|
35.5 |
|
|
2.1 |
|
|
37.6 |
|
2022 |
|
|
533.4 |
|
|
2.4 |
|
|
535.8 |
|
Thereafter |
|
|
1,687.2 |
|
|
63.8 |
|
|
1,751.0 |
|
|
|
$ |
2,384.1 |
|
$ |
75.9 |
|
$ |
2,460.0 |
|
(a) |
Debt includes $4.5 million of borrowings on the Revolving Credit Facility in the remainder of fiscal 2017 and $17.5 million under our other credit facilities in 2018. |
Conagra paid $25.4 million of costs in connection with the debt issuances described above and we paid $12.3 million. We amortize the costs in interest expense using the effective interest method over the life of the loans. In fiscal 2017, we recorded $2.5 million of amortization expense in “Interest expense” in our Combined and Consolidated Statements of Earnings.
Since the Separation during fiscal 2017, we have paid $48.8 million of interest on debt.
75
Other Credit Facilities
We have $58.0 million of other credit facilities, under which $17.5 million and $24.9 million were outstanding at May 28, 2017 and May 29, 2016, respectively. These facilities consist of an overdraft line, a fixed asset commitment, and a working capital facility. Borrowings under the facilities bear interest at a percentage of the stated rate, 4.35% at May 28, 2017, and may be prepaid without penalty. We guarantee the full amount of our subsidiary’s obligations to the financial institution up to the maximum amount of the credit facility.
Financing Obligations
During fiscal 2010, we completed the sale of approximately 17,600 acres of farmland to an unrelated buyer and immediately entered into an agreement with an affiliate of the buyer to lease back the farmland. Lamb Weston’s performance under the lease is guaranteed by Conagra. Conagra’s guarantee precludes accounting for this transaction as a sale and leaseback and, accordingly, the $75.0 million of proceeds received have been treated as a financing obligation and the land and related equipment remain on our Combined and Consolidated Balance Sheets. At May 28, 2017 and May 29, 2016, the remaining balance of the financing obligation was $68.2 million and $69.7 million, respectively, and the net carrying value of the related property was $39.9 million and $40.5 million, respectively. The lease agreement has a remaining initial term of three years and two five-year renewal options.
10. STOCK-BASED COMPENSATION
On October 29, 2016, our Board of Directors adopted the Lamb Weston Holdings, Inc. 2016 Stock Plan (“Stock Plan”). Under the Stock Plan, we may grant eligible employees and non-employee directors awards of stock options, cash, and stock-settled restricted stock units (“RSUs”), restricted stock awards, other awards based on our common stock, and performance-based long-term incentive awards (“Performance Shares”). At May 28, 2017, we had 10.0 million shares authorized under the Stock Plan, and 8.2 million were available for future grants.
Prior to the Separation Date, Conagra maintained equity incentive plans in which our employees and certain of our non-employee directors participated. Under these plans, Conagra could grant eligible employees awards of stock options, RSUs, restricted stock, and other awards based on its common stock, as well as Performance Shares. In addition, certain Lamb Weston employees participated in Conagra’s employee stock purchase plan, which allowed employees to purchase shares of Conagra common stock.
In connection with the Separation, outstanding Conagra stock options, RSUs and Performance Shares granted to Lamb Weston employees and non-employee directors under Conagra’s equity incentive plans were adjusted and converted into Lamb Weston stock awards under the Stock Plan. The awards were adjusted and converted in a manner intended to preserve the aggregate intrinsic value of the original Conagra equity award and are subject to substantially the same terms and conditions after the spinoff as the terms and conditions applicable to the original Conagra award prior to the Separation Date.
Stock Options
We grant options to employees for the purchase of stock at exercise prices equal to the fair market value of the underlying stock on the date of grant. Options generally become exercisable in three annual installments beginning on the first anniversary of the grant date and have a maximum term of ten years.
76
The fair value of each option is estimated on the grant date using a Black-Scholes option-pricing model with the following weighted average assumptions for stock options granted after the Separation Date:
|
Expected volatility (%) (a) |
|
|
23.94 |
|
Dividend yield (%) |
|
|
2.18 |
|
Risk-free interest rate (%) |
|
|
1.57 |
|
Expected life of stock option (years) |
|
|
3.4 |
|
(a) |
Because our equity shares have been traded for a relatively short period of time, we based our expected volatility assumption on the volatility of related industry stocks. |
The following table summarizes stock option activity for fiscal 2017:
|
|
|
|
|
|
Weighted- |
|
Weighted- |
|
|
|
||
|
|
|
|
|
|
Average |
|
Average |
|
Aggregate |
|||
|
|
|
|
|
|
Exercise |
|
Remaining |
|
Intrinsic |
|||
|
|
|
|
|
|
Price |
|
Contractual |
|
Value (a) |
|||
|
|
|
Shares |
|
(per share) |
|
Term (Years) |
|
(in millions) |
||||
|
Outstanding at May 29, 2016 |
|
|
— |
|
|
— |
|
|
|
|
|
|
|
Converted on November 9, 2016 |
|
|
607,420 |
|
$ |
23.60 |
|
|
|
|
|
|
|
Granted |
|
|
146,514 |
|
|
35.15 |
|
|
|
|
|
|
|
Exercised |
|
|
(22,896) |
|
|
21.90 |
|
|
|
|
|
|
|
Forfeited/cancelled |
|
|
(10,211) |
|
|
30.68 |
|
|
|
|
|
|
|
Outstanding at May 28, 2017 |
|
|
720,827 |
|
$ |
25.90 |
|
|
7.4 |
|
$ |
14.2 |
|
|
|
|
|
|
|
|
|
|
|
|
|
|
|
Exercisable at May 28, 2017 |
|
|
310,247 |
|
$ |
20.42 |
|
|
5.6 |
|
$ |
7.8 |
|
(a) |
The aggregate intrinsic values represent the total pre-tax intrinsic value (the difference between the closing price of our common stock on the last trading day of our fiscal 2017 fourth quarter, or May 26, 2017, and the exercise price, multiplied by the number of in-the-money options) that would have been received by the option holders had all option holders exercised their in-the-money options at the end of the fiscal year. The amount changes based on the fair market value of our common stock. |
RSUs and Performance Shares
We grant RSUs to eligible employees and non-employee directors. The employee RSUs generally vest over a three-year period while the non-employee director RSUs generally vest after one year. We estimate the fair value of the RSUs based upon the market price of our common stock at the date of grant. Certain RSU grants do not provide for the payment of dividend equivalents to the participant during the vesting period. For those grants, the value of the grants is reduced by the net present value of the foregone dividend equivalent payments.
Performance Shares are granted to certain executives and other key employees with vesting contingent upon meeting various Company-wide performance goals. Awards actually earned range from 0% to 220% of the targeted number of Performance Shares for each of the performance periods. Awards, if earned, will be paid in shares of our common stock. Subject to limited exceptions set forth in the Stock Plan, any shares earned will be distributed at the end of the three-year performance period. The value of the Performance Shares is adjusted based upon the market price of our common stock at the end of each reporting period and amortized as compensation expense over the vesting period.
77
The following table summarizes RSU and Performance Share activity for fiscal 2017:
|
|
|
Stock-Settled |
|
Cash-Settled |
|
Performance Shares |
||||||||||||
|
|
|
|
|
|
Weighted- |
|
|
|
|
Weighted- |
|
|
|
|
Weighted- |
|||
|
|
|
|
|
|
Average |
|
|
|
|
Average |
|
|
|
|
Average |
|||
|
|
|
|
|
|
Grant- |
|
|
|
|
Grant- |
|
|
|
|
Grant- |
|||
|
|
|
|
|
|
Date Fair |
|
|
|
|
Date Fair |
|
|
|
|
Date Fair |
|||
|
|
|
Shares |
|
Value |
|
Shares |
|
Value |
|
Shares |
|
Value |
||||||
|
Outstanding at May 29, 2016 |
|
|
— |
|
|
— |
|
|
— |
|
|
— |
|
|
— |
|
|
— |
|
Converted on November 9, 2016 |
|
|
459,466 |
|
$ |
25.05 |
|
|
469,837 |
|
$ |
25.33 |
|
|
56,050 |
|
$ |
25.84 |
|
Granted (a) |
|
|
86,642 |
|
|
33.96 |
|
|
— |
|
|
— |
|
|
1,640 |
|
|
25.84 |
|
Vested (b) |
|
|
(17,753) |
|
|
18.68 |
|
|
(1,503) |
|
|
23.70 |
|
|
— |
|
|
— |
|
Forfeited/expired/cancelled |
|
|
(38,751) |
|
|
24.24 |
|
|
(5,722) |
|
|
26.73 |
|
|
— |
|
|
— |
|
Outstanding at May 28, 2017 |
|
|
489,604 |
|
$ |
26.92 |
|
|
462,612 |
|
$ |
25.33 |
|
|
57,690 |
|
$ |
25.84 |
|
(a) |
Granted represents stock awards granted by us after the Separation and dividend equivalents accrued. |
|
(b) |
The aggregate fair value of awards that vested in fiscal 2017 was $0.7 million, which represents the market value of our common stock on the date that the RSUs vested. The number of RSUs vested includes shares of common stock that we withheld on behalf of employees to satisfy the minimum statutory tax withholding requirements. RSUs that are expected to vest are net of estimated future forfeitures. |
Compensation Expense
Prior to the Separation Date, Conagra charged us for the costs related to the portion of Conagra’s incentive plans in which Lamb Weston employees participated and an allocation of stock-based compensation costs of certain Conagra employees who provided general and administrative services on our behalf (see Note 3, Related Party Transactions). Our stock-based compensation expense is recorded in “Selling, general and administrative expenses.” Compensation expense for stock-based awards recognized in the Combined and Consolidated Statements of Earnings, net of forfeitures, was as follows (dollars in millions):
|
|
|
For the Fiscal Years Ended May |
|||||||
|
|
|
2017 |
|
2016 |
|
2015 |
|||
|
Stock options |
|
$ |
0.6 |
|
$ |
0.4 |
|
$ |
0.4 |
|
Stock-settled RSUs |
|
|
4.0 |
|
|
2.4 |
|
|
2.0 |
|
Cash-settled RSUs (a) |
|
|
9.7 |
|
|
5.7 |
|
|
4.4 |
|
Performance Shares |
|
|
1.1 |
|
|
0.4 |
|
|
0.1 |
|
Total compensation expense |
|
|
15.4 |
|
|
8.9 |
|
|
6.9 |
|
Income tax benefit (b) |
|
|
(5.7) |
|
|
(3.3) |
|
|
(2.5) |
|
Total compensation expense, net of tax benefit |
|
$ |
9.7 |
|
$ |
5.6 |
|
$ |
4.4 |
|
(a) |
All cash-settled RSUs are marked-to-market and presented within “Accrued liabilities” and “Other noncurrent liabilities” in our Combined and Consolidated Balance Sheets. |
|
(b) |
Income tax benefit determined using our marginal tax rate. |
78
Based on estimates at May 28, 2017, total unrecognized compensation expense related to stock-based payments was as follows (dollars in millions):
|
|
|
|
|
|
Remaining |
|
|
|
|
|
|
|
Weighted |
|
|
|
|
Unrecognized |
|
Average |
||
|
|
|
Compensation |
|
Recognition |
||
|
|
|
Expense |
|
Period (in years) |
||
|
Stock options |
|
$ |
1.2 |
|
|
1.6 |
|
Stock-settled RSUs |
|
|
7.1 |
|
|
2.0 |
|
Cash-settled RSUs |
|
|
7.3 |
|
|
1.7 |
|
Performance Shares |
|
|
0.9 |
|
|
1.7 |
|
Total unrecognized stock-based compensation expense |
|
$ |
16.5 |
|
|
1.8 |
11. FAIR VALUE MEASUREMENTS
FASB guidance establishes a three-level fair value hierarchy based upon the assumptions (inputs) used to price assets or liabilities. The three levels of inputs used to measure fair value are as follows:
Level 1—Unadjusted quoted prices in active markets for identical assets or liabilities,
Level 2—Observable inputs other than those included in Level 1, such as quoted prices for similar assets and liabilities in active markets or quoted prices for identical assets or liabilities in inactive markets, and
Level 3—Unobservable inputs reflecting our own assumptions and best estimate of what inputs market participants would use in pricing the asset or liability.
The following table presents our financial assets and liabilities measured at fair value on a recurring basis based upon the level within the fair value hierarchy in which the fair value measurements fall, as of May 28, 2017 and May 29, 2016 (dollars in millions):
|
|
|
As of May 28, 2017 |
||||||||||
|
|
|
Level 1 |
|
Level 2 |
|
Level 3 |
|
Total |
||||
|
Assets: |
|
|
|
|
|
|
|
|
|
|
|
|
|
Pension plan assets |
|
$ |
4.5 |
|
$ |
— |
|
$ |
— |
|
$ |
4.5 |
|
Deferred compensation assets |
|
|
0.6 |
|
|
— |
|
|
— |
|
|
0.6 |
|
Total assets |
|
|
5.1 |
|
|
— |
|
|
— |
|
|
5.1 |
|
Liabilities: |
|
|
|
|
|
|
|
|
|
|
|
|
|
Derivative liabilities (a) |
|
|
— |
|
|
2.4 |
|
|
— |
|
|
2.4 |
|
Deferred compensation liabilities (b) |
|
|
— |
|
|
8.8 |
|
|
— |
|
|
8.8 |
|
Total liabilities |
|
$ |
— |
|
$ |
11.2 |
|
$ |
— |
|
$ |
11.2 |
79
|
|
|
As of May 29, 2016 |
||||||||||
|
|
|
Level 1 |
|
Level 2 |
|
Level 3 |
|
Total |
||||
|
Assets: |
|
|
|
|
|
|
|
|
|
|
|
|
|
Derivative assets (a) |
|
$ |
1.4 |
|
$ |
0.6 |
|
$ |
— |
|
$ |
2.0 |
|
Deferred compensation assets |
|
|
0.7 |
|
|
— |
|
|
— |
|
|
0.7 |
|
Total assets |
|
|
2.1 |
|
|
0.6 |
|
|
— |
|
|
2.7 |
|
Liabilities: |
|
|
|
|
|
|
|
|
|
|
|
|
|
Derivative liabilities (a) |
|
|
— |
|
|
0.1 |
|
|
— |
|
|
0.1 |
|
Deferred compensation liabilities (b) |
|
|
— |
|
|
6.5 |
|
|
— |
|
|
6.5 |
|
Total liabilities |
|
$ |
— |
|
$ |
6.6 |
|
$ |
— |
|
$ |
6.6 |
|
(a) |
The fair values of our Level 2 derivative instruments were determined using valuation models that use market observable inputs including interest rate curves and both forward and spot prices for currencies and commodities. Derivative assets and liabilities included in Level 2 primarily represent commodity swap and forward purchase contracts. |
|
(b) |
The fair values of our Level 2 deferred compensation liabilities were valued using third-party valuations, which are based on the net asset values of mutual funds in our retirement plans. While the underlying assets are actively traded on an exchange, the funds are not. |
Certain assets and liabilities, including long-lived assets, goodwill, asset retirement obligations, and cost and equity investments are measured at fair value on a non-recurring basis.
At May 28, 2017, we had $1,688.7 million of fixed-rate and $695.4 million of variable-rate debt outstanding. Based on current market rates, the fair value of our fixed-rate debt at May 28, 2017 was estimated to be $1,724.1 million. Any differences between the book value and fair value are due to the difference between the period-end market interest rate and the stated rate of our fixed-rate debt. We estimated the fair value of our fixed-rate debt using quoted market prices (Level 2 inputs) within the fair value hierarchy that is described above. The fair value of our variable-rate term debt approximates the carrying amount as our cost of borrowing is variable and approximates current market prices.
12. DERIVATIVE FINANCIAL INSTRUMENTS
We use derivatives and other financial instruments to hedge exposures to commodity and currency risks. We do not hold or issue derivatives and other financial instruments for trading purposes. Prior to the Separation, Conagra exited all derivative instruments related to our businesses. The effect of exiting the positions was not significant to our financial results.
Certain raw materials used in our production processes are subject to price volatility caused by weather, supply conditions, political and economic variables and other unpredictable factors. To manage the volatility in earnings due to price fluctuations, we may utilize swap contracts, option contracts, or forward purchase contracts.
Derivative instruments are reported in the Combined and Consolidated Balance Sheets at their fair values, unless the derivative instruments qualify for the normal purchase normal sale exception (“NPNS”) under GAAP and such exception has been elected. If the NPNS exception is elected, the fair values of such contracts are not recognized.
We do not designate commodity derivatives to achieve hedge accounting treatment. The change in the fair value of the instruments used to reduce commodity price volatility is immediately recognized in earnings in cost of sales. In accordance with GAAP, we offset our derivative asset and liability balances where master netting arrangements with various counterparties provide for legal right of setoff. Our contracts are subject to enforceable master netting arrangements that provide rights of offset with each counterparty when amounts are payable on the same date in the same currency or in the case of certain specified defaults. As a result, we offset the fair value of recognized derivative assets and derivative
80
liabilities in our Combined and Consolidated Balance Sheets. No collateral was received or pledged in connection with these agreements.
The following table presents our derivatives at May 28, 2017 and May 29, 2016 (dollars in millions):
|
|
|
May 28, 2017 |
|||||||
|
|
|
|
|
|
|
|
|
Net Amounts |
|
|
|
|
Gross Amounts |
|
Gross Amounts Offset |
|
Presented in the |
|||
|
Derivative subject to master netting arrangements |
|
Recognized |
|
in the Balance Sheet |
|
Balance Sheet |
|||
|
Liabilities: |
|
|
|
|
|
|
|
|
|
|
Commodity contracts |
|
$ |
3.8 |
|
$ |
1.4 |
|
$ |
2.4 |
|
Accrued liabilities |
|
$ |
3.8 |
|
$ |
1.4 |
|
$ |
2.4 |
|
|
|
May 29, 2016 |
|||||||
|
|
|
|
|
|
|
|
|
Net Amounts |
|
|
|
|
Gross Amounts |
|
Gross Amounts Offset |
|
Presented in the |
|||
|
Derivative subject to master netting arrangements |
|
Recognized |
|
in the Balance Sheet |
|
Balance Sheet |
|||
|
Assets: |
|
|
|
|
|
|
|
|
|
|
Commodity contracts |
|
$ |
1.5 |
|
$ |
0.1 |
|
$ |
1.4 |
|
Foreign exchange contracts |
|
|
0.6 |
|
|
— |
|
|
0.6 |
|
Prepaid expenses and other current assets |
|
$ |
2.1 |
|
$ |
0.1 |
|
$ |
2.0 |
|
Liabilities: |
|
|
|
|
|
|
|
|
|
|
Commodity contracts |
|
$ |
0.2 |
|
$ |
0.1 |
|
$ |
0.1 |
|
Accrued liabilities |
|
$ |
0.2 |
|
$ |
0.1 |
|
$ |
0.1 |
The location and amount of gains (losses) from derivatives in our Combined and Consolidated Statements of Earnings were as follows (dollars in millions):
|
|
|
|
|
Amount of Gain (Loss) |
|||||||
|
|
|
|
|
Recognized on Derivatives in |
|||||||
|
|
|
Location in Consolidated |
|
Combined Statement of Earnings |
|||||||
|
Derivatives Not Designated as Hedging |
|
Statement of Earnings of Gain |
|
For the Fiscal Years Ended May |
|||||||
|
Instruments |
|
(Loss) Recognized on Derivatives |
|
2017 |
|
2016 |
|
2015 |
|||
|
Commodity contracts |
|
Cost of sales |
|
$ |
(2.0) |
|
$ |
(5.4) |
|
$ |
(11.4) |
|
Foreign exchange contracts |
|
Selling, general and administrative expenses |
|
|
(0.1) |
|
|
0.8 |
|
|
1.1 |
|
Total loss from derivative instruments not designed as hedging instruments |
|
|
|
$ |
(2.1) |
|
$ |
(4.6) |
|
$ |
(10.3) |
As of May 28, 2017, our open commodity contracts had a gross notional value (defined as notional quantity times market value per notional quantity unit) of $56.0 million and $88.6 million for purchase and sales contracts, respectively. As of May 29, 2016, our open commodity contracts had a gross notional value of $32.8 million and $13.6 million for purchase and sales contracts, respectively.
81
13. STOCKHOLDERS’ EQUITY
In connection with the Separation, we amended and restated our certificate of incorporation to authorize 600,000,000 shares of common stock and 60,000,000 shares of preferred stock. We had 146,080,901 shares of common stock issued and outstanding as of May 28, 2017. Each share of common stock entitles the holder to one vote on matters to be voted on by our stockholders. No preferred stock was issued or outstanding on May 28, 2017.
Dividends
During fiscal 2017, we paid $27.4 million of dividends to stockholders. On June 2, 2017, we paid $27.4 million of dividends to stockholders of record as of April 30, 2017. On July 20, 2017 our Board of Directors declared a dividend of $0.1875 per share of common stock. The dividend will be paid on September 1, 2017 to stockholders of record as of the close of business on August 4, 2017.
Accumulated Other Comprehensive Loss
Comprehensive income includes net income, currency translation adjustments, and changes in prior service cost and net actuarial gains (losses) from pension plans of an equity method investee. We generally deem our foreign investments to be essentially permanent in nature and we do not provide for taxes on currency translation adjustments arising from converting the investment denominated in a foreign currency to the U.S. dollar. When we determine that a foreign investment, as well as undistributed earnings, are no longer permanent in nature, estimated taxes are provided for the related deferred tax liability (asset), if any, resulting from currency translation adjustments.
The following table details the accumulated balances for each component of other comprehensive income (loss), net of tax (except for currency translation adjustments):
|
|
|
For the Fiscal Years Ended May |
|||||||
|
|
|
2017 |
|
2016 |
|
2015 |
|||
|
Unrealized currency translation gains (losses) |
|
$ |
(10.3) |
|
$ |
(9.2) |
|
$ |
(3.7) |
|
Pension benefit obligations, net of reclassification adjustments |
|
|
1.0 |
|
|
— |
|
|
(1.4) |
|
Accumulated other comprehensive income (loss) |
|
$ |
(9.3) |
|
$ |
(9.2) |
|
$ |
(5.1) |
Changes in AOCI, net of taxes, by component follows (dollars in millions). Amounts in parentheses indicate losses.
|
|
|
|
|
|
|
|
|
|
|
|
|
|
Foreign |
|
|
|
|
|
|
|
|
|
|
Currency |
|
Pension and |
|
|
|
||
|
|
|
Translation |
|
Post-Retirement |
|
|
|
||
|
|
|
Gains (Losses) |
|
Benefits |
|
Total |
|||
|
Balance as of May 31, 2015 |
|
$ |
(3.7) |
|
$ |
(1.4) |
|
$ |
(5.1) |
|
Other comprehensive income before reclassifications, net of tax |
|
|
(5.5) |
|
|
5.4 |
|
|
(0.1) |
|
Amounts reclassified from AOCI, net of tax |
|
|
— |
|
|
(4.0) |
|
|
(4.0) |
|
Net current-period other comprehensive income |
|
|
(5.5) |
|
|
1.4 |
|
|
(4.1) |
|
Balance as of May 29, 2016 |
|
$ |
(9.2) |
|
$ |
— |
|
$ |
(9.2) |
|
Other comprehensive income before reclassifications, net of tax |
|
|
(1.1) |
|
|
1.0 |
|
|
(0.1) |
|
Amounts reclassified from AOCI, net of tax |
|
|
— |
|
|
— |
|
|
— |
|
Net current-period other comprehensive income |
|
|
(1.1) |
|
|
1.0 |
|
|
(0.1) |
|
Balance as of May 28, 2017 |
|
$ |
(10.3) |
|
$ |
1.0 |
|
$ |
(9.3) |
82
The net amount of settlement gains on pension and post-retirement benefits included in accumulated OCI to be amortized over the next 12 months is a net gain of $0.2 million ($0.1 million after-tax).
During fiscal 2016, Lamb Weston reclassified a gain of $5.3 million ($4.0 million after-tax), from accumulated other comprehensive income (loss) related to the settlement of Lamb-Weston/Meijer. This gain is reflected within equity method investment earnings. There were no reclassifications from accumulated other comprehensive income (loss) into income for fiscal 2017 and 2015.
14. SEGMENTS
We have four operating segments, each of which are reportable segments: Global, Foodservice, Retail, and Other. Our chief operating decision maker receives periodic management reporting under this structure that generally focuses on the nature and scope of the customers’ business, which enables operating decisions, performance assessment, and resource allocation decisions at the segment level. The reportable segments are each managed by a general manager and supported by a cross functional team assigned to support the segment. We measure our segments’ product contribution margin, which is defined as net sales, less cost of sales and advertising and promotion expenses and excludes general corporate expenses, interest, and taxes. See “Part I, Item 1. Business” of this Form 10-K for more information on our segments.
|
|
|
For the Fiscal Years Ended May |
|
|||||||
|
(in millions) |
|
2017 |
|
2016 |
|
2015 |
|
|||
|
Net sales: |
|
|
|
|
|
|
|
|
|
|
|
Global |
|
$ |
1,624.8 |
|
$ |
1,549.4 |
|
$ |
1,512.9 |
|
|
Foodservice |
|
|
1,030.0 |
|
|
946.0 |
|
|
929.0 |
|
|
Retail |
|
|
384.9 |
|
|
372.1 |
|
|
355.6 |
|
|
Other |
|
|
128.3 |
|
|
126.3 |
|
|
127.5 |
|
|
Total net sales |
|
|
3,168.0 |
|
|
2,993.8 |
|
|
2,925.0 |
|
|
Product contribution margin (a): |
|
|
|
|
|
|
|
|
|
|
|
Global |
|
|
343.0 |
|
|
296.5 |
|
|
253.7 |
|
|
Foodservice |
|
|
333.1 |
|
|
254.7 |
|
|
246.0 |
|
|
Retail |
|
|
78.3 |
|
|
69.6 |
|
|
47.6 |
|
|
Other |
|
|
9.5 |
|
|
21.0 |
|
|
20.6 |
|
|
Total product contribution margin |
|
|
763.9 |
|
|
641.8 |
|
|
567.9 |
|
|
Equity method investment earnings (b) |
|
|
53.3 |
|
|
71.7 |
|
|
42.7 |
|
|
Total product contribution margin plus equity method investment earnings |
|
|
817.2 |
|
|
713.5 |
|
|
610.6 |
|
|
Other selling, general and administrative expenses (a) (c) |
|
|
245.6 |
|
|
268.5 |
|
|
186.5 |
|
|
Interest expense, net |
|
|
61.2 |
|
|
5.9 |
|
|
6.1 |
|
|
Income tax expense |
|
|
170.2 |
|
|
144.5 |
|
|
140.4 |
|
|
Net income |
|
|
340.2 |
|
|
294.6 |
|
|
277.6 |
|
|
Less: Income attributable to noncontrolling interests |
|
|
13.3 |
|
|
9.3 |
|
|
9.3 |
|
|
Net income attributable to Lamb Weston Holdings, Inc. |
|
$ |
326.9 |
|
$ |
285.3 |
|
$ |
268.3 |
|
|
(a) |
Product contribution margin is defined as net sales, less cost of sales and advertising and promotions expenses. Other selling, general and administrative expenses include all selling, general and administrative expenses other than advertising and promotions expenses. |
|
(b) |
Fiscal 2016 includes a $17.7 million non-cash gain related to the settlement of a pension plan of our Lamb-Weston/Meijer joint venture. |
|
(c) |
Fiscal 2017 includes $26.5 million of pre-tax expenses related to the Separation, primarily related to professional fees, and a $3.1 million non-cash pre-tax gain on assets received during the period. |
83
Fiscal 2016 includes the following pre-tax charges: $5.3 million of expenses related to the Separation, and $59.5 million of non-cash charges reflecting Lamb Weston’s portion of the actuarial losses in excess of 10% of Conagra’s pension liability for Conagra sponsored plans.
Fiscal 2015 includes a $5.1 million non-cash gain on the sale of land received in connection with the bankruptcy of an onion products supplier.
Assets by Segment
The manufacturing assets of Lamb Weston are shared across all reporting segments. Output from these facilities used by each reporting segment can change from fiscal year to fiscal year. Therefore, it is impracticable to allocate those assets to the reporting segments, as well as disclose total assets by segment.
Concentrations
Lamb Weston’s largest customer, McDonald’s Corporation, accounted for approximately 11% of consolidated “Net sales” in each of fiscal years 2017, 2016, and 2015. Accounts receivable from one customer accounted for 10% and 11% of our consolidated accounts receivable at May 28, 2017 and May 29, 2016, respectively. Accounts receivable from an additional customer accounted for 11% of our consolidated accounts receivable at May 29, 2016.
Other Information
The net sales of each of our Global, Foodservice, and Retail reporting segments are comprised of sales of frozen potato and frozen sweet potato products. The net sales of our Other reporting segment included vegetable sales of $81.6 million, $70.4 million, and $74.7 million, various byproduct sales of $35.4 million, $46.4 million, and $38.6 million, and dairy product sales of $11.3 million, $9.5 million, and $14.2 million in fiscal 2017, 2016, and 2015, respectively. Product contribution margin is defined as net sales, less cost of goods sold and advertising and promotions expenses.
Our operations are principally in the United States. With respect to operations outside of the United States, no single foreign country or geographic region was significant with respect to consolidated operations in fiscal 2017, 2016, and 2015. Foreign net sales, including sales by domestic segments to customers located outside of the United States and Canada, were approximately $663.5 million, $615.9 million, and $577.0 million, in fiscal 2017, 2016, and 2015, respectively. Lamb Weston’s long-lived assets of our China operations accounted for less than 3% of our total assets.
Labor
At May 28, 2017, we had approximately 6,500 employees, excluding our joint ventures. Approximately 400 of these employees work outside of the United States. Approximately 27% of our hourly employees are parties to collective bargaining agreements on terms that we believe are typical for the industry in which we operate. Most of the union workers at our facilities are represented under contracts that expire at various times throughout the next several years. Approximately 8% expire in fiscal 2018. As these agreements expire, we believe they will be renegotiated on terms satisfactory to us.
15. COMMITMENTS, CONTINGENCIES, GUARANTEES, AND LEGAL PROCEEDINGS
We have financial commitments and obligations that arise in the ordinary course of our business. These include long-term debt (discussed in Note 9, Debt and Financing Obligations), lease obligations, purchase commitments for goods and services, and legal proceedings (discussed below).
84
Capital commitments
We have capital commitments of approximately $81.7 million and $86.0 million as of May 28, 2017 and May 29, 2016, respectively, in connection with the expansion and replacement of existing facilities and equipment.
Lease Obligations
We lease certain facilities, land, and transportation equipment under agreements that expire at various dates. Rent expense for operating leases was $63.0 million, $69.2 million, and $67.4 million in fiscal 2017, 2016, and 2015, respectively.
The minimum lease payments under non-cancellable operating leases with lease terms in excess of one year are as follows (dollars in millions):
|
2018 |
|
$ |
17.7 |
|
2019 |
|
|
14.4 |
|
2020 |
|
|
12.2 |
|
2021 |
|
|
8.2 |
|
2022 |
|
|
3.9 |
|
Thereafter |
|
|
12.4 |
|
Total |
|
$ |
68.8 |
Guarantees and Indemnifications
We provide guarantees, indemnifications, and other assurances to third parties in the normal course of our business. These include tort indemnifications, environmental assurances, and representations and warranties in commercial agreements. At May 28, 2017, we were not aware of any material liabilities arising from any guarantee, indemnification, or financial assurance we have provided. If we determined such a liability was probable and subject to reasonable determination, we would accrue for it at that time.
In certain limited situations, Lamb Weston will guarantee an obligation of an unconsolidated entity. At the time in which Lamb Weston initially provides such a guarantee, Lamb Weston assesses the risk of financial exposure to Lamb Weston under these agreements. Lamb Weston considers the credit-worthiness of the guaranteed party, the value of any collateral pledged against the related obligation, and any other factors that may mitigate Lamb Weston’s risk. Lamb Weston actively monitors market and entity-specific conditions that may result in a change of Lamb Weston’s assessment of the risk of loss under these agreements.
Lamb Weston is a party to various potato purchase supply agreements with growers, under which they deliver their potato crop from the contracted acres to Lamb Weston during the harvest season, and pursuant to the potato supply agreements, pricing for this inventory is determined after delivery, taking into account crop size and quality, among other factors. Lamb Weston paid $150.8 million, $142.4 million, and $136.2 million in fiscal 2017, 2016, and 2015, respectively, under the terms of the potato supply agreements. Amounts paid are initially recorded in inventory and charged to cost of sales as related inventories are produced and subsequently sold. Under the terms of these potato supply agreements, Lamb Weston has guaranteed repayment of short-term bank loans of the potato suppliers, under certain conditions. At May 28, 2017, Lamb Weston has effectively guaranteed $29.5 million of supplier loans. Lamb Weston has not established a liability for these guarantees, as Lamb Weston has determined that the likelihood of Lamb Weston’s required performance under the guarantees is remote. Under certain other potato supply agreements, Lamb Weston makes advances to growers prior to the delivery of potatoes. The aggregate amounts of these advances were $24.4 million and $15.7 million at May 28, 2017 and May 29, 2016, respectively.
85
Lamb-Weston/Meijer, a joint venture (see Note 6, Investments in Joint Ventures, for further information), headquartered in the Netherlands, manufactures and sells frozen potato products principally in Europe. Lamb Weston and Lamb Weston’s partner are jointly and severally liable for all legal liabilities of Lamb-Weston/Meijer. As of May 28, 2017 and May 29, 2016, the total liabilities of Lamb-Weston/Meijer were $210.0 million and $203.7 million, respectively. Lamb-Weston/Meijer is well capitalized, with partners’ equity of $320.2 million and $284.5 million as of May 28, 2017 and May 29, 2016, respectively. Lamb Weston has not established a liability on its balance sheets for the obligations of Lamb-Weston/Meijer, as Lamb Weston has determined the likelihood of any required payment by Lamb Weston to settle such liabilities of Lamb-Weston/Meijer is remote.
After taking into account liabilities recognized for all of the foregoing matters, management believes the ultimate resolution of such matters would not have a material adverse effect on Lamb Weston’s financial condition, results of operations, or cash flows. It is reasonably possible that a change to an estimate of the foregoing matters may occur in the future.
Legal Proceedings
We are a party to legal actions arising in the ordinary course of our business. These legal actions include commercial liability claims, premises liability claims, and employment-related claims, among others. As of the date of this filing, we do not believe that any of the legal actions against us would, either individually or in the aggregate, have a material adverse effect on our financial condition, results of operations, or cash flows. Costs of legal services associated with the foregoing matters are recognized in earnings as services are provided.
16. QUARTERLY FINANCIAL DATA (unaudited, dollars in millions, except per-share amounts and stock price information)
|
|
|
2017 (a) |
||||||||||
|
|
|
First |
|
Second |
|
Third |
|
Fourth |
||||
|
|
|
Quarter |
|
Quarter |
|
Quarter |
|
Quarter |
||||
|
Net sales |
|
$ |
776.3 |
|
$ |
790.7 |
|
$ |
768.5 |
|
$ |
832.5 |
|
Gross profit |
|
|
180.6 |
|
|
198.9 |
|
|
207.0 |
|
|
200.0 |
|
Income before income taxes and equity method earnings |
|
|
123.5 |
|
|
118.7 |
|
|
118.9 |
|
|
95.9 |
|
Income tax expense |
|
|
51.0 |
|
|
33.9 |
|
|
44.0 |
|
|
41.2 |
|
Net income attributable to Lamb Weston Holdings, Inc. |
|
|
79.6 |
|
|
87.2 |
|
|
84.2 |
|
|
75.9 |
|
Earnings per share |
|
|
|
|
|
|
|
|
|
|
|
|
|
Basic |
|
|
0.54 |
|
|
0.59 |
|
|
0.57 |
|
|
0.52 |
|
Diluted |
|
|
0.54 |
|
|
0.59 |
|
|
0.57 |
|
|
0.51 |
|
Dividends declared |
|
|
N/A |
|
|
N/A |
|
|
0.1875 |
|
|
0.1875 |
|
Stock price - high (b) |
|
|
N/A |
|
|
33.02 |
|
|
39.90 |
|
|
45.66 |
|
Stock price - low (b) |
|
|
N/A |
|
|
29.89 |
|
|
32.51 |
|
|
39.19 |
86
|
|
|
2016 (a) |
||||||||||
|
|
|
First |
|
Second |
|
Third |
|
Fourth |
||||
|
|
|
Quarter |
|
Quarter |
|
Quarter |
|
Quarter |
||||
|
Net sales |
|
$ |
747.8 |
|
$ |
740.3 |
|
$ |
728.7 |
|
$ |
777.0 |
|
Gross profit |
|
|
141.3 |
|
|
161.8 |
|
|
181.9 |
|
|
182.4 |
|
Income before income taxes and equity method earnings |
|
|
83.3 |
|
|
108.0 |
|
|
125.8 |
|
|
50.3 |
|
Income tax expense |
|
|
32.3 |
|
|
38.7 |
|
|
53.2 |
|
|
20.3 |
|
Net income attributable to Lamb Weston Holdings, Inc. |
|
|
62.0 |
|
|
73.3 |
|
|
107.4 |
|
|
42.6 |
|
Earnings per share |
|
|
|
|
|
|
|
|
|
|
|
|
|
Basic |
|
|
0.42 |
|
|
0.50 |
|
|
0.71 |
|
|
0.29 |
|
Diluted |
|
|
0.42 |
|
|
0.50 |
|
|
0.71 |
|
|
0.29 |
|
Dividends declared |
|
|
N/A |
|
|
N/A |
|
|
N/A |
|
|
N/A |
|
Stock price - high (b) |
|
|
N/A |
|
|
N/A |
|
|
N/A |
|
|
N/A |
|
Stock price - low (b) |
|
|
N/A |
|
|
N/A |
|
|
N/A |
|
|
N/A |
|
(a) |
The sum of quarterly amounts may not agree to our annual results due to rounding. |
|
(b) |
Our common stock is listed on the NYSE under the ticker symbol “LW.” All stock prices are closing prices as reported by the NYSE. |
ITEM 9. CHANGES IN AND DISAGREEMENTS WITH ACCOUNTANTS ON ACCOUNTING AND FINANCIAL DISCLOSURE
None.
ITEM 9A. CONTROLS AND PROCEDURES
Disclosure Controls and Procedures
Our management, with the participation of our Chief Executive Officer and Chief Financial Officer, carried out an evaluation of the effectiveness of the design and operation of our disclosure controls and procedures as defined in Rule 13a‑15(e) under the Securities Exchange Act of 1934 as of May 28, 2017. Based upon that evaluation, our Chief Executive Officer and Chief Financial Officer concluded that, as of the end of the period covered by this report, our disclosure controls and procedures were effective.
Changes in Internal Control over Financial Reporting
Our management, with the participation of our Chief Executive Officer and Chief Financial Officer, evaluated any change in our internal control over financial reporting that occurred during the quarter covered by this report and determined that there was no change in our internal control over financial reporting during the quarter covered by this report that has materially affected, or is reasonably likely to materially affect, our internal control over financial reporting.
Management's Report on Internal Control Over Financial Reporting
This Annual Report on Form 10-K does not include a report of management's assessment regarding internal control over financial reporting or an attestation report of our independent registered public accounting firm due to a transition period established by the rules of the SEC for newly public companies.
87
None.
ITEM 10. DIRECTORS, EXECUTIVE OFFICERS AND CORPORATE GOVERNANCE
Information required by this Item 10 is included under the headings “Executive Officers” and “Ethics and Governance” in Part 1, Item 1 of this Annual Report, and will be included under the headings “Item 1. Election of Directors,” “Corporate Governance – Code of Conduct and Code of Ethics for Senior Corporate Financial Officers,” “Corporate Governance – Section 16(a) Beneficial Ownership Reporting Compliance,” and “Board Committees and Membership – Audit Committee” in our definitive Proxy Statement for our Annual Meeting of Stockholders scheduled to be held on September 28, 2017 (“2017 Proxy Statement”). This information from the 2017 Proxy Statement is incorporated by reference into this Form 10-K.
ITEM 11. EXECUTIVE COMPENSATION
Information required by this Item 11 will be included under the headings “Board Committees and Membership – Compensation Committee,” “Non-Employee Director Compensation,” “Compensation Discussion and Analysis,” and “Executive Compensation Tables” in our 2017 Proxy Statement. This information is incorporated by reference into this Form 10-K.
ITEM 12. SECURITY OWNERSHIP OF CERTAIN BENEFICIAL OWNERS AND MANAGEMENT AND RELATED STOCKHOLDER MATTERS
The following table provides information about shares of our common stock that may be issued upon the exercise of options, warrants, and rights under existing equity compensation plans as of our most recent year ended May 28, 2017.
Equity Compensation Plan Information
|
|
|
|
|
|
|
|
|
Number of Securities |
|
|
|
|
Number of Securities to |
|
Weighted-Average |
|
Remaining Available for |
|||
|
|
|
be Issued Upon Exercise |
|
Exercise Price of |
|
Future Issuance Under |
|||
|
|
|
of Outstanding Options, |
|
Outstanding |
|
Equity Compensation Plans |
|||
|
|
|
Warrants, and Rights |
|
Options, Warrants, and |
|
(Excluding Securities |
|||
|
Plan Category |
|
(a) |
|
Rights (b) |
|
Reflected in Column (a)) (c) |
|||
|
Equity compensation plans approved by security holders |
|
|
1,341,923 |
|
$ |
25.97 |
|
|
8,154,751 |
|
Equity compensation plans not approved by security holders |
|
|
— |
|
|
— |
|
|
— |
|
Total |
|
|
1,341,923 |
|
$ |
25.97 |
|
|
8,154,751 |
|
(a) |
Includes outstanding stock options, RSUs and performance shares (assuming the target performance payout level) granted under the Lamb Weston Holdings, Inc. 2016 Stock Plan (the “2016 Stock Plan”). Awards granted to Lamb Weston employees prior to the spinoff were made by Conagra under its stockholder-approved equity plans and were adjusted and converted into Lamb Weston equity awards under the 2016 Stock Plan in connection with the spinoff. This number also includes shares payable with respect to certain compensation deferred under the Lamb Weston Holdings, Inc. Voluntary Deferred Compensation Plan and the Lamb Weston Holdings, Inc. Directors’ Deferred Compensation Plan. The number of securities to be issued excludes options that were exercised but not settled with our stock transfer agent as of May 28, 2017. |
|
(b) |
Weighted average exercise price of outstanding stock options only. |
88
|
(c) |
Represents shares available for issuance under the 2016 Stock Plan. |
Information related to the security ownership of certain beneficial owners, directors and management will be included in our 2017 Proxy Statement under the heading “Information on Stock Ownership” and is incorporated by reference into this Form 10-K.
ITEM 13. CERTAIN RELATIONSHIPS AND RELATED TRANSACTIONS, AND DIRECTOR INDEPENDENCE
Information required by this Item 13 will be included under the headings “Corporate Governance – Director Independence” and “Corporate Governance – Related Party Transactions” in our 2017 Proxy Statement. This information is incorporated by reference into this Form 10-K.
ITEM 14. PRINCIPAL ACCOUNTANT FEES AND SERVICES
Information required by this Item 14 will be included under the heading “Board Committees and Membership – Audit Committee” in our 2017 Proxy Statement. This information is incorporated by reference into this Form 10-K.
89
ITEM 15. EXHIBITS AND FINANCIAL STATEMENT SCHEDULES
|
a) |
List of documents filed as part of this report: |
|
1. |
Financial Statements |
All financial statements of the Company as set forth under Item 8 of this Annual Report on Form 10‑K.
|
2. |
Financial Statement Schedules |
The following consolidated financial statement schedule for fiscal 2017, 2016, and 2015 is included in this report.
Schedule II – Lamb Weston - Valuation and Qualifying Accounts (dollars in millions).
|
|
|
|
|
Additions |
|
|
|
|
|
|
||
|
|
|
|
|
|
Charged |
|
|
|
|
|
|
|
|
|
|
Balance |
|
to Costs, |
|
Deductions |
|
Balance |
||||
|
|
|
Beginning of |
|
Expenses |
|
from |
|
End of |
||||
|
|
|
Year |
|
and Equity |
|
Reserves |
|
Year |
||||
|
Year ended May 28, 2017 |
|
|
|
|
|
|
|
|
|
|
|
|
|
Allowance for doubtful accounts |
|
$ |
0.5 |
|
$ |
0.1 |
|
$ |
0.1 |
|
$ |
0.5 |
|
Deferred tax asset valuation allowance |
|
|
12.3 |
|
|
86.1 |
(a) |
|
— |
|
|
98.4 |
|
Total |
|
$ |
12.8 |
|
$ |
86.2 |
|
$ |
0.1 |
|
$ |
98.9 |
|
|
|
|
|
|
|
|
|
|
|
|
|
|
|
Year ended May 29, 2016 |
|
|
|
|
|
|
|
|
|
|
|
|
|
Allowance for doubtful accounts |
|
$ |
0.8 |
|
$ |
0.5 |
|
$ |
0.8 |
|
$ |
0.5 |
|
Deferred tax asset valuation allowance |
|
|
8.9 |
|
|
3.4 |
|
|
— |
|
|
12.3 |
|
Total |
|
$ |
9.7 |
|
$ |
3.9 |
|
$ |
0.8 |
|
$ |
12.8 |
|
|
|
|
|
|
|
|
|
|
|
|
|
|
|
Year ended May 31, 2015 |
|
|
|
|
|
|
|
|
|
|
|
|
|
Allowance for doubtful accounts |
|
$ |
0.5 |
|
$ |
0.5 |
|
$ |
0.2 |
|
$ |
0.8 |
|
Deferred tax asset valuation allowance |
|
|
3.9 |
|
|
5.0 |
|
|
— |
|
|
8.9 |
|
Total |
|
$ |
4.4 |
|
$ |
5.5 |
|
$ |
0.2 |
|
$ |
9.7 |
|
(a) |
Includes $83.3 million of additions charged to equity primarily the result of a step-up in tax basis of certain assets in connection with our Separation from Conagra. See Note 4, Income Taxes, of the Notes to Combined Consolidated Financial Statements in “Part II, Item 8. Financial Statements and Supplementary Data” of this Form 10 K. |
All other schedules are omitted because they are not applicable, or not required, or because the required information is included in the consolidated financial statements, notes thereto.
90
|
b) |
The following exhibits are filed as part of, or incorporated by reference into, this Annual Report on Form 10-K: |
|
Exhibit No. |
|
Descriptions |
|
|
|
|
|
2.1* |
|
Separation and Distribution Agreement, dated as of November 8, 2016, by and between ConAgra Foods, Inc. and Lamb Weston Holdings, Inc., incorporated herein by reference to Exhibit 2.1 of Lamb Weston Holdings, Inc.’s Current Report on Form 8‑K filed on November 10, 2016 (File No. 001‑37830) |
|
|
|
|
|
3.1 |
|
Amended and Restated Certificate of Incorporation of Lamb Weston Holdings, Inc., incorporated herein by reference to Exhibit 3.1 of Lamb Weston Holdings, Inc.’s Current Report on Form 8‑K filed on November 10, 2016 (File No. 001‑37830) |
|
|
|
|
|
3.2 |
|
Amended and Restated Bylaws of Lamb Weston Holdings, Inc., incorporated herein by reference to Exhibit 3.2 of Lamb Weston Holdings, Inc.’s Current Report on Form 8‑K filed on November 10, 2016 (File No. 001‑37830) |
|
|
|
|
|
4.1 |
|
2024 Notes Indenture, dated as of November 9, 2016, by and among Lamb Weston Holdings, Inc., the Guarantors (as defined therein) and Wells Fargo Bank, National Association, as trustee (including form of note relating to the 2024 Notes), incorporated herein by reference to Exhibit 4.1 of Lamb Weston Holdings, Inc.’s Current Report on Form 8‑K filed on November 10, 2016 (File No. 001‑37830) |
|
|
|
|
|
4.2 |
|
2026 Notes Indenture, dated as of November 9, 2016, by and among Lamb Weston Holdings, Inc., the Guarantors (as defined therein) and Wells Fargo Bank, National Association, as trustee (including form of note relating to the 2026 Notes), incorporated herein by reference to Exhibit 4.2 of Lamb Weston Holdings, Inc.’s Current Report on Form 8‑K filed on November 10, 2016 (File No. 001‑37830) |
|
|
|
|
|
10.1 |
|
Tax Matters Agreement, dated as of November 8, 2016, by and between ConAgra Foods, Inc. and Lamb Weston Holdings, Inc., incorporated herein by reference to Exhibit 10.1 of Lamb Weston Holdings, Inc.’s Current Report on Form 8‑K filed on November 10, 2016 (File No. 001‑37830) |
|
|
|
|
|
10.2 |
|
Employee Matters Agreement, dated as of November 8, 2016, by and between ConAgra Foods, Inc. and Lamb Weston Holdings, Inc., incorporated herein by reference to Exhibit 10.2 of Lamb Weston Holdings, Inc.’s Current Report on Form 8‑K filed on November 10, 2016 (File No. 001‑37830) |
|
|
|
|
|
10.3 |
|
Transition Services Agreement, dated as of November 8, 2016, by and between ConAgra Foods, Inc. and Lamb Weston Holdings, Inc., incorporated herein by reference to Exhibit 10.3 of Lamb Weston Holdings, Inc.’s Current Report on Form 8‑K filed on November 10, 2016 (File No. 001‑37830) |
|
|
|
|
|
10.4 |
|
Trademark License Agreement, dated as of November 8, 2016, by and between ConAgra Foods, Inc. and Lamb Weston Holdings, Inc., incorporated herein by reference to Exhibit 10.4 of Lamb Weston Holdings, Inc.’s Current Report on Form 8‑K filed on November 10, 2016 (File No. 001‑37830) |
|
|
|
|
|
10.5 |
|
Credit Agreement, dated as of November 9, 2016, by and among Lamb Weston Holdings, Inc., the guarantors party thereto, the lenders named therein, and Bank of America, N.A., as Administrative Agent, incorporated herein by reference to Exhibit 10.5 of Lamb Weston Holdings, Inc.’s Current Report on Form 8‑K filed on November 10, 2016 (File No. 001‑37830) |
|
|
|
|
91
|
10.6 |
|
Lamb Weston Holdings, Inc. 2016 Stock Plan, incorporated by reference to Exhibit 10.10 to Amendment No. 3 to Lamb Weston Holdings, Inc.’s Registration Statement on Form 10, filed October 5, 2016 (Commission File No. 001‑37830)** |
|
|
|
|
|
10.7 |
|
Lamb Weston Holdings, Inc. Executive Change of Control Severance Plan** |
|
|
|
|
|
10.8 |
|
Form of Lamb Weston Holdings, Inc. Executive Change of Control Severance Plan Participation Agreement** |
|
|
|
|
|
10.9 |
|
Lamb Weston Holdings, Inc. Voluntary Deferred Compensation Plan, incorporated herein by reference to Exhibit 4.3 of Lamb Weston Holdings, Inc.’s Registration Statement on Form S-8 filed on June 14, 2017 (Commission File No. 333-218742)** |
|
|
|
|
|
10.10 |
|
Lamb Weston Holdings, Inc. Director’s Deferred Compensation Plan, incorporated herein by reference to Exhibit 4.4 of Lamb Weston Holdings, Inc.’s Registration Statement on Form S-8 filed on June 14, 2017 (Commission File No. 333-218742)** |
|
|
|
|
|
10.11 |
|
Letter Agreement, dated as of August 25, 2016, between ConAgra Foods, Inc. and Micheline C. Carter, incorporated by reference to Exhibit 10.11 to Amendment No. 3 to Lamb Weston Holdings, Inc.’s Registration Statement on Form 10, filed October 5, 2016 (Commission File No. 001‑37830)** |
|
|
|
|
|
10.12 |
|
Letter Agreement, dated as of September 15, 2016, between ConAgra Foods, Inc. and Eryk J. Spytek, incorporated by reference to Exhibit 10.12 to Amendment No. 3 to Lamb Weston Holdings, Inc.’s Registration Statement on Form 10, filed October 5, 2016 (Commission File No. 001‑37830)** |
|
|
|
|
|
10.13 |
|
Interim Position and Non-Compete Agreement, dated as of September 28, 2016, by and between ConAgra Foods, Inc. and John Gehring, incorporated by reference to Exhibit 10.13 to Amendment No. 3 to Lamb Weston Holdings, Inc.’s Registration Statement on Form 10, filed October 5, 2016 (Commission File No. 001‑37830)** |
|
|
|
|
|
10.14 |
|
Interim Position and Non-Compete Agreement, dated as of November 16, 2016, by and between Lamb Weston Holdings, Inc. and John F. Gehring, incorporated herein by reference to Exhibit 10.2 of Lamb Weston Holdings, Inc.’s Current Report on Form 8‑K filed on November 11, 2016 (File No. 001‑37830)** |
|
|
|
|
|
10.15 |
|
Amendment No. 1 to Interim Position and Non-Compete Agreement, dated as of February 1, 2017, by and between Lamb Weston Holdings, Inc. and John F. Gehring, incorporated herein by reference to Exhibit 10.1 of Lamb Weston Holdings, Inc.’s Quarterly Report on Form 10-Q filed on April 6, 2017 (File No. 001-37830)** |
|
|
|
|
|
10.16 |
|
Letter Agreement, dated as of November 9, 2016, between Lamb Weston Holdings, Inc. and Robert M. McNutt, incorporated herein by reference to Exhibit 10.1 of Lamb Weston Holdings, Inc.’s Current Report on Form 8-K filed on November 17, 2016 (File No. 001-37830)** |
|
|
|
|
|
10.17 |
|
Form of Lamb Weston Holdings, Inc. Restricted Stock Unit Agreement (Cash-settled) (pre-March 2017), incorporated herein by reference to Exhibit 10.12 of Lamb Weston Holdings, Inc.’s Quarterly Report on Form 10-Q filed on January 10, 2017 (File No. 001-37830)** |
|
|
|
|
|
10.18 |
|
Form of Lamb Weston Holdings, Inc. Restricted Stock Unit Agreement (Stock-settled) (pre-March 2017), incorporated herein by reference to Exhibit 10.13 of Lamb Weston Holdings, Inc.’s Quarterly Report on Form 10-Q filed on January 10, 2017 (File No. 001-37830)** |
92
|
|
|
|
|
10.19 |
|
Form of Lamb Weston Holdings, Inc. Nonqualified Stock Option Agreement for Employees (pre-March 2017), incorporated herein by reference to Exhibit 10.14 of Lamb Weston Holdings, Inc.’s Quarterly Report on Form 10-Q filed on January 10, 2017 (File No. 001-37830)** |
|
|
|
|
|
10.20 |
|
Form of Lamb Weston Holdings, Inc. Restricted Stock Unit Agreement for Non-Employee Directors (pre-March 2017), incorporated herein by reference to Exhibit 10.15 of Lamb Weston Holdings, Inc.’s Quarterly Report on Form 10-Q filed on January 10, 2017 (File No. 001-37830)** |
|
|
|
|
|
10.21 |
|
Form of Lamb Weston Holdings, Inc. Restricted Stock Unit Agreement (Cash-settled) (post-July 2017)** |
|
|
|
|
|
10.22 |
|
Form of Lamb Weston Holdings, Inc. Restricted Stock Unit Agreement (Stock-settled) (post-July 2017)** |
|
|
|
|
|
10.23 |
|
Form of Lamb Weston Holdings, Inc. Nonqualified Stock Option Agreement for Employees (post-March 2017)** |
|
|
|
|
|
10.24 |
|
Form of Lamb Weston Holdings, Inc. Restricted Stock Unit Agreement for Non-Employee Directors (post-March 2017)** |
|
|
|
|
|
12.1 |
|
Statement Regarding Computation of Ratio of Earnings to Fixed Charges |
|
|
|
|
|
21.1 |
|
Subsidiaries of Lamb Weston Holdings, Inc. |
|
|
|
|
|
23.1 |
|
Consent of KPMG LLP |
|
|
|
|
|
31.1 |
|
Section 302 Certificate of Chief Executive Officer |
|
|
|
|
|
31.2 |
|
Section 302 Certificate of Chief Financial Officer |
|
|
|
|
|
32.1 |
|
Section 906 Certificate of Chief Executive Officer |
|
|
|
|
|
32.2 |
|
Section 906 Certificate of Chief Financial Officer |
|
|
|
|
|
101.1 |
|
The following materials from Lamb Weston Holdings, Inc.’s Annual Report on Form 10-K for the year ended May 28, 2017, formatted in XBRL (eXtensible Business Reporting Language): (i) the Combined and Consolidated Statements of Earnings, (ii) the Combined and Consolidated Statements of Comprehensive Income (Loss), (iii) the Combined and Consolidated Balance Sheets, (iv) the Combined and Consolidated Statements of Stockholders' Equity, (v) the Combined and Consolidated Statements of Cash Flows, (vi) Notes to Combined and Consolidated Financial Statements, and (vii) document and entity information.
|
* Certain exhibits and schedules have been omitted and the Company agrees to furnish supplementally to the SEC a copy of any omitted exhibits and schedules upon request.
** Management contract or compensatory plan.
93
Pursuant to the requirements of Section 13 or 15(d) of the Securities Exchange Act of 1934, the registrant has duly caused this report to be signed on its behalf by the undersigned, thereunto duly authorized.
|
|
LAMB WESTON HOLDINGS, INC. |
|
|
|
|
|
|
|
By: |
/s/ ROBERT M. MCNUTT |
|
|
|
Robert M. McNutt |
|
|
|
Senior Vice President and Chief Financial Officer |
|
|
|
|
|
|
Date: |
July 25, 2017 |
Pursuant to the requirements of the Securities Exchange Act of 1934, this report has been signed below by the following persons on behalf of the registrant and in the capacities and on the dates indicated:
|
Signature |
|
Title |
|
Date |
|
/s/ THOMAS P. WERNER |
|
President and Chief Executive Officer and Director |
|
July 25, 2017 |
|
Thomas P. Werner |
||||
|
|
|
|
|
|
|
/s/ ROBERT M. MCNUTT |
|
Senior Vice President and Chief Financial Officer |
|
July 25, 2017 |
|
Robert M. McNutt |
||||
|
|
|
|
|
|
|
/s/ BERNADETTE M. MADARIETA |
|
Vice President and Controller (Principal Accounting Officer) |
|
July 25, 2017 |
|
Bernadette M. Madarieta |
||||
|
|
|
|
|
|
|
/s/ TIMOTHY R. MCLEVISH |
|
Executive Chairman |
|
July 25, 2017 |
|
Timothy R. McLevish |
||||
|
|
|
|
|
|
|
/s/ CHARLES A. BLIXT |
|
Director |
|
July 25, 2017 |
|
Charles A. Blixt |
||||
|
|
|
|
|
|
|
/s/ ANDRE J. HAWAUX |
|
Director |
|
July 25, 2017 |
|
Andre J. Hawaux |
||||
|
|
|
|
|
|
|
/s/ WILLIAM G. JURGENSEN |
|
Director |
|
July 25, 2017 |
|
William G. Jurgensen |
||||
|
|
|
|
|
|
|
/s/ THOMAS P. MAURER |
|
Director |
|
July 25, 2017 |
|
Thomas P. Maurer |
||||
|
|
|
|
|
|
|
/s/ HALA G. MODDELMOG |
|
Director |
|
July 25, 2017 |
|
Hala G. Moddelmog |
||||
|
|
|
|
|
|
|
/s/ ANDREW J. SCHINDLER |
|
Director |
|
July 25, 2017 |
|
Andrew J. Schindler |
||||
|
|
|
|
|
|
|
/s/ MARIA RENNA SHARPE |
|
Director |
|
July 25, 2017 |
|
Maria Renna Sharpe |
94