Attached files
UNITED STATES
SECURITIES AND EXCHANGE COMMISSION
Washington, DC 20549
FORM 10-K
(Mark One)
x | ANNUAL REPORT PURSUANT TO SECTION 13 OR 15(d) OF THE SECURITIES EXCHANGE ACT OF 1934 For the fiscal year ended May 28, 2017 |
OR
o | TRANSITION REPORT PURSUANT TO SECTION 13 OR 15(d) OF THE SECURITIES EXCHANGE ACT OF 1934 For the transition period from to |
Commission File Number: 1-13666
DARDEN RESTAURANTS, INC.
(Exact name of Registrant as specified in its charter)
Florida | 59-3305930 | |
(State or other jurisdiction of incorporation or organization) | (IRS Employer Identification No.) | |
1000 Darden Center Drive, Orlando, Florida | 32837 | |
(Address of principal executive offices) | (Zip Code) | |
Registrant’s telephone number, including area code: (407) 245-4000
Securities registered pursuant to Section 12(b) of the Act:
Title of each class | Name of each exchange on which registered | |
Common Stock, without par value | New York Stock Exchange | |
Securities registered pursuant to Section 12(g) of the Act: None
Indicate by check mark if the Registrant is a well-known seasoned issuer, as defined in Rule 405 of the Securities Act. Yes x No ¨
Indicate by check mark if Registrant is not required to file reports pursuant to Section 13 or 15(d) of the Act. Yes ¨ No x
Indicate by check mark if the Registrant (1) has filed all reports required to be filed by Section 13 or 15(d) of the Securities Exchange Act of 1934 during the preceding 12 months (or for such shorter period that the Registrant was required to file such reports), and (2) has been subject to such filing requirements for the past 90 days. Yes x No¨
Indicate by check mark whether the Registrant has submitted electronically and posted on its corporate Web site, if any, every Interactive Data File required to be submitted and posted pursuant to Rule 405 of Regulation S-T during the preceding 12 months (or for such shorter period that the Registrant was required to submit and post such files). Yes x No ¨
Indicate by check mark if disclosure of delinquent filers pursuant to Item 405 of Regulation S-K is not contained herein, and will not be contained, to the best of Registrant’s knowledge, in definitive proxy or information statements incorporated by reference in Part III of this Form 10-K or any amendment to this Form 10-K.x
Indicate by check mark whether the Registrant is a large accelerated filer, an accelerated filer, a non-accelerated filer, or a smaller reporting company. See definition of “large accelerated filer,” “accelerated filer” and “smaller reporting company” in Rule 12b-2 of the Exchange Act. (Check one):
Large accelerated filer | x | Accelerated filer | o | ||
Non-accelerated filer | o | (Do not check if a smaller reporting company) | Smaller reporting company | o | |
Emerging growth company | o | ||||
If an emerging growth company, indicate by check mark if the registrant has elected not to use the extended transition period for complying with any new or revised financial accounting standards provided pursuant to Section 13(a) of the Exchange Act.¨
Indicate by check mark whether the Registrant is a shell company (as defined in Rule 12b-2 of the Act). Yes ¨ No x
The aggregate market value of Common Stock held by non-affiliates of the Registrant based on the closing price of $74.95 per share as reported on the New York Stock Exchange on November 25, 2016, was approximately: $7,059,180,000.
Number of shares of Common Stock outstanding as of May 28, 2017: 125,418,175 (excluding 1,263,682 shares held in the Company’s treasury).
DOCUMENTS INCORPORATED BY REFERENCE
Portions of the Registrant’s Proxy Statement for its Annual Meeting of Shareholders on September 21, 2017, to be filed with the Securities and Exchange Commission no later than 120 days after May 28, 2017, are incorporated by reference into Part III of this Report.
DARDEN RESTAURANTS, INC.
FORM 10-K
FISCAL YEAR ENDED MAY 28, 2017
TABLE OF CONTENTS
PART I | Page | |
Item 1. | ||
Item 1A. | ||
Item 1B. | ||
Item 2. | ||
Item 3. | ||
Item 4. | ||
PART II | ||
Item 5. | ||
Item 6. | ||
Item 7. | ||
Item 7A. | ||
Item 8. | ||
Item 9. | ||
Item 9A. | ||
Item 9B. | ||
PART III | ||
Item 10. | ||
Item 11. | ||
Item 12. | ||
Item 13. | ||
Item 14. | ||
PART IV | ||
Item 15. | ||
Cautionary Statement Regarding Forward-Looking Statements
Statements set forth in or incorporated into this report regarding the expected net increase in the number of our restaurants, U.S. same-restaurant sales, total sales growth, diluted net earnings per share growth, and capital expenditures in fiscal 2018, and all other statements that are not historical facts, including without limitation statements with respect to the financial condition, results of operations, plans, objectives, future performance and business of Darden Restaurants, Inc. and its subsidiaries that are preceded by, followed by or that include words such as “may,” “will,” “expect,” “intend,” “anticipate,” “continue,” “estimate,” “project,” “believe,” “plan,” “outlook” or similar expressions, are forward-looking statements within the meaning of the Private Securities Litigation Reform Act of 1995 and are included, along with this statement, for purposes of complying with the safe harbor provisions of that Act. Any forward-looking statements speak only as of the date on which such statements are made, and we undertake no obligation to update such statements for any reason to reflect events or circumstances arising after such date. By their nature, forward-looking statements involve risks and uncertainties that could cause actual results to differ materially from those set forth in or implied by such forward-looking statements. In addition to the risks and uncertainties of ordinary business obligations, and those described in information incorporated into this report, the forward-looking statements contained in this report are subject to the risks and uncertainties described in Item 1A below under the heading “Risk Factors.”
PART I
Item 1. BUSINESS
Introduction
Darden Restaurants, Inc. is a full-service restaurant company, and as of May 28, 2017, we owned and operated 1,695 restaurants through subsidiaries in the United States and Canada under the Olive Garden®, LongHorn Steakhouse®, Cheddar’s Scratch Kitchen®, The Capital Grille®, Yard House®, Seasons 52®, Bahama Breeze®, and Eddie V’s Prime Seafood® and Wildfish Seafood Grille® (collectively, Eddie V’s) trademarks. We served over 334 million meals in fiscal 2017. As of May 28, 2017, we also had 78 restaurants operated by independent third parties pursuant to area development and franchise agreements. The following table details the number of Darden owned and operated restaurants, as well as those operated under franchise agreements, as of May 28, 2017.
Number of restaurants | Olive Garden | LongHorn Steakhouse | Cheddar’s Scratch Kitchen | Yard House | The Capital Grille | Bahama Breeze | Seasons 52 | Eddie V’s (2) | Total | |||||||||
Owned and operated: | ||||||||||||||||||
United States (1) | 840 | 490 | 140 | 67 | 56 | 37 | 41 | 18 | 1,689 | |||||||||
Canada | 6 | — | — | — | — | — | — | — | 6 | |||||||||
Total | 846 | 490 | 140 | 67 | 56 | 37 | 41 | 18 | 1,695 | |||||||||
Franchised: | ||||||||||||||||||
United States (3) | 5 | 15 | 25 | — | — | — | — | — | 45 | |||||||||
Middle East | 4 | 2 | — | — | — | — | — | — | 6 | |||||||||
Central and South America | 20 | 2 | — | — | 1 | — | — | — | 23 | |||||||||
Malaysia | 2 | 2 | — | — | — | — | — | — | 4 | |||||||||
Total | 31 | 21 | 25 | — | 1 | — | — | — | 78 | |||||||||
(1) | Includes nine restaurants that are owned jointly by us and third parties, and managed by us. |
(2) | Includes 15 Eddie V’s and 3 Wildfish restaurants. |
(3) | Includes Puerto Rico. |
Darden Restaurants, Inc. is a Florida corporation incorporated in March 1995, and is the parent company of GMRI, Inc., also a Florida corporation. GMRI, Inc. and certain other of our subsidiaries own and operate our restaurants. GMRI, Inc. was originally incorporated in March 1968 as Red Lobster Inns of America, Inc. We were acquired by General Mills, Inc. in 1970 and became a separate publicly held company in 1995 when General Mills distributed all of our outstanding stock to the stockholders of General Mills. Our principal executive offices and restaurant support center are located at 1000 Darden Center Drive, Orlando, Florida 32837, telephone (407) 245-4000. Our corporate website address is www.darden.com. We make our reports on Forms 10-K, 10-Q and 8-K, and Section 16 reports on Forms 3, 4 and 5, and all amendments to those reports available free of charge on our website the same day as the reports are filed with or furnished to the Securities and Exchange Commission. Information on our website is not deemed to be incorporated by reference into this Form 10-K. Unless the context indicates otherwise, all references to “Darden,” “we,” “our” or “us” include Darden Restaurants, Inc., GMRI, Inc. and our respective subsidiaries.
On April 24, 2017, we completed the acquisition of Cheddar’s Scratch Kitchen for $799.0 million in total consideration. The acquired operations of Cheddar’s Scratch Kitchen included 140 company-owned restaurants and 25 franchised restaurants. The results of operations, financial position and cash flows of Cheddar’s Scratch Kitchen are included in our consolidated financial statements as of the date of acquisition. For additional information, see Note 2 of the Notes to Consolidated Financial Statements (Part II, Item 8 of this report).
On November 9, 2015, we completed the spin-off of Four Corners Property Trust, Inc. (Four Corners) with the pro rata distribution of 1 share of common stock for every 3 shares of Darden common stock to Darden shareholders. The separation included the transfer of 6 LongHorn Steakhouse restaurants and 418 restaurant properties to Four Corners.
We have a 52/53 week fiscal year ending the last Sunday in May. Our fiscal year 2017 ended May 28, 2017 and consisted of 52 weeks, fiscal 2016 ended May 29, 2016 and consisted of 52 weeks, and fiscal 2015 ended May 31, 2015 and consisted of 53 weeks.
1
The following description of our business should be read in conjunction with the information in Part II of this report under the caption “Item 7 - Management’s Discussion and Analysis of Financial Condition and Results of Operations” and “Item 8 - Financial Statements and Supplementary Data.”
Segment Information
We manage our restaurant brands in North America as operating segments. The brands operate principally in the U.S. within full-service dining. We aggregate our operating segments into reportable segments based on a combination of the size, economic characteristics and sub-segment of full-service dining within which each brand operates. We have four reportable segments: 1) Olive Garden, 2) LongHorn Steakhouse, 3) Fine Dining (which includes The Capital Grille and Eddie V’s) and 4) Other Business (which includes Cheddar’s Scratch Kitchen, Yard House, Seasons 52, Bahama Breeze, consumer-packaged goods and franchise revenues). External sales are derived principally from food and beverage sales, we do not rely on any major customers as a source of sales and the customers and long-lived assets of our reportable segments are predominantly in the U.S. There were no material transactions among reportable segments. Additional information about our segments, including financial information, is included in Note 6 of the Notes to Consolidated Financial Statements (Part II, Item 8 of this report).
Restaurant Brands
Olive Garden
Olive Garden is an internally-developed brand and is the largest full-service dining Italian restaurant operator in the United States. Olive Garden offers a variety of Italian foods featuring fresh ingredients presented simply with a focus on flavor and quality, and a broad selection of imported Italian wines. In 1982, Olive Garden opened its first restaurant in Orlando, Florida.
Most dinner menu entrée prices range from $9.00 to $23.00, and most lunch menu entrée prices range from $7.00 to $13.00. The price of each entrée includes as much fresh salad or soup and breadsticks as a guest desires. During fiscal 2017, the average check per person was approximately $18.00, with alcoholic beverages accounting for 6.6 percent of Olive Garden’s sales. Olive Garden maintains different menus for dinner and lunch and different menus across its trade areas to reflect geographic differences in consumer preferences, prices and selections, as well as a smaller portioned, lower-priced children’s menu.
LongHorn Steakhouse
LongHorn Steakhouse is a full-service steakhouse restaurant with locations primarily in the eastern United States, operating in an atmosphere inspired by the American West. LongHorn Steakhouse opened its first restaurant in 1981 and we acquired LongHorn Steakhouse in October 2007 as part of the RARE Hospitality International, Inc. (RARE) acquisition. LongHorn Steakhouse restaurants feature a variety of menu items including signature fresh steaks and chicken, as well as salmon, shrimp, ribs, pork chops, burgers and prime rib.
Most dinner menu entrée prices range from $12.00 to $25.00, and most lunch menu entrée prices range from $8.00 to $15.50. The price of most entrées includes a side and/or salad and as much freshly baked bread as a guest desires. During fiscal 2017, the average check per person was approximately $21.00, with alcoholic beverages accounting for 9.6 percent of LongHorn Steakhouse’s sales. LongHorn Steakhouse maintains different menus for dinner and lunch and different menus across its trade areas to reflect geographic differences in consumer preferences, prices and selections, as well as a smaller portioned, lower-priced children’s menu.
Cheddar’s Scratch Kitchen
Cheddar’s Scratch Kitchen is a full service restaurant operating primarily in Texas and throughout the southern, midwestern and mid-Atlantic regions of the United States. The casual dining menu features modern classics and American favorites cooked from scratch. Cheddar’s Scratch Kitchen opened its first restaurant in 1979 and we acquired Cheddar’s Scratch Kitchen in April 2017.
Most lunch and dinner menu entrée prices at Cheddar’s Scratch Kitchen range from $5.99 to $19.99. Cheddar’s Scratch Kitchen features different menus across its trade areas to reflect geographic differences in consumer preferences, prices and selections, as well as a smaller portioned, lower-priced children’s menu.
Yard House
Yard House is a full-service restaurant operating in metropolitan areas across the United States and is known for great food, classic rock and over 100 draft beer offerings. The American menu includes more than 100 chef driven items with a wide range of appetizers, snacks, burgers and steaks, street tacos, salads, sandwiches, fresh fish and a generous selection of vegetarian dishes. Yard House opened its first restaurant in 1996 and we acquired Yard House in August 2012.
2
Yard House design elements create a contemporary, yet casual, “come as you are” environment. Most lunch and dinner menu entrée prices at Yard House range from $9.00 to $33.00. During fiscal 2017, the average check per person was approximately $32.00, with alcoholic beverages accounting for 36.6 percent of Yard House’s sales. Yard House maintains different menus and selections of craft beers across its trade areas to reflect geographic differences in consumer preferences, prices and selections, as well as a smaller portioned, lower-priced children’s menu.
The Capital Grille
The Capital Grille is a fine dining restaurant with locations in major metropolitan cities in the United States featuring relaxed elegance and style. The Capital Grille opened its first restaurant in 1990 and we acquired The Capital Grille in October 2007 as part of the RARE acquisition. Nationally acclaimed for dry aging steaks on the premises, The Capital Grille is also known for fresh seafood flown in daily and culinary specials created by its chefs. The restaurants feature an award-winning wine list offering over 350 selections, personalized service, a comfortable club-like atmosphere, and premiere private dining rooms.
Most dinner menu entrée prices range from $18.00 to $62.00 and most lunch menu entrée prices range from $18.00 to $39.00. During fiscal 2017, the average check per person was approximately $79.50, with alcoholic beverages accounting for 28.8 percent of The Capital Grille’s sales. The Capital Grille offers different menus for dinner and lunch and varies its wine list to reflect geographic differences in consumer preferences, prices and selections.
Bahama Breeze
Bahama Breeze is an internally-developed full-service restaurant brand operating primarily in the eastern United States, that offers guests the feeling of a Caribbean escape, with food, drinks and atmosphere found in the islands. The menu features distinctive, Caribbean-inspired fresh seafood, chicken and steaks as well as handcrafted tropical cocktails. In 1996, Bahama Breeze opened its first restaurant in Orlando, Florida.
Most lunch and dinner menu entrée prices at Bahama Breeze range from $7.50 to $30.00. During fiscal 2017, the average check per person was approximately $28.50, with alcoholic beverages accounting for 23.8 percent of Bahama Breeze’s sales. Bahama Breeze maintains different menus across its trade areas to reflect geographic differences in consumer preferences, prices and selections, as well as a smaller portioned, lower-priced children’s menu.
Seasons 52
Seasons 52 is an internally-developed full-service restaurant brand operating primarily in the eastern United States, with a casually sophisticated, fresh grill and wine bar that offers a seasonally changing menu inspired by the appeal of a local farmer’s market. The menu includes an international collection of more than 100 wines, with 52 available by the glass, along with exceptional signature handcrafted cocktails. In 2003, Seasons 52 opened its first restaurant in Orlando, Florida.
Most dinner menu entrée prices at Seasons 52 range from $14.00 to $32.00, and most lunch entrée prices range from $10.00 to $32.00. During fiscal 2017, the average check per person was approximately $45.00, with alcoholic beverages accounting for 25.2 percent of Seasons 52’s sales. Seasons 52 maintains different menus for dinner and lunch and different menus across its trade areas to reflect geographic differences in consumer preferences, prices and selections.
Eddie V’s
Eddie V’s is a fine dining restaurant with locations in major metropolitan cities in the United States with a sophisticated and contemporary ambiance, featuring live nightly music in the V-Lounge. The menu is inspired by the great classic restaurants of New Orleans, San Francisco and Boston, with an emphasis on prime seafood creations, USDA prime beef and chops, and fresh oyster bar selections. The atmosphere provides a comfortable dining experience “where your pleasure is our sole intention.” Wildfish Seafood Grille is a full-service restaurant providing a dining experience focused on comfort and excitement with fresh seafood daily and high quality USDA steaks. Eddie V’s opened its first restaurant in 2000 and we acquired eight Eddie V’s Prime Seafood restaurants and three Wildfish Seafood Grille restaurants in November 2011.
Most dinner menu entrée prices at Eddie V’s range from $20.00 to $61.00. During fiscal 2017, the average check per person was approximately $93.00, with alcoholic beverages accounting for 30.7 percent of Eddie V’s sales. Eddie V’s maintains different menus for dinner and varies its wine list to reflect geographic differences in consumer preferences, prices and selections.
3
The following table shows our growth and lists the number of restaurants owned and operated by each of our brands as of the end of the fiscal years indicated. The table excludes our restaurants operated by independent third parties pursuant to area development and franchise agreements. The final column in the table lists our total sales from continuing operations for the fiscal years indicated.
Fiscal Year | Olive Garden | LongHorn Steakhouse | Cheddar’s Scratch Kitchen | Yard House | The Capital Grille | Bahama Breeze | Seasons 52 | Eddie V’s | Total Restaurants (1)(2) | Total Sales (in millions) | ||||||||||
1998 | 466 | 3 | 469 | $1,386.9 | ||||||||||||||||
1999 | 464 | 6 | 470 | $1,490.2 | ||||||||||||||||
2000 | 469 | 11 | 480 | $1,615.7 | ||||||||||||||||
2001 | 477 | 16 | 493 | $1,780.0 | ||||||||||||||||
2002 | 496 | 22 | 518 | $1,966.1 | ||||||||||||||||
2003 | 524 | 25 | 1 | 550 | $2,097.5 | |||||||||||||||
2004 | 543 | 23 | 1 | 567 | $2,359.3 | |||||||||||||||
2005 | 563 | 23 | 3 | 589 | $2,542.4 | |||||||||||||||
2006 | 582 | 23 | 5 | 610 | $2,775.8 | |||||||||||||||
2007 | 614 | 23 | 7 | 644 | $2,965.2 | |||||||||||||||
2008 | 653 | 305 | 32 | 23 | 7 | 1,020 | $3,997.5 | |||||||||||||
2009 | 691 | 321 | 37 | 24 | 8 | 1,081 | $4,593.1 | |||||||||||||
2010 | 723 | 331 | 40 | 25 | 11 | 1,130 | $4,626.8 | |||||||||||||
2011 | 754 | 354 | 44 | 26 | 17 | 1,196 | $4,980.3 | |||||||||||||
2012 | 792 | 386 | 46 | 30 | 23 | 11 | 1,289 | $5,327.1 | ||||||||||||
2013 | 828 | 430 | 44 | 49 | 33 | 31 | 12 | 1,431 | $5,921.0 | |||||||||||
2014 | 837 | 464 | 52 | 54 | 37 | 38 | 15 | 1,501 | $6,285.6 | |||||||||||
2015 | 846 | 480 | 59 | 54 | 36 | 43 | 16 | 1,534 | $6,764.0 | |||||||||||
2016 | 843 | 481 | 65 | 54 | 37 | 40 | 16 | 1,536 | $6,933.5 | |||||||||||
2017 | 846 | 490 | 140 | 67 | 56 | 37 | 41 | 18 | 1,695 | $7,170.2 | ||||||||||
(1) | Includes only restaurants included in continuing operations. Excludes other restaurant brands operated by us in these years that are no longer owned by us, and restaurants that were classified as discontinued operations. |
(2) | Includes company-owned synergy restaurants as follows: one in fiscal 2011, one in fiscal 2012, four in fiscal 2013, and four in fiscal 2014. We converted the four synergy restaurants to Olive Garden restaurants in the first quarter of fiscal 2015. |
Strategy
We believe that capable operators of strong multi-unit brands have the opportunity to increase their share of the restaurant industry’s full-service segment. Generally, the restaurant industry is considered to be comprised of three segments: quick service, fast casual, and full service. All of our restaurants fall within the full-service segment, which is highly fragmented and includes many independent operators and small chains. We believe we have strong brands, and that the breadth and depth of our experience and expertise sets us apart in the full-service restaurant industry. This collective capability is the product of investments over many years in areas that are critical to success in our business, including restaurant operations excellence, brand management excellence, supply chain, talent management and information technology, among other things.
During fiscal 2017, our operating philosophy remained focused on improving the core operational fundamentals of the business by providing an outstanding guest experience rooted in culinary innovation, attentive service, engaging atmosphere, and integrated marketing. Darden enables each brand to reach its full potential by leveraging its scale, insight, and experience in a way that protects uniqueness and competitive advantages. Additionally, brands can capitalize on insights to deliver customized one-to-one customer relationship marketing. We hold ourselves accountable for operating our restaurants with a sense of urgency to achieve our commitments to all of our stakeholders.
4
Recent and Planned Restaurant Growth
During fiscal 2017, we added 159 net new company-owned restaurants in the United States, including the Cheddar’s Scratch Kitchen company-owned restaurants acquired in April 2017. Our fiscal 2017 actual restaurant openings and closings, fiscal 2018 projected openings, and approximate capital investment, square footage and dining capacity, by brand, are shown below.
Actual - Fiscal 2017 | Projected - Fiscal 2018 | Pro-Forma New Restaurants | |||||||||||||
Restaurant Openings | Acquired (1) | Restaurant Closings | New Restaurant Openings | Capital Investment Range (2) (in millions) | Square Feet (3) | Dining Seats (4) | |||||||||
Olive Garden | 7 | — | 4 | 10 - 12 | $3.5 | - | $4.5 | 7,700 | 240 | ||||||
LongHorn Steakhouse | 10 | — | 1 | 10 - 13 | $2.5 | - | $3.5 | 5,600 | 190 | ||||||
Cheddar’s Scratch Kitchen | — | 140 | — | 4 - 5 | $3.0 | - | $4.0 | 8,000 | 280 | ||||||
Yard House | 3 | — | 1 | 2 - 4 | $6.0 | - | $7.0 | 11,500 | 380 | ||||||
The Capital Grille | 2 | — | — | 1 - 2 | $5.0 | - | $6.0 | 9,500 | 250 | ||||||
Bahama Breeze | 1 | — | 1 | 1 - 2 | $4.5 | - | $5.5 | 10,700 | 360 | ||||||
Seasons 52 | 1 | — | — | 1 - 2 | $5.0 | - | $6.0 | 9,000 | 300 | ||||||
Eddie V’s | 2 | — | — | 1 - 2 | $5.5 | - | $6.5 | 9,000 | 180 | ||||||
Totals | 26 | 140 | 7 | 35 - 40 | |||||||||||
(1) | Includes the 140 Cheddar’s Scratch Kitchen acquired restaurants. |
(2) | Includes cash investments for building, equipment, furniture and other construction costs; excludes internal capitalized overhead, pre-opening expenses, tenant allowance and future lease obligations. Olive Garden, LongHorn Steakhouse and Cheddar’s Scratch Kitchen capital investments are based on costs associated with land-only leases; The Capital Grille, Bahama Breeze, Seasons 52, Eddie V’s and Yard House capital investments are based on ground and building leases. Actual costs can vary significantly depending on the specific location. |
(3) | Includes all space under the roof, including the coolers and freezers. |
(4) | Includes bar dining seats and patio seating, but excludes bar stools. |
The actual number of openings for each of our brands for fiscal 2018 will depend on many factors, including our ability to locate appropriate sites, negotiate acceptable purchase or lease terms, obtain necessary local governmental permits, complete construction, and recruit and train restaurant management and hourly personnel. Our objective is to continue to expand all of our restaurant brands.
We consider location to be a critical factor in determining a restaurant’s long-term success, and we devote significant effort to the site selection process. Prior to entering a market, we conduct a thorough study to determine the optimal number and placement of restaurants. Our site selection process incorporates a variety of analytical techniques to evaluate key factors. These factors include trade area demographics, such as target population density and household income levels; competitive influences in the trade area; the site’s visibility, accessibility and traffic volume; and proximity to activity centers such as shopping malls, hotel/motel complexes, offices and universities. Members of senior management evaluate, inspect and approve each restaurant site prior to its acquisition. Constructing and opening a new restaurant typically takes approximately 180 days on average after permits are obtained and the site is acquired.
We systematically review the performance of our restaurants to ensure that each one meets our standards. When a restaurant falls below minimum standards, we conduct a thorough analysis to determine the causes, and implement marketing and operational plans to improve that restaurant’s performance. If performance does not improve to acceptable levels, the restaurant is evaluated for relocation, closing or conversion to one of our other brands. Permanent closures are typically due to economic changes in trade areas, the expiration of lease agreements, or site concerns. Accordingly, we continue to evaluate our site locations in order to minimize the risk of future closures or asset impairment charges.
Cheddar’s Scratch Kitchen Integration
We acquired Cheddar’s Scratch Kitchen on April 24, 2017, approximately five weeks before the end of our fiscal year. We plan to integrate many of Cheddar’s Scratch Kitchen’s operations into the Darden operational model during the 2018 fiscal year. The descriptions of our restaurant operations below do not include Cheddar’s Scratch Kitchen unless specifically mentioned.
5
Restaurant Operations
We believe that high-quality restaurant management is critical to our long-term success. Our restaurant management structure varies by brand and restaurant size. We issue detailed operations manuals covering all aspects of restaurant operations, as well as food and beverage manuals which detail the preparation procedures of our recipes. The restaurant management teams are responsible for the day-to-day operation of each restaurant and for ensuring compliance with our operating standards.
Each Olive Garden restaurant is led by a general manager, and each LongHorn Steakhouse restaurant is led by a managing partner. Each also has three to five additional managers, depending on the operating complexity and sales volume of the restaurant. In addition, each restaurant typically employs an average of 80 to 120 hourly team members, most of whom work part-time. Restaurant general managers or managing partners report to a director of operations who is responsible for approximately seven to ten restaurants. Each director of operations of Olive Garden and LongHorn Steakhouse reports to a Senior Vice President of Operations who is responsible for up to one hundred restaurants. Restaurants are visited regularly by operations management, including officer level executives, to help ensure strict adherence to all aspects of our standards.
Each Cheddar’s Scratch Kitchen restaurant is led by a general manager or managing partner. Each also has two to six managers and one to two culinary managers. In addition, each restaurant typically employs an average of 65 to 150 hourly team members, most of whom work part-time. The general manager or managing partner of each restaurant reports directly to an area director, who has operational responsibility for approximately three to ten restaurants. Restaurants are visited regularly by operations management, including officer level executives, to help ensure strict adherence to all aspects of our standards.
Each Bahama Breeze and Yard House restaurant is led by a general manager, and each The Capital Grille, Seasons 52 and Eddie V’s restaurant is led by a managing partner. Each also has two to eight managers. Each The Capital Grille, Yard House, Seasons 52 and Eddie V’s restaurant has one to three executive chefs, and one to two sous chefs, and each Bahama Breeze restaurant has one to three culinary managers. In addition, each restaurant typically employs an average of 65 to 150 hourly team members, most of whom work part-time. The general manager or managing partner of each restaurant reports directly to a director of operations, who has operational responsibility for approximately three to ten restaurants. Restaurants are visited regularly by operations management, including officer level executives, to help ensure strict adherence to all aspects of our standards.
Our Learning and Employee Development team in partnership with each brand’s training leader, together with senior operations executives, is responsible for developing and maintaining our operations training programs. These efforts include a 10 to 12-week training program for management trainees (seven to nine weeks in the case of internal promotions) and continuing development programs for all levels of leadership. The emphasis of the training and development programs varies by restaurant brand, but includes leadership, restaurant business management and culinary skills. We also use a highly structured training program to open new restaurants, including deploying training teams experienced in all aspects of restaurant operations. The opening training teams typically begin work one and a half weeks prior to opening and remain at the new restaurant for up to three weeks after the opening. They are re-deployed as appropriate to enable a smooth transition to the restaurant’s operating staff.
We maintain performance measurement and incentive compensation programs for our management-level team members. We believe that our leadership position, strong results-oriented culture and various short-term and long-term incentive programs, including stock-based compensation, enhances our ability to attract and retain highly motivated restaurant managers.
Quality Assurance
Our Total Quality Department helps ensure that all restaurants provide safe, high-quality food in a clean and safe environment. Through rigorous supplier and risk based product evaluations, we purchase only products that meet or exceed our product specifications. We rely on independent third parties to inspect and evaluate our suppliers and distributors. Suppliers that produce “high-risk” products are subject to a food safety evaluation by Darden personnel at least annually. We require our suppliers to maintain sound manufacturing practices and operate with the comprehensive Hazard Analysis and Critical Control Point (HACCP) food safety programs and risk based preventative controls adopted by the U.S. Food and Drug Administration. These programs focus on preventing hazards that could cause food-borne illnesses by applying scientifically-based controls to analyze hazards, identify and monitor critical control points, and establish corrective actions when monitoring shows that a critical limit has not been met. We require routine food safety verification for high risk products from our suppliers. Our total quality managers and third party auditors visit each restaurant regularly throughout the year to review food handling and to provide education and training in food safety and sanitation. The total quality managers also serve as a liaison to regulatory agencies on issues relating to food safety.
6
Purchasing and Distribution
Our ability to ensure a consistent supply of safe, high-quality food and supplies at competitive prices to all of our restaurant brands depends on reliable sources of procurement. Our purchasing staff sources, negotiates and purchases food and supplies from more than 1,500 suppliers whose products originate in more than 35 countries. Suppliers must meet our requirements and strict quality control standards in the development, harvest, catch and production of food products. Competitive bids, long-term contracts and strategic supplier relationships are routinely used to manage availability and cost of products.
We believe that our significant scale is a competitive advantage and our purchasing team leverages this purchasing capability. Our purchasing staff travels routinely within the United States and internationally to source top-quality food products at competitive prices. We believe that we have established excellent long-term relationships with key suppliers and usually source our product directly from producers (not brokers or middlemen). We actively support several national minority supplier organizations to ensure that Darden incorporates women- and minority-owned businesses in all of its purchasing decisions.
We continue to drive automation of our supply chain by working with our suppliers, logistics partners and distributors to improve optimization with information visibility. Through our subsidiary, Darden Direct Distribution, Inc. (Darden Direct), and long-term agreements with our third party national distribution companies, we maintain inventory ownership of food and supplies in warehouses primarily dedicated to Darden where practical to do so. Darden Direct further enables our purchasing staff to integrate demand forecasts into long-term agreements driving efficiencies in production economics when we collaborate with suppliers. Because of the relatively rapid turnover of perishable food products, inventories in the restaurants have a modest aggregate dollar value in relation to sales.
Advertising and Marketing
Integrated marketing is a key element of our strategy, and our scale enables us to be a leading advertiser in the full-service dining segment of the restaurant industry. Olive Garden leverages the efficiency of national network television advertising. Olive Garden supplements this with cable, local television and digital advertising. LongHorn Steakhouse uses local television and digital advertising to build engagement and loyalty by market. Cheddar’s Scratch Kitchen, The Capital Grille, Yard House, Bahama Breeze, Seasons 52 and Eddie V’s do not use television advertising, but rely on local and digital marketing. Our restaurants appeal to a broad spectrum of consumers and we use advertising to build awareness and strengthen our brands. We implement periodic promotions as appropriate to maintain and increase our sales and profits, as well as increase frequency of visitation by our guests. We also rely on outdoor billboard, direct mail and email advertising, as well as radio, newspapers, digital coupons, search engine marketing and social media such as Facebook® and Instagram®, as appropriate, to attract, engage and retain our guests. We have developed and consistently use sophisticated consumer marketing research techniques to monitor guest satisfaction and evolving food service trends and expectations.
In fiscal 2017, we continued a multi-year effort to implement new technology platforms that allow us to digitally engage with our guests and team members and strengthen our marketing and analytics capabilities in this increasingly connected society. We also continued making improvements to our online and mobile ordering system for Olive Garden and LongHorn Steakhouse. In addition, we continued to further improve brand loyalty and customer relationship management programs for our brands to increase the frequency of visits and offer our guests flexibility when making dining decisions. As we implement new platforms, we are integrating them into all guest touch points including restaurant operating systems to enable compelling personalized guest experiences.
In fiscal 2017, Olive Garden continued to leverage Spanish language advertising to increase awareness and visits from Hispanic consumers.
Employees
At the end of fiscal 2017, we employed over 175,000 people (team members) in the United States and Canada, including at Cheddar’s Scratch Kitchen. Of these team members, approximately 165,000 were hourly restaurant personnel. The remainder were restaurant management personnel located in the restaurants or in the field, or were located at one of our restaurant support center facilities in Orlando, Florida, Irvine, California or Irving, Texas. Our executives have an average of 15 years of experience with us. The restaurant general managers and managing partners average 12 years with us. We believe that we provide working conditions and compensation that compare favorably with those of our competitors. Most team members, other than restaurant management and corporate management, are paid on an hourly basis. None of our team members are covered by a collective bargaining agreement. We consider our employee relations to be good.
Consistent with one of our core values of diversity, we are committed to attracting, retaining, engaging and developing a workforce that mirrors the diversity of our guests. Approximately 50 percent of our restaurant team member employees are minorities and over 53 percent are female. According to the People Report’s Human Capital Intelligence Report for April 2017,
7
the diversity of our operations leadership teams exceeds industry averages by nearly 1 percentage point for minority and 9 percentage points for female representation. At the vice president level and above, 21 percent of our leaders are minorities and 29 percent are female. The percentages of minority and female leaders at the vice president and above level rank above average in our industry. In addition, we achieved a 100 percent score on the Human Rights Campaign’s Corporate Equality Index for our business practices and policies toward our lesbian, gay, bisexual and transgender team members.
Consistent with our core values of respect and caring and teamwork, in fiscal 1999, we established a program called Darden Dimes to help fellow Darden team members in need. Darden Dimes provides short-term financial grants to team members experiencing financial need caused by unexpected emergencies or catastrophic natural disasters. Participating team members donate as little as 10 cents from each paycheck to the Darden Dimes fund, which raises and grants more than $1.5 million annually.
Information Technology
We strive for leadership in the restaurant business by using technology as a competitive advantage and as an enabler of our strategy. We have implemented technology-enabled business solutions targeted at improved financial control, cost management, guest service and employee effectiveness. These solutions are designed to be used across restaurant brands, yet are flexible enough to meet the unique needs of each restaurant brand. Our strategy is to fully integrate systems to drive operational efficiencies and enable restaurant teams to focus on restaurant operations excellence.
Restaurant hardware and software support for all of our restaurant brands is provided or coordinated from the restaurant support center facility in Orlando, Florida. A high-speed data network sends and receives critical business data to and from the restaurants throughout the day and night, providing timely and extensive information on business activity in every location. Our data center contains sufficient computing power to process information from all restaurants quickly and efficiently. Our information is processed in a secure environment to protect both the actual data and the physical assets. We guard against business interruption by maintaining a disaster recovery plan, which includes storing critical business information off-site, testing the disaster recovery plan at a host-site facility and providing on-site power backup. We use internally developed proprietary software, as well as purchased software, with proven, non-proprietary hardware. This allows processing power to be distributed effectively to each of our restaurants.
Our management believes that our current systems and practice of implementing regular updates will position us well to support current needs and future growth. We use a strategic information systems planning process that involves senior management and is integrated into our overall business planning. Information systems projects are prioritized based upon strategic, financial, regulatory and other business advantage criteria.
Competition
The restaurant industry is intensely competitive with respect to the type and quality of food, price, service, restaurant location, personnel, brand, attractiveness of facilities, availability of carryout and home delivery, internet and mobile ordering capabilites and effectiveness of advertising and marketing. The restaurant business is often affected by changes in consumer tastes; national, regional or local economic conditions; demographic trends; traffic patterns; the type, number and location of competing restaurants; and consumers’ discretionary purchasing power. We compete within each market with national and regional chains and locally-owned restaurants for guests, management and hourly personnel and suitable real estate sites. We also face growing competition from the supermarket industry, which offers “convenient meals” in the form of improved entrées and side dishes from the deli section. In addition, improving product offerings at fast casual restaurants and quick-service restaurants and expansion of home delivery services, together with negative economic conditions, could cause consumers to choose less expensive alternatives. We expect intense competition to continue in all of these areas.
Other factors pertaining to our competitive position in the industry are addressed under the sections entitled “Purchasing and Distribution,” “Advertising and Marketing” and “Information Technology” in this Item 1 and in our Risk Factors in Item 1A of this Form 10-K.
Trademarks and Service Marks
We regard our Olive Garden®, LongHorn Steakhouse®, Cheddar’s Scratch Kitchen®, The Capital Grille®, Yard House®, Bahama Breeze®, Seasons 52®, Eddie V’s Prime Seafood® , Wildfish Seafood Grille®, Darden® and Darden Restaurants® service marks, and other service marks and trademarks related to our restaurant businesses, as having significant value and as being important to our marketing efforts. Our policy is to pursue registration of our important service marks and trademarks and to oppose vigorously any infringement of them. Generally, with appropriate renewal and use, the registration of our service marks and trademarks will continue indefinitely.
8
Franchises, Joint Ventures and New Business Development
As of May 28, 2017, we operated 1,695 restaurants through subsidiaries in the United States and Canada. We own all of those locations, except for 9 restaurants managed by us and owned by joint ventures. The joint ventures pay management fees to us, and we control the joint ventures’ use of our service marks. Franchisees or licensees operated 45 franchised restaurants in the United States and Canada.
Our restaurant operations outside of the United States and Canada are conducted through area development and franchise agreements. We have area development and/or franchise agreements in place with unaffiliated operators to develop and operate Olive Garden, The Capital Grille and LongHorn Steakhouse restaurants in:
• | Middle East (Qatar, Kuwait, Saudi Arabia and the United Arab Emirates), |
• | Mexico, |
• | Central and South America (Brazil, Colombia, Costa Rica, Dominican Republic, Ecuador, El Salvador, Guatemala, Honduras, Nicaragua and Panama), and |
• | Malaysia. |
As of May 28, 2017, franchisees operated 33 franchised restaurants located throughout these regions. The restaurant developments under the area development agreements are in various states of progress, and the open and operating restaurants are all reflected in the table under the “Introduction” section of this Item 1. We do not have an ownership interest in any of these franchisees, but we receive license fees under the area development and franchise agreements and royalty income under the franchise agreements. The amount of income we derive from our joint venture and franchise arrangements is not material to our consolidated financial statements.
We license the sales and distribution of several items including Olive Garden salad dressings, salad croutons, extra virgin olive oil, balsamic vinegar, LongHorn Steakhouse seasoning and Olive Garden seasoning through various channels including wholesale distribution chains and major grocery chains. The amount of income we derive from these licensing arrangements is not material to our consolidated financial statements.
Seasonality
Our sales volumes fluctuate seasonally. Typically, our average sales per restaurant are highest in the winter and spring, followed by the summer, and lowest in the fall. Holidays, changes in the economy, severe weather and similar conditions may impact sales volumes seasonally in some operating regions. Because of the seasonality of our business, results for any quarter are not necessarily indicative of the results that may be achieved for the full fiscal year.
Government Regulation
We are subject to various federal, state, local and international laws affecting our business. Each of our restaurants must comply with licensing requirements and regulations by a number of governmental authorities, which include health, safety and fire agencies in the state or municipality in which the restaurant is located. The development and operation of restaurants depend on selecting and acquiring suitable sites, which are subject to zoning, land use, environmental, traffic and other regulations. To date, we have not been significantly affected by any difficulty, delay or failure to obtain required licenses or approvals.
During fiscal 2017, 12.6 percent of our sales were attributable to the sale of alcoholic beverages. Regulations governing their sale require licensure by each site (in most cases, on an annual basis), and licenses may be revoked or suspended for cause at any time. These regulations relate to many aspects of restaurant operation, including the minimum age of patrons and employees, hours of operation, advertising, wholesale purchasing, inventory control and handling, and storage and dispensing of alcoholic beverages. The failure of a restaurant to obtain or retain these licenses would adversely affect the restaurant’s operations. We also are subject in certain states to “dram-shop” statutes, which generally provide an injured party with recourse against an establishment that serves alcoholic beverages to an intoxicated person who then causes injury to himself or a third party. We carry liquor liability coverage as part of our comprehensive general liability insurance.
We also are subject to federal and state minimum wage laws and other laws governing such matters as overtime, tip credits, working conditions, safety standards, and hiring and employment practices. Changes in these laws during fiscal 2017 have not had a material effect on our operations.
We currently are operating under a Tip Rate Alternative Commitment (TRAC) agreement with the Internal Revenue Service. Through increased educational and other efforts in the restaurants, the TRAC agreement reduces the likelihood of potential chain-wide employer-only FICA tax assessments for unreported cash tips.
9
We are subject to federal and state environmental regulations, but these rules have not had a material effect on our operations. During fiscal 2017, there were no material capital expenditures for environmental control facilities and no material expenditures for this purpose are anticipated.
Our facilities must comply with the applicable requirements of the Americans with Disabilities Act of 1990 (ADA) and related state accessibility statutes. Under the ADA and related state laws, we must provide equivalent service to disabled persons and make reasonable accommodation for their employment, and when constructing or undertaking significant remodeling of our restaurants, we must make those facilities accessible.
We continue to monitor the status of the health care reform law enacted by Congress in March of 2010 (Affordable Care Act) and related rules and regulations.
We are subject to laws and regulations relating to the preparation and sale of food, including regulations regarding product safety, nutritional content and menu labeling. We are subject to laws and regulations requiring disclosure of calorie, fat, trans fat, salt and allergen content. Provisions in the Affordable Care Act require restaurant companies such as ours to disclose calorie information on their menus and to make available more detailed nutrition information upon request; however, regulations implementing those statutory provisions have been delayed until May 2018.
We are subject to laws relating to information security, privacy, cashless payments and consumer credit, protection and fraud. An increasing number of governments and industry groups worldwide have established data privacy laws and standards for the protection of personal information, including social security numbers, financial information (including credit card numbers), and health information.
See Item 1A “Risk Factors” below for a discussion of risks relating to federal, state and local regulation of our business, including in the areas of health care reform, data privacy and environmental matters.
Sustainability
Darden’s commitment to sustainability is embedded as a key component of providing great service and food to our guests. It is an element that separates us from our competitors, and a contributor to our business success. Our approach is both integrated and strategic and spans the enterprise from the commodities we source to the operation of our restaurants. Conservation is a competitive advantage - it continues to lower our operating costs over time, insulate our supply chain, and help us attract and retain the most qualified employees - all increasing the success of our business.
More information about our sustainability strategy, our commitment to our guests on Food Principles and our progress to date is available at our website: www.darden.com/sustainability.
Darden Foundation and Community Affairs
We are recognized for a culture that rewards caring for and responding to people. That defines service for Darden. The Darden Restaurants, Inc. Foundation (Foundation) works to bring to life this spirit of service through its philanthropic support of charitable organizations across the country as well as the volunteer involvement of our team members. The Foundation does this by focusing its philanthropic efforts on programs that enhance the communities in which our team members and guests live and work.
In fiscal 2017, we awarded approximately $3.8 million in grants through the Foundation. We awarded grants to national organizations such as the American Red Cross, Feeding America, and the National Restaurant Association Education Foundation, as well as local nonprofits including Second Harvest Food Bank of Central Florida and the Heart of Florida United Way. These organizations provide service to the public through disaster preparedness, hunger relief, community engagement, and the promotion of career opportunities in the culinary industry.
In 2003, we began the Darden Harvest program as a mechanism for getting fresh and healthy food to people who need it. Each day across most of our restaurants, we collect surplus, wholesome food that is not served to guests and, rather than discarding the food, we prepare it for donation to local nonprofit feeding partners. In fiscal 2017, Darden contributed over 7 million pounds of food which is enough to feed more than 1,300 families of four, three meals a day for an entire year. In April 2017, the Darden Harvest program achieved a significant milestone when it reached a total of 100 million pounds of food donated over the life of program. That’s the equivalent of approximately 83 million meals provided to people in need across the communities served by Olive Garden, LongHorn Steakhouse, Yard House, The Capital Grille, Seasons 52, Bahama Breeze and Eddie V’s. As an added benefit of the Darden Harvest program, we are able to divert millions of pounds of surplus food from waste streams every year, making the Darden Harvest program a key part of our goal to one day send zero waste to landfills.
10
More information about the Foundation and its efforts to enhance the quality of life in the communities where we do business is available on our website at www.darden.com.
Executive Officers of the Registrant
Our executive officers as of the date of this report are listed below.
Eugene I. (Gene) Lee, Jr., age 56, has been our President and CEO since February 2015. Prior to that, Mr. Lee served as President and Interim CEO since October 2014, and as President and COO of the Company from September 2013 to October 2014. He served as President, Specialty Restaurant Group from our acquisition of RARE in October 2007 to September 2013. Prior to the acquisition, he served as RARE’s President and COO from January 2001 to October 2007. From January 1999 until January 2001, he served as RARE’s Executive Vice President and COO.
Matthew R. Broad, age 57, has been our Senior Vice President, General Counsel, Chief Compliance Officer and Corporate Secretary since October 2015. Prior to joining Darden, he served as Executive Vice President, General Counsel and Chief Compliance Officer for OfficeMax, Incorporated from October 2004 to December 2013. Prior to that, he was Associate General Counsel with Boise Cascade Corporation from September 1989 to October 2004.
Todd A. Burrowes, age 54, has been our President, LongHorn Steakhouse since July 2015. He rejoined the Company after serving as President, Ruby Tuesday Concept and Chief Operations Officer of Ruby Tuesday, Inc. from June 2013 to July 2015. Prior to that, he served as Executive Vice President of Operations for LongHorn Steakhouse from May 2008 until June 2013. He joined the Company in 2002 as Regional Manager of LongHorn Steakhouse before being promoted to Director of Management Training. In 2004, he was promoted to Regional Vice President of Operations for LongHorn Steakhouse.
Ricardo (Rick) Cardenas, age 49, has been our Senior Vice President, Chief Financial Officer since March 2016. He was Senior Vice President, Chief Strategy Officer of the Company from July 2015 to March 2016, prior to which he served as Senior Vice President, Finance, Strategy and Technology from July 2014 to July 2015. He was Executive Vice President of Operations for LongHorn Steakhouse from June 2013 to July 2014 and Senior Vice President of Operations for LongHorn Steakhouse’s Philadelphia Division from June 2012 to June 2013. He served as Senior Vice President of Finance for Red Lobster, which the Company previously owned, from June 2010 to June 2012. Mr. Cardenas originally joined the Company in 1984 as an hourly employee and served in various positions of increasing responsibility, including Vice President of Finance for Olive Garden, prior to the positions described above.
David C. George, age 61, has been our President, Olive Garden and Executive Vice President, Darden Restaurants since March 2016, prior to which he was President of Olive Garden since January 2013. He served as our President of LongHorn Steakhouse from October 2007, when we acquired RARE, until January 2013. Prior to the acquisition, he served as RARE’s President of LongHorn Steakhouse from May 2003 until October 2007. From October 2001 until May 2003, he was RARE’s Senior Vice President of Operations for LongHorn Steakhouse and from May 2000 until October 2001 was RARE’s Vice President of Operations for The Capital Grille.
Sarah H. King, age 47, was named our Senior Vice President, Chief Human Resources Officer in March 2017. Prior to joining Darden, Sarah spent 19 years with Wyndham Worldwide Corporation in various human resources leadership positions worldwide. Most recently, from 2010 through 2017, she served as Executive Vice President, Human Resources for Wyndham Vacation Ownership.
John W. Madonna, age 41, has been our Senior Vice President, Corporate Controller since January 2016, prior to which he served as our Senior Vice President, Accounting since January 2015. Prior to that, he was a Director in Corporate Reporting from June 2010 through June 2013 when he was promoted to Senior Director, Corporate Reporting and then to Vice President of Corporate Reporting in March, 2014. He joined the Company in 2005 as Manager, Corporate Reporting. He joined the LongHorn Steakhouse team in 2009 as Manager, Financial Planning & Analysis.
Item 1A. RISK FACTORS
Various risks and uncertainties could affect our business. Any of the risks described below or elsewhere in this report or our other filings with the Securities and Exchange Commission could have a material impact on our business, financial condition or results of operations. It is not possible to predict or identify all risk factors. Additional risks and uncertainties not presently known to us or that we currently believe to be immaterial may also impair our business operations.
11
The inability to successfully integrate Cheddar’s Scratch Kitchen into our business could harm our ability to achieve the cost savings and other benefits we expect to be able to realize in the Cheddar’s Scratch Kitchen operations.
On April 24, 2017, we acquired Cheddar’s Scratch Kitchen. Our integration of Cheddar’s Scratch Kitchen’s business into our operations is a complex and time-consuming process that may not be successful. The primary areas of focus for successfully combining the business of Cheddar’s Scratch Kitchen with our operations may include, among others: retaining and integrating management and other key employees; integrating information, communications and other systems; and managing the growth of the combined company.
Even if we successfully integrate the business of Cheddar’s Scratch Kitchen into our operations, there can be no assurance that we will realize the anticipated benefits. We acquired Cheddar’s Scratch Kitchen with the expectation that the acquisition would result in various benefits for the combined company including, among others, business and growth opportunities and significant synergies from increased efficiency in purchasing, distribution and other restaurant and corporate support. Increased competition and/or deterioration in business conditions may limit our ability to expand this business. As such, we may not be able to realize the synergies, goodwill, business opportunities and growth prospects anticipated in connection with the acquisition.
We rely heavily on information technology in our operations, and insufficient guest or employee facing technology or a failure to maintain a continuous and secure cyber network, free from material failure, interruption or security breach could harm our ability to effectively operate our business and/or result in the loss of respected relationships with our guests or employees.
We rely heavily on information systems across our operations, including for marketing programs, employee engagement, management of our supply chain, point-of-sale processing system in our restaurants, and various other processes and transactions. Our ability to effectively manage our business and coordinate the production, distribution and sale of our products depends significantly on the reliability and capacity of these systems. In addition, we must effectively respond to changing guest expectations and new technological developments. Disruptions, failures or other performance issues with these guest facing technology systems could impair the benefits that they provide to our business and negatively affect our relationship with our guests. The failure of these systems to operate effectively, problems with transitioning to upgraded or replacement systems, a material network breach in the security of these systems as a result of a cyber attack, or any other failure to maintain a continuous and secure cyber network could result in substantial harm or inconvenience to us or an individual. This could include the theft of our intellectual property or trade secrets, or the improper use of personal information or other “identity theft.” Each of these situations or data privacy breaches may cause delays in guest service, reduce efficiency in our operations, require significant capital investments to remediate the problem, result in customer or advertiser dissatisfaction or otherwise result in negative publicity that could harm our reputation and we could be subjected to litigation, regulatory investigations or the imposition of penalties. As privacy and information security laws and regulations change and cyber risks evolve, we may incur additional costs to ensure we remain in compliance and protect guest, employee and Company information.
A failure to maintain food safety throughout the supply chain and food-borne illness concerns may have an adverse effect on our business.
Food safety is a top priority, and we dedicate substantial resources to ensuring that our guests enjoy safe, quality food products. Even with strong preventative interventions and controls, food safety issues could be caused at the source or by food suppliers or distributors and, as a result, be out of our control and require prompt action to mitigate impact. In addition, regardless of the source or cause, any report of food-borne illnesses such as E. coli, hepatitis A, norovirus or salmonella, and other food safety issues including food tampering or contamination, at one of our restaurants could adversely affect the reputation of our brands and have a negative impact on our sales. Even instances of food-borne illness, food tampering or food contamination occurring solely at restaurants of our competitors could result in negative publicity about the food service industry generally and adversely impact our sales. The occurrence of food-borne illnesses or food safety issues could also adversely affect the price and availability of affected ingredients, resulting in higher costs and lower margins.
Litigation, including allegations of illegal, unfair or inconsistent employment practices, may adversely affect our business, financial condition and results of operations.
Our business is subject to the risk of litigation by employees, guests, suppliers, shareholders, government agencies or others through private actions, class actions, administrative proceedings, regulatory actions or other litigation. These actions and proceedings may involve allegations of illegal, unfair or inconsistent employment practices, including wage and hour violations and employment discrimination; guest discrimination; food safety issues including poor food quality, food-borne illness, food tampering, food contamination, and adverse health effects from consumption of various food products or high-calorie foods (including obesity); other personal injury; violation of “dram shop” laws (providing an injured party with recourse against an establishment that serves alcoholic beverages to an intoxicated party who then causes injury to himself or a third party); trademark infringement; violation of the federal securities laws; or other concerns. The outcome of litigation, particularly class action lawsuits and regulatory actions, is difficult to assess or quantify. Plaintiffs in these types of lawsuits may seek recovery of
12
very large or indeterminate amounts, and the magnitude of the potential loss relating to such lawsuits may remain unknown for substantial periods of time. The cost to defend litigation may be significant. There may also be adverse publicity associated with litigation that could decrease guest acceptance of our brands, regardless of whether the allegations are valid or we ultimately are found liable. Litigation could impact our operations in other ways as well. Allegations of illegal, unfair or inconsistent employment practices, for example, could adversely affect employee acquisition and retention. As a result, litigation may adversely affect our business, financial condition and results of operations.
Unfavorable publicity, or a failure to respond effectively to adverse publicity, could harm our reputation and adversely impact our guest counts and sales.
The good reputation of our restaurant brands is a key factor in the success of our business. Actual or alleged incidents at any of our restaurants could result in negative publicity that could harm our brands. Even incidents occurring at restaurants operated by our competitors or in the supply chain generally could result in negative publicity that could harm the restaurant industry overall and, indirectly, our own brands. Negative publicity may result from allegations of illegal, unfair or inconsistent employment practices, employee dissatisfaction, guest discrimination, illness, injury, or any of the other matters discussed above that could give rise to litigation. Regardless of whether the allegations or complaints are valid, unfavorable publicity relating to a limited number of our restaurants, or only to a single restaurant, could adversely affect public perception of the entire brand. Negative publicity also may result from health concerns including food safety and flu outbreaks, publication of government or industry findings concerning food products, environmental disasters, crime incidents, data privacy breaches, scandals involving our employees, or operational problems at our restaurants, all of which could make our brands and menu offerings less appealing to our guests and negatively impact our guest counts and sales. Adverse publicity and its effect on overall consumer perceptions of our brands, or our failure to respond effectively to adverse publicity, could have a material adverse effect on our business.
We are subject to a number of risks relating to public policy changes and federal, state and local regulation of our business, including in the areas of health care reform, environmental matters, minimum wage, unionization, data privacy, menu labeling, immigration requirements and taxes, and an insufficient or ineffective response to government regulation may impact our cost structure, operational efficiencies and talent availability.
The restaurant industry is subject to extensive federal, state, local and international laws and regulations. The development and operation of restaurants depend to a significant extent on the selection and acquisition of suitable sites, which are subject to building, zoning, land use, environmental, traffic and other regulations and requirements. We are subject to licensing and regulation by state and local authorities relating to health, sanitation, safety and fire standards and the sale of alcoholic beverages. We are subject to laws and regulations relating to the preparation and sale of food, including regulations regarding product safety, nutritional content and menu labeling. We are subject to federal, state, and local laws governing employment practices and working conditions. These laws cover wage and hour practices, labor relations, paid and family leave, workplace safety, and immigration, among others. The myriad of laws and regulations being passed at the state and local level creates unique challenges for a multi-state employer as different standards apply to different locations, sometimes with conflicting requirements. We must continue to monitor and adapt our employment practices to comply with these various laws and regulations.
We also are subject to federal and state laws which prohibit discrimination and other laws regulating the design and operation of facilities, such as the ADA. Compliance with these laws and regulations can be costly and increase our exposure to litigation and governmental proceedings, and a failure or perceived failure to comply with these laws could result in negative publicity that could harm our reputation. New or changing laws and regulations relating to union organizing rights and activities may impact our operations at the restaurant level and increase our labor costs.
Provisions in the Affordable Care Act require restaurant companies such as ours to disclose calorie information on their menus and to make available more detailed nutrition information upon request; however, regulations implementing those statutory provisions have been delayed until May 2018. We do not expect to incur any material costs from compliance with these provisions, but cannot anticipate any changes to guest behavior resulting from the implementation of this portion of the law, which could have an adverse effect on our sales or results of operations.
We are subject to a variety of federal, state and local laws and regulations relating to the use, storage, discharge, emission and disposal of hazardous materials. There also has been increasing focus by United States and overseas governmental authorities on other environmental matters, such as climate change, the reduction of greenhouse gases and water consumption. This increased focus may lead to new initiatives directed at regulating a yet to be specified array of environmental matters, such as the emission of greenhouse gases, where “cap and trade” initiatives could effectively impose a tax on carbon emissions. Legislative, regulatory or other efforts to combat climate change or other environmental concerns could result in future increases in the cost of raw materials, taxes, transportation and utilities, which could decrease our operating profits and necessitate future investments in facilities and equipment.
13
We are subject to laws relating to information security, privacy, cashless payments and consumer credit, protection and fraud. An increasing number of governments and industry groups worldwide have established data privacy laws and standards for the protection of personal information, including social security numbers, financial information (including credit card numbers), and health information. Compliance with these laws and regulations can be costly, and any failure or perceived failure to comply with those laws or any breach of our systems could harm our reputation or lead to litigation, which could adversely affect our financial condition.
The impact of current laws and regulations, the effect of future changes in laws or regulations that impose additional requirements and the consequences of litigation relating to current or future laws and regulations, or an insufficient or ineffective response to significant regulatory or public policy issues, could negatively impact our cost structure, operational efficiencies and talent availability, and therefore have an adverse effect on our results of operations. Failure to comply with the laws and regulatory requirements of federal, state and local authorities could result in, among other things, revocation of required licenses, administrative enforcement actions, fines and civil and criminal liability. Compliance with these laws and regulations can be costly and can increase our exposure to litigation or governmental investigations or proceedings.
A majority of our restaurants are operated in leased properties and we are committed to long-term and non-cancelable leases that we may want to cancel, and may be unable to renew the leases that we may want to extend at the end of their terms.
As of May 28, 2017, 1,606 of our 1,695 restaurants operating in the United States and Canada operate in leased locations. If we close a restaurant in a leased location, we may remain committed to perform our obligations under the applicable lease, which would include, among other things, payment of the base rent for the balance of the lease term. Additionally, the potential losses associated with our inability to cancel leases may result in our keeping open restaurant locations that are performing significantly below targeted levels. As a result, ongoing lease obligations at closed or underperforming restaurant locations could impair our results of operations. In addition, at the end of the lease term and expiration of all renewal periods, we may be unable to renew the lease without substantial additional cost, if at all. As a result, we may be required to close or relocate a restaurant, which could subject us to construction and other costs and risks, and may have an adverse effect on our operating performance.
We may be subject to increased labor and insurance costs.
Our restaurant operations are subject to United States and Canadian federal, state and local laws governing such matters as minimum wages, working conditions, overtime and tip credits. As federal and state minimum wage rates increase, we may need to increase not only the wages of our minimum wage employees, but also the wages paid to employees at wage rates that are above minimum wage. Labor shortages, increased employee turnover and health care mandates could also increase our labor costs. This in turn could lead us to increase prices which could impact our sales. Conversely, if competitive pressures or other factors prevent us from offsetting increased labor costs by increases in prices, our profitability may decline. In addition, the current premiums that we pay for our insurance (including workers’ compensation, general liability, property, health, and directors’ and officers’ liability) may increase at any time, thereby further increasing our costs. The dollar amount of claims that we actually experience under our workers’ compensation and general liability insurance, for which we carry high per-claim deductibles, may also increase at any time, thereby further increasing our costs. Further, the decreased availability of property and liability insurance has the potential to negatively impact the cost of premiums and the magnitude of uninsured losses.
Our inability or failure to execute on a comprehensive business continuity plan following a major natural disaster such as a hurricane or manmade disaster, including terrorism, at our corporate facility could have a materially adverse impact on our business.
Many of our corporate systems and processes and corporate support for our restaurant operations are centralized at one Florida location. We have disaster recovery procedures and business continuity plans in place to address most events of a crisis nature, including hurricanes and other natural disasters, and back up and off-site locations for recovery of electronic and other forms of data and information. However, if we are unable to fully implement our disaster recovery plans, we may experience delays in recovery of data, inability to perform vital corporate functions, tardiness in required reporting and compliance, failures to adequately support field operations and other breakdowns in normal communication and operating procedures that could have a material adverse effect on our financial condition, results of operation and exposure to administrative and other legal claims.
Health concerns arising from food-related pandemics, outbreaks of flu viruses or other diseases may have an adverse effect on our business.
The United States and other countries have experienced, or may experience in the future, outbreaks of viruses, such as norovirus, avian flu or “SARS,” H1N1 or “swine flu,” or other diseases. To the extent that a virus or disease is food-borne, or perceived to be food-borne, future outbreaks may adversely affect the price and availability of certain food products and cause our guests to eat less of a product, or could reduce public confidence in food handling and/or public assembly. For example, public concern over avian flu may cause fear about the consumption of chicken, eggs and other products derived from poultry. The
14
inability to serve poultry-based products would restrict our ability to provide a variety of menu items to our guests. If we change a restaurant menu in response to such concerns, we may lose guests who do not prefer the new menu, and we may not be able to attract a sufficient new guest base to produce the sales needed to make the restaurant profitable. We also may have different or additional competitors for our intended guests as a result of such a change and may not be able to successfully compete against such competitors. If a virus is transmitted by human contact, our employees or guests could become infected, or could choose, or be advised, to avoid gathering in public places, any of which could adversely affect our restaurant guest traffic, and our ability to adequately staff our restaurants, receive deliveries on a timely basis or perform functions at the corporate level. We also could be adversely affected if the World Health Organization and/or the Centers for Disease Control were to restrict travel to affected geographic areas where we source our products, thus possibly impacting the continuity of supply. Additionally, jurisdictions in which we have restaurants may impose mandatory closures, seek voluntary closures or impose restrictions on operations. Even if such measures are not implemented and a virus or other disease does not spread significantly, the perceived risk of infection or significant health risk may adversely affect our business.
We face intense competition, and if we have an insufficient focus on competition and the consumer landscape, our business, financial condition and results of operations would be adversely affected.
The full-service dining sector of the restaurant industry is intensely competitive with respect to pricing, service, location, personnel, take-out and delivery options and type and quality of food, and there are many well-established competitors. We compete within each market with national and regional restaurant chains and locally-owned restaurants. We also face growing competition as a result of the trend toward convergence in grocery, deli and restaurant services, particularly in the supermarket industry which offers “convenient meals” in the form of improved entrées and side dishes from the deli section. We compete primarily on the quality, variety and value perception of menu items. The number and location of restaurants, type of brand, quality and efficiency of service, attractiveness of facilities and effectiveness of advertising and marketing programs are also important factors. We anticipate that intense competition will continue with respect to all of these factors. If we are unable to continue to compete effectively, our business, financial condition and results of operations would be adversely affected.
Our failure to drive both short-term and long-term profitable sales growth through brand relevance, operating excellence, opening new restaurants of existing brands, and developing new dining brands could result in poor financial performance.
As part of our business strategy, we intend to drive profitable sales growth by increasing same-restaurant sales at existing restaurants, continuing to expand our current portfolio of restaurant brands, and developing additional brands that can be expanded profitably. This strategy involves numerous risks, and we may not be able to achieve our growth objectives.
At existing brands, we may not be able to maintain brand relevance and restaurant operating excellence to achieve sustainable same-restaurant sales growth and warrant new unit growth. Existing brand short-term sales growth could be impacted if we are unable to drive near term guest count and sales growth, and long-term sales growth could be impacted if we fail to extend our existing brands in ways that are relevant to our guests. A failure to innovate and extend our existing brands in ways that are relevant to guests and occasions in order to generate sustainable same-restaurant traffic growth and produce non-traditional sales and earnings growth opportunities, insufficient focus on our competition, or failure to adequately address declines in the casual dining industry, could have an adverse effect on our results of operations. In addition, we may not be able to support sustained new unit growth or open all of our planned new restaurants, and the new restaurants that we open may not be profitable or as profitable as our existing restaurants. New restaurants typically experience an adjustment period before sales levels and operating margins normalize, and even sales at successful newly-opened restaurants generally do not make a significant contribution to profitability in their initial months of operation. The opening of new restaurants can also have an adverse effect on guest counts and sales levels at existing restaurants.
The ability to open and profitably operate restaurants is subject to various risks, such as the identification and availability of suitable and economically viable locations, the negotiation of acceptable lease or purchase terms for new locations, the need to obtain all required governmental permits (including zoning approvals and liquor licenses) on a timely basis, the need to comply with other regulatory requirements, the availability of necessary contractors and subcontractors, the ability to meet construction schedules and budgets, the ability to manage union activities such as picketing or hand billing which could delay construction, increases in labor and building material costs, the availability of financing at acceptable rates and terms, changes in weather or other acts of God that could result in construction delays and adversely affect the results of one or more restaurants for an indeterminate amount of time, our ability to hire and train qualified management personnel and general economic and business conditions. At each potential location, we compete with other restaurants and retail businesses for desirable development sites, construction contractors, management personnel, hourly employees and other resources. If we are unable to successfully manage these risks, we could face increased costs and lower than anticipated sales and earnings in future periods.
We also may not be able to identify and integrate additional brands or develop new business opportunities that are as profitable as our existing restaurants.
15
A lack of availability of suitable locations for new restaurants or a decline in the quality of the locations of our current restaurants may adversely affect our sales and results of operations.
The success of our restaurants depends in large part on their locations. As demographic and economic patterns change, current locations may not continue to be attractive or profitable. Possible declines in neighborhoods where our restaurants are located or adverse economic conditions in areas surrounding those neighborhoods could result in reduced sales in those locations. In addition, desirable locations for new restaurant openings or for the relocation of existing restaurants may not be available at an acceptable cost when we identify a particular opportunity for a new restaurant or relocation. The occurrence of one or more of these events could have a significant adverse effect on our sales and results of operations.
We may experience higher-than-anticipated costs associated with the opening of new restaurants or with the closing, relocating and remodeling of existing restaurants, which may adversely affect our results of operations.
Our sales and expenses can be impacted significantly by the number and timing of the opening of new restaurants and the closing, relocating and remodeling of existing restaurants. We incur substantial pre-opening expenses each time we open a new restaurant and other expenses when we close, relocate or remodel existing restaurants. The expenses of opening, closing, relocating or remodeling any of our restaurants may be higher than anticipated. An increase in such expenses could have an adverse effect on our results of operations.
Our inability or failure to recognize, respond to and effectively manage the accelerated impact of social media could have a material adverse impact on our business.
There has been a marked increase in the use of social media platforms and similar devices which allow individuals access to a broad audience of consumers and other interested persons. Many social media platforms immediately publish the content their subscribers and participants post, often without filters or checks on accuracy of the content posted. Information posted on such platforms at any time may be adverse to our interests or may be inaccurate, each of which may harm our performance, prospects, or business. The harm may be immediate without affording us an opportunity for redress or correction. The dissemination of information online could harm our business, prospects, financial condition, and results of operations, regardless of the information’s accuracy.
Many of our competitors are expanding their use of social media and new social media platforms are rapidly being developed, potentially making more traditional social media platforms obsolete. As a result, we need to continuously innovate and develop our social media strategies in order to maintain broad appeal with guests and brand relevance. As part of our marketing efforts, we rely on search engine marketing and social media platforms to attract and retain guests. We also continue to invest in other digital marketing initiatives that allow us to reach our guests across multiple digital channels and build their awareness of, engagement with, and loyalty to our brands. These initiatives may not be successful, resulting in expenses incurred without the benefit of higher revenues, increased employee engagement or brand recognition. In addition, a variety of risks are associated with the use of social media, including the improper disclosure of proprietary information, negative comments about us, exposure of personally identifiable information, fraud, or out-of-date information. The inappropriate use of social media vehicles by our guests or employees could increase our costs, lead to litigation or result in negative publicity that could damage our reputation.
A failure to identify and execute innovative marketing and guest relationship tactics, ineffective or improper use of other marketing initiatives, and increased advertising and marketing costs, could adversely affect our results of operations.
If our competitors increase their spending on advertising and promotions, if our advertising, media or marketing expenses increase, or if our advertising and promotions become less effective than those of our competitors, or if we do not adequately leverage technology and data analytic capabilities needed to generate concise competitive insight, we could experience a material adverse effect on our results of operations. A failure to sufficiently innovate, develop guest relationship initiatives, or maintain adequate and effective advertising could inhibit our ability to maintain brand relevance and drive increased sales.
As part of our marketing efforts, we rely on search engine marketing and social media platforms to attract and retain guests. These initiatives may not be successful, and pose a variety of other risks, as discussed below under the heading: “Our inability or failure to recognize, respond to and effectively manage the accelerated impact of social media could have a material adverse impact on our business.”
16
A failure to recruit, develop and retain effective leaders, the loss or shortage of personnel with key capacities and skills, or an inability to adequately monitor and proactively respond to employee dissatisfaction could impact our strategic direction and jeopardize our ability to meet our growth targets.
Our future growth depends substantially on the contributions and abilities of key executives and other employees. Our future growth also depends substantially on our ability to recruit and retain high-quality employees to work in and manage our restaurants. We must continue to recruit, retain and motivate management and other employees in order to maintain our current business and support our projected growth. Changes in senior management could expose us to significant changes in strategic direction and initiatives. A failure to maintain appropriate organizational capacity and capability to support leadership excellence (adequate resources, innovative skill sets and expectations) and build adequate bench strength required for growth, a loss of key employees or a significant shortage of high-quality restaurant employees, and an inability to adequately monitor and proactively respond to employee dissatisfaction could lead to poor guest satisfaction, higher turnover, litigation and unionization which could jeopardize our ability to meet our growth targets.
A failure to address cost pressures, including rising costs for commodities, labor, health care and utilities used by our restaurants, and a failure to effectively deliver cost management activities and achieve economies of scale in purchasing, could compress our margins and adversely affect our sales and results of operations.
Our results of operations depend significantly on our ability to anticipate and react to changes in the price and availability of food, ingredients, labor, health care, utilities and other related costs over which we may have little control. Operating margins for our restaurants are subject to changes in the price and availability of food commodities, including shrimp, lobster, crab and other seafood, as well as beef, pork, chicken, cheese and produce. The introduction of or changes to tariffs on imported food products, such as shrimp, could increase our costs and possibly impact the supply of those products. We cannot predict whether we will be able to anticipate and react to changing food costs by adjusting our purchasing practices and menu prices, and a failure to do so could adversely affect our operating results. We attempt to leverage our size to achieve economies of scale in purchasing, but there can be no assurances that we can always do so effectively. We are subject to the general risks of inflation.
Increases in minimum wage, health care and other benefit costs may have a material adverse effect on our labor costs. We operate in many states and localities where the minimum wage is significantly higher than the federal minimum wage. Increases in minimum wage may also result in increases in the wage rates paid for non-minimum wage positions
Our restaurants’ operating margins are also affected by fluctuations in the price of utilities such as electricity and natural gas, whether as a result of inflation or otherwise, on which the restaurants depend for their energy supply. In addition, interruptions to the availability of gas, electric, water or other utilities, whether due to aging infrastructure, weather conditions, fire, animal damage, trees, digging accidents or other reasons largely out of our control, may adversely affect our operations. Our inability to anticipate and respond effectively to an adverse change in any of these factors could have a significant adverse effect on our sales and results of operations.
We may lose sales or incur increased costs if our restaurants experience shortages or interruptions in the delivery of food and other products from our third party vendors and suppliers.
Shortages or interruptions in the supply of food items and other supplies to our restaurants may be caused by inclement weather; natural disasters such as hurricanes, tornadoes, floods, droughts and earthquakes; the inability of our vendors to obtain credit in a tightened credit market or remain solvent given disruptions in the financial markets; or other conditions beyond our control. Such shortages or interruptions could adversely affect the availability, quality and cost of the items we buy and the operations of our restaurants. We may have a limited number of suppliers for certain of our products. Supply chain risk could increase our costs and limit the availability of products that are critical to our restaurant operations. If we raise prices as a result of increased food costs or shortages, it may negatively impact our sales. If we temporarily close a restaurant or remove popular items from a restaurant’s menu, that restaurant may experience a significant reduction in sales during the time affected by the shortage or thereafter as a result of our guests changing their dining habits.
Adverse weather conditions and natural disasters could adversely affect our restaurant sales.
Adverse weather conditions can impact guest traffic at our restaurants, cause the temporary underutilization of outdoor patio seating and, in more severe cases such as hurricanes, tornadoes or other natural disasters, cause temporary closures, sometimes for prolonged periods, which would negatively impact our restaurant sales. Changes in weather could result in construction delays, interruptions to the availability of utilities, and shortages or interruptions in the supply of food items and other supplies, which could increase our costs. Some climatologists predict that the long-term effects of climate change and global warming may result in more severe, volatile weather or extended droughts, which could increase the frequency and duration of weather impacts on our operations.
17
Volatility in the market value of derivatives we may use to hedge exposures to fluctuations in commodity and broader market prices may cause volatility in our gross margins and net earnings.
We use or may use derivatives to hedge price risk for some of our principal ingredient, labor and energy costs, including but not limited to coffee, butter, wheat, soybean oil, pork, beef, diesel fuel, gasoline and natural gas. Changes in the values of these derivatives may be recorded in earnings currently, resulting in volatility in both gross margin and net earnings. These gains and losses are reported as a component of cost of sales in our Consolidated Statements of Earnings included in our consolidated financial statements.
Certain economic and business factors specific to the restaurant industry and other general macroeconomic factors including unemployment, energy prices and interest rates that are largely beyond our control may adversely affect consumer behavior and our results of operations.
Our business results depend on a number of industry-specific and general economic factors, many of which are beyond our control. The full-service dining sector of the restaurant industry is affected by changes in international, national, regional and local economic conditions, seasonal fluctuation of sales volumes, consumer spending patterns and consumer preferences, including changes in consumer tastes and dietary habits, and the level of consumer acceptance of our restaurant brands. The performance of individual restaurants may also be adversely affected by factors such as demographic trends, severe weather including hurricanes, traffic patterns and the type, number and location of competing restaurants.
General economic conditions may also adversely affect our results of operations. Recessionary economic cycles, a protracted economic slowdown, a worsening economy, increased unemployment, increased energy prices, rising interest rates, a downgrade of the U.S. government’s long-term credit rating, the European debt crisis, or other industry-wide cost pressures could affect consumer behavior and spending for restaurant dining occasions and lead to a decline in sales and earnings. Job losses, foreclosures, bankruptcies and falling home prices could cause guests to make fewer discretionary purchases, and any significant decrease in our guest traffic or average profit per transaction will negatively impact our financial performance. In addition, if gasoline, natural gas, electricity and other energy costs increase, and credit card, home mortgage and other borrowing costs increase with rising interest rates, our guests may have lower disposable income and reduce the frequency with which they dine out, may spend less on each dining out occasion or may choose more inexpensive restaurants.
Furthermore, we cannot predict the effects that actual or threatened armed conflicts, terrorist attacks, efforts to combat terrorism, heightened security requirements, or a failure to protect information systems for critical infrastructure, such as the electrical grid and telecommunications systems, could have on our operations, the economy or consumer confidence generally. Any of these events could affect consumer spending patterns or result in increased costs for us due to security measures.
Unfavorable changes in the above factors or in other business and economic conditions affecting our guests could increase our costs, reduce traffic in some or all of our restaurants or impose practical limits on pricing, any of which could lower our profit margins and have a material adverse effect on our sales, financial condition and results of operations.
Disruptions in the financial and credit markets may adversely impact consumer spending patterns, affect the availability and cost of credit and increase pension plan expenses.
Our ability to make scheduled payments or to refinance our debt and to obtain financing for acquisitions or other general corporate and commercial purposes will depend on our operating and financial performance, which in turn is subject to prevailing economic conditions and to financial, business and other factors beyond our control. Turmoil in global credit markets could adversely impact the availability of credit already arranged, and the availability and cost of credit in the future. There can be no assurances that we will be able to arrange credit on terms we believe are acceptable or that permit us to finance our business with historical margins. A lack of credit could have an adverse impact on certain of our suppliers, landlords and other tenants in retail centers in which we are located. If these issues occur, they could negatively affect our financial results. Any new disruptions in the financial markets may also adversely affect the U.S. and world economy, which could negatively impact consumer spending patterns. Changes in the capital markets could also have significant effects on our pension plan. Our pension income or expense is affected by factors including the market performance of the assets in the master pension trust maintained for the pension plan for some of our employees, the weighted average asset allocation and long-term rate of return of our pension plan assets and the discount rate used to determine the interest cost component of our net periodic pension cost. If our pension plan assets do not achieve positive rates of return, or if our estimates and assumed rates are not accurate, our earnings may decrease because net periodic pension costs would rise and we could be required to provide additional funds to cover our obligations to employees under the pension plan.
18
We face a variety of risks associated with doing business with franchisees and licensees.
Certain of our domestic and all of our international locations are operated by franchisees or licensees. We believe that we have selected high-caliber operating partners and franchisees with significant experience in restaurant operations, and are providing them with training and support. However, the probability of opening, ultimate success and quality of any franchise or licensed restaurant rests principally with the franchisee or licensee. If the franchisee or licensee does not successfully open and operate its restaurants in a manner consistent with our standards, or guests have negative experiences due to issues with food quality or operational execution, our brand values could suffer, which could have an adverse effect on our business.
We face a variety of risks associated with doing business with business partners and vendors in foreign markets.
We are making efforts to expand our brands overseas through licensing and franchising relationships. There is no assurance that international operations will be profitable or that international growth will continue. Our international operations are subject to all of the same risks associated with our domestic operations, as well as a number of additional risks. These include, among other things, international economic and political conditions, foreign currency fluctuations, and differing cultures and consumer preferences. In addition, expansion into international markets could create risks to our brands and reputation.
We also are subject to governmental regulations throughout the world that impact the way we do business with our international franchisees and vendors. These include antitrust and tax requirements, anti-boycott regulations, import/export/customs regulations and other international trade regulations, the USA Patriot Act, the Foreign Corrupt Practices Act, and applicable local law. Failure to comply with any such legal requirements could subject us to monetary liabilities and other sanctions, which could harm our business, results of operations and financial condition.
Failure to protect our service marks or other intellectual property could harm our business.
We regard our Olive Garden®, LongHorn Steakhouse®, Cheddar’s Scratch Kitchen®, The Capital Grille®, Yard House®, Bahama Breeze®, Seasons 52®, Eddie V’s Prime Seafood®, Wildfish Seafood Grille®, Darden® and Darden Restaurants® service marks, and other service marks and trademarks related to our restaurant businesses, as having significant value and being important to our marketing efforts. We rely on a combination of protections provided by contracts, copyrights, patents, trademarks, service marks and other common law rights, such as trade secret and unfair competition laws, to protect our restaurants and services from infringement. We have registered certain trademarks and service marks in the United States and foreign jurisdictions. However, we are aware of names and marks identical or similar to our service marks being used from time to time by other persons. Although our policy is to oppose any such infringement, further or unknown unauthorized uses or other misappropriation of our trademarks or service marks could diminish the value of our brands and adversely affect our business. In addition, effective intellectual property protection may not be available in every country in which we have or intend to open or franchise a restaurant. Although we believe we have taken appropriate measures to protect our intellectual property, there can be no assurance that these protections will be adequate, and defending or enforcing our service marks and other intellectual property could result in the expenditure of significant resources.
Impairment of the carrying value of our goodwill or other intangible assets could adversely affect our financial condition and consolidated results of operations.
Goodwill represents the difference between the purchase price of acquired companies and the related fair values of net assets acquired. A significant amount of judgment is involved in determining if an indication of impairment of goodwill exists. Factors may include, among others: a significant decline in our expected future cash flows; a sustained, significant decline in our stock price and market capitalization; a significant adverse change in legal factors or in the business climate; unanticipated competition; the testing for recoverability of a significant asset group within a reporting unit; and slower growth rates. Any adverse change in these factors would have a significant impact on the recoverability of these assets and negatively affect our financial condition and consolidated results of operations. We compute the amount of impairment by comparing the implied fair value of reporting unit goodwill with the carrying amount of that goodwill. We are required to record a non-cash impairment charge if the testing performed indicates that goodwill has been impaired.
We evaluate the useful lives of our other intangible assets, primarily the LongHorn Steakhouse®, Cheddar’s Scratch Kitchen®, The Capital Grille®, Yard House® and Eddie V’s Prime Seafood® trademarks, to determine if they are definite or indefinite-lived. Reaching a determination on useful life requires significant judgments and assumptions regarding the future effects of obsolescence, demand, competition, other economic factors (such as the stability of the industry, legislative action that results in an uncertain or changing regulatory environment, and expected changes in distribution channels), the level of required maintenance expenditures, and the expected lives of other related groups of assets.
As with goodwill, we test our indefinite-lived intangible assets (primarily trademarks) for impairment annually and whenever events or changes in circumstances indicate that their carrying value may not be recoverable. We cannot accurately
19
predict the amount and timing of any impairment of assets. Should the value of goodwill or other intangible assets become impaired, there could be an adverse effect on our financial condition and consolidated results of operations.
Failure of our internal controls over financial reporting and future changes in accounting standards may cause adverse unexpected operating results, affect our reported results of operations or otherwise harm our business and financial results.
Our management is responsible for establishing and maintaining effective internal control over financial reporting. Internal control over financial reporting is a process to provide reasonable assurance regarding the reliability of financial reporting for external purposes in accordance with accounting principles generally accepted in the United States. Because of its inherent limitations, internal control over financial reporting is not intended to provide absolute assurance that we would prevent or detect a misstatement of our financial statements or fraud. Our growth and acquisition of other restaurant companies with procedures not identical to our own could place significant additional pressure on our system of internal control over financial reporting. Any failure to maintain an effective system of internal control over financial reporting could limit our ability to report our financial results accurately and timely or to detect and prevent fraud. A significant financial reporting failure or material weakness in internal control over financial reporting could cause a loss of investor confidence and decline in the market price of our common stock, increase our costs, lead to litigation or result in negative publicity that could damage our reputation.
A change in accounting standards can have a significant effect on our reported results and may affect our reporting of transactions before the change is effective. New pronouncements and varying interpretations of pronouncements have occurred and may occur in the future. Changes to existing accounting rules or the questioning of current accounting practices may adversely affect our reported financial results. Additionally, our assumptions, estimates and judgments related to complex accounting matters could significantly affect our financial results. Generally accepted accounting principles and related accounting pronouncements, implementation guidelines and interpretations with regard to a wide range of matters that are relevant to our business, including but not limited to, revenue recognition, fair value of investments, impairment of long-lived assets, leases and related economic transactions, derivatives, pension and post-retirement benefits, intangibles, self-insurance, income taxes, property and equipment, unclaimed property laws and litigation, and stock-based compensation are highly complex and involve many subjective assumptions, estimates and judgments by us. Changes in these rules or their interpretation or changes in underlying assumptions, estimates or judgments by us could significantly change our reported or expected financial performance.
Item 1B. UNRESOLVED STAFF COMMENTS
None.
Item 2. | PROPERTIES |
Restaurant Properties – Continuing Operations
As of May 28, 2017, we operated 1,695 restaurants in the United States and Canada (consisting of 846 Olive Garden, 490 LongHorn Steakhouse, 140 Cheddar’s Scratch Kitchen, 67 Yard House, 56 The Capital Grille, 37 Bahama Breeze, 41 Seasons 52, and 18 Eddie V’s), in the following locations:
Alabama (31) | Illinois (53) | Montana (2) | Rhode Island (3) | |||
Alaska (2) | Indiana (45) | Nebraska (8) | South Carolina (31) | |||
Arkansas (15) | Iowa (14) | Nevada (15) | South Dakota (3) | |||
Arizona (42) | Kansas (22) | New Hampshire (9) | Tennessee (62) | |||
California (99) | Kentucky (30) | New Jersey (49) | Texas (175) | |||
Colorado (23) | Louisiana (19) | New Mexico (9) | Utah (15) | |||
Connecticut (15) | Maine (8) | New York (52) | Vermont (2) | |||
Delaware (6) | Maryland (32) | North Carolina (63) | Virginia (51) | |||
District of Columbia (1) | Massachusetts (40) | North Dakota (7) | Washington (21) | |||
Florida (192) | Michigan (34) | Ohio (78) | West Virginia (13) | |||
Georgia (99) | Minnesota (15) | Oklahoma (16) | Wisconsin (19) | |||
Hawaii (1) | Mississippi (14) | Oregon (10) | Wyoming (2) | |||
Idaho (5) | Missouri (40) | Pennsylvania (77) | Canada (6) | |||
Of these 1,695 restaurants open on May 28, 2017, 89 were located on owned sites and 1,606 were located on leased sites. The leases are classified as follows:
20
Land-Only Leases (we own buildings and equipment) | 778 | |
Ground and Building Leases | 608 | |
Space/In-Line/Other Leases | 220 | |
Total | 1,606 | |
Properties – General
We purchased several adjacent parcels of vacant land in Orange County, Florida, and relocated our restaurant support center to this site during fiscal 2010. The site includes a main headquarters building, data center and parking deck. In fiscal 2016, we completed a sale-leaseback of our restaurant support center buildings.
Except in limited instances, our present restaurant sites and other facilities are not subject to mortgages or encumbrances securing money borrowed by us from outside sources. In our opinion, our current buildings and equipment generally are in good condition, suitable for their purposes and adequate for our current needs. See also Note 5 and Note 11 of the Notes to Consolidated Financial Statements (Part II, Item 8 of this report).
Item 3. | LEGAL PROCEEDINGS |
See the discussion of legal proceedings contained in the third paragraph of Note 16 of the Notes to Consolidated Financial Statements (Part II, Item 8 of this report).
Item 4. MINE SAFETY DISCLOSURES
Not applicable.
21
PART II
Item 5. | MARKET FOR REGISTRANT’S COMMON EQUITY, RELATED STOCKHOLDER MATTERS AND ISSUER PURCHASES OF EQUITY SECURITIES |
The principal United States market on which our common shares are traded is the New York Stock Exchange, where our shares are traded under the symbol DRI. As of June 30, 2017, there were approximately 10,815 holders of record of our common shares. The number of registered holders does not include holders who are beneficial owners, but whose shares are held in street name by brokers and other nominees. The information concerning the dividends and high and low intraday sales prices for our common shares traded on the New York Stock Exchange for each full quarterly period during fiscal 2017 and 2016 is contained in Note 18 of the Notes to Consolidated Financial Statements (Part II, Item 8 of this report).
We have not sold any equity securities during the last fiscal year that were not registered under the Securities Act of 1933, as amended.
Since commencing our common share repurchase program in December 1995, we have repurchased a total of 188.6 million shares through May 28, 2017 under authorizations from our Board of Directors. The table below provides information concerning our repurchase of shares of our common stock during the quarter ended May 28, 2017.
(Dollars in millions, except per share data) | Total Number of Shares Purchased (1) (2) | Average Price Paid per Share | Total Number of Shares Purchased as Part of Publicly Announced Plans or Programs | Maximum Dollar Value of Shares That May Yet Be Purchased Under the Plans or Programs (3) | ||||
February 27, 2017 through April 2, 2017 | — | $ | — | — | $ | 485.1 | ||
April 3, 2017 through April 30, 2017 | 3,821 | $ | 85.18 | 3,821 | $ | 484.8 | ||
May 1, 2017 through May 28, 2017 | 172,238 | $ | 87.09 | 172,238 | $ | 469.8 | ||
Total | 176,059 | $ | 87.05 | 176,059 | $ | 469.8 | ||
(1) | All of the shares purchased during the quarter ended May 28, 2017 were purchased as part of our repurchase program. On September 29, 2016, our Board of Directors authorized a new share repurchase program under which the Company may repurchase up to $500.0 million of its outstanding common stock. This repurchase program, which was announced publicly in a press release issued on October 4, 2016, does not have an expiration and replaces the previously existing share repurchase authorizations. |
(2) | The number of shares purchased includes shares withheld for taxes on vesting of restricted stock, shares delivered or deemed to be delivered to us on tender of stock in payment for the exercise price of options, and shares reacquired pursuant to tax withholding on option exercises. These shares are included as part of our repurchase program and deplete the repurchase authority granted by our Board. The number of shares repurchased excludes shares we reacquired pursuant to forfeiture of restricted stock. |
(3) | Repurchases are subject to prevailing market prices, may be made in open market or private transactions, and may occur or be discontinued at any time. There can be no assurance that we will repurchase any additional shares. |
22
Comparison of Five-Year Total Return
Indexed Returns | ||||||||||||||||||||||||
Company/Index | May 2012 | May 2013 | May 2014 | May 2015 | May 2016 | May 2017 | ||||||||||||||||||
Darden Restaurants, Inc. | $ | 100.00 | $ | 103.61 | $ | 101.55 | $ | 139.83 | $ | 165.94 | $ | 223.43 | ||||||||||||
S&P 500 Stock Index | $ | 100.00 | $ | 128.04 | $ | 150.63 | $ | 170.49 | $ | 173.57 | $ | 203.96 | ||||||||||||
S&P Composite 1500 Restaurant Sub-Index | $ | 100.00 | $ | 112.56 | $ | 125.00 | $ | 148.65 | $ | 163.66 | $ | 201.81 | ||||||||||||
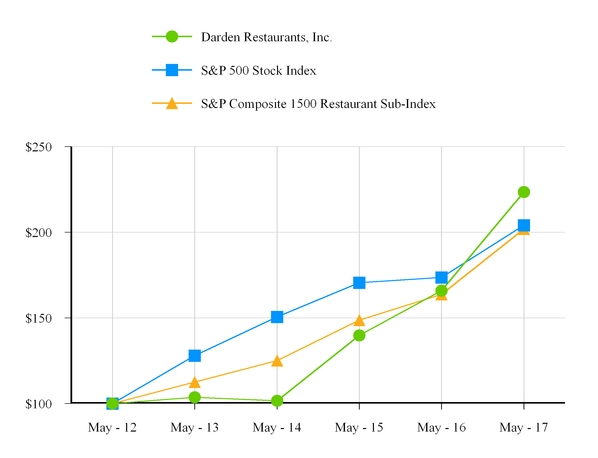
The annual changes for the five-year period shown in the graph on this page are based on the assumption that $100 had been invested in Darden Restaurants, Inc. common stock, the S&P 500 Stock Index and the S&P Composite 1500 Restaurant Sub Index on May 27, 2012, and that all dividends were reinvested. The cumulative dollar returns shown on the graph represent the value that such investments would have had for each period indicated. On November 9, 2015 we completed the spin-off of Four Corners Property Trust, Inc. (FCPT) with the pro rata distribution of one share of FCPT common stock for every three shares of Darden common stock to Darden shareholders. We reflect the effect of the spin-off of FCPT in the cumulative total return of our common stock as a reinvested dividend.
23
Item 6. | SELECTED FINANCIAL DATA |
Fiscal Year Ended | |||||||||||||||||||
(Dollars in millions, except per share data) | May 28, 2017 | May 29, 2016 | May 31, 2015 (2) | May 25, 2014 | May 26, 2013 | ||||||||||||||
Operating Results (1) Sales | $ | 7,170.2 | $ | 6,933.5 | $ | 6,764.0 | $ | 6,285.6 | $ | 5,921.0 | |||||||||
Costs and expenses: | |||||||||||||||||||
Food and beverage | 2,070.3 | 2,039.7 | 2,085.1 | 1,892.2 | 1,743.6 | ||||||||||||||
Restaurant labor | 2,265.3 | 2,189.2 | 2,135.6 | 2,017.6 | 1,892.6 | ||||||||||||||
Restaurant expenses | 1,265.2 | 1,163.5 | 1,120.8 | 1,080.7 | 980.4 | ||||||||||||||
Marketing expenses | 239.7 | 238.0 | 243.3 | 252.3 | 241.1 | ||||||||||||||
General and administrative | 387.7 | 384.9 | 430.2 | 413.1 | 384.1 | ||||||||||||||
Depreciation and amortization | 272.9 | 290.2 | 319.3 | 304.4 | 278.3 | ||||||||||||||
Impairments and disposal of assets, net | (8.4 | ) | 5.8 | 62.1 | 16.4 | 0.9 | |||||||||||||
Total operating costs and expenses | $ | 6,492.7 | $ | 6,311.3 | $ | 6,396.4 | $ | 5,976.7 | $ | 5,521.0 | |||||||||
Operating income | 677.5 | 622.2 | 367.6 | 308.9 | 400.0 | ||||||||||||||
Interest, net | 40.2 | 172.5 | 192.3 | 134.3 | 126.0 | ||||||||||||||
Earnings before income taxes | 637.3 | 449.7 | 175.3 | 174.6 | 274.0 | ||||||||||||||
Income tax expense (benefit) | 154.8 | 90.0 | (21.1 | ) | (8.6 | ) | 36.7 | ||||||||||||
Earnings from continuing operations | $ | 482.5 | $ | 359.7 | $ | 196.4 | $ | 183.2 | $ | 237.3 | |||||||||
Earnings (loss) from discontinued operations, net of tax expense (benefit) of $(4.2), $3.4, $344.8, $32.3 and $72.7 | (3.4 | ) | 15.3 | 513.1 | 103.0 | 174.6 | |||||||||||||
Net earnings | $ | 479.1 | $ | 375.0 | $ | 709.5 | $ | 286.2 | $ | 411.9 | |||||||||
Basic net earnings per share: | |||||||||||||||||||
Earnings from continuing operations | $ | 3.88 | $ | 2.82 | $ | 1.54 | $ | 1.40 | $ | 1.84 | |||||||||
Earnings (loss) from discontinued operations | $ | (0.03 | ) | $ | 0.12 | $ | 4.02 | $ | 0.78 | $ | 1.35 | ||||||||
Net earnings | $ | 3.85 | $ | 2.94 | $ | 5.56 | $ | 2.18 | $ | 3.19 | |||||||||
Diluted net earnings per share: | |||||||||||||||||||
Earnings from continuing operations | $ | 3.83 | $ | 2.78 | $ | 1.51 | $ | 1.38 | $ | 1.80 | |||||||||
Earnings (loss) from discontinued operations | $ | (0.03 | ) | $ | 0.12 | $ | 3.96 | $ | 0.77 | $ | 1.33 | ||||||||
Net earnings | $ | 3.80 | $ | 2.90 | $ | 5.47 | $ | 2.15 | $ | 3.13 | |||||||||
Average number of common shares outstanding: | |||||||||||||||||||
Basic | 124.3 | 127.4 | 127.7 | 131.0 | 129.0 | ||||||||||||||
Diluted | 126.0 | 129.3 | 129.7 | 133.2 | 131.6 | ||||||||||||||
Financial Position | |||||||||||||||||||
Total assets | $ | 5,504.2 | $ | 4,582.6 | $ | 5,994.7 | $ | 7,082.7 | $ | 6,917.3 | |||||||||
Land, buildings and equipment, net | $ | 2,272.3 | $ | 2,041.6 | $ | 3,215.8 | $ | 3,381.0 | $ | 4,391.1 | |||||||||
Working capital (deficit) | $ | (489.4 | ) | $ | (366.8 | ) | $ | (140.3 | ) | $ | 357.3 | $ | (652.0 | ) | |||||
Long-term debt, less current portion | $ | 936.6 | $ | 440.0 | $ | 1,452.3 | $ | 2,463.4 | $ | 2,476.6 | |||||||||
Stockholders’ equity | $ | 2,101.7 | $ | 1,952.0 | $ | 2,333.5 | $ | 2,156.9 | $ | 2,059.5 | |||||||||
Stockholders’ equity per outstanding share | $ | 16.76 | $ | 15.47 | $ | 18.42 | $ | 16.30 | $ | 15.81 | |||||||||
24
Item 6. | SELECTED FINANCIAL DATA (continued) |
Fiscal Year Ended | |||||||||||||||||||
(Dollars in millions, except per share data) | May 28, 2017 | May 29, 2016 | May 31, 2015 (2) | May 25, 2014 | May 26, 2013 | ||||||||||||||
Other Statistics | |||||||||||||||||||
Cash flows from operations (1) | $ | 918.2 | $ | 820.4 | $ | 874.3 | $ | 555.4 | $ | 594.4 | |||||||||
Capital expenditures (1) | $ | 293.0 | $ | 228.3 | $ | 296.5 | $ | 414.8 | $ | 510.1 | |||||||||
Dividends paid | $ | 279.1 | $ | 268.2 | $ | 278.9 | $ | 288.3 | $ | 258.2 | |||||||||
Dividends paid per share | $ | 2.24 | $ | 2.10 | $ | 2.20 | $ | 2.20 | $ | 2.00 | |||||||||
Advertising expense (1) | $ | 239.7 | $ | 238.0 | $ | 243.3 | $ | 252.3 | $ | 241.1 | |||||||||
Stock price: | |||||||||||||||||||
High | $ | 89.14 | $ | 75.60 | $ | 70.38 | $ | 55.25 | $ | 57.93 | |||||||||
Low | $ | 59.50 | $ | 53.38 | $ | 43.56 | $ | 44.78 | $ | 44.11 | |||||||||
Close | $ | 87.95 | $ | 67.48 | $ | 65.54 | $ | 49.55 | $ | 52.83 | |||||||||
Number of employees | 178,729 | 150,942 | 148,892 | 206,489 | 206,578 | ||||||||||||||
Number of restaurants (1) | 1,695 | 1,536 | 1,534 | 1,501 | 1,431 | ||||||||||||||
(1) | Consistent with our consolidated financial statements, information has been presented on a continuing operations basis. Accordingly, all discontinued operations, including the activities related to Red Lobster, have been excluded. |
(2) | Fiscal year 2015 consisted of 53 weeks, while all other fiscal years consisted of 52 weeks. |
25
Item 7. | MANAGEMENT’S DISCUSSION AND ANALYSIS OF FINANCIAL CONDITION AND RESULTS OF OPERATIONS |
This discussion and analysis below for Darden Restaurants, Inc. (Darden, the Company, we, us or our) should be read in conjunction with our consolidated financial statements and related financial statement notes included in Part II of this report under the caption “Item 8 - Financial Statements and Supplementary Data.” We operate on a 52/53-week fiscal year, which ends on the last Sunday in May. Fiscal 2017, which ended May 28, 2017, consisted of 52 weeks. Fiscal 2016, which ended May 29, 2016, consisted of 52 weeks and fiscal 2015, which ended May 31, 2015, consisted of 53 weeks.
OVERVIEW OF OPERATIONS
Our business operates in the full-service dining segment of the restaurant industry. At May 28, 2017, we operated 1,695 restaurants through subsidiaries in the United States and Canada under the Olive Garden®, LongHorn Steakhouse®, Cheddar’s Scratch Kitchen®, The Capital Grille®, Yard House®, Bahama Breeze®, Seasons 52®, and Eddie V’s Prime Seafood® and Wildfish Seafood Grille® (collectively, Eddie V’s) trademarks. We own and operate all of our restaurants in the United States and Canada, except for 9 joint venture restaurants managed by us and 45 franchised restaurants. We also have 33 franchised restaurants in operation located in Latin America, the Middle East and Malaysia. All intercompany balances and transactions have been eliminated in consolidation.
On April 24, 2017, we completed the acquisition of Cheddar’s Scratch Kitchen for $799.0 million in total consideration. The acquired operations of Cheddar’s Scratch Kitchen included 140 company-owned restaurants and 25 franchised restaurants. The results of operations, financial position and cash flows of Cheddar’s Scratch Kitchen are included in our consolidated financial statements as of the date of acquisition. See Note 2 of the Notes to Consolidated Financial Statements (Part II, Item 8 of this report) for further details.
We believe that capable operators of strong, multi-unit brands have the opportunity to increase their share of the restaurant industry’s full-service segment. Generally, the restaurant industry is considered to be comprised of three segments: quick service, fast casual, and full service. All of our restaurants fall within the full-service segment, which is highly fragmented and includes many independent operators and small chains. We believe we have strong brands and that the breadth and depth of our experience and expertise sets us apart in the full-service segment of the restaurant industry. This collective capability is the product of investments over many years in areas that are critical to success in our business, including restaurant operations excellence, brand management excellence, supply chain, talent management and information technology, among other things.
With a focus on growing same-restaurant sales, we’ve implemented a “Back-to-Basics” approach rooted in strong operating fundamentals. We’re focused on improving culinary innovation and execution inside each of our brands, delivering attentive service to each and every one of our guests, and creating an inviting and engaging atmosphere inside our restaurants. We support these priorities with smart and relevant integrated marketing programs that resonate with our guests. By delivering on these operational and brand-building imperatives, we expect to increase our market share through new restaurant and same-restaurant sales growth and deliver best-in-class profitability.
The Darden support structure enables our brands to achieve their ultimate potential by: (1) driving advantages in supply chain and general and administrative support; (2) applying insights collected from our significant guest and transactional databases to enhance guest relationships and identify new opportunities to drive sales growth; and (3) relentlessly driving operating efficiencies and continuous improvement, operating with a sense of urgency and inspiring a performance-driven culture.
We seek to increase profits by leveraging our fixed and semi-fixed costs with sales from new restaurants and increased guest traffic and sales at existing restaurants. To evaluate our operations and assess our financial performance, we monitor a number of operating measures, with a special focus on two key factors:
• | Same-restaurant sales – which is a year-over-year 52-week comparison of each period’s sales volumes for restaurants open at least 16 months, including recently acquired restaurants, regardless of when the restaurants were acquired; and |
• | Segment profit – which is restaurant sales, less food and beverage costs, restaurant labor costs, restaurant expenses and marketing expenses (sometimes referred to as restaurant-level earnings). |
Increasing same-restaurant sales can improve segment profit because these incremental sales provide better leverage of our fixed and semi-fixed restaurant-level costs. A restaurant brand can generate same-restaurant sales increases through increases in guest traffic, increases in the average guest check, or a combination of the two. The average guest check can be impacted by menu price changes and by the mix of menu items sold. For each restaurant brand, we gather daily sales data and regularly analyze the guest traffic counts and the mix of menu items sold to aid in developing menu pricing, product offerings and promotional strategies. We focus on balancing our pricing and product offerings with other initiatives to produce sustainable same-restaurant sales growth. We compute same-restaurant sales using restaurants open at least 16 months because this period is generally
26
required for new restaurant sales levels to normalize. Sales at newly opened restaurants generally do not make a significant contribution to profitability in their initial months of operation due to operating inefficiencies. Our sales and expenses can be impacted significantly by the number and timing of new restaurant openings and closings, and relocations and remodeling of existing restaurants. Pre-opening expenses each period reflect the costs associated with opening new restaurants in current and future periods.
Fiscal 2017 Financial Highlights
Our sales from continuing operations were $7.17 billion in fiscal 2017 compared to $6.93 billion in fiscal 2016. The 3.4 percent increase in sales from continuing operations was driven by a combined Darden same-restaurant sales increase of 1.8 percent, excluding Cheddar’s Scratch Kitchen, and the addition of 19 net new company-owned restaurants plus the addition of 140 Cheddar’s Scratch Kitchen purchased restaurants.
Net earnings from continuing operations for fiscal 2017 were $482.5 million ($3.83 per diluted share) compared with net earnings from continuing operations for fiscal 2016 of $359.7 million ($2.78 per diluted share). Net earnings from continuing operations for fiscal 2017 increased 34.1 percent and diluted net earnings per share from continuing operations increased 37.8 percent compared with fiscal 2016.
Our net loss from discontinued operations was $3.4 million ($0.03 per diluted share) for fiscal 2017, compared with net earnings from discontinued operations of $15.3 million ($0.12 per diluted share) for fiscal 2016. When combined with results from continuing operations, our diluted net earnings per share were $3.80 and $2.90 for fiscal 2017 and 2016, respectively.
Outlook
We expect combined Darden same-restaurant sales to increase in fiscal 2018 between 1.0 percent and 2.0 percent, and we expect fiscal 2018 sales from continuing operations to increase between 11.5 percent and 13.0 percent, including Cheddar’s Scratch Kitchen. In fiscal 2018, we expect to open approximately 35 to 40 new restaurants, including Cheddar’s Scratch Kitchen, and we expect capital expenditures incurred to build new restaurants, remodel and maintain existing restaurants and technology initiatives to be between $400.0 million and $450.0 million.
In June 2017, we announced a quarterly dividend of $0.63 per share, payable on August 1, 2017. Based on the $0.63 quarterly dividend declaration, our expected annual dividend is $2.52 per share, which reflects an increase of 12.5 percent compared to our fiscal 2017 annual dividend. Dividends are subject to the approval of our Board of Directors and, accordingly, the timing and amount of our dividends are subject to change.
There are significant risks and challenges that could impact our operations and ability to increase sales and earnings. The restaurant industry is intensely competitive and sensitive to economic cycles and other business factors, including changes in consumer tastes and dietary habits. Other risks and uncertainties are discussed in Part I, Item 1A of this report.
27
RESULTS OF OPERATIONS FOR FISCAL 2017, 2016 AND 2015
To facilitate review of our results of operations, the following table sets forth our financial results for the periods indicated. All information is derived from the consolidated statements of earnings for the fiscal years ended May 28, 2017, May 29, 2016 and May 31, 2015.
Percent Change | |||||||||||||||||
(in millions) | May 28, 2017 | May 29, 2016 | May 31, 2015 | 2017 vs 2016 | 2016 vs 2015 | ||||||||||||
Sales | $ | 7,170.2 | $ | 6,933.5 | $ | 6,764.0 | 3.4 | % | 2.5 | % | |||||||
Costs and expenses: | |||||||||||||||||
Food and beverage | 2,070.3 | 2,039.7 | 2,085.1 | 1.5 | % | (2.2 | )% | ||||||||||
Restaurant labor | 2,265.3 | 2,189.2 | 2,135.6 | 3.5 | % | 2.5 | % | ||||||||||
Restaurant expenses | 1,265.2 | 1,163.5 | 1,120.8 | 8.7 | % | 3.8 | % | ||||||||||
Marketing expenses | 239.7 | 238.0 | 243.3 | 0.7 | % | (2.2 | )% | ||||||||||
General and administrative expenses | 387.7 | 384.9 | 430.2 | 0.7 | % | (10.5 | )% | ||||||||||
Depreciation and amortization | 272.9 | 290.2 | 319.3 | (6.0 | )% | (9.1 | )% | ||||||||||
Impairments and disposal of assets, net | (8.4 | ) | 5.8 | 62.1 | NM | (90.7 | )% | ||||||||||
Total operating costs and expenses | $ | 6,492.7 | $ | 6,311.3 | $ | 6,396.4 | 2.9 | % | (1.3 | )% | |||||||
Operating income | 677.5 | 622.2 | 367.6 | 8.9 | % | 69.3 | % | ||||||||||
Interest, net | 40.2 | 172.5 | 192.3 | (76.7 | )% | (10.3 | )% | ||||||||||
Earnings before income taxes | 637.3 | 449.7 | 175.3 | 41.7 | % | 156.5 | % | ||||||||||
Income tax expense (benefit) (1) | 154.8 | 90.0 | (21.1 | ) | 72.0 | % | NM | ||||||||||
Earnings from continuing operations | $ | 482.5 | $ | 359.7 | $ | 196.4 | 34.1 | % | 83.1 | % | |||||||
Earnings (loss) from discontinued operations, net of tax | (3.4 | ) | 15.3 | 513.1 | NM | (97.0 | )% | ||||||||||
Net earnings | $ | 479.1 | $ | 375.0 | $ | 709.5 | 27.8 | % | (47.1 | )% | |||||||
(1) Effective tax rate | 24.3 | % | 20.0 | % | (12.0 | )% | |||||||||||
NM = not meaningful | |||||||||||||||||
The following table details the number of company-owned restaurants currently reported in continuing operations, compared with the number open at the end of fiscal 2016 and the end of fiscal 2015.
May 28, 2017 | May 29, 2016 | May 31, 2015 | |||||||
Olive Garden (1) | 846 | 843 | 846 | ||||||
LongHorn Steakhouse | 490 | 481 | 480 | ||||||
Cheddar’s Scratch Kitchen (2) | 140 | — | — | ||||||
Yard House | 67 | 65 | 59 | ||||||
The Capital Grille | 56 | 54 | 54 | ||||||
Bahama Breeze | 37 | 37 | 36 | ||||||
Seasons 52 | 41 | 40 | 43 | ||||||
Eddie V’s | 18 | 16 | 16 | ||||||
Total | 1,695 | 1,536 | 1,534 | ||||||
(1) | Includes six locations in Canada for all periods presented. |
(2) | Includes the 140 Cheddar’s Scratch Kitchen restaurants acquired on April 24, 2017. |
28
SALES
The following table presents our company-owned restaurant sales and U.S. same-restaurant sales (SRS) by brand for the periods indicated.
Fiscal Years | Percent Change | SRS (1) | |||||||||||||||||||||
(in millions) | 2017 | 2016 | 2015 | 2017 vs 2016 | 2016 vs 2015 | 2017 vs 2016 | 2016 vs 2015 | ||||||||||||||||
Olive Garden | $ | 3,938.6 | $ | 3,838.6 | $ | 3,789.6 | 2.6 | % | 1.3 | % | 2.6 | % | 3.1 | % | |||||||||
LongHorn Steakhouse | $ | 1,622.2 | $ | 1,587.7 | $ | 1,544.7 | 2.2 | % | 2.8 | % | 1.2 | % | 3.5 | % | |||||||||
Cheddar’s Scratch Kitchen (2) | $ | 63.0 | $ | — | $ | — | NM | NM | NA | NA | |||||||||||||
Yard House | $ | 530.7 | $ | 507.0 | $ | 469.9 | 4.7 | % | 7.9 | % | (0.2 | )% | 2.3 | % | |||||||||
The Capital Grille | $ | 421.3 | $ | 408.3 | $ | 403.3 | 3.2 | % | 1.2 | % | 0.4 | % | 3.9 | % | |||||||||
Bahama Breeze | $ | 217.8 | $ | 217.9 | $ | 209.2 | — | % | 4.2 | % | 2.2 | % | 4.8 | % | |||||||||
Seasons 52 | $ | 245.0 | $ | 253.8 | $ | 238.6 | (3.5 | )% | 6.4 | % | —% | 4.7 | % | ||||||||||
Eddie V’s | $ | 114.3 | $ | 105.8 | $ | 96.9 | 8.0 | % | 9.2 | % | 1.5 | % | 1.8 | % | |||||||||
(1) | Same-restaurant sales is a year-over-year comparison of each period’s sales volumes for a 52-week year and is limited to restaurants open at least 16 months. |
(2) | Cheddar’s Scratch Kitchen sales from company-owned restaurants are reflected for the period April 24, 2017 through May 28, 2017. |
The following table presents our average annual sales per restaurant by brand for the periods indicated. Average annual sales are calculated as net sales divided by total restaurant operating weeks multiplied by 52 weeks.
Average Annual Sales per Restaurant (1) | ||||||||||||
(in millions) | May 28, 2017 | May 29, 2016 | May 31, 2015 | |||||||||
Olive Garden | $ | 4.7 | $ | 4.5 | $ | 4.4 | ||||||
LongHorn Steakhouse | $ | 3.3 | $ | 3.3 | $ | 3.2 | ||||||
Yard House | $ | 8.1 | $ | 8.2 | $ | 8.3 | ||||||
The Capital Grille | $ | 7.6 | $ | 7.6 | $ | 7.2 | ||||||
Bahama Breeze | $ | 6.0 | $ | 5.9 | $ | 5.7 | ||||||
Seasons 52 | $ | 6.1 | $ | 6.0 | $ | 5.7 | ||||||
Eddie V’s | $ | 6.8 | $ | 6.6 | $ | 6.3 | ||||||
(1) | Excludes Cheddar’s Scratch Kitchen due to the proximity of the acquisition to our fiscal 2017 year end. |
Olive Garden’s sales increase for fiscal 2017 was primarily driven by a U.S. same-restaurant sales increase. The increase in U.S. same-restaurant sales in fiscal 2017 resulted from a 2.4 percent increase in average check combined with a 0.2 percent increase in same-restaurant guest counts. Olive Garden’s sales increase for fiscal 2016 was driven by a U.S. same-restaurant sales increase partially offset by the impact of the 53rd week in fiscal 2015. The increase in U.S. same-restaurant sales in fiscal 2016 resulted from a 2.0 percent increase in average check combined with a 1.1 percent increase in same-restaurant guest counts.
LongHorn Steakhouse’s sales increase for fiscal 2017 was driven by a same-restaurant sales increase combined with revenue from new restaurants. The increase in same-restaurant sales in fiscal 2017 resulted from a 1.6 percent increase in average check partially offset by a 0.4 percent decrease in same-restaurant guest counts. LongHorn Steakhouse’s sales increase for fiscal 2016 was driven by a same-restaurant sales increase combined with revenue from new restaurants, partially offset by the impact of the 53rd week in fiscal 2015. The increase in same-restaurant sales in fiscal 2016 resulted from a 3.0 percent increase in average check combined with a 0.5 percent increase in same-restaurant guest counts.
In total, The Capital Grille, Bahama Breeze, Seasons 52, Eddie V’s, Yard House and Cheddar’s Scratch Kitchen generated sales in fiscal 2017 and 2016 that were 6.7 percent and 5.3 percent above fiscal 2016 and fiscal 2015, respectively. The sales increase for fiscal 2017 was primarily driven by the Cheddar’s Scratch Kitchen acquisition and the incremental sales from new Yard House restaurants. Sales growth also reflected same-restaurant sales increases at The Capital Grille, Bahama Breeze and Eddie V’s in fiscal 2017, partially offset by a same-restaurant sales decrease at Yard House. The sales increase for fiscal 2016 was
29
primarily driven by incremental sales from new Yard House restaurants and same-restaurant sales increases at all five brands partially offset by the impact of the 53rd week in fiscal 2015.
COSTS AND EXPENSES
The following table sets forth selected operating data as a percent of sales from continuing operations for the periods indicated. This information is derived from the consolidated statements of earnings for the fiscal years ended May 28, 2017, May 29, 2016 and May 31, 2015.
Fiscal Years | ||||||||
2017 | 2016 | 2015 | ||||||
Sales | 100.0 | % | 100.0 | % | 100.0 | % | ||
Costs and expenses: | ||||||||
Food and beverage | 28.9 | 29.4 | 30.8 | |||||
Restaurant labor | 31.6 | 31.6 | 31.6 | |||||
Restaurant expenses | 17.6 | 16.8 | 16.6 | |||||
Marketing expenses | 3.3 | 3.4 | 3.6 | |||||
General and administrative expenses | 5.4 | 5.5 | 6.4 | |||||
Depreciation and amortization | 3.8 | 4.2 | 4.7 | |||||
Impairments and disposal of assets, net | (0.1 | ) | 0.1 | 0.9 | ||||
Total operating costs and expenses | 90.6 | % | 91.0 | % | 94.6 | % | ||
Operating income | 9.4 | 9.0 | 5.4 | |||||
Interest, net | 0.6 | 2.5 | 2.8 | |||||
Earnings before income taxes | 8.9 | 6.5 | 2.6 | |||||
Income tax expense (benefit) | 2.2 | 1.3 | (0.3 | ) | ||||
Earnings from continuing operations | 6.7 | 5.2 | 2.9 | |||||
Earnings from discontinued operations, net of taxes | — | 0.2 | 7.6 | |||||
Net earnings | 6.7 | % | 5.4 | % | 10.5 | % | ||
Total operating costs and expenses from continuing operations were $6.49 billion in fiscal 2017, $6.31 billion in fiscal 2016 and $6.40 billion in fiscal 2015. As a percent of sales, total costs and expenses from continuing operations were 90.6 percent in fiscal 2017, 91.0 percent in fiscal 2016 and 94.6 percent in fiscal 2015.
Fiscal 2017 Compared to Fiscal 2016:
• | Food and beverage costs decreased as a percent of sales as a result of pricing, cost savings initiatives and food cost deflation, primarily beef. |
• | Restaurant labor costs were flat as a percent of sales as wage-rate inflation was offset by sales leverage and improved productivity. |
• | Restaurant expenses (which include rent, utilities, repairs and maintenance, credit card, property tax, workers’ compensation, new restaurant pre-opening and other restaurant-level operating expenses) increased as a percent of sales, primarily due to higher rent expense resulting from leasebacks of properties included in the spin-off of Four Corners Property Trust (Four Corners) and individual sale-leasebacks (collectively, real estate transactions), partially offset by sales leverage. |
• | Marketing expenses decreased as a percent of sales as sales leverage was mostly offset by higher media cost. |
• | General and administrative expenses decreased as a percent of sales, primarily due to expenses incurred in fiscal 2016 related to the real estate plan implementation partially offset by a pension settlement charge and expenses incurred in fiscal 2017 related to the acquisition and integration of Cheddar’s Scratch Kitchen. |
• | Depreciation and amortization expense decreased as a percent of sales primarily from the impact of the real estate transactions. |
• | Impairments and disposal of assets, net, were lower as a percent of sales due the benefit from lease termination and asset disposal gains in fiscal 2017 compared to restaurant-related impairments in fiscal 2016. |
30
Fiscal 2016 Compared to Fiscal 2015:
• | Food and beverage costs decreased as a percent of sales as a result of favorable menu mix and pricing, cost savings initiatives and food cost deflation, primarily seafood and dairy. |
• | Restaurant labor costs were flat as a percent of sales as wage-rate inflation, higher manager bonus and salary costs were offset by sales leverage. |
• | Restaurant expenses (which include utilities, repairs and maintenance, credit card, lease, property tax, workers’ compensation, new restaurant pre-opening and other restaurant-level operating expenses) increased as a percent of sales, primarily as a result of increased rent expense partially offset by sales leverage and cost savings initiatives. |
• | Marketing expenses decreased as a percent of sales, primarily as a result of sales leverage. |
• | General and administrative expenses decreased as a percent of sales, primarily due to lower general and administrative expenses incurred in fiscal 2016 related to the real estate plan implementation as compared to the strategic action plan costs incurred in fiscal 2015. General and administrative expenses as a percent of sales also decreased as a result of sales leverage, support cost savings and the favorable settlement of legal matters. |
• | Depreciation and amortization expense decreased as a percent of sales primarily from the impact of the real estate transactions and sales leverage. |
• | Impairments and disposal of assets, net, decreased as a percent of sales primarily due to higher restaurant-related impairments in fiscal 2015. |
INTEREST EXPENSE
Net interest expense decreased as a percent of sales in fiscal 2017 primarily due to debt retirement costs of $106.8 million recorded in fiscal 2016 and lower average debt balances in fiscal 2017 as compared to fiscal 2016 due to the repayment of debt with proceeds from the real estate transactions and additional cash on hand. Net interest expense decreased as a percent of sales in fiscal 2016 primarily due to lower average debt balances in fiscal 2016 as compared to fiscal 2015 related to the retirement of $1.03 billion in principal of long-term debt in fiscal 2016. The decrease was partially offset by higher debt retirement costs of $106.8 million in fiscal 2016 compared to debt retirement costs of $91.3 million in fiscal 2015.
INCOME TAXES
The effective income tax rates for fiscal 2017, 2016 and 2015 for continuing operations were 24.3 percent, 20.0 percent and (12.0) percent, respectively. The increase in our effective tax rate for fiscal 2017 compared to fiscal 2016 and for fiscal 2016 compared to fiscal 2015 was primarily due to higher earnings before income taxes. Our effective tax rate from continuing operations was negative in fiscal 2015 primarily due to the impact of certain tax credits on lower earnings before income taxes driven primarily by costs incurred related to our strategic action plan.
NET EARNINGS AND NET EARNINGS PER SHARE FROM CONTINUING OPERATIONS
Net earnings from continuing operations for fiscal 2017 were $482.5 million ($3.83 per diluted share) compared with net earnings from continuing operations for fiscal 2016 of $359.7 million ($2.78 per diluted share) and net earnings from continuing operations for fiscal 2015 of $196.4 million ($1.51 per diluted share).
Net earnings from continuing operations for fiscal 2017 increased 34.1 percent and diluted net earnings per share from continuing operations increased 37.8 percent compared with fiscal 2016, primarily due to increased sales, lower food and beverage costs, marketing expenses, general and administrative expenses, depreciation and amortization expenses and impairments and disposal of assets, net as a percent of sales, partially offset by higher restaurant expenses as a percent of sales and a higher effective income tax rate. Our diluted net earnings per share from continuing operations for fiscal 2017 were adversely impacted by approximately $0.10 due to a non-cash pension settlement charge and approximately $0.09 related to the acquisition and integration of Cheddar’s Scratch Kitchen.
Net earnings from continuing operations for fiscal 2016 increased 83.1 percent and diluted net earnings per share from continuing operations increased 84.1 percent compared with fiscal 2015, primarily due to increased sales, lower food and beverage costs, marketing expenses, general and administrative expenses, depreciation and amortization expenses and impairments and disposal of assets, net as a percent of sales, partially offset by higher restaurant expenses as a percent of sales and a higher effective income tax rate. Our diluted net earnings per share from continuing operations for fiscal 2016 were adversely impacted by approximately $0.51 due to debt retirement costs and approximately $0.26 related to the real estate plan implementation and positively impacted by approximately $0.02 due to a tax benefit associated with the prior year lobster aquaculture divestiture.
31
EARNINGS (LOSS) FROM DISCONTINUED OPERATIONS
On an after-tax basis, results from discontinued operations for fiscal 2017 were a net loss of $3.4 million ($0.03 per diluted share) compared with earnings from discontinued operations for fiscal 2016 of $15.3 million ($0.12 per diluted share) and fiscal 2015 of $513.1 million ($3.96 per diluted share). Earnings from discontinued operations reflects pre-tax gains of $17.9 million recorded in fiscal 2016 and $837.0 million in fiscal 2015, related to the sale of Red Lobster.
SEGMENT RESULTS
We manage our restaurant brands, Olive Garden, LongHorn Steakhouse, Cheddar’s Scratch Kitchen, The Capital Grille, Yard House, Bahama Breeze, Seasons 52 and Eddie V’s in North America as operating segments. We aggregate our operating segments into reportable segments based on a combination of the size, economic characteristics and sub-segment of full-service dining within which each brand operates. Our four reportable segments are: (1) Olive Garden, (2) LongHorn Steakhouse, (3) Fine Dining and (4) Other Business. See Note 6 of the Notes to Consolidated Financial Statements (Part II, Item 8 of this report) for further details.
Our management uses segment profit as the measure for assessing performance of our segments. The following table presents segment profit margin for the periods indicated.
Fiscal Years | Change | |||||||||||
Segment | 2017 | 2016 | 2015 | 2017 vs 2016 | 2016 vs 2015 | |||||||
Olive Garden | 19.3% | 19.8% | 18.5% | (50 | ) | BP | 130 | BP | ||||
LongHorn Steakhouse | 17.3% | 17.3% | 15.5% | — | BP | 180 | BP | |||||
Fine Dining | 19.6% | 19.5% | 19.0% | 10 | BP | 50 | BP | |||||
Other Business | 16.9% | 16.9% | 15.5% | — | BP | 140 | BP | |||||
The decrease in Olive Garden’s segment profit margin for fiscal 2017 was driven primarily by additional rent expense resulting from the real estate transactions. The growth in Olive Garden’s segment profit margin for fiscal 2016 was driven primarily by leveraging positive same-restaurant sales, food and beverage cost favorability and cost reduction initiatives, partially offset by additional rent expense resulting from real estate transactions. LongHorn’s segment profit margins for fiscal 2017 were flat as additional rent expense resulting from the real estate transactions was offset by food cost deflation. The growth in LongHorn’s segment profit margins for fiscal 2016 was driven primarily by leveraging positive same-restaurant sales as well as improved cost of sales and lower marketing expense, partially offset by additional rent expense resulting from real estate transactions. The growth in Fine Dining’s segment profit margins for fiscal 2017 was driven primarily by food cost deflation, primarily beef, partially offset by higher restaurant expenses. The growth in Fine Dining’s segment profit margins for fiscal 2016 was driven primarily by improved food and beverage costs. The Other Business segment profit margins for fiscal 2017 were flat as food cost deflation was offset by higher labor costs. The growth for fiscal 2016 was driven by positive same-restaurant sales leverage and lower food and beverage costs.
SEASONALITY
Our sales volumes fluctuate seasonally. Typically, our average sales per restaurant are highest in the winter and spring, followed by the summer, and lowest in the fall. Holidays, changes in the economy, severe weather and similar conditions may impact sales volumes seasonally in some operating regions. Because of the seasonality of our business, results for any quarter are not necessarily indicative of the results that may be achieved for the full fiscal year.
IMPACT OF INFLATION
We attempt to minimize the annual effects of inflation through appropriate planning, operating practices and menu price increases. We do not believe inflation had a significant overall effect on our annual results of operations during fiscal 2017 or fiscal 2016. We experienced higher than normal inflationary costs during fiscal 2015 and were able to partially reduce the annual impact utilizing these strategies.
32
CRITICAL ACCOUNTING ESTIMATES
We prepare our consolidated financial statements in conformity with U.S. generally accepted accounting principles. The preparation of these financial statements requires us to make estimates and assumptions that affect the reported amounts of assets and liabilities and disclosure of contingent assets and liabilities at the date of the financial statements and the reported amounts of sales and expenses during the reporting period. Actual results could differ from those estimates.
Our significant accounting policies are more fully described in Note 1 of the Notes to Consolidated Financial Statements (Part II, Item 8 of this report). Judgments and uncertainties affecting the application of those policies may result in materially different amounts being reported under different conditions or using different assumptions. We consider the following estimates to be most critical in understanding the judgments that are involved in preparing our consolidated financial statements.
Leases
We evaluate our leases at their inception to estimate their expected term, which commences on the date when we have the right to control the use of the leased property and includes the non-cancelable base term plus all option periods we are reasonably assured to exercise. Our judgment in determining the appropriate expected term for each lease affects our evaluation of:
• | The classification and accounting for leases as capital versus operating; |
• | The rent holidays and escalation in payments that are included in the calculation of straight-line rent; and |
• | The term over which leasehold improvements for each restaurant facility are amortized. |
These judgments may produce materially different amounts of depreciation, amortization and rent expense than would be reported if different expected lease terms were used.
Valuation of Long-Lived Assets
Land, buildings and equipment and certain other assets, including definite-lived intangible assets, are reviewed for impairment whenever events or changes in circumstances indicate that the carrying amount of an asset may not be recoverable. The judgments we make related to the expected useful lives of long-lived assets, definitions of lease terms and our ability to realize undiscounted cash flows in excess of the carrying amounts of these assets are affected by factors such as the ongoing maintenance and improvements of the assets, changes in economic conditions, changes in usage or operating performance, desirability of the restaurant sites and other factors, such as our ability to sell our assets held for sale. As we assess the ongoing expected cash flows and carrying amounts of our long-lived assets, significant adverse changes in these factors could cause us to realize an impairment loss. Based on a review of operating results for each of our restaurants, the amount of net book value associated with lower performing restaurants that would be deemed at risk for impairment is not material to our consolidated financial statements.
Valuation and Recoverability of Goodwill and Trademarks
Goodwill and trademarks are not subject to amortization and have been assigned to reporting units for purposes of impairment testing. The reporting units are our restaurant brands. At May 28, 2017, we had the following amounts recorded as goodwill and trademarks at our brands:
(in millions) | Goodwill | Trademarks | |||||
Olive Garden | $ | 30.2 | $ | 0.6 | |||
LongHorn Steakhouse | 49.3 | 307.8 | |||||
Cheddar’s Scratch Kitchen (1) | 329.4 | 375.0 | |||||
The Capital Grille | 401.6 | 147.0 | |||||
Yard House | 369.2 | 109.3 | |||||
Eddie V’s | 22.0 | 10.5 | |||||
Total | $ | 1,201.7 | $ | 950.2 | |||
(1) | Goodwill and trademark values for Cheddar’s Scratch Kitchen represent preliminary estimates as the acquisition was completed on April 24, 2017. See Note 2 of the Notes to Consolidated Financial Statements (Part II, Item 8 of this report). |
33
A significant amount of judgment is involved in determining if an indicator of impairment has occurred. Such indicators may include, among others: a significant decline in our expected future cash flows; a sustained, significant decline in our stock price and market capitalization; a significant adverse change in legal factors or in the business climate; unanticipated competition; the testing for recoverability of a significant asset group within a reporting unit; and slower growth rates. Any adverse change in these factors could have a significant impact on the recoverability of these assets and could have a material impact on our consolidated financial statements.
We performed our annual impairment test of our goodwill and trademarks as of the first day of our fiscal fourth quarter using a qualitative assessment. In considering the qualitative approach, we evaluated factors including, but not limited to, macro-economic conditions, market and industry conditions, commodity cost fluctuations, competitive environment, share price performance, results of prior impairment tests, operational stability and the overall financial performance of the reporting units. Based on the results of our qualitative assessment, no impairment of goodwill or trademarks was indicated. Changes in circumstances existing at the measurement date or at other times in the future, or in the numerous estimates associated with management’s judgments and assumptions made in assessing the fair value of our goodwill and trademarks, could result in an impairment loss of a portion or all of our goodwill or trademarks. Due to the proximity of the acquisition to our fiscal 2017 year end, the preliminary estimates for goodwill and trademark related to Cheddar’s Scratch Kitchen were not included in our qualitative assessment.
If our annual test resulted in an impairment of our goodwill or trademarks, our financial position and results of operations would be adversely affected and our leverage ratio for purposes of our credit agreement would increase. A leverage ratio exceeding the maximum permitted under our credit agreement would be a default under our credit agreement. At May 28, 2017, a write-down of goodwill, other indefinite-lived intangible assets, or any other assets in excess of approximately $1.08 billion would have been required to cause our leverage ratio to exceed the permitted maximum. As our leverage ratio is determined on a quarterly basis, and due to the seasonal nature of our business, a lesser amount of impairment in future quarters could cause our leverage ratio to exceed the permitted maximum.
Unearned Revenues
Unearned revenues represent our liability for gift cards that have been sold but not yet redeemed. The estimated value of gift cards expected to remain unused is recognized over the expected period of redemption as the remaining gift card values are redeemed, generally over a period of 10 years. Utilizing this method, we estimate both the amount of breakage and the time period of redemption. If actual redemption patterns vary from our estimates, actual gift card breakage income may differ from the amounts recorded. We update our estimates of our redemption period and our breakage rate periodically and apply that rate to gift card redemptions. Changing our breakage-rate assumption on unredeemed gift cards by 25 basis points would result in an adjustment in our unearned revenues of approximately $21.0 million.
Income Taxes
We estimate certain components of our provision for income taxes. These estimates include, among other items, depreciation and amortization expense allowable for tax purposes, allowable tax credits for items such as taxes paid on reported employee tip income, effective rates for state and local income taxes and the tax deductibility of certain other items. We adjust our annual effective income tax rate as additional information on outcomes or events becomes available.
Assessment of uncertain tax positions requires judgments relating to the amounts, timing and likelihood of resolution. As described in Note 13 of the Notes to Consolidated Financial Statements (Part II, Item 8 of this report), the $16.4 million balance of unrecognized tax benefits at May 28, 2017, includes $0.7 million related to tax positions for which it is reasonably possible that the total amounts could change during the next 12 months based on the outcome of examinations. The $0.7 million relates to items that would impact our effective income tax rate.
LIQUIDITY AND CAPITAL RESOURCES
Cash flows generated from operating activities are our principal source of liquidity, which we use to finance capital expenditures for new restaurants and to remodel and maintain existing restaurants, to pay dividends to our shareholders and to repurchase shares of our common stock. Since substantially all of our sales are for cash and cash equivalents, and accounts payable are generally due in 5 to 45 days, we are able to carry current liabilities in excess of current assets. In addition to cash flows from operations, we use a combination of long-term and short-term borrowings to fund our capital needs.
34
We currently manage our business and financial ratios to target an investment-grade bond rating, which has historically allowed flexible access to financing at reasonable costs. Currently, our publicly issued long-term debt carries “Baa3” (Moody’s Investors Service), “BBB” (Standard & Poor’s) and “BBB” (Fitch) ratings. Our commercial paper has ratings of “P-3” (Moody’s Investors Service), “A-2” (Standard & Poor’s) and “F-2” (Fitch). These ratings are as of the date of the filing of this report and have been obtained with the understanding that Moody’s Investors Service, Standard & Poor’s and Fitch will continue to monitor our credit and make future adjustments to these ratings to the extent warranted. The ratings are not a recommendation to buy, sell or hold our securities, may be changed, superseded or withdrawn at any time and should be evaluated independently of any other rating.
On April 10, 2017, we issued $500.0 million aggregate principal amount of unsecured 3.850 percent senior notes due May 2027 under a registration statement filed with the Securities and Exchange Commission on October 6, 2016. Discount and issuance costs, which totaled $4.4 million, are being amortized over the term of the notes using the straight-line method, the results of which approximate the effective interest method. Interest on the notes is payable semi-annually in arrears on May 1 and November 1 of each year commencing November 1, 2017. We may redeem the notes at any time in whole or from time to time in part, at the principal amount plus a make-whole premium. If we experience a change in control triggering event, unless we have previously exercised our right to redeem the notes, we may be required to purchase the notes from the holders at a purchase price equal to 101 percent of their principal amount plus accrued and unpaid interest.
We maintain a $750.0 million revolving Credit Agreement (Revolving Credit Agreement), with Bank of America, N.A. (BOA) as administrative agent, and the lenders and other agents party thereto. The Revolving Credit Agreement is a senior unsecured credit commitment to the Company and contains customary representations and affirmative and negative covenants (including limitations on liens and subsidiary debt and a maximum consolidated lease adjusted total debt to total capitalization ratio of 0.75 to 1.00) and events of default usual for credit facilities of this type. As of May 28, 2017, we were in compliance with all covenants under the Revolving Credit Agreement.
The Revolving Credit Agreement matures on October 24, 2018, and the proceeds may be used for commercial paper back-up, working capital and capital expenditures, the refinancing of certain indebtedness, certain acquisitions and general corporate purposes. Loans under the Revolving Credit Agreement bear interest at a rate of LIBOR plus a margin determined by reference to a ratings-based pricing grid (Applicable Margin), or the base rate (which is defined as the highest of the BOA prime rate, the Federal Funds rate plus 0.500 percent, and the Eurocurrency Rate plus 1.00 percent) plus the Applicable Margin. Assuming a “BBB” equivalent credit rating level, the Applicable Margin under the Revolving Credit Agreement will be 1.100 percent for LIBOR loans and 0.100 percent for base rate loans. As of May 28, 2017, we had no outstanding balances under the Revolving Credit Agreement.
At May 28, 2017, our long-term debt consisted principally of:
• | $500.0 million of unsecured 3.850 percent senior notes due in May 2027; |
• | $150.0 million of unsecured 6.000 percent senior notes due in August 2035; and |
• | $300.0 million of unsecured 6.800 percent senior notes due in October 2037. |
The interest rate on our $300.0 million 6.800 percent senior notes due October 2037 is subject to adjustment from time to time if the debt rating assigned to such series of notes is downgraded below a certain rating level (or subsequently upgraded). The maximum adjustment is 2.000 percent above the initial interest rate and the interest rate cannot be reduced below the initial interest rate. As of May 28, 2017, no such adjustments are made to this rate.
Through our shelf registration statement on file with the SEC, depending on conditions prevailing in the public capital markets, we may issue unsecured debt securities from time to time in one or more series, which may consist of notes, debentures or other evidences of indebtedness in one or more offerings.
From time to time, we may repurchase our outstanding debt in privately negotiated transactions. Such repurchases, if any, will depend on prevailing market conditions, our liquidity requirements and other factors.
From time to time, we enter into interest rate derivative instruments to manage interest rate risk inherent in our operations. See Note 8 of the Notes to Consolidated Financial Statements (Part II, Item 8 of this report).
35
A summary of our contractual obligations and commercial commitments at May 28, 2017, is as follows:
(in millions) | Payments Due by Period | |||||||||||||||||||
Contractual Obligations | Total | Less Than 1 Year | 1-3 Years | 3-5 Years | More Than 5 Years | |||||||||||||||
Long-term debt (1) | $ | 1,727.2 | $ | 48.7 | $ | 97.3 | $ | 97.3 | $ | 1,483.9 | ||||||||||
Leases (2) | 3,423.5 | 350.0 | 663.9 | 579.6 | 1,830.0 | |||||||||||||||
Purchase obligations (3) | 377.6 | 327.6 | 37.0 | 13.0 | — | |||||||||||||||
Benefit obligations (4) | 364.8 | 29.5 | 60.0 | 67.4 | 207.9 | |||||||||||||||
Unrecognized income tax benefits (5) | 17.4 | 0.8 | 4.3 | 12.3 | — | |||||||||||||||
Total contractual obligations | $ | 5,910.5 | $ | 756.6 | $ | 862.5 | $ | 769.6 | $ | 3,521.8 | ||||||||||
(in millions) | Amount of Commitment Expiration per Period | |||||||||||||||||||
Other Commercial Commitments | Total Amounts Committed | Less Than 1 Year | 1-3 Years | 3-5 Years | More Than 5 Years | |||||||||||||||
Standby letters of credit (6) | $ | 138.1 | $ | 138.1 | $ | — | $ | — | $ | — | ||||||||||
Guarantees (7) | 163.2 | 38.4 | 65.4 | 40.8 | 18.6 | |||||||||||||||
Total commercial commitments | $ | 301.3 | $ | 176.5 | $ | 65.4 | $ | 40.8 | $ | 18.6 | ||||||||||
(1) | Includes interest payments associated with existing long-term debt, including the current portion. Excludes discount and issuance costs of $13.4 million. |
(2) | Inclusive of all arrangements accounted for as operating, capital and financing leases. Includes imputed interest of $78.3 million over the life of financing lease obligations and imputed interest of $29.5 million over the life of capital lease obligations. |
(3) | Includes commitments for food and beverage items and supplies, capital projects, information technology and other miscellaneous commitments. |
(4) | Includes expected contributions associated with our defined benefit plans and payments associated with our postretirement benefit plan and our non-qualified deferred compensation plan through fiscal 2027. |
(5) | Includes interest on unrecognized income tax benefits of $0.9 million, $0.1 million of which relates to contingencies expected to be resolved within one year. |
(6) | Includes letters of credit for $127.5 million of workers’ compensation and general liabilities accrued in our consolidated financial statements and letters of credit for $10.6 million related to contractual operating lease obligations and other payments. |
(7) | Consists solely of guarantees associated with leased properties that have been assigned to third parties and are primarily related to the disposition of Red Lobster. We are not aware of any non-performance under these arrangements that would result in our having to perform in accordance with the terms of the guarantees. |
36
Our fixed-charge coverage ratio, which measures the number of times each year that we earn enough to cover our fixed charges, amounted to 5.0 times and 2.7 times, on a continuing operations basis, for the fiscal years ended May 28, 2017 and May 29, 2016, respectively. Our adjusted debt to adjusted total capital ratio (which includes 6.25 times the total annual minimum rent on a consolidated basis of $303.5 million and $248.5 million for the fiscal years ended May 28, 2017 and May 29, 2016, respectively, as components of adjusted debt and adjusted total capital) was 59 percent and 53 percent as of May 28, 2017 and May 29, 2016, respectively. We include the lease-debt equivalent and contractual lease guarantees in our adjusted debt to adjusted total capital ratio reported to shareholders, as we believe its inclusion better represents the optimal capital structure that we target from period to period and because it is consistent with the calculation of the covenant under our Revolving Credit Agreement.
Based on these ratios, we believe our financial condition is strong. The composition of our capital structure is shown in the following table.
(in millions, except ratios) | May 28, 2017 | May 29, 2016 | ||||||
CAPITAL STRUCTURE | ||||||||
Long-term debt, excluding unamortized discount and issuance costs | $ | 950.0 | $ | 450.0 | ||||
Capital lease obligations | 58.9 | 52.0 | ||||||
Total debt | $ | 1,008.9 | $ | 502.0 | ||||
Stockholders’ equity | 2,101.7 | 1,952.0 | ||||||
Total capital | $ | 3,110.6 | $ | 2,454.0 | ||||
CALCULATION OF ADJUSTED CAPITAL | ||||||||
Total debt | $ | 1,008.9 | $ | 502.0 | ||||
Lease-debt equivalent | 1,896.9 | 1,553.1 | ||||||
Guarantees | 163.2 | 154.2 | ||||||
Adjusted debt | $ | 3,069.0 | $ | 2,209.3 | ||||
Stockholders’ equity | 2,101.7 | 1,952.0 | ||||||
Adjusted total capital | $ | 5,170.7 | $ | 4,161.3 | ||||
CAPITAL STRUCTURE RATIOS | ||||||||
Debt to total capital ratio | 32 | % | 20 | % | ||||
Adjusted debt to adjusted total capital ratio | 59 | % | 53 | % | ||||
Net cash flows provided by operating activities from continuing operations were $918.2 million, $820.4 million and $874.3 million in fiscal 2017, 2016 and 2015, respectively. Net cash flows provided by operating activities include net earnings from continuing operations of $482.5 million, $359.7 million and $196.4 million in fiscal 2017, 2016 and 2015, respectively. Net cash flows provided by operating activities from continuing operations increased in fiscal 2017 primarily due to higher net earnings from continuing operations partially offset by the timing of payments of accounts payable and current period activity of taxable timing differences. Net cash flows provided by operating activities from continuing operations decreased in fiscal 2016 primarily due to current period activity of taxable timing differences and the timing of inventory purchases, offset by higher net earnings from continuing operations.
Net cash flows used in investing activities from continuing operations were $1.07 billion in fiscal 2017 compared to net cash flows provided by investing activities from continuing operations of $75.4 million in fiscal 2016 and net cash flows used in investing activities from continuing operations of $235.1 million in fiscal 2015. Capital expenditures incurred principally for building new restaurants, remodeling existing restaurants, replacing equipment, and technology initiatives were $293.0 million in fiscal 2017, compared to $228.3 million in fiscal 2016 and $296.5 million in fiscal 2015. Additionally, for fiscal 2017, net cash used in the acquisition of Cheddar’s Scratch Kitchen was $764.4 million. For fiscal 2016, proceeds from the disposal of land, buildings and equipment of $325.2 million reflect the impact of closed sale-leaseback transactions.
Net cash flows provided by financing activities from continuing operations were $129.2 million in fiscal 2017, compared to net cash flows used in financing activities from continuing operations of $1.12 billion in fiscal 2016 and $1.78 billion in fiscal 2015. Net cash flows provided by financing activities in fiscal 2017 reflect proceeds from the issuance of $500.0 million of senior notes and proceeds from the exercise of employee stock options, partially offset by dividend payments of $279.1 million and share repurchases of $230.2 million. Net cash flows used in financing activities in fiscal 2016 reflected long-term debt payments of $1.10 billion, including repurchase premiums and make-whole provisions, dividend payments of $268.2 million and share repurchases of $184.8 million, partially offset by the $315.0 million cash dividend received by us from Four Corners and proceeds
37
from the exercise of employee stock options. Net cash flows used in financing activities in fiscal 2015 included long-term debt payments of $1.07 billion, including repurchase premiums and make-whole provisions, dividend payments of $278.9 million, and share repurchases of $502.3 million and net repayments of short-term debt $207.6 million, partially offset by proceeds from the exercise of employee stock options.
Our defined benefit and other postretirement benefit costs and liabilities are determined using various actuarial assumptions and methodologies prescribed under Financial Accounting Standards Board Accounting Standards Codification Topic 715, Compensation - Retirement Benefits and Topic 712, Compensation - Nonretirement Postemployment Benefits. We use certain assumptions including, but not limited to, the selection of a discount rate and expected long-term rate of return on plan assets. We set the discount rate assumption annually for each plan at its valuation date to reflect the yield of high-quality fixed-income debt instruments, with lives that approximate the maturity of the plan benefits. At May 28, 2017, our discount rate was 4.06 percent and 3.98 percent, respectively, for our defined benefit and postretirement benefit plans. The expected long-term rate of return on plan assets is based upon several factors, including our historical assumptions compared with actual results, an analysis of current market conditions, asset allocations and the views of leading financial advisers and economists. Our expected long-term rate of return on plan assets for our defined benefit plans was 6.5 percent for fiscal year 2017, 6.5 percent for fiscal year 2016 and 7.0 percent for fiscal year 2015. We made defined benefit plans contributions of approximately $0.4 million, $25.4 million and $0.4 million in fiscal years 2017, 2016 and 2015, respectively. We expect to contribute approximately $0.4 million to our defined benefit pension plans and approximately $1.3 million to our postretirement benefit plan during fiscal 2018.
We have recognized net losses of $70.1 million (net of tax) and of $0.3 million (net of tax) as components of accumulated other comprehensive income (loss) for the defined benefit plans and postretirement benefit plan, respectively, as of May 28, 2017. These net losses represent changes in the amount of the projected benefit obligation and plan assets resulting from differences in the assumptions used and actual experience. The amortization of the net loss component of our fiscal 2018 net periodic benefit cost for the defined benefit plans is expected to be approximately $1.7 million (net of tax). The amortization of the net gain component of our fiscal 2018 net periodic benefit cost for the postretirement benefit plan is expected to be approximately $1.9 million (net of tax).
We believe our defined benefit and postretirement benefit plan assumptions are appropriate based upon the factors discussed above. However, other assumptions could also be reasonably applied that could differ from the assumptions used. These changes in assumptions would not significantly impact our funding requirements.
We are not aware of any trends or events that would materially affect our capital requirements or liquidity. We believe that our internal cash-generating capabilities, the potential issuance of unsecured debt securities under our shelf registration statement and short-term commercial paper should be sufficient to finance our capital expenditures, debt maturities, stock repurchase program and other operating activities through fiscal 2018.
OFF-BALANCE SHEET ARRANGEMENTS
We are not a party to any off-balance sheet arrangements that have, or are reasonably likely to have, a current or future material effect on our financial condition, changes in financial condition, sales or expenses, results of operations, liquidity, capital expenditures or capital resources.
FINANCIAL CONDITION
Our total current assets were $799.8 million at May 28, 2017, compared with $820.3 million at May 29, 2016. The decrease was primarily due to the decrease in cash and cash equivalents driven by the acquisition of Cheddar’s Scratch Kitchen.
Our total current liabilities were $1.29 billion at May 28, 2017, compared with $1.19 billion at May 29, 2016. The increase was primarily due to an increase in unearned revenues associated with gift card sales in excess of redemptions.
APPLICATION OF NEW ACCOUNTING STANDARDS
See Note 1 of the Notes to Consolidated Financial Statements (Part II, Item 8 of this report) for a discussion of recently issued accounting standards.
38
Item 7A. QUANTITATIVE AND QUALITATIVE DISCLOSURES ABOUT MARKET RISK
We are exposed to a variety of market risks, including fluctuations in interest rates, foreign currency exchange rates, compensation and commodity prices. To manage this exposure, we periodically enter into interest rate and foreign currency exchange instruments, equity forward and commodity derivative instruments for other than trading purposes. See Notes 1 and 8 of the Notes to Consolidated Financial Statements (Part II, Item 8 of this report).
We use the variance/covariance method to measure value at risk, over time horizons ranging from one week to one year, at the 95 percent confidence level. At May 28, 2017, our potential losses in future net earnings resulting from changes in foreign currency exchange rate instruments, commodity instruments, equity forwards and floating-rate debt interest rate exposures were approximately $30.0 million over a period of one year. The value at risk from an increase in the fair value of all of our long-term fixed-rate debt, over a period of one year, was approximately $100.3 million. The fair value of our long-term fixed-rate debt outstanding as of May 28, 2017, averaged $574.3 million, with a high of $1.06 billion and a low of $492.6 million during fiscal 2017. Our interest rate risk management objective is to limit the impact of interest rate changes on earnings and cash flows by targeting an appropriate mix of variable and fixed-rate debt.
39
Item 8. | FINANCIAL STATEMENTS AND SUPPLEMENTARY DATA |
INDEX TO CONSOLIDATED FINANCIAL STATEMENTS
Page | |
40
REPORT OF MANAGEMENT’S RESPONSIBILITIES
The management of Darden Restaurants, Inc. is responsible for the fairness and accuracy of the consolidated financial statements. The consolidated financial statements have been prepared in accordance with U.S. generally accepted accounting principles, using management’s best estimates and judgments where appropriate. The financial information throughout this report is consistent with our consolidated financial statements.
Management has established a system of internal controls over financial reporting that provides reasonable assurance that assets are adequately safeguarded and transactions are recorded accurately, in all material respects, in accordance with management’s authorization. Our internal controls provide for appropriate segregation of duties and responsibilities and there are documented policies regarding utilization of our assets and proper financial reporting. These formally stated and regularly communicated policies set high standards of ethical conduct for all employees. We also maintain a strong audit program that independently evaluates the adequacy of the design and operating effectiveness of these internal controls.
The Audit Committee of the Board of Directors meets at least quarterly to determine that management, internal auditors and the independent registered public accounting firm are properly discharging their duties regarding internal control and financial reporting. Management, internal auditors and the independent registered public accounting firm have full and free access to the Audit Committee at any time.
KPMG LLP, an independent registered public accounting firm, is retained to audit our consolidated financial statements and the effectiveness of our internal control over financial reporting. Their reports follow.
MANAGEMENT’S REPORT ON INTERNAL CONTROL OVER FINANCIAL REPORTING
Management is responsible for establishing and maintaining adequate internal control over financial reporting (as defined in Rule 13a-15(f) under the Securities Exchange Act of 1934, as amended). The Company’s internal control over financial reporting is designed to provide reasonable assurance to the Company’s management and Board of Directors regarding the preparation and fair presentation of published financial statements.
Because of its inherent limitations, internal control over financial reporting may not prevent or detect misstatements. Also, projections of any evaluation of effectiveness to future periods are subject to the risk that controls may become inadequate because of changes in conditions, or that the degree of compliance with the policies or procedures may deteriorate.
Management assessed the effectiveness of the Company’s internal control over financial reporting as of May 28, 2017. In making this assessment, management used the criteria set forth by the Committee of Sponsoring Organizations of the Treadway Commission (COSO) in Internal Control-Integrated Framework (2013). Management has concluded that, as of May 28, 2017, the Company’s internal control over financial reporting was effective based on these criteria. Management excluded from its assessment of the effectiveness of the Company’s internal control over financial reporting as of May 28, 2017, Cheddar’s Scratch Kitchen’s internal control over financial reporting associated with total assets of $980.3 million and total revenues of $63.0 million in the consolidated financial statements of the Company as of and for the year ended May 28, 2017.
The Company’s independent registered public accounting firm KPMG LLP, has issued an audit report on the effectiveness of our internal control over financial reporting, which follows.
/s/ Eugene I. Lee, Jr.
Eugene I. Lee, Jr.
President and Chief Executive Officer
41
Report of Independent Registered Public Accounting Firm
The Board of Directors and Stockholders
Darden Restaurants, Inc.:
We have audited Darden Restaurants, Inc. and subsidiaries’ internal control over financial reporting as of May 28, 2017, based on criteria established in Internal Control – Integrated Framework (2013) issued by the Committee of Sponsoring Organizations of the Treadway Commission (COSO). Darden Restaurants, Inc.’s management is responsible for maintaining effective internal control over financial reporting and for its assessment of the effectiveness of internal control over financial reporting, included in the accompanying Management’s Report on Internal Control over Financial Reporting. Our responsibility is to express an opinion on the Company’s internal control over financial reporting based on our audit.
We conducted our audit in accordance with the standards of the Public Company Accounting Oversight Board (United States). Those standards require that we plan and perform the audit to obtain reasonable assurance about whether effective internal control over financial reporting was maintained in all material respects. Our audit included obtaining an understanding of internal control over financial reporting, assessing the risk that a material weakness exists, and testing and evaluating the design and operating effectiveness of internal control based on the assessed risk. Our audit also included performing such other procedures as we considered necessary in the circumstances. We believe that our audit provides a reasonable basis for our opinion.
A company’s internal control over financial reporting is a process designed to provide reasonable assurance regarding the reliability of financial reporting and the preparation of financial statements for external purposes in accordance with generally accepted accounting principles. A company’s internal control over financial reporting includes those policies and procedures that (1) pertain to the maintenance of records that, in reasonable detail, accurately and fairly reflect the transactions and dispositions of the assets of the company; (2) provide reasonable assurance that transactions are recorded as necessary to permit preparation of financial statements in accordance with generally accepted accounting principles, and that receipts and expenditures of the company are being made only in accordance with authorizations of management and directors of the company; and (3) provide reasonable assurance regarding prevention or timely detection of unauthorized acquisition, use, or disposition of the company’s assets that could have a material effect on the financial statements.
Because of its inherent limitations, internal control over financial reporting may not prevent or detect misstatements. Also, projections of any evaluation of effectiveness to future periods are subject to the risk that controls may become inadequate because of changes in conditions, or that the degree of compliance with the policies or procedures may deteriorate.
In our opinion, Darden Restaurants, Inc. maintained, in all material respects, effective internal control over financial reporting as of May 28, 2017, based on criteria established in Internal Control – Integrated Framework (2013) issued by the Committee of Sponsoring Organizations of the Treadway Commission (COSO).
Darden Restaurants, Inc. acquired Cheddar’s Scratch Kitchen during 2017, and management excluded from its assessment of the effectiveness of Darden Restaurants, Inc.’s internal control over financial reporting as of May 28, 2017, Cheddar’s Scratch Kitchen’s internal control over financial reporting associated with total assets of $980.3 million and total revenues of $63.0 million included in the consolidated financial statements of Darden Restaurants, Inc. and subsidiaries as of and for the year ended May 28, 2017. Our audit of internal control over financial reporting of Darden Restaurants, Inc. also excluded an evaluation of the internal control over financial reporting of Cheddar’s Scratch Kitchen.
We also have audited, in accordance with the standards of the Public Company Accounting Oversight Board (United States), the consolidated balance sheets of Darden Restaurants, Inc. as of May 28, 2017 and May 29, 2016, and the related consolidated statements of earnings, comprehensive income, changes in stockholders’ equity, and cash flows for each of the years in the three-year period ended May 28, 2017, and our report dated July 21, 2017 expressed an unqualified opinion on those consolidated financial statements.
/s/ KPMG LLP
Orlando, Florida
July 21, 2017
Certified Public Accountants
42
Report of Independent Registered Public Accounting Firm
The Board of Directors and Stockholders
Darden Restaurants, Inc.:
We have audited the accompanying consolidated balance sheets of Darden Restaurants, Inc. and subsidiaries as of May 28, 2017 and May 29, 2016, and the related consolidated statements of earnings, comprehensive income, changes in stockholders’ equity, and cash flows for each of the years in the three-year period ended May 28, 2017. These consolidated financial statements are the responsibility of the Company’s management. Our responsibility is to express an opinion on these consolidated financial statements based on our audits.
We conducted our audits in accordance with the standards of the Public Company Accounting Oversight Board (United States). Those standards require that we plan and perform the audit to obtain reasonable assurance about whether the financial statements are free of material misstatement. An audit includes examining, on a test basis, evidence supporting the amounts and disclosures in the financial statements. An audit also includes assessing the accounting principles used and significant estimates made by management, as well as evaluating the overall financial statement presentation. We believe that our audits provide a reasonable basis for our opinion.
In our opinion, the consolidated financial statements referred to above present fairly, in all material respects, the financial position of Darden Restaurants, Inc. as of May 28, 2017 and May 29, 2016, and the results of their operations and their cash flows for each of the years in the three-year period ended May 28, 2017, in conformity with U.S. generally accepted accounting principles.
We also have audited, in accordance with the standards of the Public Company Accounting Oversight Board (United States), Darden Restaurants, Inc.’s internal control over financial reporting as of May 28, 2017, based on criteria established in Internal Control – Integrated Framework (2013) issued by the Committee of Sponsoring Organizations of the Treadway Commission (COSO), and our report dated July 21, 2017 expressed an unqualified opinion on the effectiveness of the Company’s internal control over financial reporting.
/s/ KPMG LLP
Orlando, Florida
July 21, 2017
Certified Public Accountants
43
DARDEN RESTAURANTS, INC.
CONSOLIDATED STATEMENTS OF EARNINGS
(In millions, except per share data)
May 28, 2017 | May 29, 2016 | May 31, 2015 | |||||||||
Sales | $ | 7,170.2 | $ | 6,933.5 | $ | 6,764.0 | |||||
Costs and expenses: | |||||||||||
Food and beverage | 2,070.3 | 2,039.7 | 2,085.1 | ||||||||
Restaurant labor | 2,265.3 | 2,189.2 | 2,135.6 | ||||||||
Restaurant expenses | 1,265.2 | 1,163.5 | 1,120.8 | ||||||||
Marketing expenses | 239.7 | 238.0 | 243.3 | ||||||||
General and administrative expenses | 387.7 | 384.9 | 430.2 | ||||||||
Depreciation and amortization | 272.9 | 290.2 | 319.3 | ||||||||
Impairments and disposal of assets, net | (8.4 | ) | 5.8 | 62.1 | |||||||
Total operating costs and expenses | $ | 6,492.7 | $ | 6,311.3 | $ | 6,396.4 | |||||
Operating income | 677.5 | 622.2 | 367.6 | ||||||||
Interest, net | 40.2 | 172.5 | 192.3 | ||||||||
Earnings before income taxes | 637.3 | 449.7 | 175.3 | ||||||||
Income tax expense (benefit) | 154.8 | 90.0 | (21.1 | ) | |||||||
Earnings from continuing operations | $ | 482.5 | $ | 359.7 | $ | 196.4 | |||||
Earnings (loss) from discontinued operations, net of tax expense (benefit) of $(4.2), $3.4 and $344.8, respectively | (3.4 | ) | 15.3 | 513.1 | |||||||
Net earnings | $ | 479.1 | $ | 375.0 | $ | 709.5 | |||||
Basic net earnings per share: | |||||||||||
Earnings from continuing operations | $ | 3.88 | $ | 2.82 | $ | 1.54 | |||||
Earnings (loss) from discontinued operations | (0.03 | ) | 0.12 | 4.02 | |||||||
Net earnings | $ | 3.85 | $ | 2.94 | $ | 5.56 | |||||
Diluted net earnings per share: | |||||||||||
Earnings from continuing operations | $ | 3.83 | $ | 2.78 | $ | 1.51 | |||||
Earnings (loss) from discontinued operations | (0.03 | ) | 0.12 | 3.96 | |||||||
Net earnings | $ | 3.80 | $ | 2.90 | $ | 5.47 | |||||
Average number of common shares outstanding: | |||||||||||
Basic | 124.3 | 127.4 | 127.7 | ||||||||
Diluted | 126.0 | 129.3 | 129.7 | ||||||||
Dividends declared per common share | $ | 2.24 | $ | 2.10 | $ | 2.20 | |||||
See accompanying notes to consolidated financial statements.
44
DARDEN RESTAURANTS, INC.
CONSOLIDATED STATEMENTS OF COMPREHENSIVE INCOME
(In millions)
May 28, 2017 | May 29, 2016 | May 31, 2015 | |||||||||
Net earnings | $ | 479.1 | $ | 375.0 | $ | 709.5 | |||||
Other comprehensive income (loss): | |||||||||||
Foreign currency adjustment | 0.5 | 0.5 | 3.0 | ||||||||
Change in fair value of derivatives and amortization of unrecognized gains and losses on derivatives, net of taxes of $0.5, $14.3 and $17.4, respectively | 4.3 | 23.0 | 31.3 | ||||||||
Net unamortized gain (loss) arising during period, including amortization of unrecognized net actuarial loss, net of taxes of $11.9, $(16.0) and $4.8, respectively | 19.3 | (23.9 | ) | 7.2 | |||||||
Other comprehensive income (loss) | $ | 24.1 | $ | (0.4 | ) | $ | 41.5 | ||||
Total comprehensive income | $ | 503.2 | $ | 374.6 | $ | 751.0 | |||||
See accompanying notes to consolidated financial statements.
45
DARDEN RESTAURANTS, INC.
CONSOLIDATED BALANCE SHEETS
(In millions)
May 28, 2017 | May 29, 2016 | ||||||
ASSETS | |||||||
Current assets: | |||||||
Cash and cash equivalents | $ | 233.1 | $ | 274.8 | |||
Receivables, net | 75.9 | 64.0 | |||||
Inventories | 178.9 | 175.4 | |||||
Prepaid income taxes | 6.2 | 46.1 | |||||
Prepaid expenses and other current assets | 80.7 | 76.4 | |||||
Deferred income taxes | 211.8 | 163.3 | |||||
Assets held for sale | 13.2 | 20.3 | |||||
Total current assets | $ | 799.8 | $ | 820.3 | |||
Land, buildings and equipment, net | 2,272.3 | 2,041.6 | |||||
Goodwill | 1,201.7 | 872.3 | |||||
Trademarks | 950.2 | 574.6 | |||||
Other assets | 280.2 | 273.8 | |||||
Total assets | $ | 5,504.2 | $ | 4,582.6 | |||
LIABILITIES AND STOCKHOLDERS’ EQUITY | |||||||
Current liabilities: | |||||||
Accounts payable | $ | 249.5 | $ | 241.9 | |||
Accrued payroll | 149.1 | 135.1 | |||||
Accrued income taxes | 1.9 | — | |||||
Other accrued taxes | 54.2 | 49.1 | |||||
Unearned revenues | 388.6 | 360.4 | |||||
Other current liabilities | 445.9 | 400.6 | |||||
Total current liabilities | $ | 1,289.2 | $ | 1,187.1 | |||
Long-term debt | 936.6 | 440.0 | |||||
Deferred income taxes | 357.5 | 255.2 | |||||
Deferred rent | 282.8 | 249.7 | |||||
Other liabilities | 536.4 | 498.6 | |||||
Total liabilities | $ | 3,402.5 | $ | 2,630.6 | |||
Stockholders’ equity: | |||||||
Common stock and surplus, no par value. Authorized 500.0 shares; issued 126.7 and 127.5 shares, respectively; outstanding 125.4 and 126.2 shares, respectively | 1,614.6 | 1,502.6 | |||||
Preferred stock, no par value. Authorized 25.0 shares; none issued and outstanding | — | — | |||||
Retained earnings | 560.1 | 547.5 | |||||
Treasury stock, 1.3 and 1.3 shares, at cost, respectively | (7.8 | ) | (7.8 | ) | |||
Accumulated other comprehensive income (loss) | (62.9 | ) | (87.0 | ) | |||
Unearned compensation | (2.3 | ) | (3.3 | ) | |||
Total stockholders’ equity | $ | 2,101.7 | $ | 1,952.0 | |||
Total liabilities and stockholders’ equity | $ | 5,504.2 | $ | 4,582.6 | |||
See accompanying notes to consolidated financial statements.
46
DARDEN RESTAURANTS, INC.
CONSOLIDATED STATEMENTS OF CHANGES IN STOCKHOLDERS’ EQUITY
(In millions, except per share data)
Common Stock And Surplus | Retained Earnings | Treasury Stock | Accumulated Other Comprehensive Income (Loss) | Unearned Compensation | Total Stockholders’ Equity | ||||||||||||||||||
Balances at May 25, 2014 | $ | 1,302.2 | $ | 995.8 | $ | (7.8 | ) | $ | (128.1 | ) | $ | (5.2 | ) | $ | 2,156.9 | ||||||||
Net earnings | — | 709.5 | — | — | — | 709.5 | |||||||||||||||||
Other comprehensive income | — | — | — | 41.5 | — | 41.5 | |||||||||||||||||
Dividends declared ($2.20 per share) | — | (279.5 | ) | — | — | — | (279.5 | ) | |||||||||||||||
Stock option exercises (4.2 shares) | 154.6 | — | — | — | — | 154.6 | |||||||||||||||||
Stock-based compensation | 26.4 | — | — | — | — | 26.4 | |||||||||||||||||
Income tax benefits credited to equity | 18.4 | — | — | — | — | 18.4 | |||||||||||||||||
Repurchases of common stock (10.0 shares) | (102.5 | ) | (399.8 | ) | — | — | — | (502.3 | ) | ||||||||||||||
Issuance of stock under Employee Stock Purchase Plan and other plans (0.1 shares) | 6.8 | — | — | — | — | 6.8 | |||||||||||||||||
Other | — | — | — | — | 1.2 | 1.2 | |||||||||||||||||
Balances at May 31, 2015 | $ | 1,405.9 | $ | 1,026.0 | $ | (7.8 | ) | $ | (86.6 | ) | $ | (4.0 | ) | $ | 2,333.5 | ||||||||
Net earnings | — | 375.0 | — | — | — | 375.0 | |||||||||||||||||
Other comprehensive income | — | — | — | (0.4 | ) | — | (0.4 | ) | |||||||||||||||
Dividends declared ($2.10 per share) | — | (268.2 | ) | — | — | — | (268.2 | ) | |||||||||||||||
Stock option exercises (2.4 shares) | 94.4 | — | — | — | — | 94.4 | |||||||||||||||||
Stock-based compensation | 14.9 | — | — | — | — | 14.9 | |||||||||||||||||
Income tax benefits credited to equity | 17.5 | — | — | — | — | 17.5 | |||||||||||||||||
Repurchases of common stock (3.0 shares) | (34.9 | ) | (149.9 | ) | — | — | — | (184.8 | ) | ||||||||||||||
Issuance of stock under Employee Stock Purchase Plan and other plans (0.2 shares) | 4.8 | — | — | — | 0.1 | 4.9 | |||||||||||||||||
Separation of Four Corners Property Trust | — | (435.4 | ) | — | — | — | (435.4 | ) | |||||||||||||||
Other | — | — | — | — | 0.6 | 0.6 | |||||||||||||||||
Balances at May 29, 2016 | $ | 1,502.6 | $ | 547.5 | $ | (7.8 | ) | $ | (87.0 | ) | $ | (3.3 | ) | $ | 1,952.0 | ||||||||
Net earnings | — | 479.1 | — | — | — | 479.1 | |||||||||||||||||
Other comprehensive income | — | — | — | 24.1 | — | 24.1 | |||||||||||||||||
Dividends declared ($2.24 per share) | — | (279.6 | ) | — | — | — | (279.6 | ) | |||||||||||||||
Stock option exercises (2.7 shares) | 107.8 | — | — | — | — | 107.8 | |||||||||||||||||
Stock-based compensation | 15.6 | — | — | — | — | 15.6 | |||||||||||||||||
Income tax benefits credited to equity | 27.2 | — | — | — | — | 27.2 | |||||||||||||||||
Repurchases of common stock (3.7 shares) | (43.7 | ) | (186.5 | ) | — | — | — | (230.2 | ) | ||||||||||||||
Issuance of stock under Employee Stock Purchase Plan and other plans (0.2 shares) | 5.1 | — | — | — | 0.2 | 5.3 | |||||||||||||||||
Other | — | (0.4 | ) | — | — | 0.8 | 0.4 | ||||||||||||||||
Balances at May 28, 2017 | $ | 1,614.6 | $ | 560.1 | $ | (7.8 | ) | $ | (62.9 | ) | $ | (2.3 | ) | $ | 2,101.7 | ||||||||
See accompanying notes to consolidated financial statements.
47
DARDEN RESTAURANTS, INC.
CONSOLIDATED STATEMENTS OF CASH FLOWS
(In millions)
Fiscal Year Ended | |||||||||||
May 28, 2017 | May 29, 2016 | May 31, 2015 | |||||||||
Cash flows - operating activities | |||||||||||
Net earnings | $ | 479.1 | $ | 375.0 | $ | 709.5 | |||||
(Earnings) losses from discontinued operations, net of tax | 3.4 | (15.3 | ) | (513.1 | ) | ||||||
Adjustments to reconcile net earnings from continuing operations to cash flows: | |||||||||||
Depreciation and amortization | 272.9 | 290.2 | 319.3 | ||||||||
Impairments and disposal of assets, net | (8.4 | ) | 5.8 | 62.1 | |||||||
Amortization of loan costs and losses on interest-rate related derivatives | 1.0 | 3.6 | 8.6 | ||||||||
Stock-based compensation expense | 40.7 | 37.3 | 53.7 | ||||||||
Change in current assets and liabilities | 112.6 | 13.7 | 76.3 | ||||||||
Contributions to pension and postretirement plans | (1.6 | ) | (26.5 | ) | (1.5 | ) | |||||
Change in cash surrender value of trust-owned life insurance | (10.3 | ) | 3.3 | (6.5 | ) | ||||||
Deferred income taxes | (22.9 | ) | (10.8 | ) | 42.0 | ||||||
Change in deferred rent | 32.9 | 23.8 | 22.0 | ||||||||
Change in other assets and liabilities | (5.0 | ) | 5.3 | 3.8 | |||||||
Loss on extinguishment of debt | — | 106.8 | 91.3 | ||||||||
Other, net | 23.8 | 8.2 | 6.8 | ||||||||
Net cash provided by operating activities of continuing operations | $ | 918.2 | $ | 820.4 | $ | 874.3 | |||||
Cash flows - investing activities | |||||||||||
Purchases of land, buildings and equipment | (293.0 | ) | (228.3 | ) | (296.5 | ) | |||||
Proceeds from disposal of land, buildings and equipment | 8.3 | 325.2 | 67.9 | ||||||||
Purchases of marketable securities | (0.9 | ) | — | — | |||||||
Proceeds from sale of marketable securities | 3.7 | 1.8 | 9.7 | ||||||||
Cash used in business acquisitions, net of cash acquired | (764.4 | ) | — | — | |||||||
Purchases of capitalized software and other assets | (25.3 | ) | (23.3 | ) | (16.2 | ) | |||||
Net cash provided by (used in) investing activities of continuing operations | $ | (1,071.6 | ) | $ | 75.4 | $ | (235.1 | ) | |||
Cash flows - financing activities | |||||||||||
Proceeds from issuance of common stock | 113.1 | 99.3 | 159.7 | ||||||||
Income tax benefits credited to equity | 27.2 | 17.5 | 18.4 | ||||||||
Special cash distribution from Four Corners Property Trust | — | 315.0 | — | ||||||||
Dividends paid | (279.1 | ) | (268.2 | ) | (278.9 | ) | |||||
Repurchases of common stock | (230.2 | ) | (184.8 | ) | (502.3 | ) | |||||
ESOP note receivable repayments | 0.8 | 0.6 | 1.2 | ||||||||
Proceeds from issuance of short-term debt | — | — | 397.4 | ||||||||
Repayments of short-term debt | — | — | (605.0 | ) | |||||||
Repayments of long-term debt | — | (1,096.8 | ) | (1,065.9 | ) | ||||||
Proceeds from issuance of long-term debt | 500.0 | — | — | ||||||||
Payment of debt issuance costs | (4.4 | ) | — | — | |||||||
Principal payments on capital and financing leases | (3.9 | ) | (3.4 | ) | (2.2 | ) | |||||
Proceeds from financing lease obligation | 5.7 | — | 93.1 | ||||||||
Net cash provided by (used) in financing activities of continuing operations | $ | 129.2 | $ | (1,120.8 | ) | $ | (1,784.5 | ) | |||
Cash flows - discontinued operations | |||||||||||
Net cash used in operating activities of discontinued operations | (18.3 | ) | (42.4 | ) | (403.3 | ) | |||||
Net cash provided by investing activities of discontinued operations | 0.8 | 6.3 | 1,986.2 | ||||||||
Net cash provided by (used) in discontinued operations | $ | (17.5 | ) | $ | (36.1 | ) | $ | 1,582.9 | |||
Increase (decrease) in cash and cash equivalents | (41.7 | ) | (261.1 | ) | 437.6 | ||||||
Cash and cash equivalents - beginning of year | 274.8 | 535.9 | 98.3 | ||||||||
Cash and cash equivalents - end of year | $ | 233.1 | $ | 274.8 | $ | 535.9 | |||||
48
DARDEN RESTAURANTS, INC.
CONSOLIDATED STATEMENTS OF CASH FLOWS (Continued)
(In millions)
Fiscal Year Ended | |||||||||||
May 28, 2017 | May 29, 2016 | May 31, 2015 | |||||||||
Cash flows from changes in current assets and liabilities | |||||||||||
Receivables, net | $ | (6.5 | ) | $ | 14.0 | $ | 7.8 | ||||
Inventories | 5.0 | (11.8 | ) | 64.5 | |||||||
Prepaid expenses and other current assets | (1.1 | ) | (10.8 | ) | 2.9 | ||||||
Accounts payable | (9.0 | ) | 45.6 | (20.9 | ) | ||||||
Accrued payroll | 0.8 | (5.9 | ) | 23.4 | |||||||
Prepaid/accrued income taxes | 41.4 | (21.3 | ) | (13.8 | ) | ||||||
Other accrued taxes | 0.4 | (1.4 | ) | 2.2 | |||||||
Unearned revenues | 41.6 | 46.0 | 34.9 | ||||||||
Other current liabilities | 40.0 | (40.7 | ) | (24.7 | ) | ||||||
Change in current assets and liabilities | $ | 112.6 | $ | 13.7 | $ | 76.3 | |||||
See accompanying notes to consolidated financial statements.
49
NOTES TO CONSOLIDATED FINANCIAL STATEMENTS
NOTE 1 - SUMMARY OF SIGNIFICANT ACCOUNTING POLICIES
Operations and Principles of Consolidation
The accompanying consolidated financial statements include the operations of Darden Restaurants, Inc. and its wholly owned subsidiaries (Darden, the Company, we, us or our). We own and operate the Olive Garden®, LongHorn Steakhouse®, Cheddar’s Scratch Kitchen®, The Capital Grille®, Yard House®, Bahama Breeze®, Seasons 52®, and Eddie V’s Prime Seafood® and Wildfish Seafood Grille® (collectively, “Eddie V’s”) restaurant brands located in the United States and Canada. Through subsidiaries, we own and operate all of our restaurants in the United States and Canada, except for 9 joint venture restaurants managed by us and 45 franchised restaurants. We also have 33 franchised restaurants in operation located in Latin America, the Middle East and Malaysia. All significant intercompany balances and transactions have been eliminated in consolidation.
Basis of Presentation
On April 24, 2017, we completed the acquisition of Cheddar’s Scratch Kitchen for $799.0 million in total consideration. The acquired operations of Cheddar’s Scratch Kitchen included 140 company-owned restaurants and 25 franchised restaurants. The results of operations, financial position and cash flows are included in our consolidated financial statements as of the date of acquisition. See Note 2 for additional information.
On November 9, 2015, we completed the spin-off of Four Corners Property Trust, Inc. (Four Corners) with the pro rata distribution of one share of common stock for every three shares of Darden common stock to Darden shareholders. The separation included the transfer of 6 LongHorn Steakhouse restaurants and 418 restaurant properties to Four Corners.
On July 28, 2014, we completed the sale of Red Lobster and certain related assets and associated liabilities. For fiscal 2017, 2016 and 2015, all gains and losses on disposition, impairment charges and disposal costs, along with the sales, costs and expenses and income taxes attributable to the discontinued locations, have been aggregated in a single caption entitled “Earnings (loss) from discontinued operations, net of tax expense (benefit)” in our consolidated statements of earnings for all periods presented. See Note 3 for additional information.
Unless otherwise noted, amounts and disclosures throughout these notes to consolidated financial statements relate to our continuing operations.
We have reclassified certain amounts in prior-period financial statements to conform to the current period’s presentation.
Fiscal Year
We operate on a 52/53-week fiscal year, which ends on the last Sunday in May. Fiscal 2017, which ended May 28, 2017, consisted of 52 weeks. Fiscal 2016, which ended May 29, 2016, consisted of 52 weeks and fiscal 2015, which ended May 31, 2015, consisted of 53 weeks.
Use of Estimates
We prepare our consolidated financial statements in conformity with U.S. generally accepted accounting principles. The preparation of these financial statements requires us to make estimates and assumptions that affect the reported amounts of assets and liabilities and disclosure of contingent assets and liabilities at the date of the financial statements, and the reported amounts of sales and expenses during the reporting period. Actual results could differ from those estimates.
Cash and Cash Equivalents
Cash equivalents include highly liquid investments such as U.S. Treasury bills, taxable municipal bonds and money market funds that have an original maturity of three months or less. Amounts receivable from credit card companies are also considered cash equivalents because they are both short term and highly liquid in nature and are typically converted to cash within three days of the sales transaction. The components of cash and cash equivalents are as follows:
(in millions) | May 28, 2017 | May 29, 2016 | |||||
Short-term investments | $ | 102.8 | $ | 166.7 | |||
Credit card receivables | 93.6 | 81.1 | |||||
Depository accounts | 36.7 | 27.0 | |||||
Total cash and cash equivalents | $ | 233.1 | $ | 274.8 | |||
50
NOTES TO CONSOLIDATED FINANCIAL STATEMENTS (continued)
As of May 28, 2017, and May 29, 2016, we had cash and cash equivalent accounts in excess of insured limits. We manage the credit risk of our positions through utilizing multiple financial institutions and monitoring the credit quality of those financial institutions that hold our cash and cash equivalents.
Receivables, Net
Receivables, net of the allowance for doubtful accounts, represent their estimated net realizable value. Provisions for doubtful accounts are recorded based on historical collection experience and the age of the receivables. Receivables are written off when they are deemed uncollectible. See Note 12 for additional information.
Inventories
Inventories consist of food and beverages and are valued at the lower of weighted-average cost or market.
Marketable Securities
Available-for-sale securities are carried at fair value. Classification of marketable securities as current or noncurrent is dependent upon management’s intended holding period, the security’s maturity date, or both. Unrealized gains and losses, net of tax, on available-for-sale securities are carried in accumulated other comprehensive income (loss) within the consolidated financial statements and are reclassified into earnings when the securities mature or are sold.
Land, Buildings and Equipment, Net
Land, buildings and equipment are recorded at cost less accumulated depreciation. Building components are depreciated over estimated useful lives ranging from 7 to 40 years using the straight-line method. Leasehold improvements, which are reflected on our consolidated balance sheets as a component of buildings in land, buildings and equipment, net, are amortized over the lesser of the expected lease term, including cancelable option periods, or the estimated useful lives of the related assets using the straight-line method. Equipment is depreciated over estimated useful lives ranging from 2 to 15 years also using the straight-line method. See Note 5 for additional information. Gains and losses on the disposal of land, buildings and equipment are included in impairments and disposal of assets, net, while the write-off of undepreciated book value associated with the replacement of equipment in the normal course of business is recorded as a component of restaurant expenses in our accompanying consolidated statements of earnings. Depreciation and amortization expense from continuing operations associated with buildings and equipment and losses on replacement of equipment were as follows:
Fiscal Year | |||||||||||
(in millions) | 2017 | 2016 | 2015 | ||||||||
Depreciation and amortization on buildings and equipment | $ | 253.3 | $ | 274.4 | $ | 305.0 | |||||
Losses on replacement of equipment | 3.2 | 5.5 | 5.5 | ||||||||
Capitalized Software Costs and Other Definite-Lived Intangibles
Capitalized software, which is a component of other assets, is recorded at cost less accumulated amortization. Capitalized software is amortized using the straight-line method over estimated useful lives ranging from 3 to 10 years. The cost of capitalized software and related accumulated amortization was as follows:
(in millions) | May 28, 2017 | May 29, 2016 | |||||
Capitalized software | $ | 190.1 | $ | 169.7 | |||
Accumulated amortization | (108.2 | ) | (93.1 | ) | |||
Capitalized software, net of accumulated amortization | $ | 81.9 | $ | 76.6 | |||
51
NOTES TO CONSOLIDATED FINANCIAL STATEMENTS (continued)
We have other definite-lived intangible assets, including assets related to the value of below-market leases resulting from our acquisitions that are included as a component of other assets on our consolidated balance sheets. We also have definite-lived intangible liabilities related to the value of above-market leases and below-market agreements resulting from our acquisitions that are included in other liabilities on our consolidated balance sheets. Definite-lived intangibles are amortized on a straight-line basis over estimated useful lives of 1 to 20 years. The cost and related accumulated amortization was as follows:
(in millions) | May 28, 2017 | May 29, 2016 | |||||
Definite-lived intangible assets | $ | 43.4 | $ | 43.4 | |||
Accumulated amortization | (23.3 | ) | (20.6 | ) | |||
Definite-lived intangible assets, net of accumulated amortization | $ | 20.1 | $ | 22.8 | |||
Definite-lived intangible liabilities | $ | (31.6 | ) | $ | (21.4 | ) | |
Accumulated amortization | 8.8 | 8.3 | |||||
Definite-lived intangible liabilities, net of accumulated amortization | $ | (22.8 | ) | $ | (13.1 | ) | |
Amortization expense from continuing operations associated with capitalized software and other definite-lived intangibles included in depreciation and amortization in our accompanying consolidated statements of earnings was as follows:
Fiscal Year | |||||||||||
(in millions) | 2017 | 2016 | 2015 | ||||||||
Amortization expense - capitalized software | $ | 18.7 | $ | 14.9 | $ | 13.3 | |||||
Amortization expense - other definite-lived intangibles | 0.9 | 0.9 | 1.0 | ||||||||
Amortization expense from continuing operations associated with above- and-below-market leases included in restaurant expenses as a component of rent expense in our consolidated statements of earnings was as follows:
Fiscal Year | |||||||||||
(in millions) | 2017 | 2016 | 2015 | ||||||||
Restaurant expense - below-market leases | $ | 1.8 | $ | 1.8 | $ | 1.8 | |||||
Restaurant expense - above-market leases | (1.4 | ) | (1.4 | ) | (1.4 | ) | |||||
Amortization of capitalized software and other definite-lived intangible assets will be approximately $21.4 million annually for fiscal 2018 through 2022.
Trust-Owned Life Insurance
We have a trust that purchased life insurance policies covering certain of our officers and other key employees (trust-owned life insurance or TOLI). The trust is the owner and sole beneficiary of the TOLI policies. The policies were purchased to offset a portion of our obligations under our non-qualified deferred compensation plan. The cash surrender value for each policy is included in other assets, while changes in cash surrender values are included in general and administrative expenses.
Liquor Licenses
The costs of obtaining non-transferable liquor licenses that are directly issued by local government agencies for nominal fees are expensed as incurred. The costs of purchasing transferable liquor licenses through open markets in jurisdictions with a limited number of authorized liquor licenses are capitalized as indefinite-lived intangible assets and included in other assets. Liquor licenses are reviewed for impairment annually or more frequently if events or changes in circumstances indicate that the carrying amount may not be recoverable. Annual liquor license renewal fees are expensed over the renewal term.
52
NOTES TO CONSOLIDATED FINANCIAL STATEMENTS (continued)
Goodwill and Trademarks
We review our goodwill and trademarks for impairment annually, as of the first day of our fourth fiscal quarter or more frequently if indicators of impairment exist. Goodwill and trademarks are not subject to amortization and have been assigned to reporting units for purposes of impairment testing. The reporting units are our restaurant brands. Our goodwill and trademark balances are allocated as follows:
Goodwill | Trademarks | ||||||||||||||
(in millions) | May 28, 2017 | May 29, 2016 | May 28, 2017 | May 29, 2016 | |||||||||||
Olive Garden (1) | $ | 30.2 | $ | 30.2 | $ | 0.6 | $ | — | |||||||
LongHorn Steakhouse | 49.3 | 49.3 | 307.8 | 307.8 | |||||||||||
Cheddar’s Scratch Kitchen (2) | 329.4 | — | 375.0 | — | |||||||||||
The Capital Grille | 401.6 | 401.6 | 147.0 | 147.0 | |||||||||||
Yard House | 369.2 | 369.2 | 109.3 | 109.3 | |||||||||||
Eddie V’s | 22.0 | 22.0 | 10.5 | 10.5 | |||||||||||
Total | $ | 1,201.7 | $ | 872.3 | $ | 950.2 | $ | 574.6 | |||||||
(1) | Goodwill related to Olive Garden is associated with the RARE Hospitality International, Inc. (RARE) acquisition and the estimated value of the direct benefits derived by Olive Garden as a result of the RARE acquisition. |
(2) | Goodwill and trademark values for Cheddar’s Scratch Kitchen represent preliminary estimates as the acquisition was completed on April 24, 2017. See Note 2 for additional information. |
A significant amount of judgment is involved in determining if an indicator of impairment has occurred. Such indicators may include, among others: a significant decline in our expected future cash flows; a sustained, significant decline in our stock price and market capitalization; a significant adverse change in legal factors or in the business climate; unanticipated competition; the testing for recoverability of a significant asset group within a reporting unit; and slower growth rates. Any adverse change in these factors could have a significant impact on the recoverability of these assets and could have a material impact on our consolidated financial statements.
We elected to perform a qualitative assessment for goodwill to determine whether it is more likely than not that a reporting unit is impaired. In considering the qualitative approach, we evaluated factors including, but not limited to, macro-economic conditions, market and industry conditions, commodity cost fluctuations, competitive environment, share price performance, results of prior impairment tests, operational stability and the overall financial performance of the reporting units. Based on the results of the qualitative assessment, no impairment of goodwill was indicated for any of our brands. As Cheddar’s Scratch Kitchen was acquired in the fourth quarter of fiscal 2017, the preliminary estimate of goodwill allocated to that brand was not included in our qualitative assessment.
If the qualitative assessment is not performed or if we determine that it is not more likely than not that the fair value of the reporting unit exceeds the carrying value, the fair value of the reporting unit is calculated through a two-step process. The first step is a comparison of each reporting unit’s fair value to its carrying value. We estimate fair value using the best information available, including market information and discounted cash flow projections (also referred to as the income approach). The income approach uses a reporting unit’s projection of estimated operating results and cash flows that is discounted using a weighted-average cost of capital that reflects current market conditions. The projection uses management’s best estimates of economic and market conditions over the projected period including growth rates in sales, costs and number of units, estimates of future expected changes in operating margins and cash expenditures. Other significant estimates and assumptions include terminal value growth rates, future estimates of capital expenditures and changes in future working capital requirements. We validate our estimates of fair value under the income approach by comparing the values to fair value estimates using a market approach. A market approach estimates fair value by applying cash flow and sales multiples to the reporting unit’s operating performance. The multiples are derived from comparable publicly traded companies with similar operating and investment characteristics of the reporting units. If the fair value of the reporting unit is higher than its carrying value, goodwill is deemed not to be impaired, and no further testing is required. If the carrying value of the reporting unit is higher than its fair value, there is an indication that impairment may exist and the second step must be performed to measure the amount of impairment loss. The amount of impairment is determined by comparing the implied fair value of reporting unit goodwill to the carrying value of the goodwill in the same manner as if the reporting unit was being acquired in a business combination. Specifically, fair value is allocated to all of the assets and liabilities of the reporting unit, including any unrecognized intangible assets, in a hypothetical analysis that would calculate the implied fair value of goodwill. If the implied fair value of goodwill is less than the recorded goodwill, we would record an impairment loss for the difference.
53
NOTES TO CONSOLIDATED FINANCIAL STATEMENTS (continued)
A qualitative assessment was also performed for the trademarks. As Cheddar’s Scratch Kitchen was acquired in the fourth quarter of fiscal 2017, the preliminary estimate of the Cheddar’s Scratch Kitchen trademark was not included in our qualitative assessment. In considering the qualitative approach, we evaluate similar factors from the goodwill assessment, in addition to impacts of royalty rates and discount factors. We completed our impairment test and concluded as of the date of the test, there was no impairment of our trademarks.
We evaluate the useful lives of our other intangible assets, to determine if they are definite or indefinite-lived. A determination on useful life requires significant judgments and assumptions regarding the future effects of obsolescence, demand, competition, other economic factors (such as the stability of the industry, legislative action that results in an uncertain or changing regulatory environment and expected changes in distribution channels), the level of required maintenance expenditures and the expected lives of other related groups of assets.
Impairment or Disposal of Long-Lived Assets
Land, buildings and equipment and certain other assets, including definite-lived intangible assets, are reviewed for impairment whenever events or changes in circumstances indicate that the carrying amount of an asset may not be recoverable. Recoverability of assets to be held and used is measured by a comparison of the carrying amount of the assets to the future undiscounted net cash flows expected to be generated by the assets. Identifiable cash flows are measured at the lowest level for which they are largely independent of the cash flows of other groups of assets and liabilities, generally at the restaurant level. If such assets are determined to be impaired, the impairment recognized is measured by the amount by which the carrying amount of the assets exceeds their fair value. Fair value is generally determined based on appraisals, sales prices of comparable assets or discounted future net cash flows expected to be generated by the assets. Restaurant sites and certain other assets to be disposed of are reported at the lower of their carrying amount or fair value, less estimated costs to sell. Restaurant sites and certain other assets to be disposed of are included in assets held for sale on our consolidated balance sheets when certain criteria are met. These criteria include the requirement that the likelihood of disposing of these assets within one year is probable. Assets not meeting the “held for sale” criteria remain in land, buildings and equipment until their disposal is probable within one year.
We account for exit or disposal activities, including restaurant closures, in accordance with Financial Accounting Standards Board (FASB) Accounting Standards Codification (ASC) Topic 420, Exit or Disposal Cost Obligations. Such costs include the cost of disposing of the assets as well as other facility-related expenses from previously closed restaurants. These costs are generally expensed as incurred. Additionally, at the date we cease using a property under an operating lease, we record a liability for the net present value of any remaining lease obligations, net of estimated sublease income. Any subsequent adjustments to that liability as a result of lease termination or changes in estimates of sublease income are recorded in the period incurred. Upon disposal of the assets, primarily land, associated with a closed restaurant, any gain or loss is recorded in the same caption within our consolidated statements of earnings as the original impairment. See Note 4 for additional information.
Insurance Accruals
Through the use of insurance program deductibles and self-insurance, we retain a significant portion of expected losses under our workers’ compensation, certain employee medical and general liability programs. Accrued liabilities have been recorded based on our estimates of the anticipated ultimate costs to settle all claims, both reported and not yet reported.
Revenue Recognition
Sales, as presented in our consolidated statements of earnings, represents food and beverage product sold and is presented net of discounts, coupons, employee meals and complimentary meals. Revenue from restaurant sales is recognized when food and beverage products are sold. Sales taxes collected from customers and remitted to governmental authorities are presented on a net basis within sales in our consolidated statements of earnings.
Revenue from the sale of franchises is recognized as income when substantially all of our material obligations under the franchise agreement have been performed. Continuing royalties, which are a percentage of net sales of franchised restaurants, are accrued as income when earned. Revenue from the sale of consumer packaged goods includes ongoing royalty fees based on a percentage of licensed retail product sales and is recognized upon the sale of product by our licensed manufacturers to retail outlets.
Unearned Revenues
Unearned revenues represent our liability for gift cards that have been sold but not yet redeemed. We recognize sales from our gift cards when the gift card is redeemed by the customer. Although there are no expiration dates or dormancy fees for our gift cards, based on our analysis of our historical gift card redemption patterns, we can reasonably estimate the amount of gift cards for which redemption is remote, which is referred to as “breakage.” We recognize breakage within sales for unused gift card amounts in proportion to actual gift card redemptions, which is also referred to as the “redemption recognition” method. The
54
NOTES TO CONSOLIDATED FINANCIAL STATEMENTS (continued)
estimated value of gift cards expected to remain unused is recognized over the expected period of redemption as the remaining gift card values are redeemed, generally over a period of 10 years. Utilizing this method, we estimate both the amount of breakage and the time period of redemption. If actual redemption patterns vary from our estimates, actual gift card breakage income may differ from the amounts recorded. We update our estimates of our redemption period and our breakage rate periodically and apply that rate to gift card redemptions.
Food and Beverage Costs
Food and beverage costs include inventory, warehousing, related purchasing and distribution costs, and gains and losses on certain commodity derivative contracts. Vendor allowances received in connection with the purchase of a vendor’s products are recognized as a reduction of the related food and beverage costs as earned. Advance payments are made by the vendors based on estimates of volume to be purchased from the vendors and the terms of the agreement. As we make purchases from the vendors each period, we recognize the pro rata portion of allowances earned as a reduction of food and beverage costs for that period. Differences between estimated and actual purchases are settled in accordance with the terms of the agreements. Vendor agreements are generally for a period of one year or more and payments received are initially recorded as long-term liabilities. Amounts expected to be earned within one year are recorded as current liabilities.
Income Taxes
We provide for federal and state income taxes currently payable as well as for those deferred because of temporary differences between reporting income and expenses for financial statement purposes versus tax purposes. Federal income tax credits are recorded as a reduction of income taxes. Deferred tax assets and liabilities are recognized for the future tax consequences attributable to differences between the financial statement carrying amounts of existing assets and liabilities and their respective tax bases. Deferred tax assets and liabilities are measured using enacted tax rates expected to apply to taxable income in the years in which those temporary differences are expected to be recovered or settled. The effect on deferred tax assets and liabilities of a change in tax rates is recognized in earnings in the period that includes the enactment date. Interest recognized on reserves for uncertain tax positions is included in interest, net, in our consolidated statements of earnings. A corresponding liability for accrued interest is included as a component of other current liabilities on our consolidated balance sheets. Penalties, when incurred, are recognized in general and administrative expenses.
ASC Topic 740, Income Taxes, requires that a position taken or expected to be taken in a tax return be recognized (or derecognized) in the financial statements when it is more likely than not (i.e., a likelihood of more than 50 percent) that the position would be sustained upon examination by tax authorities. A recognized tax position is then measured at the largest amount of benefit that is greater than 50 percent likely of being realized upon ultimate settlement. See Note 13 for additional information.
Income tax benefits credited to equity relate to tax benefits associated with amounts that are deductible for income tax purposes but do not affect earnings. These benefits are principally generated from employee exercises of non-qualified stock options and vesting of employee restricted stock awards.
Derivative Instruments and Hedging Activities
We enter into derivative instruments for risk management purposes only, including derivatives designated as hedging instruments as required by FASB ASC Topic 815, Derivatives and Hedging, and those utilized as economic hedges. We use financial derivatives to manage interest rate and compensation risks inherent in our business operations. Our use of derivative instruments is currently limited to equity forwards contracts. These instruments are generally structured as hedges of the variability of cash flows related to forecasted transactions (cash flow hedges). However, we do at times enter into instruments designated as fair value hedges to reduce our exposure to changes in fair value of the related hedged item. We do not enter into derivative instruments for trading or speculative purposes, where changes in the cash flows or fair value of the derivative are not expected to offset changes in cash flows or fair value of the hedged item. However, we have entered into equity forwards to economically hedge changes in the fair value of employee investments in our non-qualified deferred compensation plan. All derivatives are recognized on the balance sheet at fair value. For those derivative instruments for which we intend to elect hedge accounting, on the date the derivative contract is entered into, we document all relationships between hedging instruments and hedged items, as well as our risk-management objective and strategy for undertaking the various hedge transactions. This process includes linking all derivatives designated as cash flow hedges to specific assets and liabilities on the consolidated balance sheet or to specific forecasted transactions. We also formally assess, both at the hedge’s inception and on an ongoing basis, whether the derivatives used in hedging transactions are highly effective in offsetting changes in cash flows of hedged items.
To the extent our derivatives are effective in offsetting the variability of the hedged cash flows, and otherwise meet the cash flow hedge accounting criteria required by Topic 815 of the FASB ASC, changes in the derivatives’ fair value are not included in current earnings but are included in accumulated other comprehensive income (loss), net of tax. These changes in fair value will be reclassified into earnings at the time of the forecasted transaction. Ineffectiveness measured in the hedging relationship is
55
NOTES TO CONSOLIDATED FINANCIAL STATEMENTS (continued)
recorded currently in earnings in the period in which it occurs. To the extent our derivatives are effective in mitigating changes in fair value, and otherwise meet the fair value hedge accounting criteria required by Topic 815 of the FASB ASC, gains and losses in the derivatives’ fair value are included in current earnings, as are the gains and losses of the related hedged item. To the extent the hedge accounting criteria are not met, the derivative contracts are utilized as economic hedges, and changes in the fair value of such contracts are recorded currently in earnings in the period in which they occur. Cash flows related to derivatives are included in operating activities. See Note 8 for additional information.
Leases
For operating leases, we recognize rent expense on a straight-line basis over the expected lease term, including cancelable option periods where we are reasonably assured to exercise the options. Differences between amounts paid and amounts expensed are recorded as deferred rent. Capital leases are recorded as an asset and an obligation at an amount equal to the present value of the minimum lease payments during the lease term. Sale-leasebacks are transactions through which we sell assets (such as restaurant properties) at fair value and subsequently lease them back. The resulting leases generally qualify and are accounted for as operating leases. Financing leases are generally the product of a failed sale-leaseback transaction and result in retention of the “sold” assets within land, buildings and equipment with a financing lease obligation equal to the amount of proceeds received recorded as a component of other liabilities on our consolidated balance sheets.
Within the provisions of certain of our leases, there are rent holidays and escalations in payments over the base lease term, as well as renewal periods. The effects of the holidays and escalations have been reflected in rent expense on a straight-line basis over the expected lease term. The lease term commences on the date when we have the right to control the use of the leased property, which is typically before rent payments are due under the terms of the lease. Many of our leases have renewal periods totaling 5 to 20 years, exercisable at our option, and require payment of property taxes, insurance and maintenance costs in addition to the rent payments. The consolidated financial statements reflect the same lease term for amortizing leasehold improvements as we use to determine capital versus operating lease classifications and in calculating straight-line rent expense for each restaurant. Percentage rent expense is generally based on sales levels and is accrued at the point in time we determine that it is probable that such sales levels will be achieved. Amortization expense related to capital leases is included in depreciation and amortization expense in our consolidated statements of earnings. Landlord allowances are recorded based on contractual terms and are included in accounts receivable, net, and as a deferred rent liability and amortized as a reduction of rent expense on a straight-line basis over the expected lease term. Gains on sale-leaseback transactions are recorded as a deferred liability and amortized as a reduction of rent expense on a straight-line basis over the expected lease term. See Note 11 for additional information.
Pre-Opening Expenses
Non-capital expenditures associated with opening new restaurants are expensed as incurred.
Advertising
Production costs of commercials are charged to operations in the fiscal period the advertising is first aired. The costs of programming and other advertising, promotion and marketing programs are charged to operations in the fiscal period incurred and reported as marketing expenses on our consolidated statements of earnings.
Stock-Based Compensation
We recognize the cost of employee service received in exchange for awards of equity instruments based on the grant date fair value of those awards. We recognize compensation expense on a straight-line basis over the employee service period for awards granted. We utilize the Black-Scholes option pricing model to estimate the fair value of stock option awards. The dividend yield has been estimated based upon our historical results and expectations for changes in dividend rates. The expected volatility was determined using historical stock prices. The risk-free interest rate was the rate available on zero coupon U.S. government obligations with a term approximating the expected life of each grant. The expected life was estimated based on the exercise history of previous grants, taking into consideration the remaining contractual period for outstanding awards. We utilize a Monte Carlo simulation to estimate the fair value of our market-based equity-settled performance awards. See Note 15 for further information.
Net Earnings per Share
Basic net earnings per share are computed by dividing net earnings by the weighted-average number of common shares outstanding for the reporting period. Diluted net earnings per share reflect the potential dilution that could occur if securities or other contracts to issue common stock were exercised or converted into common stock. Outstanding stock options, restricted stock and equity-settled performance stock units granted by us represent the only dilutive effect reflected in diluted weighted-average shares outstanding. These stock-based compensation instruments do not impact the numerator of the diluted net earnings per share computation.
56
NOTES TO CONSOLIDATED FINANCIAL STATEMENTS (continued)
The following table presents the computation of basic and diluted net earnings per common share:
Fiscal Year | |||||||||||
(in millions, except per share data) | 2017 | 2016 | 2015 | ||||||||
Earnings from continuing operations | $ | 482.5 | $ | 359.7 | $ | 196.4 | |||||
Earnings (loss) from discontinued operations | (3.4 | ) | 15.3 | 513.1 | |||||||
Net earnings | $ | 479.1 | $ | 375.0 | $ | 709.5 | |||||
Average common shares outstanding – Basic | 124.3 | 127.4 | 127.7 | ||||||||
Effect of dilutive stock-based compensation | 1.7 | 1.9 | 2.0 | ||||||||
Average common shares outstanding – Diluted | 126.0 | 129.3 | 129.7 | ||||||||
Basic net earnings per share: | |||||||||||
Earnings from continuing operations | $ | 3.88 | $ | 2.82 | $ | 1.54 | |||||
Earnings (loss) from discontinued operations | (0.03 | ) | 0.12 | 4.02 | |||||||
Net earnings | $ | 3.85 | $ | 2.94 | $ | 5.56 | |||||
Diluted net earnings per share: | |||||||||||
Earnings from continuing operations | $ | 3.83 | $ | 2.78 | $ | 1.51 | |||||
Earnings (loss) from discontinued operations | (0.03 | ) | 0.12 | 3.96 | |||||||
Net earnings | $ | 3.80 | $ | 2.90 | $ | 5.47 | |||||
Restricted stock and options to purchase shares of our common stock excluded from the calculation of diluted net earnings per share because the effect would have been anti-dilutive, are as follows:
Fiscal Year Ended | ||||||||
(in millions) | May 28, 2017 | May 29, 2016 | May 31, 2015 | |||||
Anti-dilutive restricted stock and options | 0.4 | 0.3 | 0.1 | |||||
Foreign Currency
The Canadian dollar is the functional currency for our Canadian restaurant operations. Assets and liabilities denominated in foreign currencies are translated into U.S. dollars using the exchange rates in effect at the balance sheet date. Results of operations are translated using the average exchange rates prevailing throughout the period. Translation gains and losses are reported as a separate component of other comprehensive income (loss). Aggregate cumulative translation losses were $0.7 million and $1.2 million at May 28, 2017 and May 29, 2016, respectively. Net losses from foreign currency transactions recognized in our consolidated statements of earnings were $0.8 million, $1.8 million and $1.4 million for fiscal 2017, 2016 and 2015, respectively.
Application of New Accounting Standards
In May 2014, the FASB issued Accounting Standards Update (ASU) 2014-09, Revenue from Contracts with Customers (Topic 606). This update provides a comprehensive new revenue recognition model that requires a company to recognize revenue to depict the transfer of goods or services to a customer at an amount that reflects the consideration it expects to receive in exchange for those goods or services. The guidance also requires additional disclosure about the nature, amount, timing and uncertainty of revenue and cash flows arising from customer contracts. This update is effective for us in the first quarter of fiscal 2019, which is when we plan to adopt these provisions. This update permits the use of either the retrospective or cumulative effect transition method, however we have not yet selected a transition method. Upon initial evaluation, we do not believe this guidance will impact our recognition of revenue from company-owned restaurants, which is our primary source of revenue. We are continuing to evaluate the effect this guidance will have on other, less significant revenue sources, including franchises and consumer packaged goods.
In July 2015, the FASB issued ASU 2015-11, Simplifying the Measurement of Inventory (Topic 330). This update requires inventory within the scope of the standard to be measured at the lower of cost and net realizable value. Net realizable value is defined as the estimated selling prices in the ordinary course of business, less reasonably predictable costs of completion, disposal, and transportation. This update is effective for us in the first quarter of fiscal 2018, which is when we plan to adopt these provisions. We do not expect the adoption of this guidance to have a material impact on our consolidated financial statements.
57
NOTES TO CONSOLIDATED FINANCIAL STATEMENTS (continued)
In November 2015, the FASB issued ASU 2015-17, Balance Sheet Classification of Deferred Taxes (Topic 740). This update requires that deferred tax liabilities and assets be classified as noncurrent in a classified balance sheet. This update is effective for us in the first quarter of fiscal 2018, which is when we plan to adopt these provisions. Other than the revised balance sheet presentation of deferred tax liabilities and assets, we do not expect the adoption of this guidance to have a material impact on our consolidated financial statements.
In February 2016, the FASB issued ASU 2016-02, Leases (Topic 842). This update requires a lessee to recognize on the balance sheet a liability to make lease payments and a corresponding right-of-use asset. The guidance also requires certain qualitative and quantitative disclosures about the amount, timing and uncertainty of cash flows arising from leases. This update is effective for us in the first quarter of fiscal 2020, which is when we plan to adopt these provisions. We plan to elect the available practical expedients on adoption. We expect our balance sheet presentation to be materially impacted upon adoption due to the recognition of right-of-use assets and lease liabilities for operating leases. However, we do not expect adoption to have a material impact on our consolidated statements of earnings. We do not expect our accounting for capital leases to substantially change. We are continuing to evaluate the effect this guidance will have on our consolidated financial statements and related disclosures.
In March 2016, the FASB issued ASU 2016-09, Compensation - Stock Compensation (Topic 718). This update was issued as part of the FASB’s simplification initiative and affects all entities that issue share-based payment awards to their employees. The amendments in this update cover such areas as the recognition of excess tax benefits and deficiencies, the classification of those excess tax benefits on the statement of cash flows, an accounting policy election for forfeitures, the amount an employer can withhold to cover income taxes and still qualify for equity classification and the classification of those taxes paid on the statement of cash flows. This update is effective for us in the first quarter of fiscal 2018, which is when we plan to adopt these provisions. This guidance will be applied either prospectively, retrospectively or using a modified retrospective transition method, depending on the area covered in this update. We do not expect the adoption of this guidance to have a material impact on our consolidated financial statements.
In August 2016, the FASB issued ASU 2016-15, Statement of Cash Flows (Topic 230). This update provides clarification regarding how certain cash receipts and cash payments are presented and classified in the statement of cash flows. This update addresses eight specific cash flow issues with the objective of reducing the existing diversity in practice. This update is effective for annual and interim periods beginning after December 15, 2017, which will require us to adopt these provisions in the first quarter of fiscal 2019 using a retrospective approach. Early adoption is permitted. We do not expect the adoption of this guidance to have a material impact on our consolidated financial statements.
In October 2016, the FASB issued ASU 2016-16, Income Taxes (Topic 740). This update addresses the income tax consequences of intra-entity transfers of assets other than inventory. Current GAAP prohibits the recognition of current and deferred income taxes for an intra-entity asset transfer until the asset has been sold to an outside party. In addition, interpretations of this guidance have developed in practice over the years for transfers of certain intangible and tangible assets. The amendments in the update will require recognition of current and deferred income taxes resulting from an intra-entity transfer of an asset other than inventory when the transfer occurs. This update is effective for us in the first quarter of fiscal 2019, with early adoption permitted. We plan to adopt this guidance in the first quarter of fiscal 2018 using a modified retrospective approach through a cumulative-effect adjustment to retained earnings. We do not expect this adjustment to be material.
In March 2017, the FASB issued ASU 2017-07, Compensation - Retirement Benefits (Topic 715). The amendments in this update require that an employer disaggregate the service cost component from the other components of net benefit cost. The amendments also provide explicit guidance on how to present the service cost component and the other components of net benefit cost in the income statement and allow only the service cost component of net benefit cost to be eligible for capitalization. This update is effective for annual and interim periods beginning after December 15, 2017, which will require us to adopt these provisions in the first quarter of fiscal 2019. The guidance will be applied retrospectively or prospectively, depending on the area covered in this update. Early adoption is permitted. We do not expect the adoption of this guidance to have a material impact on our consolidated financial statements.
58
NOTES TO CONSOLIDATED FINANCIAL STATEMENTS (continued)
NOTE 2 - ACQUISITION OF CHEDDAR’S SCRATCH KITCHEN
On April 24, 2017, we acquired 100 percent of the equity interest in Cheddar’s Scratch Kitchen for $799.0 million in total consideration. We funded the acquisition with the proceeds from the issuance of $500.0 million in senior notes combined with cash on hand. The acquired operations of Cheddar’s Scratch Kitchen included 140 company-owned restaurants and 25 franchised restaurants. The results of Cheddar’s Scratch Kitchen operations are included in our consolidated financial statements from the date of acquisition.
The assets and liabilities of Cheddar’s Scratch Kitchen were recorded at their respective fair values as of the date of acquisition. We are in the process of confirming, through internal studies and third-party valuations, the fair value of these assets, including land, buildings and equipment, intangible assets, and income tax assets and liabilities. The fair values set forth below are based on preliminary valuations and are subject to adjustment as additional information is obtained. When the valuation process is completed, adjustments to goodwill may result.
The preliminary allocation of the purchase price is as follows:
Balances at | ||||
(in millions) | April 24, 2017 | |||
Current assets | $ | 71.0 | ||
Land, buildings and equipment | 191.9 | |||
Trademark | 375.0 | |||
Other assets | 2.2 | |||
Goodwill | 329.4 | |||
Total assets acquired | $ | 969.5 | ||
Current liabilities | 43.4 | |||
Other liabilities | 127.1 | |||
Total liabilities assumed | $ | 170.5 | ||
Net assets acquired | $ | 799.0 | ||
The excess of the purchase price over the aggregate fair value of net assets acquired was allocated to goodwill. Of the $329.4 million recorded as goodwill, none is expected to be deductible for tax purposes. The portion of the purchase price attributable to goodwill represents benefits expected as a result of the acquisition, including sales and unit growth opportunities in addition to supply-chain and support-cost synergies. The trademark has an indefinite life based on the expected use of the asset and the regulatory and economic environment within which it is being used. The trademark represents a highly respected brand with positive connotations and we intend to cultivate and protect the use of this brand. Goodwill and indefinite-lived trademarks are not amortized but are reviewed annually for impairment or more frequently if indicators of impairment exist. Buildings and equipment will be depreciated over a period of 2 years to 20 years.
As a result of the acquisition and related integration efforts, we incurred expenses of approximately $16.3 million during the year ended May 28, 2017, which are included in general and administrative expenses in our consolidated statements of earnings. Pro-forma financial information of the combined entities for periods prior to the acquisition is not presented due to the immaterial impact of the financial results of Cheddar’s Scratch Kitchen on our consolidated financial statements.
59
NOTES TO CONSOLIDATED FINANCIAL STATEMENTS (continued)
NOTE 3 – DISCONTINUED OPERATIONS AND ASSETS HELD FOR SALE
Discontinued Operations
Earnings (loss) from discontinued operations, net of taxes in our accompanying consolidated statements of earnings is primarily related to the Red Lobster disposition and is comprised of the following:
Fiscal Year Ended | |||||||||||
(in millions) | May 28, 2017 | May 29, 2016 | May 31, 2015 | ||||||||
Sales | $ | — | $ | — | $ | 400.4 | |||||
Costs and expenses: | |||||||||||
Restaurant and marketing expenses | 1.6 | 1.8 | 353.0 | ||||||||
Depreciation and amortization | — | — | 0.2 | ||||||||
Other income and expenses (1) | 6.0 | (20.5 | ) | (810.7 | ) | ||||||
Earnings (loss) before income taxes | (7.6 | ) | 18.7 | 857.9 | |||||||
Income tax expense (benefit) | (4.2 | ) | 3.4 | 344.8 | |||||||
Earnings (loss) from discontinued operations, net of tax | $ | (3.4 | ) | $ | 15.3 | $ | 513.1 | ||||
(1) | Amounts for fiscal years 2016 and 2015 primarily relate to the gain recognized on the sale of Red Lobster. |
Assets Held For Sale
Assets classified as held for sale on our accompanying consolidated balance sheets as of May 28, 2017 and May 29, 2016, consisted of land, buildings and equipment with carrying amounts of $13.2 million and $20.3 million, respectively, primarily related to excess land parcels adjacent to our corporate headquarters.
NOTE 4 –IMPAIRMENTS AND DISPOSAL OF ASSETS, NET
Impairments and disposal of assets, net, in our accompanying consolidated statements of earnings are comprised of the following:
Fiscal Year | |||||||||||
(in millions) | 2017 | 2016 | 2015 | ||||||||
Restaurant impairments | $ | — | $ | 9.2 | $ | 49.4 | |||||
Disposal gains | (10.4 | ) | (5.9 | ) | (4.2 | ) | |||||
Other | 2.0 | 2.5 | 16.9 | ||||||||
Impairments and disposal of assets, net | $ | (8.4 | ) | $ | 5.8 | $ | 62.1 | ||||
Restaurant impairments for fiscal 2016 and 2015 were primarily related to underperforming restaurants and restaurant assets involved in individual sale-leaseback transactions.
Disposal gains for fiscal 2017 were primarily related to the sale of restaurant properties, favorable lease terminations and the sale of excess land parcels. Disposal gains for fiscal 2016 and 2015 were primarily related to the sale of land parcels and sale-leaseback transactions.
Other impairment charges for fiscal 2017 primarily related to a cost-method investment, which has no remaining carrying value. During fiscal 2016, other impairment charges related to a cost-method investment and the expected disposal of excess land parcels adjacent to our corporate headquarters. Other impairment charges for fiscal 2015 primarily related to the expected disposal of excess land parcels adjacent to our corporate headquarters, our lobster aquaculture project and a corporate airplane in connection with the closure of our aviation department.
Impairment charges were measured based on the amount by which the carrying amount of these assets exceeded their fair value. Fair value is generally determined based on appraisals or sales prices of comparable assets and estimates of discounted future cash flows. These amounts are included in impairments and disposal of assets, net as a component of earnings from continuing operations in the accompanying consolidated statements of earnings.
60
NOTES TO CONSOLIDATED FINANCIAL STATEMENTS (continued)
NOTE 5 - LAND, BUILDINGS AND EQUIPMENT, NET
The components of land, buildings and equipment, net, are as follows:
(in millions) | May 28, 2017 | May 29, 2016 | |||||
Land | $ | 136.7 | $ | 133.1 | |||
Buildings | 2,547.0 | 2,297.1 | |||||
Equipment | 1,444.2 | 1,318.5 | |||||
Assets under capital leases | 78.3 | 71.9 | |||||
Construction in progress | 62.9 | 40.0 | |||||
Total land, buildings and equipment | $ | 4,269.1 | $ | 3,860.6 | |||
Less accumulated depreciation and amortization | (1,962.1 | ) | (1,788.3 | ) | |||
Less amortization associated with assets under capital leases | (34.7 | ) | (30.7 | ) | |||
Land, buildings and equipment, net | $ | 2,272.3 | $ | 2,041.6 | |||
NOTE 6 - SEGMENT INFORMATION
We manage our restaurant brands, Olive Garden, LongHorn Steakhouse, Cheddar’s Scratch Kitchen, The Capital Grille, Yard House, Bahama Breeze, Seasons 52 and Eddie V’s in North America as operating segments. The brands operate principally in the U.S. within full-service dining. We aggregate our operating segments into reportable segments based on a combination of the size, economic characteristics and sub-segment of full-service dining within which each brand operates. We have four reportable segments: (1) Olive Garden, (2) LongHorn Steakhouse, (3) Fine Dining and (4) Other Business.
The Olive Garden segment includes the results of our company-owned Olive Garden restaurants in the U.S. and Canada. The LongHorn Steakhouse segment includes the results of our company-owned LongHorn Steakhouse restaurants in the U.S. The Fine Dining segment aggregates our premium brands that operate within the fine-dining sub-segment of full-service dining and includes the results of our company-owned The Capital Grille and Eddie V’s restaurants in the U.S. The Other Business segment aggregates our remaining brands and includes the results of our company-owned Cheddar’s Scratch Kitchen, Yard House, Seasons 52 and Bahama Breeze restaurants in the U.S. This segment also includes results from our franchises and consumer-packaged goods sales.
External sales are derived principally from food and beverage sales. We do not rely on any major customers as a source of sales, and the customers and long-lived assets of our reportable segments are predominantly in the U.S. There were no material transactions among reportable segments.
Our management uses segment profit as the measure for assessing performance of our segments. Segment profit includes revenues and expenses directly attributable to restaurant-level results of operations (sometimes referred to as restaurant-level earnings). These expenses include food and beverage costs, restaurant labor costs, restaurant expenses and marketing expenses (collectively, restaurant and marketing expenses). The following tables reconcile our segment results to our consolidated results reported in accordance with GAAP:
(in millions) | Olive Garden | LongHorn Steakhouse | Fine Dining | Other Business | Corporate | Consolidated | |||||||||||||
At May 28, 2017 and for the year ended | |||||||||||||||||||
Sales | $ | 3,938.6 | $ | 1,622.2 | $ | 535.6 | $ | 1,073.8 | $ | — | $ | 7,170.2 | |||||||
Restaurant and marketing expenses | 3,176.8 | 1,341.3 | 430.6 | 891.8 | — | 5,840.5 | |||||||||||||
Segment profit | $ | 761.8 | $ | 280.9 | $ | 105.0 | $ | 182.0 | $ | — | $ | 1,329.7 | |||||||
Depreciation and amortization | $ | 123.3 | $ | 65.1 | $ | 29.1 | $ | 55.4 | $ | — | $ | 272.9 | |||||||
Impairments and disposal of assets, net | (1.5 | ) | (0.1 | ) | — | (6.2 | ) | (0.6 | ) | (8.4 | ) | ||||||||
Segment assets | 949.2 | 948.9 | 869.9 | 1,964.7 | 771.5 | 5,504.2 | |||||||||||||
Purchases of land, buildings and equipment | 131.4 | 54.1 | 41.1 | 62.7 | 3.7 | 293.0 | |||||||||||||
(in millions) | Olive Garden | LongHorn Steakhouse | Fine Dining | Other Business | Corporate | Consolidated | |||||||||||||
At May 29, 2016 and for the year ended | |||||||||||||||||||
Sales | $ | 3,838.6 | $ | 1,587.7 | $ | 514.1 | $ | 993.1 | $ | — | $ | 6,933.5 | |||||||
Restaurant and marketing expenses | 3,079.4 | 1,312.4 | 413.6 | 825.0 | — | 5,630.4 | |||||||||||||
Segment profit | $ | 759.2 | $ | 275.3 | $ | 100.5 | $ | 168.1 | $ | — | $ | 1,303.1 | |||||||
Depreciation and amortization | $ | 135.5 | $ | 72.6 | $ | 28.6 | $ | 53.5 | $ | — | $ | 290.2 | |||||||
Impairments and disposal of assets, net | (1.4 | ) | (1.5 | ) | 0.7 | 6.0 | 2.0 | 5.8 | |||||||||||
Segment assets | 939.2 | 969.2 | 857.0 | 987.6 | 829.6 | 4,582.6 | |||||||||||||
Purchases of land, buildings and equipment | 95.6 | 46.9 | 21.4 | 60.5 | 3.9 | 228.3 | |||||||||||||
61
NOTES TO CONSOLIDATED FINANCIAL STATEMENTS (continued)
(in millions) | Olive Garden | LongHorn Steakhouse | Fine Dining | Other Business | Corporate | Consolidated | |||||||||||||
At May 31, 2015 and for the year ended | |||||||||||||||||||
Sales | $ | 3,789.6 | $ | 1,544.7 | $ | 500.1 | $ | 929.6 | $ | — | $ | 6,764.0 | |||||||
Restaurant and marketing expenses | 3,089.1 | 1,304.8 | 405.2 | 785.7 | — | 5,584.8 | |||||||||||||
Segment profit | $ | 700.5 | $ | 239.9 | $ | 94.9 | $ | 143.9 | $ | — | $ | 1,179.2 | |||||||
Depreciation and amortization | $ | 163.0 | $ | 77.1 | $ | 28.2 | $ | 51.0 | $ | — | $ | 319.3 | |||||||
Impairments and disposal of assets, net | 28.2 | 0.4 | — | 21.0 | 12.5 | 62.1 | |||||||||||||
Purchases of land, buildings and equipment | 118.9 | 67.4 | 22.9 | 83.4 | 3.9 | 296.5 | |||||||||||||
Reconciliation of segment profit to earnings from continuing operations before income taxes:
Fiscal Year Ended | |||||||||||
(in millions) | May 28, 2017 | May 29, 2016 | May 31, 2015 | ||||||||
Segment profit | $ | 1,329.7 | $ | 1,303.1 | $ | 1,179.2 | |||||
Less general and administrative expenses | (387.7 | ) | (384.9 | ) | (430.2 | ) | |||||
Less depreciation and amortization | (272.9 | ) | (290.2 | ) | (319.3 | ) | |||||
Less impairments and disposal of assets, net | 8.4 | (5.8 | ) | (62.1 | ) | ||||||
Less interest, net | (40.2 | ) | (172.5 | ) | (192.3 | ) | |||||
Earnings before income taxes | $ | 637.3 | $ | 449.7 | $ | 175.3 | |||||
NOTE 7 - DEBT
The components of long-term debt are as follows:
(in millions) | May 28, 2017 | May 29, 2016 | |||||
3.850% senior notes due May 2027 | $ | 500.0 | $ | — | |||
6.000% senior notes due August 2035 | 150.0 | 150.0 | |||||
6.800% senior notes due October 2037 | 300.0 | 300.0 | |||||
Total long-term debt | $ | 950.0 | $ | 450.0 | |||
Less unamortized discount and issuance costs | (13.4 | ) | (10.0 | ) | |||
Total long-term debt less unamortized discount and issuance costs | $ | 936.6 | $ | 440.0 | |||
On April 10, 2017, we issued $500.0 million aggregate principal amount of unsecured 3.850 percent senior notes due May 2027 under a registration statement filed with the Securities and Exchange Commission on October 6, 2016. Discount and issuance costs, which totaled $4.4 million, are being amortized over the term of the notes using the straight-line method, the results of which approximate the effective interest method. Interest on the notes is payable semi-annually in arrears on May 1 and November 1 of each year commencing November 1, 2017. We may redeem the notes at any time in whole or from time to time in part, at the principal amount plus a make-whole premium. If we experience a change in control triggering event, unless we have previously exercised our right to redeem the notes, we may be required to purchase the notes from the holders at a purchase price equal to 101 percent of their principal amount plus accrued and unpaid interest.
The interest rate on our $300.0 million 6.800 percent senior notes due October 2037 is subject to adjustment from time to time if the debt rating assigned to such series of notes is downgraded below a certain rating level (or subsequently upgraded). The maximum adjustment is 2.000 percent above the initial interest rate and the interest rate cannot be reduced below the initial interest rate. As of May 28, 2017, no such adjustments are made to this rate.
The aggregate contractual maturities of long-term debt for each of the five fiscal years subsequent to May 28, 2017, and thereafter are as follows:
(in millions) | ||||||||||||||||||||||||
Fiscal Year | 2018 | 2019 | 2020 | 2021 | 2022 | Thereafter | ||||||||||||||||||
Debt repayments | $ | — | $ | — | $ | — | $ | — | $ | — | $ | 950.0 | ||||||||||||
62
NOTES TO CONSOLIDATED FINANCIAL STATEMENTS (continued)
We maintain a $750.0 million revolving Credit Agreement (Revolving Credit Agreement), with Bank of America, N.A. (BOA) as administrative agent, and the lenders and other agents party thereto. The Revolving Credit Agreement is a senior unsecured credit commitment to the Company and contains customary representations and affirmative and negative covenants (including limitations on liens and subsidiary debt and a maximum consolidated lease adjusted total debt to total capitalization ratio of 0.75 to 1.00) and events of default usual for credit facilities of this type. As of May 28, 2017, we were in compliance with all covenants under the Revolving Credit Agreement.
The Revolving Credit Agreement matures on October 24, 2018, and the proceeds may be used for commercial paper back-up, working capital and capital expenditures, the refinancing of certain indebtedness, certain acquisitions and general corporate purposes. Loans under the Revolving Credit Agreement bear interest at a rate of LIBOR plus a margin determined by reference to a ratings-based pricing grid (Applicable Margin), or the base rate (which is defined as the highest of the BOA prime rate, the Federal Funds rate plus 0.500 percent and the Eurocurrency Rate plus 1.00 percent) plus the Applicable Margin. Assuming a “BBB” equivalent credit rating level, the Applicable Margin under the Revolving Credit Agreement will be 1.100 percent for LIBOR loans and 0.100 percent for base rate loans. As of May 28, 2017, we had no outstanding balances under the Revolving Credit Agreement.
NOTE 8 – DERIVATIVE INSTRUMENTS AND HEDGING ACTIVITIES
We use financial derivatives to manage interest rate and equity-based compensation risks inherent in our business operations. By using these instruments, we expose ourselves, from time to time, to credit risk and market risk. Credit risk is the failure of the counterparty to perform under the terms of the derivative contract. When the fair value of a derivative contract is positive, the counterparty owes us, which creates credit risk for us. We minimize this credit risk by entering into transactions with high-quality counterparties. We currently do not have any provisions in our agreements with counterparties that would require either party to hold or post collateral in the event that the market value of the related derivative instrument exceeds a certain limit. As such, the maximum amount of loss due to counterparty credit risk we would incur at May 28, 2017, if counterparties to the derivative instruments failed completely to perform, would approximate the values of derivative instruments currently recognized as assets on our consolidated balance sheet. Market risk is the adverse effect on the value of a financial instrument that results from a change in interest rates, commodity prices or the market price of our common stock. We minimize this market risk by establishing and monitoring parameters that limit the types and degree of market risk that may be undertaken.
In the fourth quarter of fiscal 2017 we entered into Treasury lock derivative instruments with $500.0 million of notional value to hedge a portion of the risk of changes in the benchmark interest rate prior to the issuance of senior notes on April 10, 2017, as changes in the benchmark interest rate would cause variability in our forecasted interest payments. These derivative instruments were designated as cash flow hedges and were settled at the issuance of the senior notes for a cumulative loss of $1.3 million. This amount was recorded in accumulated other comprehensive income (loss) and will be reclassified into earnings as an adjustment to interest expense on the senior notes or similar debt as incurred.
We enter into equity forward contracts to hedge the risk of changes in future cash flows associated with the unvested, unrecognized Darden stock units. The equity forward contracts will be settled at the end of the vesting periods of their underlying Darden stock units, which range between four and five years and currently extend through July 2021. The contracts were initially designated as cash flow hedges to the extent the Darden stock units are unvested and, therefore, unrecognized as a liability in our financial statements. The forward contracts can only be net settled in cash. As the Darden stock units vest, we will de-designate that portion of the equity forward contract that no longer qualifies for hedge accounting, and changes in fair value associated with
63
NOTES TO CONSOLIDATED FINANCIAL STATEMENTS (continued)
that portion of the equity forward contract will be recognized in current earnings. We periodically incur interest on the notional value of the contracts and receive dividends on the underlying shares. These amounts are recognized currently in earnings as they are incurred or received.
We entered into equity forward contracts to hedge the risk of changes in future cash flows associated with recognized, employee-directed investments in Darden stock within the non-qualified deferred compensation plan. We did not elect hedge accounting with the expectation that changes in the fair value of the equity forward contracts would offset changes in the fair value of Darden stock investments in the non-qualified deferred compensation plan within general and administrative expenses in our consolidated statements of earnings. These contracts currently extend through July 2021.
The notional and fair values of our derivative contracts are as follows:
Fair Values | ||||||||||||||||||||||||||
(in millions, except per share data) | Number of Shares Outstanding | Weighted-Average Per Share Forward Rates | Notional Values | Derivative Assets (1) | Derivative Liabilities (1) | |||||||||||||||||||||
May 28, 2017 | May 28, 2017 | May 29, 2016 | May 28, 2017 | May 29, 2016 | ||||||||||||||||||||||
Equity Forwards | ||||||||||||||||||||||||||
Designated | 0.3 | $ | 59.36 | $ | 18.7 | $ | — | $ | 1.2 | $ | 0.1 | $ | — | |||||||||||||
Not designated | 0.6 | $ | 51.85 | $ | 31.5 | — | 2.6 | 0.3 | — | |||||||||||||||||
Total equity forwards | $ | — | $ | 3.8 | $ | 0.4 | $ | — | ||||||||||||||||||
(1) | Derivative assets and liabilities are included in receivables, net, prepaid expenses and other current assets, and other current liabilities, as applicable, on our consolidated balance sheets. |
The effects of derivative instruments in cash flow hedging relationships in the consolidated statements of earnings are as follows:
Equity (1) | Interest Rate (2) | ||||||||||||||||||||||
Fiscal Year | Fiscal Year | ||||||||||||||||||||||
(in millions) | 2017 | 2016 | 2015 | 2017 | 2016 | 2015 | |||||||||||||||||
Gain (loss) recognized in AOCI (effective portion) | $ | 3.7 | $ | 2.0 | $ | 2.1 | $ | (1.3 | ) | $ | — | $ | — | ||||||||||
Gain (loss) reclassified from AOCI to earnings (effective portion) | (1.4 | ) | 2.1 | (1.0 | ) | — | (37.4 | ) | (45.7 | ) | |||||||||||||
Gain (loss) recognized in earnings (ineffective portion) | 0.5 | 0.9 | 1.1 | — | — | — | |||||||||||||||||
(1) | Location of the gain (loss) reclassified from AOCI to earnings as well as the gain (loss) recognized in earnings for the ineffective portion of the hedge is restaurant labor expenses and general and administrative expenses. |
(2) | Location of the gain (loss) reclassified from AOCI to earnings as well as the gain (loss) recognized in earnings for the ineffective portion of the hedge is interest, net. |
The effects of derivatives not designated as hedging instruments in the consolidated statements of earnings are as follows:
Amount of Gain (Loss) Recognized in Earnings | ||||||||||||
(in millions) | Fiscal Year | |||||||||||
Location of Gain (Loss) Recognized in Earnings on Derivatives | 2017 | 2016 | 2015 | |||||||||
Restaurant labor expenses | $ | 5.3 | $ | 3.9 | $ | 4.0 | ||||||
General and administrative expenses | 8.9 | 7.5 | 9.2 | |||||||||
Total | $ | 14.2 | $ | 11.4 | $ | 13.2 | ||||||
Based on the fair value of our derivative instruments designated as cash flow hedges as of May 28, 2017, we expect to reclassify $0.2 million of net gains on derivative instruments from accumulated other comprehensive income (loss) to earnings
64
NOTES TO CONSOLIDATED FINANCIAL STATEMENTS (continued)
during the next 12 months based on the maturity of equity forward contracts. However, the amounts ultimately realized in earnings will be dependent on the fair value of the contracts on the settlement dates.
NOTE 9 – FAIR VALUE MEASUREMENTS
The fair values of cash equivalents, receivables, net, accounts payable and short-term debt approximate their carrying amounts due to their short duration.
The following tables summarize the fair values of financial instruments measured at fair value on a recurring basis at May 28, 2017 and May 29, 2016:
Items Measured at Fair Value at May 28, 2017 | |||||||||||||||||
(in millions) | Fair Value of Assets (Liabilities) | Quoted Prices in Active Market for Identical Assets (Liabilities) (Level 1) | Significant Other Observable Inputs (Level 2) | Significant Unobservable Inputs (Level 3) | |||||||||||||
Fixed-income securities: | |||||||||||||||||
Corporate bonds | (1) | $ | 1.1 | $ | — | $ | 1.1 | $ | — | ||||||||
U.S. Treasury securities | (2) | 2.0 | 2.0 | — | — | ||||||||||||
Mortgage-backed securities | (1) | 1.0 | — | 1.0 | — | ||||||||||||
Derivatives: | |||||||||||||||||
Equity forwards | (3) | (0.4 | ) | — | (0.4 | ) | — | ||||||||||
Total | $ | 3.7 | $ | 2.0 | $ | 1.7 | $ | — | |||||||||
Items Measured at Fair Value at May 29, 2016 | |||||||||||||||||
(in millions) | Fair Value of Assets (Liabilities) | Quoted Prices in Active Market for Identical Assets (Liabilities) (Level 1) | Significant Other Observable Inputs (Level 2) | Significant Unobservable Inputs (Level 3) | |||||||||||||
Fixed-income securities: | |||||||||||||||||
Corporate bonds | (1) | $ | 2.0 | $ | — | $ | 2.0 | $ | — | ||||||||
U.S. Treasury securities | (2) | 3.9 | 3.9 | — | — | ||||||||||||
Mortgage-backed securities | (1) | 1.0 | — | 1.0 | — | ||||||||||||
Derivatives: | |||||||||||||||||
Equity forwards | (3) | 3.8 | — | 3.8 | — | ||||||||||||
Total | $ | 10.7 | $ | 3.9 | $ | 6.8 | $ | — | |||||||||
(1) | The fair value of these securities is based on closing market prices of the investments, when applicable, or, alternatively, valuations utilizing market data and other observable inputs, inclusive of the risk of nonperformance. |
(2) | The fair value of our U.S. Treasury securities is based on closing market prices. |
(3) | The fair value of our equity forwards is based on the closing market value of Darden stock, inclusive of the risk of nonperformance. |
Our fixed-income securities are carried at fair value and consist of available-for-sale securities related to insurance funding requirements for our workers’ compensation and general liability claims. As of May 28, 2017, the cost and market value for our securities that qualify as available-for-sale was $4.2 million and $4.1 million, respectively. Earnings include insignificant realized gains and loss from sales of available-for-sale securities. At May 28, 2017, our available-for-sale securities of $2.9 million have maturities of less than one year and $1.2 million have maturities within one to three years.
The carrying value and fair value of long-term debt, as of May 28, 2017, was $936.6 million and $1.05 billion, respectively. The carrying value and fair value of long-term debt as of May 29, 2016, was $440.0 million and $499.5 million, respectively. The
65
NOTES TO CONSOLIDATED FINANCIAL STATEMENTS (continued)
fair value of long-term debt, which is classified as Level 2 in the fair value hierarchy, is determined based on market prices or, if market prices are not available, the present value of the underlying cash flows discounted at our incremental borrowing rates.
The fair value of non-financial assets measured at fair value on a non-recurring basis, which is classified as Level 3 in the fair value hierarchy, is determined based on appraisals or sales prices of comparable assets and estimates of future cash flows. As of May 28, 2017, adjustments to the fair values of non-financial assets were not material. As of May 29, 2016, long-lived assets held and used with a carrying value of $5.4 million, primarily related to two underperforming restaurants, were determined to have no fair value resulting in an impairment charge of $5.4 million. As of May 29, 2016, long-lived assets held for sale with a carrying value of $17.5 million, related to excess land parcels adjacent to our corporate headquarters, were written down to their fair value of $16.9 million, resulting in an impairment charge of $0.6 million.
NOTE 10 - STOCKHOLDERS’ EQUITY
Share Repurchase Program
On September 29, 2016, our Board of Directors authorized a new share repurchase program under which we may repurchase up to $500.0 million of our outstanding common stock. As of May 28, 2017, $469.8 million remains under this authorization. This repurchase program does not have an expiration and replaces all other outstanding share repurchase authorizations.
Share Retirements
As of May 28, 2017, of the 188.6 million cumulative shares repurchased under the current and previous authorizations, 176.0 million shares were retired and restored to authorized but unissued shares of common stock. We expect that all shares of common stock acquired in the future will also be retired and restored to authorized but unissued shares of common stock.
Accumulated Other Comprehensive Income (Loss)
The components of accumulated other comprehensive income (loss), net of tax, are as follows:
(in millions) | Foreign Currency Translation Adjustment | Unrealized Gains (Losses) on Marketable Securities | Unrealized Gains (Losses) on Derivatives | Benefit Plan Funding Position | Accumulated Other Comprehensive Income (Loss) | ||||||||||||||
Balances at May 31, 2015 | $ | (1.7 | ) | $ | 0.1 | $ | (19.1 | ) | $ | (65.9 | ) | $ | (86.6 | ) | |||||
Gain (loss) | 0.5 | — | 2.0 | (23.5 | ) | (21.0 | ) | ||||||||||||
Reclassification realized in net earnings | — | — | 21.0 | (0.4 | ) | 20.6 | |||||||||||||
Balances at May 29, 2016 | $ | (1.2 | ) | $ | 0.1 | $ | 3.9 | $ | (89.8 | ) | $ | (87.0 | ) | ||||||
Gain (loss) | 0.5 | — | 2.9 | 6.4 | 9.8 | ||||||||||||||
Reclassification realized in net earnings | — | — | 1.4 | 12.9 | 14.3 | ||||||||||||||
Balances at May 28, 2017 | $ | (0.7 | ) | $ | 0.1 | $ | 8.2 | $ | (70.5 | ) | $ | (62.9 | ) | ||||||
66
NOTES TO CONSOLIDATED FINANCIAL STATEMENTS (continued)
The following table presents the amounts and line items in our consolidated statements of earnings where other adjustments reclassified from AOCI into net earnings were recorded:
Fiscal Year | |||||||||
(in millions) AOCI Components | Location of Gain (Loss) Recognized in Earnings | May 28, 2017 | May 29, 2016 | ||||||
Derivatives | |||||||||
Equity contracts | (1) | $ | (1.4 | ) | $ | 2.1 | |||
Interest rate contracts | (2) | — | (37.4 | ) | |||||
Total before tax | $ | (1.4 | ) | $ | (35.3 | ) | |||
Tax benefit | — | 14.3 | |||||||
Net of tax | $ | (1.4 | ) | $ | (21.0 | ) | |||
Benefit plan funding position | |||||||||
Pension/postretirement plans | |||||||||
Actuarial losses | (3) | $ | (3.3 | ) | $ | (2.8 | ) | ||
Settlement loss | (3) | (19.9 | ) | — | |||||
Total - pension/postretirement plans | $ | (23.2 | ) | $ | (2.8 | ) | |||
Recognized net actuarial gain - other plans | (4) | 2.3 | 3.4 | ||||||
Total before tax | $ | (20.9 | ) | $ | 0.6 | ||||
Tax benefit (expense) | 8.0 | (0.2 | ) | ||||||
Net of tax | $ | (12.9 | ) | $ | 0.4 | ||||
(1) | Primarily included in restaurant labor costs and general and administrative expenses. See Note 8 for additional details. |
(2) | Included in interest, net, on our consolidated statements of earnings. Reclassifications in fiscal 2016 primarily related to the acceleration of hedge loss amortization resulting from the pay down of the associated long-term debt. |
(3) | Included in the computation of net periodic benefit costs - pension and postretirement plans, which is a component of restaurant labor expenses and general and administrative expenses. See Note 14 for additional details. |
(4) | Included in the computation of net periodic benefit costs - other plans, which is a component of general and administrative expenses. |
NOTE 11 – LEASES
An analysis of rent expense incurred related to continuing operations is as follows:
Fiscal Year | |||||||||||
(in millions) | 2017 | 2016 | 2015 | ||||||||
Restaurant minimum rent (1) | $ | 286.8 | $ | 233.6 | $ | 167.0 | |||||
Restaurant rent averaging expense | 26.0 | 15.9 | 16.7 | ||||||||
Restaurant percentage rent | 7.9 | 8.0 | 7.7 | ||||||||
Other | 11.3 | 8.1 | 3.5 | ||||||||
Total rent expense | $ | 332.0 | $ | 265.6 | $ | 194.9 | |||||
(1) | Expense is higher for fiscal 2017 and fiscal 2016 primarily due to the fiscal 2016 real estate transactions. |
67
NOTES TO CONSOLIDATED FINANCIAL STATEMENTS (continued)
Total rent expense included in discontinued operations was $0.1 million, $0.0 million and $6.2 million for fiscal 2017, 2016 and 2015, respectively. These amounts include restaurant minimum rent of $0.1 million, $0.0 million and $5.8 million for fiscal 2017, 2016 and 2015, respectively.
The annual future lease commitments under capital lease obligations and noncancelable operating and financing leases, including those related to restaurants reported as discontinued operations, for each of the five fiscal years subsequent to May 28, 2017 and thereafter is as follows:
(in millions) | |||||||||||
Fiscal Year | Capital | Financing | Operating | ||||||||
2018 | $ | 7.0 | $ | 9.1 | $ | 333.9 | |||||
2019 | 7.2 | 9.3 | 323.2 | ||||||||
2020 | 7.3 | 9.4 | 307.6 | ||||||||
2021 | 7.2 | 9.6 | 285.8 | ||||||||
2022 | 7.1 | 9.7 | 260.2 | ||||||||
Thereafter | 52.6 | 131.9 | 1,645.4 | ||||||||
Total future lease commitments | $ | 88.4 | $ | 179.0 | $ | 3,156.1 | |||||
Less imputed interest (various) | (29.5 | ) | (78.3 | ) | |||||||
Present value of future lease commitments | $ | 58.9 | $ | 100.7 | |||||||
Less current maturities | (3.2 | ) | (2.1 | ) | |||||||
Obligations under capital and financing leases, net of current maturities | $ | 55.7 | $ | 98.6 | |||||||
NOTE 12 - ADDITIONAL FINANCIAL INFORMATION
The tables below provide additional financial information related to our consolidated financial statements:
Balance Sheets
(in millions) | May 28, 2017 | May 29, 2016 | |||||
Receivables, net | |||||||
Retail outlet gift card sales | $ | 43.0 | $ | 43.9 | |||
Landlord allowances due | 14.2 | 3.7 | |||||
Miscellaneous | 19.0 | 16.9 | |||||
Allowance for doubtful accounts | (0.3 | ) | (0.5 | ) | |||
Total | $ | 75.9 | $ | 64.0 | |||
Other Current Liabilities | |||||||
Non-qualified deferred compensation plan | $ | 210.3 | $ | 194.0 | |||
Sales and other taxes | 66.9 | 58.7 | |||||
Insurance-related | 41.7 | 36.3 | |||||
Employee benefits | 41.8 | 35.8 | |||||
Accrued interest | 7.3 | 5.1 | |||||
Miscellaneous | 77.9 | 70.7 | |||||
Total | $ | 445.9 | $ | 400.6 | |||
68
NOTES TO CONSOLIDATED FINANCIAL STATEMENTS (continued)
Statements of Earnings
Fiscal Year | |||||||||||
(in millions) | 2017 | 2016 | 2015 | ||||||||
Interest, net | |||||||||||
Interest expense (1) | $ | 34.4 | $ | 165.4 | $ | 186.2 | |||||
Imputed interest on capital and financing leases | 8.8 | 8.9 | 8.0 | ||||||||
Capitalized interest | (1.7 | ) | (0.7 | ) | (1.3 | ) | |||||
Interest income | (1.3 | ) | (1.1 | ) | (0.6 | ) | |||||
Total | $ | 40.2 | $ | 172.5 | $ | 192.3 | |||||
(1) | Interest expense in fiscal 2016 and 2015 includes approximately $106.8 million and $91.3 million, respectively, of expenses associated with the retirement of long-term debt. |
Statements of Cash Flows
Fiscal Year | |||||||||||
(in millions) | 2017 | 2016 | 2015 | ||||||||
Cash paid during the fiscal year for: | |||||||||||
Interest, net of amounts capitalized (1) | $ | 37.0 | $ | 140.8 | $ | 142.8 | |||||
Income taxes, net of refunds (2) | $ | 106.2 | $ | 128.0 | $ | 290.7 | |||||
Non-cash investing and financing activities: | |||||||||||
Increase in land, buildings and equipment through accrued purchases | $ | 22.8 | $ | 14.9 | $ | 11.1 | |||||
Net book value of assets distributed in Four Corners separation, net of deferred tax liabilities | $ | — | $ | 750.4 | $ | — | |||||
(1) | Interest paid in fiscal 2016 and 2015 includes approximately $68.7 million and $44.0 million, respectively, of payments associated with the retirement of long-term debt. |
(2) | Income taxes paid in fiscal 2015 were higher primarily as a result of the gain recognized on the sale of Red Lobster. |
NOTE 13 - INCOME TAXES
Total income tax expense was allocated as follows:
Fiscal Year | |||||||||||
(in millions) | 2017 | 2016 | 2015 | ||||||||
Earnings from continuing operations | $ | 154.8 | $ | 90.0 | $ | (21.1 | ) | ||||
Earnings from discontinued operations | (4.2 | ) | 3.4 | 344.8 | |||||||
Total consolidated income tax expense | $ | 150.6 | $ | 93.4 | $ | 323.7 | |||||
69
NOTES TO CONSOLIDATED FINANCIAL STATEMENTS (continued)
The components of earnings from continuing operations before income taxes and the provision for income taxes thereon are as follows:
Fiscal Year | |||||||||||
(in millions) | 2017 | 2016 | 2015 | ||||||||
Earnings from continuing operations before income taxes: | |||||||||||
U.S. | $ | 632.3 | $ | 450.6 | $ | 179.9 | |||||
Foreign | 5.0 | (0.9 | ) | (4.6 | ) | ||||||
Earnings from continuing operations before income taxes | $ | 637.3 | $ | 449.7 | $ | 175.3 | |||||
Income taxes: | |||||||||||
Current: | |||||||||||
Federal | $ | 160.5 | $ | 89.1 | $ | (12.7 | ) | ||||
State and local | 22.2 | 2.7 | (8.0 | ) | |||||||
Foreign | 1.3 | 1.9 | 6.9 | ||||||||
Total current | $ | 184.0 | $ | 93.7 | $ | (13.8 | ) | ||||
Deferred (principally U.S.): | |||||||||||
Federal | $ | (24.1 | ) | $ | (2.4 | ) | $ | — | |||
State and local | (5.1 | ) | (1.3 | ) | (7.3 | ) | |||||
Total deferred | $ | (29.2 | ) | $ | (3.7 | ) | $ | (7.3 | ) | ||
Total income taxes | $ | 154.8 | $ | 90.0 | $ | (21.1 | ) | ||||
The following table is a reconciliation of the U.S. statutory income tax rate to the effective income tax rate from continuing operations included in the accompanying consolidated statements of earnings:
Fiscal Year | ||||||||
2017 | 2016 | 2015 | ||||||
U.S. statutory rate | 35.0 | % | 35.0 | % | 35.0 | % | ||
State and local income taxes, net of federal tax benefits | 1.7 | 1.2 | (6.6 | ) | ||||
Benefit of federal income tax credits | (9.2 | ) | (12.5 | ) | (34.0 | ) | ||
Other, net | (3.2 | ) | (3.7 | ) | (6.4 | ) | ||
Effective income tax rate | 24.3 | % | 20.0 | % | (12.0 | )% | ||
As of May 28, 2017, we had estimated current prepaid state income taxes of $6.2 million which is included on our accompanying consolidated balance sheets as prepaid income taxes and estimated current federal income taxes payable of $1.9 million, which are included on our accompanying consolidated balance sheets as accrued income taxes.
As of May 28, 2017, we had unrecognized tax benefits of $16.4 million, which represents the aggregate tax effect of the differences between tax return positions and benefits recognized in our consolidated financial statements, all of which would favorably affect the effective tax rate if resolved in our favor. Included in the balance of unrecognized tax benefits at May 28, 2017, is $0.7 million related to tax positions for which it is reasonably possible that the total amounts could change during the next 12 months based on the outcome of examinations. The $0.7 million relates to items that would impact our effective income tax rate.
A reconciliation of the beginning and ending amount of unrecognized tax benefits follows:
(in millions) | |||
Balances at May 29, 2016 | $ | 14.3 | |
Additions related to current-year tax positions | 4.6 | ||
Reductions due to settlements with taxing authorities | (0.2 | ) | |
Reductions to tax positions due to statute expiration | (2.3 | ) | |
Balances at May 28, 2017 | $ | 16.4 | |
70
NOTES TO CONSOLIDATED FINANCIAL STATEMENTS (continued)
We recognize accrued interest related to unrecognized tax benefits in income tax expense. Penalties, when incurred, are recognized in general and administrative expense. Interest expense associated with unrecognized tax benefits, excluding the release of accrued interest related to prior year matters due to settlement or the lapse of the statute of limitations was as follows:
Fiscal Year | |||||||||||
(in millions) | 2017 | 2016 | 2015 | ||||||||
Interest expense on unrecognized tax benefits | $ | 0.6 | $ | 0.5 | $ | 1.1 | |||||
At May 28, 2017, we had $0.9 million accrued for the payment of interest associated with unrecognized tax benefits.
For U.S. federal income tax purposes, we participate in the Internal Revenue Service’s (IRS) Compliance Assurance Process (CAP), whereby our U.S. federal income tax returns are reviewed by the IRS both prior to and after their filing. Income tax returns are subject to audit by state and local governments, generally years after the returns are filed. These returns could be subject to material adjustments or differing interpretations of the tax laws. The major jurisdictions in which the Company files income tax returns include the U.S. federal jurisdiction, Canada, and all states in the U.S. that have an income tax. With a few exceptions, the Company is no longer subject to U.S. federal income tax examinations by tax authorities for years before fiscal 2016, and state and local, or non-U.S. income tax examinations by tax authorities for years before fiscal 2012.
The tax effects of temporary differences that give rise to deferred tax assets and liabilities are as follows:
(in millions) | May 28, 2017 | May 29, 2016 | |||||
Accrued liabilities | $ | 137.1 | $ | 109.4 | |||
Compensation and employee benefits | 174.6 | 176.0 | |||||
Deferred rent and interest income | 110.3 | 97.8 | |||||
Net operating loss, credit and charitable contribution carryforwards | 78.0 | 47.1 | |||||
Other | 6.9 | 5.9 | |||||
Gross deferred tax assets | $ | 506.9 | $ | 436.2 | |||
Valuation allowance | (17.0 | ) | (17.0 | ) | |||
Deferred tax assets, net of valuation allowance | $ | 489.9 | $ | 419.2 | |||
Trademarks and other acquisition related intangibles | (310.7 | ) | (226.4 | ) | |||
Buildings and equipment | (275.4 | ) | (238.6 | ) | |||
Capitalized software and other assets | (38.1 | ) | (34.0 | ) | |||
Other | (11.4 | ) | (12.1 | ) | |||
Gross deferred tax liabilities | $ | (635.6 | ) | $ | (511.1 | ) | |
Net deferred tax liabilities | $ | (145.7 | ) | $ | (91.9 | ) | |
Net operating loss, credit and charitable contribution carryforwards have the potential to expire. We have taken current and potential future expirations into consideration when evaluating the need for valuation allowances against these deferred tax assets. A valuation allowance for deferred tax assets is provided when it is more likely than not that some portion or all of the deferred tax assets will not be realized. Realization is dependent upon the generation of future taxable income or the reversal of deferred tax liabilities during the periods in which those temporary differences become deductible. We consider the scheduled reversal of deferred tax liabilities, projected future taxable income and tax planning strategies in making this assessment. Based upon the level of historical taxable income and projections for future taxable income over the periods in which our deferred tax assets are deductible, we believe it is more-likely-than-not that we will realize the benefits of these deductible differences, net of the existing valuation allowances at May 28, 2017.
NOTE 14 - RETIREMENT PLANS
Defined Benefit Plans and Postretirement Benefit Plan
We sponsor non-contributory defined benefit pension plans, for a group of certain eligible employees in the United States under which benefits are based on various formulas, including a Final Average Pay formula and a Cash Balance formula. As of December 2014, the plans were frozen and no additional benefits will accrue for participants (except for continuing interest credits for eligible participants in the Cash Balance component). Pension plan assets are invested in U.S. and international equity and fixed-income security funds and a real estate investment fund. Our policy is to fund, at a minimum, the amount necessary on
71
NOTES TO CONSOLIDATED FINANCIAL STATEMENTS (continued)
an actuarial basis to provide for benefits in accordance with the requirements of the Employee Retirement Income Security Act of 1974, as amended, and the Internal Revenue Code (IRC), as amended by the Pension Protection Act of 2006. We also sponsor a non-contributory postretirement benefit plan that provides health care benefits to our salaried retirees. Fundings related to the defined benefit pension plans and postretirement benefit plan, which are funded on a pay-as-you-go basis, were as follows:
Fiscal Year | |||||||||||
(in millions) | 2017 | 2016 | 2015 | ||||||||
Defined benefit pension plans funding (1) | $ | 0.4 | $ | 25.4 | $ | 0.4 | |||||
Postretirement benefit plan funding | 1.2 | 1.1 | 1.1 | ||||||||
(1) | Funding for fiscal 2016 includes a voluntary funding contribution of $25.0 million. |
We expect to contribute approximately $0.4 million to our defined benefit pension plans and approximately $1.3 million to our postretirement benefit plan during fiscal 2018.
We are required to recognize the over- or under-funded status of the plans as an asset or liability as measured by the difference between the fair value of the plan assets and the benefit obligation and any unrecognized prior service costs and actuarial gains and losses as a component of accumulated other comprehensive income (loss), net of tax. Additionally, the defined benefit pension plans recognized $19.9 million of previously unrecognized loss in net periodic benefit cost due to a settlement charge triggered by lump sum payouts during the fourth quarter of fiscal 2017.
The following provides a reconciliation of the changes in the plan benefit obligation, fair value of plan assets and the funded status of the plans as of May 28, 2017 and May 29, 2016:
Defined Benefit Plans | Postretirement Benefit Plan | ||||||||||||||
(in millions) | 2017 | 2016 | 2017 | 2016 | |||||||||||
Change in Benefit Obligation: | |||||||||||||||
Benefit obligation at beginning of period | $ | 298.5 | $ | 288.4 | $ | 19.9 | $ | 18.0 | |||||||
Service cost | — | — | 0.2 | 0.2 | |||||||||||
Interest cost | 10.1 | 10.6 | 0.6 | 0.8 | |||||||||||
Plan settlements | (44.2 | ) | — | — | — | ||||||||||
Benefits paid | (10.0 | ) | (15.9 | ) | (1.2 | ) | (1.1 | ) | |||||||
Actuarial (gain) loss | (2.1 | ) | 15.4 | 1.3 | 2.0 | ||||||||||
Benefit obligation at end of period | $ | 252.3 | $ | 298.5 | $ | 20.8 | $ | 19.9 | |||||||
Change in Plan Assets: | |||||||||||||||
Fair value at beginning of period | $ | 242.0 | $ | 236.6 | $ | — | $ | — | |||||||
Actual return on plan assets | 19.5 | (4.1 | ) | — | — | ||||||||||
Employer contributions | 0.4 | 25.4 | 1.2 | 1.1 | |||||||||||
Plan settlements | (44.2 | ) | — | — | — | ||||||||||
Benefits paid | (10.0 | ) | (15.9 | ) | (1.2 | ) | (1.1 | ) | |||||||
Fair value at end of period | $ | 207.7 | $ | 242.0 | $ | — | $ | — | |||||||
Unfunded status at end of period | $ | (44.6 | ) | $ | (56.5 | ) | $ | (20.8 | ) | $ | (19.9 | ) | |||
72
NOTES TO CONSOLIDATED FINANCIAL STATEMENTS (continued)
The following is a detail of the balance sheet components of each of our plans and a reconciliation of the amounts included in accumulated other comprehensive income (loss):
Defined Benefit Plans | Postretirement Benefit Plan | ||||||||||||||
(in millions) | May 28, 2017 | May 29, 2016 | May 28, 2017 | May 29, 2016 | |||||||||||
Components of the Consolidated Balance Sheets: | |||||||||||||||
Current liabilities | $ | — | $ | — | $ | 1.3 | $ | 1.3 | |||||||
Noncurrent liabilities | 44.6 | 56.5 | 19.5 | 18.6 | |||||||||||
Net amounts recognized | $ | 44.6 | $ | 56.5 | $ | 20.8 | $ | 19.9 | |||||||
Amounts Recognized in Accumulated Other Comprehensive Income (Loss), net of tax: | |||||||||||||||
Prior service credit | $ | — | $ | — | $ | 9.0 | $ | 11.9 | |||||||
Net actuarial gain (loss) | (70.1 | ) | (87.9 | ) | (9.3 | ) | (9.5 | ) | |||||||
Net amounts recognized | $ | (70.1 | ) | $ | (87.9 | ) | $ | (0.3 | ) | $ | 2.4 | ||||
The following is a summary of our accumulated and projected benefit obligations for our defined benefit plans:
(in millions) | May 28, 2017 | May 29, 2016 | |||||
Accumulated benefit obligation for all defined benefit plans | $ | 252.3 | $ | 298.5 | |||
Pension plans with accumulated benefit obligations in excess of plan assets: | |||||||
Accumulated benefit obligation | 252.3 | 298.5 | |||||
Fair value of plan assets | 207.7 | 242.0 | |||||
Projected benefit obligations for all plans with projected benefit obligations in excess of plan assets | 252.3 | 298.5 | |||||
The following table presents the weighted-average assumptions used to determine benefit obligations and net expense:
Defined Benefit Plans | Postretirement Benefit Plan | ||||||||||
2017 | 2016 | 2017 | 2016 | ||||||||
Weighted-average assumptions used to determine benefit obligations at May 28 and May 29 (1) | |||||||||||
Discount rate | 4.06 | % | 4.18 | % | 3.98 | % | 4.00 | % | |||
Rate of future compensation increases | N/A | N/A | N/A | N/A | |||||||
Weighted-average assumptions used to determine net expense for fiscal years ended May 28 and May 29 (2) | |||||||||||
Discount rate | 4.18 | % | 4.43 | % | 4.00 | % | 4.22 | % | |||
Expected long-term rate of return on plan assets | 6.50 | % | 6.50 | % | N/A | N/A | |||||
Rate of future compensation increases | N/A | N/A | N/A | N/A | |||||||
(1) | Determined as of the end of fiscal year. |
(2) | Determined as of the beginning of fiscal year. |
We set the discount rate assumption annually for each of the plans at their valuation dates to reflect the yield of high-quality fixed-income debt instruments, with lives that approximate the maturity of the plan benefits. Additionally, for our mortality assumption as of fiscal year end, we selected the most recent RP-2014 mortality tables and MP-2016 mortality improvement scale to measure the benefit obligations.
The expected long-term rate of return on plan assets is based upon several factors, including our historical assumptions compared with actual results, an analysis of current market conditions, asset fund allocations and the views of leading financial advisers and economists. We reduced our expected long-term rate of return on plan assets for our defined benefit plans from 7.0 percent used in fiscal 2015 to 6.5 percent used in fiscal 2016 and we continue to use 6.5 percent for fiscal 2017 in connection with our current expectations for long-term returns and target asset fund allocation. In developing our expected rate of return assumption, we have evaluated the actual historical performance and long-term return projections of the plan assets, which give
73
NOTES TO CONSOLIDATED FINANCIAL STATEMENTS (continued)
consideration to the asset mix and the anticipated timing of the pension plan outflows. We employ a total return investment approach whereby a mix of equity and fixed-income investments are used to maximize the long-term return of plan assets for what we consider a prudent level of risk. Our historical 10-year, 15-year and 20-year rates of return on plan assets, calculated using the geometric method average of returns, are approximately 6.0 percent, 8.4 percent and 8.5 percent, respectively, as of May 28, 2017. Our Benefit Plans Committee has delegated to the Benefit Plans Investment Committee the authority to set the investment policy for the defined benefit plans and oversees the investment allocation, which includes setting long-term strategic targets. Our overall investment strategy is to achieve appropriate diversification through a mix of U.S. and international equity and fixed-income investments and real estate investments. Currently, our target asset fund allocation is 40.0 percent high-quality, long-duration fixed-income securities, 31.0 percent U.S. equities, 16.0 percent international equities, 10.0 percent absolute-return funds and 3.0 percent real estate securities. The investment policy establishes a re-balancing band around the established targets within which the asset class weight is allowed to vary. Equity securities, absolute-return funds, international equities and fixed-income securities include investments in various industry sectors. Investments in real estate securities follow different strategies designed to maximize returns, allow for diversification and provide a hedge against inflation. Our current positioning is neutral on investment style between value and growth companies and large and small cap companies. We monitor our actual asset fund allocation to ensure that it approximates our target allocation and believe that our long-term asset fund allocation will continue to approximate our target allocation. Investments held in U.S. fixed income commingled funds, U.S. commingled funds, an international commingled fund, a global fixed-income commingled fund and emerging markets equity investments represented approximately 39.6 percent, 30.7 percent, 11.0 percent, 9.9 percent and 5.6 percent, respectively, of total plan assets and represents the only significant concentrations of risk related to a single entity, sector, country, commodity or investment fund. No other single sector concentration of assets exceeded 5.0 percent of total plan assets.
Components of net periodic benefit cost included in earnings are as follows:
Defined Benefit Plans | Postretirement Benefit Plan | ||||||||||||||||||||||
(in millions) | 2017 | 2016 | 2015 | 2017 | 2016 | 2015 | |||||||||||||||||
Service cost | $ | — | $ | — | $ | 1.1 | $ | 0.2 | $ | 0.2 | $ | 0.5 | |||||||||||
Interest cost | 10.1 | 10.6 | 10.0 | 0.6 | 0.8 | 1.0 | |||||||||||||||||
Expected return on plan assets | (16.0 | ) | (14.5 | ) | (15.2 | ) | — | — | — | ||||||||||||||
Amortization of unrecognized prior service cost | — | — | — | (4.8 | ) | (4.8 | ) | (2.8 | ) | ||||||||||||||
Recognized net actuarial loss | 3.3 | 2.8 | 2.6 | 1.7 | 1.2 | 0.8 | |||||||||||||||||
Settlement loss recognized | 19.9 | — | 6.1 | — | — | — | |||||||||||||||||
Net pension and postretirement cost (benefit) | $ | 17.3 | $ | (1.1 | ) | $ | 4.6 | $ | (2.3 | ) | $ | (2.6 | ) | $ | (0.5 | ) | |||||||
The amortization of the net actuarial gain (loss) component of our fiscal 2018 net periodic benefit cost for the defined benefit plans and postretirement benefit plan is expected to be approximately $(2.8) million and $3.0 million, respectively.
The fair values of the defined benefit pension plans assets at their measurement dates of May 28, 2017 and May 29, 2016, are as follows:
74
NOTES TO CONSOLIDATED FINANCIAL STATEMENTS (continued)
Items Measured at Fair Value at May 28, 2017 | |||||||||||||||||
(in millions) | Fair Value of Assets (Liabilities) | Quoted Prices in Active Market for Identical Assets (Liabilities) (Level 1) | Significant Other Observable Inputs (Level 2) | Significant Unobservable Inputs (Level 3) | |||||||||||||
Equity: | |||||||||||||||||
U.S. Commingled Funds | (1) | $ | 63.7 | $ | — | $ | 63.7 | $ | — | ||||||||
International Commingled Fund | (2) | 22.8 | — | 22.8 | — | ||||||||||||
Emerging Market Commingled Fund | (3) | 6.0 | — | 6.0 | — | ||||||||||||
Emerging Market Mutual Fund | (4) | 5.7 | 5.7 | — | — | ||||||||||||
Real Estate Commingled Fund | (5) | 6.0 | — | 6.0 | — | ||||||||||||
Fixed-Income: | |||||||||||||||||
Global Fixed-Income Commingled Fund | (7) | 20.6 | — | 20.6 | — | ||||||||||||
U.S. Fixed-Income Commingled Funds | (8) | 82.4 | — | 82.4 | — | ||||||||||||
Cash & Accruals | 0.5 | 0.5 | — | — | |||||||||||||
Total | $ | 207.7 | $ | 6.2 | $ | 201.5 | $ | — | |||||||||
Items Measured at Fair Value at May 29, 2016 | |||||||||||||||||
(in millions) | Fair Value of Assets (Liabilities) | Quoted Prices in Active Market for Identical Assets (Liabilities) (Level 1) | Significant Other Observable Inputs (Level 2) | Significant Unobservable Inputs (Level 3) | |||||||||||||
Equity: | |||||||||||||||||
U.S. Commingled Funds | (1) | $ | 75.3 | $ | — | $ | 75.3 | $ | — | ||||||||
International Commingled Fund | (2) | 24.9 | — | 24.9 | — | ||||||||||||
Emerging Market Commingled Fund | (3) | 6.8 | — | 6.8 | — | ||||||||||||
Emerging Market Mutual Fund | (4) | 5.9 | 5.9 | — | — | ||||||||||||
Real Estate Commingled Fund | (5) | 7.5 | — | 7.5 | — | ||||||||||||
Fixed-Income: | |||||||||||||||||
U.S. Treasury Securities | (6) | 25.9 | 25.9 | — | — | ||||||||||||
U.S. Corporate Securities | (6) | 37.8 | — | 37.8 | — | ||||||||||||
International Securities | (6) | 6.3 | — | 6.3 | — | ||||||||||||
Public Sector Utility Securities | (6) | 14.8 | — | 14.8 | — | ||||||||||||
Global Fixed-Income Commingled Fund | (7) | 24.4 | — | 24.4 | — | ||||||||||||
U.S. Fixed-Income Commingled Funds | (8) | 10.3 | — | 10.3 | — | ||||||||||||
Cash & Accruals | 2.1 | 2.1 | — | — | |||||||||||||
Total | $ | 242.0 | $ | 33.9 | $ | 208.1 | $ | — | |||||||||
(1) | U.S. commingled funds are comprised of investments in funds that purchase publicly traded U.S. common stock for total return purposes. Investments are valued using a unit price or net asset value (NAV) based on the fair value of the underlying investments of the funds. There are no redemption restrictions associated with these funds. |
(2) | International commingled fund is comprised of investments in funds that purchase publicly traded non-U.S. common stock for total return purposes. Investments are valued using a unit price or NAV based on the fair value of the underlying investments of the fund. There are no redemption restrictions associated with this fund. |
(3) | Emerging market commingled fund and developed market securities are comprised of investments in funds that purchase publicly traded common stock of non-U.S. companies in emerging economies for total return purposes. Funds are valued using a unit price or NAV based on the fair value of the underlying investments of the funds. There are no redemption restrictions associated with these funds. |
75
NOTES TO CONSOLIDATED FINANCIAL STATEMENTS (continued)
(4) | Emerging market mutual fund is comprised of securities associated with emerging markets and frontier markets. Fund is valued using quoted market prices from national exchanges. |
(5) | Real estate commingled fund is comprised of investments in funds that purchase publicly traded common stock of real estate companies for purposes of total return. These investments are valued using a unit price or NAV based on the fair value of the underlying investments of the fund. There are no redemption restrictions associated with this fund. |
(6) | Fixed-income securities are comprised of investments in government and corporate debt securities. These securities are valued by the trustee at closing prices from national exchanges or pricing vendors on the valuation date. |
(7) | Global fixed-income commingled fund is comprised of investments in U.S. and non-U.S. government fixed-income securities. Investments are valued using a unit price or NAV based on the fair value of the underlying investments of the fund. There are no redemption restrictions associated with this fund. |
(8) | U.S. fixed-income commingled funds are comprised of a diversified portfolio of U.S. investment-grade corporate and government securities. Investments are valued using a unit price or NAV based on the fair value of the underlying investments of the funds. There are no redemption restrictions associated with these funds. |
The following benefit payments are expected to be paid between fiscal 2018 and fiscal 2027:
(in millions) | Defined Benefit Plans | Postretirement Benefit Plan | ||||||
2018 | $ | 11.4 | $ | 1.3 | ||||
2019 | 12.5 | 1.3 | ||||||
2020 | 12.8 | 1.3 | ||||||
2021 | 13.1 | 1.3 | ||||||
2022 | 13.3 | 1.3 | ||||||
2023-2027 | 71.7 | 6.6 | ||||||
Postemployment Severance Practice
We accrue for postemployment severance costs in our consolidated financial statements and recognize actuarial gains and losses as well as prior service credits related to our postemployment severance accrual as a component of accumulated other comprehensive income (loss). As of May 28, 2017 and May 29, 2016, $0.1 million and $4.3 million, respectively, of unrecognized actuarial losses related to our postemployment severance practice were included in accumulated other comprehensive income (loss) on a net of tax basis.
Defined Contribution Plan
We have a defined contribution (401(k)) plan (Darden Savings Plan) covering most employees age 21 and older. We match contributions for participants with at least one year of service up to 6 percent of compensation, based on our performance. The match ranges from a minimum of $0.25 to $1.20 for each dollar contributed by the participant. The plan also provides for a profit sharing contribution for eligible participants equal to 1.5 percent of the participant’s compensation. The plan had net assets of $753.7 million at May 28, 2017, and $643.3 million at May 29, 2016. Expense recognized in fiscal 2017, 2016 and 2015 was $3.7 million, $15.1 million and $0.6 million, respectively. Employees classified as “highly compensated” under the IRC are not eligible to participate in this plan. Instead, highly compensated employees are eligible to participate in a separate non-qualified deferred compensation (FlexComp) plan. This plan allows eligible employees to defer the payment of part of their annual salary and all or part of their annual bonus and provides for awards that approximate the matching contributions and other amounts that participants would have received had they been eligible to participate in our defined contribution and defined benefit plans. Amounts payable to highly compensated employees under the FlexComp plan totaled $210.3 million and $194.0 million at May 28, 2017 and May 29, 2016, respectively. These amounts are included in other current liabilities on our accompanying consolidated balance sheets.
The defined contribution plan includes a leveraged Employee Stock Ownership Plan (ESOP). The ESOP borrowed $16.9 million from us at a variable rate of interest in July 1996. At May 28, 2017, the ESOP’s original debt to us had a balance of $1.4 million with a variable rate of interest of 0.99 percent and is due to be repaid no later than December 2019. At the end of fiscal 2005, the ESOP borrowed an additional $1.6 million (Additional Loan) from us at a variable interest rate and acquired an additional 0.05 million shares of our common stock, which were held in suspense within the ESOP at that time. At May 28, 2017, the Additional Loan had a balance of $1.1 million with a variable interest rate of 1.16 percent and is due to be repaid no later than December 2018. Compensation expense is recognized as contributions are accrued. Fluctuations in our stock price impact the amount of expense to be recognized. Contributions to the plan, plus the dividends accumulated on unallocated shares held by the ESOP, are used to pay principal, interest and expenses of the plan. As loan payments are made, common stock is allocated to ESOP participants. In each of the fiscal years 2017, 2016 and 2015, the ESOP used dividends received of $0.8 million, $0.7
76
NOTES TO CONSOLIDATED FINANCIAL STATEMENTS (continued)
million and $1.1 million, respectively, and contributions received from us of $0.1 million, $0.1 million and $0.0 million, respectively, to pay principal and interest on our debt.
ESOP shares are included in weighted-average common shares outstanding for purposes of calculating net earnings per share with the exception of those shares acquired under the Additional Loan, which are accounted for in accordance with FASB ASC Subtopic 718-40, Employee Stock Ownership Plans. Fluctuations in our stock price are recognized as adjustments to common stock and surplus when the shares are committed to be released. The ESOP shares acquired under the Additional Loan are not considered outstanding until they are committed to be released and, therefore, unreleased shares have been excluded for purposes of calculating basic and diluted net earnings per share. As of May 28, 2017, the ESOP shares included in the basic and diluted net earnings per share calculation totaled 2.3 million shares, representing 2.0 million allocated shares and 0.3 million suspense shares.
NOTE 15 - STOCK-BASED COMPENSATION
In September 2015, our shareholders approved the Darden Restaurants, Inc. 2015 Omnibus Incentive Plan (2015 Plan). All equity grants subject to ASC Topic 718 after the date of approval are made under the 2015 Plan. No further equity grants after that date are permitted under the Darden Restaurants, Inc. 2002 Stock Incentive Plan, the RARE Hospitality International, Inc. Amended and Restated 2002 Long-Term Incentive Plan or any other prior stock option and/or stock grant plans (collectively, the Prior Plans). The 2015 Plan and the Prior Plans are administered by the Compensation Committee of the Board of Directors. The 2015 Plan provides for the issuance of up to 7.6 million common shares in connection with the granting of non-qualified stock options, incentive stock options, stock appreciation rights, restricted stock, restricted stock units (RSUs), stock awards and other stock-based awards including performance stock units and Darden stock units to employees, consultants and non-employee directors. There are outstanding awards under the Prior Plans that may still vest and be exercised in accordance with their terms. As of May 28, 2017, approximately 3.7 million shares may be issued under outstanding awards that were granted under the Prior Plans.
Stock-based compensation expense included in continuing operations was as follows:
Fiscal Year | |||||||||||
(in millions) | 2017 | 2016 | 2015 | ||||||||
Stock options (1) | $ | 6.0 | $ | 7.8 | $ | 20.9 | |||||
Restricted stock/restricted stock units | 1.9 | 1.6 | 2.0 | ||||||||
Darden stock units | 20.9 | 15.9 | 13.3 | ||||||||
Cash-settled performance stock units (2) | 4.2 | 6.5 | 14.5 | ||||||||
Equity-settled performance stock units | 5.3 | 2.7 | — | ||||||||
Employee stock purchase plan | 1.1 | 1.1 | 1.3 | ||||||||
Director compensation program/other | 1.3 | 1.7 | 1.7 | ||||||||
Total | $ | 40.7 | $ | 37.3 | $ | 53.7 | |||||
(1) | The higher expense in fiscal 2015 is primarily attributable to the workforce reduction efforts and a change in mix of equity awards granted. |
(2) | The higher expense in fiscal 2015 is primarily attributable to the workforce reduction efforts and the impact of improved financial performance. |
77
NOTES TO CONSOLIDATED FINANCIAL STATEMENTS (continued)
The weighted-average fair value of non-qualified stock options and the related assumptions used in the Black-Scholes model to record stock-based compensation are as follows:
Stock Options Granted in Fiscal Year | |||||||||||
2017 | 2016 | 2015 | |||||||||
Weighted-average fair value | $ | 9.08 | $ | 12.72 | $ | 9.41 | |||||
Dividend yield | 3.5 | % | 3.3 | % | 4.5 | % | |||||
Expected volatility of stock | 24.3 | % | 28.0 | % | 37.3 | % | |||||
Risk-free interest rate | 1.4 | % | 1.9 | % | 2.1 | % | |||||
Expected option life (in years) | 6.5 | 6.5 | 6.5 | ||||||||
Weighted-average exercise price per share | $ | 59.70 | $ | 64.85 | $ | 40.43 | |||||
The following table presents a summary of our stock option activity as of and for the year ended May 28, 2017:
Options (in millions) | Weighted-Average Exercise Price Per Share | Weighted-Average Remaining Contractual Life (Yrs) | Aggregate Intrinsic Value (in millions) | ||||
Outstanding beginning of period | 6.32 | $42.04 | 6.00 | $160.6 | |||
Options granted | 0.58 | 59.70 | |||||
Options exercised | (2.72) | 39.67 | |||||
Options canceled | (0.17) | 51.57 | |||||
Outstanding end of period | 4.01 | $45.81 | 6.09 | $168.9 | |||
Exercisable | 2.47 | $41.29 | 4.91 | $115.5 | |||
The total intrinsic value of options exercised during fiscal 2017, 2016 and 2015 was $99.1 million, $73.6 million and $90.2 million, respectively. Cash received from option exercises during fiscal 2017, 2016 and 2015 was $107.8 million, $94.4 million and $154.6 million, respectively. Stock options generally vest over 4 years and have a maximum contractual period of 10 years from the date of grant. We settle employee stock option exercises with authorized but unissued shares of Darden common stock or treasury shares we have acquired through our ongoing share repurchase program.
As of May 28, 2017, there was $8.0 million of unrecognized compensation cost related to unvested stock options granted under our stock plans. This cost is expected to be recognized over a weighted-average period of 2.0 years. The total fair value of stock options that vested during fiscal 2017 was $5.5 million.
Restricted stock and RSUs are granted at a value equal to the market price of our common stock on the date of grant. Restrictions lapse with regard to restricted stock, and RSUs are settled in shares, at the end of their vesting periods, which generally range from one to four years.
The following table presents a summary of our restricted stock and RSU activity as of and for the fiscal year ended May 28, 2017:
Shares (in millions) | Weighted-Average Grant Date Fair Value Per Share | ||
Outstanding beginning of period | 0.11 | $55.46 | |
Shares granted | 0.12 | 57.64 | |
Shares vested | (0.03) | 52.30 | |
Shares canceled | (0.01) | 53.26 | |
Outstanding end of period | 0.19 | $57.44 | |
As of May 28, 2017, there was $5.2 million of unrecognized compensation cost related to unvested restricted stock and RSUs granted under our stock plans. This cost is expected to be recognized over a weighted-average period of 2.2 years. The total
78
NOTES TO CONSOLIDATED FINANCIAL STATEMENTS (continued)
fair value of restricted stock and RSUs that vested during fiscal 2017, 2016 and 2015 was $1.7 million, $1.6 million and $4.8 million, respectively.
Darden stock units are granted at a value equal to the market price of our common stock on the date of grant and will be settled in cash at the end of their vesting periods, which range between four and five years, at the then market price of our common stock. Compensation expense is measured based on the market price of our common stock each period, is amortized over the vesting period and the vested portion is carried as a liability on our accompanying consolidated balance sheets. We also entered into equity forward contracts to hedge the risk of changes in future cash flows associated with the unvested, unrecognized Darden stock units granted (see Note 8 for additional information).
The following table presents a summary of our Darden stock unit activity as of and for the fiscal year ended May 28, 2017:
(All units settled in cash) | Units (in millions) | Weighted-Average Fair Value Per Unit | |
Outstanding beginning of period | 1.43 | $67.48 | |
Units granted | 0.31 | 59.66 | |
Units vested | (0.29) | 63.15 | |
Units canceled | (0.10) | 51.19 | |
Outstanding end of period | 1.35 | $87.95 | |
As of May 28, 2017, our total Darden stock unit liability was $65.0 million, including $24.0 million recorded in other current liabilities and $41.0 million recorded in other liabilities on our consolidated balance sheets. As of May 29, 2016, our total Darden stock unit liability was $50.7 million, including $17.1 million recorded in other current liabilities and $33.6 million recorded in other liabilities on our consolidated balance sheets.
Based on the value of our common stock as of May 28, 2017, there was $35.1 million of unrecognized compensation cost related to Darden stock units granted under our incentive plans. This cost is expected to be recognized over a weighted-average period of 2.7 years. The total fair value of Darden stock units that vested during fiscal 2017 was $18.4 million.
The following table presents a summary of our cash-settled performance stock unit activity as of and for the fiscal year ended May 28, 2017:
(All units settled in cash) | Units (in millions) | Weighted-Average Fair Value Per Unit | |
Outstanding beginning of period | 0.21 | $67.48 | |
Units vested | (0.11) | 61.51 | |
Units canceled | (0.03) | 42.19 | |
Performance unit adjustment | 0.02 | 40.47 | |
Outstanding end of period | 0.09 | $87.95 | |
As of May 28, 2017, our cash-settled performance stock unit liability was $7.5 million, and was recorded in other current liabilities on our consolidated balance sheets. As of May 29, 2016, our cash-settled performance stock unit liability was $10.4 million, including $7.1 million recorded in other current liabilities and $3.3 million recorded in other liabilities on our consolidated balance sheets.
Cash-settled performance stock units cliff vest three years from the date of grant, where 0.0 percent to 150.0 percent of the entire grant is earned or forfeited at the end of three years. The number of units that actually vests will be determined for each year based on the achievement of Company performance criteria set forth in the award agreement and may range from 0.0 percent to 150.0 percent of the annual target. All awards will be settled in cash. The awards are measured based on the market price of our common stock each period, are amortized over the service period and the vested portion is carried as a liability in our accompanying consolidated balance sheets. As of May 28, 2017, there was $0.5 million of unrecognized compensation cost related to unvested performance stock units granted under our stock plans. This cost is expected to be recognized over a weighted-average period of 0.2 years. The total fair value of cash-settled performance stock units that vested in fiscal 2017 was $6.6 million.
79
NOTES TO CONSOLIDATED FINANCIAL STATEMENTS (continued)
The following table presents a summary of our equity-settled performance stock unit activity as of and for the fiscal year ended May 28, 2017:
Units (in millions) | Weighted-Average Grant Date Fair Value Per Unit | ||
Outstanding beginning of period | 0.17 | $65.21 | |
Units granted | 0.19 | 60.05 | |
Units canceled | (0.03) | 63.84 | |
Outstanding end of period | 0.33 | $62.40 | |
Beginning in fiscal 2016, cash-settled performance awards were replaced with two new types of equity-settled performance-based restricted stock units, where 0.0 percent to 150.0 percent of the entire grant is earned or forfeited at the end of the respective vesting periods, which range from three to four years. The number of units that actually vest will be determined based on the achievement of performance criteria set forth in the award agreements and may range from 0.0 percent to 150.0 percent of target. A portion of these performance awards, which will vest based on the achievement of company-specific targets, are measured based on a value equal to the market price of our common stock on the date of grant, and amortized over the service period. The other portion of these awards, which will vest based on the achievement of market-based targets, are measured based on estimated fair value as of the date of grant using a Monte Carlo simulation, and amortized over the service period. As of May 28, 2017, there was $12.6 million of unrecognized compensation cost related to unvested equity-settled performance stock units granted under our stock plans. This cost is expected to be recognized over a weighted-average period of 2.3 years. None of these equity-settled performance stock units vested during fiscal 2017.
We maintain an Employee Stock Purchase Plan to provide eligible employees who have completed one year of service (excluding senior officers subject to Section 16(b) of the Securities Exchange Act of 1934, and certain other employees who are employed less than full time or own 5 percent or more of our capital stock or that of any subsidiary) an opportunity to invest up to $5.0 thousand per calendar quarter to purchase shares of our common stock, subject to certain limitations. Under the plan, up to an aggregate of 3.6 million shares are available for purchase by employees at a purchase price that is 85.0 percent of the fair market value of our common stock on either the first or last trading day of each calendar quarter, whichever is lower. Cash received from employees pursuant to the plan during fiscal 2017, 2016 and 2015 was $5.2 million, $4.8 million and $5.2 million, respectively.
NOTE 16 - COMMITMENTS AND CONTINGENCIES
As collateral for performance on contracts and as credit guarantees to banks and insurers, we were contingently liable for guarantees of subsidiary obligations under standby letters of credit. At May 28, 2017 and May 29, 2016, we had $127.5 million and $116.5 million, respectively, of standby letters of credit related to workers’ compensation and general liabilities accrued in our consolidated financial statements. At May 28, 2017 and May 29, 2016, we had $10.6 million and $8.4 million, respectively, of standby letters of credit related to contractual operating lease obligations and other payments. All standby letters of credit are renewable annually.
At May 28, 2017 and May 29, 2016, we had $163.2 million and $154.2 million, respectively, of guarantees associated with leased properties that have been assigned to third parties. These amounts represent the maximum potential amount of future payments under the guarantees. The fair value of these potential payments discounted at our weighted-average cost of capital at May 28, 2017 and May 29, 2016, amounted to $137.6 million and $119.3 million, respectively. We did not record a liability for the guarantees, as the likelihood of the third parties defaulting on the assignment agreements was deemed to be remote. In the event of default by a third party, the indemnity and default clauses in our assignment agreements govern our ability to recover from and pursue the third party for damages incurred as a result of its default. We do not hold any third-party assets as collateral related to these assignment agreements, except to the extent that the assignment allows us to repossess the building and personal property. These guarantees expire over their respective lease terms, which range from fiscal 2018 through fiscal 2028.
We are subject to private lawsuits, administrative proceedings and claims that arise in the ordinary course of our business. A number of these lawsuits, proceedings and claims may exist at any given time. These matters typically involve claims from guests, employees and others related to operational issues common to the restaurant industry, and can also involve infringement of, or challenges to, our trademarks. While the resolution of a lawsuit, proceeding or claim may have an impact on our financial results for the period in which it is resolved, we believe that the final disposition of the lawsuits, proceedings and claims in which
80
NOTES TO CONSOLIDATED FINANCIAL STATEMENTS (continued)
we are currently involved, either individually or in the aggregate, will not have a material adverse effect on our financial position, results of operations or liquidity.
NOTE 17 – SUBSEQUENT EVENT
On June 26, 2017, the Board of Directors declared a cash dividend of $0.63 per share to be paid August 1, 2017 to all shareholders of record as of the close of business on July 10, 2017.
81
NOTES TO CONSOLIDATED FINANCIAL STATEMENTS (continued)
NOTE 18 - QUARTERLY DATA (UNAUDITED)
The following table summarizes unaudited quarterly data for fiscal 2017 and fiscal 2016:
Fiscal 2017 - Quarters Ended | |||||||||||||||||||
(in millions, except per share data) | Aug. 28 | Nov. 27 | Feb. 26 | May 28 | Total | ||||||||||||||
Sales | $ | 1,714.4 | $ | 1,642.5 | $ | 1,878.7 | $ | 1,934.6 | $ | 7,170.2 | |||||||||
Earnings before income taxes | 151.4 | 107.0 | 220.2 | 158.7 | 637.3 | ||||||||||||||
Earnings from continuing operations | 111.1 | 79.7 | 166.3 | 125.4 | 482.5 | ||||||||||||||
Losses from discontinued operations, net of tax | (0.9 | ) | (0.2 | ) | (0.7 | ) | (1.6 | ) | (3.4 | ) | |||||||||
Net earnings | 110.2 | 79.5 | 165.6 | 123.8 | 479.1 | ||||||||||||||
Basic net earnings per share: | |||||||||||||||||||
Earnings from continuing operations | 0.89 | 0.65 | 1.34 | 1.00 | 3.88 | ||||||||||||||
Losses from discontinued operations | (0.01 | ) | — | (0.01 | ) | (0.01 | ) | (0.03 | ) | ||||||||||
Net earnings | 0.88 | 0.65 | 1.33 | 0.99 | 3.85 | ||||||||||||||
Diluted net earnings per share: | |||||||||||||||||||
Earnings from continuing operations | 0.88 | 0.64 | 1.32 | 0.99 | 3.83 | ||||||||||||||
Losses from discontinued operations | (0.01 | ) | — | — | (0.01 | ) | (0.03 | ) | |||||||||||
Net earnings | 0.87 | 0.64 | 1.32 | 0.98 | 3.80 | ||||||||||||||
Dividends paid per share | 0.56 | 0.56 | 0.56 | 0.56 | 2.24 | ||||||||||||||
Stock price: | |||||||||||||||||||
High | 68.68 | 74.99 | 79.43 | 89.14 | 89.14 | ||||||||||||||
Low | 59.50 | 60.16 | 71.02 | 73.81 | 59.50 | ||||||||||||||
Fiscal 2016 - Quarters Ended | |||||||||||||||||||
(in millions, except per share data) | Aug. 30 | Nov. 29 | Feb. 28 | May 29 | Total | ||||||||||||||
Sales | $ | 1,687.0 | $ | 1,608.8 | $ | 1,847.5 | $ | 1,790.2 | $ | 6,933.5 | |||||||||
Earnings before income taxes | 111.8 | 24.4 | 138.1 | 175.4 | 449.7 | ||||||||||||||
Earnings from continuing operations | 81.0 | 30.1 | 108.2 | 140.4 | 359.7 | ||||||||||||||
Earnings (loss) from discontinued operations, net of tax | 5.4 | 13.1 | (2.4 | ) | (0.8 | ) | 15.3 | ||||||||||||
Net earnings | 86.4 | 43.2 | 105.8 | 139.6 | 375.0 | ||||||||||||||
Basic net earnings per share: | |||||||||||||||||||
Earnings from continuing operations | 0.64 | 0.23 | 0.85 | 1.11 | 2.82 | ||||||||||||||
Earnings (loss) from discontinued operations | 0.04 | 0.11 | (0.02 | ) | (0.01 | ) | 0.12 | ||||||||||||
Net earnings | 0.68 | 0.34 | 0.83 | 1.10 | 2.94 | ||||||||||||||
Diluted net earnings per share: | |||||||||||||||||||
Earnings from continuing operations | 0.63 | 0.23 | 0.84 | 1.10 | 2.78 | ||||||||||||||
Earnings (loss) from discontinued operations | 0.04 | 0.10 | (0.02 | ) | (0.01 | ) | 0.12 | ||||||||||||
Net earnings | 0.67 | 0.33 | 0.82 | 1.09 | 2.90 | ||||||||||||||
Dividends paid per share | 0.55 | 0.55 | 0.50 | 0.50 | 2.10 | ||||||||||||||
Stock price: | |||||||||||||||||||
High | 75.60 | 72.11 | 64.90 | 68.62 | 75.60 | ||||||||||||||
Low | 63.68 | 53.38 | 55.01 | 61.90 | 53.38 | ||||||||||||||
82
Item 9. | CHANGES IN AND DISAGREEMENTS WITH ACCOUNTANTS ON ACCOUNTING AND FINANCIAL DISCLOSURE |
There were no changes in or disagreements with accountants on accounting and financial disclosure requiring disclosure under this Item.
Item 9A. CONTROLS AND PROCEDURES
Under the supervision and with the participation of our management, including our Chief Executive Officer and our Chief Financial Officer, we evaluated the effectiveness of the design and operation of our disclosure controls and procedures (as defined in Rule 13a-15(e) under the Securities Exchange Act of 1934 (the Exchange Act) as of May 28, 2017, the end of the period covered by this report. Based on that evaluation, the Chief Executive Officer and Chief Financial Officer concluded that our disclosure controls and procedures were effective as of May 28, 2017.
During the fiscal quarter ended May 28, 2017, there was no change in our internal control over financial reporting (as defined in Rule 13a-15(f) under the Exchange Act) that has materially affected, or is reasonably likely to materially affect, our internal control over financial reporting.
The annual report of our management on internal control over financial reporting, and the audit report of KPMG LLP, our independent registered public accounting firm, regarding our internal control over financial reporting are included in this Annual Report under the caption “Item 8 - Financial Statements and Supplementary Data.”
Item 9B. OTHER INFORMATION
None.
PART III
Item 10. | DIRECTORS, EXECUTIVE OFFICERS AND CORPORATE GOVERNANCE |
The information contained in the sections entitled “Proposal 1 – Election of Eight Directors From the Named Director Nominees,” “Meetings of the Board of Directors and Its Committees,” “Corporate Governance and Board Administration” and “Section 16(a) Beneficial Ownership Reporting Compliance” in our definitive Proxy Statement for our 2017 Annual Meeting of Shareholders is incorporated herein by reference. Information regarding executive officers is contained in Part I above under the heading “Executive Officers of the Registrant.”
All of our employees are subject to our Code of Business Conduct and Ethics. Appendix A to the Code provides a special Code of Ethics with additional provisions that apply to our principal executive officer, principal financial officer, principal accounting officer or controller, and persons performing similar functions (the Senior Financial Officers). Appendix B to the Code provides a Code of Business Conduct and Ethics for members of our Board of Directors. These documents are posted on our internet website at www.darden.com and are available in print free of charge to any shareholder who requests them. We will disclose any amendments to or waivers of these Codes for directors, executive officers or Senior Financial Officers on our website.
We also have adopted a set of Corporate Governance Guidelines and charters for all of our Board committees: the Audit Committee, which was established in accordance with Section 5(a)(58)(A) of the Exchange Act, Compensation Committee, Nominating and Governance Committee and Finance Committee. The Corporate Governance Guidelines and committee charters are available on our website at www.darden.com under the Investor Relations - Corporate Governance tab and in print free of charge to any shareholder who requests them. Written requests for our Code of Business Conduct and Ethics, Corporate Governance Guidelines and committee charters should be addressed to Darden Restaurants, Inc., 1000 Darden Center Drive, Orlando, Florida 32837, Attention: Corporate Secretary.
Item 11. | EXECUTIVE COMPENSATION |
The information contained in the sections entitled “Director Compensation,” “Executive Compensation,” “Compensation Discussion and Analysis,” “Compensation Committee Report” and “Corporate Governance and Board Administration” in our definitive Proxy Statement for our 2017 Annual Meeting of Shareholders is incorporated herein by reference.
83
Item 12. | SECURITY OWNERSHIP OF CERTAIN BENEFICIAL OWNERS AND MANAGEMENT AND RELATED STOCKHOLDER MATTERS |
The information contained in the sections entitled “Stock Ownership of Principal Shareholders,” “Stock Ownership of Management” and “Equity Compensation Plan Information” in our definitive Proxy Statement for our 2017 Annual Meeting of Shareholders is incorporated herein by reference.
Item 13. | CERTAIN RELATIONSHIPS AND RELATED TRANSACTIONS, AND DIRECTOR INDEPENDENCE |
The information contained in the sections entitled “Related Party Transactions,” “Meetings of the Board of Directors and Its Committees” and “Corporate Governance and Board Administration” in our definitive Proxy Statement for our 2017 Annual Meeting of Shareholders is incorporated herein by reference.
Item 14. | PRINCIPAL ACCOUNTANT FEES AND SERVICES |
The information contained in the section entitled “Independent Registered Public Accounting Firm Fees and Services” in our definitive Proxy Statement for our 2017 Annual Meeting of Shareholders is incorporated herein by reference.
PART IV
Item 15. | EXHIBITS AND FINANCIAL STATEMENT SCHEDULES |
(a) | Documents filed as part of this report: |
1. Financial Statements: | |
All financial statements. See Index to Consolidated Financial Statements in Item 8 of this Annual Report on Form 10-K. | |
2. Financial Statement Schedules: | |
Not applicable. | |
3. Exhibits: | |
The exhibits listed in the accompanying Exhibit Index are filed as part of this Form 10-K and incorporated herein by reference. Pursuant to Item 601(b)(4)(iii) of Regulation S-K, copies of certain instruments defining the rights of holders of certain of our long-term debt are not filed, and in lieu thereof, we agree to furnish copies thereof to the Securities and Exchange Commission upon request. The Exhibit Index specifically identifies with an asterisk each management contract or compensatory plan or arrangement required to be filed as an exhibit to this Form 10-K. We will furnish copies of any exhibit listed on the Exhibit Index upon request upon the payment of a reasonable fee to cover our expenses in furnishing such exhibits.
84
SIGNATURES
Pursuant to the requirements of Section 13 or 15(d) of the Securities Exchange Act of 1934, the Registrant has duly caused this report to be signed on its behalf by the undersigned, thereunto duly authorized.
Date: | July 21, 2017 | DARDEN RESTAURANTS, INC. | |||
By: | /s/ Eugene I. Lee, Jr. | ||||
Eugene I. Lee, Jr., President and Chief Executive Officer | |||||
Pursuant to the requirements of the Securities Exchange Act of 1934, this report has been signed below by the following persons on behalf of the Registrant and in the capacities and on the dates indicated.
Signature | Title | Date | ||
/s/ Eugene I. Lee, Jr. | Director, President and Chief Executive Officer (Principal executive officer) | July 21, 2017 | ||
Eugene I. Lee, Jr. | ||||
/s/ Ricardo Cardenas | Senior Vice President, Chief Financial Officer (Principal financial officer) | July 21, 2017 | ||
Ricardo Cardenas | ||||
/s/ John W. Madonna | Senior Vice President, Corporate Controller (Principal accounting officer) | July 21, 2017 | ||
John W. Madonna | ||||
/s/ Margaret Shan Atkins* | Director | |||
Margaret Shan Atkins | ||||
/s/ Bradley D. Blum* | Director | |||
Bradley D. Blum | ||||
/s/ James P. Fogarty* | Director | |||
James P. Fogarty | ||||
/s/ Cynthia T. Jamison* | Director | |||
Cynthia T. Jamison | ||||
/s/ Nana Mensah* | Director | |||
Nana Mensah | ||||
/s/ William S. Simon* | Director | |||
William S. Simon | ||||
/s/ Charles M. Sonsteby* | Chairman of the Board and Director | |||
Charles M. Sonsteby | ||||
*By: | /s/ Anthony G. Morrow | ||
Anthony G. Morrow, Attorney-In-Fact | |||
July 21, 2017 | |||
85
EXHIBIT INDEX | ||
Exhibit Number | Title | |
2.1 | Separation and Distribution Agreement, dated as of October 21, 2015, by and between Darden Restaurants, Inc. and Four Corners Property Trust, Inc. (incorporated by reference to Exhibit 2.1 to our Current Report on Form 8-K filed October 21, 2015). | |
2.2 | Agreement and Plan of Merger dated March 27, 2017, among Darden Restaurants, Inc., Continental Merger Sub, Inc., Cheddar’s Restaurant Holding Corp. and Shareholder Representative Services LLC, as agent of the Equityholders. (incorporated by reference to Exhibit 2.1 to our Current Report on Form 8-K filed March 28, 2017). | |
3.1 | Amended and Restated Articles of Incorporation effective June 29, 2016 (incorporated by reference to Exhibit 3.1 to our Current Report on Form 8-K filed July 5, 2016). | |
3.2 | Bylaws as amended effective June 29, 2016 (incorporated by reference to Exhibit 3.2 to our Current Report on Form 8-K filed July 5, 2016). | |
4.1 | Indenture dated as of January 1, 1996, between Darden Restaurants, Inc. and Wells Fargo Bank, National Association (as successor to Wells Fargo Bank Minnesota, National Association, formerly known as Norwest Bank Minnesota, National Association) (incorporated by reference to Exhibit 4.1 to our Registration Statement on Form S-3 (Commission File No. 333-146582) filed October 9, 2007). | |
4.2 | Officers’ Certificate and Authentication Order, dated August 9, 2005, for the 6.000% Senior Notes due 2035 (which includes the form of Note) issued pursuant to the Indenture dated as of January 1, 1996, between Darden Restaurants, Inc. and Wells Fargo Bank, National Association (as successor to Wells Fargo Bank Minnesota, National Association, formerly known as Norwest Bank Minnesota, National Association), as Trustee (incorporated by reference to Exhibit 4.1 to our Current Report on Form 8-K filed August 11, 2005). | |
4.3 | Officers’ Certificate and Authentication Order, dated October 10, 2007, for the 6.800% Senior Notes due 2037 (which includes the form of Note) issued pursuant to the Indenture dated as of January 1, 1996, between Darden Restaurants, Inc. and Wells Fargo Bank, National Association (as successor to Wells Fargo Bank Minnesota, National Association, formerly known as Norwest Bank Minnesota, National Association), as Trustee (incorporated by reference to Exhibit 4.3 to our Current Report on Form 8-K filed October 16, 2007). | |
4.4. | Officers’ Certificate and Authentication Order dated April 18, 2017 for the 3.850% Senior Notes due 2027 (which includes the form of Note) issued pursuant to the Indenture dated as of January 1, 1996, between the Company and Wells Fargo Bank, National Association (as successor to Wells Fargo Bank Minnesota, National Association, formerly known as Norwest Bank Minnesota, National Association), as Trustee. (incorporated by reference to Exhibit 4.1 to our Amendment to Current Report on Form 8-K/A dated April 18, 2017. | |
*10.1 | Amended and Restated Darden Restaurants, Inc. Benefits Trust Agreement dated as of March 23, 2011, between Darden Restaurants, Inc. and Wells Fargo Bank, National Association (as successor to Wells Fargo Bank Minnesota, National Association, formerly known as Norwest Bank Minnesota, National Association) (incorporated by reference to Exhibit 10 to our Quarterly Report on Form 10-Q for the fiscal quarter ended February 27, 2011). | |
*10.2 | Darden Restaurants, Inc. 2002 Stock Incentive Plan, as amended (incorporated by reference to Exhibit 10 to our Current Report on Form 8-K filed September 20, 2013). | |
10.3 | Credit Agreement, dated as of October 3, 2011, among Darden Restaurants, Inc., certain lenders party thereto and Bank of America, N.A., as administrative agent (incorporated by reference to Exhibit 10.1 to our Current Report on Form 8-K filed October 3, 2011). | |
10.4 | First Amendment to Credit Agreement, dated as of October 24, 2013, among Darden Restaurants, Inc., certain lenders party thereto and Bank of America, N.A., as administrative agent (incorporated by reference to Exhibit 10.1 to our Current Report on Form 8-K filed October 30, 2013). | |
*10.5 | Form of Non-Qualified Stock Option Award Agreement under the Darden Restaurants, Inc. 2002 Stock Incentive Plan, as amended (incorporated by reference to Exhibit 10(o) to our Annual Report on Form 10-K for the fiscal year ended May 31, 2009). | |
*10.6 | Employment Agreement dated April 28, 2003 between RARE Hospitality International, Inc. and Eugene I. Lee, Jr. (incorporated by reference to Exhibit 10.2 to the RARE Hospitality International, Inc. Quarterly Report on Form 10-Q (Commission File No. 0-19924) for the fiscal quarter ended June 29, 2003). | |
*10.7 | First Amendment of Employment Agreement dated October 27, 2004 between RARE Hospitality International, Inc. and Eugene I. Lee, Jr. (incorporated by reference to Exhibit 10.2 to the RARE Hospitality International, Inc. Quarterly Report on Form 10-Q (Commission File No. 0-19924) for the fiscal quarter ended September 26, 2004). | |
86
*10.8 | Second Amendment of Employment Agreement, dated October 27, 2005 between RARE Hospitality International, Inc. and Eugene I. Lee, Jr. (incorporated by reference to Exhibit 10.2 to the RARE Hospitality International, Inc. Quarterly Report on Form 10-Q (Commission File No. 0-19924) for the fiscal quarter ended September 25, 2005). | |
*10.9 | Third Amendment of Employment Agreement, dated October 27, 2006 between RARE Hospitality International, Inc. and Eugene I. Lee, Jr. (incorporated by reference to Exhibit 10.2 to the RARE Hospitality International, Inc. Quarterly Report on Form 10-Q (Commission File No. 0-19924) for the fiscal quarter ended October 1, 2006). | |
*10.10 | Fourth Amendment of Employment Agreement, dated December 15, 2006 between RARE Hospitality International, Inc. and Eugene I. Lee, Jr. (incorporated by reference to Exhibit 10(24) to the RARE Hospitality International, Inc. Annual Report filed on Form 10-K (Commission File No. 0-19924) for fiscal year ended December 31, 2006). | |
*10.11 | Letter Agreement, dated August 16, 2007, between us and Eugene I. Lee, Jr. (incorporated by reference to Exhibit (e)(22) to the RARE Hospitality International, Inc. Schedule 14D-9 (Commission File No. 0-19924) filed August 31, 2007). | |
*10.12 | RARE Hospitality International, Inc. Amended and Restated 2002 Long-Term Incentive Plan, as amended (incorporated by reference to Exhibit 10(aa) to our Annual Report on Form 10-K for the fiscal year ended May 31, 2009). | |
*10.13 | Form of Non-Qualified Stock Option Award Agreement under the RARE Hospitality International, Inc. Amended and Restated 2002 Long-Term Incentive Plan, as amended (incorporated by reference to Exhibit 10(bb) to our Annual Report on Form 10-K for the fiscal year ended May 31, 2009). | |
*10.14 | Form of Performance Stock Units Award Agreement under the Darden Restaurants, Inc. 2002 Stock Incentive Plan, as amended (incorporated by reference to Exhibit 10(kk) to our Annual Report on Form 10-K for the fiscal year ended May 31, 2015). | |
*10.15 | Form of Performance Stock Units Award Agreement under the Darden Restaurants, Inc. 2002 Stock Incentive Plan, as amended (incorporated by reference to Exhibit 10(ll) to our Annual Report on Form 10-K for the fiscal year ended May 31, 2015). | |
*10.16 | Form of annual Non-employee Director Restricted Stock Units Award Agreement under the Darden Restaurants, Inc. 2002 Stock Incentive Plan, as amended (incorporated by reference to Exhibit 10(mm) to our Annual Report on Form 10-K for the fiscal year ended May 31, 2015). | |
*10.17 | Form of initial Non-employee Director Restricted Stock Units Award Agreement under the Darden Restaurants, Inc. 2002 Stock Incentive Plan, as amended (incorporated by reference to Exhibit 10(nn) to our Annual Report on Form 10-K for the fiscal year ended May 31, 2015). | |
*10.18 | Form of quarterly Non-employee Director Restricted Stock Units Award Agreement under the Darden Restaurants, Inc. 2002 Stock Incentive Plan, as amended (incorporated by reference to Exhibit 10(oo) to our Annual Report on Form 10-K for the fiscal year ended May 31, 2015). | |
*10.19 | Form of annual Non-employee Director Stock Option Award Agreement under the Darden Restaurants, Inc. 2002 Stock Incentive Plan, as amended (incorporated by reference to Exhibit 10(pp) to our Annual Report on Form 10-K for the fiscal year ended May 31, 2015). | |
*10.20 | Form of initial Non-employee Director Stock Option Award Agreement under the Darden Restaurants, Inc. 2002 Stock Incentive Plan, as amended (incorporated by reference to Exhibit 10(qq) to our Annual Report on Form 10-K for the fiscal year ended May 31, 2015). | |
*10.21 | Form of Change in Control Agreement (incorporated by reference to Exhibit 10(rr) to our Annual Report on Form 10-K for the fiscal year ended May 31, 2015). | |
*10.22 | Form of Restricted Stock Units Award Agreement under the Darden Restaurants, Inc. 2002 Stock Incentive Plan, as amended (incorporated by reference to Exhibit 10(ss) to our Annual Report on Form 10-K for the fiscal year ended May 31, 2015). | |
*10.23 | Form of Performance Restricted Stock Unit Award Agreement under the Darden Restaurants, Inc. 2002 Stock Incentive Plan, as amended (incorporated by reference to Exhibit 10.11 to our Quarterly Report on Form 10-Q for the fiscal quarter ended August 30. 2015). | |
*10.24 | Form of Non-Qualified Stock Option Agreement under the Darden Restaurants, Inc. 2002 Stock Incentive Plan, as amended (incorporated by reference to Exhibit 10.12 to our Quarterly Report on Form 10-Q for the fiscal quarter ended August 30, 2015). | |
*10.25 | Darden Restaurants, Inc. 2015 Omnibus Incentive Plan (incorporated by reference to Exhibit 10.1 to our Current Report on Form 8-K filed September 22, 2015). | |
87
*10.26 | Form of Nonqualified Stock Option Award Agreement under the Darden Restaurants, Inc. 2015 Omnibus Incentive Plan (incorporated by reference to Exhibit 10.13 to our Quarterly Report on Form 10-Q for the fiscal quarter ended August 30, 2015). | |
*10.27 | Form of Restricted Stock Unit Award Agreement for Non-Employee Directors (Quarterly Grant in Lieu of Cash Retainer) under the Darden Restaurants, Inc. 2015 Omnibus Incentive Plan (incorporated by reference to Exhibit 10.14 to our Quarterly Report on Form 10-Q for the fiscal quarter ended August 30, 2015). | |
*10.28 | Form of Restricted Stock Unit Award Agreement for Non-Employee Directors under the Darden Restaurants, Inc. 2015 Omnibus Incentive Plan (incorporated by reference to Exhibit 10.15 to our Quarterly Report on Form 10-Q for the fiscal quarter ended August 30, 2015). | |
*10.29 | Form of Performance Stock Unit Award Agreement (United States) under the Darden Restaurants, Inc. 2015 Omnibus Incentive Plan (incorporated by reference to Exhibit 10.16 to our Quarterly Report on Form 10-Q for the fiscal quarter ended August 30, 2015). | |
*10.30 | Release Letter Agreement between Valerie L. Insignares and Darden Restaurants, Inc. executed September 2, 2015 (incorporated by reference to Exhibit 10.1 to our Quarterly Report on Form 10-Q for the fiscal quarter ended November 29, 2015). | |
*10.31 | Form of Restricted Stock Unit Award Agreement under the Darden Restaurants, Inc. 2015 Omnibus Incentive Plan. (incorporated by reference to Exhibit 10.49 to our Annual Report on Form 10-K for the fiscal year ending May 29, 2016). | |
*10.32 | Form of Restricted Stock Unit Award Agreement for Todd Burrowes under the Darden Restaurants, Inc. 2002 Stock Incentive Plan. (incorporated by reference to Exhibit 10.50 to our Annual Report on Form 10-K for the fiscal year ending May 29, 2016). | |
*10.33 | Form of Restricted Stock Award Agreement for Officers under the Darden Restaurants, Inc. 2002 Stock Incentive Plan. (incorporated by reference to Exhibit 10.51 to our Annual Report on Form 10-K for the fiscal year ending May 29, 2016). | |
*10.34 | Agreement, dated March 8, 2016, between Darden Restaurants, Inc. and Harald Herrmann. (incorporated by reference to Exhibit 10.52 to our Annual Report on Form 10-K for the fiscal year ending May 29, 2016). | |
*10.35 | Agreement, dated April 6, 2016, between Darden Restaurants, Inc. and Jeffrey A. Davis. (incorporated by reference to Exhibit 10.53 to our Annual Report on Form 10-K for the fiscal year ending May 29, 2016). | |
*10.36 | Form of Nonqualified Stock Option Award Agreement under the Darden Restaurants, Inc. 2015 Omnibus Incentive Plan. (incorporated by reference to Exhibit 10.54 to our Annual Report on Form 10-K for the fiscal year ending May 29, 2016). | |
*10.37 | Form of Performance Stock Unit Award Agreement (United States) under the Darden Restaurants, Inc. 2015 Omnibus Incentive Plan. (incorporated by reference to Exhibit 10.55 to our Annual Report on Form 10-K for the fiscal year ending May 29, 2016). | |
*10.38 | Form of Restricted Stock Unit Award Agreement (United States) under the Darden Restaurants, Inc. 2015 Omnibus Incentive Plan. (incorporated by reference to Exhibit 10.56 to our Annual Report on Form 10-K for the fiscal year ending May 29, 2016). | |
*10.39 | Form of Restricted Stock Unit Award Agreement for Non-Employee Directors under the Darden Restaurants, Inc. 2015 Omnibus Incentive Plan. (incorporated by reference to Exhibit 10.58 to our Annual Report on Form 10-K for the fiscal year ending May 29, 2016). | |
*10.40 | Form of Nonqualified Stock Option Award Agreement under the Darden Restaurants, Inc. 2015 Omnibus Incentive Plan. | |
*10.41 | Form of Performance Stock Unit Award Agreement under the Darden Restaurants, Inc. 2015 Omnibus Incentive Plan. | |
*10.42 | Form of Restricted Stock Unit Award Agreement (United States) under the Darden Restaurants, Inc. 2015 Omnibus Incentive Plan. | |
*10.43 | Form of Restricted Stock Award Agreement under the Darden Restaurants, Inc. 2015 Omnibus Incentive Plan. | |
*10.44 | Form of Restricted Stock Unit Award Agreement for Non-Employee Directors under the Darden Restaurants, Inc. 2015 Omnibus Incentive Plan. | |
*10.45 | Special Equity Award Grant Agreement under the Darden Restaurants, Inc. 2015 Omnibus Incentive Plan between the Company and Eugene I. Lee, Jr., dated as of June 29, 2017. | |
*10.46 | Darden Restaurants, Inc. Amended and Restated FlexComp Plan, amended and restated as of June 1, 2017. | |
12 | Computation of Ratio of Consolidated Earnings to Fixed Charges. | |
88
21 | Subsidiaries of Darden Restaurants, Inc. | |
23 | Consent of Independent Registered Public Accounting Firm. | |
24 | Powers of Attorney. | |
31(a) | Certification of Chief Executive Officer pursuant to Section 302 of the Sarbanes-Oxley Act of 2002. | |
31(b) | Certification of Chief Financial Officer pursuant to Section 302 of the Sarbanes-Oxley Act of 2002. | |
32(a) | Certification of Chief Executive Officer pursuant to Section 906 of the Sarbanes-Oxley Act of 2002. | |
32(b) | Certification of Chief Financial Officer pursuant to Section 906 of the Sarbanes-Oxley Act of 2002. | |
101.INS | XBRL Instance Document | |
101.SCH | XBRL Schema Document | |
101.CAL | XBRL Calculation Linkbase Document | |
101.DEF | XBRL Definition Linkbase Document | |
101.LAB | XBRL Label Linkbase Document | |
101.PRE | XBRL Presentation Linkbase Document | |
* Items marked with an asterisk are management contracts or compensatory plans or arrangements required to be filed as an exhibit pursuant to Item 15 of Form 10-K and Item 601(b)(10)(iii)(A) of Regulation S-K.
89