Attached files
| file | filename |
|---|---|
| 8-K - CURRENT REPORT ON FORM 8-K - DELTA AIR LINES, INC. | delta_8k.htm |
Exhibit 99.1
Delta: Delivering Sustainable Results Deutsche Bank Global Industrials and Materials Summit June 7, 2017
2 Safe Harbor Statements in this presentation that are not historical facts, including statements regarding our estimates, expectations, be lie fs, intentions, projections or strategies for the future, may be "forward - looking statements" as defined in the Private Securities L itigation Reform Act of 1995. All forward - looking statements involve a number of risks and uncertainties that could cause actual results t o differ materially from the estimates, expectations, beliefs, intentions, projections and strategies reflected in or suggested by the fo rward - looking statements. These risks and uncertainties include, but are not limited to, the effects of terrorist attacks or geopo lit ical conflict; the cost of aircraft fuel; the impact of fuel hedging activity including rebalancing our hedge portfolio, recording mark - to - mark et adjustments or posting collateral in connection with our fuel hedge contracts; the availability of aircraft fuel; the perform anc e of our significant investments in airlines in other parts of the world; the possible effects of accidents involving our aircraft; th e r estrictions that financial covenants in our financing agreements could have on our financial and business operations; labor issues; interrupti ons or disruptions in service at one of our hub or gateway airports; breaches or security lapses in our information technology syste ms; disruptions in our information technology infrastructure; our dependence on technology in our operations; the effects of weat her , natural disasters and seasonality on our business; the effects of an extended disruption in services provided by third party reg ional carriers; failure or inability of insurance to cover a significant liability at Monroe’s Trainer refinery; the impact of envi ron mental regulation on the Trainer refinery, including costs related to renewable fuel standard regulations; our ability to retain man age ment and key employees; competitive conditions in the airline industry; the effects of extensive government regulation on our business ; t he sensitivity of the airline industry to prolonged periods of stagnant or weak economic conditions; uncertainty in economic con dit ions and regulatory environment in the United Kingdom related to the likely exit of the United Kingdom from the European Union; an d t he effects of the rapid spread of contagious illnesses. Additional information concerning risks and uncertainties that could cause differences between actual results and forward - lookin g statements is contained in our Securities and Exchange Commission filings, including our Annual Report on Form 10 - K for the fisc al year ended December 31, 2016. Caution should be taken not to place undue reliance on our forward - looking statements, which represent our views only as of June 7, 2017, and which we have no current intention to update.
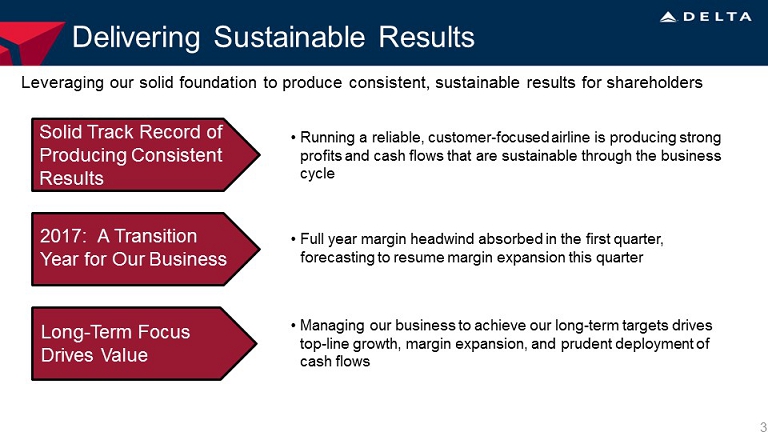
Delivering Sustainable Results Solid Track Record of Producing Consistent Results 2017: A Transition Year for Our Business Long - Term Focus Drives Value Leveraging our solid foundation to produce consistent, sustainable results for shareholders • Running a reliable, customer - focused airline is producing strong profits and cash flows that are sustainable through the business cycle • Managing our business to achieve our long - term targets drives top - line growth, margin expansion, and prudent deployment of cash flows • Full year margin headwind absorbed in the first quarter, forecasting to resume margin expansion this quarter 3
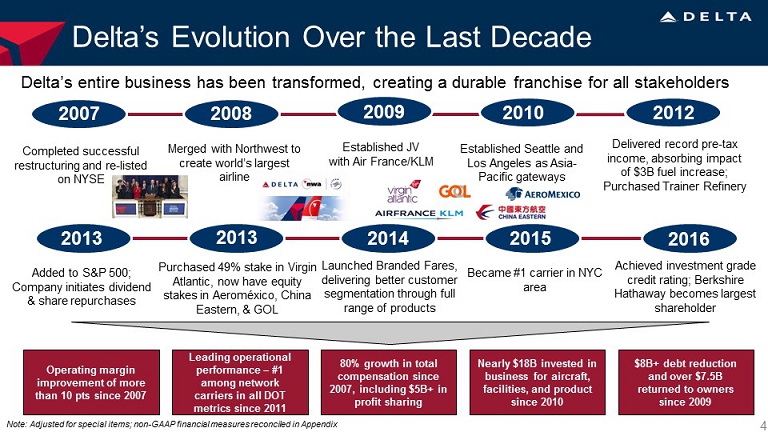
Delta’s Evolution Over the Last Decade Delta’s entire business has been transformed, creating a durable franchise for all stakeholders 4 2007 Completed successful restructuring and re - listed on NYSE 2008 Merged with Northwest to create world’s largest airline 2010 Added to S&P 500; Company initiates dividend & share repurchases 2012 Became #1 carrier in NYC area 2016 Purchased 49% stake in Virgin Atlantic, now have equity stakes in Aeroméxico , China Eastern, & GOL Achieved investment grade credit rating; Berkshire Hathaway becomes largest shareholder 2015 Launched Branded Fares, delivering better customer segmentation through full range of products 2013 2014 Delivered record pre - tax income, absorbing impact of $3B fuel increase; Purchased Trainer Refinery 2009 Established JV with Air France/KLM Established Seattle and Los Angeles as Asia - Pacific gateways 2013 Operating margin improvement of more than 10 pts since 2007 Leading operational performance – #1 among network carriers in all DOT metrics since 2011 80% growth in total compensation since 2007, including $5B+ in profit sharing Nearly $18B invested in business for aircraft, facilities, and product since 2010 $8B+ debt reduction and over $7.5B returned to owners since 2009 Note: Adjusted for special items; non - GAAP financial measures reconciled in Appendix
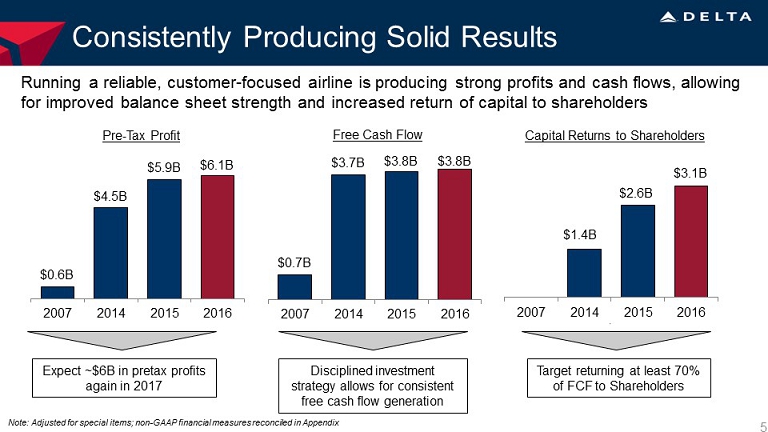
Consistently Producing Solid Results Running a reliable, customer - focused airline is producing strong profits and cash flows, allowing for improved balance sheet strength and increased return of capital to shareholders Expect ~$6B in pretax profits again in 2017 $0.6B $4.5B $5.9B $6.1B 2007 2014 2015 2016 $2.6B 2007 2014 2015 2016 $1.4B 5 Pre - Tax Profit Capital Returns to Shareholders Free Cash Flow Disciplined investment strategy allows for consistent free cash flow generation Target returning at least 70% of FCF to Shareholders Note: Adjusted for special items; non - GAAP financial measures reconciled in Appendix $0.7B $3.7B $3.8B $3.8B 2007 2014 2015 2016 $3.1B
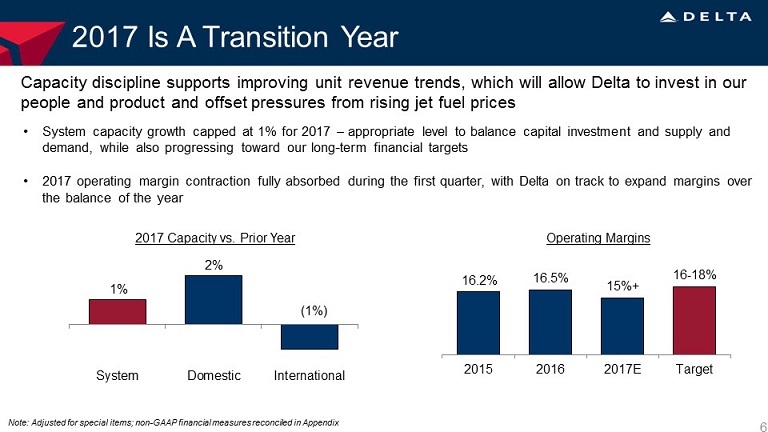
2017 Is A Transition Year • System capacity growth capped at 1% for 2017 – appropriate level to balance capital investment and supply and demand, while also progressing toward our long - term financial targets • 2017 operating margin contraction fully absorbed during the first quarter, with Delta on track to expand margins over the balance of the year Capacity discipline supports improving unit revenue trends, which will allow Delta to invest in our people and product and offset pressures from rising jet fuel prices 6 1% System Domestic International 2% 2017 Capacity vs. Prior Year (1%) Operating Margins 16.2% 16.5% 15%+ 16 - 18% 2015 2016 2017E Target Note: Adjusted for special items; non - GAAP financial measures reconciled in Appendix
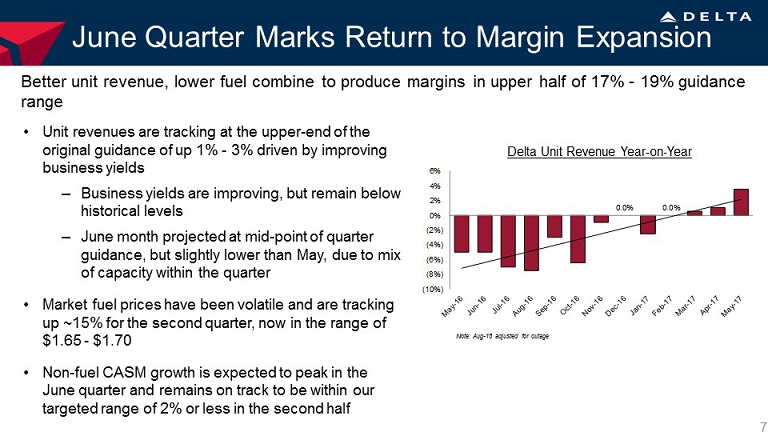
June Quarter Marks Return to Margin Expansion 7 • Unit revenues are tracking at the upper - end of the original guidance of up 1% - 3% driven by improving business yields ‒ Business yields are improving, but remain below historical levels ‒ June month projected at mid - point of quarter guidance, but slightly lower than May, due to mix of capacity within the quarter • Market fuel prices have been volatile and are tracking up ~15% for the second quarter, but slightly below initial forecast of $1.68 - $1.73 • Non - fuel CASM growth is expected to peak in the June quarter and remains on track to be within our targeted range of 2% or less in the second half Better unit revenue, lower fuel combine to produce margins in upper half of 17% - 19% guidance range Delta Unit Revenue Year - on - Year Note: Aug - 16 adjusted for outage 0.0% 0.0% (10%) (8%) (6%) (4%) (2%) 0% 2% 4% 6%
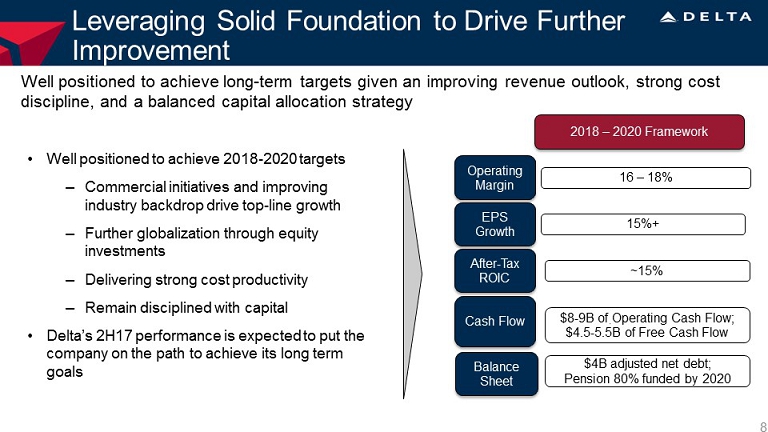
Well positioned to achieve long - term targets given an improving revenue outlook, strong cost discipline, and a balanced capital allocation strategy Operating Margin EPS Growth After - Tax ROIC Cash Flow 2018 – 2020 Framework 16 – 18% 15%+ ~15% $4B adjusted net debt; Pension 80% funded by 2020 $8 - 9B of Operating Cash Flow; $4.5 - 5.5B of Free Cash Flow Balance Sheet • Well positioned to achieve 2018 - 2020 targets – Commercial initiatives and improving industry backdrop drive top - line growth – Further globalization through equity investments – Delivering strong cost productivity – Remain disciplined with capital • Delta’s 2H17 performance is expected to put the company on the path to achieve its long term goals Leveraging Solid Foundation to Drive Further Improvement 8
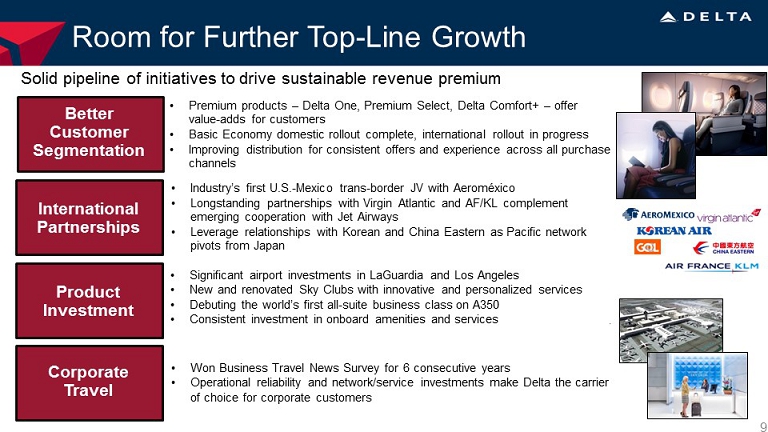
Room for Further Top - Line Growth Solid pipeline of initiatives to drive sustainable revenue premium 9 Better Customer Segmentation International Partnerships Product Investment • Premium products – Delta One, Premium Select, Delta Comfort+ – offer value - adds for customers • Basic Economy domestic rollout complete, international rollout in progress • Improving distribution for consistent offers and experience across all purchase channels • Industry’s first U.S. - Mexico trans - border JV with Aeroméxico • Longstanding partnerships with Virgin Atlantic and AF/KL complement emerging cooperation with Jet Airways • Leverage relationships with Korean and China Eastern as Pacific network pivots from Japan • Significant airport investments in LaGuardia and Los Angeles • New and renovated Sky Clubs with innovative and personalized services • Debuting the world’s first all - suite business class on A350 • Consistent investment in onboard amenities and services Corporate Travel • Won Business Travel News Survey for 6 consecutive years • Operational reliability and network/service investments make Delta the carrier of choice for corporate customers
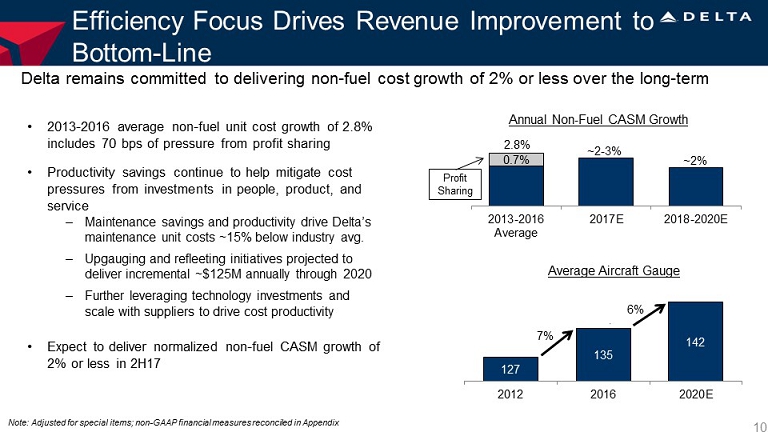
Efficiency Focus Drives Revenue Improvement to Bottom - Line Delta remains committed to delivering non - fuel cost growth of 2% or less over the long - term 10 • 2013 - 2016 average non - fuel unit cost growth of 2.8% includes 70 bps of pressure from profit sharing • Productivity savings continue to help mitigate cost pressures from investments in people, product, and service – Maintenance savings and productivity drive Delta’s maintenance unit costs ~15% below industry avg. – Upgauging and refleeting initiatives projected to deliver incremental ~$125M annually through 2020 – Further leveraging technology investments and scale with suppliers to drive cost productivity • Expect to deliver normalized non - fuel CASM growth of 2% or less in 2H17 Note: Adjusted for special items; non - GAAP financial measures reconciled in Appendix Annual Non - Fuel CASM Growth Average Aircraft Gauge 127 135 142 2012 2016 2020E 7% 6% 0.7% 2013-2016 Average 2017E 2018-2020E 2.8% ~2 - 3% ~2% Profit Sharing
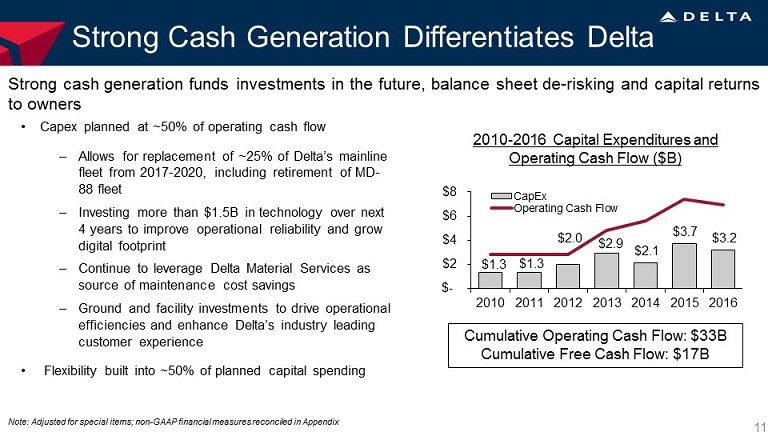
Strong Cash Generation Differentiates Delta Strong cash generation funds investments in the future, balance sheet de - risking and capital returns to owners 11 $1.3 $1.3 $2.0 $2.9 $2.1 $3.7 $3.2 $- $2 $4 $6 $8 2010 2011 2012 2013 2014 2015 2016 CapEx Operating Cash Flow 2010 - 2016 Capital Expenditures and Operating Cash Flow ($B) Cumulative Operating Cash Flow: $33B Cumulative Free Cash Flow: $17B Note: Adjusted for special items; non - GAAP financial measures reconciled in Appendix • Capex planned at ~50% of operating cash flow – Allows for replacement of ~25% of Delta’s mainline fleet from 2017 - 2020, including retirement of MD - 88 fleet – Investing more than $1.5B in technology over next 4 years to improve operational reliability and grow digital footprint – Continue to leverage Delta Material Services as source of maintenance cost savings – Ground and facility investments to drive operational efficiencies and enhance Delta’s industry leading customer experience • Flexibility built into ~50% of planned capital spending
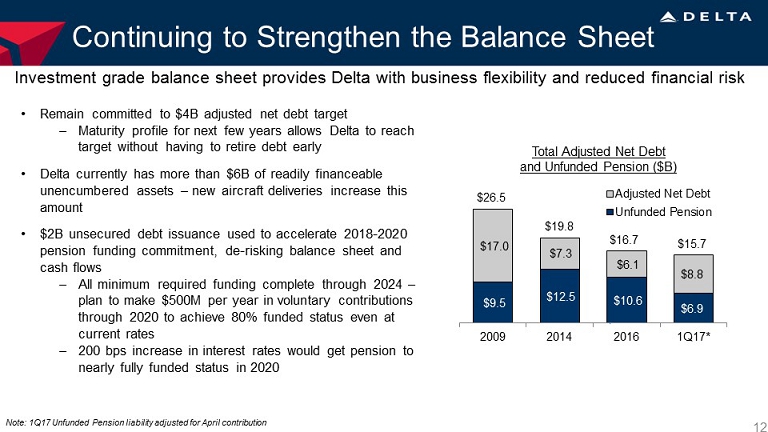
Continuing to Strengthen the Balance Sheet Investment grade balance sheet provides Delta with business flexibility and reduced financial risk 12 • Remain committed to $4B adjusted net debt target – Maturity profile for next few years allows Delta to reach target without having to retire debt early • Delta currently has more than $6B of readily financeable unencumbered assets – new aircraft deliveries increase this amount • $2B unsecured debt issuance used to accelerate 2018 - 2020 pension funding commitment, de - risking balance sheet and cash flows – All minimum required funding complete through 2024 – plan to make $500M per year in voluntary contributions through 2020 to achieve 80% funded status even at current rates – 200 bps increase in interest rates would get pension to nearly fully funded status in 2020 $9.5 $12.5 $10.6 $6.9 $17.0 $7.3 $6.1 $8.8 2009 2014 2016 1Q17* Adjusted Net Debt Unfunded Pension Total Adjusted Net Debt and Unfunded Pension ($B) $26.5 $19.8 $16.7 $15.7 Note: 1Q17 Unfunded Pension liability adjusted for April contribution
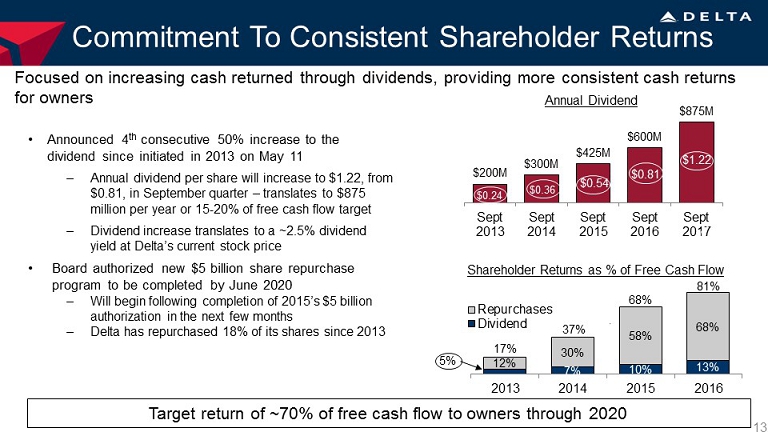
Commitment To Consistent Shareholder Returns Focused on increasing cash returned through dividends, providing more consistent cash returns for owners 13 • Announced 4 th consecutive 50% increase to the dividend since initiated in 2013 on May 11 – Annual dividend per share will increase to $1.22, from $0.81, in September quarter – translates to $875 million per year or 15 - 20% of free cash flow target – Dividend increase translates to a ~2.5% dividend yield at Delta’s current stock price • Board authorized new $5 billion share repurchase program to be completed by June 2020 – Will begin following completion of 2015’s $5 billion authorization in the next few months – Delta has repurchased 18% of its shares since 2013 Target return of ~70% of free cash flow to owners through 2020 Shareholder Returns as % of Free Cash Flow Annual Dividend $200M $300M $425M $600M $875M Sept 2013 Sept 2014 Sept 2015 Sept 2016 Sept 2017 $0.54 $0.81 $1.22 $0.24 $0.36 5% 7% 10% 13% 12% 30% 58% 68% 2013 2014 2015 2016 Repurchases Dividend 17% 37% 68% 81%
Delta: Delivering Sustainable Results 14 America’s Best Run Airline Leading Partnerships Throughout the World Sustainable Margins, Returns, and Cash Flows Investment Grade Balance Sheet Provides Solid Foundation Setting the standard for financial, operational and service excellence in the airline industry

xxx 15 Q&A

Non-GAAP Financial Measures: We sometimes use information ("non-GAAP financial measures") that is derived from the Consolidated Financial Statements, but that is not presented in accordance with accounting principles generally accepted in the U.S. ("GAAP"). Under the U.S. Securities and Exchange Commission rules, non-GAAP financial measures may be considered in addition to results prepared in accordance with GAAP, but should not be considered a substitute for or superior to GAAP results. The tables below show reconciliations of non-GAAP financial measures used in this presentation to the most directly comparable GAAP financial measures.
Forward Looking Projections. We do not reconcile forward looking non-GAAP financial measures because mark-to-market ("MTM") adjustments and settlements will not be known until the end of the period and could be significant.
Operating Margin, Adjusted. We adjust for the following items to determine operating margin, adjusted, for the reasons described below:
Mark-to-Market ("MTM") adjustments and settlements. MTM adjustments are defined as fair value changes recorded in periods other than the settlement period. Such fair value changes are not necessarily indicative of the actual settlement value of the underlying hedge in the contract settlement period. Settlements represent cash received or paid on hedge contracts settled during the period. These items adjust fuel expense to show the economic impact of hedging, including cash received or paid on hedge contracts during the period. Adjusting for these items allows investors to better understand and analyze our core operational performance in the periods shown.
Restructuring and other. Because of the variability in restructuring and other, the adjustment for this item is helpful to investors to analyze the company’s recurring core financial performance in the periods shown.
Refinery sales. Delta's refinery segment provides jet fuel to the airline segment from its own production and from jet fuel obtained through agreements with third parties. Activities of the refinery segment are primarily for the benefit of the airline. However, from time to time, the refinery sells fuel by-products to third parties. These sales are recorded gross within other revenue and other operating expense. We believe adjusting for refinery sales allows investors to better understand and analyze the impact of fuel cost on our results in the periods shown.
| Year Ended | Year Ended | |||||||
| December 31, 2016 | December 31, 2015 | |||||||
| Operating margin | 17.5 | % | 19.2 | % | ||||
| Adjusted for: | ||||||||
| MTM adjustments and settlements | (1.1) | % | (3.2) | % | ||||
| Restructuring and other | — | % | 0.1 | % | ||||
| Refinery sales | 0.1 | % | 0.1 | % | ||||
| Operating margin, adjusted | 16.5 | % | 16.2 | % | ||||
| Operating margin, year ended December 31, 2007 | 6.0 | % | ||||||
| Change | 10.5 | pts | ||||||
| 16 |
Adjusted Net Debt. We use adjusted total debt, including aircraft rent, in addition to long-term adjusted debt and capital leases, to present estimated financial obligations. We reduce adjusted debt by cash, cash equivalents and short-term investments and hedge margin receivable, resulting in adjusted net debt, to present the amount of assets needed to satisfy the debt. Management believes this metric is helpful to investors in assessing the company’s overall debt profile. Management has reduced adjusted debt by the amount of hedge margin receivable, which reflects cash posted to counterparties, as we believe this removes the impact of current market volatility on our unsettled hedges and is a better representation of the continued progress we have made on our debt initiatives.
| (in billions) | March 31, 2017 | December 31, 2016 | December 31, 2014 | December 31, 2009 | ||||||||||||||||||||||||||||
| Debt and capital lease obligations | $ | 9.2 | $ | 7.3 | $ | 9.7 | $ | 17.2 | ||||||||||||||||||||||||
| Plus: unamortized discount, net and debt issuance costs | 0.1 | 0.1 | 0.2 | 1.1 | ||||||||||||||||||||||||||||
| Adjusted debt and capital lease obligations | $ | 9.3 | $ | 7.4 | $ | 9.9 | $ | 18.3 | ||||||||||||||||||||||||
| Plus: 7x last twelve months' aircraft rent | 2.2 | 2.0 | 1.6 | 3.4 | ||||||||||||||||||||||||||||
| Adjusted total debt | 11.5 | 9.4 | 11.5 | 21.7 | ||||||||||||||||||||||||||||
| Less: cash, cash equivalents and short-term investments | (2.7 | ) | (3.2 | ) | (3.3 | ) | (4.7 | ) | ||||||||||||||||||||||||
| Less: hedge margin receivable | – | (0.1 | ) | (0.9 | ) | – | ||||||||||||||||||||||||||
| Adjusted net debt | $ | 8.8 | $ | 6.1 | $ | 7.3 | $ | 17.0 | ||||||||||||||||||||||||
| Unfunded Pension | 6.9 | 10.6 | 12.5 | 9.5 | ||||||||||||||||||||||||||||
| Total adjusted net debt and unfunded pension | $ | 15.7 | $ | 16.7 | $ | 19.8 | $ | 26.5 | ||||||||||||||||||||||||
| 17 |
Pre-Tax Income, Adjusted. We adjust for the following items to determine pre-tax income, adjusted, for the reasons described below:
MTM adjustments and settlements. MTM adjustments are defined as fair value changes recorded in periods other than the settlement period. Such fair value changes are not necessarily indicative of the actual settlement value of the underlying hedge in the contract settlement period. Settlements represent cash received or paid on hedge contracts settled during the period. These items adjust fuel expense to show the economic impact of hedging, including cash received or paid on hedge contracts during the period. Adjusting for these items allows investors to better understand and analyze our core operational performance in the periods shown.
Restructuring and other. Because of the variability in restructuring and other, the adjustment for this item is helpful to investors to analyze the company’s recurring core financial performance in the periods shown.
Reorganization items, net. Reorganization, net, includes a $1.2 billion non-cash gain for reorganization costs (primarily consisting of; emergence gains, aircraft financing renegotiations and rejections, contract carrier agreements, emergence compensation, pilot collective bargaining agreement and facility leases). We removed the impact of this gain to allow investors to better understand and analyze the company’s core financial performance in the periods shown.
Loss on extinguishment of debt. Because of the variability in loss on extinguishment of debt, the exclusion of this item is helpful to investors to analyze the company’s recurring core operational performance in the periods shown.
Virgin Atlantic MTM adjustments. We record our proportionate share of earnings from our equity investment in Virgin Atlantic in non-operating expense. We adjust for Virgin Atlantic's MTM adjustments to allow investors to better understand and analyze the company’s core financial performance in the periods shown.
| Year Ended | Year Ended | Year Ended | Year Ended | |||||||||||||
| (in billions) | December 31, 2016 | December 31, 2015 | December 31, 2014 | December 31, 2007 | ||||||||||||
| Pre-tax income | $ | 6.6 | $ | 7.2 | $ | 1.1 | $ | 1.8 | ||||||||
| Adjusted for: | ||||||||||||||||
| MTM adjustments and settlements | (0.4 | ) | (1.3 | ) | 2.3 | |||||||||||
| Restructuring and other | – | – | 0.7 | – | ||||||||||||
| Reorganization items, net | – | – | – | (1.2 | ) | |||||||||||
| Loss on extinguishment of debt | – | – | 0.3 | – | ||||||||||||
| Virgin Atlantic MTM adjustments | (0.1 | ) | – | 0.1 | – | |||||||||||
| Total adjustments | (0.5 | ) | (1.3 | ) | 3.4 | (1.2 | ) | |||||||||
| Pre-tax income, adjusted | $ | 6.1 | $ | 5.9 | $ | 4.5 | $ | 0.6 | ||||||||
| 18 |
Free Cash Flow. We present free cash flow because management believes this metric is helpful to investors to evaluate the company's ability to generate cash that is available for use for debt service or general corporate initiatives. Adjustments include:
Hedge deferrals. During the March 2015 quarter, we effectively deferred settlement of a portion of our hedge portfolio until 2016 by entering into fuel derivative transactions that, excluding market movements from the date of the transactions, provided approximately $150 million in cash receipts during the September 2015 quarter and $150 million in cash receipts for the December 2015 quarter. Additionally, these transactions required approximately $300 million in cash payments in 2016 (excluding market movements from the date of the transactions). By effectively deferring settlement of a portion of the original derivative transactions, the restructured hedge portfolio provided additional time for the fuel market to stabilize while adding some hedge protection in 2016. Free cash flow is adjusted to include these deferral transactions in order to allow investors to better understand the net impact of hedging activities in the periods shown.
Hedge margin and other. Free cash flow is adjusted for hedge margin and other as we believe this adjustment removes the impact of current market volatility on our unsettled hedges and allows investors to better understand and analyze the company’s core operational performance in the periods shown.
Net (purchase)/redemption of short-term investments and other investing. Net purchases of short term investments represent the net purchase and sale activity of investments and marketable securities in the period, including gains and losses. We adjust free cash flow for this activity, net, to provide investors a better understanding of the company's free cash flow position core to operations.
| Year Ended | Year Ended | Year Ended | Year Ended | Year Ended | Year Ended | Year Ended | Year Ended | |||||||||||||||||
| (in billions) | December 31, 2016 | December 31, 2015 | December 31, 2014 | December 31, 2013 | December 31, 2012 | December 31, 2011 | December 31, 2010 | December 31, 2007 | ||||||||||||||||
| Net cash provided by operating activities | $ | 7.2 | $ | 7.9 | $ | 4.9 | $ | 4.5 | $ | 2.5 | $ | 2.8 | $ | 2.8 | $ | 1.3 | ||||||||
| Net cash used in investing activities | (2.2 | ) | (4.0 | ) | (2.5 | ) | (2.7 | ) | (2.0 | ) | (1.5 | ) | (2.0 | ) | (0.6 | ) | ||||||||
| Adjustments: | ||||||||||||||||||||||||
| Hedge deferrals | (0.1 | ) | 0.4 | – | – | – | – | – | – | |||||||||||||||
| Hedge margin and other | (0.1 | ) | (0.8 | ) | 0.9 | – | – | – | – | – | ||||||||||||||
| Net (purchase)/redemption of short-term investments and other investing | (1.0 | ) | 0.3 | 0.4 | 0.3 | 0.3 | 0.3 | 0.8 | – | |||||||||||||||
| Total free cash flow | $ | 3.8 | $ | 3.8 | $ | 3.7 | $ | 2.1 | $ | 0.8 | $ | 1.6 | $ | 1.6 | $ | 0.7 | ||||||||
| Share repurchases | 2.6 | 2.2 | 1.1 | 0.3 | ||||||||||||||||||||
| Dividends | 0.5 | 0.4 | 0.3 | 0.1 | ||||||||||||||||||||
| Total shareholder returns | $ | 3.1 | $ | 2.6 | $ | 1.4 | $ | 0.4 | ||||||||||||||||
| Shareholder returns as a percentage of free cash flow | 81% | 68% | 37% | 17% | ||||||||||||||||||||
| 19 |
Non-Fuel Unit Cost or Cost per Available Seat Mile, Including Profit Sharing ("CASM-Ex"). We adjust CASM for the following items to determine CASM-Ex, including profit sharing for the reasons described below:
Aircraft fuel and related taxes. The volatility in fuel prices impacts the comparability of year-over-year financial performance. The adjustment for aircraft fuel and related taxes (including our regional carriers) allows investors to better understand and analyze our non-fuel costs and year-over-year financial performance
Restructuring and other. Because of the variability in restructuring and other, the adjustment for this item is helpful to investors to analyze our recurring core performance in the periods shown.
Other expenses. Other expenses include aircraft maintenance and staffing services we provide to third parties, our vacation wholesale operations, and refinery cost of sales to third parties. Because these businesses are not related to the generation of a seat mile, we adjust for the costs related to these sales to provide a more meaningful comparison of the costs of our airline operations to the rest of the airline industry.
| Year Ended | Year Ended | Year Ended | Year Ended | Year Ended | ||||||||||||||||
| December 31, 2016 | December 31, 2015 | December 31, 2014 | December 31, 2013 | December 31, 2012 | ||||||||||||||||
| CASM (cents) | 12.98 | 13.33 | 15.92 | 14.77 | 14.97 | |||||||||||||||
| Adjusted for: | ||||||||||||||||||||
| Aircraft fuel and related taxes | (2.38 | ) | (3.07 | ) | (5.64 | ) | (4.92 | ) | (5.31 | ) | ||||||||||
| Restructuring and other | – | (0.01 | ) | (0.30 | ) | (0.17 | ) | (0.20 | ) | |||||||||||
| Other expenses | (0.47 | ) | (0.48 | ) | (0.37 | ) | (0.32 | ) | (0.38 | ) | ||||||||||
| CASM-Ex, including profit sharing | 10.13 | 9.77 | 9.61 | 9.36 | 9.08 | |||||||||||||||
| Year-over-year change | 3.7% | 1.8% | 2.7% | 3.0% | ||||||||||||||||
| Average | 2.8% | |||||||||||||||||||
| Profit sharing per ASM | (0.44 | ) | (0.60 | ) | (0.45 | ) | (0.22 | ) | (0.16 | ) | ||||||||||
| Change excluding profit sharing | 9.69 | 9.17 | 9.16 | 9.14 | 8.92 | |||||||||||||||
| Growth excluding profit sharing | 5.7% | 0.1% | 0.2% | 2.5% | ||||||||||||||||
| Average | 2.1% | |||||||||||||||||||
| Change due to profit sharing | 0.7% | |||||||||||||||||||
| 20 |
Capital Expenditures, Net. We present capital expenditures, net, which includes strategic investments, because management believes incorporating these amounts provides a more meaningful financial measure for investors when comparing capital spending in relation to the industry. We also adjust for proceeds for sales of E190 aircraft because management believes investors should be informed that these proceeds effectively offset the cash paid for these aircraft earlier in the year. Management believes investors should be informed that reimbursements for build-to-suit leased facilities effectively reduce net cash provided by operating activities.
| Year Ended | Year Ended | Year Ended | Year Ended | Year Ended | ||||||||||||||||
| (in billions) | December 31, 2016 | December 31, 2015 | December 31, 2014 | December 31, 2013 | December 31, 2010 | |||||||||||||||
| Property and equipment additions | $ | 2.6 | $ | 2.2 | $ | 1.6 | $ | 2.1 | $ | 1.1 | ||||||||||
| Ground property and equipment, including technology | 0.8 | 0.7 | 0.6 | 0.5 | 0.3 | |||||||||||||||
| Adjustments: | ||||||||||||||||||||
| Purchase of equity investments | – | 0.5 | – | 0.3 | – | |||||||||||||||
| Acquisition of London-Heathrow slots | – | 0.3 | – | – | – | |||||||||||||||
| Proceeds for sales of E190 aircraft | (0.2 | ) | – | – | – | – | ||||||||||||||
| Reimbursements related to build-to-suit facilities and other | – | – | (0.1 | ) | – | (0.1 | ) | |||||||||||||
| Capital expenditures, net | $ | 3.2 | $ | 3.7 | $ | 2.1 | $ | 2.9 | $ | 1.3 | ||||||||||
| 21 |
Operating Cash Flow, Adjusted. Delta presents adjusted operating cash flow because management believes adjusting for the following items provides a more meaningful measure for investors. Adjustments include:
Hedge deferrals. During the March 2015 quarter, we effectively deferred settlement of a portion of our hedge portfolio until 2016 by entering into fuel derivative transactions that, excluding market movements from the date of the transactions, provided approximately $150 million in cash receipts during the September 2015 quarter and $150 million in cash receipts for the December 2015 quarter. Additionally, these transactions required approximately $300 million in cash payments in 2016 (excluding market movements from the date of the transactions). By effectively deferring settlement of a portion of the original derivative transactions, the restructured hedge portfolio provided additional time for the fuel market to stabilize while adding some hedge protection in 2016. Operating cash flow is adjusted to include these deferral transactions in order to allow investors to better understand the net impact of hedging activities in the periods shown.
Hedge margin and other. Operating cash flow is adjusted for hedge margin and other as we believe this adjustment removes the impact of current market volatility on our unsettled hedges and allows investors to better understand and analyze the company’s core operational performance in the periods shown.
Reimbursements related to build-to-suit facilities. Management believes investors should be informed that these reimbursements for build-to-suit leased facilities effectively reduce net cash provided by operating activities and related capital expenditures.
| Year Ended | Year Ended | Year Ended | Year Ended | Year Ended | ||||||||||||||||
| (in billions) | December 31, 2016 | December 31, 2015 | December 31, 2014 | December 31, 2013 | December 31, 2012 | |||||||||||||||
| Net cash provided by operating activities (GAAP) | $ | 7.2 | $ | 7.9 | $ | 4.9 | $ | 4.5 | $ | 2.5 | ||||||||||
| Adjustments: | ||||||||||||||||||||
| Hedge deferrals | (0.1 | ) | 0.4 | – | – | – | ||||||||||||||
| Hedge margin and other | (0.1 | ) | (0.8 | ) | 0.9 | – | – | |||||||||||||
| Reimbursements related to build-to-suit leased facilities | – | (0.1 | ) | – | – | – | ||||||||||||||
| SkyMiles used pursuant to advance purchase under AMEX agreement | – | – | – | 0.3 | 0.3 | |||||||||||||||
| Net cash provided by operating activities, adjusted | $ | 7.0 | $ | 7.4 | $ | 5.8 | $ | 4.8 | $ | 2.8 | ||||||||||
| 22 |