Attached files
| file | filename |
|---|---|
| 8-K - FORM 8-K - BROADWIND, INC. | f8k_053117.htm |
Exhibit 99.1

Investor Presentation May 2017
Industry Data and Forward - Looking Statements Disclaimer ▪ Broadwind obtained the industry and market data used throughout this presentation from our own research, internal surveys and st udies conducted by third parties, independent industry associations or general publications and other publicly available informatio n. Independent industry publications and surveys generally state that they have obtained information from sources believed to be reliable, but do not gu arantee the accuracy or completeness of such information. Forecasts are particularly likely to be inaccurate, especially over long periods of time. W e a re not aware of any misstatements in the industry data we have presented herein, but estimates involve risks and uncertainties and a re subject to change based on various factors beyond our control. ▪ This presentation contains “forward - looking statements ”, as defined in Section 21E of the Securities Exchange Act of 1934, as amended. Forward - looking statements include any statement that does not directly relate to a current or historical fact. Our forward - look ing statements may include or relate to our beliefs, expectations, plans and/or assumptions with respect to the following: ( i ) state, local and federal regulatory frameworks affecting the industries in which we compete, including the wind energy industry, and the related extension, conti nua tion or renewal of federal tax incentives and grants and state renewable portfolio standards; (ii) our customer relationships and efforts to div ers ify our customer base and sector focus and leverage customer relationships across business units; (iii) our ability to continue to grow our busines s o rganically and through acquisitions; (iv) the sufficiency of our liquidity and alternate sources of funding, if necessary; (v) our ability t o r ealize revenue from customer orders and backlog; (vi) our ability to operate our business efficiently, manage capital expenditures and costs effe cti vely, and generate cash flow; (vii) the economy and the potential impact it may have on our business, including our customers; (viii) the state of the wind energy market and other energy and industrial markets generally and the impact of competition and economic volatility in those marke ts; (ix) the effects of market disruptions and regular market volatility, including fluctuations in the price of oil, gas and other commodities; (x) the effects of the recent change of administrations in the U.S. federal government; (xi) our ability to successfully integrate and operate the business of Red Wolf Company, LLC and to identify, negotiate and execute future acquisitions; and (xii) the potential loss of tax benefits if we experience an “ownership change” under Section 382 of the Internal Revenue Code of 1986, as amended. These statements are based on information currently available to us and are subject to various risks, uncertainties and other factors. We are under no duty to update any of these statements. You sh oul d not consider any list of such factors to be an exhaustive statement of all of the risks, uncertainties or other factors that could cause our c urr ent beliefs, expectations, plans and/or assumptions to change. ▪ This presentation contains non - GAAP financial information. We believe that certain non - GAAP financial measures may provide users of this financial information with meaningful comparisons between current results and results in prior operating periods. We believe tha t these non - GAAP financial measures can provide additional meaningful reflection of underlying trends of the business because they provide a c omp arison of historical information that excludes certain infrequently occurring or non - operational items that impact the overall comparabili ty. Non - GAAP financial measures should be viewed in addition to, and not as an alternative to, our reported results prepared in accordance wi th GAAP. Please see our earnings release dated May 2, 2017 for a reconciliation of certain non - GAAP measures presented in this presentation. May 2017 2
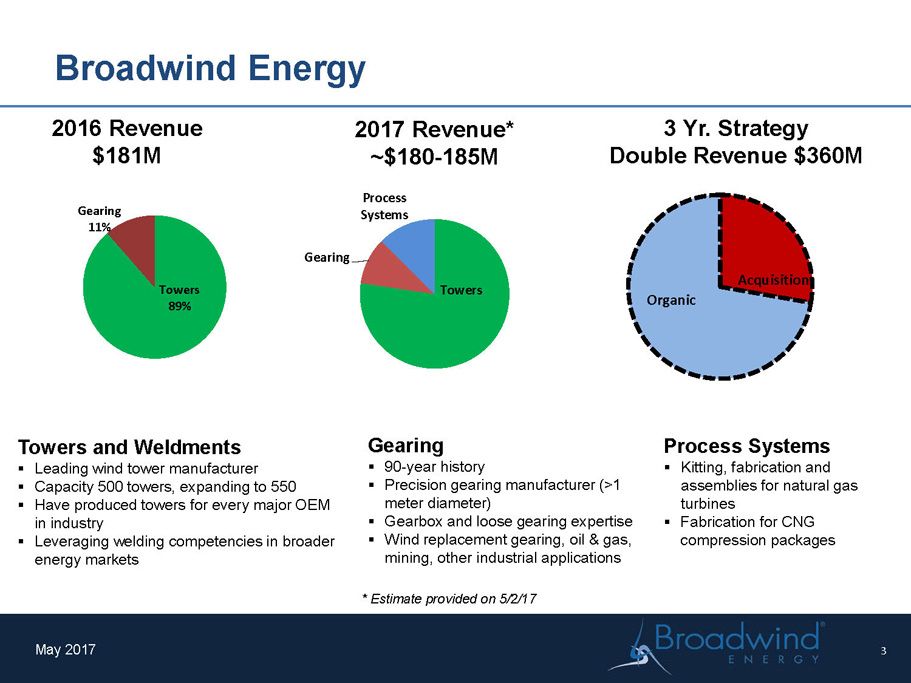
Broadwind Energy May 2017 Towers 89% Gearing 11% 2016 Revenue $181M Towers and Weldments ▪ Leading wind tower manufacturer ▪ Capacity 500 towers, expanding to 550 ▪ Have produced towers for every major OEM in industry ▪ Leveraging welding competencies in broader energy markets Towers Gearing Process Systems 2017 Revenue* ~$180 - 185M Gearing ▪ 90 - year history ▪ Precision gearing manufacturer (>1 meter diameter ) ▪ Gearbox and loose gearing expertise ▪ Wind replacement gearing, oil & gas, mining, other industrial applications Process Systems ▪ Kitting, fabrication and assemblies for natural gas turbines ▪ Fabrication for CNG compression packages Organic Acquisitions 3 Yr. Strategy Double Revenue $360M 3 * Estimate provided on 5/2/17
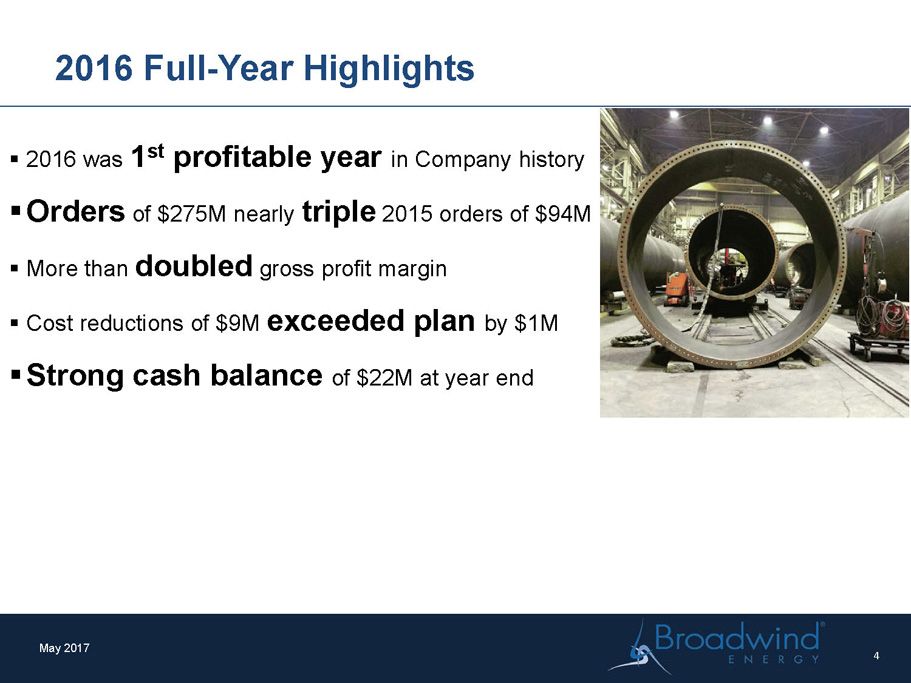
2016 Full - Year Highlights May 2017 ▪ 2016 was 1 st profitable year in Company history ▪ Orders of $275M nearly triple 2015 orders of $94M ▪ More than d oubled gross profit margin ▪ Cost reductions of $9M exceeded plan by $1M ▪ Strong cash balance of $22M at year end 4
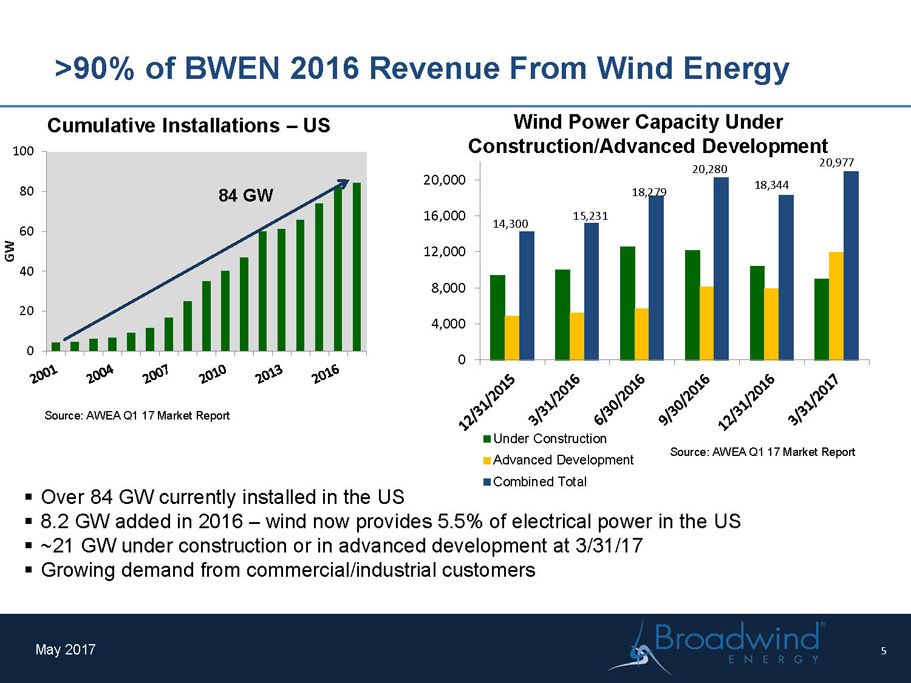
>90% of BWEN 2016 Revenue F rom W ind Energy May 2017 0 20 40 60 80 100 GW Cumulative Installations – US Source: AWEA Q1 17 Market Report 84 GW Wind Power Capacity Under Construction/Advanced Development ▪ Over 84 GW currently installed in the US ▪ 8.2 GW added in 2016 – wind now provides 5.5% of electrical power in the US ▪ ~21 GW under construction or in advanced development at 3/31/17 ▪ Growing demand from commercial/industrial customers Source: AWEA Q1 17 Market Report 0 4,000 8,000 12,000 16,000 20,000 Under Construction Advanced Development Combined Total 15,231 18,279 20,280 18,344 20,977 14,300 5
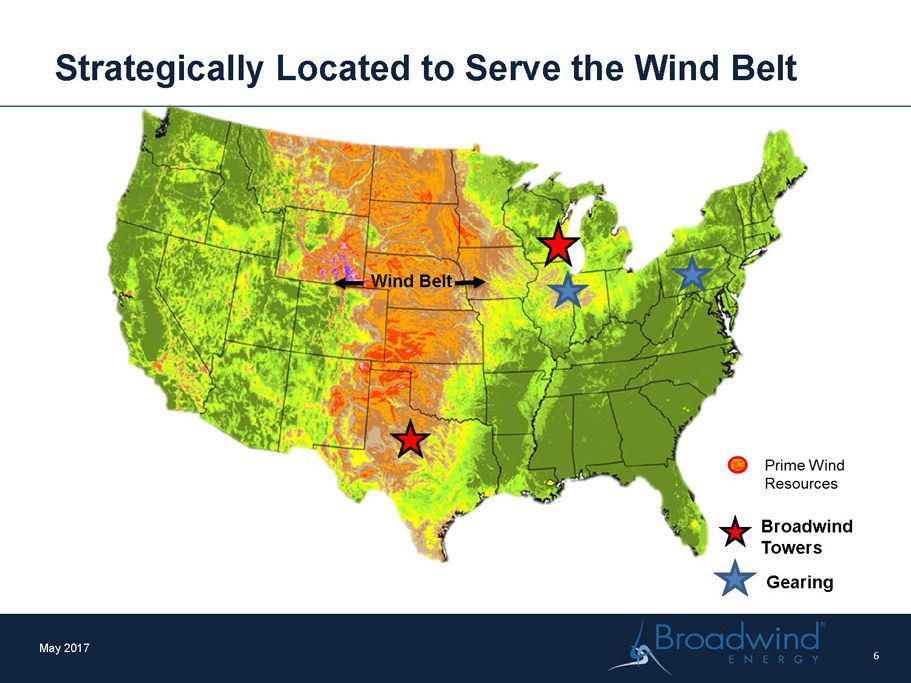
Strategically Located to Serve the Wind Belt May 2017 6 Wind Belt Gearing Broadwind Towers
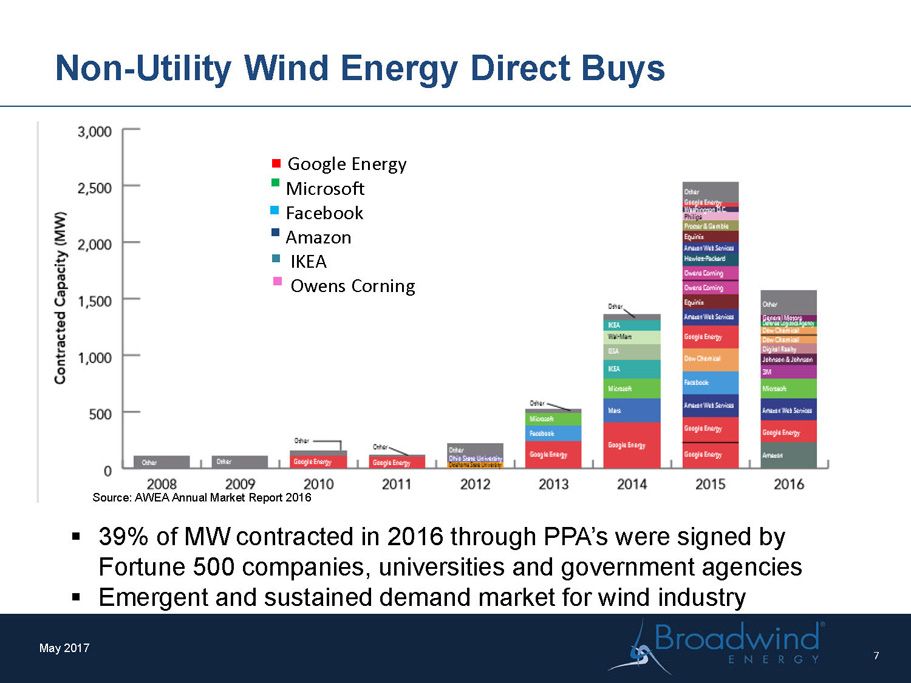
Non - Utility Wind Energy Direct Buys May 2017 7 ▪ 39% of MW contracted in 2016 through PPA’s were signed by Fortune 500 companies, universities and government agencies ▪ Emergent and sustained demand market for wind industry Google Energy Microsoft Facebook Amazon IKEA Owens Corning Source: AWEA Annual Market Report 2016
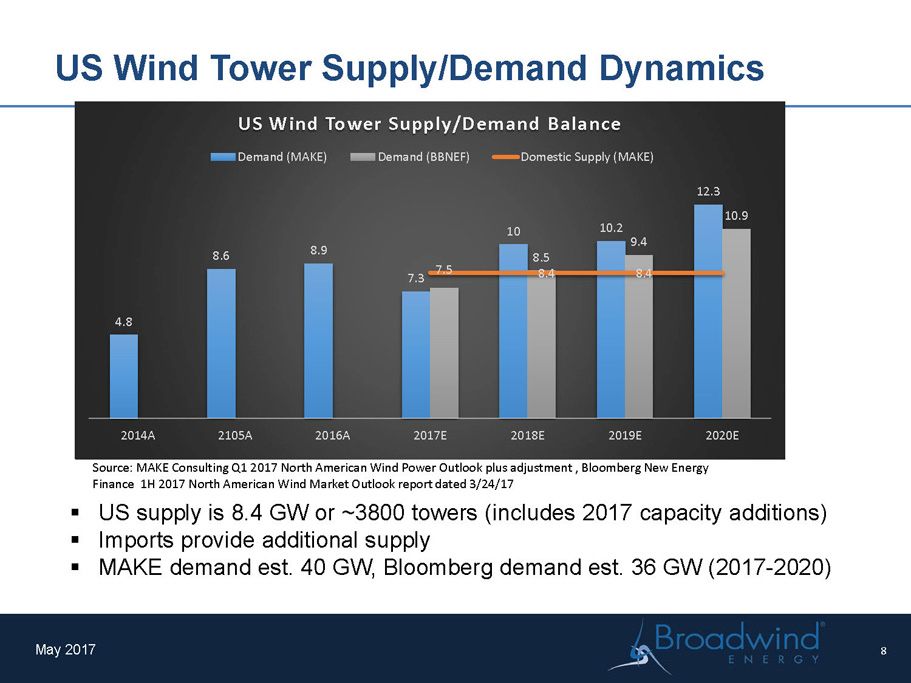
US Wind Tower Supply/Demand Dynamics May 2017 ▪ US supply is 8.4 GW or ~3800 towers (includes 2017 capacity additions) ▪ Imports provide additional supply ▪ MAKE demand est. 40 GW, Bloomberg demand est. 36 GW (2017 - 2020) Source: MAKE Consulting Q1 2017 North American Wind Power Outlook plus adjustment , Bloomberg New Energy Finance 1H 2017 North American Wind Market Outlook report dated 3/24/17 8 4.8 8.6 8.9 7.3 10 10.2 12.3 7.5 8.5 9.4 10.9 8.4 8.4 2014A 2105A 2016A 2017E 2018E 2019E 2020E US Wind Tower Supply/Demand Balance Demand (MAKE) Demand (BBNEF) Domestic Supply (MAKE)
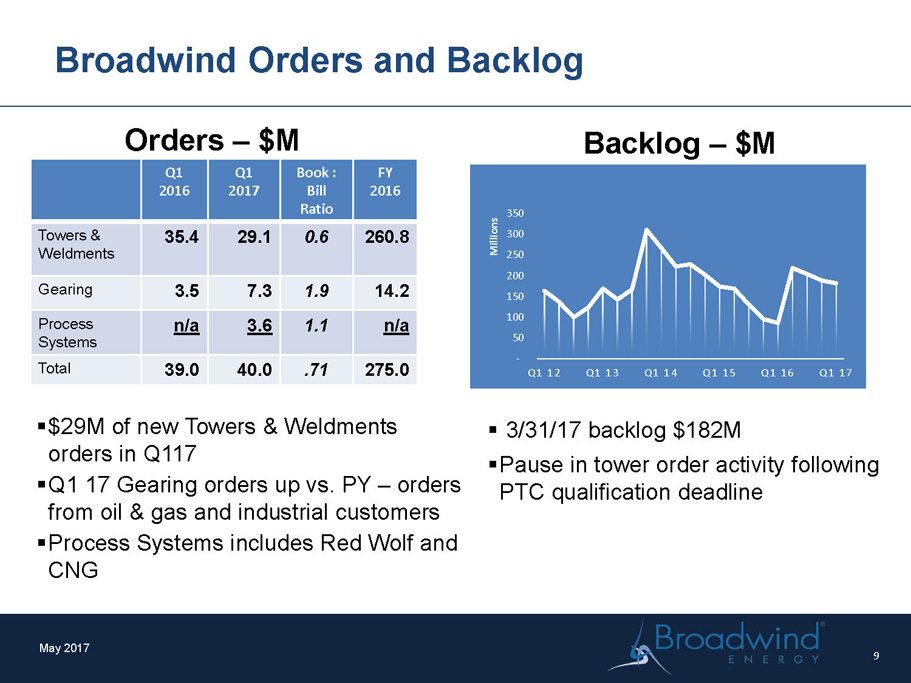
Broadwind Orders and Backlog Orders – $M ▪ $29M of new Towers & Weldments orders in Q117 ▪ Q1 17 Gearing orders up vs. PY – orders from oil & gas and industrial customers ▪ Process Systems includes Red Wolf and CNG Backlog – $M ▪ 3/31/17 backlog $182M ▪ Pause in tower order activity following PTC qualification deadline Q1 2016 Q1 2017 Book : Bill Ratio FY 2016 Towers & Weldments 35.4 29.1 0.6 260.8 Gearing 3.5 7.3 1.9 14.2 Process Systems n/a 3.6 1.1 n/a Total 39.0 40.0 .71 275.0 May 2017 - 50 100 150 200 250 300 350 Q1 12 Q1 13 Q1 14 Q1 15 Q1 16 Q1 17 Millions 9
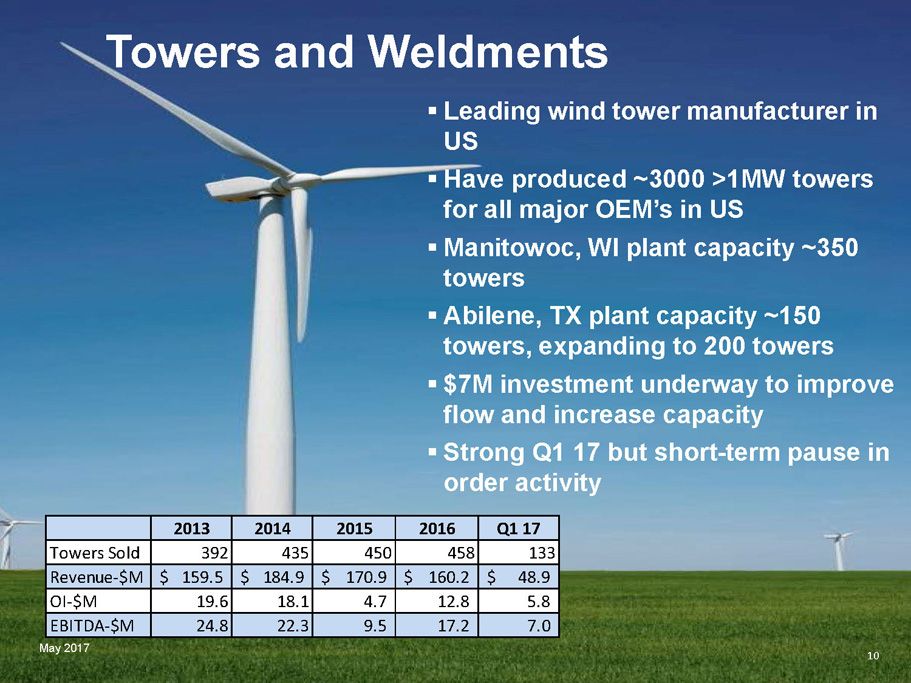
Towers and Weldments ▪ Leading wind tower manufacturer in US ▪ Have produced ~3000 >1MW towers for all major OEM’s in US ▪ Manitowoc, WI plant capacity ~350 towers ▪ Abilene, TX plant capacity ~150 towers, expanding to 200 towers ▪ $7M investment underway to improve flow and increase capacity ▪ Strong Q1 17 but short - term pause in order activity May 2017 10 2013 2014 2015 2016 Q1 17 Towers Sold 392 435 450 458 133 Revenue-$M 159.5$ 184.9$ 170.9$ 160.2$ 48.9$ OI-$M 19.6 18.1 4.7 12.8 5.8 EBITDA-$M 24.8 22.3 9.5 17.2 7.0
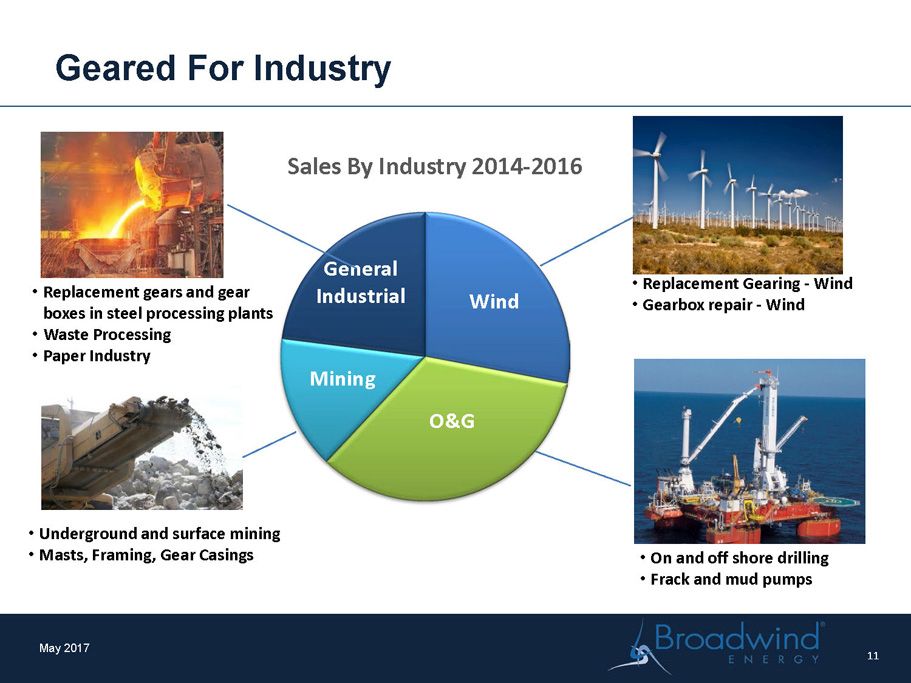
Geared F or Industry May 2017 11 Wind O&G Mining General Industrial Sales By Industry 2014 - 2016 • Underground and surface mining • Masts, Framing , Gear Casings • Replacement gears and gear boxes in s teel p rocessing plants • Waste Processing • Paper Industry • On and off shore drilling • Frack and mud pumps • R eplacement G earing - Wind • G earbox repair - Wind
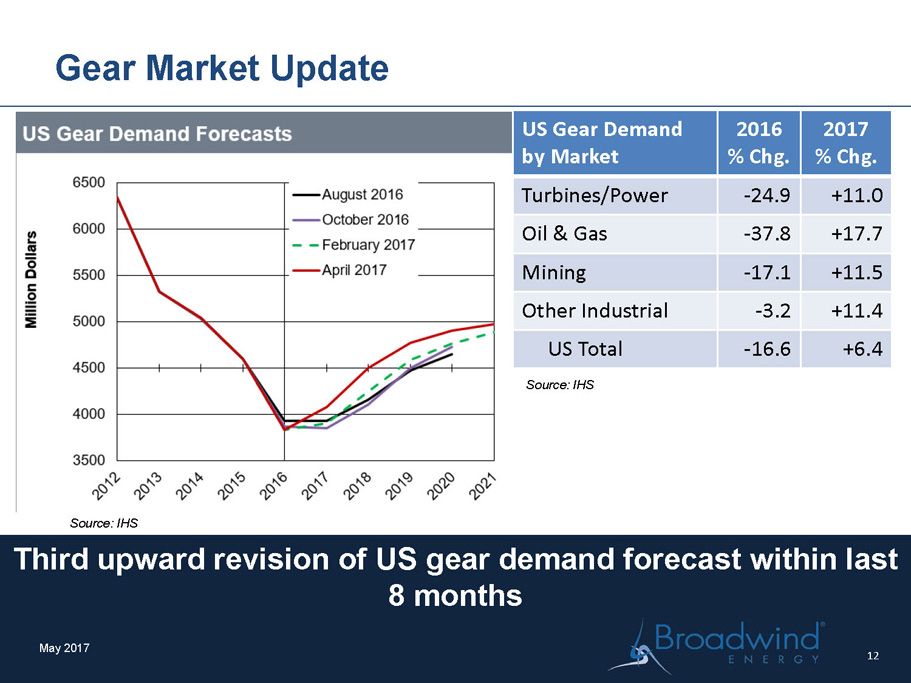
Third upward revision of US gear demand forecast within last 8 months Gear Market Update May 2017 Source: IHS US Gear Demand by Market 2016 % Chg. 2017 % Chg. Turbines/Power - 24.9 +11.0 Oil & Gas - 37.8 +17.7 Mining - 17.1 +11.5 Other Industrial - 3.2 +11.4 US Total - 16.6 +6.4 Source: IHS 12
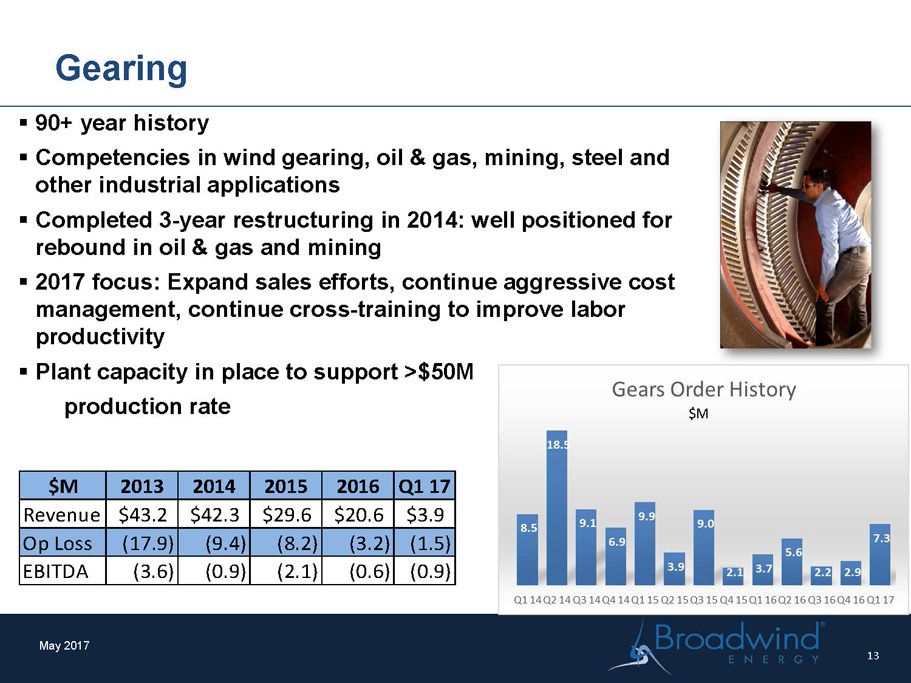
Gearing May 2017 ▪ 90+ year history ▪ Competencies in wind gearing, oil & gas, mining, steel and other industrial applications ▪ Completed 3 - year restructuring in 2014: well positioned for rebound in oil & gas and mining ▪ 2017 focus: Expand sales efforts, continue aggressive cost management, continue cross - training to improve labor productivity ▪ Plant capacity in place to support >$50M p roduction rate $M 2013 2014 2015 2016 Q1 17 Revenue 43.2$ 42.3$ 29.6$ 20.6$ 3.9$ Op Loss (17.9) (9.4) (8.2) (3.2) (1.5) EBITDA (3.6) (0.9) (2.1) (0.6) (0.9) 13 $ M
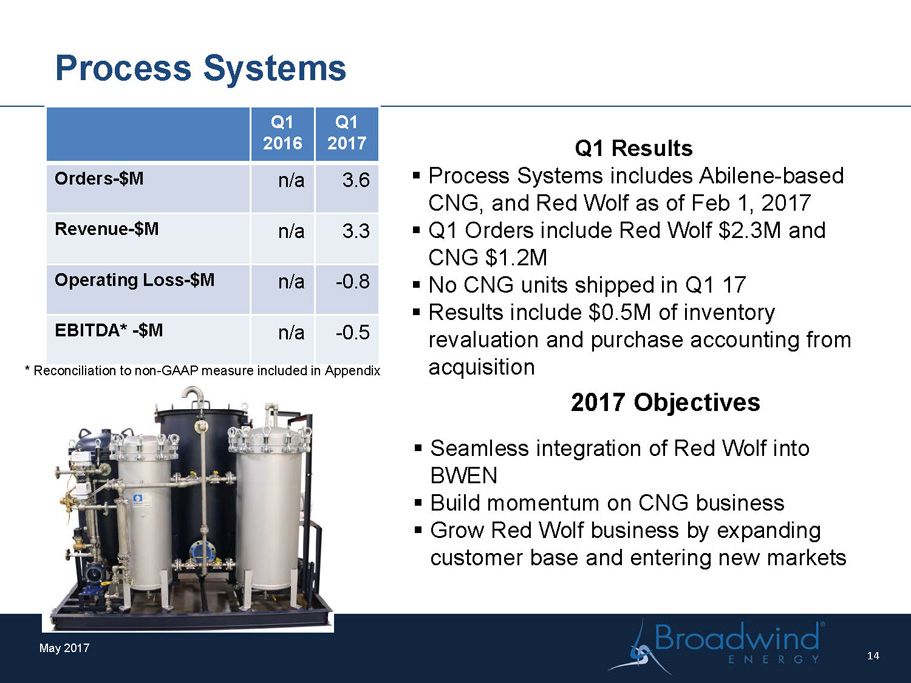
May 2017 Process Systems Q1 2016 Q1 2017 Orders - $M n/a 3.6 Revenue - $M n/a 3.3 Operating Loss - $M n/a - 0.8 EBITDA* - $M n/a - 0.5 * Reconciliation to non - GAAP measure included in Appendix Q1 Results ▪ Process Systems includes Abilene - based CNG, and Red Wolf as of Feb 1, 2017 ▪ Q1 Orders include Red Wolf $2.3M and CNG $1.2M ▪ No CNG units shipped in Q1 17 ▪ Results include $0.5M of inventory revaluation and purchase accounting from acquisition 2017 Objectives ▪ Seamless integration of Red Wolf into BWEN ▪ Build momentum on CNG business ▪ Grow Red Wolf business by expanding customer base and entering new markets 14
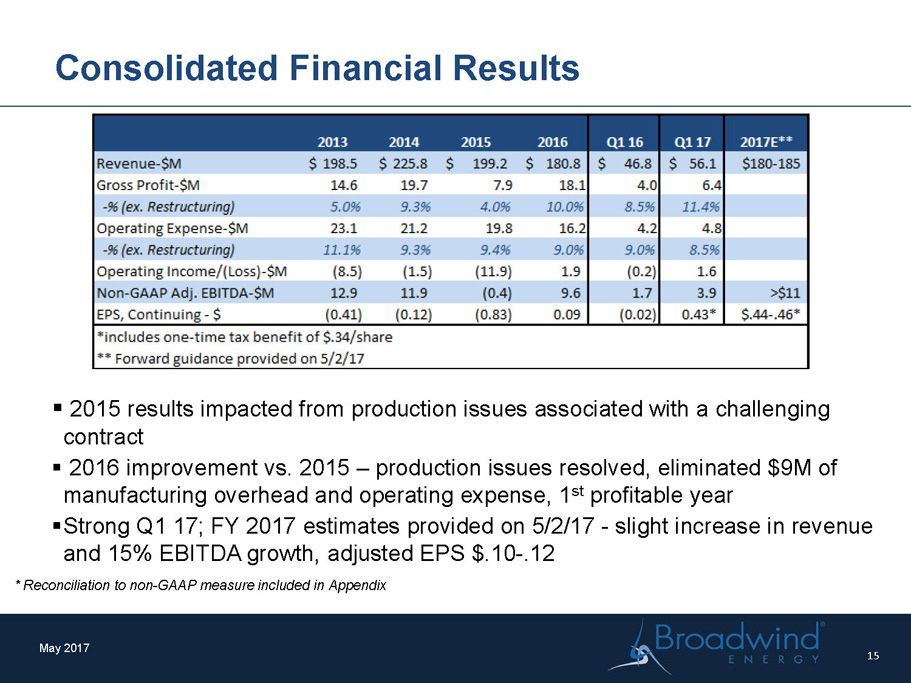
Consolidated Financial Results May 2017 ▪ 2015 results impacted from production issues associated with a challenging contract ▪ 2016 improvement vs. 2015 – production issues resolved, eliminated $9M of manufacturing overhead and operating expense, 1 st profitable year ▪ Strong Q1 17; FY 2017 estimates provided on 5/2/17 - slight increase in revenue and 15% EBITDA growth, adjusted EPS $.10 - .12 * Reconciliation to non - GAAP measure included in Appendix 15
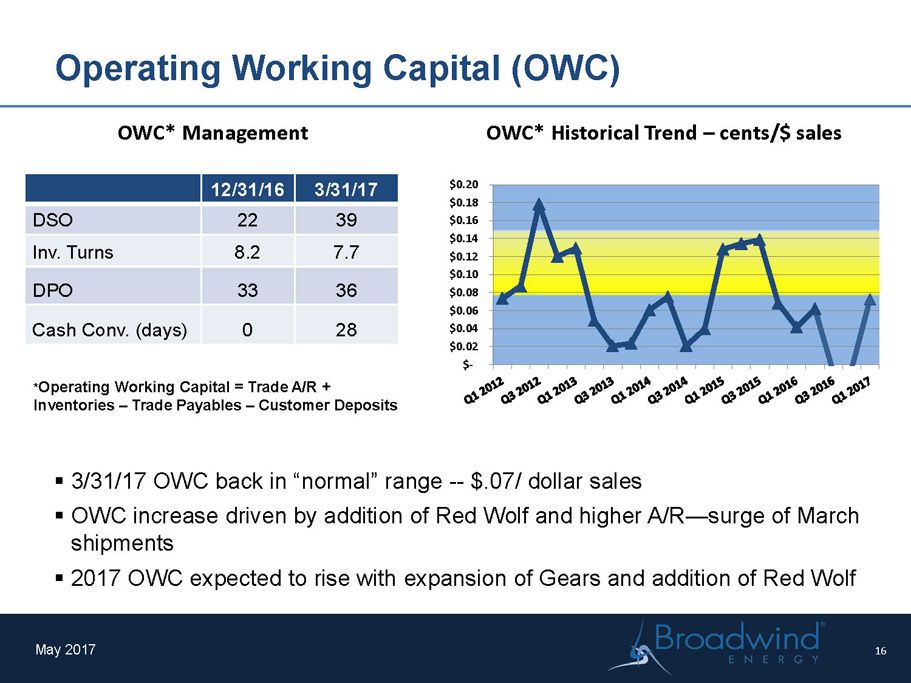
Operating Working Capital (OWC) May 2017 ▪ 3/31/17 OWC back in “normal” range -- $.07/ dollar sales ▪ OWC increase driven by addition of Red Wolf and higher A/R — surge of March shipments ▪ 2017 OWC expected to rise with expansion of Gears and addition of Red Wolf * Operating Working Capital = Trade A/R + Inventories – Trade Payables – Customer Deposits 12/31/16 3/31/17 DSO 22 39 Inv. Turns 8.2 7.7 DPO 33 36 Cash Conv. (days) 0 28 $- $0.02 $0.04 $0.06 $0.08 $0.10 $0.12 $0.14 $0.16 $0.18 $0.20 OWC* Historical Trend – cents/$ sales OWC* Management 16
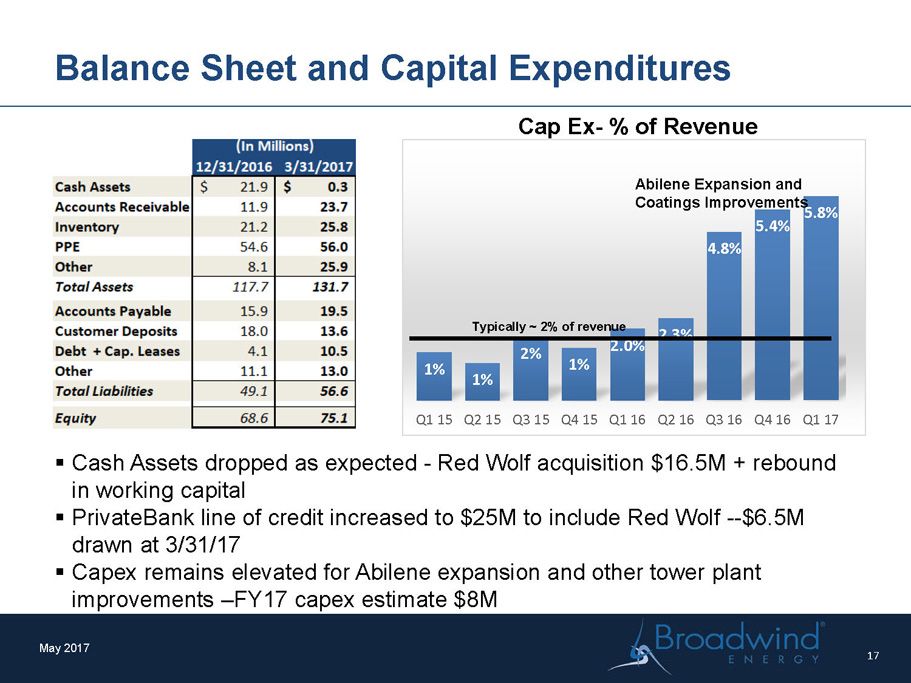
Balance Sheet and Capital Expenditures May 2017 1% 1% 2% 1% 2.0% 2.3% 4.8% 5.4% 5.8% Q1 15 Q2 15 Q3 15 Q4 15 Q1 16 Q2 16 Q3 16 Q4 16 Q1 17 Cap Ex - % of Revenue Typically ~ 2% of revenue Abilene Expansion and Coatings Improvements ▪ Cash Assets dropped as expected - Red Wolf acquisition $16.5M + rebound in working capital ▪ PrivateBank line of credit increased to $ 25M to include Red Wolf -- $6.5M drawn at 3/31/17 ▪ Capex remains elevated for Abilene expansion and other tower plant improvements – FY17 capex estimate $8M 17
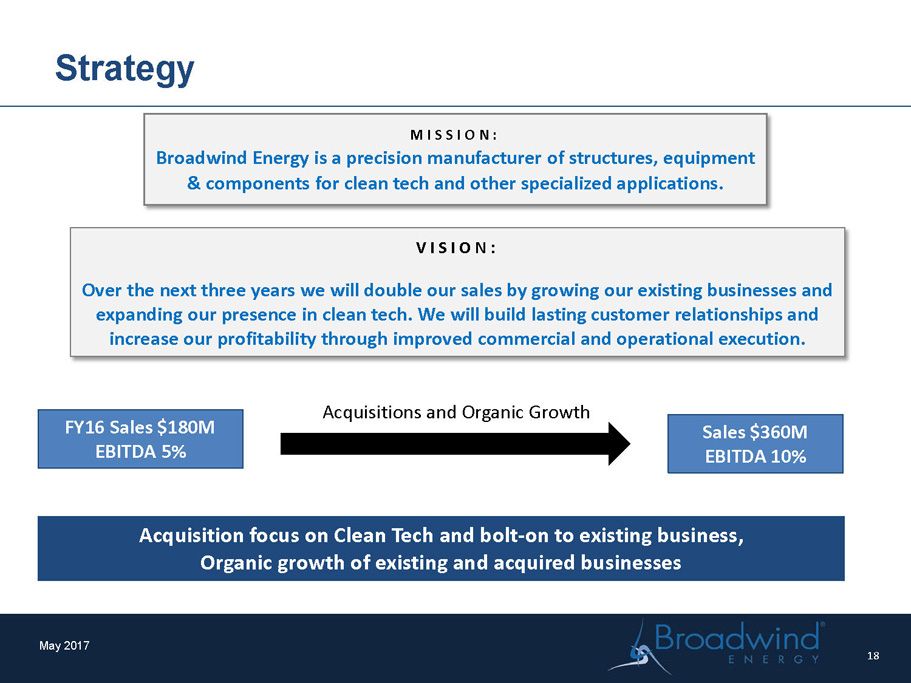
VISION: Over the next three years we will double our sales by growing our existing businesses and expanding our presence in clean tech. We will build lasting customer relationships and increase our profitability through improved commercial and operational execution. Strategy May 2017 FY16 Sales $180M EBITDA 5% Sales $360M EBITDA 10% MISSION: Broadwind Energy is a precision manufacturer of structures, equipment & components for clean tech and other specialized applications. Acquisitions and Organic Growth Acquisition focus on Clean Tech and bolt - on to existing business, Organic growth of existing and acquired businesses 18
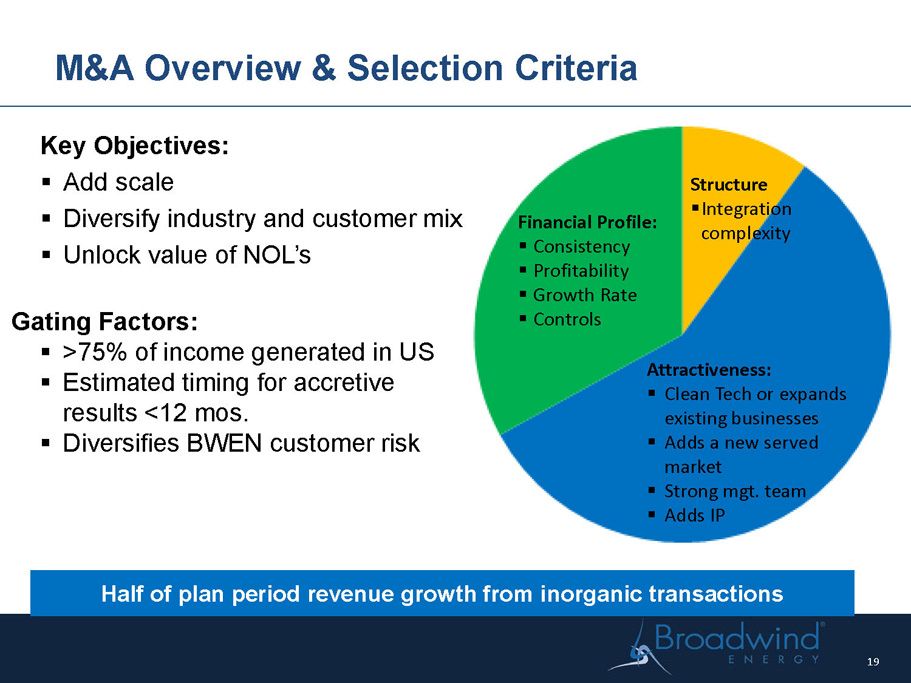
M&A Overview & Selection Criteria Half of plan period revenue growth from inorganic transactions Key Objectives: ▪ Add scale ▪ Diversify industry and customer mix ▪ Unlock value of NOL’s 19 Financial Profile: ▪ Consistency ▪ Profitability ▪ Growth Rate ▪ Controls Attractiveness: ▪ Clean Tech or expands existing businesses ▪ Adds a new served market ▪ Strong mgt. team ▪ Adds IP Structure ▪ Integration complexity Gating Factors: ▪ >75% of income generated in US ▪ Estimated timing for accretive results <12 mos. ▪ Diversifies BWEN customer risk
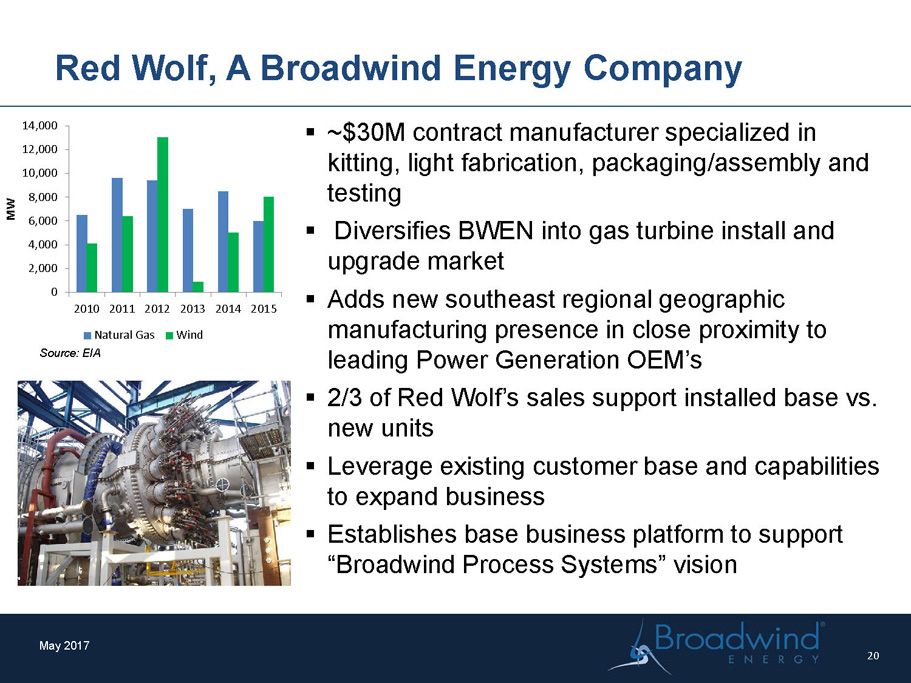
Red Wolf, A Broadwind Energy Company ▪ ~$30M c ontract manufacturer specialized in kitting, light fabrication, packaging/assembly and testing ▪ Diversifies BWEN into gas turbine install and upgrade market ▪ Adds new southeast regional geographic manufacturing presence in close proximity to leading Power Generation OEM’s ▪ 2/3 of Red Wolf’s sales support installed base vs. new units ▪ Leverage existing customer base and capabilities to expand business ▪ Establishes base business platform to support “ Broadwind Process Systems” vision May 2017 0 2,000 4,000 6,000 8,000 10,000 12,000 14,000 2010 2011 2012 2013 2014 2015 MW Natural Gas Wind Source: EIA 20
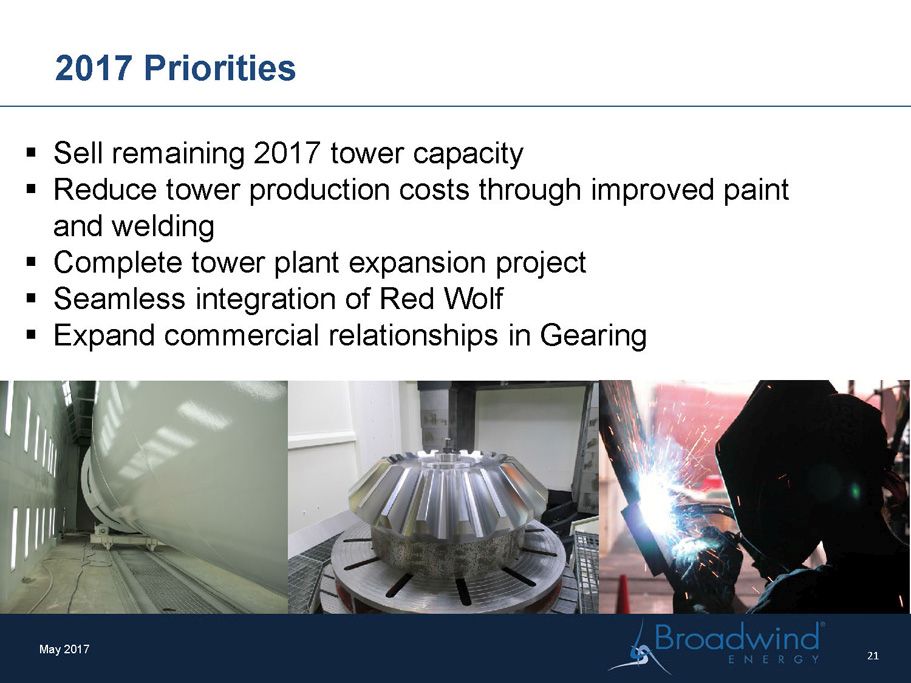
2017 Priorities May 2017 ▪ Sell remaining 2017 tower capacity ▪ Reduce tower production costs through improved paint and welding ▪ Complete tower plant expansion project ▪ Seamless integration of Red Wolf ▪ Expand commercial relationships in Gearing 21
Investment Thesis ▪ US Wind markets fundamentally strong…oil and gas and mining recovering ▪ Strong balance sheet – good working capital management ▪ Surplus cash redeployed to diversify into gas turbine supply chain with Red Wolf acquisition ▪ Conservative capital structure supports growth objectives ▪ >$ 200M NOL to shelter income for foreseeable future May 2017 22
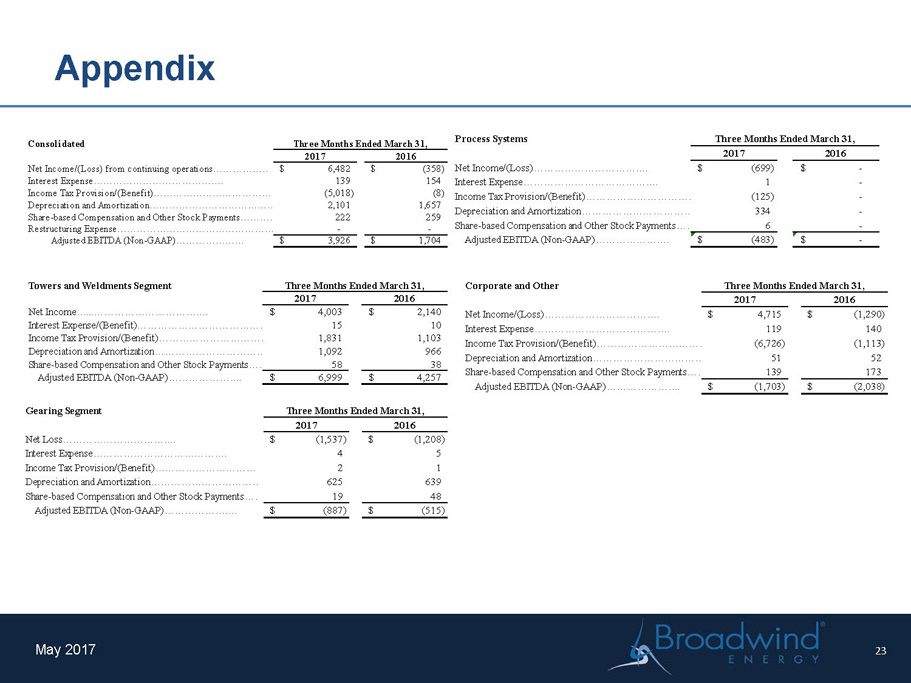
Appendix May 2017 Consolidated 2017 2016 Net Income/(Loss) from continuing operations…………………………….6,482$ (358)$ Interest Expense…………………………………. 139 154 Income Tax Provision/(Benefit)……………………………… (5,018) (8) Depreciation and Amortization………………………………………………………………2,101 1,657 Share-based Compensation and Other Stock Payments………………………………………………………………222 259 Restructuring Expense…………………………………………………... - - Adjusted EBITDA (Non-GAAP)………………… 3,926$ 1,704$ Three Months Ended March 31, Towers and Weldments Segment 2017 2016 Net Income…...……………………………. 4,003$ 2,140$ Interest Expense/(Benefit)…………………………………. 15 10 Income Tax Provision/(Benefit)……………………………… 1,831 1,103 Depreciation and Amortization………………………………………………………………1,092 966 Share-based Compensation and Other Stock Payments………………………………………………………………58 38 Adjusted EBITDA (Non-GAAP)…………………. 6,999$ 4,257$ Three Months Ended March 31, Gearing Segment 2017 2016 Net Loss……………………………. (1,537)$ (1,208)$ Interest Expense…………………………………. 4 5 Income Tax Provision/(Benefit)……………………………… 2 1 Depreciation and Amortization………………………………………………………………625 639 Share-based Compensation and Other Stock Payments………………………………………………………………19 48 Adjusted EBITDA (Non-GAAP)…………………. (887)$ (515)$ Three Months Ended March 31, Process Systems 2017 2016 Net Income/(Loss)……………………………. (699)$ -$ Interest Expense…………………………………. 1 - Income Tax Provision/(Benefit)……………………………… (125) - Depreciation and Amortization………………………………………………………………334 - Share-based Compensation and Other Stock Payments………………………………………………………………6 - Adjusted EBITDA (Non-GAAP)…………………. (483)$ -$ Three Months Ended March 31, Corporate and Other 2017 2016 Net Income/(Loss)……………………………. 4,715$ (1,290)$ Interest Expense…………………………………. 119 140 Income Tax Provision/(Benefit)……………………………… (6,726) (1,113) Depreciation and Amortization………………………………………………………………51 52 Share-based Compensation and Other Stock Payments………………………………………………………………139 173 Adjusted EBITDA (Non-GAAP)…………………. (1,703)$ (2,038)$ Three Months Ended March 31, 23

Broadwind Energy is a precision manufacturer of structures, equipment & components for clean tech and other specialized applications . www.BWEN.com May 2017 24