Attached files
| file | filename |
|---|---|
| EX-32.2 - EXHIBIT 32.2 - AMERICAN SUPERCONDUCTOR CORP /DE/ | amsc20170331ex322.htm |
| EX-32.1 - EXHIBIT 32.1 - AMERICAN SUPERCONDUCTOR CORP /DE/ | amsc20170331ex321.htm |
| EX-31.2 - EXHIBIT 31.2 - AMERICAN SUPERCONDUCTOR CORP /DE/ | amsc20170331ex312.htm |
| EX-31.1 - EXHIBIT 31.1 - AMERICAN SUPERCONDUCTOR CORP /DE/ | amsc20170331ex311.htm |
| EX-23.1 - EXHIBIT 23.1 - AMERICAN SUPERCONDUCTOR CORP /DE/ | amsc20170331ex231.htm |
| EX-21.1 - EXHIBIT 21.1 - AMERICAN SUPERCONDUCTOR CORP /DE/ | amsc20170331ex211.htm |
UNITED STATES
SECURITIES AND EXCHANGE COMMISSION
WASHINGTON, D.C. 20549
Form 10-K | ||||
ý | ANNUAL REPORT PURSUANT TO SECTION 13 OR 15(d) OF THE SECURITIES EXCHANGE ACT OF 1934 |
For the fiscal year ended March 31, 2017
OR
¨ | TRANSITION REPORT PURSUANT TO SECTION 13 OR 15(d) OF THE SECURITIES EXCHANGE ACT OF 1934 |
For the Transition Period from to
Commission file number 000-19672
American Superconductor Corporation (Exact Name of Registrant as Specified in Its Charter) | ||||
Delaware | 04-2959321 | |
(State or Other Jurisdiction of Incorporation or Organization) | (IRS Employer Identification Number) | |
64 Jackson Road Devens, Massachusetts | 1,434 | |
(Address of Principal Executive Offices) | (Zip Code) | |
Registrant’s telephone number, including area code:
(978) 842-3000
Securities registered pursuant to Section 12(b) of the Act:
Common Stock, $0.01 par value, NASDAQ Global Select Market
Securities registered pursuant to Section 12(g) of the Act: None | ||||
Indicate by checkmark if the registrant is a well-known seasoned issuer, as defined in Rule 405 of the Securities Act. Yes ¨ No ý
Indicate by checkmark if the registrant is not required to file reports pursuant to Section 13 or Section 15(d) of the Act. Yes ¨ No ý
Indicate by check mark whether the registrant (1) has filed all reports required to be filed by Section 13 or 15(d) of the Securities Exchange Act of 1934 during the preceding 12 months (or for such shorter period that the registrant was required to file such reports), and (2) has been subject to such filing requirements for the past 90 days. Yes ý No ¨
Indicate by check mark whether the registrant has submitted electronically and posted on its corporate Web site, if any, every Interactive Data File required to be submitted and posted pursuant to Rule 405 of Regulation S-T (§ 232.405 of this chapter) during the preceding 12 months (or for such shorter period that the registrant was required to submit and post such files). Yes ý No ¨
Indicate by check mark if disclosure of delinquent filers pursuant to Item 405 of Regulation S-K (§ 232.405) is not contained herein, and will not be contained, to the best of the Registrant’s knowledge, in definitive proxy or information statements incorporated by reference in Part III of this Form 10-K or any amendment to this Form 10-K. ¨
Indicate by checkmark whether the registrant is a large accelerated filer, an accelerated filer, a non-accelerated filer, smaller reporting company, or an emerging growth company. See definitions of “large accelerated filer,” “accelerated filer,” “smaller reporting company,” and "emerging growth company" in Rule 12b-2 of the Exchange Act:
Large accelerated filer | o | Accelerated filer | x | |
Non-accelerated filer | o | (Do not check if a smaller reporting company) | Smaller reporting company | o |
Emerging growth company | o | |||
If an emerging growth company, indicate by check mark if the registrant has elected not to use the extended transition period for complying with any new or revised financial accounting standards provided pursuant to Section 13(a) of the Exchange Act. ¨
Indicate by checkmark whether the registrant is a shell company (as defined in Rule 12b-2 of the Act). Yes ¨ No ý
The aggregate market value of the registrant’s Common Stock held by non-affiliates of the registrant on September 30, 2016, based on the closing price of the shares of Common Stock on the Nasdaq Global Select Market on that date ($7.01 per share) was $83.1 million.
Number of shares outstanding of the registrant’s Common Stock, as of May 23, 2017 was 18,591,648.
DOCUMENTS INCORPORATED BY REFERENCE
Portions of the definitive proxy statement for the annual meeting of stockholders scheduled to be held on July 27, 2017, to be filed with the Securities and Exchange Commission (the “SEC”), are incorporated by reference in answer to Part III of this Form 10-K.
AMERICAN SUPERCONDUCTOR CORPORATION
INDEX
Item | Page | |||
PART I | ||||
1. | ||||
1A. | ||||
1B. | ||||
2. | ||||
3. | ||||
4. | ||||
PART II | ||||
5. | ||||
6. | ||||
7. | ||||
7A. | ||||
8. | ||||
9. | ||||
9A. | ||||
9B. | ||||
PART III | ||||
10. | ||||
11. | ||||
12. | ||||
13. | ||||
14. | ||||
PART IV | ||||
15. | ||||
2
This Annual Report on Form 10-K contains forward-looking statements within the meaning of Section 21E of the Securities Exchange Act of 1934, as amended (the “Exchange Act”). Any statements in this Annual Report that relate to future events or conditions, including without limitation, the statements in Part I, “Item 1A. Risk Factors” and in Part II under “Item 7. Management’s Discussion and Analysis of Financial Condition and Results of Operations” and located elsewhere herein regarding industry prospects, our addressable markets, capabilities and potential uses of our products, or our prospective results of operations or financial position, may be deemed to be forward-looking statements. Without limiting the foregoing, the words “believes,” “anticipates,” “plans,” “expects,” and similar expressions are intended to identify forward-looking statements. Such forward-looking statements represent management’s current expectations and are inherently uncertain. There are a number of important factors that could materially impact the value of our common stock or cause actual results to differ materially from those indicated by such forward-looking statements. Such factors include the important factors discussed under the caption “Risk Factors” in Part 1. Item 1A of this Form 10-K for the fiscal year ended March 31, 2017, which among others, could cause actual results to differ materially from those indicated by forward-looking statements made herein and presented elsewhere by management from time to time. Any such forward-looking statements represent management’s estimates as of the date of this Annual Report on Form 10-K. While we may elect to update such forward-looking statements at some point in the future, we disclaim any obligation to do so, even if subsequent events cause our views to change. These forward-looking statements should not be relied upon as representing our views as of any date subsequent to the date of this Annual Report on Form 10-K.
3
PART I
Item 1. | BUSINESS |
Overview
American Superconductor Corporation (together with its subsidiaries, “AMSC®” or the “Company”) was founded on April 9, 1987. We are a leading provider of megawatt-scale solutions that lower the cost of wind power and enhance the performance of the power grid. In the wind power market, we enable manufacturers to field highly competitive wind turbines through our advanced power electronics products, engineering, and support services. In the power grid market, we enable electric utilities, industrial facilities, and renewable energy project developers to connect, transmit and distribute power through our transmission planning services and power electronics, and superconductor-based products. Our wind and power grid products and services provide exceptional reliability, security, efficiency, and affordability to our customers.
Our wind and power grid solutions help to improve energy efficiency, alleviate power grid capacity constraints and increase the adoption of renewable energy generation. Demand for our solutions is driven by the growing needs for renewable sources of electricity, such as wind and solar energy, and for modernized smart grids that improve power reliability, security, and quality. Concerns about these factors have led to increased spending by corporations as well as supportive government regulations and initiatives on local, state and national levels, including renewable portfolio standards, tax incentives, and international treaties. We estimate that today’s total annual addressable global market for our wind and grid solutions exceeds $6 billion.
We segment our operations into two market-facing business units: Wind and Grid. We believe this market-centric structure enables us to more effectively anticipate and meet the needs of wind turbine manufacturers, power generation project developers and electric utilities.
• | Wind. Through our Windtec Solutions™, our Wind business segment enables manufacturers to field wind turbines with exceptional power output, reliability, and affordability. We supply advanced power electronics and control systems, license our highly engineered wind turbine designs, and provide extensive customer support services to wind turbine manufacturers. Our design portfolio includes a broad range of drive trains and power ratings of 2 megawatts (“MW”) and higher. We provide a broad range of power electronics and software-based control systems that are highly integrated and designed for optimized performance, efficiency, and grid compatibility. |
• | Grid. Through our Gridtec Solutions™, our Grid business segment enables electric utilities and renewable energy project developers to connect, transmit and distribute power with exceptional efficiency, reliability, security and affordability. We provide transmission planning services that allow us to identify power grid congestion, poor power quality, and other risks, which help us determine how our solutions can improve network performance. These services often lead to sales of our grid interconnection solutions for wind farms and solar power plants, power quality systems and transmission and distribution cable systems. We also sell ship protection products to the U.S. Navy. |
Our fiscal year begins on April 1 and ends on March 31. When we refer to a particular fiscal year, we are referring to the fiscal year beginning on April 1 of that same year. For example, fiscal 2016 refers to the fiscal year beginning on April 1, 2016. Other fiscal years follow similarly.
Competitive strengths
We believe our competitive strengths position us well to execute on our growth plans in the markets we serve.
• | Unique Solutions for the Wind and Grid Markets. We believe we are the only company in the world that provides wind turbine manufacturers with an integrated approach of wind turbine design and engineering, customer support services and power electronics and control systems. We also believe we are the only company in the world that is able to provide transmission planning services, grid interconnection and voltage control systems as well as superconductor-based transmission and distribution systems for power grid operators. This unique scope of supply provides us with greater insight into our customers’ evolving needs and greater cross-selling opportunities. |
• | Differentiated Technologies. Our PowerModule™ power converters are based on proprietary software and hardware combinations and are used in a broad array of applications, including our D-VAR® grid interconnection and voltage control systems, as well as our wind turbine electrical control systems. Our proprietary Amperium® superconductor wire was engineered to allow us to tailor the product via laminations to meet the electrical and mechanical performance requirements of widely varying end-use applications, including power cables and fault current limiters for the Grid market. |
4
• | Scalable, Low-Cost Manufacturing Platform. Our manufacturing of proprietary electrical control systems and power electronics products are primarily assembly operations with minimal fixed costs. We can increase the production of these products at costs that we believe are low relative to our competitors. Our proprietary manufacturing technique for Amperium wires is modular in nature, which allows us to expand manufacturing capacity at a relatively low incremental cost. |
• | Robust Patent Position and Engineering Expertise. As of March 31, 2017, we owned 385 patents and patent applications worldwide (including international counterparts to U.S. patents), and had rights through exclusive and non-exclusive licenses to approximately 150 additional patents and patent applications worldwide. We believe our technology and manufacturing knowledge base, customer and product expertise and patent portfolio provide a strong competitive position. |
Strategy
Building on these competitive strengths, we plan to focus on driving revenue growth and enhancing our operating results through the objectives defined below.
• | Provide Solutions from Power Generation to Delivery. From the generation source to the distribution system, we focus on providing best-in-class engineering, support services, technologies and solutions that make the world’s power supplies smarter, cleaner and stronger. |
• | Focus on “Megawatt-Scale” Power Offerings. Our research, product development, and sales efforts focus on megawatt-scale offerings ranging from designs of power electronics for large wind turbine platforms to systems that stabilize power flows, integrate renewable power into the grid and carry power to and from transmission and distribution substations. |
• | Pursue Emerging Overseas Markets and Serve Key Markets Locally. We focus our sales efforts on overseas markets that are investing aggressively in renewable energy and power grid projects, and we have been particularly successful in targeting key Asian markets, including India and China. As part of our strategy, we serve our key target markets with local sales and field service personnel, which enables us to understand market dynamics and more effectively anticipate customer needs while also reducing response time. We currently serve target markets such as Australia, China, India, South Africa, the United Kingdom, and the United States. |
• | Product Innovation. We have a strong record of developing unique solutions for megawatt-scale power applications and will continue our focus on investing in innovation. Recently, our product development efforts have included our Resilient Electric Grid (“REG”) system for the electricity grid and ship protection systems for the U.S. Navy. |
Market opportunities
We provide solutions that address three key drivers of our business:
• | the evolving electric grid; |
• | the electrification of the Naval fleet; and |
• | the global demand for renewable energy. |
Wind market overview
According to GlobalData, a research firm, 57 Gigawatts (GW) of wind generation capacity were added worldwide in 2016, as compared to 66 GW in 2015. GlobalData anticipates that more than 60 GW of additional capacity will be added in 2017.
According to GlobalData, annual wind installations in India for 2016 were 3.6 GW, and for 2017 are estimated to be 3.7 GW.
Several factors are expected to drive the future growth in the wind power market, including substantial government incentives and mandates that have been established globally, technological improvements, turbine cost reductions, the development of the offshore wind market, and increasing cost competitiveness with existing power generation technologies. Technological advances, declining turbine production cost and fluctuating prices for some fossil fuels continue to increase the competitiveness of wind versus traditional power generation technologies.
Our solutions for the wind market
We address the challenges of the wind power market by designing and engineering wind turbines, providing extensive support services to wind turbine manufacturers, and manufacturing and selling critical components for wind turbines.
5
• | Electrical Control Systems. We provide full electrical control systems (“ECS”) or a subset of those systems (“core electrical components”) to manufacturers of wind turbines designed by us. Our ECS regulate voltage, control power flows and maximize wind turbine efficiency, among other functions. To date, we have shipped enough core electrical components and complete ECS to power over 16,000 Megawatts (“MW”) of wind power. We believe our ECS represent approximately 5-10% of a wind turbine’s bill of materials. We believe that the annual total addressable market for ECS is approximately $3.6 billion of which the annual addressable market in India is expected to approach $300 million. |
• | Wind Turbine Designs. We design and develop entire state-of-the-art onshore and offshore wind turbines with power ratings of 2 MWs and higher for manufacturers who are in the business of producing wind turbines or who plan to enter the business of manufacturing wind turbines. These customers typically pay us licensing fees, and in some cases royalties for wind turbine designs, and purchase from us the core electrical components or complete electrical control systems needed to operate the wind turbines. |
• | Customer Support Services. We provide extensive customer support services to wind turbine manufacturers. These services range from providing designs for customers’ wind turbine manufacturing plants to establishing and localizing their supply chains and training their employees on proper wind turbine installation and maintenance. We believe these services enable customers to accelerate their entry into the wind turbine manufacturing market and lower the cost of their wind turbine platforms. |
Our approach to the wind energy markets allows our customers to use our world-class turbine engineering capabilities while minimizing their research and development costs. These services and our advanced electrical control systems provide our customers with the ability to produce standardized or next-generation wind turbines at scale for their local market or the global market quickly and cost-effectively. Our team of highly experienced engineers works with clients to customize turbine designs specifically tailored to local markets while providing ongoing access to field services support and future technological advances.
Grid market overview
It is widely believed that the electricity grid in the U.S. is in need of modernization through a technology upgrade if it is to maintain reliability and adapt to the changing market needs. In fact, a report written by The White House in 2013 and titled, “Economic Benefits of Increasing Electric Grid Resilience to Weather Outages” found that economic damage from weather-related power outages averaged between $18 and $33 billion per year between 2003 and 2012 – and went as high as $75 billion in 2008 and $52 billion in 2012, as a result of damage caused by Hurricanes Ike and Sandy, respectively. Furthermore, the electric grid is also vulnerable to equipment failure, acts of terror, and threats to cyber security. Recent events and the reliance of safety, security, and economy on the electricity grid have prompted broad recognition worldwide of the need to modernize and enhance the reliability and security of power grids.
Power grid operators worldwide face various challenges, including:
• | Stability. Power grid operators are confronting power quality and stability issues arising from intermittent renewable energy sources and from the capacity limitations of transmission and overhead distribution lines and underground cables. |
• | Reliability. Traditional transmission lines and cables often reach their reliable voltage stability limit well below their thermal threshold. Driving more power through a power grid when some lines and cables are operating above their voltage stability limit during times of peak demand can cause either unacceptably low voltage in the power grid (a brownout) or risk of a sudden, uncontrollable voltage collapse (a blackout). |
• | Capacity. The traditional way to enable increases in power grid capacity without losing voltage stability is to install more overhead power lines and underground cables. However, permitting new transmission and distribution lines can take 10 years or more due to various public policy issues, such as environmental, aesthetic, and health concerns. In urban and metropolitan areas, installing additional conventional underground copper cables is similarly challenging, since many existing underground corridors carrying power distribution cables are already filled to their physical capacity and cannot accommodate any additional conventional cables. In addition, adding new conduits requires excavation to expand existing corridors or create new corridors, which are costly and disruptive undertakings. |
• | Efficiency. Most overhead lines and underground cables use traditional conductors such as copper and aluminum, which lose power due to electrical resistance. At transmission voltage, electrical losses average about 7% in the United States and other developed nations, but can exceed 20% in some locations due to the distance of the line, quality of conductor, and the power grid’s architecture and characteristics, among other factors. |
• | Security. Catastrophic equipment failures caused by aging equipment, physical and cyber threats, and weather related disasters can leave entire sections of an urban environment without power for hours or days. It can be difficult to recover from extended power outages in urban load centers, worsening situations where the personal safety of residents and the economic health of business are threatened. |
6
Our solutions for the grid market
We address these challenges in the Grid market by providing services and solutions designed to increase the power grid’s capacity, reliability, security and efficiency. We also provide advanced ship protection equipment for the U.S Navy in this segment as each Navy ship can be thought of as having its own power grid. Our solutions include:
• | Superconductor Wire and Applications. Conventional conductors of electricity, such as aluminum and copper wire, lose energy due to resistance. Using a compound of yttrium barium copper oxide (“YBCO”), we manufacture and provide high-temperature superconductor (“HTS”) wire that can conduct many times more electricity than conventional conductors with no power loss. We have developed full system solutions that we sell and expect to continue to sell directly to customers. This business model leverages our applications expertise, drives value beyond the wire and enables us to recognize revenue and take ownership over the marketing and sales of the full systems. These systems include: |
o | Resilient Electric Grid Systems. Our REG system has two primary applications that increase the reliability and the capacity of the urban infrastructure. For applications focused on reliability improvement, the REG cable is best used in a “ring” or “loop” configuration to interconnect nearby urban substations. This enables urban utilities to share transmission connections and excess station capacity, while controlling the high fault currents that naturally result from such interconnections, providing protection against the adverse effects that follow the loss of critical substation facilities in urban areas. We believe a utility installing our REG system could double its reliability (e.g. N-1 to N-2, or greater) by networking substations, which is a solution utilities would generally not consider when using conventional technology due to the disruptive nature and economic disadvantages of conventional technology in urban settings. For applications focused on capacity improvement, the REG cable can be used in a “branch” configuration. In this application, the REG cable connects an existing large urban substation with a new, much smaller, and more simplified substation within the city at a lower cost. The smaller urban substation does not need large power transformers and takes up much less space, thereby significantly reducing real estate, construction, and other related costs in the urban area. The key component to the REG system is a breakthrough cable system that combines very high power handling capacity with fault current limiting characteristics, features that are attributable to our proprietary HTS wire, which we believe allows leaking, aged oil-cooled cables to be replaced with environmentally benign, nitrogen cooled cables. Assuming all urban substations in major cities in the U.S. could be connected with our REG system, we believe the total annual addressable market is approximately $1 billion to $2 billion. | |
o | Ship Protection Systems. The primary focus of our ship protection systems (“SPS”) has been degaussing systems. These systems reduce a Naval ship’s magnetic signature, making it much more difficult for a mine to detect and damage a ship. Traditionally made of heavy copper wire, degaussing is required on all Navy combat ships. Our HTS advanced degaussing system is lightweight, compact, and often outperforms its conventional counterpart. This HTS system is estimated to enable a 50 to 80 percent reduction in total degaussing system weight, offering significant potential for fuel savings or options to add different payloads. The core components of a degaussing system are transferable to other applications being targeted for ship implementation. We are also continuing to work on expanding HTS technology into the fleet through a variety of applications for power, propulsion, and protection equipment. We believe that once we are qualified on a ship platform for SPS, we could sell SPS to the Navy for the duration of the build for the platform, as well as open opportunities to propagate SPS throughout the surface fleet, creating a relatively long-term revenue steam. We estimate that the total addressable market for HTS-based, ship protection systems for the marine market to be between $70.0 million and $120.0 million per year between the years 2020 and 2025. | |
• | FACTS Systems. Flexible alternating current transmission system – or FACTS – is a system that consists of power electronics and other static components used for controlling power flow and voltage in the AC transmission system. FACTS products aim to increase controllability and power transferability of a network, which allows more effective utilization of existing assets, and reduces the need for new transmission lines and facilities to increase electricity availability. Our FACTS sales process begins with our group of experienced transmission planners working with power grid operators, renewable energy developers, and industrial system operators to identify power grid constraints and determine how our solutions might improve network performance. These services often lead to sales of grid interconnection solutions for wind farms and solar power plants, power quality systems for utilities and heavy industrial operations and transmission and distribution cable systems. Our transmission planners work with our customers on the following solutions: |
7
o | D-VAR® Systems. The power that flows through AC networks comprises both real power, measured in watts, and reactive power, measured in Volt Amp Reactive (“VARs”). In simple terms, reactive power is required to support voltage in the power network. D-VAR systems can provide the reactive power needed to stabilize voltage on the grid. These systems also can be used to connect wind farms and solar power plants to the power grid seamlessly as well as to protect certain industrial facilities against voltage swells and sags. AMSC estimates the annual addressable market for FACTS systems such as D-VAR (excluding D-VAR VVO "VVO") to be $600 million. | |
o | D-SVC Systems. Our D-SVC systems are a cost-effective solution that allows large industrial loads to operate on the AC power system while minimizing the impacts of voltage sags and flicker problems, and also provides dynamic, distribution level voltage regulation and power factor control solutions for utilities. Our D-SVC system automatically applies VARs on a cycle-by-cycle basis to maintain steady line voltages adjacent to large inductive loads such as motors, welders, arc furnaces and pipeline pumping stations. | |
o | D-VAR® VVO. We believe VVO will allow us to enter the market for products to serve the distribution power grid. VVO is designed to be a direct-connect 15 kilovolt class power quality system for a utility's distribution network to optimally control voltage as distribution networks are increasingly impacted by distributed generation, such as roof top and community solar. We believe VVO has the potential to save utilities time and money by avoiding costly options to increase the reliability and resiliency of the distribution grid and to allow utilities to build a "plug 'n play" network to serve the demands of modern energy consumers. The intended target markets of VVO are electric distribution grids incorporating distributed generation, including where utility grid modernization attributes such as the following are applicable: mandated efficiency upgrades, mass adoption of rooftop solar, community solar, utility-owned micro-girds, variable load conditions on the distribution grid and voltage regulations alternatives. AMSC estimates the annual addressable market for VVO to be approximately $600 million. | |
• | We are also offering full system solutions through a collaboration with industry leader Nexans: |
o | Stand-alone Fault Current Limiters. Used in substations, superconductor fault current limiters (“SFCLs”) act as surge protectors for the power grid. SFCLs can help protect the grid by reducing the destructive nature of faults, extending the life of existing substation equipment and allowing utilities to defer or eliminate equipment replacements or upgrades. Together with Nexans, we offer SFCLs for medium voltage alternating current (“AC”) networks. | |
Core Technologies
Superconductors
Our second generation (“2G”) HTS wire technology helps us address the smart grid infrastructure market opportunity by providing components and solutions designed to increase the power grid’s capacity, reliability, security and efficiency. Our wire, known as Amperium wire, conducts electricity with zero resistance below about -297 degrees Fahrenheit. Additionally, our 2G wire has the ability to switch to a resistive state whenever a fault current exceeds a predetermined value. This characteristic is a key enabler to our REG system. The technology can be used in many applications including electricity transmission cables, superconducting generators, voltage regulators and degaussing systems for naval vessels. Superconductor power cables, which are a class of high-capacity, environmentally-benign, and easy-to-install transmission and distribution cables, address power grid capacity issues by increasing the thermal limit of existing or new corridors. Superconductor power cables are cylindrically shaped systems consisting of HTS wires (which conduct electricity) surrounded by electrical insulation encased in a metal or polymeric jacket.
Currently, power cables are made primarily using copper wires. Power cables incorporating our Amperium wire are able to carry up to 10 times the electrical current of copper cables of the same diameter. These cable systems also bring efficiency advantages. Traditional cable systems heat up due to the electrical resistance of copper, causing electrical losses. Electrical losses at transmission voltage average about 7% in the United States and other developed nations, but can exceed 20% in some locations due to the distance of the line and the power grid’s architecture and characteristics, among other factors. Conversely, HTS materials can carry direct current (“DC”) with 100% efficiency and AC with nearly 100% efficiency when they are cooled below a critical
8
temperature. As a result, AC HTS power cables lose significantly less power to resistive heating than copper cables, and DC HTS power cables have no energy losses due to resistive heating.
PowerModule Power Converters
Our family of PowerModule power electronic converters incorporates power semiconductor devices that switch, control and move large amounts of power faster and with far less disruption than the electromechanical switches historically used. While today our PowerModule systems are used primarily in our ECS and D-VAR systems, they also have been incorporated into electric motor drives, distributed and dispersed generation devices (micro-turbines, fuel cells, and photovoltaics), power quality solutions, batteries, and flywheel-based uninterruptible power supplies.
Research and Development
Our research and development expenses were $12.5 million, $12.3 million and $11.9 million in fiscal 2016, fiscal 2015 and fiscal 2014, respectively.
Customers
We have designed wind turbines for, or licensed wind turbine designs to, more than 10 wind turbine manufacturing customers including Inox in India. We have also served over 100 customers in the grid market since our inception, including American Electric Power, Long Island Power Authority, M.A. Mortensen Company, and Renewable Energy Systems, LLC in the United States, EDF Group in France, Korean Electric Power Corporation in Korea, SSE plc in the United Kingdom, Consolidated Power Projects (Pty) Ltd in South Africa, and Ergon Energy in Australia. We serve customers globally through a localized sales and field service presence in our core target markets. Additionally, our sales personnel in the United States are supported by manufacturers' representatives.
Facilities and manufacturing
Our primary facilities and their primary functions are as follows:
• | Devens, Massachusetts — Corporate headquarters, superconductors research, development and manufacturing, FACTS product engineering and manufacturing |
• | New Berlin, Wisconsin — Power electronics and controls research and development |
• | Klagenfurt, Austria — Wind turbine engineering |
• | Timisoara, Romania – Electrical Control System and PowerModule power converter manufacturing |
Our global footprint also includes sales and field service offices in China, Australia, Germany, India, Korea and the United Kingdom.
Sales and marketing
Our strategy is to serve customers locally in our core target markets through a direct sales force operating out of sales offices worldwide. In addition, we utilize manufacturers’ sales representatives in the United States to market our products to utilities in North America. The sales force also leverages business development staff for our various offerings as well as our team of wind turbine engineers and power grid transmission planners, all of whom help to ensure that we have an in-depth understanding of customer needs and provide cost-effective solutions for those needs.
In fiscal 2016, 2015 and 2014, Inox accounted for 59%, 62% and 56% of our total revenues, respectively, and no other customer accounted for more than 10% of our total revenues in each of those fiscal years.
The portion of total revenue recognized from customers located outside the United States was 78%, 85% and 86% for fiscal 2016, 2015 and 2014, respectively. Of the revenue recognized from customers outside the United States, we recognized 75%, 73% and 65% from customers in India for fiscal 2016, 2015 and 2014, respectively, and we recognized 3%, 10% and 17% from customers in China in fiscal 2016, 2015 and 2014, respectively. For additional financial information, see the notes to consolidated financial statements included herein, including Note 17, “Business Segments”.
Our foreign operations, particularly our operations in India, China and other emerging markets, expose us to a variety of risks. For a discussion of additional risks associated with our foreign operations, see Item 1A, “Risk Factors – We have operations
9
in, and that depend on sales in, emerging markets, including India, and global conditions could negatively affect our operating results or limit our ability to expand our operations outside of these markets. Changes in India’s political, social, regulatory and economic environment may affect our financial performance.”
Backlog
We had backlog at March 31, 2017 of approximately $65.6 million from government and commercial customers, compared to $88.9 million at March 31, 2016. Current backlog represents the value of contracts and purchase orders received for which delivery is expected during the next twelve months based on contractually agreed-upon terms. The year over year decrease in backlog is driven by lower backlog in both the Wind and Grid business units. See Item 7 – “Management’s Discussion and Analysis of Financial Condition and Results of Operation”, for further discussion of the strategic agreements entered into with Inox.
Competition
We face competition in various aspects of our technology and product development. We believe that competitive performance in the marketplace depends upon several factors, including technical innovation, range of products and services, product quality and reliability, customer service and technical support.
Wind
We face competition from companies offering power electronic converters for use in applications for which we expect to sell our PowerModule products. These companies include ABB, Hopewind, Semikron, Shinergy, Vacon, and Xantrex (a subsidiary of Schneider Electric).
We face competition from companies offering various types of wind turbine electrical system components, which include ABB, Ingeteam, Mita-Teknik, and Woodward. We also face indirect competition in the wind energy market from global manufacturers of wind turbines, such as Gamesa, General Electric, Suzlon, and Vestas.
We face competition for the supply of wind turbine engineering design services from design engineering firms such as GL Garrad Hassan, and from licensors of wind turbine systems such as Aerodyn.
Grid
We face competition from other companies offering FACTS systems similar to our D-VAR products. These include static var compensators (“SVCs”) from ABB, General Electric, AREVA, Mitsubishi Electric, and Siemens; adaptive VAR compensators and STATCOMs produced by ABB, Siemens, and S&C Electric; Dynamic voltage restorers (“DVRs”) produced by companies such as ABB and S&C Electric; and flywheels and battery-based uninterruptable power supply (“UPS”) systems offered by various companies around the world.
We face competition both from suppliers of traditional utility solutions and from companies who are developing HTS wires. We also face competition for our Amperium wire from a number of companies in the United States and abroad. These include Superconductor Technologies and Superpower (a subsidiary of Furukawa) in the United States; Fujikura and Sumitomo in Japan; SuNAM in South Korea; BASF Corporation in Europe (“BASF”), Innova and Shanghai Creative Superconductor in China; and SuperOx in Russia. With our HTS-based REG product, we are offering a new approach that provides alternatives to utilities for power system design. Therefore, we believe that we compete with traditional approaches such as new full-sized substations, overhead and underground transmission, and urban power transformers.
We believe we are currently the only company that can offer HTS-based SPS products that have been fully qualified for use aboard Navy surface combatants. Therefore, the primary competition for our SPS products is currently coming from defense contractors that provide the copper-based systems that our lighter, more efficient HTS versions have been developed to replace. Companies such as L3, Excelis, Raytheon, and Textron have the bulk of the copper-based business today. However, over time, as the HTS-based SPS proliferate to the fleet, companies that have the capability to manufacture and/or package HTS wire into robust, turn-key systems will likely attempt to duplicate our products, and thus additional competition is expected from more traditional HTS competitors such as those listed above.
Many of our competitors have substantially greater financial resources, research and development, manufacturing and marketing capabilities than we do. In addition, as our target markets develop, other large industrial companies may enter these fields and compete with us.
10
Patents, licenses and trade secrets
Patent Background
An important part of our business strategy is to develop a strong worldwide patent position in all of our technology areas. Our intellectual property (“IP”) portfolio includes both patents we own and patents we license from others. We devote substantial resources to building a strong patent position. As of March 31, 2017, we owned (either solely or jointly) 93 U.S. patents and 7 U.S. patent applications on file. We also hold licenses from third parties covering more than 60 issued U.S. patents and patent applications. Together with the international counterparts of each of these patents and patent applications, we own 385 patents and patent applications worldwide, and have rights through exclusive and non-exclusive licenses to more than 150 additional patents and patent applications. We believe that our current patent position, together with our ability to obtain licenses from other parties to the extent necessary, will provide us with sufficient proprietary rights to develop and sell our products. However, for the reasons described below, we cannot assure you that this will be the case.
Despite the strength of our patent position, a number of U.S. and foreign patents and patent applications of third parties relate to our current products, to products we are developing, or to technology we are now using in the development or production of our products. We may need to acquire licenses to those patents, contest the scope or validity of those patents, or design around patented processes or applications as necessary. If companies holding patents or patent applications that we need to license are competitors, we believe the strength of our patent portfolio will significantly improve our ability to enter into license or cross-license arrangements with these companies. We have already successfully negotiated cross-licenses with several competitors. We may be required to obtain licenses to some patents and patent applications held by companies or other institutions, such as national laboratories or universities, not directly competing with us. Those organizations may not be interested in cross-licensing or, if willing to grant licenses, may charge unreasonable royalties. We have successfully obtained licenses related to HTS wire from a number of such organizations with royalties we consider reasonable. Based on historical experience, we expect that we will be able to obtain other necessary licenses on commercially reasonable terms. However, we cannot provide any assurance that we will be able to obtain all necessary licenses from competitors on commercially reasonable terms, or at all.
Failure to obtain all necessary patents, licenses and other IP rights upon reasonable terms could significantly reduce the scope of our business and have a material adverse effect on our results of operations. We do not now know the likelihood of successfully contesting the scope or validity of patents held by others. In any event, we could incur substantial costs in challenging the patents of other companies. Moreover, third parties could challenge some of our patents or patent applications, and we could incur substantial costs in defending the scope and validity of our own patents or patent applications whether or not a challenge is ultimately successful.
Wind and Grid Patents
We have received patents and filed a significant number of additional patent applications on power quality and reliability systems, including our D-VAR products. Our products are covered by more than 60 patents and patents pending worldwide on both our systems and power converter products. The patents and applications focus on inventions that significantly improve product performance and reduce product costs, thereby providing a competitive advantage. One invention of note allows for a reduction in the number of power inverters required in the system by optimally running the inverters in overload mode, thereby significantly reducing overall system costs. Another important invention uses inverters to offset transients due to capacitor bank switching, which provides improved system performance.
Under our Windtec Solutions™ brand, we design a variety of wind turbine systems and license these designs, including expertise and patent rights, to third parties for an upfront fee, plus in some cases, future royalties. Our wind turbine designs are covered by more than 30 patents and patents pending worldwide on wind turbine technology. We have patent coverage on the unique design features of our blade pitch control system, which ensures optimal aerodynamic flow conditions on the turbine blades and improves system efficiency and performance. The pitch system includes a patented SafetyLOCK™ feature that causes the blades to rotate to a feathered position to prevent the rotor blades from spinning during a fault.
We recognize the importance of IP protection in China and believe that China is steadily moving toward recognizing and acting in accordance with international norms for IP. As such, we have incorporated China in our patent strategy for all of our various products. Nevertheless, we recognize that the risk of IP piracy is still higher in China than in most other industrialized countries, and so we are careful to limit the technology we provide through our product sales in China. While we take the steps necessary to ensure the safety of our IP, we cannot provide any assurance that these measures will be fully successful. For example, see Part I, Item 3, “Legal Proceedings,” for more information regarding legal proceedings that we have undertaken against Sinovel Wind Group Co., Ltd (“Sinovel”) alleging the illegal use of our intellectual property.
11
HTS Patents
Since the discovery of high temperature superconductors in 1986, rapid technical advances have characterized the HTS industry, which in turn have resulted in a large number of patents, including overlapping patents, relating to superconductivity. As a result, the patent situation in the field of HTS technology and products is unusually complex. We have obtained licenses to patents and patent applications covering some HTS materials. We have acquired exclusive rights (through 2017) to a fundamental U.S. patent (U.S. 8,060,169 B1) covering 2G and similar HTS wire and applications and are currently evaluating whether to negotiate with the licensor to extend the exclusivity period, to exercise our rights to continue to use such patent under a non-exclusive license or to allow our rights under the license to lapse. However, we may have to obtain additional licenses to HTS materials and, upon expiration of U.S. 8,060,169, to the materials covered by such patent.
We are focusing on the production of our Amperium wire, and we intend to continue to maintain a leadership position in 2G HTS wire through a combination of patents, licenses and proprietary expertise. In addition to our owned patents and patent applications in 2G HTS wire, we have obtained licenses from (i) MIT for the MOD process we use to deposit the YBCO layer, (ii) Alcatel-Lucent on the YBCO material, and (iii) the University of Tennessee/Battelle for the RABiTS® process we use for the substrate and buffer layers for this technology. During fiscal 2015, we entered into a Joint Development Agreement (“JDA”) and licensed certain of our HTS manufacturing process technology to BASF. Under the JDA, we agreed with BASF to develop a new solutions-based deposition technology for the interface layers of our Amperium wire. Should this development effort be successful, any newly developed intellectual property as a result of the JDA will be owned by BASF, but we will have the right to incorporate this new technology into our manufacturing process on a royalty-free basis. Alternatively, we could purchase HTS wire directly from BASF should they decide to manufacture and sell HTS wire. If alternative processes become more promising in the future, we also expect to seek to develop a proprietary position in these alternative processes.
We have a significant number of patents and patents pending covering applications of HTS wire, such as HTS fault current limiting technology including our fault current limiting cable, HTS rotating machines and ship protection systems. Since the superconductor rotating machine and the fault current limiting cable applications are relatively new, we are building a particularly strong patent position in these areas. At present, we believe we have the world’s broadest and most fundamental patent position in superconductor rotating machines technology. We have also filed a series of patents on our concept for our proprietary fault current limiting technology. However, there can be no assurance that that these patents will be sufficient to assure our freedom of action in these fields without further licensing from others. See Part I, Item 1A, “Risk Factors,” for more information regarding the status of the commercialization of our Amperium wire products.
Trade Secrets
Some of the important technology used in our operations and products is not covered by any patent or patent application owned by or licensed to us. However, we take steps to maintain the confidentiality of this technology by requiring all employees and all consultants to sign confidentiality agreements and by limiting access to confidential information. We cannot provide any assurance that these measures will prevent the unauthorized disclosure or use of that information. For example, see Part I, Item 3, “Legal Proceedings,” for more information regarding legal proceedings that we have filed against Sinovel alleging the illegal use of our intellectual property. In addition, we cannot provide any assurance that others, including our competitors, will not independently develop the same or comparable technology that is one of our trade secrets.
Employees
As of March 31, 2017, we employed 354 persons. None of our employees is represented by a labor union.
In April 2017, we announced that our board of directors had approved a plan to reduce our global workforce by approximately 8%, effective April 4, 2017. The majority of the affected employees were located at our Devens, Massachusetts office location. The purpose of the workforce reduction was to reduce operating expenses to better align with our current revenues.
Available information
Our internet address is www.amsc.com. We are not including the information contained in our website as part of, or incorporating it by reference into, this document. We make available, free of charge, through our website our annual reports on Form 10-K, quarterly reports on Form 10-Q, current reports on Form 8-K and amendments to these reports filed or furnished pursuant to Section 13(a) or 15(d) of the Exchange Act, as soon as reasonably practicable after we electronically file such materials with, or furnish such materials to, the SEC.
We intend to disclose on our website any amendments to, or waivers of, our Code of Business Conduct and Ethics that are required to be disclosed pursuant to the SEC or Nasdaq rules.
12
Executive officers of the registrant
The table and biographical summaries set forth below contain information with respect to our executive officers as of the date of this filing:
Name | Age | Position | |||
Daniel P. McGahn | 45 | President, Chief Executive Officer and Director | |||
John W. Kosiba, Jr. | 44 | Senior Vice President, Chief Financial Officer and Treasurer | |||
Daniel P. McGahn joined us in December 2006 and has been chief executive officer and a member of our board of directors since June 2011. He previously served as president and chief operating officer from December 2009 to June 2011, as senior vice president and general manager of our AMSC Superconductors business unit from April 2008 until December 2009, as vice president of our AMSC Superconductors business unit from March 2007 to April 2008 and as vice president of strategic planning and development from December 2006 to March 2007. From 2003 to 2006, Mr. McGahn served as executive vice president and chief marketing officer of Konarka Technologies. We believe Mr. McGahn’s qualifications to sit on our board of directors include his extensive experience with our company, including serving as our president since 2009, experience in the power electronics industry and strategic planning expertise gained while working in senior management as a consultant for other public and private companies.
John W. Kosiba, Jr. was appointed senior vice president, chief financial officer and treasurer effective April 4, 2017. Mr. Kosiba joined us as managing director, finance operations, in June 2010. He then served as vice president, finance operations, from September 2011 to May 2013. Prior to his appointment as senior vice president and chief financial officer, Mr. Kosiba served most recently as senior vice president, Gridtec solutions and finance operations, where he was responsible for (i) overseeing finance and accounting operations, budgeting, strategic planning and financial planning and analysis for the company, and (ii) managing the day-to-day business operations of our Gridtec solutions’ business segment. From January 2008 until June 2010, Mr. Kosiba served as division director and controller of Amphenol Aerospace, a division of Amphenol Corporation and a manufacturer of interconnect products for the military, commercial aerospace and industrial markets. In this role, Mr. Kosiba was responsible for overseeing finance, accounting, budgeting, audit and all aspects of financial planning and analysis for the division.
13
Item 1A. | RISK FACTORS |
Risks Related to Our Financial Performance
We have a history of operating losses, which may continue in the future. Our operating results may fluctuate significantly from quarter to quarter and may fall below expectations in any particular fiscal quarter.
We have recorded net losses in each of the last three fiscal years, including a net loss of $27.4 million for the fiscal year ended March 31, 2017, and it is unlikely that we will be profitable in fiscal 2017. We cannot be certain that we will regain profitability in the future.
There is currently substantial uncertainty in our business, which makes it difficult to evaluate our business and future prospects. In addition, our operating results historically have been difficult to predict and have at times fluctuated from quarter to quarter due to a variety of factors, many of which are outside of our control. As a result of all of these factors, comparing our operating results on a period-to-period basis may not be meaningful, and you should not rely on our past results as an indication of our future performance. In addition, we have in the past, and may continue to, provide public guidance on our expected operating and financial results for future periods. Such guidance is comprised of forward-looking statements subject to the risks and uncertainties described in this report and in our other public filings and statements. Our actual results may not always be in line with or exceed the guidance we have provided. If our revenue or operating results fall below the expectations of investors or any securities analysts that follow our company in any period or we do not meet our guidance, the trading price of our common stock would likely decline.
Our operating expenses do not always vary directly with revenue and may be difficult to adjust in the short term. As a result, if revenue for a particular quarter is below our expectations, we may not be able to proportionately reduce operating expenses for that quarter, and therefore such a revenue shortfall would have a disproportionate effect on our operating results for that quarter.
We have a history of negative operating cash flows, and we may require additional financing in the future, which may not be available to us.
As of March 31, 2017, we had approximately $27.7 million of cash, cash equivalents, and restricted cash, and during the fiscal year ended March 31, 2017, we used $11.2 million in cash for our operating activities. We have experienced substantial net losses, including a net loss of $27.4 million for the fiscal year ended March 31, 2017. From April 1, 2011 through the date of this Annual Report, our various restructuring activities have resulted in a substantial reduction of our global workforce, including our announcements in April 2017 that we are exploring options for moving our manufacturing and administrative operations in Devens, Massachusetts to a nearby, smaller-scale building and reducing our global workforce by approximately 8%. We plan to continue to closely monitor our expenses and, if required, will further reduce operating costs and capital spending to enhance liquidity.
Our liquidity is highly dependent on our ability to profitably grow our revenues, control our operating costs, and secure additional financing, if required. We may require additional capital to conduct our business and adequately respond to future business challenges or opportunities, including, but not limited to, the need to develop new products or enhance existing products, maintaining or expanding research and development projects, to collateralize performance bonds or letters of credit, and the need to build inventory or to invest other cash to support business growth. In order to raise additional capital, we may offer shares of our common stock or other securities convertible into or exchangeable for our common stock. To the extent that we raise additional capital through the sale of equity or convertible debt securities, the ownership interest of each of our existing stockholders will be diluted, and the terms of these securities may include liquidation or other preferences that adversely affect the rights of our common stockholders.
In the event that additional liquidity is required, there can be no assurance that such financing would be available or, if available, that such financing could be obtained upon terms acceptable to us, which would have a material adverse effect on our business, financial condition and prospects.
We may be required to issue performance bonds or provide letters of credit, which restricts our ability to access any cash used as collateral for the bonds or letters of credit.
While we have been required to provide performance bonds in the form of surety bonds or other forms of security and letters of credit in the past, the size of the bonds and letters of credit was not material. In recent years, we have entered into contracts that require us to post bonds of significant magnitude and some of our suppliers have asked us to provide letters of credit. In many instances, we have been required to deposit cash in escrow accounts as collateral for these instruments, which is unavailable to us for general use for significant periods of time. Should we be unable to obtain performance bonds or letters of credit in the future,
14
significant future potential revenue could become unavailable to us. Further, should our working capital situation deteriorate, we would not be able to access the restricted cash to meet working capital requirements.
Changes in exchange rates could adversely affect our results from operations.
Currency exchange rate fluctuations could have an adverse effect on our revenues and results of operations, and we could experience losses with respect to hedging activities. In fiscal 2016, 78% of our revenues were recognized from sales outside the United States. In addition, approximately 61% of our revenues in fiscal 2016 were derived under sales contracts where prices were denominated in the Euro. Unfavorable currency fluctuations could require us to increase prices to foreign customers, which could result in a lesser number of orders, and therefore lower revenues, from such customers. Alternatively, if we do not adjust the prices for our products in response to unfavorable currency fluctuations, our results of operations could be adversely affected. In addition, most sales made by our foreign subsidiaries are denominated in the currency of the country in which these products are sold, and the currency they receive in payment for such sales could be less valuable at the time of receipt as a result of exchange rate fluctuations. However, we cannot be certain that our efforts will be adequate to protect us against significant currency fluctuations or that such efforts will not expose us to additional exchange rate risks.
If we fail to maintain proper and effective internal control over financial reporting, our ability to produce accurate and timely financial statements could be impaired and may lead investors and other users to lose confidence in our financial data.
Maintaining effective internal control over financial reporting is necessary for us to produce reliable financial statements.
We note that a system of procedures and controls, no matter how well conceived and operated, can provide only reasonable, not absolute, assurance that the objectives of the control system are met. Because of the inherent limitations in all systems of procedures and controls, no evaluation can provide absolute assurance that all control issues, including instances of fraud, if any, have been detected. These inherent limitations include the realities that judgments in decision-making can be faulty, and breakdowns can occur because of simple errors or mistakes. Additionally, procedures and controls can be circumvented by the individual acts of some persons, by collusion of two or more people, or by management override. The design of any system of procedures and controls also is based, in part, upon certain assumptions about the likelihood of future events, and there can be no assurance that any design will succeed in achieving its stated goals under all potential future conditions. Over time, our systems of procedures and controls, as we further develop and enhance them, may become inadequate because of changes in conditions, or the degree of compliance with the policies or procedures may deteriorate. Because of the inherent limitations in a cost-effective system of procedures and controls, misstatements due to errors or fraud may occur and not be detected. Such misstatements could be material and require a restatement of our financial statements.
If we are unable to maintain effective internal controls, we may not have adequate, accurate or timely financial information, and we may be unable to meet our reporting obligations or comply with the requirements of the SEC or the Sarbanes-Oxley Act of 2002, which could result in the imposition of sanctions, including the inability of registered broker dealers to make a market in our common stock, or investigation by regulatory authorities. Any such action or other negative results caused by our inability to meet our reporting requirements or comply with legal and regulatory requirements or by disclosure of an accounting, reporting or control issue could adversely affect the trading price of our securities and our business. Significant deficiencies or material weaknesses in our internal control over financial reporting could also reduce our ability to obtain financing or could increase the cost of any financing we obtain.
Risks Related to Our Operations
A significant portion of our revenues are derived from a single customer. If this customer’s business is negatively affected, it will adversely impact our business
Our largest customer is Inox in India. Inox accounted for 59% of our total revenues during the fiscal year ended March 31, 2017, and 62% of our revenues during the fiscal year ended March 31, 2016, and 56% of our total revenues during the fiscal year ended March 31, 2015. Revenues from Inox are supported by a supply contract to purchase, and a license to make, use and supply, wind turbine ECS. If Inox cancels or does not perform under such contracts or discontinues future purchases from us under the supply contract, we would likely be unable to replace the related revenues. In this regard, certain states in India are seeking to re-negotiate recent power purchase agreements, which include feed-in tariffs that are higher than the tariff resulting from the nation’s first wind power auction in February 2017, resulting in delays and uncertainty for some wind energy projects in India. Such actions have negatively affected shipments of ECS by us to Inox, resulting in lower than expected revenue in the fourth quarter of fiscal 2016. Although we believe, based on our discussions with Inox, that this demand dislocation is temporary, we can provide no assurance that these or other actions in the future will not have a negative effect on our business. Any of the foregoing actions would have a material adverse impact on our operating results and financial position.
15
Our financial condition may have an adverse effect on our customer and supplier relationships.
Our relationships with our customers and suppliers are predicated on the belief that we will continue to operate. Our customers, particularly in the utility industry, are generally risk averse and may not enter into sales contracts with us if there is uncertainty regarding our ability to continue operating through the term of our warranty obligation. This has had, and may continue to have, an adverse effect on our ability to grow our revenues. In addition, current and future suppliers may be less likely to grant us credit, resulting in a negative impact on our working capital and cash flows.
Our contracts with the U.S. government are subject to audit, modification or termination by the U.S. government and include certain other provisions in favor of the government. The continued funding of such contracts remains subject to annual congressional appropriation, which, if not approved, could reduce our revenue and lower or eliminate our profit.
As a company that contracts with the U.S. government, we are subject to financial audits and other reviews by the U.S. government of our costs and performance, accounting, and general business practices relating to these contracts. Based on the results of these audits, the U.S. government may adjust our contract-related costs and fees. We cannot be certain that adjustments arising from government audits and reviews would not have a material adverse effect on our results of operations.
Our U.S. government contracts customarily contain other provisions that give the government substantial rights and remedies, many of which are not typically found in commercial contracts, including provisions that allow the government to:
• | obtain certain rights to the intellectual property that we develop under the contract; |
• | decline to award future contracts if actual or apparent organizational conflicts of interest are discovered, or to impose organizational conflict mitigation measures as a condition of eligibility for an award; |
• | suspend or debar us from doing business with the government or a specific government agency; and |
• | pursue criminal or civil remedies under the False Claims Act, False Statements Act and similar remedy provisions unique to government contracting. |
All of our U.S. government contracts can be terminated by the U.S. government for its convenience, including our contract with the Department of Homeland Security (“DHS”) to deploy our REG system in Commonwealth Edison’s (“ComEd”) electric grid in Chicago, Illinois (“Project REG”). Moving to the manufacturing and construction stage of Project REG is dependent upon both DHS and ComEd agreeing to proceed following the successful completion of a detailed deployment plan. We can provide no assurance that DHS and ComEd will agree to proceed with the project. Termination-for-convenience provisions typically provide only for our recovery of costs incurred or committed, and for settlement of expenses and profit on work completed prior to termination. In addition to the right of the U.S. government to terminate its contracts with us, U.S. government contracts are conditioned upon the continuing approval by the U.S. Congress of the necessary spending to honor such contracts. Congress often appropriates funds for a program on a fiscal year basis even though contract performance may take more than one year. Consequently, at the beginning of many major governmental programs, contracts often may not be fully funded, and additional monies are then committed to the contract only if, as and when appropriations are made by the U.S. Congress for future fiscal years.
We cannot be certain that our U.S. government contracts, including our contract for Project REG, will not be terminated or suspended in the future. The U.S. government’s termination of, or failure to fully fund, one or more of our contracts would have a negative impact on our operating results and financial condition. Further, in the event that any of our government contracts are terminated for cause, it could affect our ability to obtain future government contracts which could, in turn, seriously harm our ability to develop our technologies and products.
Our success in addressing the wind energy market is dependent on the manufacturers that license our designs.
Because an important element of our strategy for addressing the wind energy market involves the license of our wind turbine designs to manufacturers of those systems, the financial benefits to us from our products for the wind energy market are dependent on the success of these manufacturers in selling wind turbines based on our designs. We may not be able to enter into marketing or distribution arrangements with third parties on financially acceptable terms, or at all, and third parties may not be successful in selling our products or applications incorporating our products.
Our success is dependent upon attracting and retaining qualified personnel and our inability to do so could significantly damage our business and prospects.
We have attracted a highly skilled management team and specialized workforce, including scientists, engineers, researchers, manufacturing, marketing and sales professionals. Hiring and retaining good personnel for our business is challenging, and highly
16
qualified technical personnel are likely to remain a limited resource for the foreseeable future. We may not be able to hire the necessary personnel to implement our business strategy. In addition, we may need to provide higher compensation or more training to our personnel than we currently anticipate. Moreover, any officer or employee can terminate his or her relationship with us at any time.
Over the past several years, we have substantially reduced our global workforce in order to lower expenses, reorganize our global operations, and streamline various functions of the business, to match the demand for our products. We recently announced that the board of directors of the Company approved a plan to reduce the Company’s global workforce by approximately 8%, effective April 4, 2017. Employee retention may be a particularly challenging issue following reductions in workforce and organizational changes since we also must continue to motivate employees and keep them focused on our strategies and goals. Losing the services of any of our executive officers or key employees could materially and adversely impact our business.
Failure to successfully execute any move of our Devens, Massachusetts manufacturing facility or achieve expected savings following any move could adversely impact our financial performance.
As part of our effort to increase manufacturing efficiency, we intend to move our manufacturing facility located in Devens, Massachusetts to a nearby smaller-scale facility. If the move is successful, we expect that our Grid products, including D-VAR® systems, VVO products, HTS wire, and ship protection system products will be produced exclusively at the new facility. Moving production to a different plant involves various risks, including the inability to commence manufacturing within the cost and timeframe estimated, damage to equipment, inability to produce a high quality product, shipping delays, and the inability to hire and to retain a sufficient number of qualified personnel. Failure to successfully implement a move of our Devens, Massachusetts facility due to these and other unforeseen risks could adversely affect our ability to meet customer demand for Grid products and could increase the cost of production versus projections, both of which could adversely impact our operating and financial results.
We may not realize all of the sales expected from our backlog of orders and contracts.
We cannot assure you that we will realize the revenue we expect to generate from our backlog in the periods we expect to realize such revenue, or at all.
In addition, the backlog of orders, if realized, may not result in profitable revenue. Backlog represents the value of contracts and purchase orders received for which delivery is expected in the next twelve months. Our customers have the right under some circumstances and with some penalties or consequences to terminate, reduce or defer firm orders that we have in backlog. In addition, our government contracts are subject to the risks described below. If our customers terminate, reduce or defer firm orders, we may be protected from certain costs and losses, but our sales will nevertheless be adversely affected and we may not generate the revenue we expect.
Although we strive to maintain ongoing relationships with our customers, there is an ongoing risk that they may cancel orders or reschedule orders due to fluctuations in their business needs or purchasing budgets.
Our business and operations would be adversely impacted in the event of a failure or security breach of our information technology infrastructure.
We rely upon the capacity, reliability, and security of our information technology hardware and software infrastructure and our ability to expand and update this infrastructure in response to our changing needs. We are constantly updating our information technology infrastructure. Any failure to manage, expand, and update our information technology infrastructure or any failure in the operation of this infrastructure could harm our business.
Despite our implementation of security measures, our systems are vulnerable to damages from computer viruses, natural disasters, unauthorized access and other similar disruptions. Our business is also subject to break-ins, sabotage, and intentional acts of vandalism by third parties as well as employees. Our business activities in China may increase our risks to such breaches. For example, a former employee of our Austrian subsidiary pled guilty in September 2011 to charges of economic espionage and fraudulent manipulation of data. The evidence presented during the trial showed that this former employee was contracted by Sinovel through an intermediary while employed by us and improperly obtained and transferred to Sinovel portions of our wind turbine control software source code developed for Sinovel’s 1.5MW wind turbines. Moreover, the evidence shows that this former employee illegally used source code to develop, for Sinovel, a software modification to circumvent the encryption and remove technical protection measures on the PM3000 power converters in 1.5MW wind turbines in the field. Any system failure, accident, or security breach could result in disruptions to our operations. To the extent that any disruption or security breach results in a loss or damage to our data, or inappropriate disclosure of confidential information, it could harm our business. In addition, we may be required to incur significant costs to protect against damage caused by these disruptions or security breaches in the future.
17
We rely upon third-party suppliers for the components and subassemblies of many of our Wind and Grid products, making us vulnerable to supply shortages and price fluctuations, which could harm our business.
Many of our components and subassemblies are currently manufactured for us by a limited number of qualified suppliers. Any interruption in the supply of components or subassemblies, or our inability to obtain substitute components or subassemblies from alternate sources at acceptable prices in a timely manner, could impair our ability to meet the demand of our customers, which would have an adverse effect on our business and operating results.
We are producing certain Wind products in our manufacturing facility in Romania. In order to minimize costs and time to market, we have and will continue to identify local suppliers that meet our quality standards to produce certain of our subassemblies and components. These efforts may not be successful. In addition, any event which negatively impacts our supply, including, among others, wars, terrorist activities, natural disasters and outbreaks of infectious disease, could delay or suspend shipments of products or the release of new products or could result in the delivery of inferior products. Our revenues from the affected products would decline or we could incur losses until such time as we are able to restore our production processes or put in place alternative contract manufacturers or suppliers. Even though we carry business interruption insurance policies, we may suffer losses as a result of business interruptions that exceed the coverage available under our insurance policies.
Many of our revenue opportunities are dependent upon subcontractors and other business collaborators.
Many of the revenue opportunities for our business involve projects, such as the installation of superconductor cables in power grids and electrical system hardware in wind turbines, in which we collaborate with other companies, including suppliers of cryogenic systems, manufacturers of electric power cables and manufacturers of wind turbines. As a result, most of our current and planned revenue-generating projects involve business collaborators on whose performance our revenue is dependent. If these business collaborators fail to deliver their products or perform their obligations on a timely basis or fail to generate sufficient demand for the systems they manufacture, our revenue from the project may be delayed or decreased, and we may not be successful in selling our products.
If we fail to implement our business strategy successfully, our financial performance could be harmed.
Our future financial performance and success are dependent in large part upon our ability to implement our business strategy successfully. Our business strategy envisions several initiatives, including driving revenue growth and enhancing operating results by increasing customer adoption of our products by targeting high-growth segments with commercial products, pursuing overseas markets, anticipating customer needs in the development of system-level solutions, strengthening our technology leadership while lowering cost and pursuing targeted strategic alliances. We may not be able to implement our business strategy successfully or achieve the anticipated benefits of our business plan. If we are unable to do so, our long-term growth and profitability may be adversely affected. Even if we are able to implement some or all of the initiatives of our business plan successfully, our operating results may not improve to the extent we anticipate, or at all. In addition, to the extent we have misjudged the nature and extent of industry trends or our competition, we may have difficulty in achieving our strategic objectives. Any failure to implement our business strategy successfully may adversely affect our business, financial condition and results of operations. In addition, we may decide to alter or discontinue certain aspects of our business strategy at any time.
Our ability to implement our business strategy could also be affected by a number of factors beyond our control, such as increased competition, legal developments, government regulation, general economic conditions, or increased operating costs or expenses.
Problems with product quality or product performance may cause us to incur warranty expenses and may damage our market reputation and prevent us from achieving increased sales and market share.
Consistent with customary practice in our industry, we guarantee our products and/or services to be free from defects in material and workmanship under normal use and service. We generally provide a one- to three-year warranty on our products, commencing upon installation. A provision is recorded upon revenue recognition to cost of revenues for estimated warranty expense based on historical experience. The possibility of future product failures or issues related to services we provided could cause us to incur substantial expenses to repair or replace defective products or re-perform such services. Furthermore, widespread product failures may damage our market reputation and reduce our market share and cause sales to decline.
Many of our customers outside of the United States may be either directly or indirectly related to governmental entities, and we could be adversely affected by violations of the United States Foreign Corrupt Practices Act and similar worldwide anti-bribery laws outside the United States.
18
The U.S. Foreign Corrupt Practices Act and similar worldwide anti-bribery laws in non-U.S. jurisdictions generally prohibit companies and their intermediaries from making improper payments to non-U.S. officials for the purpose of obtaining or retaining business. Many of our customers outside of the United States are, either directly or indirectly, related to governmental entities and are therefore subject to such anti-bribery laws. Our policies mandate compliance with these anti-bribery laws. We operate in many parts of the world that have experienced governmental corruption to some degree, and in certain circumstances strict compliance with anti-bribery laws may conflict with local customs and practices. Our internal control policies and procedures may not always protect us from reckless or criminal acts committed by our employees or agents. Violations of these laws, or allegations of such violations, could disrupt our business and result in a material adverse effect on our business, results of operations and financial condition.
We have had limited success marketing and selling our superconductor products and system-level solutions, and our failure to more broadly market and sell our products and solutions could lower our revenue and cash flow.
To date, we have had limited success marketing and selling our superconductor products and system-level solutions, and there are few people who have significant experience marketing or selling superconductor products and system-level solutions. Once our products and solutions are ready for widespread commercial use, we will have to develop a marketing and sales organization that will effectively demonstrate the advantages of our products over both more traditional products and competing superconductor products or other technologies. We may not be successful in our efforts to market this technology and we may not be able to establish an effective sales and distribution organization.
We may decide to enter into arrangements with third parties for the marketing or distribution of our products, including arrangements in which our products, such as Amperium wire, are included as a component of a larger product, such as a power cable system. By entering into marketing and sales alliances, the financial benefits to us of commercializing our products will be dependent on the efforts of others.
We may acquire additional complementary businesses or technologies, which may require us to incur substantial costs for which we may never realize the anticipated benefits.
Our prior acquisitions required substantial integration and management efforts. As a result of any acquisition we pursue, management’s attention and resources may be diverted from our other businesses. An acquisition may also involve the payment of a significant purchase price, which could reduce our cash position or dilute our stockholders, and require significant transaction-related expenses.
Achieving the benefits of any acquisition involves additional risks, including:
• | difficulty assimilating acquired operations, technologies and personnel; |
• | inability to retain management and other key personnel of the acquired business; |
• | changes in management or other key personnel that may harm relationships with the acquired business’s customers and employees; |
• | unforeseen liabilities of the acquired business; |
• | diversion of management’s and employees’ attention from other business matters as a result of the integration process; |
• | mistaken assumptions about volumes, revenue and costs, including synergies; |
• | limitations on rights to indemnity from the seller; |
• | mistaken assumptions about the overall costs of equity or debt used to finance the acquisition; and |
• | unforeseen difficulties operating in new product areas, with new customers, or in new geographic areas. |
We cannot provide any assurance that we will realize any of the anticipated benefits of any acquisition, and if we fail to realize these anticipated benefits, our operating performance could suffer.
Risks Related to Our Markets
Our success depends upon the commercial use of high temperature superconductor (“HTS”) products, which is currently limited, and a widespread commercial market for our products may not develop.
To date, there has been no widespread commercial use of HTS products. Even if the technological hurdles currently limiting commercial uses of HTS products are overcome, it is uncertain whether a robust commercial market for those new and unproven products will ever develop. To date, many projects to install superconductor cables and products in power grids have been funded
19
or subsidized by the governmental authorities. If this funding is curtailed, grid operators may not continue to use superconductor cables and products in their projects.
In addition, we believe in-grid demonstrations of superconductor power cables are necessary to convince utilities and power grid operators of the benefits of this technology. Even if a project is funded, completion of projects can be delayed as a result of other factors.
It is possible that the market demands we currently anticipate for our HTS products will not develop and that they will never achieve widespread commercial acceptance. In such event, we would not be able to implement our strategy, and our profits could be reduced or eliminated. Even if a commercial market for our HTS products were to develop, commercial terms requested by utilities and power grid operators relating to bonding requirements, limitations of liability, warranty periods, or other contractual provisions, may not be acceptable to us, which could impede our ability to enter into contractual arrangements for the sale of our HTS products.
Growth of the wind energy market depends largely on the availability and size of government subsidies, economic incentives and legislative programs designed to support the growth of wind energy.
At present, the cost of wind energy exceeds the cost of conventional power generation in many locations around the world. Various governments have used different policy initiatives to encourage or accelerate the development and adoption of wind energy and other renewable energy sources. Renewable energy policies are in place in the European Union, certain countries in Asia, including India, China, Japan and South Korea, and many of the states in Australia and the United States. Examples of government sponsored financial incentives include capital cost rebates, feed-in tariffs, tax credits, net metering and other incentives to end-users, distributors, system integrators and manufacturers of wind energy products to promote the use of wind energy and to reduce dependency on other forms of energy. In the United States, various legislation and regulations designed to support the growth of wind energy have been implemented or proposed by the federal government, such as the Production Tax Credit for Renewable Energy (PTC) and the Clean Power Plan. Governments may decide to reduce or eliminate these economic incentives, or curtail legislative programs supportive of wind energy technologies for political, financial or other reasons. For example, during the 2016 presidential election campaign, the new U.S. presidential administration made comments suggesting that it was not supportive of various clean energy programs and initiatives designed to curtail global warming. Reductions in, or eliminations of, government subsidies, economic incentives or favorable legislative programs before the wind energy industry reaches a sufficient scale to be cost-effective in a non-subsidized marketplace could reduce demand for our products and adversely affect our business prospects and results of operations.
We have operations in, and depend on sales in, emerging markets, including India, and global conditions could negatively affect our operating results or limit our ability to expand our operations outside of these markets. Changes in India’s political, social, regulatory and economic environment may affect our financial performance.
We have operations in India and in recent years a significant portion of our total revenues has been derived from customers in this market. Our financial performance depends upon our ability to carry on our operations and market our products in markets such as India, as well as other emerging markets around the world. We are, and will continue to be, subject to financial, political, economic and business risks in connection with our operations and sales in these emerging markets. In addition to the business risks inherent in developing and servicing these markets, economic conditions may be more volatile, legal and regulatory systems less developed and predictable, and the possibility of various types of adverse governmental action more pronounced in emerging markets. In addition, inflation, fluctuations in currency and interest rates, competitive factors, civil unrest and labor problems could affect our revenues, expenses and results of operations. Our operations could also be adversely affected by acts of war, terrorism or the threat of any of these events as well as government actions such as controls on imports, exports and prices, tariffs, new forms of taxation, or changes in fiscal regimes and increased government regulation in the countries in which we operate or service customers. Unexpected or uncontrollable events or circumstances in any of these markets could have a material adverse effect on our financial results and cash flows.
Our financial performance could be affected by the political and social environment in India. In recent years, India has experienced civil unrest and terrorism and has been involved in conflicts with neighboring countries. The potential for hostilities between India and Pakistan has been high in light of tensions related to recent terrorist incidents in India and the unsettled nature of the regional geopolitical environment, including events in and related to Afghanistan and Iraq.
With respect to our activities in all emerging markets, we may be impacted by issues with managing foreign sales operations, including long payment cycles, potential difficulties in accounts receivable collection and, especially from significant customers, fluctuations in the timing and amount of orders. The adverse effect of any of these issues on our business could be increased due to the concentration of our business with a small number of customers. Operations in foreign countries also expose us to risks
20
relating to difficulties in enforcing our proprietary rights, currency fluctuations and adverse or deteriorating economic conditions. If we experience problems with obtaining registrations, compliance with foreign country or applicable U.S. laws, or if we experience difficulties in payments or intellectual property matters in foreign jurisdictions, or if significant political, economic or regulatory changes occur, our results of operations would be adversely affected.
Our products face intense competition, which could limit our ability to acquire or retain customers.
The markets for our products are intensely competitive and many of our competitors have substantially greater financial resources, research and development, manufacturing and marketing capabilities than we do. In addition, as our target markets develop, other large industrial companies may enter these fields and compete with us.
Our Wind business faces competition for the supply of wind turbine engineering design services from design engineering firms such as GL Garrad Hassan, and from licensors of wind turbine systems such as Aerodyn.
Our Wind business also faces competition from companies offering power electronic converters for use in applications for which we expect to sell our PowerModule products. These companies include ABB, Hopewind, Semikron, Shinergy, Vacon and Xantrex (a subsidiary of Schneider Electric).
Finally, our Wind business faces competition from companies offering wind turbine electrical system components, including ABB, Ingeteam, Mita-Teknik, and Woodward. We also face indirect competition in the wind energy market from global manufacturers of wind energy systems, such as Gamesa, General Electric, Suzlon and Vestas.
Our Grid business faces competition from companies offering FACTS systems similar to our D-VAR products. These include SVCs from ABB, General Electric, AREVA, Mitsubishi Electric and Siemens; adaptive VAR compensators and STATCOMs produced by ABB, Siemens, and S&C Electric; dynamic voltage restorers produced by companies such as ABB and S&C Electric; and flywheels and battery-based UPS systems offered by various companies around the world.
Our Grid business also faces competition both from suppliers of traditional wires made from materials such as copper and from companies who are developing HTS wires.
Finally, our Grid business faces competition for our Amperium wire from a number of companies in the United States and abroad who are developing 2G HTS wire technology. These include Superconductor Technologies and Superpower (a subsidiary of Furukawa) in the United States; Fujikura, and Sumitomo in Japan; SuNAM in South Korea; BASF in Europe; Innova and Shanghai Creative Superconductor in China; and SuperOx in Russia. With our HTS-based REG product, we are offering a new approach that provides alternatives to utilities for power system design. Therefore, we believe that we compete with traditional approaches such as new full-sized substations, overhead and underground transmission, and urban power transformers.
We believe we are currently the only company that can offer HTS-based SPS that have been fully qualified for use aboard Navy surface combatants. Therefore, the primary competition for our SPS products is currently coming from defense contractors that provide the copper-based systems that our lighter, more efficient HTS versions have been developed to replace. Companies such as L3, Excelis, Raytheon and Textron have the bulk of the copper-based business today. However, over time, as the HTS-based SPS proliferate to the fleet, companies that have the capability to manufacture and/or package HTS wire into robust, turn-key systems will most likely attempt to duplicate our products and thus additional competition is expected from more traditional HTS competitors such as those listed above.
As the HTS wire, superconductor electric motors and generators, and power electronic systems markets develop, other large industrial companies may enter those fields and compete with us. If we are unable to compete successfully, it may harm our business, which in turn may limit our ability to acquire or retain customers.
Our international operations are subject to risks that we do not face in the United States, which could have an adverse effect on our operating results.
In recent years, a substantial majority of our consolidated revenues were recognized from customers outside of the United States. For example, 78% of our revenues in fiscal 2016 and 85% of our revenues in fiscal 2015 were recognized from sales outside the United States. Our international operations are subject to a variety of risks that we do not face in the United States, including:
• | potentially longer payment cycles for sales in foreign countries and difficulties in collecting accounts receivable; |
• | difficulties in staffing and managing our foreign offices and the increased travel, infrastructure and legal compliance costs associated with multiple international locations; |
21
• | additional withholding taxes or other taxes on our foreign income and repatriated cash, and tariffs or other restrictions on foreign trade or investment, including export duties and quotas, trade and employment restrictions; |
• | imposition of, or unexpected adverse changes in, foreign laws or regulatory requirements; |
• | increased exposure to foreign currency exchange rate risk; |
• | reduced protection for intellectual property rights in some countries; and |
• | political unrest, war or acts of terrorism. |
In addition, the new U.S. presidential administration has withdrawn the United States from the Trans-Pacific Partnership trade agreement and has made various comments suggesting the possible re-negotiation of or withdrawal from other trade agreements and the potential imposition of new import barriers. We cannot predict whether the United States or any other country will impose new quotas, tariffs, taxes or other trade barriers upon the importation or exportation of our products or gauge the effect that new barriers would have on our financial position or results of operations.
Our overall success in international markets depends, in part, upon our ability to succeed in differing legal, regulatory, economic, social and political conditions. We may not be successful in developing and implementing policies and strategies that will be effective in managing these risks in each country where we do business or conduct operations. Our failure to manage these risks successfully could harm our international operations and reduce our international sales, thus lowering our total revenue and reducing or eliminating our profits.
Adverse changes in domestic and global economic conditions could adversely affect our operating results.
We have become increasingly subject to the risks arising from adverse changes in domestic and global economic conditions. In recent years, the state of both the domestic and global economies has been uncertain due to the difficulty in obtaining credit, weak economic recovery, and financial market volatility. Adverse credit conditions in the future could have a negative impact on our ability to execute on future strategic activities. In addition, if credit is difficult to obtain in the future, some customers may delay or reduce purchases. This could result in reductions in sales of our products, longer sales cycles, slower adoption of new technologies, increased accounts receivable and inventory write-offs and increased price competition. Any of these events would likely harm our business, results of operations and financial condition.
Risks Related to Our Technologies
We may be unable to adequately prevent disclosure of trade secrets and other proprietary information.
We rely on trade secrets to protect our proprietary technologies, especially where we do not believe patent protection is appropriate or obtainable. However, trade secrets are difficult to protect. We rely, in part, on confidentiality agreements with our employees, contractors, consultants, outside scientific collaborators and other advisors to protect our trade secrets and other proprietary information. These agreements may not effectively prevent disclosure of confidential information and may not provide an adequate remedy in the event of unauthorized disclosure of confidential information. In addition, others may independently discover our trade secrets or independently develop processes or products that are similar or identical to our trade secrets and courts outside the United States may be less willing to protect trade secrets. Costly and time-consuming litigation could be necessary to enforce and determine the scope of our proprietary rights, and failure to obtain or maintain trade secret protection could adversely affect our competitive business position.
For example, based, in part, upon evidence obtained through an internal investigation and a criminal investigation conducted by Austrian authorities regarding the actions of a former employee of our Austrian subsidiary, we believe that Sinovel illegally obtained and used our intellectual property in violation of civil and criminal intellectual property laws. In July 2011, a former employee of our Austrian subsidiary was arrested in Austria on charges of economic espionage and fraudulent manipulation of data. In September 2011, the former employee pled guilty to the charges, and was imprisoned. On September 13, 2011, we commenced a series of legal actions in China against Sinovel and other parties alleging the illegal use of our intellectual property. We cannot provide any assurance as to the outcome of these legal actions. This or future litigation with Sinovel could result in substantial costs and divert management’s attention and resources, which could have an adverse effect on our business, operating results and financial condition. In addition, such proceedings may make it more difficult to finance our operations. If we are unsuccessful in this litigation and fail to maintain adequate protection of this intellectual property, our competitive business position would be adversely affected. For more information about these legal proceedings, see Part I, Item 3, “Legal Proceedings.”
Our patents may not provide meaningful protection for our technology, which could result in us losing some or all of our market position.
22
We own or have licensing rights under many patents and pending patent applications. However, the patents that we own or license may not provide us with meaningful protection of our technologies and may not prevent our competitors from using similar technologies, for a variety of reasons, such as:
• | the patent applications that we or our licensors file may not result in patents being issued; |
• | any patents issued may be challenged by third parties; and |
• | others may independently develop similar technologies not protected by our patents or design around the patented aspects of any technologies we develop. |
Moreover, we could incur substantial litigation costs in defending the validity of or enforcing our own patents. We also rely on trade secrets and proprietary know-how to protect our intellectual property. However, our non-disclosure agreements and other safeguards may not provide meaningful protection for our trade secrets and other proprietary information. If the patents that we own or license or our trade secrets and proprietary know-how fail to protect our technologies, our market position may be adversely affected.
There are a number of technological challenges that must be successfully addressed before our superconductor products can gain widespread commercial acceptance, and our inability to address such technological challenges could adversely affect our ability to acquire customers for our products.
Many of our superconductor products are in the early stages of commercialization, while others are still under development. There are a number of technological challenges that we must successfully address to complete our development and commercialization efforts for superconductor products. We will also need to improve the performance and reduce the cost of our Amperium wire to expand the number of commercial applications for it. We may be unable to meet such technological challenges or to sufficiently improve the performance and reduce the costs of our Amperium wire. Delays in development, as a result of technological challenges or other factors, may result in the introduction or commercial acceptance of our superconductor products later than anticipated.
Third parties have or may acquire patents that cover the materials, processes and technologies we use or may use in the future to manufacture our Amperium products, and our success depends on our ability to license such patents or other proprietary rights.
We expect that some or all of the HTS materials, processes and technologies we use in designing and manufacturing our products are or will become covered by patents issued to other parties, including our competitors. The owners of these patents may refuse to grant licenses to us, or may be willing to do so only on terms that we find commercially unreasonable. If we are unable to obtain these licenses, we may have to contest the validity or scope of those patents or re-engineer our products to avoid infringement claims by the owners of these patents. It is possible that we will not be successful in contesting the validity or scope of a patent, or that we will not prevail in a patent infringement claim brought against us. Even if we are successful in such a proceeding, we could incur substantial costs and diversion of management resources in prosecuting or defending such a proceeding.
Our technology and products could infringe intellectual property rights of others, which may require costly litigation and, if we are not successful, could cause us to pay substantial damages and disrupt our business.
In recent years, there has been significant litigation involving patents and other intellectual property rights in many technology-related industries. There may be patents or patent applications in the United States or other countries that are pertinent to our products or business of which we are not aware. The technology that we incorporate into and use to develop and manufacture our current and future products, including the technologies we license, may be subject to claims that they infringe the patents or proprietary rights of others. The success of our business will also depend on our ability to develop new technologies without infringing or misappropriating the proprietary rights of others. Third parties may allege that we infringe patents, trademarks or copyrights, or that we misappropriated trade secrets. These allegations could result in significant costs and diversion of the attention of management. If a successful claim were brought against us and we are found to infringe a third party’s intellectual property rights, we could be required to pay substantial damages, including treble damages if it is determined that we have willfully infringed such rights, or be enjoined from using the technology deemed to be infringing, or using, making or selling products deemed to be infringing. If we have supplied infringing products or technology to third parties, we may be obligated to indemnify these third parties for damages they may be required to pay to the patent holder and for any losses they may sustain as a result of the infringement. In addition, we may need to attempt to license the intellectual property right from such third party or spend time and money to design around or avoid the intellectual property. Any such license may not be available on reasonable terms, or at all. An adverse determination may subject us to significant liabilities and/or disrupt our business.
23
Risks Related to Our Legal Matters
We have filed a demand for arbitration and other lawsuits against our former largest customer, Sinovel, regarding amounts we contend are overdue. We cannot be certain as to the outcome of these proceedings.
On March 31, 2011, Sinovel refused to accept contracted scheduled shipments with a revenue value of approximately $65.2 million. In addition, as of March 31, 2011, we had approximately $62.0 million of receivables (excluding value-added tax) outstanding from Sinovel. We have not received payment from Sinovel for these outstanding receivables that are now past due, nor have we been notified as to when, if ever, they will accept contracted shipments that were scheduled for delivery after March 31, 2011. No payment has been received from Sinovel since early March 2011. Because Sinovel did not give us notice that it intended to delay deliveries as required under the contracts, we believe that these actions constitute material breaches of our contracts. Additionally, we believe that Sinovel illegally obtained and used our intellectual property in violation of civil and criminal intellectual property laws.
On September 13, 2011, we filed a claim for arbitration against Sinovel in Beijing, China to compel Sinovel to pay us for past product shipments and to accept all contracted but not yet delivered core electrical components and spare parts under all existing contracts with us. In addition, we have filed civil complaints in China against Sinovel alleging the illegal use of our intellectual property. Sinovel has filed counterclaims against us with the Beijing Arbitration Commission for breach of the same contracts under which we filed our original arbitration claim. Sinovel claims, among other things, that the goods supplied by us do not conform to the standards specified in the contracts and has claimed net damages in the amount of approximately 1.2 billion Chinese yuan (“RMB”) (approximately $174 million). Sinovel also filed a claim with the Beijing Arbitration Commission against us for breach of the same contracts under which we filed our original arbitration claim. Sinovel claimed, among other things, that the goods supplied by us do not conform to the standards specified in the contracts and claimed damages in the amount of approximately RMB 105.0 million (approximately $15 million). As the legal proceedings continue, we and Sinovel may identify additional amounts in dispute. We cannot provide any assurance as to the outcome of these legal actions or that, if we prevail, we ultimately will be able to collect any amounts awarded. Moreover, these legal proceedings could result in the incurrence of significant legal and related expenses, which may not be recoverable depending on the outcome of the litigation. An award by the arbitration panel or court in favor of Sinovel and/or the incurrence of significant legal fees that are not recoverable could adversely impact our operating results. For more information about these legal proceedings, see Part I, Item 3, “Legal Proceedings.”
We have been named as a party in various legal proceedings, and we may be named in additional litigation, all of which will require significant management time and attention, result in significant legal expenses and may result in an unfavorable outcome, which could have a material adverse effect on our business, operating results and financial condition.
We are and may become subject to various legal proceedings and claims that arise in or outside the ordinary course of business. Certain current lawsuits and pending proceedings are described under Part I, Item 3. “Legal Proceedings.”
The results of these lawsuits and future legal proceedings cannot be predicted with certainty. Also, our insurance coverage may be insufficient, our assets may be insufficient to cover any amounts that exceed our insurance coverage, and we may have to pay damage awards or otherwise may enter into settlement arrangements in connection with such claims. Any such payments or settlement arrangements in current or future litigation could have a material adverse effect on our business, operating results or financial condition. Even if the plaintiffs’ claims are not successful, current future litigation could result in substantial costs and significantly and adversely impact our reputation and divert management’s attention and resources, which could have a material adverse effect on our business, operating results or financial condition. In addition, such lawsuits may make it more difficult to finance our operations.
Risks Related to Our Common Stock
Our common stock has experienced, and may continue to experience, significant market price and volume fluctuations, which may prevent our stockholders from selling our common stock at a profit and could lead to costly litigation against us that could divert our management’s attention.
The market price of our common stock has historically experienced significant volatility and may continue to experience such volatility in the future. Factors such as our financial performance, liquidity requirements, technological achievements by us and our competitors, the establishment of development or strategic relationships with other companies, strategic acquisitions, new customer orders and contracts, and our introduction of commercial products may have a significant effect on the market price of our common stock. The stock market in general, and the stock of high technology companies, in particular, have, in recent years, experienced extreme price and volume fluctuations, which are often unrelated to the performance or condition of particular companies. Such broad market fluctuations could adversely affect the market price of our common stock. Due to these factors, the price of our common stock may decline and investors may be unable to resell their shares of our common stock for a profit.
24
Following periods of volatility in the market price of a particular company’s securities, securities class action litigation has often been brought against that company. In the past, we have been subject to a number of class action lawsuits which were filed against us on behalf of certain purchasers of our common stock. If we become subject to additional litigation of this kind in the future, it could result in additional substantial litigation costs, a damages award against us and the further diversion of our management’s attention.
Item 1B. | UNRESOLVED STAFF COMMENTS |
Not applicable.
Item 2. | PROPERTIES |
Our corporate headquarters and Grid manufacturing operations are located in a 355,000-square-foot facility owned by us and located in Devens, Massachusetts.
We also occupy leased facilities located in New Berlin, Wisconsin; Suzhou, China; Klagenfurt, Austria; and Timisoara, Romania with a combined total of approximately 180,000 square feet of space. These leases have varying expiration dates through March 2021 which can generally be terminated at our request after a six month advance notice. Our other locations focus primarily on applications engineering, sales and/or field service and do not have significant leases or physical presence. We believe all of these facilities are well-maintained and suitable for their intended uses.
The following table summarizes information regarding our significant leased and owned properties, as of March 31, 2017:
Location | Supporting | Square footage | Owned/Leased | |
United States | ||||
Devens, Massachusetts | Corporate & Grid Segment | 355,000 | Owned | |
New Berlin, Wisconsin | Wind & Grid Segments | 50,000 | Leased | |
China | ||||
Suzhou & Beijing | Wind Segment | 39,000 | Leased | |
Austria | ||||
Klagenfurt | Wind Segment | 28,000 | Leased | |
Romania | ||||
Timisoara | Wind Segment | 62,000 | Leased | |
Item 3. | LEGAL PROCEEDINGS |
On September 13, 2011, we commenced a series of legal actions in China against Sinovel. Our Chinese subsidiary, Suzhou AMSC Superconductor Co. Ltd., filed a claim for arbitration with the Beijing Arbitration Commission in accordance with the terms of our supply contracts with Sinovel. The case is captioned (2011) Jing Zhong An Zi No. 0963. On March 31, 2011, Sinovel refused to accept contracted shipments of 1.5 MW and 3 MW wind turbine core electrical components and spare parts that we were prepared to deliver. We allege that these actions constitute material breaches of our contracts because Sinovel did not give us notice that it intended to delay deliveries as required under the contracts. Moreover, we allege that Sinovel has refused to pay past due amounts for prior shipments of core electrical components and spare parts. We are seeking compensation for past product shipments and retention (including interest) in the amount of approximately RMB 485 million (approximately $70 million) due to Sinovel’s breaches of our contracts. We are also seeking specific performance of our existing contracts as well as reimbursement of all costs and reasonable expenses with respect to the arbitration. The value of the undelivered components under the existing contracts, including the deliveries refused by Sinovel in March 2011, amounts to approximately RMB 4.6 billion (approximately $667 million).
On October 8, 2011, Sinovel filed with the Beijing Arbitration Commission an application under the caption (2011) Jing Zhong An Zi No. 0963, for a counterclaim against us for breach of the same contracts under which we filed our original arbitration claim. Sinovel claims, among other things, that the goods supplied by us do not conform to the standards specified in the contracts and claims damages in the amount of approximately RMB 370 million (approximately $54 million). On October 17, 2011, Sinovel filed with the Beijing Arbitration Commission a request for change of counterclaim to increase its damage claim to approximately
25
RMB 1 billion (approximately $145 million). On December 22, 2011, Sinovel filed with the Beijing Arbitration Commission an additional request for change of counterclaim to increase its damages claim to approximately RMB 1.2 billion (approximately $174 million). On February 27, 2012, Sinovel filed with the Beijing Arbitration Commission an application under the caption (2012) Jing Zhong An Zi No. 0157, against us for breach of the same contracts under which we filed our original arbitration claim. Sinovel claims, among other things, that the goods supplied by us do not conform to the standards specified in the contracts and claims damages in the amount of approximately RMB 105 million (approximately $15 million). We believe that Sinovel’s claims are without merit and we intend to defend these actions vigorously. Since the proceedings in this matter are still in the early technical review phase, we cannot reasonably estimate possible losses or range of losses at this time.
We also submitted a civil action application to the Beijing No. 1 Intermediate People’s Court under the caption (2011) Yi Zhong Min Chu Zi No. 15524, against Sinovel for software copyright infringement on September 13, 2011. The application alleges Sinovel’s unauthorized use of portions of our wind turbine control software source code developed for Sinovel’s 1.5MW wind turbines and the binary code, or upper layer, of our software for the PM3000 power converters in 1.5MW wind turbines. In July 2011, a former employee of our Austrian subsidiary was arrested in Austria on charges of economic espionage and fraudulent manipulation of data. In September 2011, the former employee pled guilty to the charges, and was imprisoned. As a result of our internal investigation and a criminal investigation conducted by Austrian authorities, we believe that this former employee was contracted by Sinovel through an intermediary while employed by us and improperly obtained and transferred to Sinovel portions of our wind turbine control software source code developed for Sinovel’s 1.5MW wind turbines. Moreover, we believe the former employee illegally used source code to develop for Sinovel a software modification to circumvent the encryption and remove technical protection measures on the PM3000 power converters in 1.5MW wind turbines in the field. We are seeking a cease and desist order with respect to the unauthorized copying, installation and use of our software, monetary damages of approximately RMB 38 million (approximately $6 million) for our economic losses and reimbursement of all costs and reasonable expenses. The Beijing No. 1 Intermediate People’s Court accepted the case, which was necessary in order for the case to proceed. On September 15, 2014, the Beijing No. 1 Intermediate People’s Court held its first substantive hearing in the Beijing case. At the hearing, the parties presented evidence, reviewed claims, and answered questions from the court. On April 24, 2015, we received notification from the Beijing No. 1 Intermediate People’s Court that it dismissed the case for what it cited was a lack of evidence. On May 6, 2015, we filed an appeal of the Beijing No. 1 Intermediate People’s Court decision to dismiss the case with the Beijing Higher People’s Court. On September 8, 2015, the Beijing Higher People’s Court held its first substantive hearing on our appeal of the Beijing No. 1 Intermediate People’s Court’s dismissal of the case. At the hearing, the parties presented evidence and answered questions from the court. We are awaiting a decision from the Beijing Higher People’s Court.
We submitted a civil action application to the Beijing Higher People’s Court against Sinovel and certain of its employees for trade secret infringement on September 13, 2011 under the caption (2011) Gao Min Chu Zi No. 4193. The application alleges the defendants’ unauthorized use of portions of our wind turbine control software source code developed for Sinovel’s 1.5MW wind turbines as described above with respect to the Copyright Action. We are seeking monetary damages of approximately RMB 2.9 billion (approximately $421 million) for the trade secret infringement as well as reimbursement of all costs and reasonable expenses. The Beijing Higher People’s Court has accepted the case, which was necessary in order for the case to proceed. On December 22, 2011 the Beijing Higher People’s Court transferred the case to the Beijing No. 1 Intermediate People’s Court under the caption (2011) Gao Min Chu Zi No. 4193. On June 7, 2012, we received an Acceptance Notice from the Beijing No.1 Intermediate People’s Court under the caption (2012) Yi Zhong Min Chu Zi No.6833. The Beijing No. 1 Intermediate Court held the first substantive hearing on May 11, 2015. On June 15, 2015, we submitted a request for the withdrawal of our complaint to the Beijing No. 1 Intermediate Court. On June 16, 2015, the Beijing No. 1 Intermediate Court granted our request. We immediately filed a civil action application to the Beijing Intellectual Property Court against the same parties and seeking the same amount of monetary damages for trade secret infringement on June 16, 2015 under the caption (2015) Jin Zhi Min Chu Zi No. 1135. On January 18, 2016, the Beijing Intellectual Property Court held its first substantive hearing on our trade secret infringement case. At the hearing, the parties presented evidence, reviewed claims and answered questions from the court. We are awaiting a decision from the Beijing Intellectual Property Court.
On September 16, 2011, we filed a civil copyright infringement complaint in the Hainan Province No. 1 Intermediate People’s Court against Dalian Guotong Electric Co. Ltd. (“Guotong”), a supplier of power converter products to Sinovel, and Huaneng Hainan Power, Inc. (“Huaneng”), a wind farm operator that has purchased Sinovel wind turbines containing Guotong power converter products. The case is captioned (2011) Hainan Yi Zhong Min Chu Zi No. 62. The application alleges that our PM1000 converters in certain Sinovel wind turbines have been replaced by converters produced by Guotong. Because the Guotong converters are being used in wind turbines containing our wind turbine control software, we believe that our copyrighted software is being infringed. We are seeking a cease and desist order with respect to the unauthorized use of our software, monetary damages of approximately RMB 1.2 million (approximately $0.2 million) for our economic losses (with respect to Guotong only) and reimbursement of all costs and reasonable expenses. The court has accepted the case, which was necessary in order for the case to proceed. In addition, upon the request of the defendant Huaneng, Sinovel has been added by the court to this case as a defendant and Huaneng has been released from this case. On November 18, 2014, the Hainan No. 1 Intermediate People’s Court held its first substantive hearing in the Hainan case. At the hearing, the parties presented evidence, reviewed claims, and answered
26
questions from the court. On June 3, 2015, we received notification from the Hainan No. 1 Intermediate People’s Court that it dismissed the case for what it cited was a lack of evidence. On June 18, 2015, we filed an appeal of the Hainan No. 1 Intermediate People’s Court decision to dismiss the case with the Hainan Higher People’s Court. On August 20, 2015, the Hainan Higher People’s Court accepted the appeal under the caption (2015) QiongZhi Min Zhong Zi No. 6. On November 26, 2015, the Hainan Higher People’s Court held its first substantive hearing on our appeal of the Hainan No. 1 Intermediate People’s Court’s dismissal of the case. On August 17, 2016, we received notification from the Hainan Higher People’s Court that it dismissed the case for what it cited was a lack of evidence. We intend to file an appeal of the Hainan Higher People’s Court’s decision with China’s Supreme People’s Court. China’s Supreme People’s Court has discretion to decide whether to hear the appeal.
Item 4. | MINE SAFETY DISCLOSURES |
Not Applicable.
27
PART II
Item 5. | MARKET FOR REGISTRANT’S COMMON EQUITY, RELATED STOCKHOLDER MATTERS AND ISSUER PURCHASES OF EQUITY SECURITIES |
Market Information
Our common stock has been listed on the NASDAQ Global Select Market under the symbol “AMSC” since 1991. The following table sets forth the high and low sales price per share of our common stock as reported on the NASDAQ Global Select Market for each quarter of the two most recent fiscal years.
Common Stock Price | ||||||||
High | Low | |||||||
Fiscal year ended March 31, 2017: | ||||||||
First quarter | $ | 12.50 | $ | 7.44 | ||||
Second quarter | 9.63 | 6.21 | ||||||
Third quarter | 8.55 | 6.01 | ||||||
Fourth quarter | 7.82 | 5.86 | ||||||
Fiscal year ended March 31, 2016: | ||||||||
First quarter | $ | 10.89 | $ | 5.10 | ||||
Second quarter | 5.94 | 3.26 | ||||||
Third quarter | 7.89 | 3.81 | ||||||
Fourth quarter | 9.05 | 5.28 | ||||||
Holders
The number of holders of record of our common stock on May 23, 2017 was 151.
Dividend Policy
We have never paid cash dividends on our common stock. We currently intend to retain earnings, if any, to fund the development and growth of our business and do not anticipate paying cash dividends for the foreseeable future. Payment of future cash dividends, if any, will be at the discretion of our board of directors after taking into account various factors, including our financial condition, operating results, current and anticipated cash needs and plans for expansion. The Term Loans with Hercules Technology Growth Capital, Inc. which are discussed further in Item 7, “Management’s Discussion and Analysis of Financial Condition and Results of Operations”, prohibit us from paying cash dividends.
Stock Performance Graph
The following graph compares the cumulative total stockholder return on our common stock from March 31, 2012 to March 31, 2017 with the cumulative total return of (i) the Russell 2000 Index and (ii) the Russell Microcap Index. This graph assumes the investment of $100.00 on March 31, 2012 in our common stock, the Russell 2000 Index and the Russell Microcap Index, and assumes any dividends are reinvested. Measurement points are March 31, 2012; March 31, 2013; March 31, 2014; March 31, 2015; March 31, 2016; and March 31, 2017.
28
COMPARISON OF 5 YEAR CUMULATIVE TOTAL RETURN
Among American Superconductor Corporation, the Russell 2000 Index
and the Russell Microcap Index
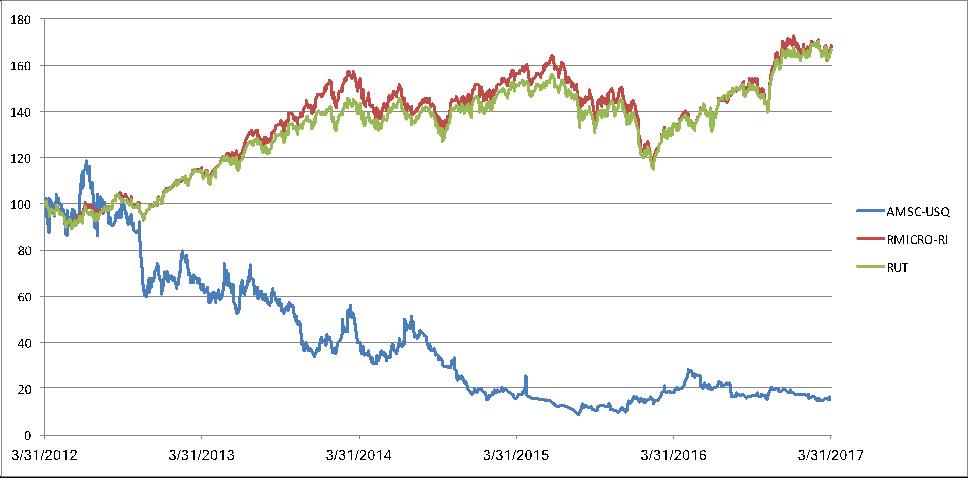
Company/Index | 3/31/2012 | 3/31/2013 | 3/31/2014 | 3/31/2015 | 3/31/2016 | 3/31/2017 | ||||||||||||
American Superconductor Corp. | 100.00 | 64.81 | 39.80 | 15.63 | 18.45 | 16.65 | ||||||||||||
Russell Microcap | 100.00 | 115.27 | 151.72 | 155.68 | 133.63 | 168.71 | ||||||||||||
Russell 2000 | 100.00 | 114.60 | 141.28 | 150.88 | 134.17 | 166.92 | ||||||||||||
29
Item 6. | SELECTED FINANCIAL DATA |
The following selected financial data reflects the results of operations and balance sheet data for the fiscal years ended March 31, 2013 to 2017. Per share data has been restated to reflect the 1-for-10 reverse stock split effected on March 24, 2015. The information set forth below is not necessarily indicative of results of future operations and should be read in conjunction with Item 7, “Management’s Discussion and Analysis of Financial Condition and Results of Operations,” and the consolidated financial statements and notes thereto included in Item 8, “Financial Statements and Supplementary Data,” of this Form 10-K, in order to understand further the factors that may affect the comparability of the financial data presented below.
Fiscal year ended March 31, | |||||||||||||||
2017 | 2016 | 2015 | 2014 | 2013 | |||||||||||
(In thousands, except per share data) | |||||||||||||||
Revenues | $ | 75,195 | $ | 96,023 | $ | 70,530 | $ | 84,117 | $ | 87,419 | |||||
Net loss | (27,373 | ) | (23,139 | ) | (48,656 | ) | (56,258 | ) | (66,131 | ) | |||||
Net loss per common share - basic | (1.98 | ) | (1.76 | ) | (5.74 | ) | (8.98 | ) | (12.46 | ) | |||||
Net loss per common share - diluted | (1.98 | ) | (1.76 | ) | (5.74 | ) | (8.98 | ) | (12.46 | ) | |||||
Total assets | 100,244 | 135,318 | 133,825 | 168,509 | 216,754 | ||||||||||
Working capital | 23,483 | 42,334 | 17,319 | 35,459 | 40,428 | ||||||||||
Cash, cash equivalents, marketable securities and restricted cash | 27,744 | 40,721 | 24,548 | 49,421 | 50,199 | ||||||||||
Long term debt, net of discount | — | 1,367 | 3,877 | 6,380 | 9,248 | ||||||||||
Stockholders’ equity | 60,226 | 83,549 | 79,893 | 112,259 | 125,118 | ||||||||||
Included in the net loss for the fiscal year ended March 31, 2017 was stock-based compensation expense of $2.9 million, gain on sale of our minority investment of $0.3 million, and a gain from the change in fair value of warrants and derivatives of $1.3 million. Included in the net loss for the fiscal year ended March 31, 2016 was stock-based compensation expense of $3.2 million, restructuring and impairment charges of $0.8 million, gains on sales of our minority investments of $3.1 million, non-cash interest expense of $0.4 million, and a loss from the change in fair value of warrants and derivatives of $0.2 million. Included in the net loss for the fiscal year ended March 31, 2015 was stock-based compensation expense of $5.9 million, restructuring and impairment charges of $5.4 million, non-cash interest expense of $0.6 million, arbitration award expense of $9.0 million and a gain from the change in fair value of warrants and derivatives of $4.0 million. Included in the net loss for the fiscal year ended March 31, 2014 was stock-based compensation expense of $10.7 million, restructuring and impairment charges of $3.0 million, a prepaid value added tax reserve of $1.4 million, non-cash interest expense of $7.7 million, a loss on extinguishment of debt of $5.2 million and a gain from the change in fair value of warrants and derivatives of $1.9 million. Included in the net loss for the fiscal year ended March 31, 2013 was stock-based compensation expense of $8.1 million, restructuring and impairment charges of $7.9 million, a loss contingency of $1.8 million, non-cash interest expense of $12.4 million as well as gains from the change in fair value of warrants and derivatives and recoveries of adverse purchase commitments of $7.6 million and $7.8 million, respectively.
30
Item 7. | MANAGEMENT DISCUSSION AND ANALYSIS OF FINANCIAL CONDITION AND RESULTS OF OPERATIONS |
Executive Overview
We are a leading provider of megawatt-scale solutions that lower the cost of wind power and enhance the performance of the power grid. In the wind power market, we enable manufacturers to field highly competitive wind turbines through our advanced power electronics products, engineering, and support services. In the power grid market, we enable electric utilities and renewable energy project developers to connect, transmit and distribute power through our transmission planning services and power electronics and superconductor-based products. Our wind and power grid products and services provide exceptional reliability, security, efficiency and affordability to our customers.
Our wind and power grid solutions help to improve energy efficiency, alleviate power grid capacity constraints and increase the adoption of renewable energy generation. Demand for our solutions is driven by the growing needs for renewable sources of electricity, such as wind and solar energy, and for modernized smart grids that improve power reliability, security and quality. Concerns about these factors have led to increased spending by corporations as well as supportive government regulations and initiatives on local, state, national and global levels, including renewable portfolio standards, tax incentives and international treaties.
We manufacture products using two proprietary core technologies: PowerModule programmable power electronic converters and our Amperium high temperature superconductor (HTS) wires. These technologies and our system-level solutions are protected by a broad and deep intellectual property portfolio consisting of hundreds of patents and licenses worldwide.
We operate our business under two market-facing business units: Wind and Grid. We believe this market-centric structure enables us to more effectively anticipate and meet the needs of wind turbine manufacturers, power generation project developers and electric utilities.
● | Wind. Through our Windtec Solutions™, our Wind business segment enables manufacturers to field wind turbines with exceptional power output, reliability and affordability. We supply advanced power electronics and control systems, license our highly engineered wind turbine designs, and provide extensive customer support services to wind turbine manufacturers. Our design portfolio includes a broad range of drivetrains and power ratings of 2 MW and higher. We provide a broad range of power electronics and software-based control systems that are highly integrated and designed for optimized performance, efficiency, and grid compatibility. | |
● | Grid. Through our Gridtec Solutions™, our Grid business segment enables electric utilities and renewable energy project developers to connect, transmit and distribute power with exceptional efficiency, reliability, security and affordability. We provide transmission planning services that allow us to identify power grid congestion, poor power quality, and other risks, which help us determine how our solutions can improve network performance. These services often lead to sales of our grid interconnection solutions for wind farms and solar power plants, power quality systems and transmission and distribution cable systems. We also sell ship protection products to the U.S. Navy through our Grid business segment. | |
Our fiscal year begins on April 1 and ends on March 31. When we refer to a particular fiscal year, we are referring to the fiscal year beginning on April 1 of that same year. For example, fiscal 2016 refers to the fiscal year beginning on April 1, 2016. Other fiscal years follow similarly.
We have experienced recurring operating losses and as of March 31, 2017 had an accumulated deficit of $955.6 million. In addition, we have experienced recurring negative operating cash flows and our Wind segment revenues decreased substantially in fiscal 2016 compared to fiscal 2015. From April 1, 2011 through the date of this filing, we have reduced our global workforce substantially, including an 8% reduction in force, primarily affecting employees in our Devens, Massachusetts facility, effective April 4, 2017. At March 31, 2017, we had cash and cash equivalents of $26.8 million. Cash used in operations for the year ended March 31, 2017 was $11.2 million. On January 27, 2017, we entered into an At Market Issuance Sales Agreement ("ATM"), under which we were permitted to sell, at our discretion, up to $10.0 million of shares of our common stock. During the three months ended March 31, 2017, we realized net proceeds of $2.5 million from the sale of 379,693 shares of our common stock at an average price of $6.79 per share. See also "Liquidity and Capital Resources" below for additional discussion.
Over the last several years, we have entered into several debt and equity financing arrangements in order to enhance liquidity. During the fiscal years ended March 31, 2013 through 2017, we have generated aggregate cash flows from financing activities of $69.9 million. In addition, on May 10, 2017, we completed an additional equity offering, which generated net proceeds
31
of approximately $14.7 million, after deducting underwriting discounts and commissions and estimated offering expenses payable by us. We terminated the ATM in conjunction with this offering. See Note 9, “Debt”, Note 12, “Stockholders’ Equity”, and Note 19 “Subsequent Events” for further discussion of these financing arrangements.
Our cash requirements depend on numerous factors, including the successful completion of our product development activities, our ability to commercialize our Resilient Electric Grid (“REG”) and ship protection system solutions, rate of customer and market adoption of our products, collecting receivables according to established terms, and the continued availability of U.S. government funding during the product development phase of our Superconductors-based products. In December 2015, we entered into a set of strategic agreements valued at approximately $210.0 million with Inox, which includes a multi-year supply contract pursuant to which we will supply electric control systems to Inox and a license agreement allowing Inox to manufacture a limited number of electrical control systems over the next three to four years. After this initial three to four year period, Inox agreed that we will continue as Inox’s preferred supplier and Inox will be required to purchase from us a majority of its electric control systems requirements for an additional three-year period. Significant deviations to our business plan with regard to these factors and events, including any prolonged disruption in our revenues with our largest customers, which are important drivers to our business, could have a material adverse effect on our operating performance, financial condition, and future business prospects. We expect to pursue the expansion of our operations through internal growth, diversification of our customer base, and potential strategic alliances. See “Liquidity and Capital Resources” below for additional discussion.
Business Goals
We intend to pursue the following goals during fiscal year 2017.
• | Complete remaining obligations under our agreement with the DHS to deploy our REG system in ComEd’s electric grid, and, subject to the agreement of DHS and ComEd, proceed to the manufacturing and construction phase of the project. |
• | Receive an order for SPS from the U.S. Navy. |
• | Have at least one additional city perform a REG deployment study. |
• | Receive the first commercial orders for VVO. |
• | Increase our grid sales over the prior year. |
We intend to pursue the following goals during fiscal year 2018.
• | Receive a commercial REG order. |
• | Receive an order for our multi-ship module product from the U.S. Navy. |
• | Receive an additional SPS order from the U.S. Navy. |
• | Receive an additional SPS order from a foreign navy. |
• | Achieve revenues from commercial VVO sales. |
Results of Operations
Fiscal Years Ended March 31, 2017 and March 31, 2016
Revenues
Total revenues decreased by 22% to $75.2 million in fiscal 2016 from $96.0 million in fiscal 2015. Our revenues are summarized as follows (in thousands):
Fiscal Years Ended March 31, | |||||||
2017 | 2016 | ||||||
Revenues: | |||||||
Wind | $ | 47,269 | $ | 68,883 | |||
Grid | 27,926 | 27,140 | |||||
Total | $ | 75,195 | $ | 96,023 | |||
32
Revenues in our Wind business unit are derived from wind turbine electrical systems and core components, wind turbine license and development contracts, service contracts and consulting arrangements. Our Wind business unit accounted for 63% of total revenues in fiscal 2016 and 72% in fiscal 2015. Revenues in the Wind business unit decreased 31% to $47.3 million in fiscal 2016 from $68.9 million in fiscal 2015. The decrease in Wind business unit revenues was driven primarily by lower revenues from Inox in India. Such decrease in revenues was due to fewer than anticipated ECS shipments to Inox, which resulted from Inox's working capital constraints, particularly in the first half of 2016, and what we believe, based on our discussions with Inox, is a temporary demand dislocation caused by the reaction in certain states in India to a recent national wind energy auction that resulted in a record-low power purchase tariff.
Revenues in our Grid business unit are derived from our D-VAR product sales, HTS wire sales, revenues under government-sponsored electric utility projects, license contracts and other prototype development contracts. We also engineer, install and commission our products on a turnkey-basis for some customers. The Grid business unit accounted for 37% of total revenues in fiscal 2016 and 28% in fiscal 2015. Grid revenue increased 3% to $27.9 million in fiscal 2016 from $27.1 million in fiscal 2015. The increase in Grid revenue was primarily due to higher D-VAR system revenues and higher HTS project revenues which were partially offset by lower license revenue from BASF Corporation ("BASF").
Revenues from Project HYDRA and Project REG represented 7% and 6% of our Grid business unit’s revenue for fiscal 2016 and 2015, respectively. Our revenues for these projects are derived by funding from the Department of Homeland Security (“DHS”). Project HYDRA is a project with Consolidated Edison, Inc. (“ConEd”) to demonstrate our REG product in ConEd’s electric grid. Project REG is a project with Commonwealth Edison, Inc. (“ComEd”) to permanently install our REG product in ComEd’s electric grid. This fault current limiting cable system is designed to utilize customized Amperium® HTS wire, and ancillary controls to deliver more power through the grid while also being able to suppress power surges that can disrupt service. DHS has committed 100% of the total expected funding of $29.0 million for Project HYDRA. Under Project REG, DHS is expected to invest up to $60.0 million to enable the deployment of the REG system in Chicago’s electric grid. We have substantially completed the first phase of the project which among other things, has resulted in the creation of a detailed deployment plan. In the fiscal year ended March 31, 2015, DHS committed funding of $1.5 million for this phase of the project. During the fiscal year ended March 31, 2016, DHS committed funding of an additional $3.7 million, for a total of $5.2 million. This additional funding serves as a bridge between the detailed deployment plan and construction phases of the project. The period of performance to complete the engineering work extends through December 31, 2018. The final phase of the project involves the delivery of the REG system and the associated construction and deployment of the system in ComEd’s grid. We will not begin this phase of the project until all parties agree to proceed. There can be no assurance that all parties will agree to proceed with the project.
Cost of Revenues and Gross Margin
Cost of revenues decreased by 13% to $64.4 million in fiscal 2016, compared to $74.0 million in fiscal 2015. Gross margin decreased to 14.4% in fiscal 2016 from 22.9% in fiscal 2015. The decrease in gross margin in fiscal 2016 was driven primarily by lower Wind revenue as discussed above.
Operating Expenses
Research and development
R&D expenses increased by 2% to $12.5 million, or 17% of revenue in fiscal 2016, compared to $12.3 million, or 13% of revenue, in fiscal 2015. The increase in R&D expenses is primarily the result of new product development expenses in our Grid segment, partially offset by lower employee compensation expenses.
Selling, general, and administrative
Selling, general and administrative (“SG&A”) expenses decreased by 11% to $25.7 million, or 34% of revenue in fiscal 2016 from $28.9 million, or 30% of revenue, in fiscal 2015. The decrease in SG&A expenses in fiscal 2016 was primarily due to lower employee compensation expenses, as well as a decrease in software and license expenses.
Amortization of acquisition related intangibles
We recorded $0.2 million in both fiscal 2016 and fiscal 2015 in amortization expense related to our core technology and know-how, and trade names and trademark intangible assets.
Restructuring and impairments
33
We recorded restructuring and impairment charges of $0.8 million in fiscal 2015. For fiscal 2015, this consists primarily of an impairment charge of $0.7 million to fully impair our investment in Tres Amigas.
Operating loss
Our operating loss is summarized as follows (in thousands):
Fiscal Years Ended March 31, | |||||||
2017 | 2016 | ||||||
Operating loss: | |||||||
Wind | $ | (4,174 | ) | $ | (1,256 | ) | |
Grid | (20,476 | ) | (14,835 | ) | |||
Unallocated corporate expenses | (2,892 | ) | (4,027 | ) | |||
Total | $ | (27,542 | ) | $ | (20,118 | ) | |
Wind operating loss increased to $4.2 million in fiscal 2016 compared to $1.3 million in fiscal 2015. The increase in operating loss for fiscal 2016 was primarily attributable to decreased revenues as discussed above.
Grid operating loss increased to $20.5 million in fiscal 2016 from $14.8 million in fiscal 2015. The increase in operating loss for fiscal 2016 is primarily due to an unfavorable D-VAR revenue mix, lower license revenue from BASF in fiscal 2016 at 100% margin, as well as increased product development costs in fiscal 2016.
Unallocated corporate expenses in fiscal 2016 consisted entirely of stock-based compensation expense. Unallocated corporate expenses in fiscal 2015 included restructuring and impairment charges of $0.8 million and $3.2 million in stock-based compensation expense.
Change in fair value of derivatives and warrants
The change in fair value of derivatives and warrants resulted in a gain of $1.3 million in fiscal 2016 and a loss of $0.2 million in fiscal 2015. The changes in the fair value were primarily due to changes in our stock price, which is a key valuation metric on the derivative liabilities.
Gain on sale of minority interest
We recorded a gain on sale of minority interest of $0.3 million in fiscal 2016, related to the receipt of the final payment for the sale of our investment in Tres Amigas. We recorded a gain on sale of minority interests of $3.1 million in fiscal 2015, related to the sale of our investment in Blade Dynamics and the receipt of the first payment from the sale of our investment in Tres Amigas. Both of these investments were fully impaired prior to the time of their sale.
Interest expense, net
Interest expense, net was $0.4 million in fiscal 2016 compared to $1.0 million for fiscal 2015. The decrease in interest expense, net was primarily driven by lower interest expense due to the maturity of one of our term loans with Hercules Technology Growth Capital, Inc. (“Hercules”) in November 2016.
Other income (expense), net
Other income, net was less than $0.1 million in fiscal 2016, compared to other expense, net of $2.5 million in fiscal 2015. The decrease in other expense, net was due primarily to gains from foreign currency fluctuations in fiscal 2016.
Income Taxes
We recorded an income tax expense of $1.1 million in fiscal 2016, compared to $2.4 million in fiscal 2015. The decrease in income tax expense was driven primarily by decreases in income taxes in foreign jurisdictions and foreign withholding taxes.
Please refer to the “Risk Factors” section in Part I, Item 1A, for a discussion of certain factors that may affect our future results of operations and financial condition.
34
Fiscal Years Ended March 31, 2016 and March 31, 2015
Revenues
Total revenues increased by 36% to $96.0 million in fiscal 2015 from $70.5 million in fiscal 2014. Our revenues are summarized as follows (in thousands):
Fiscal Years Ended March 31, | |||||||
2016 | 2015 | ||||||
Revenues: | |||||||
Wind | $ | 68,883 | $ | 51,307 | |||
Grid | 27,140 | 19,223 | |||||
Total | $ | 96,023 | $ | 70,530 | |||
Our Wind business unit accounted for 72% of total revenues in fiscal 2015 and 73% in fiscal 2014. Revenues in the Wind business unit increased 34% to $68.9 million in fiscal 2015 from $51.3 million in fiscal 2014. The increase in Wind business unit revenues was driven primarily by higher revenues from Inox in India.
The Grid business unit accounted for 28% of total revenues in fiscal 2015 and 27% in fiscal 2014. Grid revenue increased 41% to $27.1 million in fiscal 2015 from $19.2 million in fiscal 2014. The increase in revenues was primarily due to higher D-VAR system revenues and the license to BASF.
Revenues from Project HYDRA and Project REG represented 6% and 9% of our Grid business unit’s revenue for fiscal 2015 and 2014, respectively. Our revenues for these projects are derived by $5.2 million of funding from DHS. The period of performance to complete the engineering work extends through December 31, 2018. The final phase of the project involves the delivery of the REG system and the associated construction and deployment of the system in ComEd’s grid. We will not begin this phase of the project until all parties agree to proceed. There can be no assurance that all parties will agree to proceed with the project.
Cost of Revenues and Gross Margin
Cost of revenues increased by 10% to $74.0 million in fiscal 2015, compared to $67.4 million in fiscal 2014. Gross margin increased to 22.9% in fiscal 2015 from 4.4% in fiscal 2014. The increase in gross margin in fiscal 2015 was driven primarily by higher revenues, including increased royalty and license revenue compared to fiscal 2014.
Operating Expenses
Research and development
R&D expenses increased by 4% to $12.3 million, or 13% of revenue in fiscal 2015, compared to $11.9 million, or 17% of revenue, in fiscal 2014. The slight increase is primarily the result of new product development expenses in our Grid segment, partially offset by lower stock compensation expense.
Selling, general, and administrative
Selling, general and administrative (“SG&A”) expenses decreased by 1% to $28.9 million, or 30% of revenue in fiscal 2015 from $29.2 million, or 41% of revenue, in fiscal 2014. The slight decrease in SG&A expenses in fiscal 2015 was primarily due to lower stock compensation expense, partially offset by the reversal of legal costs for the Catlin insurance claim as result of our settlement agreement with Catlin Insurance Company (“Catlin”) in fiscal 2014.
Amortization of acquisition related intangibles
We recorded $0.2 million in both fiscal 2015 and fiscal 2014 in amortization expense related to our core technology and know-how, and trade names and trademark intangible assets.
35
Restructuring and impairments
We recorded restructuring and impairment charges of $0.8 million in fiscal 2015, compared to $5.4 million in fiscal 2014. For fiscal 2015, this consists primarily of an impairment charge of $0.7 million to fully impair our investment in Tres Amigas. For fiscal 2014, this consists of restructuring charges of $0.6 million for employee severance costs, and $1.3 million for facility and relocation costs primarily for the consolidation of our Grid manufacturing operations into our Devens facility. In addition, we recorded an impairment charge of $3.5 million to fully impair our minority investment in Blade Dynamics.
Operating loss
Our operating loss is summarized as follows (in thousands):
Fiscal Years Ended March 31, | |||||||
2016 | 2015 | ||||||
Operating loss: | |||||||
Wind | $ | (1,256 | ) | $ | (14,321 | ) | |
Grid | (14,835 | ) | (26,890 | ) | |||
Unallocated corporate expenses | (4,027 | ) | (11,306 | ) | |||
Total | $ | (20,118 | ) | $ | (52,517 | ) | |
Wind generated an operating loss of $1.3 million in fiscal 2015 compared to an operating loss of $14.3 million in fiscal 2014. The decrease in operating loss for fiscal 2015 was primarily attributable to increased revenues, partially offset by a lower consumption of previously written-off inventory used in our electrical control systems. Additionally, fiscal 2014 included a one-time charge of $9.0 million relating to the arbitration award to Ghodawat.
Grid operating loss decreased to $14.8 million in fiscal 2015 from $26.9 million in fiscal 2014. The decrease in operating loss for fiscal 2015 is primarily attributed to higher D-VAR system revenues, increased production which resulted in better factory absorption, and license revenue recognized from the license agreement with BASF in the fourth quarter of fiscal 2015.
Unallocated corporate expenses in fiscal 2015 included restructuring and impairment charges of $0.8 million and $3.2 million in stock-based compensation expense. Unallocated corporate expenses in fiscal 2014 included restructuring and impairment charges of $5.4 million and $5.9 million in stock-based compensation expense.
Change in fair value of derivatives and warrants
The change in fair value of derivatives and warrants resulted in a loss of $0.2 million in fiscal 2015 and a gain of $4.0 million in fiscal 2014. The changes in the fair value were primarily due to changes in our stock price, which is a key valuation metric on the derivative liabilities.
Gain on sale of minority interest
We recorded a gain on sale of minority interests of $3.1 million in the fiscal year ended March 31, 2016, related to the sale of our investments in Blade Dynamics and Tres Amigas. Both of these investments had been fully impaired at the time of their sale.
Interest expense, net
Interest expense, net was $1.0 million in fiscal 2015 compared to $1.9 million for fiscal 2014. The decrease in interest expense, net was primarily driven by lower interest expense due to the maturity of one of our term loans with Hercules Technology Growth Capital, Inc. (“Hercules”) in December 2014.
Other (expense) income, net
Other expense, net was $2.5 million in fiscal 2015, compared to other income, net of $1.6 million in fiscal 2014. The decrease in other income, net was due primarily to losses from foreign currency fluctuations as a result of the strengthening of the Euro against the U.S. dollar in fiscal 2015.
36
Income Taxes
We recorded an income tax expense of $2.4 million in fiscal 2015, compared to an income tax benefit of $0.2 million in fiscal 2014. The increase in income tax expense was driven primarily by increases in income taxes in foreign jurisdictions and foreign withholding taxes.
Certain asset write-offs in our foreign jurisdictions are considered permanent differences and are not tax deductible. Other asset write-offs, such as inventory and prepaid value-added taxes in China, are not currently deductible and result in deferred tax assets. Due to uncertainty around the realization of these deferred tax assets, they have been fully reserved as of the end of the fiscal years ended March 31, 2016, 2015 and, 2014, respectively.
Non-GAAP Measures
Generally, a non-GAAP financial measure is a numerical measure of a company’s performance, financial position or cash flow that either excludes or includes amounts that are not normally excluded or included in the most directly comparable measure calculated and presented in accordance with GAAP. The non-GAAP measures included in this Form 10-K, however, should be considered in addition to, and not as a substitute for or superior to the comparable measure prepared in accordance with GAAP.
We define non-GAAP net loss as net loss before gain on sale of interest in minority investments, stock-based compensation, arbitration award expense, amortization of acquisition-related intangibles, restructuring and impairment charges, consumption of zero cost-basis inventory, changes in fair value of derivatives and warrants, non-cash interest expense and other non-cash or unusual charges, and any tax effects related to these items, indicated in the table below. We believe non-GAAP net loss assists management and investors in comparing our performance across reporting periods on a consistent basis by excluding these non-cash charges and other items that we do not believe are indicative of our core operating performance. In addition, we use non-GAAP net loss as a factor in evaluating management’s performance when determining incentive compensation and to evaluate the effectiveness of our business strategies. A reconciliation of GAAP to non-GAAP net loss is set forth in the table below (in thousands, except per share data):
Year ended March 31, | |||||||||||
2017 | 2016 | 2015 | |||||||||
Net loss | $ | (27,373 | ) | $ | (23,139 | ) | $ | (48,656 | ) | ||
Gain on sale of interest in minority investments, net of tax effect | (325 | ) | (2,919 | ) | — | ||||||
Stock-based compensation | 2,892 | 3,248 | 5,936 | ||||||||
Arbitration award expense | — | — | 8,987 | ||||||||
Amortization of acquisition-related intangibles | 157 | 157 | 157 | ||||||||
Restructuring and impairment charges | — | 779 | 5,366 | ||||||||
Consumption of zero cost-basis inventory | (1,373 | ) | (4,960 | ) | (7,982 | ) | |||||
Change in fair value of derivatives and warrants | (1,304 | ) | 228 | (3,963 | ) | ||||||
Non-cash interest expense | 156 | 359 | 566 | ||||||||
Tax effect of adjustments | 220 | — | — | ||||||||
Non-GAAP net loss | (26,950 | ) | (26,247 | ) | (39,589 | ) | |||||
Non-GAAP net loss per share | $ | (1.95 | ) | $ | (1.99 | ) | $ | (4.67 | ) | ||
Weighted average shares outstanding - basic and diluted | 13,804 | 13,178 | 8,477 | ||||||||
We generated a non-GAAP net loss of $27.0 million, or $1.95 per share, for fiscal 2016, compared to $26.2 million, or $1.99 per share, for fiscal 2015, and $39.6 million, or $4.67 per share, for fiscal 2014. The increase in non-GAAP net loss in fiscal 2016 over 2015 was primarily related to increased net loss as a result of lower revenues, partially offset by lower adjustments to net loss from the gain on sale of minority investments, lower stock compensation expense and lower consumption of zero cost-basis inventory. The decrease in non-GAAP net loss in fiscal 2015 over 2014 was primarily related to higher revenues in both business units, as well as higher gross margin.
Liquidity and Capital Resources
37
Our cash requirements depend on numerous factors, including the successful completion of our product development activities, our ability to commercialize our REG and ship protection system solutions, rate of customer and market adoption of our products, collecting receivables according to established terms, and the continued availability of U.S. government funding during the product development phase of our Superconductors-based products. Significant deviations from our business plan with regard to these factors and events, including any prolonged disruption in our revenues with our largest customers, which are important drivers to our business, could have a material adverse effect on our operating performance, financial condition, and future business prospects. We expect to pursue the expansion of our operations through internal growth, diversification of our customer base, and potential strategic alliances.
At March 31, 2017, we had cash, cash equivalents, and restricted cash of $27.7 million, compared to $40.7 million at March 31, 2016, a decrease of $13.0 million. Our cash and cash equivalents, and restricted cash are summarized as follows (in thousands):
March 31, 2017 | March 31, 2016 | ||||||
Cash and cash equivalents | $ | 26,784 | $ | 39,330 | |||
Restricted cash | 960 | 1,391 | |||||
Total cash, cash equivalents, and restricted cash | $ | 27,744 | $ | 40,721 | |||
As of March 31, 2017, we had approximately $9.0 million of cash, cash equivalents, and restricted cash in foreign bank accounts, with a majority of this cash located in Europe. The decrease in total cash and cash equivalents, and restricted cash was due primarily to cash used in operating activities. See further discussion below.
Net cash used in operating activities was $11.2 million, $4.6 million and $32.7 million in fiscal 2016, 2015 and 2014, respectively. The increase in net cash used in operations in fiscal 2016 compared to fiscal 2015 was due primarily to non-recurring payments for customer deposits and licenses in fiscal 2015 and higher net loss for the reasons discussed above. The decrease in fiscal 2015 compared to fiscal 2014 was primarily due to lower net loss for the reasons discussed above.
Net cash provided by investing activities was $0.2 million, $4.9 million and $1.8 million in fiscal 2016, 2015 and 2014, respectively. The decrease in net cash provided by investing activities in fiscal 2016 compared to fiscal 2015 was due primarily to a decrease in restricted cash as well as lower proceeds related to the sale of our minority interests. The increase in net cash provided by investing activities in fiscal 2015 compared to fiscal 2014 was driven primarily by the proceeds from the sale of our minority interests in Blade Dynamics and Tres Amigas.
Net cash (used in)/provided by financing activities was ($1.1 million), $18.2 million and $8.8 million in fiscal 2016, 2015 and 2014, respectively. The decrease in net cash provided by financing activities in fiscal 2016 compared to fiscal 2015 was primarily due to net proceeds of $22.3 million from the issuance of 4.0 million shares of common stock in April 2015, compared to net proceeds of $2.5 million from sales of 379,693 shares of common stock under the ATM during the fiscal quarter ended March 31, 2017. The increase in cash provided by financing activities in fiscal 2015 compared to fiscal 2014 is primarily due to net proceeds from the April 2015 equity offering, which was an increase of $7.3 million over fiscal 2014 net offering proceeds from the sale of shares under a previous at market issuance sales agreement and an equity offering in November 2014. See Note 10, “Warrants and Derivative Liabilities” for further information on the November 2014 equity offering. Additionally, amounts used to repay debt decreased by $3.3 million compared to fiscal 2014 due to the repayment in full of one of our term loans in the prior-year period.
At March 31, 2017 and 2016, we had $0.8 million and $0.5 million, respectively, of restricted cash included in current assets, and $0.2 million and $0.9 million, respectively of restricted cash included in long-term assets. These amounts included in restricted cash primarily represent deposits to secure surety bonds and letters of credit for various customer contracts. These deposits are held in interest bearing accounts.
On November 15, 2013, we amended our Loan and Security Agreement (the “Term Loan”) with Hercules and entered into a new term loan (the “Term Loan B”), borrowing $10.0 million. After closing fees and expenses, we received net proceeds of $9.8 million. The Term Loan B bore an interest rate equal to 11% plus the percentage, if any, in which the prime rate as reported by The Wall Street Journal exceeds 3.75%. We made interest-only payments from December 1, 2013 to May 31, 2014. Beginning June 1, 2014, we began making payments on the Term Loan B in equal monthly installments which ended at maturity on November 1, 2016.
On December 19, 2014, we entered into another amendment with Hercules (the “Hercules Second Amendment”) and entered into a new term loan (the “Term Loan C” or "Term Loan"), borrowing an additional $1.5 million. After closing fees and expenses,
38
the net proceeds from the Term Loan C were $1.4 million. The Term Loan C bears the same interest rate as the Term Loan B, which increased to 11.25% effective March 16, 2017. We are making interest only payments until maturity on June 1, 2017, when the loan is scheduled to be repaid in its entirety.
The Term Loan C is secured by substantially all of our existing and future assets, including a mortgage on real property owned by our wholly-owned subsidiary, ASC Devens LLC, and located at 64 Jackson Road, Devens, Massachusetts. The Term Loan contains certain covenants that restrict our ability to, among other things, incur or assume certain debt, merge or consolidate, materially change the nature of our business, make certain investments, acquire or dispose of certain assets, make guarantees or grant liens on our assets, make certain loans, advances or investments, declare dividends or make distributions or enter into transactions with affiliates. In addition, there is a covenant that requires us to maintain a minimum unrestricted cash balance (the “Minimum Threshold”) in the United States. As part of the Hercules Second Amendment, this Minimum Threshold was amended to be the lower of $5.0 million or the aggregate outstanding principal balance of the then outstanding term loans. As a result of the April 2015 offering (see discussion below), the Minimum Threshold was reduced to the lesser of $2.0 million or the aggregate outstanding principal balance of the then outstanding term loans. As of March 31, 2017, the Minimum Threshold was $1.5 million. The events of default under the Term Loan include, but are not limited to, failure to pay amounts due, breaches of covenants, bankruptcy events, cross defaults under other material indebtedness and the occurrence of a material adverse effect and/or change in control. In the case of a continuing event of default, Hercules may, among other remedies, declare due all unpaid principal amounts outstanding and any accrued but unpaid interest and foreclose on all collateral granted to Hercules as security under the Term Loan.
We believe we are in and expect to remain in compliance with the covenants and restrictions under the Term Loan as of the date of this Annual Report on Form 10-K. If we fail to stay in compliance with our covenants or experience some other event of default, we may be forced to repay the outstanding principal on the Term Loan.
We have experienced recurring operating losses and as of March 31, 2017, had an accumulated deficit of $955.6 million. In addition, we have experienced recurring negative operating cash flows and our Wind segment revenues decreased substantially in fiscal 2016 as compared to fiscal 2015. From April 1, 2011 through the date of this filing, we have reduced our global workforce substantially, including an 8% reduction in force, primarily affecting employees in our Devens, Massachusetts facility, effective April 4, 2017. We expect to incur restructuring charges of $1.5 million to $2.0 million in cash severance expenses in the fiscal quarter ending June 30, 2017 in connection with the workforce reduction. We plan to closely monitor our expenses and, if required, expect to further reduce operating costs and capital spending to enhance liquidity. At March 31, 2017, we had cash and cash equivalents of $26.8 million, and cash used in operations of $11.2 million for the year ended March 31, 2017.
In April 2015, we completed an equity offering which raised net proceeds of $22.3 million after deducting underwriting discounts and commissions and estimated offering expenses payable by us from the sale of 4.0 million shares of our common stock at a public offering price of $6.00 per share. On October 6, 2015, 100% of the outstanding common stock of Blade Dynamics was acquired by a subsidiary of General Electric Company. After deducting transaction expenses, we received net proceeds of $2.8 million from the sale, which was recorded as a gain during the year ended March 31, 2016. On March 11, 2016, we sold 100% of our minority investment in Tres Amigas to an investor for $0.6 million. We received $0.3 million according to the terms of the purchase agreement upon closing, which was recorded as a gain during the three months ended March 31, 2016. The final $0.3 million, which was due upon the achievement of certain agreed-upon financing conditions, was received and recorded as a gain during the third quarter of fiscal 2016. On January 27, 2017, we entered into the ATM. During the three months ended March 31, 2017, we realized net proceeds of $2.5 million from the sale of 379,693 shares of our common stock at an average price of $6.79 per share. No sales of our common stock were made under the ATM after March 31, 2017. On May 4, 2017, we provided to FBR Capital Markets & Co., the sales agent, a notice of termination of the ATM. Also, on May 10, 2017, we completed an equity offering, which raised net proceeds of $14.7 million after deducting underwriting discounts and commissions and estimated offering expenses payable by us from the sale of 4.0 million shares of our common stock at a public offering price of $4.00 per share.
We believe, based on the information presented above and our annual assessment, that we have sufficient available liquidity to fund our operations, capital expenditures and scheduled cash payments under our debt obligations for the next twelve months following the issuance of our financial statements. Our liquidity is highly dependent on our ability to increase revenues, control our operating costs, and our ability to raise additional capital, if necessary. There can be no assurance that we will be able to continue to raise additional capital from other sources or execute on any other means of improving our liquidity as described above.
Legal Proceedings
39
We are involved in legal and administrative proceedings and claims of various types. See Part II, Item 1, “Legal Proceedings,” for additional information. We record a liability in our consolidated financial statements for these matters when a loss is known or considered probable and the amount can be reasonably estimated. We review these estimates each accounting period as additional information is known and adjust the loss provision when appropriate. If a matter is both probable to result in liability and the amounts of loss can be reasonably estimated, we estimate and disclose the possible loss or range of loss to the extent necessary to make the consolidated financial statements not misleading. If the loss is not probable or cannot be reasonably estimated, a liability is not recorded in our consolidated financial statements.
Off-Balance Sheet Arrangements
We do not have any off-balance sheet arrangements, as defined under SEC rules, such as relationships with unconsolidated entities or financial partnerships, which are often referred to as structured finance or special purpose entities, established for the purpose of facilitating transactions that are not required to be reflected on our balance sheet except as discussed below.
We occasionally enter into construction contracts that include a performance bond. As these contracts progress, we continually assess the probability of a payout from the performance bond. Should we determine that such a payout is probable, we would record a liability.
In addition, we have various contractual arrangements, under which we have committed to purchase certain minimum quantities of goods or services on an annual basis.
Contractual Obligations
Contractual obligations represent future cash commitments and liabilities under agreements with third parties. Operating leases include minimum payments under leases for our facilities and certain equipment; see Item 2, “Properties,” for more information. Purchase commitments represent enforceable and legally binding agreements with suppliers to purchase goods or services. As of March 31, 2017, we are committed to make the following payments under contractual obligations (in thousands):
Payments Due by Period | |||||||||||||||||||
Total | Less than 1 year | 1-3 Years | 3-5 Years | More than 5 Years | |||||||||||||||
Non-cancellable purchase commitments | $ | 4,940 | $ | 4,926 | $ | 14 | $ | — | $ | — | |||||||||
Senior Term Loans | 1,500 | 1,500 | — | — | — | ||||||||||||||
Operating leases (rent) | 1,597 | 960 | 473 | 164 | — | ||||||||||||||
Operating leases (other) | 87 | 62 | 21 | 4 | — | ||||||||||||||
Total contractual obligations | $ | 8,124 | $ | 7,448 | $ | 508 | $ | 168 | $ | — | |||||||||
Recent Accounting Pronouncements
In May 2014, the Financial Accounting Standards Board (“FASB”) and the International Accounting Standards Board (IASB) issued ASU 2014-09, Revenue from Contracts with Customers (Topic 606). The guidance substantially converges final standards on revenue recognition between the FASB and IASB providing a framework on addressing revenue recognition issues and, upon its effective date, replaces almost all existing revenue recognition guidance, including industry-specific guidance, in current U.S. generally accepted accounting principles. The FASB has subsequently issued the following amendments to ASU 2014-09 which are all effective for annual reporting periods beginning after December 15, 2017.
• | In March 2016 the FASB issued ASU No. 2016-08, Revenue from Contracts with Customers (Topic 606): Principal versus Agent Considerations, which clarifies the implementation guidance on principal versus agent considerations. |
• | In April 2016 the FASB issued ASU No. 2016-10, Revenue from Contracts with Customers (Topic 606): Identifying Performance Obligations and Licensing, which clarifies certain aspects of identifying performance obligations and licensing implementation guidance. |
• | In May 2016 the FASB issued ASU No. 2016-12, Revenue from Contracts with Customers (Topic 606): Narrow- Scope Improvements and Practical Expedients related to disclosures of remaining performance obligations, as well as other |
40
amendments to guidance on collectability, non-cash consideration and the presentation of sales and other similar taxes collected from customers.
• | In December 2016 the FASB issued ASU No. 2016-20, Technical Corrections and Improvements to Topic 606, Revenue from Contracts with Customers, which amends certain narrow aspects of the guidance issued in ASU 2014-09 including guidance related to the disclosure of remaining performance obligations and prior-period performance obligations, as well as other amendments to the guidance on loan guarantee fees, contract costs, refund liabilities, advertising costs and the clarification of certain examples. |
We are currently evaluating the provisions of ASU 2014-09 and its amendments, and assessing the impact the adoption of this guidance will have on our financial position, results of operations and disclosures. We anticipate the adoption of this guidance will result in certain changes in the identification of deliverables in our contracts and allocation of transaction price. We are required to adopt the new standards in the first quarter of fiscal 2018 using one of two application methods: retrospectively to each prior reporting period presented (full retrospective method), or retrospectively with the cumulative effect of initially applying the guidance recognized at the date of initial application (the cumulative catch-up transition method). We are currently evaluating the available adoption methods.
In July 2014, the FASB issued ASU 2014-12, Compensation – Stock Compensation (Topic 718): Accounting for Share Based Payments When the Terms of an Award Provide that a Performance Target Could be Achieved after the Requisite Service Period. To account for such awards, a reporting entity should apply existing guidance in FASB Accounting Standards Codification Topic 718, Compensation – Stock Compensation, as it relates to awards with performance conditions that affect vesting. As such, the performance target should not be reflected in estimating the grant-date fair value of the award. We adopted ASU 2014-12 effective April 1, 2016 and conclude that there is no material impact on our current practices.
In August 2014, the FASB issued ASU 2014-15, Presentation of Financial Statements – Going Concern (Subtopic 205-40): Disclosure of Uncertainties About an Entity’s Ability to Continue as a Going Concern. The new standard explicitly requires the assessment at interim and annual periods, and provides management with its own disclosure guidance. This ASU is effective for annual reporting periods and interim periods, within those annual periods ending after December 15, 2016. We adopted ASU 2014-15 effective March 31, 2017 and concluded there is no material impact on our current practices.
In April 2015, the FASB issued ASU 2015-03, Interest—Imputation of Interest (Subtopic 835-30): Simplifying the Presentation of Debt Issuance Costs. The amendments in ASU 2015-03 require an entity to present debt issuance costs on the balance sheet as a direct deduction from the related debt liability as opposed to an asset. Amortization of the costs will continue to be reported as interest expense. This ASU is effective for annual reporting periods beginning after December 15, 2015, and interim periods within those fiscal years. We adopted ASU 2015-03 effective April 1, 2016 and concluded that there is no material impact on our consolidated results of operations, financial condition, or cash flow.
In June 2015, the FASB issued ASU 2015-10, Technical Corrections and Improvements. The amendments in ASU 2015-10 clarify and correct some of the difference that arose between original guidance from FASB, EITF and other sources, and the translation into the new Codification. This ASU is effective for annual reporting periods beginning after December 15, 2015, and interim periods within those fiscal years. We adopted ASU 2015-10 effective April 1, 2016 and concluded that there is no material impact on our consolidated results of operations, financial condition, or cash flow.
In July 2015, the FASB issued ASU 2015-11, Inventory (Topic 330): Simplifying the Measurement of Inventory. The amendments in ASU 2015-11 clarify the proper way to identify market value in the use of lower of cost or market value valuation method. As market value could be determined multiple ways under prior standards, it will now be considered as net realizable value. This ASU is effective for annual reporting periods beginning after December 15, 2016, and interim periods within those fiscal years. We adopted ASU 2015-11 effective March 31, 2017 and concluded there is no material impact on our current practices.
In September 2015, the FASB issued ASU 2015-16, Business Combinations (Topic 805): Simplifying the Accounting for Measurement-Period Adjustments. The amendments in ASU 2015-16 require that an acquirer recognize adjustments to provisional amounts identified during the measurement period in the reporting period in which the adjustment amounts are determined. This ASU is effective for annual reporting periods beginning after December 15, 2015, and interim periods within those fiscal years. We adopted ASU 2015-16 effective April 1, 2016 and concluded that there is no material impact on our consolidated results of operations, financial condition, or cash flow.
In January 2016, the FASB issued ASU 2016-01, Financial Instruments—Overall (Subtopic 825-10): Recognition and Measurement of Financial Assets and Financial Liabilities. The amendments in ASU 2016-01 enhance the reporting model for financial instruments to provide users of financial statements with more decision-useful information. This ASU is effective for
41
annual reporting periods beginning after December 15, 2017, and interim periods within those fiscal years. We are currently evaluating the impact, if any, the adoption of ASU 2016-01 may have on our current practices.
In February 2016, the FASB issued ASU 2016-02, Leases (Topic 842). The guidance in this ASU supersedes the leasing guidance in Topic 840, Leases. Under the new guidance, lessees are required to recognize lease assets and lease liabilities on the balance sheet for all leases with terms longer than 12 months. Leases will be classified as either finance or operating, with classification affecting the pattern of expense recognition in the income statement. This ASU is effective for fiscal years beginning after December 15, 2019, including interim periods within those fiscal years. A modified retrospective transition approach is required for lessees for capital and operating leases existing at, or entered into after, the beginning of the earliest comparative period presented in the financial statements, with certain practical expedients available. We are currently evaluating the effects adoption of this guidance will have on our consolidated financial statements.
In March 2016, the FASB issued ASU 2016-09, Compensation—Stock Compensation (Topic 718): Improvements to Employee Share-Based Payment Accounting. The amendments in ASU 2016-09 simplify several aspects of the accounting for share-based payment transactions, including tax consequences, classification of awards as either equity or liabilities, and classification on the statement of cash flows. The ASU is effective for annual reporting periods beginning after December 15, 2017, and interim periods within annual periods beginning after December 15, 2016. We adopted ASU 2016-09 effective April 1, 2016 and concluded that there is no material impact on our current practices.
In June 2016, the FASB issued ASU 2016-13, Financial Instruments-Credit Losses (Topic 326): Measurement of Credit Losses on Financial Instruments. The amendments in ASU 2016-13 provide more decision useful information about the expected credit losses on financial instruments and other commitments to extend credit held by a reporting entity at each reporting date. The ASU is effective for annual reporting periods beginning after December 15, 2019, including interim periods within that year. We are currently evaluating the impact, if any, the adoption of ASU 2016-13 may have on our current practices.
In 2016, the FASB issued the following two ASU's on Statement of Cash Flows (Topic 230). Both amendments are effective for annual reporting periods beginning after December 15, 2017, including interim periods within that year.
• | In August 2016, the FASB issued ASU 2016-15, Statement of Cash Flows (Topic 230): Classification of Certain Cash Receipts and Cash Payments. The amendments in ASU 2016-15 provide more guidance towards the classification of multiple different types of cash flows in order to reduce the diversity in reporting across entities. |
• | In November 2016, the FASB issued ASU 2016-18, Statement of Cash Flows (Topic 230): Restricted Cash. The amendments in ASU 2016-18 explain the change during the period in the total of cash, cash equivalents, and amounts generally described as restricted cash or restricted cash equivalents. Therefore, amounts generally described as restricted cash and restricted cash equivalents should be included with cash and cash equivalents when reconciling the beginning-of-period and end-of-period total amounts shown on the statement of cash flows. |
We are currently evaluating the impact, if any, the adoption of ASU 2016-15 and ASU 2016-18 may have on our current practices.
In October 2016, the FASB issued ASU 2016-16, Income Taxes (Topic 740): Intra-Entity Transfers of Assets Other Than Inventory. The amendments in ASU 2016-16 improve the accounting for the income tax consequences of intra-entity transfers of assets other than inventory. The ASU is effective for annual reporting periods beginning after December 15, 2017, including interim periods within that year. We are currently evaluating the impact, if any, the adoption of ASU 2016-16 may have on our current practices.
In January 2017, the FASB issued ASU 2017-01, Business Combinations. The amendments in ASU 2017-01 clarify the definition of a business with the objective of adding guidance to assist entities with evaluating whether transactions should be accounted for as acquisitions (or disposals) of assets or businesses. The ASU is effective for annual reporting periods beginning after December 15, 2017, including interim periods within those periods. We are currently evaluating the impact the adoption of ASU 2017-01 may have on our current practices.
In January 2017, the FASB issued ASU 2017-03, Accounting Changes and Error Corrections (Topic 250) and Investments - Equity Method and Joint Ventures. The amendments in ASU 2017-03 provide additional detail surrounding disclosures required related to adoption of new pronouncements. The ASU is effective for the periods of each related pronouncement. We are currently evaluating the impact the adoption of ASU 2017-03 may have on our current practices.
42
In February 2017, the FASB issued ASU 2017-05, Other Income - Gains and Losses from the Derecognition of Non-financial Assets(Subtopic 610-20). The amendments in ASU 2017-05 clarify the scope of Subtopic 610-20, Other Income—Gains and Losses from the Derecognition of Non-financial Assets, and to add guidance for partial sales of non-financial assets. Subtopic 610-20, which was issued in May 2014 as a part of Accounting Standards Update No. 2014-09, Revenue from Contracts with Customers (Topic 606), provides guidance for recognizing gains and losses from the transfer of non-financial assets in contracts with non customers. We are currently evaluating the impact the adoption of ASU 2017-05 may have on our current practices.
We do not believe that other recently issued accounting pronouncements will have a material impact on our financial statements.
Critical Accounting Policies and Estimates
The preparation of consolidated financial statements requires that we make estimates and judgments that affect the reported amounts of assets, liabilities, revenue and expenses, and related disclosure of contingent assets and liabilities. We base our estimates on historical experience and various other assumptions that are believed to be reasonable under the circumstances, the results of which form the basis for making judgments about the carrying values of assets and liabilities that are not readily apparent from other sources. Actual results may differ under different assumptions or conditions. Our accounting policies that involve the most significant judgments and estimates are as follows:
• | Revenue recognition; |
• | Accounts receivable; |
• | Inventory; |
• | Valuation of long-lived assets; |
• | Income taxes; |
• | Stock-based compensation; |
• | Contingencies; |
• | Product warranty; |
• | Debt; and |
• | Fair value of financial instruments. |
Revenue recognition
We recognize revenue for product sales upon customer acceptance, which can occur at the time of delivery, installation, or post-installation, where applicable, provided persuasive evidence of an arrangement exists, delivery has occurred, the sales price is fixed or determinable and collectability is reasonably assured. Existing customers are subject to ongoing credit evaluations based on payment history and other factors. If it is determined during the arrangement that collectability is not reasonably assured, revenue is recognized on a cash basis of accounting. Certain of our contracts involve retention amounts which are contingent upon meeting certain performance requirements through the expiration of the contract warranty periods. For contractual arrangements that involve retention, we recognize revenue for these amounts upon the expiration of the warranty period, meeting the performance requirements and when collection of the fee is reasonably assured.
For certain arrangements, such as contracts to perform research and development, prototype development contracts and certain product sales, we record revenues using the percentage-of-completion method, measured by the relationship of costs incurred to total estimated contract costs. Percentage-of-completion revenue recognition accounting is predominantly used on certain turnkey power systems installations for electric utilities and long-term prototype development contracts with the U.S. government. We follow this method since reasonably dependable estimates of the revenues and costs applicable to various stages of a contract can be made. However, the ability to reliably estimate total costs at completion is challenging, especially on long-term prototype development contracts, and could result in future changes in contract estimates. For contracts where reasonably dependable estimates of the revenues and costs cannot be made, we follow the completed-contract method.
We enter into sales arrangements that may provide for multiple deliverables to a customer. Sales of certain products may include extended warranty and support or service packages, and at times include performance bonds. As these contracts progress, we continually assess the probability of a payout from the performance bond. Should we determine that such a payout is likely; we would record a liability. We would reduce revenue to the extent a liability is recorded. In addition, we enter into licensing arrangements that include training services.
43
Deliverables are separated into more than one unit of accounting when (1) the delivered element(s) have value to the customer on a stand-alone basis, and (2) delivery of the undelivered element(s) is probable and substantially in our control. In general, revenues are separated between the different product shipments which have stand-alone value, and the various services to be provided. Revenue for product shipments is recognized in accordance with our policy for product sales, while revenues for the services are recognized over the period of performance. We identify all goods and/or services that are to be delivered separately under a sales arrangement and allocate revenue to each deliverable based on the element’s fair value as determined by vendor-specific objective evidence (“VSOE”), which is the price charged when that element is sold separately, or third-party evidence (“TPE”). When VSOE and TPE are unavailable, fair value is based on our best estimate of selling price utilizing a cost plus reasonable margin consistent with how we have set pricing historically for similar products and services. When our estimates are used to determine fair value, we make our estimates using reasonable and objective evidence to determine the price. We review VSOE and TPE at least annually. If we conclude we are unable to establish fair values for one or more undelivered elements within a multiple-element arrangement using VSOE then we use TPE or the best estimate of the selling price for that unit of accounting, being the price at which the vendor would transact if the unit of accounting were sold by the vendor regularly on a standalone basis.
Our license agreements provide either for the payment of contractually determined paid-up front license fees or milestone based payments in consideration for the grant of rights to manufacture and or sell products using our patented technologies or know-how. Some of these agreements provide for the release of the licensee from intellectual property infringements past and future claims. When we can determine that we have no further obligations other than the grant of the license and that we have fully transferred the technology knowhow, we will recognize the revenue. In certain arrangements we may also agree to provide training services to transfer the technology know-how. In other license arrangements we have determined that the licenses have no standalone value to the customer and are not separable from training services as we can only fully transfer the technology know-how through the training component. Accordingly, we account for these arrangements as a single unit of accounting, and recognize revenue over the period of its performance and milestones that have been achieved. Costs for these arrangements are expensed as incurred.
In December 2015, we entered into a set of strategic agreements valued at approximately $210.0 million with Inox, which includes a multi-year supply contract pursuant to which we will supply electric control systems to Inox and a license agreement allowing Inox to manufacture a limited number of electrical control systems over the next three to four years. We determined this license has standalone value to the customer and can be separated from the supply contract. The license agreement includes customer acceptance criteria to demonstrate the know-how to manufacture the electrical control systems has been fully transferred. We continue to defer revenue recognition for the allocable portion of the license until this acceptance criteria has been met.
In March 2016, we entered into a set of agreements to jointly develop an advanced low cost manufacturing process for second generation high temperature superconductor wire with BASF. In the joint development, our manufacturing know-how for our Amperium® superconductor wire and BASF's chemical solution deposition production technology are being combined. As part of the agreements, we also entered into a royalty-bearing, non-exclusive license under which we will provide BASF a specified portion of our second generation (2G) high temperature superconductor (HTS) wire manufacturing technology. We determined that the license rights we provide to BASF have standalone value from the ongoing joint development effort. We transferred the license rights to BASF in March 2016, recording $3.0M of license revenues in the fiscal year ended March 31, 2016 as there were no remaining obligations associated with these rights. Any newly developed intellectual property as a result of the joint development will be owned by BASF. Should this development effort be successful, we have the right to incorporate this new technology into our manufacturing process on a royalty-free basis. BASF has also agreed to make guaranteed annual payments to us through fiscal 2017 and has an option to continue the joint development through fiscal 2018. We are recording revenue for the research and development services we are providing over the term of the arrangement.
We have elected to record taxes collected from customers on a net basis and do not include tax amounts in revenue or costs of revenue.
Customer deposits received in advance of revenue recognition are recorded as deferred revenue until customer acceptance is received. Deferred revenue also represents the amount billed to and/or collected from commercial and government customers on contracts which permit billings to occur in advance of contract performance/revenue recognition.
Accounts Receivable
Accounts receivable consist of amounts owed by commercial companies and government agencies. Accounts receivable are stated net of allowances for doubtful accounts. Our accounts receivable relate principally to a limited number of customers. As of March 31, 2017, of our total receivable balance, Inox accounted for approximately 52%, and SSE plc accounted for
44
approximately 17%, with no other customers accounting for greater than 10% of the balance. As of March 31, 2016, Inox accounted for approximately 84% of our total receivable balance, with no other customers accounting for greater than 10% of the balance. Changes in the financial condition or operations of our customers may result in delayed payments or non-payments which would adversely impact our cash flows from operating activities and/or our results of operations. As such, we may require collateral, advanced payment or other security based upon the customer history and/or creditworthiness. In determining the allowance for doubtful accounts, we evaluate the collectability of accounts receivable based primarily on the probability of recoverability based on historical collection and write-off experience, the age of past due receivables, specific customer circumstances, and current economic trends. If the financial condition of our customers were to deteriorate, resulting in an impairment of their ability to make payment, additional allowances may be required. Failure to accurately estimate the losses for doubtful accounts and ensure that payments are received on a timely basis could have a material adverse effect on our business, financial condition, results of operations, and cash flows.
Inventory
Inventories include material, direct labor and related manufacturing overhead, and are stated at the lower of cost or net realizable value determined on a first-in, first-out basis. We record inventory when we take delivery and title to the product according to the terms of each supply contract.
Program costs may be deferred and recorded as inventory on contracts on which costs are incurred in excess of approved contractual amounts and/or funding, if future recovery of the costs is deemed probable.
At each balance sheet date, we evaluate our ending inventories for excess quantities and obsolescence. Inventories that management considers excess or obsolete are reserved. Management considers forecasted demand in relation to the inventory on hand, competitiveness of product offerings, market conditions and product life cycles when determining excess and obsolescence and net realizable value adjustments. Once inventory is written down and a new cost basis is established, it is not written back up if demand increases.
We recorded inventory reserves of $1.6 million during fiscal 2016 and $2.7 million during fiscal 2015, respectively, based on evaluating our ending inventories for excess quantities and obsolescence. We recorded an inventory reserve of approximately $63.9 million during fiscal 2010 based on our evaluation of forecasted demand in relation to the inventory on hand and market conditions surrounding our products as a result of the assumption that Sinovel and certain other customers in China would fail to meet their contractual obligations and demand that was previously forecasted would fail to materialize. If, in any period, we are able to sell inventories that were not valued or that had been reserved in a previous period, related revenues would be recorded without any offsetting charge to cost of revenues, resulting in a net benefit to our gross profit in that period. In fiscal 2016, 2015, and 2014, $1.4 million, $5.0 million, and $8.0 million respectively, were recognized as a net benefit to gross profit for inventory previously reserved in fiscal year 2010.
Valuation of long-lived assets
We periodically evaluate our long-lived assets, consisting principally of fixed and amortizable intangible assets for potential impairment. In accordance with the applicable accounting guidance for the treatment of long-lived assets, we review the carrying value of our long-lived assets or asset group that is held and used, including intangible assets subject to amortization, for impairment whenever events and circumstances indicate that the carrying value of the assets may not be recoverable. Under the held and used approach, the asset or asset group to be tested for impairment should represent the lowest level for which identifiable cash flows are largely independent of the cash flows of other groups of assets and liabilities. The determination of our asset groups involves a significant amount of judgment, assumptions and estimates. We evaluate our long-lived assets whenever events or circumstances suggest that the carrying amount of an asset or group of assets may not be recoverable from the estimated undiscounted future cash flows.
Our judgments regarding the existence of impairment indicators are based on market and operational performance. Indicators of potential impairment include:
• | a significant change in the manner in which an asset group is used; |
• | a significant decrease in the market value of an asset group; |
• | identification of other impaired assets within a reporting unit; |
• | a significant adverse change in its business or the industry in which it is sold; |
• | a current period operating cash flow loss combined with a history of operating or cash flow losses or a projection or forecast that demonstrates continuing losses associated with the asset group; and |
45
• | significant advances in our technologies that require changes in our manufacturing process. |
On April 3, 2017, the Board of Directors approved a plan to reduce our global workforce by approximately 8%, effective April 4, 2017 primarily in our Devens, Massachusetts facility. The Board of Directors also approved a move from our currently owned 355,000 square-foot facility in Devens, Massachusetts to a smaller facility better suited for our 2G wire process and our systems manufacturing. Since the restructuring activities impacted our Superconductor and Corporate assets group, we concluded that there were indicators of potential impairment of our long-lived assets that required further analysis for these assets groups as of March 31, 2017. We conducted assessments of the recoverability of these assets by comparing the carrying value of the assets to the pre-tax undiscounted cash flows estimated to be generated by those assets over their remaining book useful lives. Based on the calculations performed by management, the sum of the undiscounted cash flows forecasted to be generated by certain assets were less than the carrying value of those assets. Therefore, there were indicators that certain of our assets were impaired and we performed additional analysis. An evaluation of the level of impairment was made by comparing the fair value of the definite long-lived tangible and intangible assets of its reporting units against their carrying values.
The fair values for the impacted property and equipment were based on what we could reasonably expect to sell each asset for from the perspective of a market participant. The determination of the fair value of our property and equipment includes estimates and judgments regarding marketability and ultimate sales price of individual assets. We utilized market data and approximations from comparable analyses to arrive at the fair value of the impacted property and equipment. The fair values of the amortizable intangible assets related to core technology and trade names were determined using primarily the relief-from-royalty method over the estimated economic lives of these assets from a perspective of a market participant. During the fiscal year ended March 31, 2017, we determined that the long-lived assets for the Superconductor and Corporate asset groups were not impaired as their estimated fair values exceed the carrying values.
Income taxes
Our provision for income taxes is comprised of a current and a deferred portion. The current income tax provision is calculated as the estimated taxes payable or refundable on tax returns for the current year. The deferred income tax provision is calculated for the estimated future tax effects attributable to temporary differences and carryforwards using expected tax rates in effect in the years during which the differences are expected to reverse. All deferred tax assets and liabilities are presented as non-current in the Consolidated Balance Sheet.
We regularly assess our ability to realize our deferred tax assets. Assessments of the realization of deferred tax assets require that management consider all available evidence, both positive and negative, and make significant judgments about many factors, including the amount and likelihood of future taxable income. Based on all the available evidence, we have recorded valuation allowances to reduce our deferred tax assets to the amount that is more likely than not to be realizable due to the taxable losses that have been incurred since our inception and uncertainty around our future profitability.
Accounting for income taxes requires a two-step approach to recognizing and measuring uncertain tax positions. The first step is to evaluate the tax position for recognition by determining if, based on the technical merits, it is more likely than not that the position will be sustained upon audit, including resolution of related appeals or litigation processes, if any. The second step is to measure the tax benefit as the largest amount that is more than 50% likely of being realized upon ultimate settlement. We reevaluate these uncertain tax positions on a quarterly basis. This evaluation is based on factors including, but not limited to, changes in facts or circumstances, changes in tax law, effectively settled issues under audit and new audit activity. Any changes in these factors could result in the recognition of a tax benefit or an additional charge to the tax provision. We include interest and penalties related to gross unrecognized tax benefits within the provision for income taxes. See Note 11, “Income Taxes,” of our consolidated financial statements for further information regarding our income tax assumptions and expenses.
We evaluate our permanent reinvestment assertions with respect to foreign earnings at each reporting period. We have not recorded a deferred tax asset for the temporary difference associated with the excess of the tax basis over the book basis in our Austrian and Chinese subsidiaries as the future tax benefit is not expected to reverse in the foreseeable future. We have recorded a deferred tax liability as of March 31, 2017 for the undistributed earnings of our remaining foreign subsidiaries for which we can no longer assert are permanently reinvested. The total amount of undistributed earnings available to be repatriated at March 31, 2017 was $2.1 million resulting in the recording of a $0.7 million net deferred federal and state income tax liability. See Note 11, “Income Taxes,” of our consolidated financial statements for the results of this assessment.
Stock-based compensation
46
We measure compensation cost arising from the grant of share-based payments to employees at fair value and recognize such cost over the period during which the employee is required to provide service in exchange for the award, usually the vesting period. Total stock-based compensation expense recognized during the fiscal years ended March 31, 2017, 2016, and 2015 was $2.9 million, $3.2 million, and $5.9 million, respectively. For awards with service conditions only, we recognize compensation cost on a straight-line basis over the requisite service/vesting period. For awards with performance conditions, accruals of compensation cost are made based on the probable outcome of the performance conditions. The cumulative effect of changes in the probability outcomes are recorded in the period in which the changes occur.
Determining the appropriate fair value model and calculating the fair value of share-based payment awards requires the input of highly subjective assumptions, including the expected life of the share-based payment awards and stock price volatility. Management determined that expected volatility rates should be estimated based on historical and implied volatilities of our common stock. The expected term represents the average time that the options that vest are expected to be outstanding based on the vesting provisions and our historical exercise, cancellation and expiration patterns. The assumptions used in calculating the fair value of share-based payment awards represent management’s best estimates, but these estimates involve inherent uncertainties and the application of management judgment. As a result, if circumstances change and we use different assumptions, our stock-based compensation expense could be materially different in the future. In addition, we are required to estimate an expected forfeiture rate and only recognize expense for those shares expected to vest. If our actual forfeiture rate is materially different from our estimate, the stock-based compensation expense could be significantly different from what we have recorded in the current period. See Note 12, “Stockholders’ Equity,” of our consolidated financial statements for further information regarding our stock-based compensation assumptions and expenses.
Our adoption of ASU 2016-09 Compensation - Stock Compensation (Topic 718): Improvements to Employee Share-Based Payment Accounting also resulted in the prospective classification of excess tax benefits as cash flows from operating activities in the same manner as other cash flows related to income taxes within the consolidated statements of cash flows. Based on the prospective method of adoption chosen, the classification of excess tax benefits within the consolidated statements of cash flows for prior periods presented has not been adjusted to reflect the change.
Contingencies
From time to time, we are involved in legal and administrative proceedings and claims of various types. We record a liability in our consolidated financial statements for these matters when a loss is known or considered probable and the amount can be reasonably estimated. We review these estimates each accounting period as additional information is known and adjust the loss provision when appropriate. If the loss is not probable or cannot be reasonably estimated, a liability is not recorded in our consolidated financial statements. If, with respect to a matter, it is not both probable to result in liability and the amount of loss cannot be reasonably estimated, an estimate of possible loss or range of loss shall be disclosed unless such an estimate cannot be made. We do not recognize gain contingencies until they are realized. Legal costs incurred in connection with loss contingencies are expensed as incurred. During the fiscal year ended March 31, 2015, we reversed legal expenses of approximately $2.2 million incurred in connection with the Ghodawat arbitration that were covered by our Catlin settlement. See Note 13, “Commitments and Contingencies”, of our consolidated financial statements for further information.
Product Warranty
Warranty obligations are incurred in connection with the sale of our products. We generally provide a one to three year warranty on our products, commencing upon installation. The costs incurred to provide for these warranty obligations are estimated and recorded as an accrued liability at the time of sale. Future warranty costs are estimated based on historical performance rates and related costs to repair given products. The accounting estimate related to product warranty involves judgment in determining future estimated warranty costs. Should actual performance rates or repair costs differ from estimates, revision to the estimated warranty liability would be required.
Fair Value of Financial Instruments
Our financial instruments consist principally of cash and cash equivalents, accounts receivable, accounts payable, accrued expenses, derivatives, warrants, and the term loans. The carrying amounts of cash and cash equivalents, accounts receivable, accounts payable, and accrued expenses due to their short nature approximate fair value at March 31, 2017 and 2016. The estimated fair values have been determined through information obtained from market sources and management estimates. The fair value for the debt and warrant arrangements has been estimated by management based on the terms that we believe we could obtain in the current market for debt with the same terms and similar maturities. The warrants are subject to revaluation at each balance sheet date, and any change in fair value will be recorded as a change in fair value in other (expense) income until the earlier of
47
the warrants’ exercise or expiration. We rely on assumptions used in a lattice model to determine the fair value of the warrants. We have appropriately valued the warrants within Level 3 of the valuation hierarchy.
Item 7A. | QUANTITATIVE AND QUALITATIVE DISCLOSURES ABOUT MARKET RISK |
We face exposure to financial market risks, including adverse movements in foreign currency exchange rates and changes in interest rates. These exposures may change over time as our business practices evolve and could have a material adverse impact on our financial results.
Cash and cash equivalents
Our exposure to market risk through financial instruments, such as investments in marketable securities, is limited to interest rate risk and is not material. Our investments in marketable securities consist primarily of government-backed securities and commercial paper and are designed, in order of priority, to preserve principal, provide liquidity, and maximize income. Investments are monitored to limit exposure to mortgage-backed securities and similar instruments responsible for the recent turmoil in the credit markets. Interest rates are variable and fluctuate with current market conditions. We do not believe that a 10% change in interest rates would have a material impact on our financial position or results of operations.
Foreign currency exchange risk
The functional currency of each of our foreign subsidiaries is the U.S. dollar, except for AMSC Austria, for which the local currency (Euro) is the functional currency, and AMSC China, for which the local currency (Renminbi) is the functional currency. The assets and liabilities of AMSC Austria and AMSC China are translated into U.S. dollars at the exchange rate in effect at the balance sheet date and income and expense items are translated at average rates for the period. Cumulative translation adjustments are excluded from net income (loss) and shown as a separate component of stockholders’ equity.
We face exposure to movements in foreign currency exchange rates whenever we, or any of our subsidiaries, enter into transactions with third parties that are denominated in currencies other than our functional currency. Intercompany transactions between entities that use different functional currencies also expose us to foreign currency risk. Gross margins of products we manufacture in the U.S and sell in currencies other than the U.S. dollar are also affected by foreign currency exchange rate movements. In addition, a portion of our earnings is generated by our foreign subsidiaries, whose functional currencies are other than the U.S. dollar, and our revenues and earnings could be materially impacted by movements in foreign currency exchange rates upon the translation of the earnings of such subsidiaries into the U.S. dollar. If the functional currency for AMSC Austria and AMSC China were to fluctuate by 10% the net effect would be immaterial to our consolidated financial statements.
Foreign currency gains (losses), are included in net loss and were $0.1 million, ($2.3) million and $2.7 million for the fiscal years ended March 31, 2017, 2016 and 2015, respectively.
48
Item 8. | FINANCIAL STATEMENTS AND SUPPLEMENTARY DATA |
Report of Independent Registered Public Accounting Firm
To the Board of Directors and Stockholders
of American Superconductor Corporation
We have audited the accompanying consolidated balance sheets of American Superconductor Corporation and its subsidiaries (collectively, the “Company”) as of March 31, 2017 and 2016, and the related consolidated statements of operations, comprehensive loss, stockholders' equity, and cash flows for each of the three years in the period ended March 31, 2017, and the financial statement schedule of American Superconductor Corporation and subsidiaries listed in Item 15(a)2 as of March 31, 2017 and 2016 and for each of the three years in the period ended March 31, 2017. We also have audited the Company's internal control over financial reporting as of March 31, 2017, based on criteria established in Internal Control - Integrated Framework issued by the Committee of Sponsoring Organizations of the Treadway Commission in 2013. The Company's management is responsible for these financial statements and financial statement schedule, for maintaining effective internal control over financial reporting, and for its assessment of the effectiveness of internal control over financial reporting included in the accompanying Management’s Report on Internal Control over Financial Reporting. Our responsibility is to express an opinion on these financial statements and the financial statement schedule and an opinion on the Company's internal control over financial reporting based on our audits.
We conducted our audits in accordance with the standards of the Public Company Accounting Oversight Board (United States). Those standards require that we plan and perform the audits to obtain reasonable assurance about whether the financial statements are free of material misstatement and whether effective internal control over financial reporting was maintained in all material respects. Our audits of the financial statements included examining, on a test basis, evidence supporting the amounts and disclosures in the financial statements, assessing the accounting principles used and significant estimates made by management, and evaluating the overall financial statement presentation. Our audit of internal control over financial reporting included obtaining an understanding of internal control over financial reporting, assessing the risk that a material weakness exists, and testing and evaluating the design and operating effectiveness of internal control based on the assessed risk. Our audits also included performing such other procedures as we considered necessary in the circumstances. We believe that our audits provide a reasonable basis for our opinions.
A company's internal control over financial reporting is a process designed to provide reasonable assurance regarding the reliability of financial reporting and the preparation of financial statements for external purposes in accordance with generally accepted accounting principles. A company's internal control over financial reporting includes those policies and procedures that (a) pertain to the maintenance of records that, in reasonable detail, accurately and fairly reflect the transactions and dispositions of the assets of the company; (b) provide reasonable assurance that transactions are recorded as necessary to permit preparation of financial statements in accordance with generally accepted accounting principles, and that receipts and expenditures of the company are being made only in accordance with authorizations of management and directors of the company; and (c) provide reasonable assurance regarding prevention or timely detection of unauthorized acquisition, use, or disposition of the company's assets that could have a material effect on the financial statements.
Because of its inherent limitations, internal control over financial reporting may not prevent or detect misstatements. Also, projections of any evaluation of effectiveness to future periods are subject to the risk that controls may become inadequate because of changes in conditions, or that the degree of compliance with the policies or procedures may deteriorate.
In our opinion, the consolidated financial statements referred to above present fairly, in all material respects, the financial position of American Superconductor Corporation and its subsidiaries as of March 31, 2017 and 2016, and the results of their operations and their cash flows for each of the three years in the period ended March 31, 2017, in conformity with accounting principles generally accepted in the United States of America, and in our opinion, the related financial statement schedule, when considered in relation to the basic consolidated financial statements taken as a whole, presents fairly in all material respects the information set forth therein. Also in our opinion, American Superconductor Corporation and its subsidiaries maintained, in all material respects, effective internal control over financial reporting as of March 31, 2017, based on criteria established in Internal Control - Integrated Framework issued by the Committee of Sponsoring Organizations of the Treadway Commission in 2013.
/s/ RSM US LLP
Boston, Massachusetts
May 25, 2017
49
AMERICAN SUPERCONDUCTOR CORPORATION
PART I — FINANCIAL INFORMATION
ITEM 1. FINANCIAL STATEMENTS
CONSOLIDATED BALANCE SHEETS
(In thousands)
March 31, 2017 | March 31, 2016 | ||||||
ASSETS | |||||||
Current assets: | |||||||
Cash and cash equivalents | $ | 26,784 | $ | 39,330 | |||
Accounts receivable, net | 7,956 | 19,264 | |||||
Inventory | 17,462 | 18,512 | |||||
Prepaid expenses and other current assets | 2,703 | 5,778 | |||||
Restricted cash | 795 | 457 | |||||
Total current assets | 55,700 | 83,341 | |||||
Property, plant and equipment, net | 43,438 | 49,778 | |||||
Intangibles, net | 301 | 854 | |||||
Restricted cash | 165 | 934 | |||||
Deferred tax assets | 407 | 96 | |||||
Other assets | 233 | 315 | |||||
Total assets | $ | 100,244 | $ | 135,318 | |||
LIABILITIES AND STOCKHOLDERS' EQUITY | |||||||
Current liabilities: | |||||||
Accounts payable and accrued expenses | $ | 14,490 | $ | 23,156 | |||
Note payable, current portion, net of discount of $19 as of March 31, 2017 and $42 as of March 31, 2016 | 1,481 | 2,624 | |||||
Derivative liabilities | 1,923 | 3,227 | |||||
Deferred revenue | 14,323 | 12,000 | |||||
Total current liabilities | 32,217 | 41,007 | |||||
Note payable, net of discount of $133 as of March 31, 2016 | — | 1,367 | |||||
Deferred revenue | 7,631 | 9,269 | |||||
Deferred tax liabilities | 125 | 63 | |||||
Other liabilities | 45 | 63 | |||||
Total liabilities | 40,018 | 51,769 | |||||
Commitments and contingencies (Note 13) | |||||||
Stockholders' equity: | |||||||
Common stock, $0.01 par value, 75,000,000 shares authorized; 14,713,839 and 14,107,126 shares issued at March 31, 2017 and 2016, respectively | 147 | 141 | |||||
Additional paid-in capital | 1,017,510 | 1,011,813 | |||||
Treasury stock, at cost, 97,529 and 51,506 shares at March 31, 2017 and 2016, respectively | (1,371 | ) | (881 | ) | |||
Accumulated other comprehensive (loss) income | (503 | ) | 660 | ||||
Accumulated deficit | (955,557 | ) | (928,184 | ) | |||
Total stockholders' equity | 60,226 | 83,549 | |||||
Total liabilities and stockholders' equity | $ | 100,244 | $ | 135,318 | |||
The accompanying notes are an integral part of the consolidated financial statements.
50
AMERICAN SUPERCONDUCTOR CORPORATION
CONSOLIDATED STATEMENTS OF OPERATIONS
(In thousands, except per share data)
Fiscal Year Ended March 31, | |||||||||||
2017 | 2016 | 2015 | |||||||||
Revenues | $ | 75,195 | $ | 96,023 | $ | 70,530 | |||||
Cost of revenues | 64,352 | 74,041 | 67,442 | ||||||||
Gross profit | 10,843 | 21,982 | 3,088 | ||||||||
Operating expenses: | |||||||||||
Research and development | 12,540 | 12,303 | 11,878 | ||||||||
Selling, general and administrative | 25,688 | 28,861 | 29,217 | ||||||||
Arbitration award expense | — | — | 8,987 | ||||||||
Restructuring and impairments | — | 779 | 5,366 | ||||||||
Amortization of acquisition related intangibles | 157 | 157 | 157 | ||||||||
Total operating expenses | 38,385 | 42,100 | 55,605 | ||||||||
Operating loss | (27,542 | ) | (20,118 | ) | (52,517 | ) | |||||
Change in fair value of derivatives and warrants | 1,304 | (228 | ) | 3,963 | |||||||
Gain on sale of minority interests | 325 | 3,092 | — | ||||||||
Interest expense, net | (383 | ) | (1,037 | ) | (1,882 | ) | |||||
Other income (expense), net | 65 | (2,457 | ) | 1,596 | |||||||
Loss before income tax expense (benefit) | (26,231 | ) | (20,748 | ) | (48,840 | ) | |||||
Income tax expense (benefit) | 1,142 | 2,391 | (184 | ) | |||||||
Net loss | $ | (27,373 | ) | $ | (23,139 | ) | $ | (48,656 | ) | ||
Net loss per common share | |||||||||||
Basic | $ | (1.98 | ) | $ | (1.76 | ) | $ | (5.74 | ) | ||
Diluted | $ | (1.98 | ) | $ | (1.76 | ) | $ | (5.74 | ) | ||
Weighted average number of common shares outstanding | |||||||||||
Basic | 13,804 | 13,178 | 8,477 | ||||||||
Diluted | 13,804 | 13,178 | 8,477 | ||||||||
The accompanying notes are an integral part of the consolidated financial statements.
51
AMERICAN SUPERCONDUCTOR CORPORATION
CONSOLIDATED STATEMENTS OF COMPREHENSIVE LOSS
(In thousands)
Fiscal Year Ended March 31, | |||||||||||
2017 | 2016 | 2015 | |||||||||
Net loss | $ | (27,373 | ) | $ | (23,139 | ) | $ | (48,656 | ) | ||
Other comprehensive (loss) gain, net of tax: | |||||||||||
Foreign currency translation (losses) gains | (1,163 | ) | 968 | (2,147 | ) | ||||||
Total other comprehensive (loss) gain, net of tax | (1,163 | ) | 968 | (2,147 | ) | ||||||
Comprehensive loss | $ | (28,536 | ) | $ | (22,171 | ) | $ | (50,803 | ) | ||
The accompanying notes are an integral part of the consolidated financial statements.
52
AMERICAN SUPERCONDUCTOR CORPORATION
CONSOLIDATED STATEMENTS OF STOCKHOLDERS’ EQUITY
(In thousands)
Common Stock | Additional Paid-in Capital | Treasury Stock | Accumulated Other Comprehensive Income (Loss) | Accumulated Deficit | Total Stockholders' Equity | |||||||||||||||||||||
Number of Shares | Par Value | |||||||||||||||||||||||||
Balance at March 31, 2014 | 7,893 | $ | 79 | $ | 967,100 | $ | (370 | ) | $ | 1,839 | $ | (856,389 | ) | $ | 112,259 | |||||||||||
Issuance of common stock - ESPP | 17 | — | 124 | — | — | — | 124 | |||||||||||||||||||
Issuance of common stock - restricted shares | 301 | 3 | (3 | ) | — | — | — | — | ||||||||||||||||||
Stock-based compensation expense | — | — | 5,936 | — | — | — | 5,936 | |||||||||||||||||||
Issuance of stock for 401(k) match | 35 | — | 392 | — | — | — | 392 | |||||||||||||||||||
Issuance of common stock-ATM, net of costs | 375 | 4 | 5,835 | — | — | — | 5,839 | |||||||||||||||||||
Issuance of common stock-Hudson Bay Capital | 909 | 9 | 5,216 | — | — | — | 5,225 | |||||||||||||||||||
Issuance of common stock to settle liabilities | 94 | 1 | 1,322 | — | — | — | 1,323 | |||||||||||||||||||
Reverse stock split | — | — | (1 | ) | — | — | — | (1 | ) | |||||||||||||||||
Repurchase of treasury stock | — | — | — | (401 | ) | — | — | (401 | ) | |||||||||||||||||
Cumulative translation adjustment | — | — | — | — | (2,147 | ) | — | (2,147 | ) | |||||||||||||||||
Net loss | — | — | — | — | — | (48,656 | ) | (48,656 | ) | |||||||||||||||||
Balance at March 31, 2015 | 9,624 | $ | 96 | $ | 985,921 | $ | (771 | ) | $ | (308 | ) | $ | (905,045 | ) | $ | 79,893 | ||||||||||
Issuance of common stock - ESPP | 8 | — | 30 | — | — | — | 30 | |||||||||||||||||||
Issuance of common stock - restricted shares | 409 | 4 | (4 | ) | — | — | — | — | ||||||||||||||||||
Stock-based compensation expense | — | — | 3,248 | — | — | — | 3,248 | |||||||||||||||||||
Issuance of stock for 401(k) match | 66 | 1 | 376 | — | — | — | 377 | |||||||||||||||||||
Issuance of common stock-equity offering | 4,000 | 40 | 22,242 | — | — | — | 22,282 | |||||||||||||||||||
Repurchase of treasury stock | — | — | — | (110 | ) | — | — | (110 | ) | |||||||||||||||||
Cumulative translation adjustment | — | — | — | — | 968 | — | 968 | |||||||||||||||||||
Net loss | — | — | — | — | — | (23,139 | ) | (23,139 | ) | |||||||||||||||||
Balance at March 31, 2016 | 14,107 | $ | 141 | $ | 1,011,813 | $ | (881 | ) | $ | 660 | $ | (928,184 | ) | $ | 83,549 | |||||||||||
Issuance of common stock - restricted shares | 174 | 2 | (2 | ) | — | — | — | — | ||||||||||||||||||
Stock-based compensation expense | — | — | 2,892 | — | — | — | 2,892 | |||||||||||||||||||
Issuance of stock for 401(k) match | 53 | — | 284 | — | — | — | 284 | |||||||||||||||||||
Issuance of common stock-equity offering | 380 | 4 | 2,523 | — | — | — | 2,527 | |||||||||||||||||||
Repurchase of treasury stock | — | — | — | (490 | ) | — | — | (490 | ) | |||||||||||||||||
Cumulative translation adjustment | — | — | — | — | (1,163 | ) | — | (1,163 | ) | |||||||||||||||||
Net loss | — | — | — | — | — | (27,373 | ) | (27,373 | ) | |||||||||||||||||
Balance at March 31, 2017 | 14,714 | $ | 147 | $ | 1,017,510 | $ | (1,371 | ) | $ | (503 | ) | $ | (955,557 | ) | $ | 60,226 | ||||||||||
The accompanying notes are an integral part of the consolidated financial statements.
53
AMERICAN SUPERCONDUCTOR CORPORATION
CONSOLIDATED STATEMENTS OF CASH FLOWS
(In thousands)
Fiscal Year Ended March 31, | |||||||||||
2017 | 2016 | 2015 | |||||||||
Cash flows from operating activities: | |||||||||||
Net loss | $ | (27,373 | ) | $ | (23,139 | ) | $ | (48,656 | ) | ||
Adjustments to reconcile net loss to net cash used in operations: | |||||||||||
Depreciation and amortization | 7,519 | 7,972 | 9,554 | ||||||||
Stock-based compensation expense | 2,892 | 3,248 | 5,936 | ||||||||
Impairment of minority interest investments | — | 746 | 3,464 | ||||||||
Provision for excess and obsolete inventory | 1,615 | 2,713 | 1,386 | ||||||||
Write-off prepaid taxes | — | 289 | — | ||||||||
Gain on sale from minority interest investments | (325 | ) | (3,092 | ) | — | ||||||
Loss from minority interest investments | — | 356 | 743 | ||||||||
Change in fair value of derivatives and warrants | (1,304 | ) | 228 | (3,963 | ) | ||||||
Reversal of Catlin legal costs | — | — | (2,220 | ) | |||||||
Non-cash interest expense | 156 | 359 | 566 | ||||||||
Other non-cash items | (940 | ) | 1,462 | (2,436 | ) | ||||||
Changes in operating asset and liability accounts: | |||||||||||
Accounts receivable | 11,143 | (9,318 | ) | (2,677 | ) | ||||||
Inventory | (815 | ) | (782 | ) | (1,887 | ) | |||||
Prepaid expenses and other current assets | 2,729 | 5,608 | (2,330 | ) | |||||||
Accounts payable and accrued expenses | (7,938 | ) | 1,543 | 5,579 | |||||||
Deferred revenue | 1,426 | 7,248 | 4,265 | ||||||||
Net cash used in operating activities | (11,215 | ) | (4,559 | ) | (32,676 | ) | |||||
Cash flows from investing activities: | |||||||||||
Purchase of property, plant and equipment | (656 | ) | (1,201 | ) | (737 | ) | |||||
Proceeds from the sale of property, plant and equipment | 29 | 47 | 18 | ||||||||
Change in restricted cash | 431 | 2,669 | 2,248 | ||||||||
Proceeds from sale of minority interests | 325 | 3,092 | — | ||||||||
Change in other assets | 63 | 266 | 280 | ||||||||
Net cash provided by investing activities | 192 | 4,873 | 1,809 | ||||||||
Cash flows from financing activities: | |||||||||||
Employee taxes paid related to net settlement of equity awards | (490 | ) | (110 | ) | (401 | ) | |||||
Proceeds from the issuance of debt, net of expenses | — | — | 1,422 | ||||||||
Repayment of debt | (3,167 | ) | (4,000 | ) | (7,295 | ) | |||||
Proceeds from ATM sales, net | 2,527 | — | 5,839 | ||||||||
Proceeds from public equity offering, net | — | 22,282 | 9,094 | ||||||||
Proceeds from exercise of employee stock options and ESPP | — | 30 | 124 | ||||||||
Net cash (used in) provided by financing activities | (1,130 | ) | 18,202 | 8,783 | |||||||
Effect of exchange rate changes on cash and cash equivalents | (393 | ) | 324 | (540 | ) | ||||||
Net (decrease)/increase in cash and cash equivalents | (12,546 | ) | 18,840 | (22,624 | ) | ||||||
Cash and cash equivalents at beginning of year | 39,330 | 20,490 | 43,114 | ||||||||
Cash and cash equivalents at end of year | $ | 26,784 | $ | 39,330 | $ | 20,490 | |||||
Supplemental schedule of cash flow information: | |||||||||||
Cash paid for income taxes, net of refunds | $ | 992 | $ | 1,723 | $ | 362 | |||||
Issuance of common stock to settle liabilities | 399 | 377 | 1,715 | ||||||||
Cash paid for interest | 280 | 709 | 1,362 | ||||||||
The accompanying notes are an integral part of the consolidated financial statements.
54
1. Nature of the Business and Operations and Liquidity
Nature of the Business and Operations
American Superconductor Corporation (together with its subsidiaries, “AMSC” or the “Company”) was founded on April 9, 1987. The Company is a leading provider of megawatt-scale solutions that lower the cost of wind power and enhance the performance of the power grid. In the wind power market, the Company enables manufacturers to field wind turbines through its advanced engineering, support services and power electronics products. In the power grid market, the Company enables electric utilities and renewable energy project developers to connect, transmit and distribute power through its transmission planning services and power electronics and superconductor-based products. The Company’s wind and power grid products and services provide exceptional reliability, security, efficiency and affordability to its customers.
The Company’s consolidated financial statements have been prepared on a going concern basis in accordance with United States generally accepted accounting principles (“GAAP”) and the Securities and Exchange Commission’s (“SEC”) instructions to Form 10-K. The going concern basis of presentation assumes that the Company will continue operations and will be able to realize its assets and discharge its liabilities and commitments in the normal course of business.
On March 24, 2015, the Company effected a 1-for-10 reverse stock split of its common stock. Trading of the Company’s common stock reflected the reverse stock split beginning on March 25, 2015. Unless otherwise indicated, all historical references to shares of common stock, shares of restricted stock, restricted stock units, shares underlying options, warrants or calculations that use common stock for per share financial reporting have been adjusted for comparative purposes to reflect the impact of the 1-for-10 reverse stock split as if it had occurred at the beginning of the earliest period presented.
Liquidity
The Company has experienced recurring operating losses and as of March 31, 2017, the Company had an accumulated deficit of $955.6 million. In addition, the Company has experienced recurring negative operating cash flows. At March 31, 2017, the Company had cash and cash equivalents of $26.8 million. Cash used in operations for the year ended March 31, 2017 was $11.2 million.
From April 1, 2011 through the date of this filing, the Company has reduced its global workforce substantially, including an 8% reduction in force, primarily affecting employees in its Devens, Massachusetts facility, effective April 4, 2017. The Company has taken actions to consolidate certain business operations to reduce facility costs. As of March 31, 2017, the Company had a global workforce of 354 persons. The Company plans to closely monitor its expenses and, if required, expects to further reduce operating costs and capital spending to enhance liquidity. The Company expects to incur restructuring charges of $1.5 million to $2.0 million in cash severance expenses in the first quarter of fiscal 2017, in connection with the workforce reduction.
Over the last several years, the Company has entered into several debt and equity financing arrangements in order to enhance liquidity. During the fiscal years ended March 31, 2013 through 2017, the Company generated aggregate cash flows from financing activities of $69.9 million, including net proceeds of $2.5 million during the three months ended March 31, 2017 from the Company's At Market Issuance Sales Agreement ("ATM") with FBR Capital Markets & Co. In addition, on May 10, 2017, the Company completed an additional equity offering, which generated net proceeds of approximately $14.7 million, after deducting underwriting discounts and commissions and estimated offering expenses payable by the Company. The Company terminated the ATM in conjunction with this equity offering. See Note 9, “Debt”, Note 12 “Stockholders’ Equity”, and Note 19, "Subsequent Events" for further discussion of these financing arrangements. The Company believes that it is in compliance with the covenants and restrictions included in the agreements governing its debt arrangements as of March 31, 2017.
In December 2015, the Company entered into a set of strategic agreements valued at approximately $210.0 million with Inox, which includes a multi-year supply contract pursuant to which the Company will supply electric control systems to Inox Wind Ltd. (“Inox”) and a license agreement allowing Inox to manufacture a limited number of electrical control systems over the next three to four years. After this initial three to four year period, Inox agreed that the Company will continue as Inox’s preferred supplier and Inox will be required to purchase from the Company a majority of its electric control systems requirements for an additional three-year period.
The Company believes based on the information presented above, and its annual management assessment, that it has sufficient liquidity to fund its operations, capital expenditures and scheduled cash payments under its debt obligations to meet the liquidity needs for the next twelve months following the issuance of the financial statements. The Company’s liquidity is highly dependent on its ability to increase revenues, its ability to control its operating costs, its ability to maintain compliance with the covenants and restrictions on its debt obligations (or obtain waivers from the lender in the event of non-compliance), and its ability
55
to raise additional capital, if necessary. There can be no assurance that the Company will be able to continue to raise additional capital from other sources or execute on any other means of improving liquidity described above.
2. Summary of Significant Accounting Policies
Basis of Consolidation
The consolidated financial statements include the accounts of the Company and its wholly-owned subsidiaries. All significant intercompany balances and transactions are eliminated. Certain reclassifications of prior years’ amounts have been made to conform to the current year presentation. These reclassifications had no effect on net income, cash flows from operating activities or stockholders’ equity.
Use of Estimates
The preparation of financial statements in conformity with GAAP requires management to make estimates and assumptions that affect the reported amounts of assets and liabilities, disclosure of contingent assets and liabilities at the date of the financial statements and the reported amounts of revenue and expenses during the reporting period. The Company bases its estimates on historical experience and various other factors believed to be reasonable under the circumstances, the results of which form the basis for making judgments about the carrying value of assets and liabilities that are not readily apparent from other sources. On an ongoing basis, the Company evaluates its estimates, including those related to revenue recognition, collectability of receivables, realizability of inventory, goodwill and intangible assets, warranty provisions, stock-based compensation, valuation of warrant and derivative liabilities, tax reserves, and deferred tax assets. Provisions for depreciation are based on their estimated useful lives using the straight-line method. Some of these estimates can be subjective and complex and, consequently, actual results may differ from these estimates under different assumptions or conditions. While for any given estimate or assumption made by the Company’s management there may be other estimates or assumptions that are reasonable, the Company believes that, given the current facts and circumstances, it is unlikely that applying any such other reasonable estimate or assumption would materially impact the financial statements.
Cash Equivalents
Cash equivalents consist of highly liquid instruments with maturities of three months or less that are regarded as high quality, low risk investments and are measured using such inputs as quoted prices, and are classified within Level 1 of the valuation hierarchy. Cash equivalents consist principally of certificates of deposits and money market accounts.
Accounts Receivable
Accounts receivable consist of amounts owed by commercial companies and government agencies. Accounts receivable are stated net of allowances for doubtful accounts. The Company’s accounts receivable relate principally to a limited number of customers. As of March 31, 2017, Inox, accounted for approximately 52%, and SSE plc for approximately 17% of the Company’s total receivable balance, with no other customer accounting for greater than 10% of the balance. As of March 31, 2016, Inox, accounted for approximately 84% of the Company’s total receivable balance, with no other customer accounting for greater than 10% of the balance. Changes in the financial condition or operations of the Company’s customers may result in delayed payments or non-payments which would adversely impact its cash flows from operating activities and/or its results of operations. As such the Company may require collateral, advanced payment or other security based upon the customer history and/or creditworthiness. In determining the allowance for doubtful accounts, the Company evaluates the collectability of accounts receivable based primarily on the probability of recoverability based on historical collection and write-off experience, the age of past due receivables, specific customer circumstances, and current economic trends. If the financial condition of the Company’s customers were to deteriorate, resulting in an impairment of their ability to make payment, additional allowances may be required. Failure to accurately estimate the losses for doubtful accounts and ensure that payments are received on a timely basis could have a material adverse effect on the Company’s business, financial condition, results of operations, and cash flows.
Inventory
Inventories include material, direct labor and related manufacturing overhead, and are stated at the lower of cost or net realizable value determined on a first-in, first-out basis. The Company records inventory when it takes delivery and title to the product according to the terms of each supply contract.
Program costs may be deferred and recorded as inventory on contracts on which costs are incurred in excess of approved contractual amounts and/or funding, if future recovery of the costs is deemed probable.
56
At each balance sheet date, the Company evaluates its ending inventories for excess quantities and obsolescence. Inventories that management considers excess or obsolete are reserved. Management considers forecasted demand in relation to the inventory on hand, competitiveness of product offerings, market conditions and product life cycles when determining excess and obsolescence and net realizable value adjustments. Once inventory is written down and a new cost basis is established, it is not written back up if demand increases.
For the fiscal years ended March 31, 2017 and 2016, the Company recorded inventory reserves of approximately $1.6 million and $2.7 million, respectively, based on evaluating its ending inventory on hand for excess quantities and obsolescence. For the fiscal years ended March 31, 2017, 2016, and 2015, the Company recorded benefits of $1.4 million, $5.0 million, and $8.0 million, respectively, for the usage of inventories previously reserved.
Property, Plant and Equipment
Property, plant and equipment are carried at cost less accumulated depreciation and amortization. The Company accounts for depreciation and amortization using the straight-line method to allocate the cost of property, plant and equipment over their estimated useful lives as follows:
Asset Classification | Estimated Useful Life in Years | |
Building | 40 | |
Process upgrades to the building | 10-40 | |
Machinery and equipment | 3-10 | |
Furniture and fixtures | 3-5 | |
Leasehold improvements | Shorter of the estimated useful life or the remaining lease term | |
Expenditures for maintenance and repairs are expensed as incurred. Upon retirement or other disposition of assets, the costs and related accumulated depreciation are eliminated from the accounts and the resulting gain or loss is reflected in operating expenses.
Valuation of Long-Lived Assets
The Company periodically evaluates its long-lived assets, consisting principally of fixed assets and amortizable intangible assets, for potential impairment. In accordance with the applicable accounting guidance for the treatment of long-lived assets, the Company reviews the carrying value of its long-lived assets or asset group that is held and used, including intangible assets subject to amortization, for impairment whenever events and circumstances indicate that the carrying value of the assets may not be recoverable. Under the held and used approach, the asset or asset group to be tested for impairment should represent the lowest level for which identifiable cash flows are largely independent of the cash flows of other groups of assets and liabilities. The Company evaluates its long-lived assets whenever events or circumstances suggest that the carrying amount of an asset or group of assets may not be recoverable from the estimated undiscounted future cash flows.
On April 3, 2017, the Board of Directors approved a plan to reduce the Company's global workforce by approximately 8%, effective April 4, 2017 primarily in its Devens, Massachusetts facility. The Board of Directors also approved a move from the Company's currently owned 355,000 square-foot facility in Devens, Massachusetts to a smaller facility better suited for its 2G wire process and systems manufacturing. Since the restructuring activities impacted its Superconductor and Corporate assets group, the Company concluded that there were indicators of potential impairment of its long-lived assets that required further analysis for these assets groups as of March 31, 2017. The Company conducted assessments of the recoverability of these assets by comparing the carrying value of the assets to the pre-tax undiscounted cash flows estimated to be generated by those assets over their remaining book useful lives. Based on the calculations performed by management, the sum of the undiscounted cash flows forecasted to be generated by certain assets were less than the carrying value of those assets. Therefore, there were indicators that certain of its assets were impaired and the Company performed additional analysis. An evaluation of the level of impairment was made by comparing the fair value of the definite long-lived tangible and intangible assets of its reporting units against their carrying values.
The fair values for the impacted property and equipment were based on what the Company could reasonably expect to sell each asset for from the perspective of a market participant. The determination of the fair value of its property and equipment includes estimates and judgments regarding marketability and ultimate sales price of individual assets. The Company utilized market data and approximations from comparable analyses to arrive at the fair value of the impacted property and equipment. The
57
fair values of the amortizable intangible assets related to core technology and trade names were determined using primarily the relief-from-royalty method over the estimated economic lives of these assets from a perspective of a market participant. During the fiscal year ended March 31, 2017, the Company determined that the long-lived assets for the Superconductor and Corporate asset groups were not impaired as the estimated fair values exceeded the carrying values.
Equity Method Investments
The Company uses the equity method of accounting for investments in entities in which it has an ownership interest, but does not exercise a controlling interest in the operating and financial policies of an investee. Under this method, an investment is carried at the acquisition cost, plus the Company’s equity in undistributed earnings or losses since acquisition.
The Company periodically tests its investments for potential impairment whenever events and circumstances indicate a loss in the fair value of the investments may be other than temporary. During the year ended March 31, 2016, the Company recorded an impairment charge of $0.7 million on its investment in Tres Amigas. During the year ended March 31, 2015, the Company recorded an impairment charge of $3.5 million on its investment in Blade Dynamics. Both of these minority investments have been sold as of March 31, 2017. See Note 15, “Minority Investments”, for further discussion.
Revenue Recognition
The Company recognizes revenue for product sales upon customer acceptance, which can occur at the time of delivery, installation or post-installation where applicable, provided persuasive evidence of an arrangement exists, delivery has occurred, the sales price is fixed or determinable and the collectability is reasonably assured. Existing customers are subject to ongoing credit evaluations based on payment history and other factors. If it is determined during the arrangement that collectability is not reasonably assured, revenue is recognized on a cash basis of accounting. Certain of the Company’s contracts involve retention amounts which are contingent upon meeting certain performance requirements through the expiration of the contract warranty periods. For contractual arrangements that involve retention, the Company recognizes revenue for these amounts upon the expiration of the warranty period, meeting the performance requirements and when collection of the fee is reasonably assured.
During the year ended March 31, 2011, the Company determined that revenues from certain of its customers in China could not be recorded for shipments made according to the delivery terms, as the fee was not fixed or determinable or collectability was not reasonably assured. For these customers, the Company is utilizing a cash basis of accounting with cash applied first against accounts receivable balances, then costs of shipments (inventory and value added taxes) before recognizing any gross margin. Payments of $0.9 million were received from these customers during the fiscal year ended March 31, 2017, for past shipments and recorded as revenue. There were no payments received for past shipments in the fiscal years ended March 31, 2016 and 2015.
For certain arrangements, such as contracts to perform research and development, prototype development contracts and certain product sales, the Company records revenues using the percentage-of-completion method, measured by the relationship of costs incurred to total estimated contract costs. Percentage-of-completion revenue recognition accounting is predominantly used on certain turnkey power systems installations for electric utilities and long-term prototype development contracts with the U.S. government. The Company follows this method since reasonably dependable estimates of the revenues and costs applicable to various stages of a contract can be made. However, the ability to reliably estimate total costs at completion is challenging, especially on long-term prototype development contracts, and could result in future changes in contract estimates. For contracts where reasonably dependable estimates of the revenues and costs cannot be made, the Company follows the completed-contract method.
The Company enters into sales arrangements that may provide for multiple deliverables to a customer. Sales of certain products may include extended warranty and support or service packages, and at times include performance bonds. As these contracts progress, the Company continually assesses the probability of a payout from the performance bond. Should the Company determine that such a payout is likely; the Company would record a liability. The Company would reduce revenue to the extent a liability is recorded. In addition, the Company enters into licensing arrangements that include training services.
Deliverables are separated into more than one unit of accounting when (1) the delivered element(s) have value to the customer on a stand-alone basis, and (2) delivery of the undelivered element(s) is probable and substantially in the control of the Company. In general, revenues are separated between the different product shipments which have stand-alone value, and the various services to be provided. Revenue for product shipments is recognized in accordance with the Company’s policy for product sales, while revenues for the services are recognized over the period of performance. The Company identifies all goods and/or services that are to be delivered separately under a sales arrangement and allocates revenue to each deliverable based on the element’s fair value as determined by vendor-specific objective evidence (“VSOE”), which is the price charged when that element is sold separately, or third-party evidence (“TPE”). When VSOE and TPE are unavailable, fair value is based on the Company’s
58
best estimate of selling price utilizing a cost plus reasonable margin consistent with how the Company has set pricing historically for similar products and services. When the Company’s estimates are used to determine fair value, management makes its estimates using reasonable and objective evidence to determine the price. The Company reviews VSOE and TPE at least annually. If the Company concludes it is unable to establish fair values for one or more undelivered elements within a multiple-element arrangement using VSOE then the Company uses TPE or the best estimate of the selling price for that unit of accounting, being the price at which the vendor would transact if the unit of accounting were sold by the vendor regularly on a standalone basis.
The Company’s license agreements provide either for the payment of contractually determined paid-up front license fees or milestone based payments in consideration for the grant of rights to manufacture and or sell products using its patented technologies or know-how. Some of these agreements provide for the release of the licensee from intellectual property infringements past and future claims. When the Company can determine that it has no further obligations other than the grant of the license and that the Company has fully transferred the technology know-how, the Company recognizes the revenue under a completed contract model. In other license arrangements, the Company may also agree to provide training services to transfer the technology know-how. In these arrangements, the Company has determined that the licenses have no standalone value to the customer and are not separable from training services as the Company can only fully transfer the technology know-how through the training component. Accordingly, the Company accounts for these arrangements as a single unit of accounting, and recognizes revenue over the period of its performance and milestones that have been achieved. Costs for these arrangements are expensed as incurred.
In December 2015, the Company entered into a set of strategic agreements valued at approximately $210.0 million with Inox, which includes a multi-year supply contract pursuant to which the Company will supply electric control systems to Inox and a license agreement allowing Inox to manufacture a limited number of electrical control systems over the next three to four years. The Company determined this license has standalone value to the customer and can be separated from the supply contract. The license agreement includes customer acceptance criteria to demonstrate that the know-how to manufacture the electrical control systems has been fully transferred. The Company is deferring recognition of the revenue allocable to the license until this acceptance criteria has been met.
In March 2016, the Company entered into a set of agreements to jointly develop an advanced, low cost manufacturing process for second generation high temperature superconductor wire with BASF. Under the joint development agreement, the Company’s manufacturing know-how for its Amperium® superconductor wire and BASF's chemical solution deposition production technology will be combined. As part of the agreements, the Company also entered into a royalty-bearing, non-exclusive license under which the Company agreed to provide BASF a specified portion of its second generation (2G) high temperature superconductor (HTS) wire manufacturing technology. The Company determined that the license rights it provides to BASF have standalone value from the ongoing joint development effort. The Company transferred the license rights to BASF in March 2016 recording $3.0M of license revenue in the fiscal year ended March 31, 2016 as there were no remaining obligations associated with these rights. Any newly developed intellectual property as a result of the joint development will be owned by BASF. Should this development effort be successful, the Company has the right to incorporate this new technology into its manufacturing process on a royalty-free basis. BASF has also agreed to make guaranteed annual payments to the Company through fiscal 2017 and has an option to continue the joint development through fiscal 2018. The Company is recording revenue for the research and development services being provided over the term of the arrangement.
The Company has elected to record taxes collected from customers on a net basis and does not include tax amounts in revenue or costs of revenue.
Customer deposits received in advance of revenue recognition are recorded as deferred revenue until customer acceptance is received. Deferred revenue also represents the amount billed to and/or collected from commercial and government customers on contracts which permit billings to occur in advance of contract performance/revenue recognition.
Product Warranty
Warranty obligations are incurred in connection with the sale of the Company’s products. The Company generally provides a one to three year warranty on its products, commencing upon installation. The costs incurred to provide for these warranty obligations are estimated and recorded as an accrued liability at the time of sale. Future warranty costs are estimated based on historical performance rates and related costs to repair given products. The accounting estimate related to product warranty involves judgment in determining future estimated warranty costs. Should actual performance rates or repair costs differ from estimates, revision to the estimated warranty liability would be required.
Research and Development Costs
Research and development costs are expensed as incurred.
59
Income Taxes
The Company’s provision for income taxes is comprised of a current and a deferred portion. The current income tax provision is calculated as the estimated taxes payable or refundable on tax returns for the current year. The deferred income tax provision is calculated for the estimated future tax effects attributable to temporary differences and carry-forwards using expected tax rates in effect in the years during which the differences are expected to reverse.
Deferred income taxes are recognized for the tax consequences in future years of differences between the tax bases of assets and liabilities and their financial reporting amounts at each fiscal year end based on enacted tax laws and statutory tax rates applicable to the periods in which the differences are expected to affect taxable income. Valuation allowances are established when necessary to reduce net deferred tax assets to the amount expected to be realized. The Company has provided a valuation allowance against its U.S. and certain foreign deferred income tax assets since the Company believes that it is more likely than not that these deferred tax assets are not currently realizable due to uncertainty around profitability in the future.
Accounting for income taxes requires a two-step approach to recognizing and measuring uncertain tax positions. The first step is to evaluate the tax position for recognition by determining if, based on the technical merits, it is more likely than not that the position will be sustained upon audit, including resolution of related appeals or litigation processes, if any. The second step is to measure the tax benefit as the largest amount that is more than 50% likely of being realized upon ultimate settlement. The Company reevaluates these uncertain tax positions on a quarterly basis. This evaluation is based on factors including, but not limited to, changes in facts or circumstances, changes in tax law, effectively settled issues under audit and new audit activity. Any changes in these factors could result in the recognition of a tax benefit or an additional charge to the tax provision. The Company includes interest and penalties related to gross unrecognized tax benefits within the provision for income taxes. See Note 11, “Income Taxes,” for further information regarding its income tax assumptions and expenses.
The Company evaluates its permanent reinvestment assertions with respect to foreign earnings at each reporting period. The Company has not recorded a deferred tax asset for the temporary difference associated with the excess of the tax basis over its book basis in its Austrian and Chinese subsidiaries as the future tax benefit is not expected to reverse in the foreseeable future. The Company has recorded a deferred tax liability as of March 31, 2017 for the undistributed earnings of its remaining foreign subsidiaries for which it can no longer assert are permanently reinvested. The total amount of undistributed earnings available to be repatriated at March 31, 2017 was $2.1 million resulting in the recording of a $0.7 million net deferred federal and state income tax liability. See Note 11, “Income Taxes,” for further information regarding its income tax assumptions and expenses.
Stock-Based Compensation
The Company accounts for stock-based payment transactions using a fair value-based method and recognizes the related expense in the results of operations.
Stock-based compensation is estimated at the grant date based on the fair value of the award and is recognized as expense over the requisite service period of the award. The fair value of restricted stock awards is determined by reference to the fair market value of the Company’s common stock on the date of grant. The Company uses the Black-Scholes option pricing model to estimate the fair value of awards with service and performance conditions. For awards with service conditions only, the Company recognizes compensation cost on a straight-line basis over the requisite service/vesting period. For awards with performance conditions, accruals of compensation cost are made based on the probable outcome of the performance conditions. The cumulative effect of changes in the probability outcomes are recorded in the period in which the changes occur.
Determining the appropriate fair value model and related assumptions requires judgment, including estimating stock price volatilities of the Company’s common stock and expected terms. The expected volatility rates are estimated based on historical and implied volatilities of the Company’s common stock. The expected term represents the average time that the options that vest are expected to be outstanding based on the vesting provisions and the Company’s historical exercise, cancellation and expiration patterns.
The Company estimates pre-vesting forfeitures when recognizing compensation expense based on historical and forward-looking factors. Changes in estimated forfeiture rates and differences between estimated forfeiture rates and actual experience may result in significant, unanticipated increases or decreases in stock-based compensation expense from period to period. The termination of employment of certain employees who hold large numbers of stock-based awards may also have a significant, unanticipated impact on forfeiture experience and, therefore, on stock-based compensation expense. The Company will update these assumptions on at least an annual basis and on an interim basis if significant changes to the assumptions are warranted.
The Company's adoption of ASU 2016-09 Compensation - Stock Compensation (Topic 718): Improvements to Employee Share-Based Payment Accounting also resulted in the prospective classification of excess tax benefits as cash flows from operating
60
activities in the same manner as other cash flows related to income taxes within the consolidated statements of cash flows. Based on the prospective method of adoption chosen, the classification of excess tax benefits within the consolidated statements of cash flows for prior periods presented has not been adjusted to reflect the change.
Computation of Net Loss per Common Share
Basic net loss per share (“EPS”) is computed by dividing net loss by the weighted-average number of common shares outstanding for the period. Diluted EPS is computed by dividing the net loss by the weighted-average number of common shares and dilutive common equivalent shares outstanding during the period, calculated using the treasury stock method. Common equivalent shares include the effect of restricted stock, exercise of stock options and warrants and contingently issuable shares. For the fiscal years ended March 31, 2017, 2016, and 2015, common equivalent shares of 1,538,418, 1,552,959, and 1,567,352, respectively, were not included in the calculation of diluted EPS as they were considered antidilutive. The following table reconciles the numerators and denominators of the EPS calculation for the fiscal years ended March 31, 2017, 2016, and 2015 (in thousands except per share amounts):
Fiscal year ended March 31, | |||||||||||
2017 | 2016 | 2015 | |||||||||
Numerator: | |||||||||||
Net loss | $ | (27,373 | ) | $ | (23,139 | ) | $ | (48,656 | ) | ||
Denominator: | |||||||||||
Weighted-average shares of common stock outstanding | 14,231 | 13,295 | 8,559 | ||||||||
Weighted-average shares subject to repurchase | (427 | ) | (117 | ) | (82 | ) | |||||
Shares used in per-share calculation ― basic | 13,804 | 13,178 | 8,477 | ||||||||
Shares used in per-share calculation ― diluted | 13,804 | 13,178 | 8,477 | ||||||||
Net loss per share ― basic | $ | (1.98 | ) | $ | (1.76 | ) | $ | (5.74 | ) | ||
Net loss per share ― diluted | $ | (1.98 | ) | $ | (1.76 | ) | $ | (5.74 | ) | ||
Foreign Currency Translation
The functional currency of all the Company’s foreign subsidiaries is the U.S. dollar, except for AMSC Austria, for which the local currency (Euro) is the functional currency, and AMSC China, for which the local currency (Renminbi) is the functional currency. The assets and liabilities of AMSC Austria and AMSC China are translated into U.S. dollars at the exchange rate in effect at the balance sheet date and income and expense items are translated at average rates for the period. Cumulative translation adjustments are excluded from net loss and shown as a separate component of stockholders’ equity. Net foreign currency gains (losses) are included in net loss and were $0.1 million, $(2.3) million, and $2.8 million for the fiscal years ended March 31, 2017, 2016 and 2015, respectively. The Company has no restrictions on the foreign exchange activities of its foreign subsidiaries, including the payment of dividends and other distributions.
Risks and Uncertainties
The preparation of financial statements in conformity with GAAP requires management to make estimates and assumptions that affect the reported amounts of assets and liabilities and disclosures of contingent assets and liabilities at the date of the financial statements and the reported amounts of revenues and expenses during the reporting period. Actual results could materially differ from those estimates and would impact future results of operations and cash flows.
The Company invests its available cash in high credit, quality financial instruments and invests primarily in investment-grade marketable securities, including, but not limited to, government obligations, money market funds and corporate debt instruments.
Several of the Company’s government contracts are being funded incrementally, and as such, are subject to the future authorization, appropriation, and availability of government funding. The Company has a history of successfully obtaining financing under incrementally-funded contracts with the U.S. government and it expects to continue to receive additional contract modifications in the year ending March 31, 2018 and beyond as incremental funding is authorized and appropriated by the government.
61
Contingencies
From time to time, the Company may be involved in legal and administrative proceedings and claims of various types. The Company records a liability in its consolidated financial statements for these matters when a loss is known or considered probable and the amount can be reasonably estimated. Management reviews these estimates in each accounting period as additional information is known and adjusts the loss provision when appropriate. If the loss is not probable or cannot be reasonably estimated, a liability is not recorded in the consolidated financial statements. If, with respect to a matter, it is not both probable to result in liability and the amount of loss cannot be reasonably estimated, an estimate of possible loss or range of loss is disclosed unless such an estimate cannot be made. The Company does not recognize gain contingencies until they are realized. Legal costs incurred in connection with loss contingencies are expensed as incurred. See Note 13, “Commitments and Contingencies,” for further information regarding the Company’s pending litigation.
Disclosure of Fair Value of Financial Instruments
The Company’s financial instruments consist principally of cash and cash equivalents, accounts receivable, accounts payable, accrued expenses, warrants to purchase shares of common stock, derivatives, and a senior secured term loan. The carrying amounts of cash and cash equivalents, accounts receivable, short-term debt, accounts payable, and accrued expenses due to their short nature approximate fair value at March 31, 2017 and 2016. The estimated fair values have been determined through information obtained from market sources and management estimates. The fair value for the warrant arrangements has been estimated by management based on the terms that it believes it could obtain in the current market for debt with the same terms and similar maturities. The Company classifies the estimates used to fair value these instruments as Level 3 inputs See Note 3, “Fair Value Measurements” for a full discussion on fair value measurements.
3. Fair Value Measurements
A valuation hierarchy for disclosure of the inputs to valuation used to measure fair value has been established. This hierarchy prioritizes the inputs into three broad levels as follows:
Level 1 | - | Inputs are unadjusted quoted prices in active markets for identical assets or liabilities that the Company has the ability to access at the measurement date. | |
Level 2 | - | Inputs include quoted prices for similar assets and liabilities in active markets, quoted prices for identical or similar assets or liabilities in markets that are not active, inputs other than quoted prices that are observable for the asset or liability, and inputs that are derived principally from or corroborated by observable market data by correlation or other means (market corroborated inputs). | |
Level 3 | - | Unobservable inputs that reflect the Company’s assumptions that market participants would use in pricing the asset or liability. The Company develops these inputs based on the best information available, including its own data. | |
The Company provides a gross presentation of activity within Level 3 measurement roll-forward and details of transfers in and out of Level 1 and 2 measurements. A change in the hierarchy of an investment from its current level is reflected in the period during which the pricing methodology of such investment changes. Disclosure of the transfer of securities from Level 1 to Level 2 or Level 3 is made in the event that the related security is significant to total cash and investments. The Company did not have any transfers of assets and liabilities from Level 1 and Level 2 to Level 3 of the fair value measurement hierarchy during the year ended March 31, 2017.
A financial asset’s or liability’s classification within the hierarchy is determined based on the lowest level input that is significant to the fair value measurement.
The following table provides the assets and liabilities carried at fair value on a recurring basis, measured as of March 31, 2017 and 2016 (in thousands):
62
Total Carrying Value | Quoted Prices in Active Markets (Level 1) | Significant Other Observable Inputs (Level 2) | Significant Unobservable Inputs (Level 3) | ||||||||||||
March 31, 2017: | |||||||||||||||
Assets: | |||||||||||||||
Cash equivalents | $ | 14,105 | $ | 14,105 | $ | — | $ | — | |||||||
Derivative liabilities: | |||||||||||||||
Warrants | $ | 1,923 | $ | — | $ | — | $ | 1,923 | |||||||
Total Carrying Value | Quoted Prices in Active Markets (Level 1) | Significant Other Observable Inputs (Level 2) | Significant Unobservable Inputs (Level 3) | ||||||||||||
March 31, 2016: | |||||||||||||||
Assets: | |||||||||||||||
Cash equivalents | $ | 16,040 | $ | 16,040 | $ | — | $ | — | |||||||
Derivative liabilities: | |||||||||||||||
Warrants | $ | 3,227 | $ | — | $ | — | $ | 3,227 | |||||||
The table below reflects the activity for the Company’s major classes of liabilities measured at fair value on a recurring basis (in thousands):
Warrants | |||
April 1, 2016 | $ | 3,227 | |
Mark to market adjustment | (1,304 | ) | |
Balance at March 31, 2017 | $ | 1,923 | |
Warrants | |||
April 1, 2015 | $ | 2,999 | |
Mark to market adjustment | 228 | ||
Balance at March 31, 2016 | $ | 3,227 | |
Valuation Techniques
Cash Equivalents
Cash equivalents consist of highly liquid instruments with maturities of three months or less that are regarded as high quality, low risk investments and are measured using such inputs as quoted prices, and are classified within Level 1 of the valuation hierarchy. Cash equivalents consist principally of certificates of deposits and money market accounts.
Warrants
Warrants were issued in conjunction with a Securities Purchase Agreement (the “Purchase Agreement”) with Capital Ventures International (“CVI”), an equity offering to Hudson Bay Capital in November 2014, and a Loan and Security Agreement with Hercules Technology Growth Capital, Inc. (“Hercules”). See Note 9, “Debt,” and Note 10 “Warrants and Derivative Liabilities,” for additional information. These warrants are subject to revaluation at each balance sheet date, and any change in fair value will be recorded as a change in fair value in derivatives and warrants until the earlier of their exercise or expiration.
The Company relies on various assumptions in a lattice model to determine the fair value of warrants. The Company has valued the warrants within Level 3 of the valuation hierarchy. See Note 10, “Warrants and Derivative Liabilities,” for a discussion of the warrants and the valuation assumptions used.
4. Accounts Receivable
Accounts receivable at March 31, 2017 and March 31, 2016 consisted of the following (in thousands):
63
March 31, 2017 | March 31, 2016 | ||||||
Accounts receivable (billed) | $ | 7,436 | $ | 18,089 | |||
Accounts receivable (unbilled) | 574 | 1,229 | |||||
Less: Allowance for doubtful accounts | (54 | ) | (54 | ) | |||
Accounts receivable, net | $ | 7,956 | $ | 19,264 | |||
5. Inventory
Inventory at March 31, 2017 and March 31, 2016 consisted of the following (in thousands):
March 31, 2017 | March 31, 2016 | ||||||
Raw materials | $ | 4,263 | $ | 9,665 | |||
Work-in-process | 426 | 3,411 | |||||
Finished goods | 8,016 | 3,215 | |||||
Deferred program costs | 4,757 | 2,221 | |||||
Net inventory | $ | 17,462 | $ | 18,512 | |||
The Company recorded inventory write-downs of $1.6 million and $2.7 million for the fiscal years ended March 31, 2017 and 2016, respectively. These write downs were based on evaluating its inventory on hand for excess quantities and obsolescence.
Deferred program costs as of March 31, 2017 and March 31, 2016 primarily represent costs incurred on programs accounted for under contract accounting where the Company needs to complete development milestones before revenue and costs will be recognized.
6. Property, Plant and Equipment
The cost and accumulated depreciation of property and equipment at March 31, 2017 and 2016 are as follows (in thousands):
March 31, 2017 | March 31, 2016 | ||||||
Land | $ | 3,643 | $ | 3,643 | |||
Construction in progress - equipment | 601 | 601 | |||||
Buildings | 34,549 | 34,549 | |||||
Equipment and software | 73,445 | 73,659 | |||||
Furniture and fixtures | 1,201 | 1,215 | |||||
Leasehold improvements | 2,442 | 3,600 | |||||
Property, plant and equipment, gross | 115,881 | 117,267 | |||||
Less accumulated depreciation | (72,443 | ) | (67,489 | ) | |||
Property, plant and equipment, net | $ | 43,438 | $ | 49,778 | |||
Depreciation expense was $7.0 million, $7.4 million, and $9.0 million, for the fiscal years ended March 31, 2017, 2016, and 2015, respectively.
7. Intangible Assets
Intangible assets at March 31, 2017 and 2016 consisted of the following (in thousands):
2017 | 2016 | ||||||||||||||||||||||||
Gross Amount | Accumulated Amortization | Net Book Value | Gross Amount | Accumulated Amortization | Net Book Value | Estimated Useful Life | |||||||||||||||||||
Licenses | $ | 4,422 | $ | (4,134 | ) | $ | 288 | $ | 4,422 | $ | (3,739 | ) | $ | 683 | 7 | ||||||||||
Core technology and know-how | 4,806 | (4,793 | ) | 13 | 5,010 | (4,839 | ) | 171 | 5-10 | ||||||||||||||||
Intangible assets | $ | 9,228 | $ | (8,927 | ) | $ | 301 | $ | 9,432 | $ | (8,578 | ) | $ | 854 | |||||||||||
64
The Company recorded intangible amortization expense of $0.6 million, $0.6 million, and $0.6 million for the fiscal years ended March 31, 2017, 2016, and 2015, respectively.
Expected future amortization expense related to intangible assets is as follows (in thousands):
Fiscal years ending March 31, | Total | ||
2018 | 301 | ||
Total | $ | 301 | |
The geographic composition of intangible assets is as follows (in thousands):
March 31, | |||||||
2017 | 2016 | ||||||
Intangible assets by geography: | |||||||
U.S. | $ | 301 | $ | 854 | |||
Total | $ | 301 | $ | 854 | |||
The business segment composition of intangible assets is as follows (in thousands):
March 31, | |||||||
2017 | 2016 | ||||||
Intangible assets by business segments: | |||||||
Grid | 301 | 854 | |||||
Total | $ | 301 | $ | 854 | |||
8. Accounts Payable and Accrued Expenses
Accounts payable and accrued expenses at March 31, 2017 and March 31, 2016 consisted of the following (in thousands):
March 31, 2017 | March 31, 2016 | ||||||
Accounts payable | $ | 3,207 | $ | 5,837 | |||
Accrued inventories in-transit | 313 | 1,908 | |||||
Accrued other miscellaneous expenses | 2,240 | 3,003 | |||||
Accrued compensation | 5,042 | 7,526 | |||||
Income taxes payable | 1,344 | 1,281 | |||||
Accrued warranty | 2,344 | 3,601 | |||||
Total | $ | 14,490 | $ | 23,156 | |||
The Company generally provides a one to three year warranty on its products, commencing upon installation. A provision is recorded upon revenue recognition to cost of revenues for estimated warranty expense based on historical experience.
Product warranty activity was as follows (in thousands):
Fiscal Years Ended March 31, | |||||||
2017 | 2016 | ||||||
Balance at beginning of period | $ | 3,601 | $ | 3,934 | |||
Change in accruals for warranties during the period | 1,219 | 1,865 | |||||
Settlements during the period | (2,476 | ) | (2,198 | ) | |||
Balance at end of period | $ | 2,344 | $ | 3,601 | |||
9. Debt
Senior Secured Term Loans
65
On November 15, 2013, the Company amended its existing Loan and Security Agreement with Hercules, and entered into a term loan (the “Term Loan B”), borrowing $10.0 million. After closing fees and expenses, the net proceeds to the Company for the Term Loan B were $9.8 million. The Term Loan B bore an interest rate of 11% plus the percentage, if any, by which the prime rate as reported by the Wall Street Journal exceeds 3.75%. The Company repaid the Term Loan B in equal monthly installments ending on November 1, 2016, when the loan was repaid in full. The Company paid an end of term fee of $0.5 million upon the maturity of the Term Loan B, which had been accrued at inception of the loan with a corresponding amount recorded into the debt discount. In addition, the Company incurred $0.2 million of legal and origination costs at the inception of the loan, which have been recorded as a debt discount.
On December 19, 2014, the Company entered into a second amendment with Hercules (the “Hercules Second Amendment”) and entered into a new term loan, borrowing an additional $1.5 million (the “Term Loan C”). After closing fees and expenses, the net proceeds to the Company for the Term Loan C were $1.4 million. The Term Loan C is also referred to as the “Term Loan”. The Term Loan C also bears the same interest rate as the Term Loan B, which increased to 11.25% effective March 16, 2017. The Company will make interest only payments until maturity on June 1, 2017, when the loan is scheduled to be repaid in its entirety. The maturity date of the Term Loan C was extended from March 1, 2017 to June 1, 2017 due to the Company’s April 2015 equity offering which raised more than $10 million in new capital before December 31, 2015. The Company will pay an end of term fee of approximately $0.1 million upon earlier of maturity or prepayment of the Term Loan C. The Company has accrued the end of term fee and recorded a corresponding amount in the debt discount. The Term Loan C includes a mandatory prepayment feature that allows Hercules the right to use any of the Company's net proceeds from specified asset dispositions greater than $1.0 million in a calendar year to pay off any outstanding accrued interest and principle balances on the Term Loan C. The Company determined the fair value to be de-minimus for this feature. In addition, the Company incurred approximately $0.1 million of legal and origination costs in the three months ended December 31, 2014, which have been recorded as a debt discount.
Hercules received warrants to purchase 13,927 shares of common stock (the “First Warrant”) and 25,641 shares of common stock (the “Second Warrant”) in conjunction with a prior term loan which has been repaid in full and the Term Loan B. Due to certain adjustment provisions within the warrants, they qualified for liability accounting and the fair value of the warrants $0.4 million and $0.2 million, respectively, was recorded upon issuance to debt discount and a warrant liability. In conjunction with the Hercules Second Amendment, the First Warrant and Second Warrant were canceled and replaced with the issuance of a new warrant (the “Hercules Warrant”) to purchase 58,823 shares of common stock at an exercise price of $11.00 per share, subject to adjustment. The Warrant expires on June 30, 2020. See Note 10, “Warrants and Derivative Liabilities”, for a discussion on the Warrant and the valuation assumptions used.
Under Term Loan B, the total debt discount including the Warrant, end of term fee and legal and origination costs of $1.0 million was amortized into interest expense over the term of the Term Loan B using the effective interest method. During the years ended March 31, 2017 and 2016, the Company recorded non-cash interest expense for amortization of the debt discount related to the Term Loan B of less than $0.1 million and $0.2 million, respectively. Under Term Loan C, the total debt discount, including the Warrant, end of term fee and legal and origination costs of $0.3 million is being amortized into interest expense over the term of the Term Loan C using the effective interest method. During each of the fiscal years ended March 31, 2017 and 2016, the Company recorded non-cash interest expense for amortization of the debt discount related to the Term Loan C of $0.1 million.
The Term Loan is secured by substantially all of the Company’s existing and future assets, including a mortgage on real property owned by the Company’s wholly-owned subsidiary, ASC Devens LLC, and located at 64 Jackson Road, Devens, Massachusetts. The Term Loan contains certain covenants that restrict the Company’s ability to, among other things, incur or assume certain debt, merge or consolidate, materially change the nature of the Company’s business, make certain investments, acquire or dispose of certain assets, make guarantees or grant liens on its assets, make certain loans, advances or investments, declare dividends or make distributions or enter into transactions with affiliates. In addition, there is a covenant that requires the Company to maintain a minimum unrestricted cash balance (the “Minimum Threshold”) in the United States. As a result of the Company’s April 2015 equity offering, the Minimum Threshold was reduced to the lesser of $2.0 million or the aggregate outstanding principal balance of the then outstanding term loans. As of March 31, 2017, the Minimum Threshold was $1.5 million. The events of default under the Term Loan include, but are not limited to, failure to pay amounts due, breaches of covenants, bankruptcy events, cross defaults under other material indebtedness and the occurrence of a material adverse effect and/or change in control. In the case of a continuing event of default, Hercules may, among other remedies, declare due all unpaid principal amounts outstanding and any accrued but unpaid interest and foreclose on all collateral granted to Hercules as security under the Term Loan.
Interest expense for the fiscal years ended March 31, 2017, 2016 and 2015, was $0.4 million, $1.0 million and $1.7 million, respectively, which included $0.2 million, $0.4 million and $0.5 million, respectively, of non-cash interest expense related to the amortization of the debt discount and payment of the Note in Company common stock at a discount.
66
Although the Company believes that it is in compliance with the covenants and restrictions under the Term Loan as of March 31, 2017, there can be no assurance that the Company will remain in compliance until the maturity of the Term Loan.
10. Warrants and Derivative Liabilities
Senior Convertible Note Warrant
On April 4, 2012, the Company entered into the Purchase Agreement with CVI. The Purchase Agreement included a warrant to purchase 309,406 shares of the Company’s common stock (the “Original Warrant”). Pursuant to an exchange in October 2013, the Original warrant was exchanged for a new warrant (the “Exchanged Warrant”). The Exchanged Warrant is exercisable at any time on or after the date that is six months after the issuance of the Original Warrant and entitles CVI to purchase shares of the Company’s common stock for a period of five years from the date the Original Warrant becomes exercisable at an exercise price equal to $15.70 per share, after giving effect to certain price-based and other anti-dilution adjustments including the sale of common stock under the ATM entered into in January 2017. See Note 12, "Stockholders Equity" for further discussion. The Exchanged Warrant may not be exercised if, after giving effect to the conversion, CVI together with its affiliates, would beneficially own in excess of 4.99% of the Company’s common stock. This percentage may be raised to any other percentage not in excess of 9.99% at the option of CVI, upon at least 61-days prior notice to the Company, or lowered to any other percentage, at the option of CVI, at any time.
The Company calculated the fair value of the warrant, utilizing an integrated lattice model. The lattice model is an option pricing model that involves the construction of a binomial tree to show the different paths that the underlying asset may take over the option’s life. A lattice model can take into account expected changes in various parameters such as volatility over the life of the options, providing more accurate estimates of option prices than the Black-Scholes model. See Note 3, “Fair Value Measurements” for further discussion
The Company accounts for the Exchanged Warrant as a liability due to certain adjustment provisions within the warrant, which requires that it be recorded at fair value. The Exchanged Warrant is subject to revaluation at each balance sheet date and any change in fair value is recorded as a change in fair value of derivatives and warrants until the earlier of its expiration or its exercise at which time the warrant liability will be reclassified to equity.
Following is a summary of the key assumptions used to calculate the fair value of the Exchanged Warrant:
67
March 31, | December 31, | September 30, | June 30, | |||||||
Fiscal Year 16 | 2017 | 2016 | 2016 | 2016 | ||||||
Risk-free interest rate | 0.91% | 0.56% | 0.59% | 0.48% | ||||||
Expected annual dividend yield | — | — | — | — | ||||||
Expected volatility | 44.12% | 58.04% | 70.50% | 76.30% | ||||||
Term (years) | 0.51 | 0.76 | 1.01 | 1.26 | ||||||
Fair value | $— | $0.1 million | $0.2 million | $0.4 million | ||||||
March 31, | December 31, | September 30, | June 30, | |||||||
Fiscal Year 15 | 2016 | 2015 | 2015 | 2015 | ||||||
Risk-free interest rate | 0.66% | 0.96% | 0.64% | 0.74% | ||||||
Expected annual dividend yield | — | — | — | — | ||||||
Expected volatility | 76.76% | 76.68% | 73.39% | 71.61% | ||||||
Term (years) | 1.51 | 1.76 | 2.01 | 2.26 | ||||||
Fair value | $0.4 million | $0.3 million | $0.1 million | $0.2 million | ||||||
March 31, | December 31, | September 30, | June 30, | March 31, | ||||||
Fiscal Year 14 | 2015 | 2014 | 2014 | 2014 | 2014 | |||||
Risk-free interest rate | 0.73% | 1.00% | 1.07% | 0.98% | 1.11% | |||||
Expected annual dividend yield | — | — | — | — | — | |||||
Expected volatility | 70.42% | 72.38% | 76.20% | 83.50% | 80.99% | |||||
Term (years) | 2.51 | 2.76 | 3.01 | 3.26 | 3.51 | |||||
Fair value | $0.3 million | $0.5 million | $1.5 million | $2.3 million | $2.2 million | |||||
The Company recorded a net gain, resulting from the decrease in the fair value of the Exchanged Warrant, of $0.4 million in the fiscal year ended March 31, 2017. The Company recorded a net loss, resulting from an increase in the fair value of the Exchanged Warrant, of $0.1 million, and a net gain, of $1.9 million to change in fair value of derivatives and warrants in the fiscal years ended March 31, 2016 and 2015, respectively.
Hercules Warrant
On December 19, 2014, the Company entered into the Hercules Second Amendment, (see Note 10, “Debt” for additional information). In conjunction with the agreement, the Company issued the Hercules Warrant to purchase 58,823 shares of the Company’s common stock. The Hercules Warrant is exercisable at any time after its issuance at an exercise price of $9.38 per share, subject to certain price-based and other anti-dilution adjustments, including sales of common stock under the ATM entered into in January 2017, and expires on June 30, 2020. See Note 12, "Stockholders Equity" for further discussion. The Company accounts for the Hercules Warrant as a liability due to certain provisions within the warrant. The Hercules Warrant is subject to revaluation at each balance sheet date and any change in fair value is recorded as a change in fair value of derivatives and warrants until the earlier of its expiration or its exercise, at which time the warrant liability will be reclassified to equity.
Following is a summary of the key assumptions used to calculate the fair value of the Hercules Warrant:
68
March 31, | December 31, | September 30, | June 30, | ||||
Fiscal Year 16 | 2017 | 2016 | 2016 | 2016 | |||
Risk-free interest rate | 1.55% | 1.57% | 0.97% | 0.86% | |||
Expected annual dividend yield | — | — | — | — | |||
Expected volatility | 66.51% | 67.28% | 67.98% | 68.34% | |||
Term (years) | 3.25 | 3.50 | 3.75 | 4.00 | |||
Fair value | $0.2 million | $0.2 million | $0.2 million | $0.3 million | |||
March 31, | December 31, | September 30, | June 30, | ||||
Fiscal Year 15 | 2016 | 2015 | 2015 | 2015 | |||
Risk-free interest rate | 1.08% | 1.65% | 1.31% | 1.63% | |||
Expected annual dividend yield | — | — | — | — | |||
Expected volatility | 70.25% | 73.57% | 75.32% | 72.57% | |||
Term (years) | 4.25 | 4.50 | 4.75 | 5.00 | |||
Fair value | $0.2 million | $0.2 million | $0.1 million | $0.2 million | |||
New Issuance | |||||||
March 31, | December 31, | December 19, | |||||
Fiscal Year 14 | 2015 | 2014 | 2014 | ||||
Risk-free interest rate | 1.41% | 1.73% | 1.74% | ||||
Expected annual dividend yield | — | — | — | ||||
Expected volatility | 74.60% | 77.43% | 70.26% | ||||
Term (years) | 5.25 | 5.50 | 5.53 | ||||
Fair value | $0.2 million | $0.2 million | $0.2 million | ||||
The Company recorded no significant change, in the fair value of the Hercules Warrant in the fiscal years ended March 31, 2017, 2016 and 2015, respectively.
November 2014 Warrant
On November 13, 2014, the Company completed an offering of approximately 909,090 units of the Company’s common stock with Hudson Bay Capital. Each unit consisted of one share of the Company’s common stock and 0.9 of a warrant to purchase one share of common stock, or a warrant to purchase in the aggregate 818,181 shares (the “November 2014 Warrant”). The November 2014 Warrant is exercisable at any time, at an exercise price equal to $9.33 per share, subject to certain price-based and other anti-dilution adjustments, including sales of common stock under the ATM entered into in January 2017, and expires on November 13, 2019. See Note 12, "Stockholders Equity" for further discussion. The Company accounts for the November 2014 Warrant as a liability due to certain provisions within the warrant. The November 2014 Warrant is subject to revaluation at each balance sheet date and any change in fair value is recorded as a change in fair value of derivatives and warrants until the earlier of its expiration or its exercise, at which time the warrant liability will be reclassified to equity.
Following is a summary of the key assumptions used to calculate the fair value of the November 2014 Warrant:
69
March 31, | December 31, | September 30, | June 30, | ||||
Fiscal Year 16 | 2017 | 2016 | 2016 | 2016 | |||
Risk-free interest rate | 1.41% | 1.43% | 0.93% | 0.77% | |||
Expected annual dividend yield | — | — | — | — | |||
Expected volatility | 66.53% | 69.31% | 68.96% | 70.01% | |||
Term (years) | 2.62 | 2.87 | 3.12 | 3.37 | |||
Fair value | $1.8 million | $2.3 million | $2.3 million | $3.2 million | |||
March 31, | December 31, | September 30, | June 30, | ||||
Fiscal Year 15 | 2016 | 2015 | 2015 | 2015 | |||
Risk-free interest rate | 0.98% | 1.51% | 1.17% | 1.44% | |||
Expected annual dividend yield | — | — | — | — | |||
Expected volatility | 69.88% | 70.02% | 73.02% | 74.18% | |||
Term (years) | 3.62 | 3.87 | 4.12 | 4.37 | |||
Fair value | $2.6 million | $2.1 million | $1.3 million | $1.8 million | |||
New Issuance | |||||||
March 31, | December 31, | November 13, | |||||
Fiscal Year 14 | 2015 | 2014 | 2014 | ||||
Risk-free interest rate | 1.28% | 1.61% | 1.64% | ||||
Expected annual dividend yield | — | — | — | ||||
Expected volatility | 75.96% | 78.00% | 72.86% | ||||
Term (years) | 4.62 | 4.87 | 5.00 | ||||
Fair value | $2.5 million | $3.2 million | $4.3 million | ||||
The Company recorded a net gain, resulting from a decrease in the fair value of the November 2014 Warrant, of $0.8 million, a net loss, resulting from an increase in the fair value of the November 2014 Warrant, of $0.1 million, and a net gain, of $1.8 million to change in fair value of derivatives and warrants in the fiscal years ended March 31, 2017, 2016 and 2015, respectively.
The Company prepared its estimates for the assumptions used to determine the fair value of the warrants issued in conjunction with both the Exchanged Note, the Term Loans, and the November 2014 Warrant utilizing the respective terms of the warrants with similar inputs, as described above.
11. Income Taxes
Loss before income taxes for the fiscal years ended March 31, 2017, 2016, and 2015 are provided in the table as follows (in thousands):
Fiscal years ended March 31, | |||||||||||
2017 | 2016 | 2015 | |||||||||
Loss before income tax expense: | |||||||||||
U.S. | $ | (31,664 | ) | $ | (29,436 | ) | $ | (40,277 | ) | ||
Foreign | 5,433 | 8,688 | (8,563 | ) | |||||||
Total | $ | (26,231 | ) | $ | (20,748 | ) | $ | (48,840 | ) | ||
The components of income tax expense (benefit) attributable to continuing operations consist of the following (in thousands):
70
Fiscal years ended March 31, | |||||||||||
2017 | 2016 | 2015 | |||||||||
Current | |||||||||||
Federal | $ | 765 | $ | 459 | $ | 47 | |||||
State | — | — | — | ||||||||
Foreign | 619 | 1,950 | (274 | ) | |||||||
Total current | 1,384 | 2,409 | (227 | ) | |||||||
Deferred | |||||||||||
Federal | 60 | (18 | ) | 43 | |||||||
State | — | — | — | ||||||||
Foreign | (302 | ) | — | — | |||||||
Total deferred | (242 | ) | (18 | ) | 43 | ||||||
Income tax (benefit) expense | $ | 1,142 | $ | 2,391 | $ | (184 | ) | ||||
The reconciliation between the statutory federal income tax rate and the Company’s effective income tax rate is shown below.
Fiscal years ended March 31, | ||||||||
2017 | 2016 | 2015 | ||||||
Statutory federal income tax rate | (34 | )% | (34 | )% | (34 | )% | ||
State income taxes, net of federal benefit | — | 1 | 2 | |||||
Deemed dividend and dividends paid | 20 | 5 | 1 | |||||
Foreign income tax rate differential | (1 | ) | 5 | 6 | ||||
Stock options | — | 1 | 1 | |||||
Nondeductible expenses | — | — | 1 | |||||
Research and development tax credit | (2 | ) | (5 | ) | — | |||
Deferred warrants | (2 | ) | — | (3 | ) | |||
Reversal of uncertain tax benefits | — | — | (6 | ) | ||||
True-up of NOLs | (40 | ) | 19 | — | ||||
Settlement of intercompany balances | — | (9 | ) | — | ||||
Nondeductible foreign currency exchange remeasurement loss | — | 10 | — | |||||
Valuation allowance | 63 | 18 | 32 | |||||
Effective income tax rate | 4 | % | 11 | % | — | % | ||
71
The following is a summary of the principal components of the Company’s deferred tax assets and liabilities (in thousands):
March 31, 2017 | March 31, 2016 | ||||||
Deferred tax assets: | |||||||
Net operating loss carryforwards | $ | 297,961 | $ | 281,098 | |||
Research and development and other tax credit carryforwards | 11,965 | 11,878 | |||||
Accruals and reserves | 26,222 | 28,088 | |||||
Fixed assets and intangible assets | 2,250 | 2,393 | |||||
Other | 12,454 | 14,494 | |||||
Gross deferred tax assets | 350,852 | 337,951 | |||||
Valuation allowance | (315,092 | ) | (301,393 | ) | |||
Total deferred tax assets | 35,760 | 36,558 | |||||
Deferred tax liabilities: | |||||||
Intercompany debt | (25,841 | ) | (27,117 | ) | |||
Other | (9,637 | ) | (9,408 | ) | |||
Total deferred tax liabilities | (35,478 | ) | (36,525 | ) | |||
Net deferred tax asset | $ | 282 | $ | 33 | |||
In March 2016, the FASB issued Accounting Standards Update No. 2016-09, Compensation- Stock Compensation: Improvements to Employee Share-Based Payment Accounting. The guidance simplifies several aspects of the accounting for employee share-based payment transactions, including the accounting for income taxes, forfeitures, and statutory tax withholding requirements, as well as classification of excess tax benefits in the consolidated statements of cash flows. This amendment is effective for annual periods beginning after December 15, 2016 and early adoption is permitted. The Company elected to early adopt the new guidance in the fourth quarter of fiscal 2016 which requires them to reflect any adjustments as of April 1, 2016, the beginning of the annual period that includes the interim period of adoption. The Company has not changed the way it accounts for forfeitures. Prior to April 1, 2016, the Company recognized the excess tax benefits of stock-based compensation expense as additional paid-in capital ("APIC"), and tax deficiencies of stock-based compensation expense in the income tax provision or as APIC to the extent that there were sufficient recognized excess tax benefits previously recognized. As a result of the prior guidance that the excess tax benefits reduce taxes payable prior to being recognized as an increase in capital, the Company had not recognized certain deferred tax assets (all tax attributes such as loss ) that could be attributed to tax deductions related to equity compensation in excess of compensation recognized for financial reporting. Effective April 1, 2016, the Company early adopted a change in accounting policy in accordance with ASU 2016-09 to account for excess tax benefits and tax deficiencies as income tax expense or benefit, treated as discrete items in the reporting period in which they occur, and to recognize previously unrecognized deferred tax assets that arose directly from (or the use of which was postponed by) tax deductions related to equity compensation in excess of compensation recognized for financial reporting. No prior periods were restated as a result of this change in accounting policy as the Company previously maintained a valuation allowance against its deferred tax assets that could be attributed to equity compensation in excess of compensation recognized for financial reporting. As a result of the early adoption of ASU 2016-09, the Company recognized an increase to their deferred tax asset of $18.0M offset by an increase in the Company’s valuation allowance. There was no impact to the Company’s financial statements as a result of the adoption
The Company has provided a full valuation allowance against its net deferred income tax assets since it is more likely than not that its deferred tax assets are not currently realizable due to the net operating losses incurred by the Company since its inception and net operating losses forecasted in the future. During the year ended March 31, 2017, the Company’s valuation allowance increased by approximately $13.7M, primarily due to the increase in the Company’s net operating loss. The Company has recorded a deferred tax asset of approximately $13.0 million reflecting the benefit of deductions from the exercise of stock options. This deferred tax asset has been fully reserved since it is more likely than not that the tax benefit from the exercise of stock options will not be realized.
At March 31, 2017, the Company had aggregate net operating loss carryforwards in the U.S. for federal and state income tax purposes of approximately $798.0 million and $143.0 million, respectively, which expire in the years ending March 31, 2018 through 2037. Included in the U.S. net operating loss is $3.7 million of acquired losses from Power Quality Systems, Inc. Research and development and other tax credit carryforwards amounting to approximately $9.5 million and $3.2 million are available to offset federal and state income taxes, respectively, and will expire in the years ending March 31, 2018 through 2037.
72
At March 31, 2017, the Company had aggregate net operating loss carryforwards for its Austrian subsidiary, AMSC Austria GmbH, of approximately $37.1 million which can be carried forward indefinitely subject to certain annual limitations. At March 31, 2017, the Company had aggregate net operating loss carryforwards for its Chinese operation of approximately $17.9 million, which can be carried forward for five years and begin to expire December 31, 2017. Also the Company had immaterial amounts of current and net operating loss carryforwards for its other foreign operations which can be carried forward indefinitely.
Section 382 of the U.S. Internal Revenue Code of 1986, as amended (the “IRC”), provides limits on the extent to which a corporation that has undergone an ownership change (as defined) can utilize any NOL and general business tax credit carryforwards it may have. The Company conducted a study as a result of the April 2015 equity offering to determine whether Section 382 could limit the use of its carryforwards in this manner. After completing this study, the Company has concluded that the limitation will not have a material impact on its ability to utilize its net operating loss carryforwards. If there were material ownership changes subsequent to the study it could limit the ability to utilize its net operating loss carryforwards. The Company plans to conduct a study during fiscal 2017 as a result of the May 2017 equity offering to determine whether Section 382 could limit the use of its carryforwards in this manner.
The Company has not recorded a deferred tax asset for the temporary difference associated with the excess of its tax basis over the book basis in its Austrian and Chinese subsidiaries as the future tax benefit is not expected to reverse in the foreseeable future.
The Company has recorded a deferred tax liability as of March 31, 2017 for the undistributed earnings of its remaining foreign subsidiaries for which it can no longer assert are permanently reinvested. The total amount of undistributed earnings available to be repatriated at March 31, 2017 was $2.1 million resulting in the recording of a $0.7 million net deferred federal and state income tax liability.
Accounting for income taxes requires a two-step approach to recognizing and measuring uncertain tax positions. The first step is to evaluate the tax position for recognition by determining if, based on the technical merits, it is more likely than not that the position will be sustained upon audit, including resolution of related appeals or litigation processes, if any. The second step is to measure the tax benefit as the largest amount that is more than 50% likely of being realized upon ultimate settlement. The Company reevaluates these uncertain tax positions on a quarterly basis. This evaluation is based on factors including, but not limited to, changes in facts or circumstances, changes in tax law, effectively settled issues under audit and new audit activity. Any changes in these factors could result in the recognition of a tax benefit or an additional charge to the tax provision. The Company did not identify any uncertain tax positions at March 31, 2017. The Company did not have any gross unrecognized tax benefits at March 31, 2017 or 2016.
During the fiscal year ended March 31, 2015, the Company concluded a tax audit for the period April 1, 2008 through March 31, 2011 with its foreign subsidiary in Austria. The results of this audit found no material exceptions to the Company’s tax positions.
There were no reversals of uncertain tax positions in the years ended March 31, 2017 and 2016. During the fiscal period ended March 31, 2015, the Company reversed uncertain tax positions of $1.1 million.
The Company accounts for interest and penalties related to uncertain tax positions as part of its provision for federal and state income taxes. Any unrecognized tax benefits, if recognized, would favorably affect its effective tax rate in any future period. The Company does not expect that the amounts of unrecognized benefits will change significantly within the next twelve months. Interest and penalties recorded in prior periods were immaterial and subsequently reversed in the year ended March 31, 2015.
The Company conducts business globally and, as a result, its subsidiaries file income tax returns in the U.S. federal jurisdiction and various state and foreign jurisdictions. Major tax jurisdictions include the U.S., China, Romania and Austria. All U.S. income tax filings for fiscal years ended March 31, 1995 through 2016 remain open and subject to examination and all fiscal years from the year ended March 31, 2012 through 2016 remain open and subject to examination in Austria. The Company’s tax filings in China for calendar years 2013 and 2014 were examined with no material exceptions. Although the 2013 and 2014 tax years in China were audited, they remain subject to further review until the statute of limitations has expired. The statute of limitations in China for the tax authorities to audit is generally three years. Tax filings in China for calendar years 2008 through 2012 and 2015 through 2016 remain open and subject to examination. Tax filings in Romania for the years ended March 31, 2014 through 2016 remain open and subject to examination.
12. Stockholders’ Equity
73
Stock-Based Compensation Plans
As of March 31, 2017, the Company had two active stock plans: the 2007 Stock Incentive Plan, as amended (the “2007 Plan”) and the Amended and Restated 2007 Director Stock Plan (the “2007 Director Plan”). Both the 2007 Plan and the 2007 Director Plan were approved by the Company’s stockholders on August 1, 2014.
The 2007 Plan provides for the grant of incentive stock options intended to qualify under Section 422 of the Internal Revenue Code of 1986, as amended, nonstatutory stock options, stock appreciation rights, restricted stock, restricted stock units and other stock-based awards. In the case of options, the exercise price shall be equal to at least the fair market value of the common stock, as determined by (or in a manner approved by) the Board of Directors, on the date of grant. The contractual life of options is generally 10 years. Options generally vest over a 3-5 year period while restricted stock generally vests over a 3 year period.
As of March 31, 2017, the 2007 Director Plan provided for the grant of nonstatutory stock options and stock awards to members of the Board of Directors who are not also employees of the Company (outside directors). Under the terms of the 2007 Director Plan effective April 1, 2014, each outside director is granted an option to purchase shares of common stock with an aggregate grant date value equal to $40,000 upon his or her initial election to the Board with an exercise price equal to the fair market value of the Company’s common stock on the date of the grant. These options vest in equal annual installments over a two-year period. In addition, effective April 1, 2014, each outside director is granted an award of shares of common stock with an aggregate grant date value equal to $40,000 three business days following the last day of each fiscal year, subject to proration for any partial fiscal year of service.
As of March 31, 2017, the 2007 Plan had 1,405,110 shares and the 2007 Director Plan had 150,802 shares available for future issuance.
Stock-Based Compensation
The components of employee stock-based compensation for the years ended March 31, 2017, 2016 and 2015 were as follows (in thousands):
Fiscal years ended March 31, | |||||||||||
2017 | 2016 | 2015 | |||||||||
Stock options | $ | 323 | $ | 663 | $ | 1,851 | |||||
Restricted stock and stock awards | 2,569 | 2,574 | 4,063 | ||||||||
Employee stock purchase plan | — | 11 | 22 | ||||||||
Total stock-based compensation expense | $ | 2,892 | $ | 3,248 | $ | 5,936 | |||||
The estimated fair value of the Company’s stock-based awards, less expected annual forfeitures, is amortized over the awards’ service period. The total unrecognized compensation cost for unvested outstanding stock options was $0.4 million for the fiscal year ended March 31, 2017. This expense will be recognized over a weighted-average expense period of approximately 1.9 years. The total unrecognized compensation cost for unvested outstanding restricted stock was $1.8 million for the fiscal year ended March 31, 2017. This expense will be recognized over a weighted-average expense period of approximately 1.3 years.
The following table summarizes employee stock-based compensation expense by financial statement line item for the fiscal years ended March 31, 2017, 2016 and 2015 (in thousands):
Fiscal years ended March 31, | |||||||||||
2017 | 2016 | 2015 | |||||||||
Cost of revenues | $ | 185 | $ | 274 | $ | 719 | |||||
Research and development | 214 | 418 | 1,728 | ||||||||
Selling, general and administrative | 2,493 | 2,556 | 3,489 | ||||||||
Total | $ | 2,892 | $ | 3,248 | $ | 5,936 | |||||
The following table summarizes the information concerning currently outstanding and exercisable employee and non-employee options:
74
Options / Shares | Weighted- Average Exercise Price | Weighted- Average Remaining Contractual Term | Aggregate Intrinsic Value (thousands) | |||||||||
Outstanding at March 31, 2016 | 366,549 | $ | 83.39 | |||||||||
Granted | 9,703 | 6.80 | ||||||||||
Exercised | — | — | ||||||||||
Canceled/forfeited | (24,244 | ) | 107.26 | |||||||||
Outstanding at March 31, 2017 | 352,008 | $ | 79.63 | 5.1 | $ | 0.6 | ||||||
Exercisable at March 31, 2017 | 282,005 | $ | 96.09 | 5.0 | $ | — | ||||||
Fully vested and expected to vest at March 31, 2017 | 347,256 | $ | 80.54 | 4.5 | $ | 0.5 | ||||||
There were 9,703 stock options granted during the fiscal year ended March 31, 2017 at a weighted average grant date fair value of $4.06 per share. There were no stock options granted during the fiscal year ended March 31, 2016 and the weighted-average grant-date fair value of stock options granted during the fiscal year ended March 31, 2015 was $10.18 per share. Intrinsic value represents the amount by which the market price of the common stock exceeds the exercise price of the options. Given the decline in the Company’s stock price, exercisable options as of March 31, 2017, 2016 and 2015 had no intrinsic value.
The weighted average assumptions used in the Black-Scholes valuation model for stock options granted during the fiscal years ended March 31, 2017, 2016, and 2015 are as follows:
Fiscal years ended March 31, | |||||||
2017 | 2016 | 2015 | |||||
Expected volatility | 67.6 | % | N/A | 85.5 | % | ||
Risk-free interest rate | 1.3 | % | N/A | 1.9 | % | ||
Expected life (years) | 5.7 | N/A | 5.9 | ||||
Dividend yield | None | N/A | None | ||||
The expected volatility rate was estimated based on an equal weighting of the historical volatility of the Company’s common stock and the implied volatility of the Company’s traded options. The expected term was estimated based on an analysis of the Company’s historical experience of exercise, cancellation, and expiration patterns. The risk-free interest rate is based on the average of the five and seven year U.S. Treasury rates.
The following table summarizes the employee and non-employee restricted stock activity for the year ended March 31, 2017:
Shares | Weighted Average Grant Date Fair Value | Intrinsic Aggregate Value (thousands) | ||||||||
Outstanding at March 31, 2016 | 482,844 | $ | 9.62 | |||||||
Granted | 171,000 | 10.23 | ||||||||
Vested | (228,919 | ) | 10.51 | |||||||
Forfeited | — | — | ||||||||
Outstanding at March 31, 2017 | 424,925 | $ | 9.40 | $ | 2,915 | |||||
The total fair value of restricted stock that was granted during the fiscal years ended March 31, 2017, 2016 and 2015 was $1.7 million, $2.6 million, and $5.6 million, respectively. The total fair value of restricted stock that vested during the fiscal years ended March 31, 2017, 2016 and 2015 was $2.3 million, $1.7 million, $3.1 million, respectively.
There were no performance-based restricted stock shares awarded during the fiscal years ended March 31, 2017 and 2016, respectively. The restricted stock awarded during the fiscal year ended March 31, 2015 includes approximately 38,021 shares of performance-based restricted stock, which would vest upon achievement of certain financial performance measurements. Included in the table above are 3,333 shares of service-based restricted stock units outstanding, which are expected to vest during the first quarter of fiscal 2017.
75
The remaining shares awarded vest upon the passage of time. For awards that vest upon the passage of time, expense is being recorded over the vesting period.
Employee Stock Purchase Plan
The Company has an employee stock purchase plan (ESPP) which provides employees with the opportunity to purchase shares of common stock at a price equal to the market value of the common stock at the end of the offering period, less a 15% purchase discount. As of March 31, 2017, the ESPP had 300,013 shares available for future issuance. The Company recognized no compensation expense for the fiscal year ended March 31, 2017, compensation expense of less than $0.1 million during the year fiscal ended March 31, 2016 and $0.1 million for the fiscal years ended March 31, 2015, related to the ESPP.
Equity Offerings
On April 29, 2015, the Company completed an equity offering with Cowen and Company, LLC, under which the Company sold 4.0 million shares of its common stock at an offering price of $6.00 per share. After underwriting, commissions and expenses, the Company received net proceeds from the offering of approximately $22.3 million.
ATM Arrangement
On January 27, 2017, the Company entered into an ATM arrangement, pursuant to which, the Company could, at its discretion, sell up to $10.0 million of the Company’s common stock through its sales agent, FBR. Sales of common stock made under the ATM were made pursuant to the prospectus supplement dated January 27, 2017, which supplements the prospectus dated October 1, 2014, included in the shelf registration statement that AMSC filed with the Securities and Exchange Commission (“SEC”) on September 19, 2014.
During the year ended March 31, 2017, the Company received net proceeds of $2.5 million, from sales of approximately 379,693 shares of its common stock at an average sales price of approximately $6.79 per share under the ATM. No sales of the Company's common stock were made under the ATM after March 31, 2017. On May 4, 2017, the Company provided to FBR Capital Markets & Co., the sales agent, a notice of termination of the ATM.
13. Commitments and Contingencies
Purchase Commitments
The Company periodically enters into non-cancelable purchase contracts in order to ensure the availability of materials to support production of its products. Purchase commitments represent enforceable and legally binding agreements with suppliers to purchase goods or services. The Company periodically assesses the need to provide for impairment on these purchase contracts and record a loss on purchase commitments when required.
Lease Commitments
Operating leases include minimum payments under leases for the Company’s facilities and certain equipment. The Company’s primary leased facilities are located in New Berlin, Wisconsin; Suzhou and Beijing, China; Klagenfurt, Austria; and Timisoara, Romania with a combined total of approximately 180,000 square feet of space. These leases have varying expiration dates through March 2021 which can generally be terminated at the Company’s request after a six month advance notice. The Company leases other locations which focus primarily on applications engineering, sales and/or field service and do not have significant leases or physical presence. See Item 2, “Properties” for further information.
Minimum future lease commitments at March 31, 2017 were as follows (in thousands):
Fiscal years ended March 31, | Total | ||
2018 | $ | 1,022 | |
2019 | 315 | ||
2020 | 179 | ||
2021 | 168 | ||
Total | $ | 1,684 | |
Rent expense under the operating leases mentioned above was as follows (in thousands):
76
Fiscal years ended March 31, | |||||||||||
2017 | 2016 | 2015 | |||||||||
Rent expense | $ | 1,338 | $ | 1,628 | $ | 2,091 | |||||
Legal Contingencies
From time to time, the Company is involved in legal and administrative proceedings and claims of various types. The Company records a liability in its consolidated financial statements for these matters when a loss is known or considered probable and the amount can be reasonably estimated. The Company reviews these estimates each accounting period as additional information is known and adjusts the loss provision when appropriate. If a matter is both probable to result in a liability and the amounts of loss can be reasonably estimated, the Company estimates and discloses the possible loss or range of loss to the extent necessary to make the consolidated financial statements not misleading. If the loss is not probable or cannot be reasonably estimated, a liability is not recorded in its consolidated financial statements.
On September 13, 2011, the Company commenced a series of legal actions in China against Sinovel Wind Group Co. Ltd. (“Sinovel”). The Company’s Chinese subsidiary, Suzhou AMSC Superconductor Co. Ltd., filed a claim for arbitration with the Beijing Arbitration Commission in accordance with the terms of the Company’s supply contracts with Sinovel. The case is captioned (2011) Jing Zhong An Zi No. 0963. The Company alleges that Sinovel committed various material breaches of its contracts with the Company and that Sinovel has refused to pay past due amounts for prior shipments of core electrical components and spare parts. The Company is seeking compensation for past product shipments and retention (including interest) in the amount of approximately RMB 485 million (approximately $70 million) due to Sinovel’s breaches of its contracts. The Company is also seeking specific performance of its existing contracts as well as reimbursement of all costs and reasonable expenses with respect to the arbitration. The value of the undelivered components under the existing contracts, including the deliveries refused by Sinovel in March 2011, amounts to approximately RMB 4.6 billion (approximately $667 million).
On October 8, 2011, Sinovel filed with the Beijing Arbitration Commission an application under the caption (2011) Jing Zhong An Zi No. 0963, for a counterclaim against the Company for breach of the same contracts under which the Company filed its original arbitration claim. Sinovel claimed, among other things, that the goods supplied by the Company do not conform to the standards specified in the contracts and claimed damages in the amount of approximately RMB 1.2 billion (approximately $174 million). On February 27, 2012, Sinovel filed with the Beijing Arbitration Commission an application under the caption (2012) Jing Zhong An Zi No. 0157, against the Company for breach of the same contracts under which the Company filed its original arbitration claim. Sinovel claims, among other things, that the goods supplied by the Company do not conform to the standards specified in the contracts and claimed damages in the amount of approximately RMB 105 million (approximately $15 million). The Company believes that Sinovel’s claims are without merit and it intends to defend these actions vigorously. Since the proceedings in this matter are still in the early technical review phase, the Company cannot reasonably estimate possible losses or range of losses at this time.
Other
The Company enters into long-term construction contracts with customers that require the Company to obtain performance bonds. The Company is required to deposit an amount equivalent to some or all the face amount of the performance bonds into an escrow account until the termination of the bond. When the performance conditions are met, amounts deposited as collateral for the performance bonds are returned to the Company. In addition, the Company has various contractual arrangements in which minimum quantities of goods or services have been committed to be purchased on an annual basis.
As of March 31, 2017, the Company had $0.8 million of restricted cash included in current assets and $0.2 million of restricted cash included in long-term assets. These amounts included in restricted cash primarily represent deposits to secure letters of credit for various supply contracts. These deposits are held in interest bearing accounts.
14. Employee Benefit Plans
The Company has implemented a defined contribution plan (the “Plan”) under Section 401(k) of the Internal Revenue Code. Any contributions made by the Company to the Plan are discretionary. The Company has a stock match program under which the Company matched, in the form of Company common stock, 50% of the first 6% of eligible contributions. The Company recorded expense of $0.4 million, for each of the fiscal years ended March 31, 2017, 2016, and 2015, and recorded corresponding charges to additional paid-in capital related to this program.
15. Minority Investments
77
Investment in Tres Amigas LLC
The Company made an investment in Tres Amigas, focused on providing the first common interconnection of America’s three power grids to help the country achieve its renewable energy goals and facilitate the smooth, reliable and efficient transfer of green power from region to region. The Company’s original investment in Tres Amigas was $5.4 million.
During the three months ended June 30, 2015, the Company determined that as a result of delays in Tres Amigas securing financing for the project, as well as the Company’s expectation that its investment would not be recoverable based on recent adverse market indicators for potential sales of the Company’s share of the investment, that its investment in Tres Amigas required further analysis for other-than-temporary impairment. The Company recorded an impairment charge of $0.7 million to fully impair this investment in the fiscal year ended March 31, 2016.
On March 11, 2016, the Company sold 100% of its minority share investment in Tres Amigas to an investor for $0.6 million. The Company received $0.3 million according to the terms of the purchase agreement upon closing, which was recorded as a gain during the three months ended March 31, 2016. The final $0.3 million was received and recorded as a gain during the year ended March 31, 2017.
16. Restructuring
The Company accounts for charges resulting from operational restructuring actions in accordance with ASC Topic 420, Exit or Disposal Cost Obligations (“ASC 420”) and ASC Topic 712, Compensation—Nonretirement Postemployment Benefits (“ASC 712”). In accounting for these obligations, the Company is required to make assumptions related to the amounts of employee severance, benefits, and related costs and the time period over which leased facilities will remain vacant, sublease terms, sublease rates and discount rates. Estimates and assumptions are based on the best information available at the time the obligation arises. These estimates are reviewed and revised as facts and circumstances dictate; changes in these estimates could have a material effect on the amount accrued on the consolidated balance sheet.
During the fiscal year ended March 31, 2015, the Company undertook restructuring activities, approved by the Board of Directors, in order to reorganize its global operations, streamline various functions of the business, and reduce its global workforce to better reflect the demand for its products. During the year ended March 31, 2015, the Company undertook a plan to consolidate its Grid manufacturing activities into its Devens, Massachusetts facility and close its facility in Middleton, Wisconsin which was completed during the year ended March 31, 2016. In addition, the Company established a new Wind manufacturing facility in Romania, and as a result, reduced the headcount in its operation in China. The Company is maintaining its headcount in China at a level necessary to support demand from its Chinese customers. There was no restructuring activity in the fiscal year ended March 31, 2017. The Company recorded restructuring charges for severance and other costs of approximately less than $0.1 million and $1.9 million during the fiscal years ended March 31, 2016 and 2015, respectively, primarily associated with the consolidation of the Company’s manufacturing activities in the United States and China. From April 1, 2011 through March 31, 2017, the Company’s various restructuring activities resulted in a substantial reduction of its global workforce. All amounts related to these restructuring activities have been paid as of March 31, 2017. The Company announced an additional restructuring plan on April 4, 2017 (see Note 19, "Subsequent Events" for further discussion).
The following table presents restructuring charges and cash payments during the year ended March 31, 2016 (in thousands):
Severance pay and benefits | Facility exit and Relocation costs | Total | |||||||||
Accrued restructuring balance at April 1, 2015 | $ | 180 | $ | — | $ | 180 | |||||
Charges to operations | (5 | ) | 38 | 33 | |||||||
Cash payments | (175 | ) | (38 | ) | (213 | ) | |||||
Accrued restructuring balance at March 31, 2016 | $ | — | $ | — | $ | — | |||||
All restructuring charges discussed above are included within restructuring and impairments in the Company’s consolidated statements of operations. The Company includes accrued restructuring within accounts payable and accrued expenses in the consolidated balance sheets.
17. Business Segments
The Company reports its financial results in two reportable business segments: Wind and Grid.
78
Through the Company’s Windtec Solutions, the Wind business segment enables manufacturers to field wind turbines with exceptional power output, reliability and affordability. The Company supplies advanced power electronics and control systems, licenses its highly engineered wind turbine designs, and provides extensive customer support services to wind turbine manufacturers. The Company’s design portfolio includes a broad range of drive trains and power ratings of 2 MWs and higher. The Company provides a broad range of power electronics and software-based control systems that are highly integrated and designed for optimized performance, efficiency, and grid compatibility.
Through the Company’s Gridtec Solutions, the Grid business segment enables electric utilities and renewable energy project developers to connect, transmit and distribute power with exceptional efficiency, reliability and affordability. The sales process is enabled by transmission planning services that allow it to identify power grid congestion, poor power quality and other risks, which helps the Company determine how its solutions can improve network performance. These services often lead to sales of grid interconnection solutions for wind farms and solar power plants, power quality systems, and transmission and distribution cable systems. The Company also sells ship protection products to the U.S. Navy through its Grid business segment.
The operating results for the 2 business segments are as follows (in thousands):
Fiscal Years Ended March 31, | |||||||||||
2017 | 2016 | 2015 | |||||||||
Revenues: | |||||||||||
Wind | $ | 47,269 | $ | 68,883 | $ | 51,307 | |||||
Grid | 27,926 | 27,140 | 19,223 | ||||||||
Total | $ | 75,195 | $ | 96,023 | $ | 70,530 | |||||
Fiscal Years Ended March 31, | |||||||||||
2017 | 2016 | 2015 | |||||||||
Operating loss: | |||||||||||
Wind | $ | (4,174 | ) | $ | (1,256 | ) | $ | (14,321 | ) | ||
Grid | (20,476 | ) | (14,835 | ) | (26,890 | ) | |||||
Unallocated corporate expenses | (2,892 | ) | (4,027 | ) | (11,306 | ) | |||||
Total | $ | (27,542 | ) | $ | (20,118 | ) | $ | (52,517 | ) | ||
Total assets for the two business segments as of March 31, 2017 and March 31, 2016 are as follows (in thousands):
March 31, 2017 | March 31, 2016 | ||||||
Wind | $ | 18,346 | $ | 34,389 | |||
Grid | 31,060 | 36,255 | |||||
Corporate assets | 50,838 | 64,674 | |||||
Total | $ | 100,244 | $ | 135,318 | |||
The accounting policies of the business segments are the same as those for the consolidated Company. The Company’s business segments have been determined in accordance with the Company’s internal management structure, which is organized based on operating activities. The Company evaluates performance based upon several factors, of which the primary financial measures are segment revenues and segment operating loss. The disaggregated financial results of the segments reflect allocation of certain functional expense categories consistent with the basis and manner in which Company management internally disaggregates financial information for the purpose of assisting in making internal operating decisions. In addition, certain corporate expenses which the Company does not believe are specifically attributable or allocable to either of the two business segments have been excluded from the segment operating loss.
Unallocated corporate expenses primarily consist of stock-based compensation expense of $2.9 million, $3.2 million, and $5.9 million, in the fiscal years ended March 31, 2017, 2016, and 2015, respectively, and restructuring and impairment charges of $0.8 million and, $5.4 million, for the fiscal years ended March 31, 2016, and 2015, respectively.
Geographic information about revenue, based on shipments to customers by region, is as follows (in thousands):
79
Fiscal years ended March 31, | |||||||||||
2017 | 2016 | 2015 | |||||||||
India | $ | 44,243 | $ | 59,640 | $ | 39,314 | |||||
U.S. | 16,224 | 14,565 | 9,820 | ||||||||
China | 2,004 | 8,455 | 10,410 | ||||||||
Asia Pacific | 2,106 | 5,364 | 3,788 | ||||||||
Africa | 1,548 | 2,697 | 616 | ||||||||
Australia | 4,053 | 2,410 | 1,653 | ||||||||
Europe | 3,624 | 1,775 | 2,239 | ||||||||
Canada | 1,393 | 1,117 | 2,690 | ||||||||
Total | $ | 75,195 | $ | 96,023 | $ | 70,530 | |||||
In the fiscal years ended March 31, 2017, 2016, and 2015, 78%, 85%, and 86% of the Company’s revenues, respectively, were recognized from sales outside the United States. The Company maintains operations in Austria, Romania, and the United States and sales and service support centers around the world.
In the fiscal years ended March 31, 2017, 2016 and 2015, Inox accounted for approximately 59%, 62%, and 56% of the Company’s total revenues, respectively.
Geographic information about property, plant and equipment associated with particular regions is as follows (in thousands):
March 31, | |||||||
2017 | 2016 | ||||||
North America | $ | 42,699 | $ | 48,685 | |||
Europe | 602 | 868 | |||||
Asia Pacific | 137 | 225 | |||||
Total | $ | 43,438 | $ | 49,778 | |||
18. Quarterly Financial Data (Unaudited)
(In thousands, except per share amount) | For the year ended March 31, 2017: | ||||||||||||||
Three Months Ended | June 30, | September 30, | December 31, | March 31, | |||||||||||
2016 | 2016 | 2016 | 2017 | ||||||||||||
Total revenue | $ | 13,345 | $ | 18,507 | $ | 27,148 | $ | 16,195 | |||||||
Operating loss | (9,344 | ) | (7,150 | ) | (4,060 | ) | (6,988 | ) | |||||||
Net loss | (10,355 | ) | (7,325 | ) | (2,768 | ) | (6,925 | ) | |||||||
Net loss per common share—basic | (0.76 | ) | (0.53 | ) | (0.20 | ) | (0.50 | ) | |||||||
Net loss per common share—diluted | (0.76 | ) | (0.53 | ) | (0.20 | ) | (0.50 | ) | |||||||
For the year ended March 31, 2016: | |||||||||||||||
Three Months Ended | June 30, | September 30, | December 31, | March 31, | |||||||||||
2015 | 2015 | 2015 | 2016 | ||||||||||||
Total revenue | $ | 23,723 | $ | 19,004 | $ | 25,772 | $ | 27,524 | |||||||
Operating loss | (8,257 | ) | (6,841 | ) | (3,312 | ) | (1,708 | ) | |||||||
Net loss | (9,121 | ) | (7,698 | ) | (2,957 | ) | (3,363 | ) | |||||||
Net loss per common share—basic | (0.75 | ) | (0.57 | ) | (0.22 | ) | (0.25 | ) | |||||||
Net loss per common share—diluted | (0.75 | ) | (0.57 | ) | (0.22 | ) | (0.25 | ) | |||||||
19. Subsequent Events
On April 4, 2017, the Company announced that the board of directors had approved a plan to reduce its global workforce by approximately 8%, effective April 4, 2017. The majority of the affected employees were located at the Company's Devens, Massachusetts office location. The purpose of the workforce reduction was to reduce operating expenses to better align with the Company’s current revenues.
80
This workforce reduction, together with fixed cost savings from a more cost-effective facility, and variable cost savings expected to be realized from production volume aligned with the lower headcount, is expected to reduce the Company’s annualized expenses once the savings are fully realized, which is expected to begin to occur in the fiscal quarter ending March 31, 2018. The Company expects to incur restructuring charges of $1.5 million to $2.0 million in cash severance expenses in the fiscal quarter ending June 30, 2017 in connection with the workforce reduction.
On May 5, 2017, the Company entered into an underwriting agreement with Oppenheimer & Co. Inc., as representative of the several underwriters named therein, relating to the issuance and sale (the "Offering") of 4.0 million shares of the Company's common stock at a public offering price of $4.00 per share. The net proceeds to the Company from the Offering were approximately $14.7 million, after deducting underwriting discounts and commissions and estimated offering expenses payable by the Company. The Offering closed on May 10, 2017. In addition, the Company has granted the underwriters a 30 day option to purchase up to an additional 600,000 shares of common stock at the public offering price.
The Offering was made pursuant to the Company's shelf registration statement on Form S-3 (Registration Statement No. 333-198851) previously filed with and declared effective by the Securities and Exchange Commission (the "SEC") and a prospectus supplement and accompanying prospectus filed with the SEC.
The Company has performed an evaluation of subsequent events through the time of filing this Annual Report on Form 10-K with the SEC, and has determined that there are no other such events to report.
20. Recent Accounting Pronouncements
In May 2014, the Financial Accounting Standards Board (“FASB”) and the International Accounting Standards Board (IASB) issued, ASU 2014-09, Revenue from Contracts with Customers (Topic 606). The guidance substantially converges final standards on revenue recognition between the FASB and IASB providing a framework on addressing revenue recognition issues and, upon its effective date, replaces almost all existing revenue recognition guidance, including industry-specific guidance, in current U.S. generally accepted accounting principles. The FASB has subsequently issued the following amendments to ASU 2014-09 which are all effective for annual reporting periods beginning after December 15, 2017.
• | In March 2016 the FASB issued ASU No. 2016-08, Revenue from Contracts with Customers (Topic 606): Principal versus Agent Considerations, which clarifies the implementation guidance on principal versus agent considerations. |
• | In April 2016 the FASB issued ASU No. 2016-10, Revenue from Contracts with Customers (Topic 606): Identifying Performance Obligations and Licensing, which clarifies certain aspects of identifying performance obligations and licensing implementation guidance. |
• | In May 2016 the FASB issued ASU No. 2016-12, Revenue from Contracts with Customers (Topic 606): Narrow- Scope Improvements and Practical Expedients related to disclosures of remaining performance obligations, as well as other amendments to guidance on collectability, non-cash consideration and the presentation of sales and other similar taxes collected from customers. |
• | In December 2016 the FASB issued ASU No. 2016-20, Technical Corrections and Improvements to Topic 606, Revenue from Contracts with Customers, which amends certain narrow aspects of the guidance issued in ASU 2014-09 including guidance related to the disclosure of remaining performance obligations and prior-period performance obligations, as well as other amendments to the guidance on loan guarantee fees, contract costs, refund liabilities, advertising costs and the clarification of certain examples. |
The Company is currently evaluating the provisions of ASU 2014-09 and its amendments, and assessing the impact the adoption of this guidance will have on its financial position, results of operations and disclosures. The Company anticipates the adoption of this guidance will result in certain changes in the identification of deliverables in its contracts and allocation of transaction price. The Company is required to adopt the new standards in the first quarter of fiscal 2018 using one of two application methods: retrospectively to each prior reporting period presented (full retrospective method), or retrospectively with the cumulative effect of initially applying the guidance recognized at the date of initial application (the cumulative catch-up transition method). The Company is currently evaluating the available adoption methods.
In July 2014, the FASB issued ASU 2014-12, Compensation - Stock Compensation (Topic 718): Accounting for Share Based Payments When the Terms of an Award Provide that a Performance Target could be Achieved after the Requisite Service Period. To account for such awards, a reporting entity should apply existing guidance in FASB Accounting Standards Codification Topic
81
718, Compensation - Stock Compensation, as it relates to awards with performance conditions that affect vesting. As such, the performance target should not be reflected in estimating the grant-date fair value of the award. The Company adopted ASU 2014-12 effective April 1, 2016 and concluded that there is no material impact on its current practices.
In August 2014, the FASB issued ASU 2014-15, Presentation of Financial Statements - Going Concern (Subtopic 205-40): Disclosure of Uncertainties About an Entity’s Ability to Continue as a Going Concern. The new standard explicitly requires the assessment at interim and annual periods, and provides management with its own disclosure guidance. This ASU is effective for annual reporting periods and interim periods, within those annual periods ending after December 15, 2016. The Company adopted ASU 2014-15 effective March 31, 2017 and concluded there is no material impact on its current practices.
In April 2015, the FASB issued ASU 2015-03, Interest-Imputation of Interest (Subtopic 835-30): Simplifying the Presentation of Debt Issuance Costs. The amendments in ASU 2015-03 require an entity to present debt issuance costs on the balance sheet as a direct deduction from the related debt liability as opposed to an asset. Amortization of the costs will continue to be reported as interest expense. This ASU is effective for annual reporting periods beginning after December 15, 2015, and interim periods within those fiscal years. The Company adopted ASU 2015-03 effective April 1, 2016 and concluded that there is no material impact on its consolidated results of operations, financial condition, or cash flow.
In June 2015, the FASB issued ASU 2015-10, Technical Corrections and Improvements. The amendments in ASU 2015-10 clarify and correct some of the differences that arose between original guidance from FASB, EITF and other sources, and the translation into the new Codification. This ASU is effective for annual reporting periods beginning after December 15, 2015, and interim periods within those fiscal years. The Company adopted ASU 2015-10 effective April 1, 2016 and concluded that there is no material impact on its consolidated results of operations, financial condition, or cash flow.
In July 2015, the FASB issued ASU 2015-11, Inventory (Topic 330): Simplifying the Measurement of Inventory. The amendments in ASU 2015-11 clarify the proper way to identify market value in the use of lower of cost or market value valuation method. As market value could be determined multiple ways under prior standards, it will now be considered as net realizable value. This ASU is effective for annual reporting periods beginning after December 15, 2016, and interim periods within those fiscal years. The Company adopted ASU 2015-11 effective March 31, 2017 and concluded there is no material impact on its current practices.
In September 2015, the FASB issued ASU 2015-16, Business Combinations (Topic 805): Simplifying the Accounting for Measurement-Period Adjustments. The amendments in ASU 2015-16 require that an acquirer recognize adjustments to provisional amounts identified during the measurement period in the reporting period in which the adjustment amounts are determined. This ASU is effective for annual reporting periods beginning after December 15, 2015, and interim periods within those fiscal years. The Company adopted ASU 2015-16 effective April 1, 2016 and concluded that there is no material impact on its consolidated results of operations, financial condition, or cash flow.
In January 2016, the FASB issued ASU 2016-01, Financial Instruments-Overall (Subtopic 825-10): Recognition and Measurement of Financial Assets and Financial Liabilities. The amendments in ASU 2016-01 will enhance the reporting model for financial instruments to provide users of financial statements with more decision-useful information. This ASU is effective for annual reporting periods beginning after December 15, 2017, and interim periods within those fiscal years. The Company is currently evaluating the impact, if any, the adoption of ASU 2016-01 may have on its current practices.
In February 2016, the FASB issued ASU 2016-02, Leases (Topic 842). The guidance in this ASU supersedes the leasing guidance in Topic 840, Leases. Under the new guidance, lessees are required to recognize lease assets and lease liabilities on the balance sheet for all leases with terms longer than 12 months. Leases will be classified as either finance or operating, with classification affecting the pattern of expense recognition in the income statement. This ASU is effective for fiscal years beginning after December 15, 2019, including interim periods within those fiscal years. A modified retrospective transition approach is required for lessees for capital and operating leases existing at, or entered into after, the beginning of the earliest comparative period presented in the financial statements, with certain practical expedients available. The Company is currently evaluating the effects adoption of this guidance will have on its consolidated financial statements.
In March 2016, the FASB issued ASU 2016-09, Compensation-Stock Compensation (Topic 718): Improvements to Employee Share-Based Payment Accounting. The amendments in ASU 2016-09 will simplify several aspects of the accounting for share-based payment transactions, including tax consequences, classification of awards as either equity or liabilities, and classification on the statement of cash flows. The ASU is effective for annual reporting periods beginning after December 15, 2017, and interim periods within annual periods beginning after December 15, 2018. The Company adopted ASU 2016-09 effective April 1, 2016 and concluded that there is no material impact on its current practices.
82
In June 2016, the FASB issued ASU 2016-13, Financial Instruments-Credit Losses (Topic 326): Measurement of Credit Losses on Financial Instruments. The amendments in ASU 2016-13 will provide more decision useful information about the expected credit losses on financial instruments and other commitments to extend credit held by a reporting entity at each reporting date. The ASU is effective for annual reporting periods beginning after December 15, 2019, including interim periods within that year. The Company is currently evaluating the impact, if any, the adoption of ASU 2016-13 may have on its current practices.
In 2016, the FASB issued the following two ASU's on Statement of Cash Flows (Topic 230). Both amendments are effective for annual reporting periods beginning after December 15, 2017, including interim periods within that year.
• | In August 2016, the FASB issued ASU 2016-15, Statement of Cash Flows (Topic 230): Classification of Certain Cash Receipts and Cash Payments. The amendments in ASU 2016-15 will provide more guidance towards the classification of multiple different types of cash flows in order to reduce the diversity in reporting across entities. |
• | In November 2016, the FASB issued ASU 2016-18, Statement of Cash Flows (Topic 230): Restricted Cash. The amendments in ASU 2016-18 will explain the change during the period in the total of cash, cash equivalents, and amounts generally described as restricted cash or restricted cash equivalents. Therefore, amounts generally described as restricted cash and restricted cash equivalents should be included with cash and cash equivalents when reconciling the beginning-of-period and end-of-period total amounts shown on the statement of cash flows. |
The Company is currently evaluating the impact, if any, the adoption of ASU 2016-15 and ASU 2016-18 may have on its current practices.
In October 2016, the FASB issued ASU 2016-16, Income Taxes (Topic 740): Intra-Entity Transfers of Assets Other Than Inventory. The amendments in ASU 2016-16 will improve the accounting for the income tax consequences of intra-entity transfers of assets other than inventory. The ASU is effective for annual reporting periods beginning after December 15, 2017, including interim periods within that year. The Company is currently evaluating the impact, if any, the adoption of ASU 2016-16 may have on its current practices.
In January 2017, the FASB issued ASU 2017-01, Business Combinations. The amendments in ASU 2017-01 will clarify the definition of a business with the objective of adding guidance to assist entities with evaluating whether transactions should be accounted for as acquisitions (or disposals) of assets or businesses. The ASU is effective for annual reporting periods beginning after December 15, 2017, including interim periods within those periods. The Company is currently evaluating the impact the adoption of ASU 2017-01 may have on its current practices.
In January 2017, the FASB issued ASU 2017-03, Accounting Changes and Error Corrections (Topic 250) and Investments - Equity Method and Joint Ventures. The amendments in ASU 2017-03 provide additional detail surrounding disclosures required related to adoption of new pronouncements. The ASU is effective for the periods of each related pronouncement. The Company is currently evaluating the impact the adoption of ASU 2017-03 may have on its current practices.
In February 2017, the FASB issued ASU 2017-05, Other Income - Gains and Losses from the Derecognition of Non-financial Assets (Subtopic 610-20). The amendments in ASU 2017-05 clarify the scope of Subtopic 610-20, Other Income-Gains and Losses from the Derecognition of Non-financial Assets, and to add guidance for partial sales of non financial assets. Subtopic 610-20, which was issued in May 2014 as a part of Accounting Standards Update No. 2014-09, Revenue from Contracts with Customers (Topic 606), provides guidance for recognizing gains and losses from the transfer of non financial assets in contracts with non customers. The Company is currently evaluating the impact the adoption of ASU 2017-05 may have on its current practices.
Item 9. | CHANGES IN AND DISAGREEMENTS WITH ACCOUNTANTS ON ACCOUNTING AND FINANCIAL DISCLOSURE |
None.
Item 9A. | CONTROLS AND PROCEDURES |
Evaluation of Disclosure Controls and Procedures
Our management, with the participation of our Chief Executive Officer and Chief Financial Officer, evaluated the effectiveness of our disclosure controls and procedures as of March 31, 2017. The term “disclosure controls and procedures,” as defined in Rules 13a-15(e) and 15d-15(e) under the Exchange Act, means controls and other procedures of a company that are designed to ensure that information required to be disclosed by a company in the reports that it files or submits under the Exchange
83
Act is recorded, processed, summarized and reported, within the time periods specified in the SEC’s rules and forms. Disclosure controls and procedures include, without limitation, controls and procedures designed to ensure that information required to be disclosed by a company in the reports that it files or submits under the Exchange Act is accumulated and communicated to the company’s management, including its principal executive and principal financial officers, as appropriate, to allow timely decisions regarding required disclosure. Management recognizes that any controls and procedures, no matter how well designed and operated, can provide only reasonable assurance of achieving their objectives and management necessarily applies its judgment in evaluating the cost-benefit relationship of possible controls and procedures. Based on the evaluation of our disclosure controls and procedures as of March 31, 2017, our Chief Executive Officer and Chief Financial Officer concluded that, as of such date, our disclosure controls and procedures were effective at the reasonable assurance level.
Management’s Report on Internal Control over Financial Reporting
Management is responsible for establishing and maintaining adequate internal control over our financial reporting. Internal control over financial reporting is defined in Rules 13a–15(f) and 15d–15(f) under the Exchange Act as a process designed by, or under the supervision of, a company’s chief executive officer and chief financial officer, and effected by the board of directors, management and other personnel, to provide reasonable assurance regarding the reliability of financial reporting and the preparation of financial statements for external purposes in accordance with generally accepted accounting principles, and includes those policies and procedures that:
(1) Pertain to the maintenance of records that, in reasonable detail, accurately and fairly reflect the transactions and dispositions of assets;
(2) Provide reasonable assurance that transactions are recorded as necessary to permit preparation of financial statements in accordance with generally accepted accounting principles, and that receipts and expenditures are being made only in accordance with authorizations of management and directors; and
(3) Provide reasonable assurance regarding prevention or timely detection of unauthorized acquisition, use or disposition of assets that could have a material effect on the financial statements.
Under the supervision and with the participation of our management, including our chief executive officer and chief financial officer, an evaluation was conducted of the effectiveness of our internal control over financial reporting based on the Committee of Sponsoring Organizations of the Treadway Commission’s Internal Control – Integrated Framework (2013 Edition). Based on this evaluation, management concluded that our internal control over financial reporting was effective as of March 31, 2017.
The effectiveness of our internal control over financial reporting as of March 31, 2017 has been audited by RSM US LLP, an independent registered public accounting firm, as stated in their report which is included herein.
Changes in Internal Control over Financial Reporting
There was no change in our internal control over financial reporting during the quarter ended March 31, 2017 that has materially affected, or is reasonably likely to materially affect, our internal control over financial reporting.
Item 9B. | OTHER INFORMATION |
None.
PART III
Item 10. | DIRECTORS, EXECUTIVE OFFICERS AND CORPORATE GOVERNANCE |
The response to this item is contained in part under the caption “Executive Officers” in Part I of this Annual Report on Form 10-K, and in part in our Proxy Statement for the Annual Meeting of Stockholders to be held in 2017 (the “2017 Proxy Statement”) in the sections “Corporate Governance — Members of the Board,” “Other Matters — Section 16(a) Beneficial Ownership Reporting Compliance,” “Corporate Governance — Code of Business Conduct and Ethics,” “Corporate Governance —Board Committees” and “Corporate Governance — Board Committees — Audit Committee,” “Corporate Governance — Director Nomination Process”, “Corporate Governance — Board Determination of Independence”, which sections are incorporated herein by reference.
84
Item 11. | EXECUTIVE COMPENSATION |
The sections of the 2017 Proxy Statement titled “Information About Executive and Director Compensation,” “Information About Executive and Director Compensation — Compensation Committee Interlocks and Insider Participation” and “Information About Executive and Director Compensation — Compensation Committee Report” are incorporated herein by reference.
Item 12. | SECURITY OWNERSHIP OF CERTAIN BENEFICIAL OWNERS AND MANAGEMENT AND RELATED STOCKHOLDER MATTERS |
The sections of the 2017 Proxy Statement titled “Stock Ownership of Certain Beneficial Owners and Management” and “Information about Executive Officer and Director Compensation — Securities Authorized for Issuance Under our Equity Compensation Plans” are incorporated herein by reference.
Item 13. | CERTAIN RELATIONSHIPS AND RELATED TRANSACTIONS, AND DIRECTOR INDEPENDENCE |
The sections of the 2017 Proxy Statement titled “Certain Relationships and Related Transactions” and “Corporate Governance —Board Determination of Independence” and “Corporate Governance — Board Committees” are incorporated herein by reference.
Item 14. | PRINCIPAL ACCOUNTING FEES AND SERVICES |
The section of the 2017 Proxy Statement titled “Ratification of Selection of Independent Registered Public Accounting Firm (Proposal 5)” is incorporated herein by reference.
PART IV
Item 15. | EXHIBITS AND FINANCIAL STATEMENT SCHEDULES |
(a) Document filed as part of this Annual Report on Form 10-K:
1. Financial Statements
The following financial statements of American Superconductor Corporation, supplemental information and report of independent registered public accounting firm required by this item are included in Item 8, “Financial Statements and Supplementary Data,” in this Form 10-K:
2. Financial Statement Schedules
See “Schedule II — Valuation and Qualifying Accounts” for the fiscal years ended March 31, 2017, 2016 and 2015. All other schedules are omitted because they are not applicable, not required or the required information is shown in the consolidated financial statements or notes thereto.
3. Exhibits Required by Item 601 of Regulation S-K under the Exchange Act.
See (b) Exhibits.
85
(b) Exhibits
The list of Exhibits filed as a part of this Annual Report on Form 10-K is set forth on the Exhibit Index immediately preceding such Exhibits, and is incorporated herein by reference.
86
American Superconductor Corporation
Schedule II — Valuation and Qualifying Accounts
(In thousands)
Balance, Beginning of Year | Additions | Write-offs | Recoveries and Other Adjustments | Balance, End of Year | ||||||||||||
Allowance for doubtful accounts receivable: | ||||||||||||||||
Fiscal year ended March 31, 2017 | $ | 54 | — | — | — | $ | 54 | |||||||||
Fiscal year ended March 31, 2016 | $ | 54 | — | — | — | $ | 54 | |||||||||
Fiscal year ended March 31, 2015 | $ | 16 | 54 | (16 | ) | — | $ | 54 | ||||||||
Balance, Beginning of Year | Additions | Write-offs | Recoveries and Other Adjustments | Balance, End of Year | ||||||||||||
Deferred tax asset valuation allowance: | ||||||||||||||||
Fiscal year ended March 31, 2017 | $ | 301,393 | 22,580 | (8,881 | ) | — | $ | 315,092 | ||||||||
Fiscal year ended March 31, 2016 | $ | 294,860 | 9,028 | (2,495 | ) | — | $ | 301,393 | ||||||||
Fiscal year ended March 31, 2015 | $ | 282,824 | 15,189 | (3,153 | ) | — | $ | 294,860 | ||||||||
Item 16. FORM 10-K SUMMARY
None.
87
SIGNATURES
Pursuant to the requirements of Section 13 or 15(d) of the Securities Exchange Act of 1934, the registrant has duly caused this report to be signed on its behalf by the undersigned, thereunto duly authorized.
AMERICAN SUPERCONDUCTOR CORPORATION | ||
BY: | /S/ DANIEL P. MCGAHN | |
Daniel P. McGahn President, Chief Executive Officer, and Director | ||
Date: May 25, 2017 | ||
Pursuant to the requirements of the Securities Exchange Act of 1934, this report has been signed below by the following persons on behalf of the registrant and in the capacities and on the dates indicated.
Name | Title | Date | ||
/S/ DANIEL P. MCGAHN | President, Chief Executive Officer, and Director (Principal Executive Officer) | May 25, 2017 | ||
Daniel P. McGahn | ||||
/S/ JOHN W. KOSIBA, JR. | Senior Vice President, Chief Financial Officer and Treasurer (Principal Financial and Accounting Officer) | May 25, 2017 | ||
John W. Kosiba, Jr. | ||||
/S/ JOHN W. WOOD, JR. | Chairman of the Board | May 25, 2017 | ||
John W. Wood, Jr. | ||||
/S/ VIKRAM S. BUDHRAJA | Director | May 25, 2017 | ||
Vikram S. Budhraja | ||||
/S/ ARTHUR H. HOUSE | Director | May 25, 2017 | ||
Arthur H. House | ||||
/S/ PAMELA F. LENEHAN. | Director | May 25, 2017 | ||
Pamela F. Lenehan | ||||
/S/ DAVID R. OLIVER, JR. | Director | May 25, 2017 | ||
David R. Oliver, Jr. | ||||
/S/ JOHN B. VANDER SANDE | Director | May 25, 2017 | ||
John B. Vander Sande | ||||
EXHIBIT INDEX
Incorporated by Reference | ||||||||||||
Exhibit Number | Exhibit Description | Form | File No. | Exhibit | Filing Date | Filed/Furnished Herewith | ||||||
3.1 | Restated Certificate of Incorporation of the Registrant, as amended. | S-3 | 333-191153 | 3.1 | 9/13/2013 | |||||||
3.2 | Certificate of Amendment of Restated Certificate of Incorporation of the Registrant, dated March 24, 2015. | 8-K | 000-19672 | 3.1 | 3/24/2015 | |||||||
3.3 | Amended and Restated By-Laws of the Registrant. | S-3 | 333-191153 | 3.2 | 9/13/2013 | |||||||
4.1 | Exchanged Note dated as of December 20, 2012 between the Registrant and Capital Ventures International. | 10-Q | 000-19672 | 4.1 | 2/11/2013 | |||||||
4.2 | Series A-2 Warrant, dated as of October 9, 2013, between the Registrant and Capital Ventures International, and assigned to CVI Investments on January 29, 2016. | 10-K | 000-19672 | 4.2 | 5/31/2016 | |||||||
4.3 | Amended and Restated Warrant Agreement, dated as of December 19, 2014, between the Registrant and Hercules Technology Growth Capital, Inc. | 8-K | 000-19672 | 4.1 | 12/22/2014 | |||||||
4.4 | Form of Indenture, between the Registrant and Wilmington Trust, National Association. | S-3 | 333-198851 | 4.1 | 9/19/2014 | |||||||
4.5 | Form of Warrant Agreement, by and between the Registrant and the American Stock Transfer and Trust Company, dated November 13, 2014, and Form of Warrant. | 8-K | 000-19672 | 4.1 | 11/13/2014 | |||||||
10.1+ | Amended and Restated 1996 Stock Incentive Plan. | 10-K | 000-19672 | 10.21 | 6/27/2001 | |||||||
10.2+ | Form of incentive stock option agreement under Amended and Restated 1996 Stock Incentive Plan. | 10-K | 000-19672 | 10.3 | 5/28/2009 | |||||||
10.3+ | Form of non-statutory stock option agreement under Amended and Restated 1996 Stock Incentive Plan. | 10-K | 000-19672 | 10.4 | 5/28/2009 | |||||||
10.4+ | Second Amended and Restated 1997 Director Stock Option Plan, as amended. | 10-Q | 000-19672 | 10.8 | 2/5/2009 | |||||||
10.5+ | Form of Stock Option Agreement under Second Amended and Restated 1997 Director Stock Option Plan, as amended. | 10-Q | 000-19672 | 10.4 | 11/9/2004 | |||||||
10.6+ | 2004 Stock Incentive Plan, as amended. | 10-Q | 000-19672 | 10.9 | 2/5/2009 | |||||||
10.7+ | Form of Incentive Stock Option Agreement under 2004 Stock Incentive Plan, as amended. | 10-Q | 000-19672 | 10.1 | 11/9/2004 | |||||||
10.8+ | Form of Non-statutory Stock Option Agreement under 2004 Stock Incentive Plan, as amended. | 10-Q | 000-19672 | 10.2 | 11/9/2004 | |||||||
Incorporated by Reference | ||||||||||||
Exhibit Number | Exhibit Description | Form | File No. | Exhibit | Filing Date | Filed/Furnished Herewith | ||||||
10.9+ | Form of Restricted Stock Agreement under 2004 Stock Incentive Plan, as amended. | 10-Q | 000-19672 | 10.3 | 11/9/2004 | |||||||
10.10+ | 2007 Stock Incentive Plan, as amended. | 8-K | 000-19672 | 10.1 | 8/2/2016 | |||||||
10.11+ | Form of Incentive Stock Option Agreement under 2007 Stock Incentive Plan, as amended. | 8-K | 000-19672 | 10.2 | 8/7/2007 | |||||||
10.12+ | Form of Non-statutory Stock Option Agreement under 2007 Stock Option Plan, as amended. | 8-K | 000-19672 | 10.3 | 8/7/2007 | |||||||
10.13+ | Form of Restricted Stock Agreement Regarding Awards to Executive Officers under 2007 Stock Option Plan, as amended. | 8-K | 000-19672 | 10.4 | 8/7/2007 | |||||||
10.14+ | Form of Restricted Stock Agreement Regarding Awards to Employees, under 2007 Stock Option Plan, as amended. | 8-K | 000-19672 | 10.5 | 8/7/2007 | |||||||
10.15+ | Form of Restricted Stock Agreement (regarding performance-based awards to executive officers and employees) under 2007 Stock Incentive Plan, as amended. | 8-K | 000-19672 | 10.1 | 5/20/2008 | |||||||
10.16+ | Amended and Restated 2007 Director Stock Plan. | 8-K | 000-19672 | 10.2 | 8/2/2016 | |||||||
10.17+ | Form of Non-statutory Stock Option Agreement Under Amended and Restated 2007 Director Stock Plan. | 8-K | 000-19672 | 10.7 | 8/7/2007 | |||||||
10.18+ | Executive Incentive Plan for the fiscal year ended March 31, 2016. | 10-Q | 000-19672 | 10.1 | 8/5/2015 | |||||||
10.19+ | Executive Incentive Plan for fiscal year ended March 31, 2017. | 10-Q | 000-19672 | 10.1 | 8/9/2016 | |||||||
10.20 | Form of Employee Nondisclosure and Developments Agreement. | S-1 | 333-43647 | 10.16 | 1/7/1991 | |||||||
10.21+ | Amended and Restated Executive Severance Agreement, dated as of May 24, 2011, between the Registrant and Daniel P. McGahn. | 8-K | 000-19672 | 10.2 | 5/24/2011 | |||||||
10.22+ | Amended and Restated Executive Severance Agreement, dated as of December 23, 2008, between the Registrant and David A. Henry. | 10-Q | 000-19672 | 10.2 | 2/5/2009 | |||||||
10.23+ | Amended and Restated Executive Severance Agreement, dated as of September 20, 2013, between the Registrant and James F. Maguire. | 8-K | 000-19672 | 10.1 | 9/25/2013 | |||||||
Incorporated by Reference | ||||||||||||
Exhibit Number | Exhibit Description | Form | File No. | Exhibit | Filing Date | Filed/Furnished Herewith | ||||||
10.24+ | Executive Severance Agreement, dated as of January 13, 2012, between the Registrant and John W. Kosiba. | 8-K | 000-19672 | 10.1 | 4/4/2017 | |||||||
10.25 | Securities Purchase Agreement, dated as of April 4, 2012, by and between the Registrant and Capital Ventures International. | 8-K | 000-19672 | 10.1 | 4/4/2012 | |||||||
10.26 | Registration Rights Agreement, dated as of April 4, 2012, by and between the Registrant and Capital Ventures International. | 8-K | 000-19672 | 10.2 | 4/4/2012 | |||||||
10.27 | Amendment and Exchange Agreement, dated as of December 20, 2012, by and between the Registrant and Capital Ventures International. | 8-K | 000-19672 | 10.1 | 12/21/2012 | |||||||
10.28 | Second Amendment and Warrant Exchange Agreement, dated as of October 9, 2013, by and between the Registrant and Capital Ventures International. | 8-K | 000-19672 | 10.1 | 10/9/2013 | |||||||
10.29 | Exchange Agreement, dated as of March 2, 2014, by and between the Registrant and Capital Ventures International. | 8-K | 000-19672 | 10.1 | 3/3/2014 | |||||||
10.30 | Loan and Security Agreement, by and between Registrant and Hercules Technology Growth Capital, Inc., dated as of June 5, 2012. | 8-K | 000-19672 | 10.1 | 6/6/2012 | |||||||
10.31 | First Amendment to Loan and Security Agreement, by and between Registrant and Hercules Technology Growth Capital, Inc., dated as of November 15, 2013. | 8-K | 000-19672 | 10.1 | 11/18/2013 | |||||||
10.32 | Second Amendment to Loan and Security Agreement, by and among the Registrant, ASC Devens LLC, Superconductivity, Inc. and Hercules Technology Growth Capital, Inc., dated as of December 19, 2014. | 8-K | 000-19672 | 10.1 | 12/22/2014 | |||||||
10.33 | Limited Waiver, dated as of June 11, 2013, between the Registrant and Hercules Technology Growth Capital, Inc. | 10-K | 000-19672 | 10.50 | 6/14/2013 | |||||||
10.34 | Mortgage and Security Agreement, dated as of July 31, 2012, by and between ASC Devens LLC and Hercules Technology Growth Capital, Inc. | 10-Q | 000-19672 | 10.3 | 11/6/2012 | |||||||
10.35 | First Modification to Mortgage and Security Agreement, dated as of November 15, 2013, by and between ASC Devens LLC and Hercules Technology Growth Capital, Inc. | 10-Q | 000-19672 | 10.3 | 2/6/2014 | |||||||
10.36 | Second Modification to Mortgage and Security Agreement, dated as of December 19, 2014, by and between ASC Devens LLC and Hercules Technology Growth Capital, Inc. | 10-Q | 000-19672 | 10.2 | 2/5/2015 | |||||||
10.37 | Environmental Indemnity Agreement, dated as of July 31, 2012, made by the Registrant and ASC Devens LLC in favor of Hercules Technology Growth Capital, Inc. | 10-Q | 000-19672 | 10.4 | 11/6/2012 | |||||||
Incorporated by Reference | ||||||||||||
Exhibit Number | Exhibit Description | Form | File No. | Exhibit | Filing Date | Filed/Furnished Herewith | ||||||
10.38† | Supply Contract, effective as of February 8, 2013, by and between the Registrant and Inox Wind Limited. | 8-K | 000-19672 | 10.1 | 2/14/2013 | |||||||
10.39† | Supply Contract, effective as of June 2, 2014, by and between the Registrant and Inox Wind Limited. | 8-K | 000-19672 | 10.1 | 6/5/2014 | |||||||
10.40† | Amendment No.1 to Supply Contract (dated June 2, 2014), by and between the Registrant and Inox Wind Limited, entered into by the Registrant on August 26, 2015. | 10-Q | 000-19672 | 10.1 | 11/3/2015 | |||||||
10.41† | Amendment No.2 to Supply Contract (dated June 2, 2014), by and between the Registrant and Inox Wind Limited, entered into by the Registrant on December 14, 2015. | 10-Q | 000-19672 | 10.3 | 2/9/2016 | |||||||
10.42†† | Amendment No.3 to Supply Contract (dated June 3, 2014), by and between the Registrant and Inox Wind Limited, entered into on February 18, 2016. | 10-K | 000-19672 | 10.41 | 5/31/2016 | |||||||
10.43† | Supply Contract, effective as of August 15, 2014, by and between the Registrant and Inox Wind Limited. | 10-Q | 000-19672 | 10.1 | 11/6/2014 | |||||||
10.44† | Amendment No.1 to Supply Contract (effective as of August 15, 2014), by and between the Registrant and Inox Wind Limited, entered into by the Registrant on February 25, 2015. | 10-Q | 000-19672 | 10.2 | 11/3/2015 | |||||||
10.45† | Amendment No.2 to Supply Contract (effective as of August 15, 2014), by and between the Registrant and Inox Wind Limited, entered into by the Registrant on August 26, 2015. | 10-Q | 000-19672 | 10.3 | 11/3/2015 | |||||||
10.46† | Amendment No.3 to Supply Contract (effective as of August 15, 2014), by and between the Registrant and Inox Wind Limited, entered into on November 19, 2015. | 10-Q | 000-19672 | 10.30 | 2/9/2016 | |||||||
10.47†† | Amendment No.4 to Supply Contract (effective as of August 15, 2014), by and between the Registrant and Inox Wind Limited, entered into on February 18, 2016. | 10-K | 000-19672 | 10.46 | 5/31/2016 | |||||||
10.48† | Supply Contract, dated December 16, 2015, by and between the Registrant and Inox Wind Limited. | 10-Q | 000-19672 | 10.1 | 2/9/2016 | |||||||
10.49† | Technology License Agreement, dated December 16, 2015, by and among AMSC Austria GMBH, the Registrant and Inox Wind Limited. | 10-Q | 000-19672 | 10.2 | 2/9/2016 | |||||||
10.50†† | License and Sublicense Agreement, dated March 4, 2016, by and between the Registrant and BASF Corporation. | 10-K | 000-19672 | 10.49 | 5/31/2016 | |||||||
10.51†† | Disclosure Letter, dated March 4, 2016, by and between the Registrant and BASF Corporation. | 10-K | 000-19672 | 10.50 | 5/31/2016 | |||||||
Incorporated by Reference | ||||||||||||
Exhibit Number | Exhibit Description | Form | File No. | Exhibit | Filing Date | Filed/Furnished Herewith | ||||||
10.52†† | Joint Development Agreement, dated March 4, 2016, by and between the Registrant and BASF Corporation. | 10-K | 000-19672 | 10.51 | 5/31/2016 | |||||||
10.52 | At Market Issuance Sales Agreement, by and between the Registrant and FBR Capital Markets & Co. | 8-K | 000-19672 | 10.1 | 1/27/17 | |||||||
21.1 | Subsidiaries. | * | ||||||||||
23.1 | Consent of RSM US LLP | * | ||||||||||
31.1 | Chief Executive Officer — Certification pursuant to Rule 13a-14(a) or Rule 15d-14(a) of the Securities Exchange Act of 1934, as adopted pursuant to Section 302 of the Sarbanes-Oxley Act of 2002. | * | ||||||||||
31.2 | Chief Financial Officer — Certification pursuant to Rule 13a-14(a) or Rule 15d-14(a) of the Securities Exchange Act of 1934, as adopted pursuant to Section 302 of the Sarbanes-Oxley Act of 2002. | * | ||||||||||
32.1 | Chief Executive Officer — Certification pursuant to Rule13a-14(b) or Rule 15d-14(b) of the Securities Exchange Act of 1934 and 18 U.S.C. Section 1350, as adopted pursuant to Section 906 of the Sarbanes-Oxley Act of 2002. | ** | ||||||||||
32.2 | Chief Financial Officer — Certification pursuant to Rule 13a-14(b) or Rule 15d-14(b) of the Securities Exchange Act of 1934 and 18 U.S.C. Section 1350, as adopted pursuant to Section 906 of the Sarbanes-Oxley Act of 2002. | ** | ||||||||||
101.INS | XBRL Instance Document.* | |||||||||||
101.SCH | XBRL Taxonomy Extension Schema Document.* | |||||||||||
101.CAL | XBRL Taxonomy Calculation Linkbase Document.* | |||||||||||
101.DEF | XBRL Taxonomy Definition Linkbase Document.* | |||||||||||
101.LAB | XBRL Taxonomy Label Linkbase Document.* | |||||||||||
101.PRE | XBRL Taxonomy Presentation Linkbase Document.* | |||||||||||
† | Confidential treatment previously requested and granted with respect to certain portions, which portions were omitted and filed separately with the Commission. |
+ | Management contract or compensatory plan or arrangement required to be filed as an Exhibit to this Form 10-K. |
* | Filed herewith. |
** | Furnished herewith. |