Attached files
| file | filename |
|---|---|
| 8-K - FORM 8-K - Travelport Worldwide LTD | t1701652_8k.htm |
Exhibit 99.1

May 23, 2017 Bernard Bot Executive Vice President and Chief Financial Officer
Related to Forward - Looking Statements Certain items in this presentation and in today’s discussion, including, but not limited to, matters relating to revenue, net income (loss) and earnings, and assumptions or projections regarding future events or future results, and percentages or calculations using these measures, capital structure, future business opportunities, plans, prospects or growth rates and other financial measurements and non - financial statements relating to future periods, constitute forward - looking statements. These forward - looking statements are based on management’s current views with respect to future results, are only predictions, not historical fact, and are subject to risks and uncertainties, as well as assumptions. These statements are not guarantees of future performance. Actual results may differ materially from those contemplated by forward - looking statements. Travelport Worldwide Limited (the ‘Company’ or ‘ Travelport ’) refers you to our periodic reports and filings with the Securities and Exchange Commission (SEC), including our Annual Report on Form 10 - K for the year ended December 31, 2016, filed with the SEC on February 21, 2017 and our Quarterly Report on Form 10 - Q for the quarter ended March 31, 2017, filed on May 9, 2017, f or additional discussion of these risks and uncertainties, as well as a cautionary statement regarding forward - looking statements. Forward - looking statements made during this presentation speak only as of today’s date. Travelport expressly disclaims any obligation to update or revise any forward - looking statements, whether as a result of new information, future events, any change in expectations or otherwise. Related to Non - GAAP Financial Information Travelport analyzes its performance using Adjusted EBITDA, Adjusted Operating Income/(Loss), Adjusted Net Income/(Loss), Adjusted Income/(Loss) per Share, Capital Expenditures, Net Debt and Free Cash Flow, which are non - GAAP financial measures. Such measures may not be comparable to similarly named measures used by other companies. We utilize these measures to provide useful supplemental information to assist investors in understanding and assessing our performance and financial results on the same basis that management uses internally. These adjusted financial measures provide investors greater transparency with respect to key metrics used by management to evaluate our core operations, forecast future results, determine future capital investment allocations and understand business trends within the industry. Management believes the adjusted financial measures assist investors in the comparison of financial results between periods as such measures exclude certain items that management believes are not reflective of our core operating performance consistent with how management reviews the business. Adjusted EBITDA is the primary metric used to evaluate and understand our underlying operations and business trends, forecasting and determining future capital investment allocations. Adjusted EBITDA, Adjusted Net Income/(Loss), Adjusted Income/(Loss) per Share and Adjusted Operating Income/(Loss) are also used by the Board of Directors to determine incentive compensation for future periods. Capital Expenditures, which impact depreciation and amortization, interest expense and income tax expense, are reviewed separately by management. These non - GAAP measures are defined in the ‘Definitions’ appendix of this presentation and discussed and reconciled to GAAP measures in our quarterly and annual filings with the SEC. The targets set forth herein are set as goals only and are not projections nor intended to be projections of future financial performance. They are subject to the risks identified under “Related to Forward - Looking Statements”. Disclaimers

Focused product strategy Deliver leading technology Winning in sales
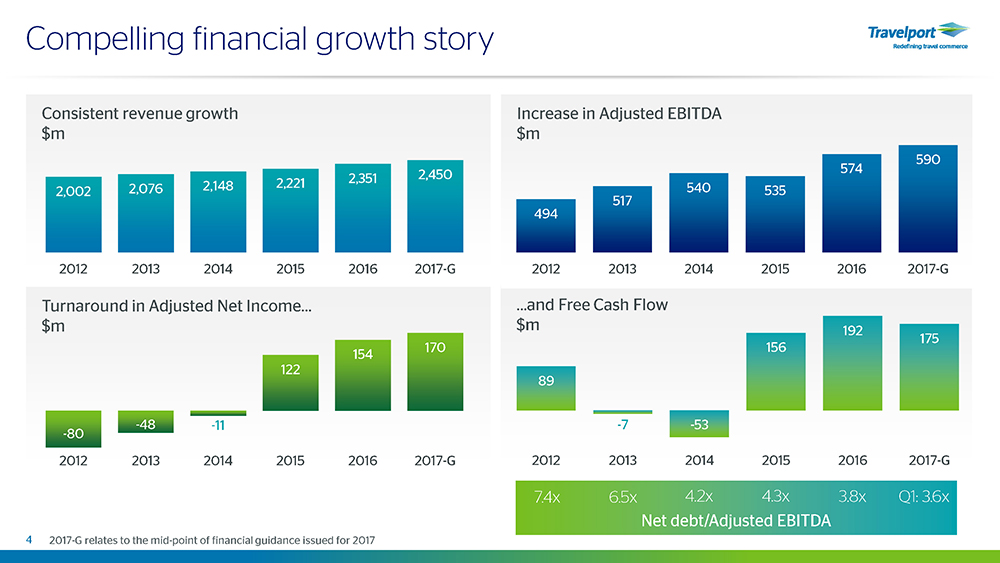
…and Free Cash Flow $m 89 - 7 - 53 156 192 175 2012 2013 2014 2015 2016 2017-G Compelling financial growth story Consistent revenue growth $m 2,002 2,076 2,148 2,221 2,351 2,450 2012 2013 2014 2015 2016 2017-G Increase in Adjusted EBITDA $m 494 517 540 535 574 590 2012 2013 2014 2015 2016 2017-G Turnaround in Adjusted Net Income… $m - 80 - 48 - 11 122 154 170 2012 2013 2014 2015 2016 2017-G Net debt/Adjusted EBITDA 7.4x 6.5x 4.2x 4.3x 3.8x 4 2017 - G relates to the mid - point of financial guidance issued for 2017 Q1: 3.6x
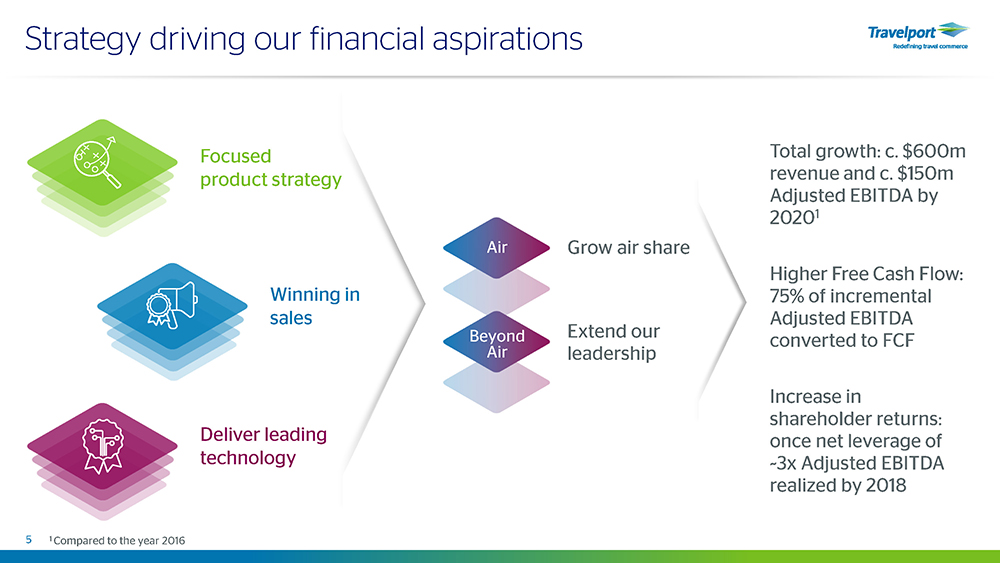
Strategy driving our financial aspirations 5 1 Compared to the year 2016 Focused product strategy Winning in sales Deliver leading technology Total growth: c. $600m revenue and c. $150m Adjusted EBITDA by 2020 1 Higher Free Cash Flow: 75% of incremental Adjusted EBITDA converted to FCF Increase in shareholder returns: once net leverage of ~3x Adjusted EBITDA realized by 2018 Grow air share Air Beyond Air Extend our leadership
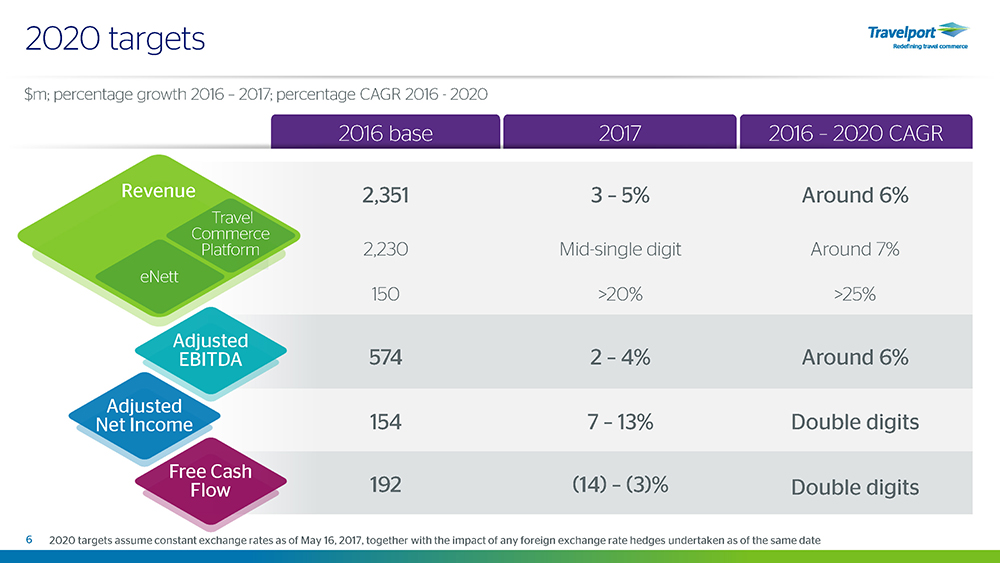
2016 base 2017 2016 – 2020 CAGR 2,351 3 – 5% Around 6% 2,230 Mid - single digit Around 7% eNett 150 >20% >25% 574 2 – 4% Around 6% 154 7 – 13% Double digits 192 (14) – (3)% Double digits 2020 targets 6 $m; percentage growth 2016 – 2017; percentage CAGR 2016 - 2020 Adjusted EBITDA Adjusted Net Income Free Cash Flow Revenue eNett Travel Commerce Platform 2020 targets assume constant exchange rates as of May 16, 2017, together with the impact of any foreign exchange rate hedges und ertaken as of the same date
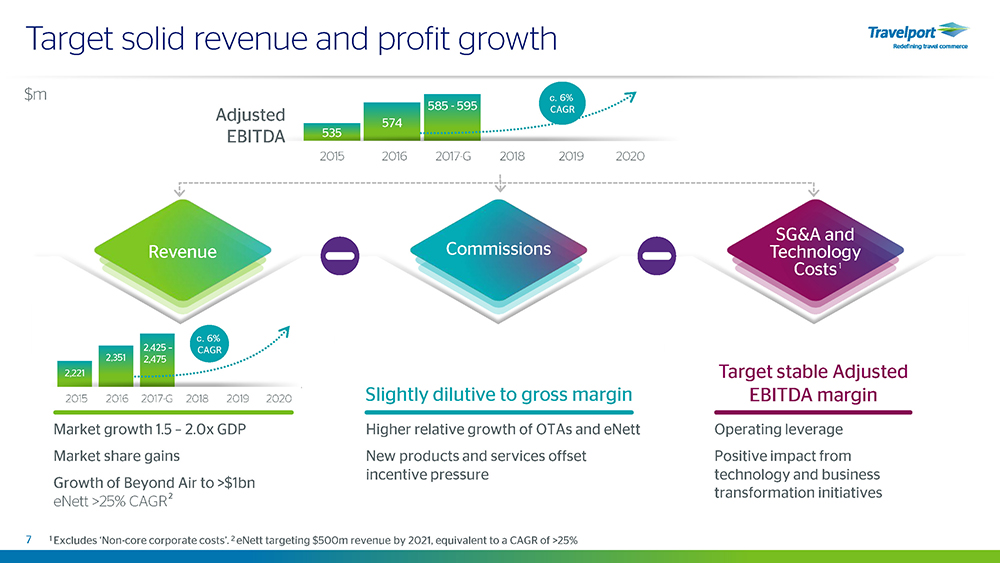
Target solid revenue and profit growth 7 Market growth 1.5 – 2.0x GDP Market share gains Growth of Beyond Air to >$1bn eNett >25% CAGR Higher relative growth of OTAs and eNett New products and services offset incentive pressure Operating leverage Positive impact from technology and business transformation initiatives Revenue 2,221 2,351 2015 2016 2017 2018 2019 2020 2,425 – 2,475 2015 2016 2017 - G 2018 2019 2020 c. 6% CAGR SG&A and Technology Costs Target stable Adjusted EBITDA margin $m 1 1 Excludes ‘Non - core corporate costs ’. 2 eNett targeting $500m revenue by 2021, equivalent to a CAGR of >25% Commissions Slightly dilutive to gross margin 535 574 585 - 595 2015 2016 2017 - G 2018 2019 2020 c. 6% CAGR Adjusted EBITDA 2
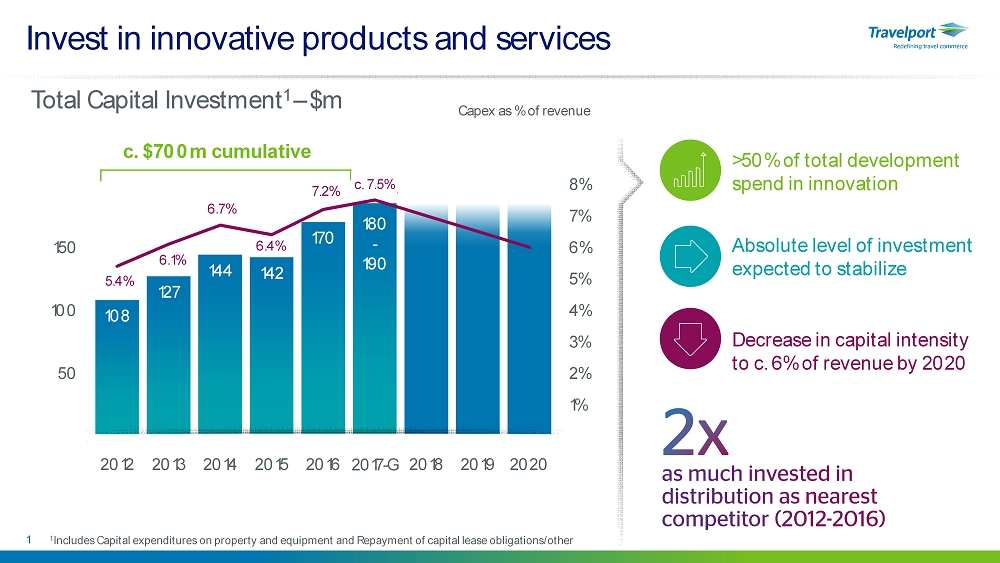
Invest in innovative products and services Debt holders c. $700m cumulative Decrease in capital intensity to c. 6% of revenue by 2020 Absolute level of investment expected to stabilize >50% of total development spend in innovation 1 1 Includes Capital expenditures on property and equipment and Repayment of capital lease obligations/other 108 127 144 142 170 5.4% 6.1% 6.7% 6.4% 7.2% ~ 7.5% 0% 1% 2% 3% 4% 5% 6% 7% 8% 0 50 100 150 200 2012 2013 2014 2015 2016 2017 2018 2019 2020 Capex as % of revenue Total Capital Investment 1 – $m 2017 - G 180 - 190 c. 7.5%
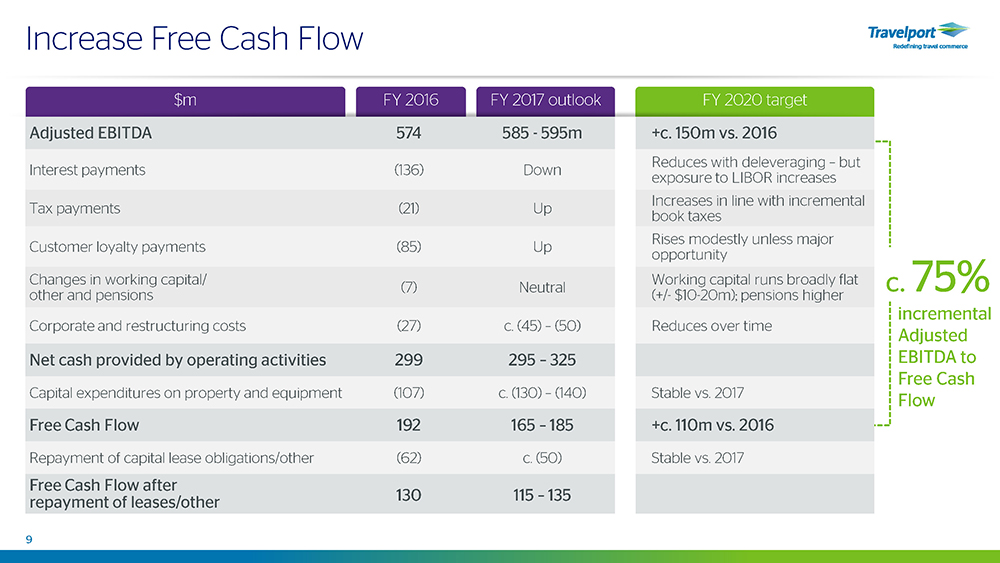
FY 2020 target Increase Free Cash Flow 9 $m FY 2016 FY 2017 outlook Adjusted EBITDA 574 585 - 595m Interest payments (136) Down Tax payments (21) Up Customer loyalty payments (85) Up Changes in working capital/ other and pensions (7) Neutral Corporate and restructuring costs (27) c. (45) – (50) Net cash provided by operating activities 299 295 – 325 Capital expenditures on property and equipment (107) c. (130) – (140) Free Cash Flow 192 165 – 185 Repayment of capital lease obligations/other (62) c. (50) Free Cash Flow after repayment of leases/other 130 115 – 135 c. 75% incremental Adjusted EBITDA to Free Cash Flow +c. 150m vs. 2016 Reduces with deleveraging – but exposure to LIBOR increases Increases in line with incremental book taxes Rises modestly unless major opportunity Working capital runs broadly flat (+/ - $10 - 20m); pensions higher Reduces over time Stable vs. 2017 +c. 110m vs. 2016 Stable vs. 2017
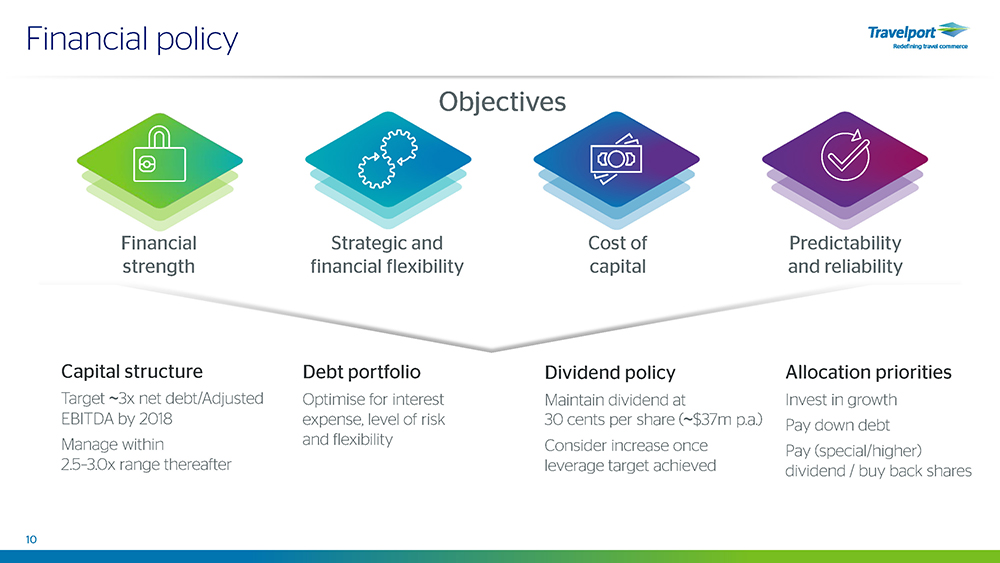
Financial policy 10 Objectives Financial strength Strategic and financial flexibility Cost of capital Predictability and reliability Debt portfolio Optimise for interest expense, level of risk and flexibility Capital structure Target ~ 3x net debt/Adjusted EBITDA by 2018 Manage within 2.5 – 3.0x range thereafter Allocation priorities Invest in growth Pay down debt Pay (special/higher) dividend / buy back shares Dividend policy Maintain dividend at 30 cents per share ( ~ $37m p.a.) Consider increase once leverage target achieved
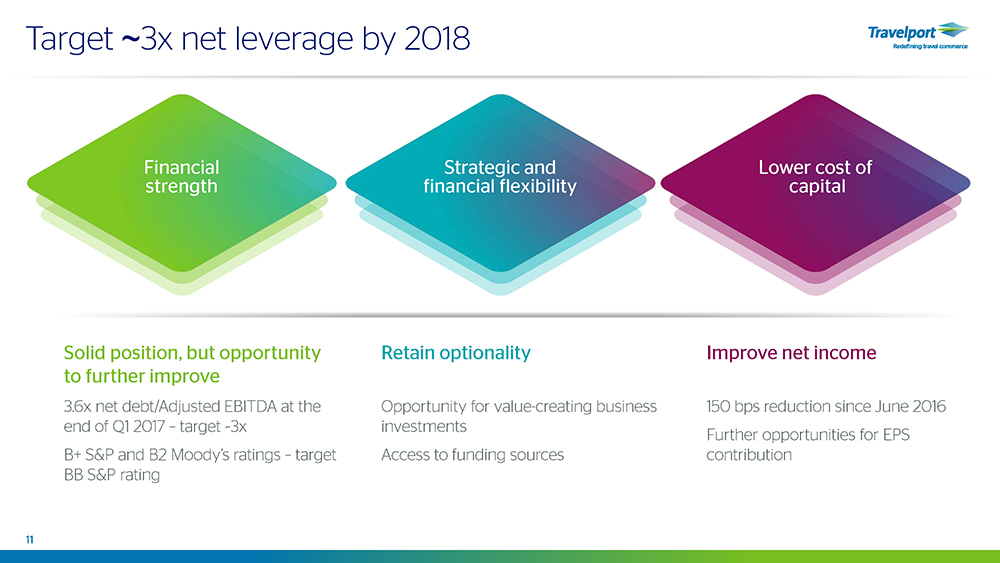
Target ~ 3x net leverage by 2018 Solid position, but opportunity to further improve 3.6x net debt/Adjusted EBITDA at the end of Q1 2017 – target ~3x B+ S&P and B2 Moody’s ratings – target BB S&P rating Retain optionality supporting lower interest margin Opportunity for value - creating business investments Access to funding sources Improve net income to benefit from further debt and margin 150 bps reduction since June 2016 Further opportunities for EPS contribution 11 Financial strength Strategic and financial flexibility Lower cost of capital
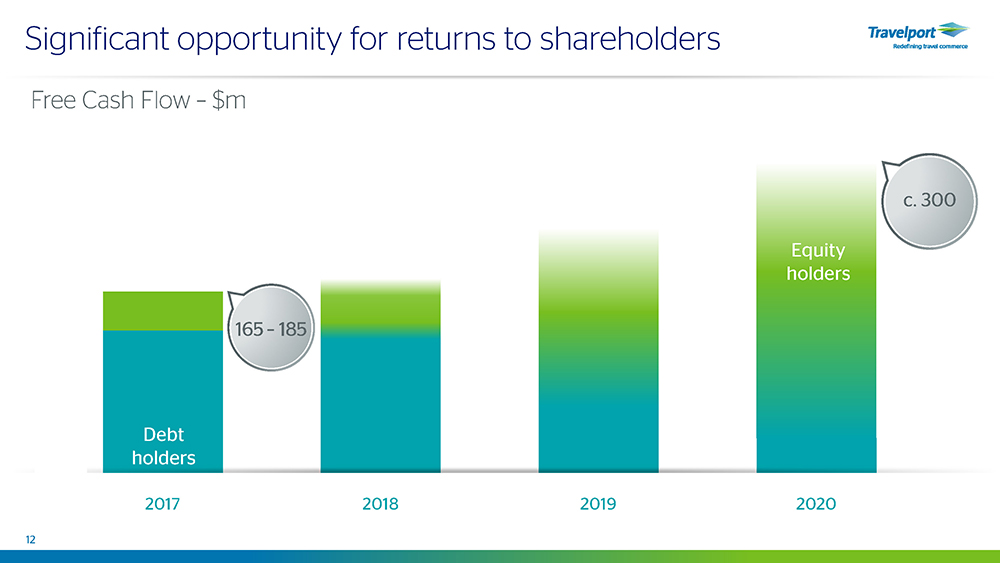
Significant opportunity for returns to shareholders 12 Debt holders 2017 2018 2019 2020 Debt holders Equity holders 165 – 185 c. 300 Free Cash Flow – $m
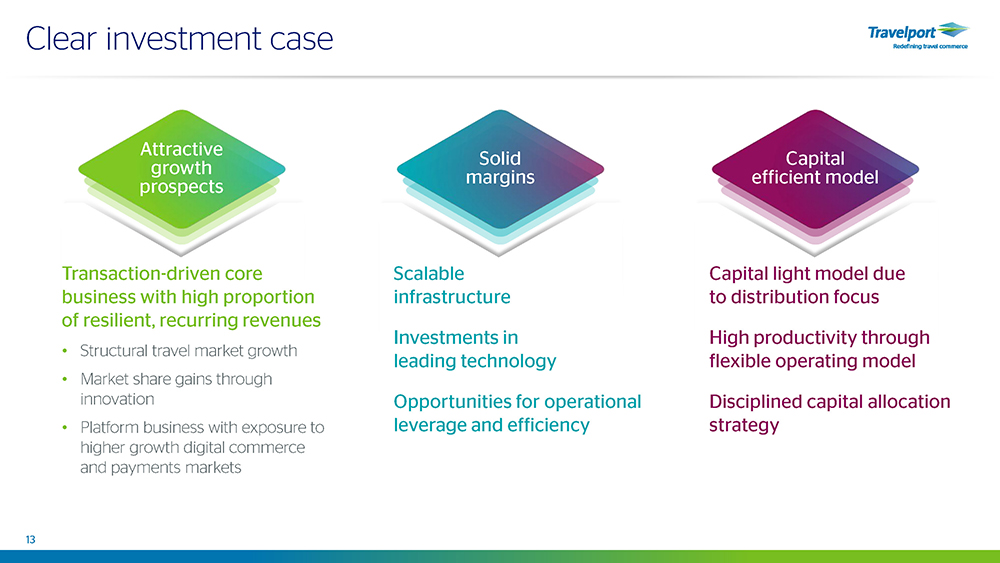
Clear investment case 13 Transaction - driven core business with high proportion of resilient, recurring revenues • Structural travel market growth • Market share gains through innovation • Platform business with exposure to higher growth digital commerce and payments markets Attractive growth prospects Scalable infrastructure Solid margins Capital light model due to distribution focus Capital efficient model Investments in leading technology Opportunities for operational leverage and efficiency High productivity through flexible operating model Disciplined capital allocation strategy

May 23, 2017 Appendices
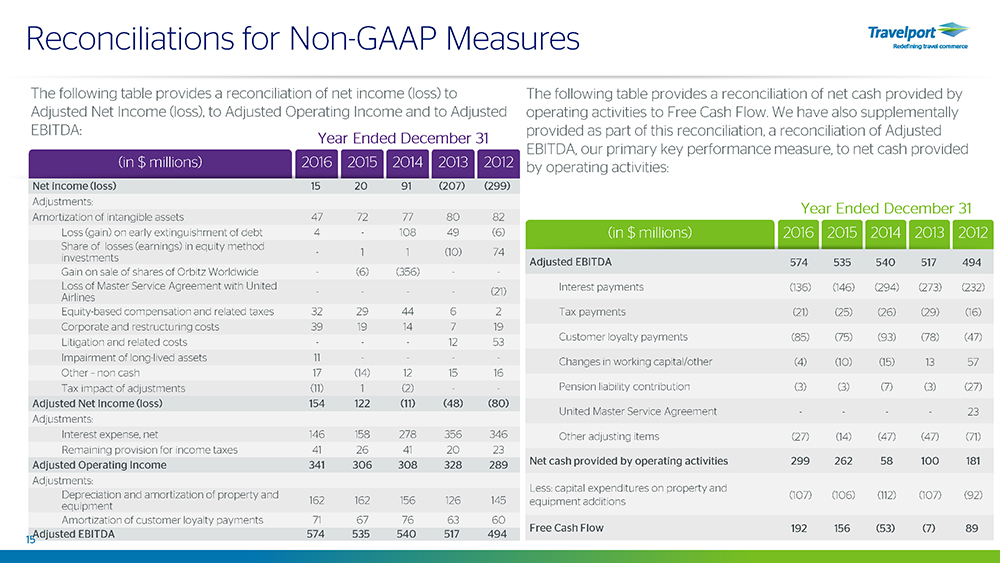
2016 2015 2014 2013 2012 2016 2015 2014 2013 2012 (in $ millions) Reconciliations for Non - GAAP Measures (in $ millions) The following table provides a reconciliation of net income (loss) to Adjusted Net Income (loss), to Adjusted Operating Income and to Adjusted EBITDA: Net income (loss) 15 20 91 (207) (299) Adjustments: Amortization of intangible assets 47 72 77 80 82 Loss (gain) on early extinguishment of debt 4 - 108 49 (6) Share of losses (earnings) in equity method investments - 1 1 (10) 74 Gain on sale of shares of Orbitz Worldwide - (6) (356) - - Loss of Master Service Agreement with United Airlines - - - - (21) Equity - based compensation and related taxes 32 29 44 6 2 Corporate and restructuring costs 39 19 14 7 19 Litigation and related costs - - - 12 53 Impairment of long - lived assets 11 - - - - Other – non cash 17 (14) 12 15 16 Tax impact of adjustments (11) 1 (2) - - Adjusted Net Income (loss) 154 122 (11) (48) (80) Adjustments: Interest expense, net 146 158 278 356 346 Remaining provision for income taxes 41 26 41 20 23 Adjusted Operating Income 341 306 308 328 289 Adjustments: Depreciation and amortization of property and equipment 162 162 156 126 145 Amortization of customer loyalty payments 71 67 76 63 60 Adjusted EBITDA 574 535 540 517 494 15 Year Ended December 31 Adjusted EBITDA 574 535 540 517 494 Interest payments (136) (146) (294) (273) (232) Tax payments (21) (25) (26) (29) (16) Customer loyalty payments (85) (75) (93) (78) (47) Changes in working capital/other (4) (10) (15) 13 57 Pension liability contribution (3) (3) (7) (3) (27) United Master Service Agreement - - - - 23 Other adjusting items (27) (14) (47) (47) (71) Net cash provided by operating activities 299 262 58 100 181 Less: capital expenditures on property and equipment additions (107) (106) (112) (107) (92) Free Cash Flow 192 156 (53) (7) 89 The following table provides a reconciliation of net cash provided by operating activities to Free Cash Flow. We have also supplementally provided as part of this reconciliation, a reconciliation of Adjusted EBITDA, our primary key performance measure, to net cash provided by operating activities: Year Ended December 31
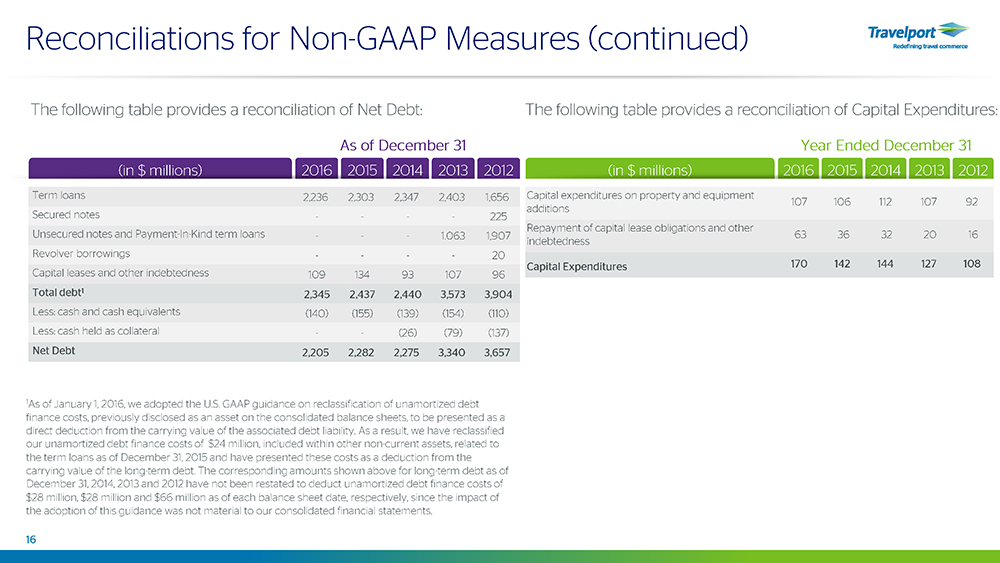
2016 2015 2014 2013 2012 2016 2015 2014 2013 2012 (in $ millions) Reconciliations for Non - GAAP Measures (continued) (in $ millions) The following table provides a reconciliation of Net Debt: Term loans 2,236 2,303 2,347 2,403 1,656 Secured notes - - - - 225 Unsecured notes and Payment - In - Kind term loans - - - 1.063 1,907 Revolver borrowings - - - - 20 Capital leases and other indebtedness 109 134 93 107 96 Total debt 1 2,345 2,437 2,440 3,573 3,904 Less: cash and cash equivalents (140) (155) (139) (154) (110) Less: cash held as collateral - - (26) (79) (137) Net Debt 2,205 2,282 2,275 3,340 3,657 16 As of December 31 Capital expenditures on property and equipment additions 107 106 112 107 92 Repayment of capital lease obligations and other indebtedness 63 36 32 20 16 Capital Expenditures 170 142 144 127 108 1 As of January 1, 2016, we adopted the U.S. GAAP guidance on reclassification of unamortized debt finance costs, previously disclosed as an asset on the consolidated balance sheets, to be presented as a direct deduction from the carrying value of the associated debt liability. As a result, we have reclassified our unamortized debt finance costs of $24 million, included within other non - current assets, related to the term loans as of December 31, 2015 and have presented these costs as a deduction from the carrying value of the long - term debt. The corresponding amounts shown above for long - term debt as of December 31, 2014, 2013 and 2012 have not been restated to deduct unamortized debt finance costs of $28 million, $28 million and $66 million as of each balance sheet date, respectively, since the impact of the adoption of this guidance was not material to our consolidated financial statements. Year Ended December 31 The following table provides a reconciliation of Capital Expenditures:
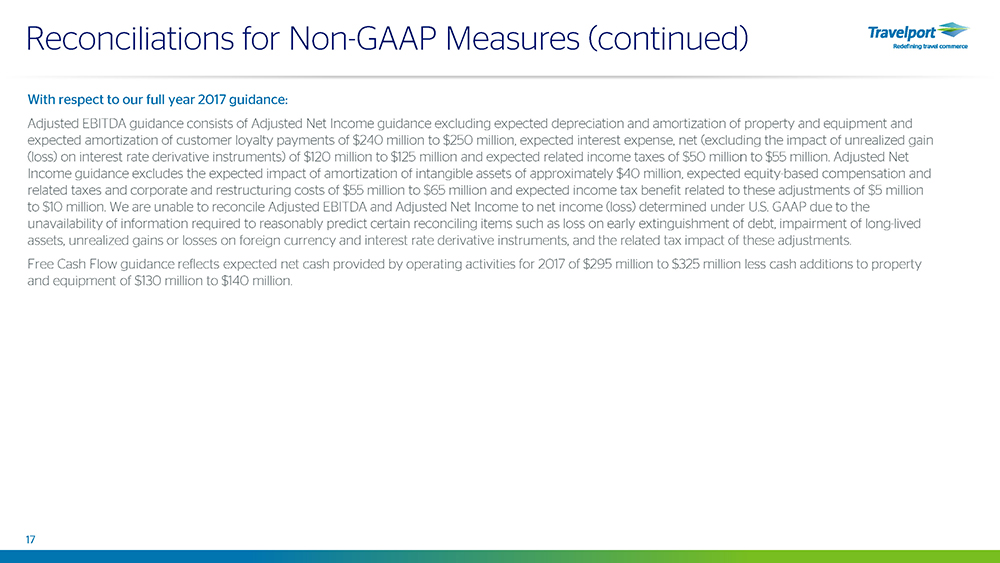
With respect to our full year 2017 guidance: Adjusted EBITDA guidance consists of Adjusted Net Income guidance excluding expected depreciation and amortization of propert y a nd equipment and expected amortization of customer loyalty payments of $240 million to $250 million, expected interest expense, net (excluding th e impact of unrealized gain (loss) on interest rate derivative instruments) of $120 million to $125 million and expected related income taxes of $50 mill ion to $55 million. Adjusted Net Income guidance excludes the expected impact of amortization of intangible assets of approximately $40 million, expected equi ty - based compensation and related taxes and corporate and restructuring costs of $55 million to $65 million and expected income tax benefit related to the se adjustments of $5 million to $10 million. We are unable to reconcile Adjusted EBITDA and Adjusted Net Income to net income (loss) determined under U.S. GA AP due to the unavailability of information required to reasonably predict certain reconciling items such as loss on early extinguishment o f d ebt, impairment of long - lived assets, unrealized gains or losses on foreign currency and interest rate derivative instruments, and the related tax impact o f t hese adjustments. Free Cash Flow guidance reflects expected net cash provided by operating activities for 2017 of $295 million to $325 million les s cash additions to property and equipment of $130 million to $140 million. Reconciliations for Non - GAAP Measures (continued) 17
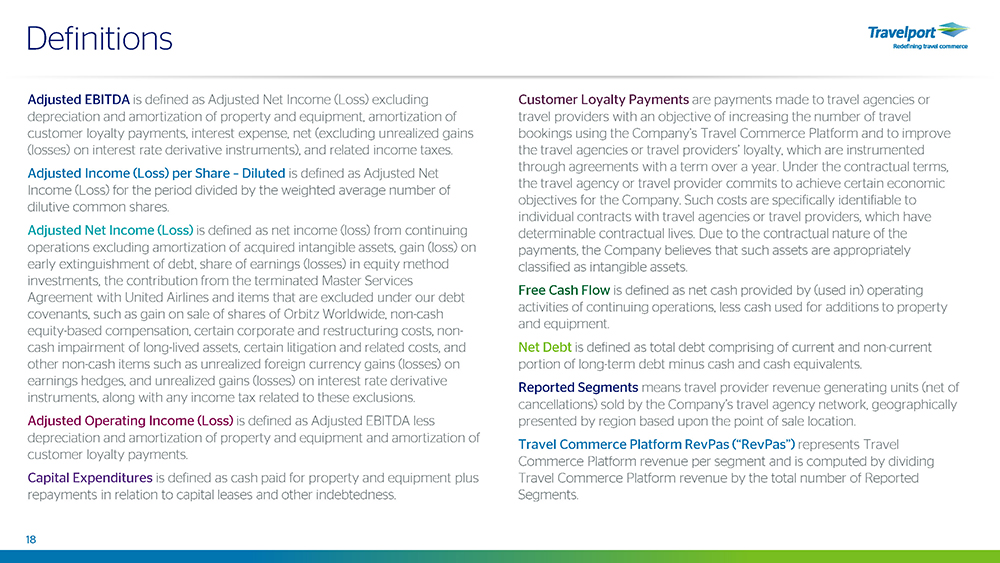
Definitions 18 Adjusted EBITDA is defined as Adjusted Net Income (Loss) excluding depreciation and amortization of property and equipment, amortization of customer loyalty payments, interest expense, net (excluding unrealized gains (losses) on interest rate derivative instruments), and related income taxes. Adjusted Income (Loss) per Share – Diluted is defined as Adjusted Net Income (Loss) for the period divided by the weighted average number of dilutive common shares. Adjusted Net Income (Loss) is defined as net income (loss) from continuing operations excluding amortization of acquired intangible assets, gain (loss) on early extinguishment of debt, share of earnings (losses) in equity method investments, the contribution from the terminated Master Services Agreement with United Airlines and items that are excluded under our debt covenants, such as gain on sale of shares of Orbitz Worldwide, non - cash equity - based compensation, certain corporate and restructuring costs, non - cash impairment of long - lived assets, certain litigation and related costs, and other non - cash items such as unrealized foreign currency gains (losses) on earnings hedges, and unrealized gains (losses) on interest rate derivative instruments, along with any income tax related to these exclusions. Adjusted Operating Income (Loss) is defined as Adjusted EBITDA less depreciation and amortization of property and equipment and amortization of customer loyalty payments. Capital Expenditures is defined as cash paid for property and equipment plus repayments in relation to capital leases and other indebtedness. Customer Loyalty Payments are payments made to travel agencies or travel providers with an objective of increasing the number of travel bookings using the Company’s Travel Commerce Platform and to improve the travel agencies or travel providers’ loyalty, which are instrumented through agreements with a term over a year. Under the contractual terms, the travel agency or travel provider commits to achieve certain economic objectives for the Company. Such costs are specifically identifiable to individual contracts with travel agencies or travel providers, which have determinable contractual lives. Due to the contractual nature of the payments, the Company believes that such assets are appropriately classified as intangible assets. Free Cash Flow is defined as net cash provided by (used in) operating activities of continuing operations, less cash used for additions to property and equipment. Net Debt is defined as total debt comprising of current and non - current portion of long - term debt minus cash and cash equivalents. Reported Segments means travel provider revenue generating units (net of cancellations) sold by the Company’s travel agency network, geographically presented by region based upon the point of sale location. Travel Commerce Platform RevPas (“ RevPas ”) represents Travel Commerce Platform revenue per segment and is computed by dividing Travel Commerce Platform revenue by the total number of Reported Segments.
We utilize non - GAAP (or adjusted) financial measures, including Adjusted EBITDA, Adjusted Operating Income (Loss), Adjusted Net Income (Loss) and Adjusted Net Income (Loss) per Share – diluted, to provide useful supplemental information to assist investors in understanding and assessing our performance and financial results on the same basis that management uses internally. These adjusted financial measures provide investors greater transparency w ith respect to key metrics used by management to evaluate our core operations, forecast future results, determine future capital investment allocations and unde rst and business trends within the industry. These metrics are also used by our Board of Directors to determine incentive compensation for future periods. Manag eme nt believes the adjusted financial measures assist investors in the comparison of financial results between periods as such measures exclude certain items that man agement believes are not reflective of our core operating performance consistent with how management reviews the business. Adjusted Net Income (Loss), Adjusted Net Income (Loss) per Share – diluted, Adjusted Operating Income (Loss) and Adjusted EBITDA are supplemental measures of operating performance that do not represent, and should not be considered as, alternatives to net income (loss) or net income (l oss) per share – diluted, as determined under U.S. GAAP. In addition, these measures may not be comparable to similarly named measures used by other compa nie s. We believe Adjusted Income (Loss) per Share - diluted is a useful measure for our investors as it represents, on a per share basis , our consolidated results, taking into account depreciation and amortization on property and equipment and amortization of customer loyalty payments, as well as oth er items which are not allocated to the operating businesses such as interest expense (excluding unrealized gains (losses) on interest rate derivative instrument s) and related income taxes but excluding the effects of certain expenses not directly tied to the core operations of our businesses. Adjusted Income (Loss) per Share - di luted has similar limitations as Adjusted Net Income (Loss), Adjusted Operating Income (Loss) and Adjusted EBITDA and may not be comparable to similarly named measures us ed by other companies. In addition, Adjusted Net Income (Loss) does not include all items that affect our net income (loss) and net income (loss) per s har e for the period. Therefore, we believe it is important to evaluate these measures along with our consolidated condensed statements of operations. We believe our important measure of liquidity is Free Cash Flow. This measure is useful indicator of our ability to generate cas h to meet our liquidity demands. We use Free Cash Flow to conduct and evaluate our operating liquidity. We believe it typically presents an alternate measure of cash fl ows since purchases of property and equipment are a necessary component of our ongoing operations and provides useful information regarding how cash provided by ope rating activities compares to the property and equipment investments required to maintain and grow our platform. We believe it provides investors with an und erstanding of how assets are performing and measures management’s effectiveness in managing cash. Free Cash Flow is non - GAAP measure and may not be comparab le to similarly named measures used by other companies. This measure has limitation in that it does not represent the total increase or decrease i n t he cash balance for the period, nor do they represent residual cash flow for discretionary expenditures. This measure should not be considered as measure of liquidi ty or cash flows from operations as determined under U.S. GAAP. Non - GAAP Financial M easures 19
We use Capital Expenditures to determine our total cash spent on acquisition of property and equipment and cash repayment of cap ital lease obligation and other indebtedness. We believe this measure provides management and investors an understanding of total capital invested in the dev elo pment of our platform. Capital Expenditures is a non - GAAP measure and may not be comparable to similarly named measures used by other entities. This measure ha s limitation in that it aggregates cash flows from investing and financing activities as determined under U.S. GAAP. Management uses Net Debt to review our overall liquidity, financial flexibility, capital structure and leverage. Further, we be lieve, certain debt rating agencies, creditors and credit analysts monitor our Net Debt as part of their assessment of our business. Net Debt is not a measurement of our i nde btedness under U.S. GAAP and should not be considered in isolation or as alternative to assess our total debt or any other measures derived in accordance wit h U.S. GAAP. These non - GAAP financial measures have limitations as analytical tools and should not be considered in isolation or as a substit ute for analysis of Travelport’s results as reported under U.S. GAAP. Non - GAAP Financial M easures (continued) 20