Attached files
| file | filename |
|---|---|
| 8-K - 8-K - Summit Hotel Properties, Inc. | a17-14004_18k.htm |
Exhibit 99.1
SUMMIT HOTEL PROPERTIES

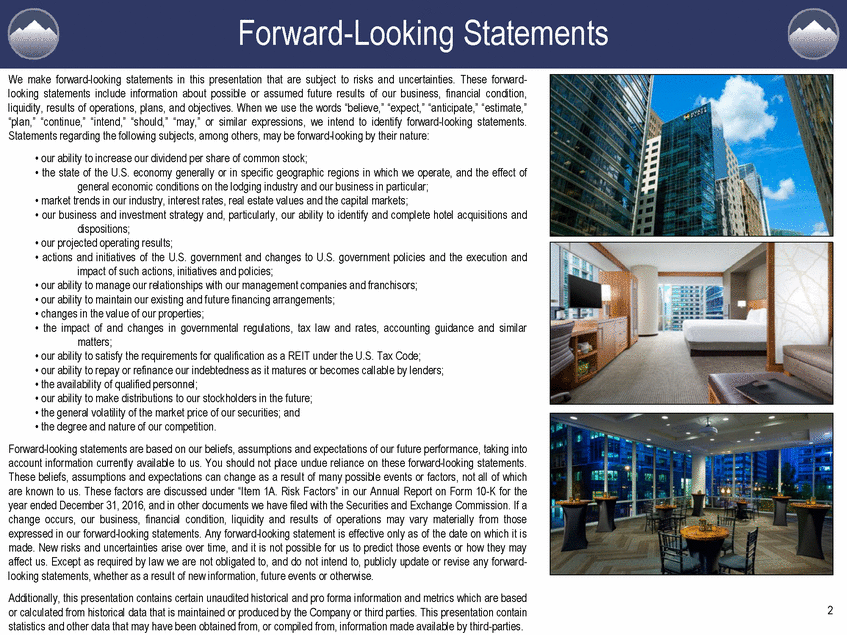
Forward-Looking Statements We make forward-looking statements in this presentation that are subject to risks and uncertainties. These forward-looking statements include information about possible or assumed future results of our business, financial condition, liquidity, results of operations, plans, and objectives. When we use the words “believe,” “expect,” “anticipate,” “estimate,” “plan,” “continue,” “intend,” “should,” “may,” or similar expressions, we intend to identify forward-looking statements. Statements regarding the following subjects, among others, may be forward-looking by their nature: • our ability to increase our dividend per share of common stock; • the state of the U.S. economy generally or in specific geographic regions in which we operate, and the effect of general economic conditions on the lodging industry and our business in particular; • market trends in our industry, interest rates, real estate values and the capital markets; • our business and investment strategy and, particularly, our ability to identify and complete hotel acquisitions and dispositions; • our projected operating results; • actions and initiatives of the U.S. government and changes to U.S. government policies and the execution and impact of such actions, initiatives and policies; • our ability to manage our relationships with our management companies and franchisors; • our ability to maintain our existing and future financing arrangements; • changes in the value of our properties; • the impact of and changes in governmental regulations, tax law and rates, accounting guidance and similar matters; • our ability to satisfy the requirements for qualification as a REIT under the U.S. Tax Code; • our ability to repay or refinance our indebtedness as it matures or becomes callable by lenders; • the availability of qualified personnel; • our ability to make distributions to our stockholders in the future; • the general volatility of the market price of our securities; and • the degree and nature of our competition. Forward-looking statements are based on our beliefs, assumptions and expectations of our future performance, taking into account information currently available to us. You should not place undue reliance on these forward-looking statements. These beliefs, assumptions and expectations can change as a result of many possible events or factors, not all of which are known to us. These factors are discussed under “Item 1A. Risk Factors” in our Annual Report on Form 10-K for the year ended December 31, 2016, and in other documents we have filed with the Securities and Exchange Commission. If a change occurs, our business, financial condition, liquidity and results of operations may vary materially from those expressed in our forward-looking statements. Any forward-looking statement is effective only as of the date on which it is made. New risks and uncertainties arise over time, and it is not possible for us to predict those events or how they may affect us. Except as required by law we are not obligated to, and do not intend to, publicly update or revise any forward-looking statements, whether as a result of new information, future events or otherwise. Additionally, this presentation contains certain unaudited historical and pro forma information and metrics which are based or calculated from historical data that is maintained or produced by the Company or third parties. This presentation contain statistics and other data that may have been obtained from, or compiled from, information made available by third-parties. 2
Agenda – Tuesday, May 23, 2017 Breakfast & Company Presentation Courtyard Convention Center Floor 2-A, Meeting Space BC 8:00 AM – 10:00 AM Property Tours 10:30 AM – 2:30 PM Hilton New Orleans/St. Charles Avenue 333 St. Charles Avenue 10:30 AM – 11:00 AM JW Marriott New Orleans 614 Canal Street 11:00 AM – 11:30 AM Courtyard New Orleans Downtown Near the French Quarter 124 St. Charles Avenue 11:30 AM – 12:00 PM Lunch @ Courtyard New Orleans Downtown Near the French Quarter 12:00 PM – 1:00 PM Courtyard New Orleans Metairie 2 Galleria Boulevard 1:30 PM – 2:00 PM Residence Inn New Orleans Metairie 3 Galleria Boulevard 2:00 PM – 2:30 PM 3
Table of Contents I. Company Overview II. Industry Overview III. Portfolio Overview IV. Asset Management Expertise V. Capital Allocation Strategy VI. Industry-Leading Results VII. New Orleans Market Update 4
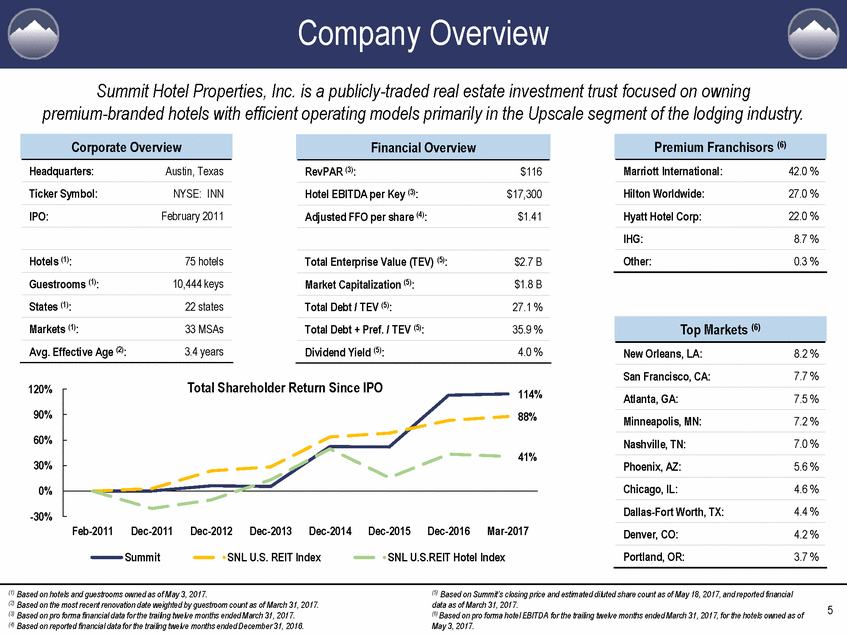
Company Overview Summit Hotel Properties, Inc. is a publicly-traded real estate investment trust focused on owning premium-branded hotels with efficient operating models primarily in the Upscale segment of the lodging industry. Total Shareholder Return Since IPO 120% 114% 88% 90% 60% 41% 30% 0% -30% Feb-2011Dec-2011 Dec-2012 Dec-2013 Dec-2014 Dec-2015 Dec-2016 Mar-2017 Summit SNL U.S. REIT Index SNL U.S.REIT Hotel Index (1) Based on hotels and guestrooms owned as of May 3, 2017. (2) Based on the most recent renovation date weighted by guestroom count as of March 31, 2017. (3) Based on pro forma financial data for the trailing twelve months ended March 31, 2017. (4) Based on reported financial data for the trailing twelve months ended December 31, 2016. (5) Based on Summit’s closing price and estimated diluted share count as of May 18, 2017, and reported financial data as of March 31, 2017. (6) Based on pro forma hotel EBITDA for the trailing twelve months ended March 31, 2017, for the hotels owned as of May 3, 2017. 5 Top Markets (6) New Orleans, LA: 8.2 % San Francisco, CA: 7.7 % Atlanta, GA: 7.5 % Minneapolis, MN: 7.2 % Nashville, TN: 7.0 % Phoenix, AZ: 5.6 % Chicago, IL: 4.6 % Dallas-Fort Worth, TX: 4.4 % Denver, CO: 4.2 % Portland, OR: 3.7 % Premium Franchisors (6) Marriott International: 42.0 % Hilton Worldwide: 27.0 % Hyatt Hotel Corp: 22.0 % IHG: 8.7 % Other: 0.3 % Financial Overview RevPAR (3): $116 Hotel EBITDA per Key (3): $17,300 Adjusted FFO per share (4): $1.41 Total Enterprise Value (TEV) (5): $2.7 B Market Capitalization (5): $1.8 B Total Debt / TEV (5): 27.1 % Total Debt + Pref. / TEV (5): 35.9 % Dividend Yield (5): 4.0 % Corporate Overview Headquarters: Austin, Texas Ticker Symbol: NYSE: INN IPO: February 2011 Hotels (1): 75 hotels Guestrooms (1): 10,444 keys States (1): 22 states Markets (1): 33 MSAs Avg. Effective Age (2): 3.4 years
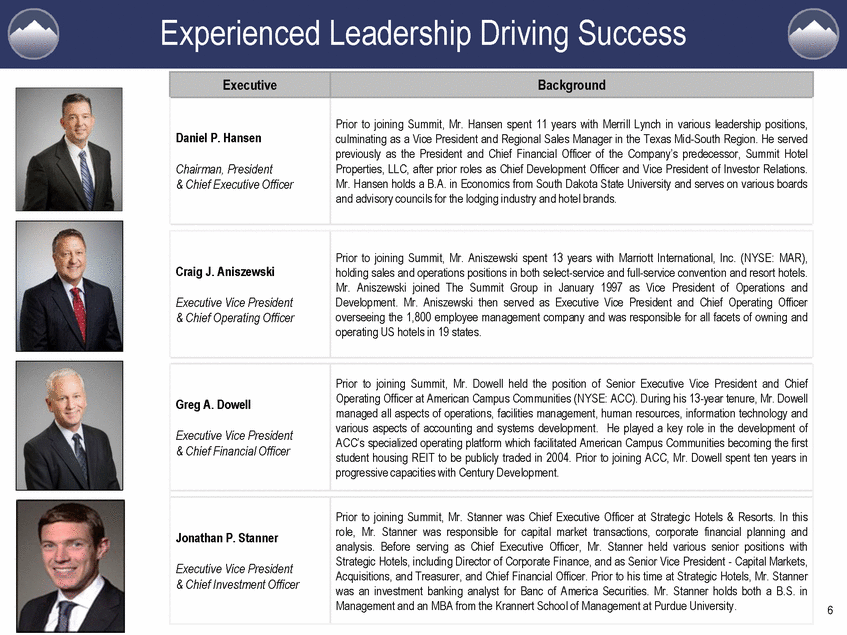
Experienced Leadership Driving Success managed all aspects of operations, facilities management, human resources, information technology and ACC’s specialized operating platform which facilitated American Campus Communities becoming the first analysis. Before serving as Chief Executive Officer, Mr. Stanner held various senior positions with Acquisitions, and Treasurer, and Chief Financial Officer. Prior to his time at Strategic Hotels, Mr. Stanner 6 Executive Background Daniel P. Hansen Chairman, President & Chief Executive Officer Prior to joining Summit, Mr. Hansen spent 11 years with Merrill Lynch in various leadership positions, culminating as a Vice President and Regional Sales Manager in the Texas Mid-South Region. He served previously as the President and Chief Financial Officer of the Company’s predecessor, Summit Hotel Properties, LLC, after prior roles as Chief Development Officer and Vice President of Investor Relations. Mr. Hansen holds a B.A. in Economics from South Dakota State University and serves on various boards and advisory councils for the lodging industry and hotel brands. Craig J. Aniszewski Executive Vice President & Chief Operating Officer Prior to joining Summit, Mr. Aniszewski spent 13 years with Marriott International, Inc. (NYSE: MAR), holding sales and operations positions in both select-service and full-service convention and resort hotels. Mr. Aniszewski joined The Summit Group in January 1997 as Vice President of Operations and Development. Mr. Aniszewski then served as Executive Vice President and Chief Operating Officer overseeing the 1,800 employee management company and was responsible for all facets of owning and operating US hotels in 19 states. Greg A. Dowell Executive Vice President & Chief Financial Officer Prior to joining Summit, Mr. Dowell held the position of Senior Executive Vice President and Chief Operating Officer at American Campus Communities (NYSE: ACC). During his 13-year tenure, Mr. Dowell various aspects of accounting and systems development. He played a key role in the development of student housing REIT to be publicly traded in 2004. Prior to joining ACC, Mr. Dowell spent ten years in progressive capacities with Century Development. Jonathan P. Stanner Executive Vice President & Chief Investment Officer Prior to joining Summit, Mr. Stanner was Chief Executive Officer at Strategic Hotels & Resorts. In this role, Mr. Stanner was responsible for capital market transactions, corporate financial planning and Strategic Hotels, including Director of Corporate Finance, and as Senior Vice President - Capital Markets, was an investment banking analyst for Banc of America Securities. Mr. Stanner holds both a B.S. in Management and an MBA from the Krannert School of Management at Purdue University.
Differentiated Investment Strategy TARGETED CAPITAL RECYCLING AND REINVESTMENT BRAND PARTNERS 7 INDUSTRY LEADING FOCUSED AND EFFICIENT OPERATING MODEL BROAD GEOGRAPHIC EBITDA DIVERSIFICATION UNCONFLICTED AND BEST-IN-CLASS OPERATORS
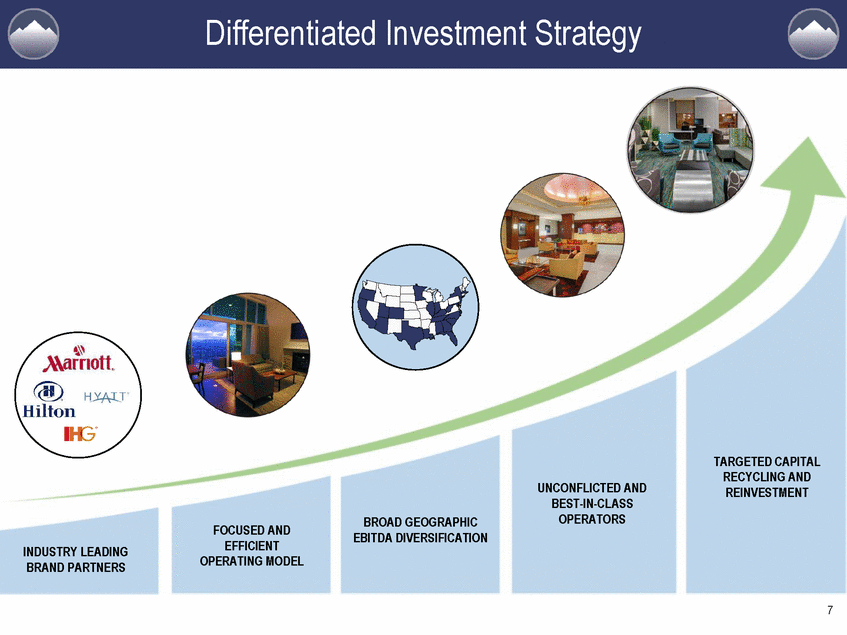
Table of Contents I. Company Overview II. Industry Overview III. Portfolio Overview IV. Asset Management Expertise V. Capital Allocation Strategy VI. Industry-Leading Results VII. New Orleans Market Update 8
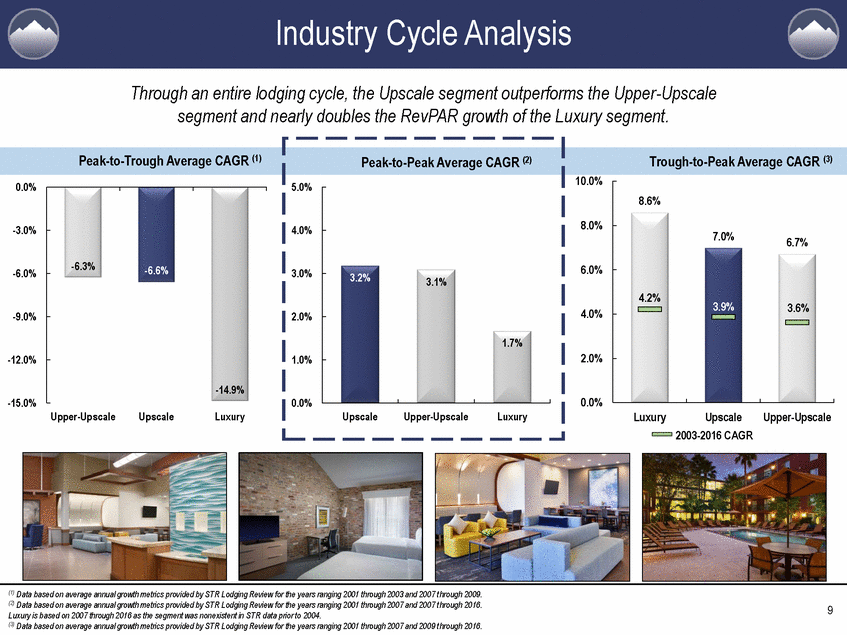
Industry Cycle Analysis Through an entire lodging cycle, the Upscale segment outperforms the Upper-Upscale segment and nearly doubles the RevPAR growth of the Luxury segment. Peak-to-Trough Average CAGR (1) Trough-to-Peak Average CAGR (3) 10.0% 0.0% 8.6% 8.0% -3.0% 7.0% 6.7% 6.0% -6.0% 3.2% 3.1% 4.2% 3.9% 3.6% 4.0% -9.0% 2.0% -12.0% -15.0% 0.0% Upper-Upscale Upscale Luxury Luxury Upscale 2003-2016 CAGR Upper-Upscale (1) Data based on average annual growth metrics provided by STR Lodging Review for the years ranging 2001 through 2003 and 2007 t hrough 2009. (2) Data based on average annual growth metrics provided by STR Lodging Review for the years ranging 2001 through 2007 and 2007 t hrough 2016. Luxury is based on 2007 through 2016 as the segment was nonexistent in STR data prior to 2004. (3) Data based on average annual growth metrics provided by STR Lodging Review for the years ranging 2001 through 2007 and 2009 t hrough 2016. 9 -6.3%-6.6% -14.9% Peak-to-Peak Average CAGR (2) 5.0% 4.0% 3.0% 2.0% 1.7% 1.0% 0.0% UpscaleUpper-UpscaleLuxury
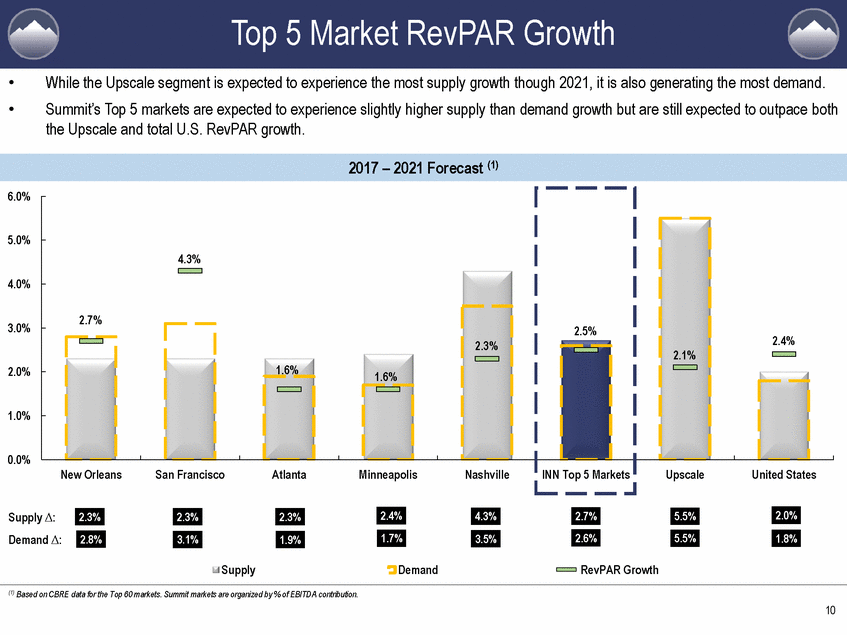
Top 5 Market RevPAR Growth While the Upscale segment is expected to experience the most supply growth though 2021, it is also generating the most demand. Summit’s Top 5 markets are expected to experience slightly higher supply than demand growth but are still expected to outpace both the Upscale and total U.S. RevPAR growth. • • 2017 – 2021 Forecast (1) 6.0% 5.0% 4.3% 4.0% 3.0% 1.6% 2.0% 1.6% 1.0% 0.0% San Francisco Atlanta Minneapolis Nashville United States 2.4% 1.7% 4.3% 3.5% 2.7% 2.6% 5.5% 5.5% 2.0% 1.8% Supply ∆: Demand ∆: 2.3% 2.8% 2.3% 3.1% 2.3% 1.9% Supply Demand RevPAR Growth (1) Based on CBRE data for the Top 60 markets. Summit markets are organized by % of EBITDA contribution. 10 2.5% 2.1% 2.4% 2.7% 2.3% New Orleans INN Top 5 Markets Upscale
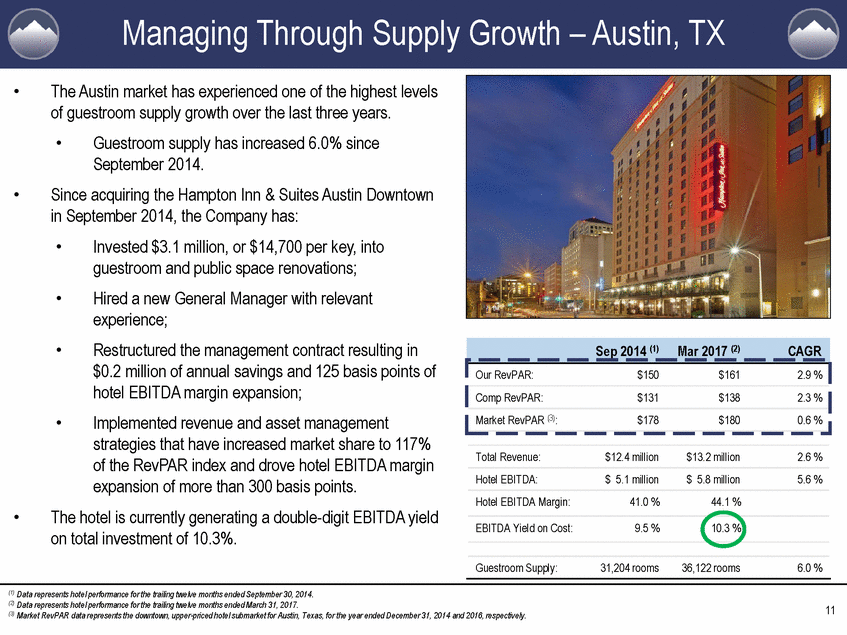
Managing Through Supply Growth – Austin, TX The Austin market has experienced one of the highest levels of guestroom supply growth over the last three years. • • Guestroom supply has increased 6.0% since September 2014. Since acquiring the Hampton Inn & Suites Austin Downtown in September 2014, the Company has: • • Invested $3.1 million, or $14,700 per key, into guestroom and public space renovations; Hired a new General Manager with relevant experience; Restructured the management contract resulting in $0.2 million of annual savings and 125 basis points of hotel EBITDA margin expansion; Implemented revenue and asset management strategies that have increased market share to 117% of the RevPAR index and drove hotel EBITDA margin expansion of more than 300 basis points. • • • • The hotel is currently generating a double-digit EBITDA yield on total investment of 10.3%. (1) Data represents hotel performance for the trailing twelve months ended September 30, 2014. (2) Data represents hotel performance for the trailing twelve months ended March 31, 2017. (3) Market RevPAR data represents the downtown, upper-priced hotel submarket for Austin, Texas, for the year ended December 31, 2014 and 2016, respectively. 11 Sep 2014 (1)Mar 2017 (2)CAGR Our RevPAR: $150 $161 2.9 % Comp RevPAR: $131 $138 2.3 % Market RevPAR (3): $178 $180 0.6 % Total Revenue: $12.4 million $13.2 million 2.6 % Hotel EBITDA: $ 5.1 million $ 5.8 million 5.6 % Hotel EBITDA Margin: 41.0 % 44.1 % EBITDA Yield on Cost: 9.5 % 10.3 % Guestroom Supply: 31,204 rooms 36,122 rooms 6.0 %
Evolving Guest Preference Summit believes guest preferences continue to shift favorably toward newer, cleaner, and more functional Upscale products that can offer guests an authentically local and convenient experience. Unnamed Full-Service Hyatt Product Hyatt Place Chicago Downtown-The Loop From dark and stuffy to modern functionality with natural light From full service to grab and go From antiquated business hubs and outdated spas to fitness centers promoting health and wellness 12
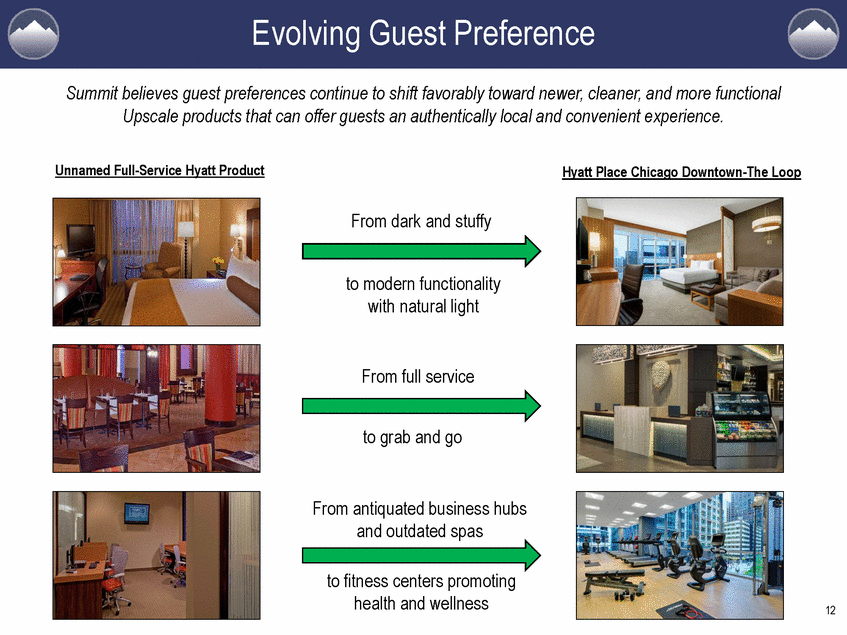
Table of Contents I. Company Overview II. Industry Overview III. Portfolio Overview IV. Asset Management Expertise V. Capital Allocation Strategy VI. Industry-Leading Results VII. New Orleans Market Update 13
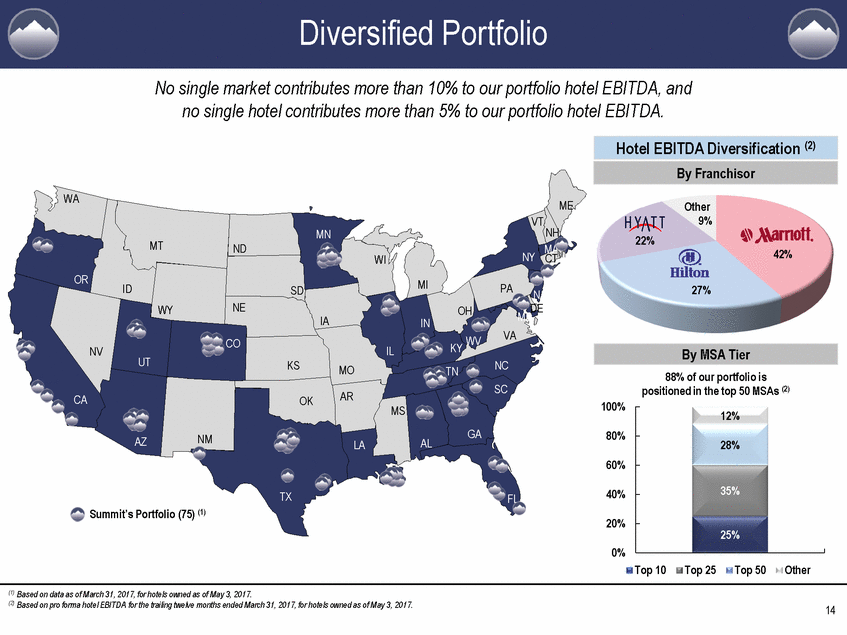
Diversified Portfolio No single market contributes more than 10% to our portfolio hotel EBITDA, and no single hotel contributes more than 5% to our portfolio hotel EBITDA. WA ME Other 9% VT NH CTRI MN 22% MT ND 42% NY WI OR MI PA ID SD 27% NJ NE DE MD WY OH IA VA WV CO NV IL UT KS NC SC MO TN 88% of our portfolio is positioned in the top 50 MSAs (2) AR CA OK 100% MS 12% GA 80% NM AZ AL LA 28% 60% 35% 40% TX FL Summit’s Portfolio (75) (1) 20% 25% 0% Top 10 Top 25 Top 50 Other (1) Based on data as of March 31, 2017, for hotels owned as of May 3, 2017. (2) Based on pro forma hotel EBITDA for the trailing twelve months ended March 31, 2017, for hotels owned as of May 3, 2017. 14 By MSA Tier Hotel EBITDA Diversification (2) By Franchisor
We Believe in the Value of Brands…Sort of We believe that brand recognition and an adherence to lodging standards drives guest loyalty, which in turn helps to increase occupancy, improve room rates, and create greater shareholder value. Global Brands Premium Standards With more than two million rooms globally, our partners enable us to serve both domestic and international travel. Exceptional service, ample amenities, and attractive design demonstrate award-winning quality. Customer Loyalty Reservation Systems Each brand maintains strong customer loyalty programs that incentivize recurring visits. Global booking systems enable guests to easily find and reserve accommodations. Brand Segmentation Our partners operate a diverse portfolio with many offerings across multiple chain scales. Over 55% of our portfolio is concentrated in brands that rank in the top five for guest satisfaction. (2) (1) Based on JD Power and Associates 2016 North America Guest Satisfaction Rankings. (2) Based on total number of hotels as of May 3, 2017. 15 #1 9 #2 6 #3 16 #4 10 #5 1 Brands Guests Trust JD Power and Associates Upscale Segment Guest Satisfaction Rankings (1) Brand Ranking Hotel Count
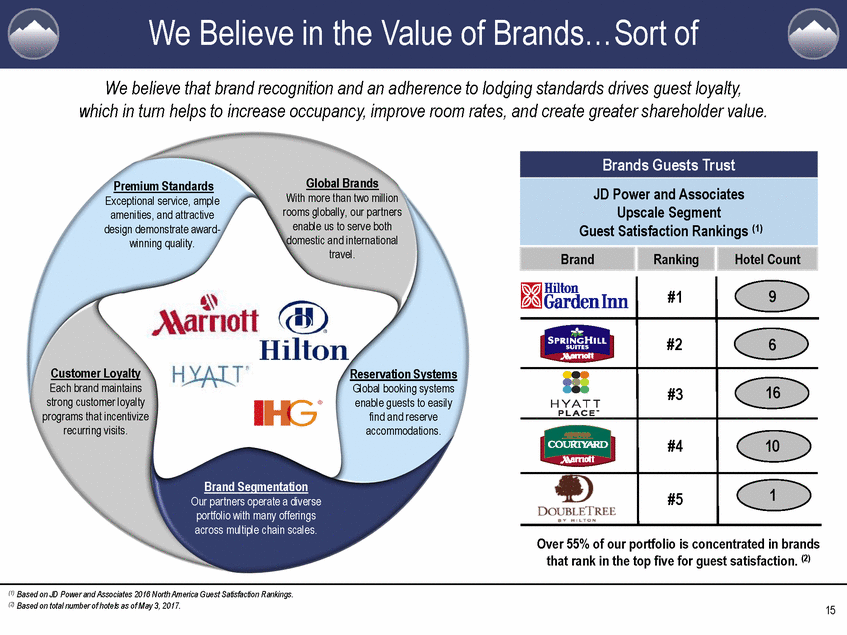
Table of Contents I. Company Overview II. Industry Overview III. Portfolio Overview IV. Asset Management Expertise V. Capital Allocation Strategy VI. Industry-Leading Results VII. New Orleans Market Update 16
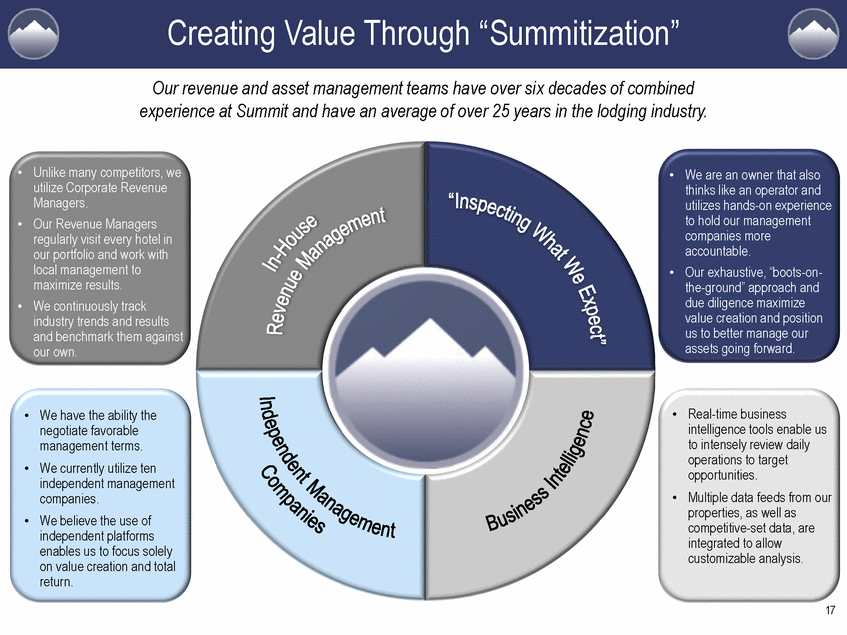
Creating Value Through “Summitization” Our revenue and asset management teams have over six decades of combined experience at Summit and have an average of over 25 years in the lodging industry. • Unlike many competitors, we utilize Corporate Revenue Managers. Our Revenue Managers regularly visit every hotel in our portfolio and work with local management to maximize results. We continuously track industry trends and results and benchmark them against our own. • We are an owner that also thinks like an operator and utilizes hands-on experience to hold our management companies more accountable. Our exhaustive, “boots-on-the-ground” approach and due diligence maximize value creation and position us to better manage our assets going forward. • • • • Real-time business intelligence tools enable us to intensely review daily operations to target opportunities. Multiple data feeds from our properties, as well as competitive-set data, are integrated to allow customizable analysis. • We have the ability the negotiate favorable management terms. We currently utilize ten independent management companies. We believe the use of independent platforms enables us to focus solely on value creation and total return. • • • 17
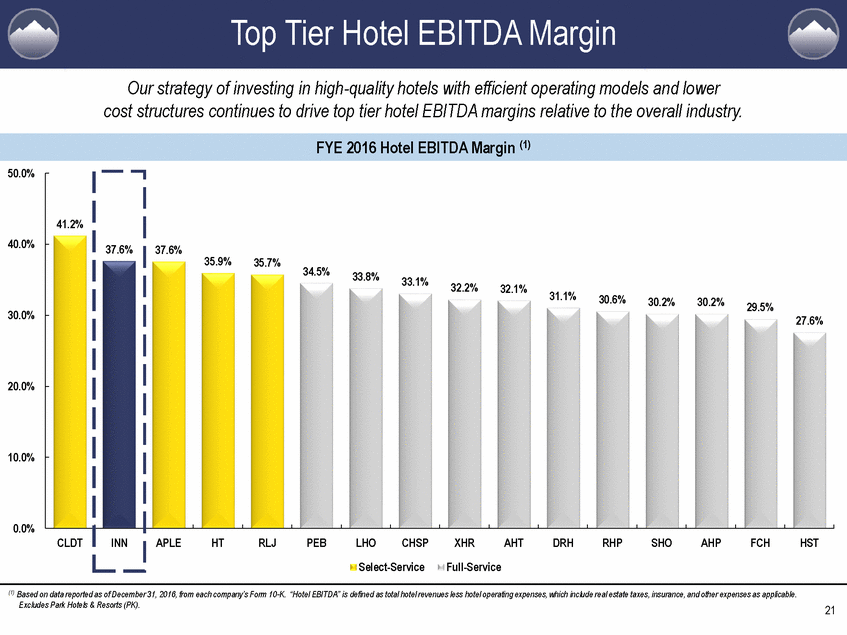
Revenue Management Summit has a staff of professionals with multi-property revenue management experience who lend expertise to our property managers to help reach each hotel’s maximum potential. Hotel Experience: • • Veteran team of “real hoteliers” with an average of 18 years of expertise Multi-brand, multi-property experience Combining Data and Expertise: • • Innovative revenue management platform Real-time booking data Historical Intelligence: • • Proprietary tools to evaluate hotel mix, source of business, and retail pricing Drill down capability on all hotels, brands, management companies, and regions Eyes to the Future: • • Our revenue management tool provides insight into supply and demand. “Fixing the mix:” market leaders in optimal pricing and mix of sales. 18
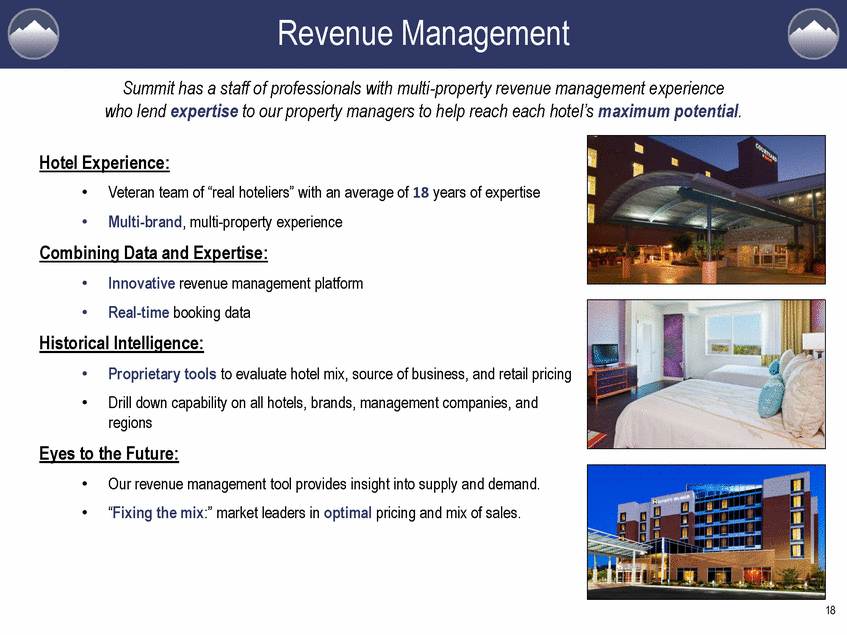
Upscale Outperformance We believe the outperformance of the Upscale segment is a direct result of an enhanced guest experience through continuous product evolution. Despite new supply, we expect a continuing shift in guest preference to Upscale hotels. STR Upscale RevPAR (1) STR Upper-Upscale RevPAR (1) $120 $150 $102 $133 $90 $125 +46% +18% $113 $70 $60 $100 2000 2016 2000 2016 (1) Based on Smith Travel Research Quarterly & Monthly Hotel Review as of the applicable years. 19
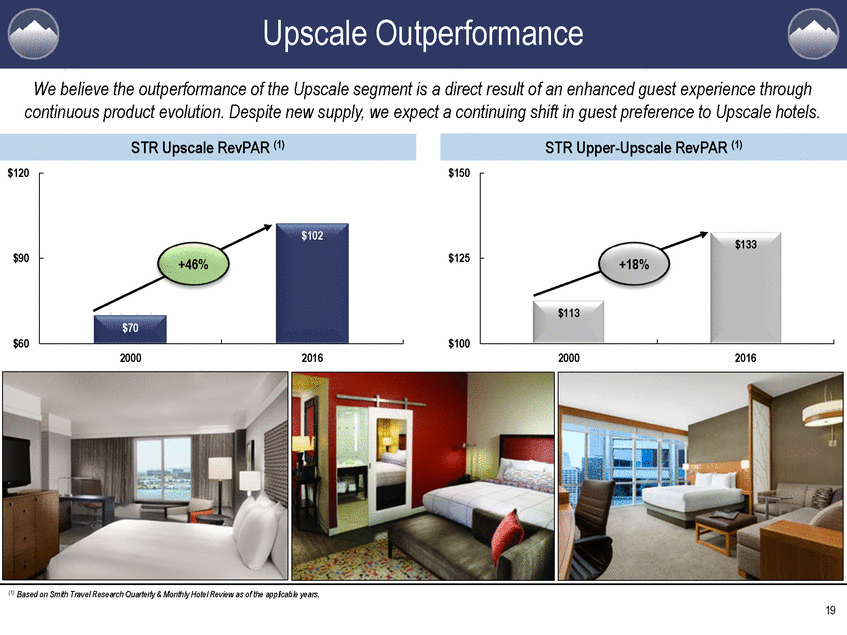
Track Record of Outperformance Our pro forma portfolio RevPAR growth has outperformed the STR Upscale RevPAR growth benchmark every year for the past five years by an average margin of 186 basis points. RevPAR Performance: Summit Pro Forma Portfolio vs. STR Upscale (1) 12.0% 10.9% 9.7% 10.0% 8.4% 8.0% 7.3% 7.5% 6.7% 186 bps 5.7% 5.3% 6.0% 5.6% 5.6% 3.8% 4.0% 2.1% 2.0% 0.0% 2012 2013 2014 2015 2016 Summit Pro Forma STR Upscale Summit Pro Forma Average STR Upscale Average (1) Based on Smith Travel Research Lodging Review and as reported pro forma RevPAR growth as of the applicable years. 20
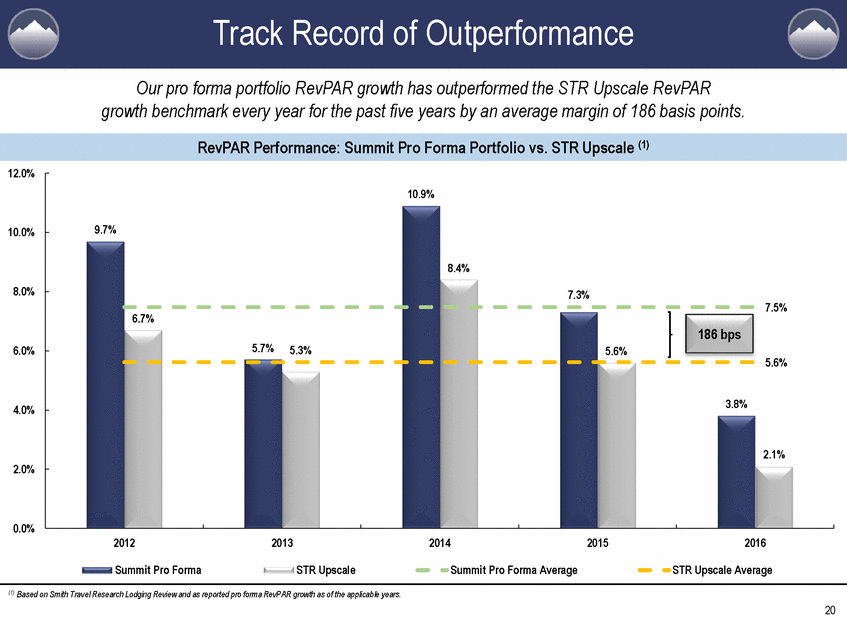
Top Tier Hotel EBITDA Margin Our strategy of investing in high-quality hotels with efficient operating models and lower cost structures continues to drive top tier hotel EBITDA margins relative to the overall industry. FYE 2016 Hotel EBITDA Margin (1) 50.0% 40.0% 35.9% 35.7% 32.2% 32.1% 31.1% 30.0% 20.0% 10.0% 0.0% HT RLJ PEB LHO CHSP XHR Full-Service AHT DRH RHP SHO AHP FCH HST Select-Service (1) Based on data reported as of December 31, 2016, from each company’s Form 10-K. “Hotel EBITDA” is defined as total hotel revenues less hotel operating expenses, which include real estate taxes, insurance, and other expenses as applicable. Excludes Park Hotels & Resorts (PK). 21 41.2% 37.6% 37.6% 34.5%33.8%33.1% 30.6%30.2%30.2%29.5% 27.6% CLDT INN APLE
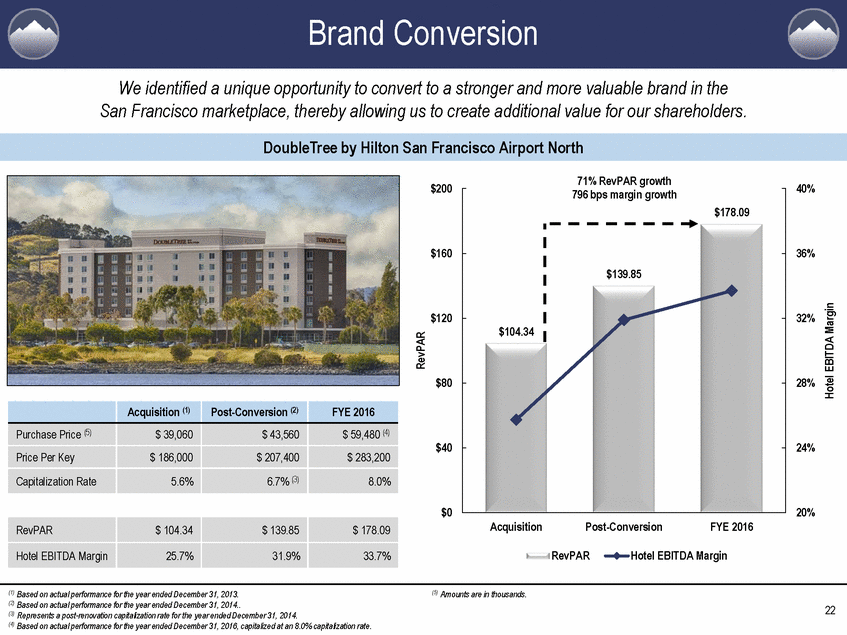
Brand Conversion We identified a unique opportunity to convert to a stronger and more valuable brand in the San Francisco marketplace, thereby allowing us to create additional value for our shareholders. DoubleTree by Hilton San Francisco Airport North 71% RevPAR growth $200 40% $160 36% $139.85 $120 32% $104.34 $80 28% $40 24% $0 20% Acquisition Post-Conversion FYE 2016 RevPAR Hotel EBITDA Margin (1) Based on actual performance for the year ended December 31, 2013. (2) Based on actual performance for the year ended December 31, 2014.. (3) Represents a post-renovation capitalization rate for the year ended December 31, 2014. (4) Based on actual performance for the year ended December 31, 2016, capitalized at an 8.0% capitalization rate. (5) Amounts are in thousands. 22 RevPAR Hotel EBITDA Margin Acquisition (1) Post-Conversion (2) FYE 2016 Purchase Price (5) $ 39,060 $ 43,560 $ 59,480 (4) Price Per Key $ 186,000 $ 207,400 $ 283,200 Capitalization Rate 5.6% 6.7% (3) 8.0% RevPAR $ 104.34 $ 139.85 $ 178.09 Hotel EBITDA Margin 25.7% 31.9% 33.7% 796 bps margin growth $178.09
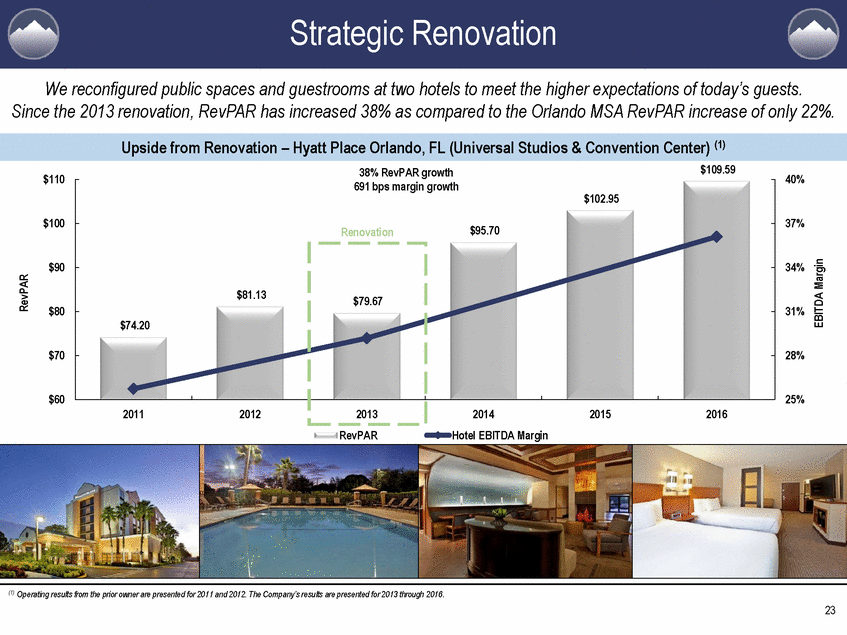
Strategic Renovation We reconfigured public spaces and guestrooms at two hotels to meet the higher expectations of today’s guests. Since the 2013 renovation, RevPAR has increased 38% as compared to the Orlando MSA RevPAR increase of only 22%. Upside from Renovation – Hyatt Place Orlando, FL (Universal Studios & Convention Center) (1) $109.59 38% RevPAR growth $110 40% $100 37% $90 34% $81.13 $80 31% $74.20 $70 28% $60 25% 2012 2015 2016 RevPAR Hotel EBITDA Margin (1) Operating results from the prior owner are presented for 2011 and 2012. The Company’s results are presented for 2013 through 2016. 23 RevPAR EBITDA Margin 691 bps margin growth $102.95 Renovation$95.70 $79.67 2011 2013 2014
Capturing Value We converted six two-bedroom suites into six one-bedroom suites and six standalone queen guestrooms. A seventh suite was added by converting an existing fitness center while repurposing a vacant outbuilding into a new fitness center. Guestroom Conversion – Hyatt House Miami, Florida Before – 1 Two-Bedroom Suites After – 1 Studio and 1 Standard Room (1) Based on the 2017E SNL Mean EBITDA Estimate from SNL Financial and the Company’s total enterprise value as of March 31, 2017. (2) Represents 2017E forecasted performance as of March 31, 2017. 24 Return on Investment Miami Hyatt House Hotel EBITDA per Key (2) $19,700 Renovation Cost per Key $99,600 Implied Cash-on-Cash Return 19.8% Implied Value Creation Miami Hyatt House Hotel EBITDA per Key (2) $19,700 Implied INN 2017E EBITDA Multiple (1) 13.7x Implied Value per Key $269,900 Guestrooms Added 7 rooms Implied Value Creation $1,889,300
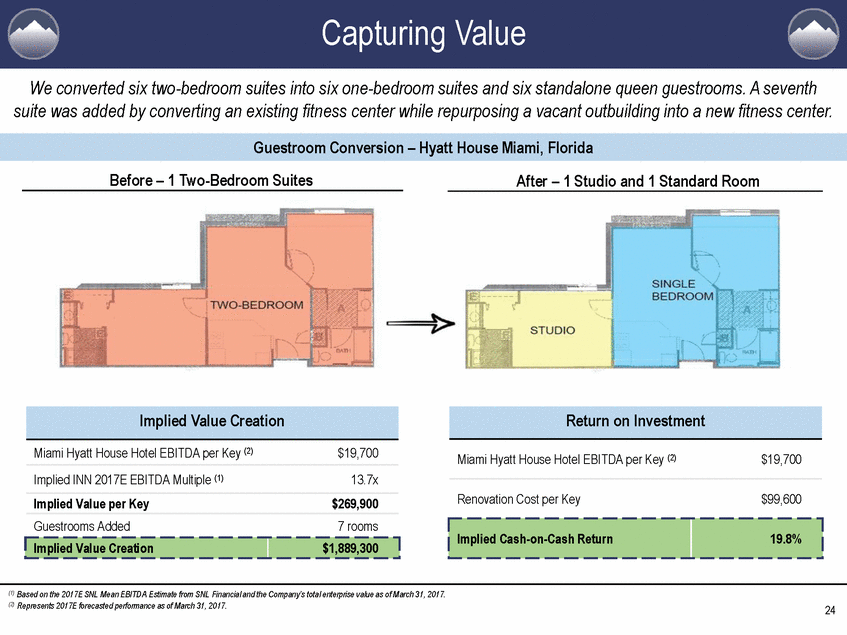
Table of Contents I. Company Overview II. Industry Overview III. Portfolio Overview IV. Asset Management Expertise V. Capital Allocation Strategy VI. Industry-Leading Results VII. New Orleans Market Update 25
Capital Allocation Strategy Acquisitions • “Markets That Matter” with favorable supply/demand dynamics and multiple demand generators Rooms focused business model Target strong RevPAR hotels relative to our existing portfolio Seek value-add opportunities (i.e. property renovations, brand conversions, management changes) • • • Dispositions • • Identify markets with unfavorable supply/demand dynamics Identify hotels with functional obsolescence or large capital needs that do not meet return thresholds Opportunistic in response to unsolicited offers • Select Development and Mezzanine Lending Activity • • Higher risk-adjusted returns Alternative pipeline for growth Conservative Balance Sheet • • • • Target leverage of 3.5x to 4.5x Net Debt to EBITDA Maintain and grow sustainable dividends Maintain liquidity and flexibility for acquisitive growth Manage maturities across multiple years to limit near-term liquidity risk 26
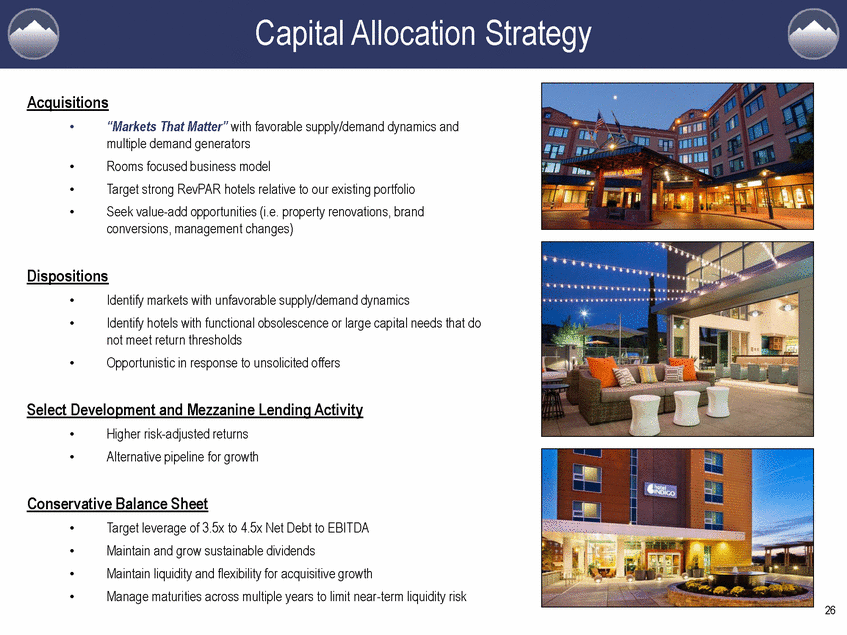
Timeline Since IPO • Since our IPO, we have sold 51 of our original 65 hotels and have averaged approximately 1.5 hotel transactions per month. Our transaction activity over the past six years increased our market capitalization $1.5 billion. • 27 2016 Acquisitions: $244.2 million Dispositions: 147.3 million Common Equity: $89.1 million Preferred Equity: $21.6 million 2014 Acquisitions: $214.7 million Dispositions: $19.8 million Common Equity: N/A Preferred Equity: N/A 2012 Acquisitions: $265.4 million Dispositions: $26.1 million Common Equity: $106.4 million Preferred Equity: $72.5 million YTD May 23, 2017 Acquisitions: $60.2 million Dispositions: $81.3 million Common Equity: $163.8 million Preferred Equity: N/A 2015 Acquisitions: $237.8 million Dispositions: $150.1 million Common Equity: N/A Preferred Equity: N/A 2013 Acquisitions: $475.6 million Dispositions: $50.3 million Common Equity: $300.1 million Preferred Equity: $81.7 million 2011 Acquisitions: $50.1 million Dispositions: N/A Common Equity: $240.8 million Preferred Equity: $47.9 million
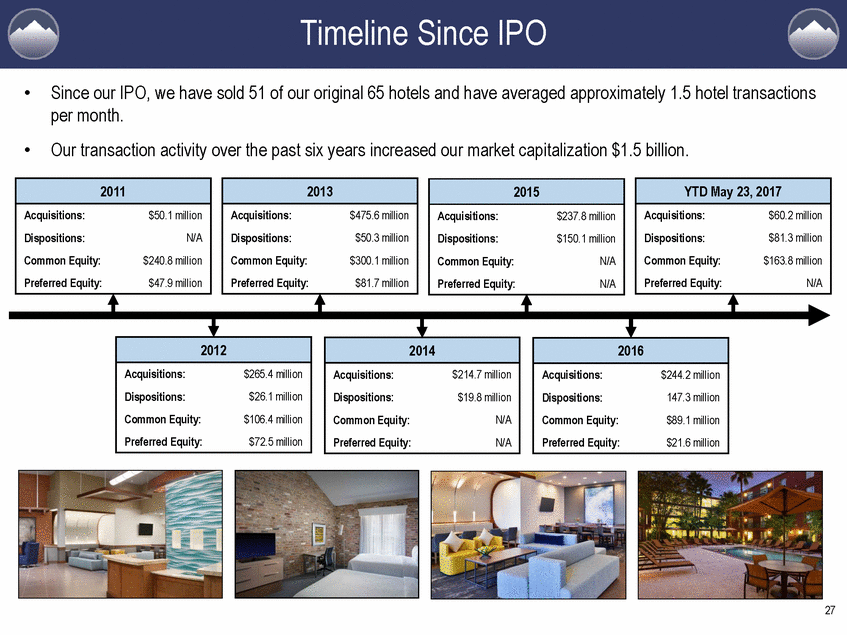
Courtyard by Marriott Fort Lauderdale Note: The Company entered into an agreement on April 11, 2017, to acquire the Courtyard Fort Lauderdale Beach for a purchase price of $85.0 million and is expected to complete the acquisition in the second quarter 2017. The acquisition is subject to the satisfaction of customary closing conditions, and the Company can give no assurance that the acquisition will close in the second quarter 2017 or at all. 28 Estimated Components of Value Value Per Key Hotel:$ 74,100,000$ 284,000 Vacant Land:$ 5,200,000$ 20,000 Retail:$ 5,700,000$ 22,000 Total:$ 85,000,000$ 326,000 Acquisition Overview Brand: Courtyard by Marriott Guestrooms: 261 keys Chain Scale: Upscale Ownership: Fee Simple Acquisition Date: 2nd Quarter 2017 Purchase Price: $ 85,000,000
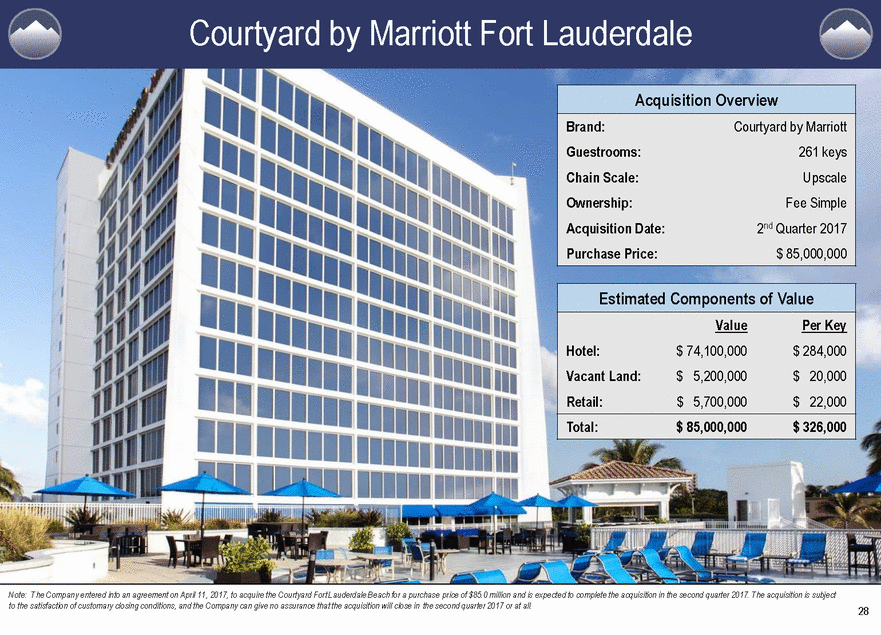
Courtyard by Marriott Fort Lauderdale (1) The metrics above represent management’s estimate of first year performance for the pending acquisition based on our due dili gence and underwriting activities, which included review and analysis of unaudited historical financial information provided by the proposed seller. 29 Financial Metrics (1) Hotel Only Total Investment Year 1 - NOI Cap Rate:8.5%7.8% Year 1 - EBITDA Multiple:10.6x11.6x Attractive Financial Metrics (1) Year 1 RevPAR estimate of $160 representing a 41% premium over the Company’s existing portfolio Year 1 Hotel EBITDA margin over 40% Renovation estimate of $1.6 million, or $6,300 per key, which represents only 1.9% of the purchase price Premier Oceanfront Location The hotel is ideally situated on Fort Lauderdale Beach and features scenic Atlantic Ocean and Intracoastal Waterway views. The Courtyard Fort Lauderdale Beach is the only premium-branded Upscale hotel on the water. The purchase includes a 0.8 acre vacant land parcel adjacent to the hotel which presents a future value creation opportunity.
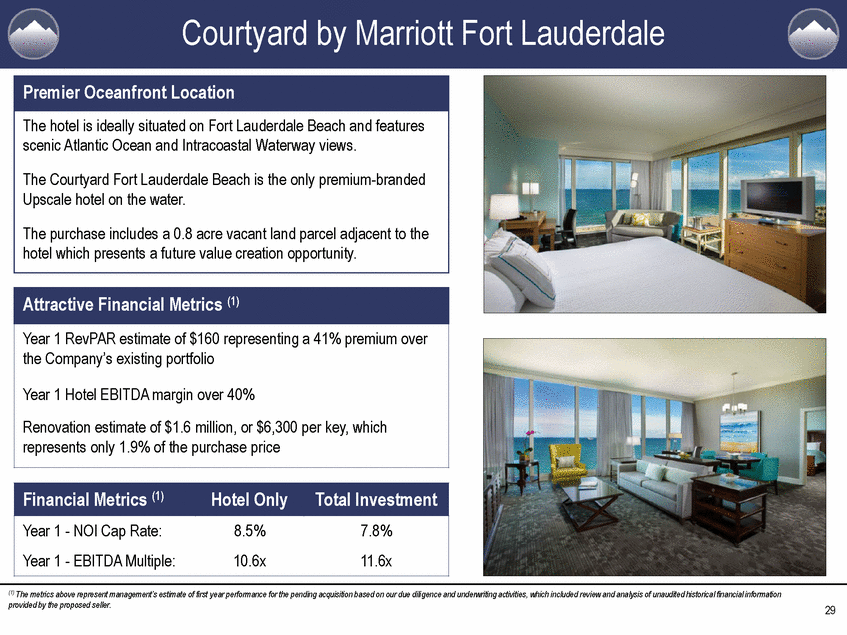
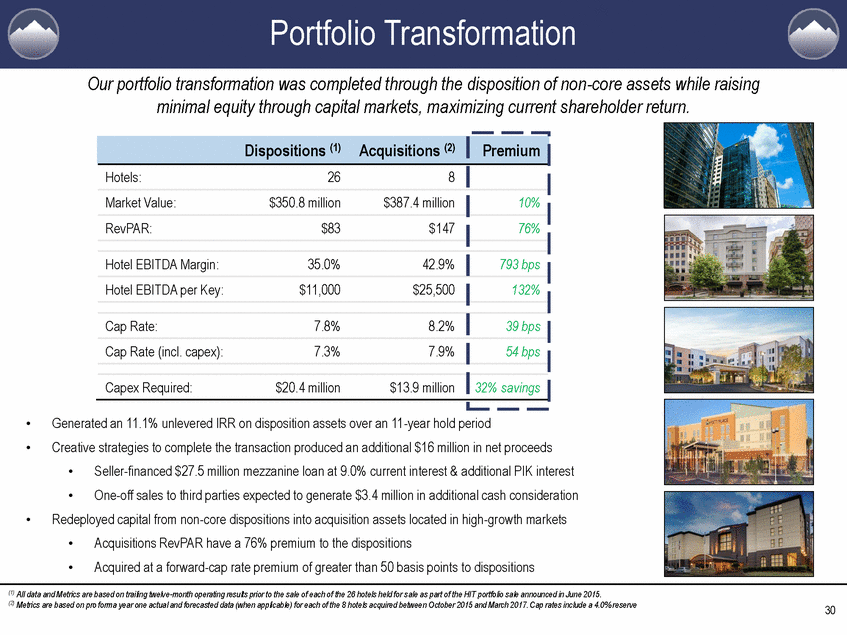
Portfolio Transformation Our portfolio transformation was completed through the disposition of non-core assets while raising minimal equity through capital markets, maximizing current shareholder return. • • Generated an 11.1% unlevered IRR on disposition assets over an 11-year hold period Creative strategies to complete the transaction produced an additional $16 million in net proceeds • • Seller-financed $27.5 million mezzanine loan at 9.0% current interest & additional PIK interest One-off sales to third parties expected to generate $3.4 million in additional cash consideration • Redeployed capital from non-core dispositions into acquisition assets located in high-growth markets • • Acquisitions RevPAR have a 76% premium to the dispositions Acquired at a forward-cap rate premium of greater than 50 basis points to dispositions (1) All data and Metrics are based on trailing twelve-month operating results prior to the sale of each of the 26 hotels held for sale as part of the HIT portfolio sale announced in June 2015. (2) Metrics are based on pro forma year one actual and forecasted data (when applicable) for each of the 8 hotels acquired betwee n October 2015 and March 2017. Cap rates include a 4.0% reserve 30 Dispositions (1) Acquisitions (2) Premium Hotels: 26 8 Market Value: $350.8 million $387.4 million 10% RevPAR: $83 $147 76% Hotel EBITDA Margin: 35.0% 42.9% 793 bps Hotel EBITDA per Key: $11,000 $25,500 132% Cap Rate: 7.8% 8.2% 39 bps Cap Rate (incl. capex): 7.3% 7.9% 54 bps Capex Required: $20.4 million $13.9 million 32% savings
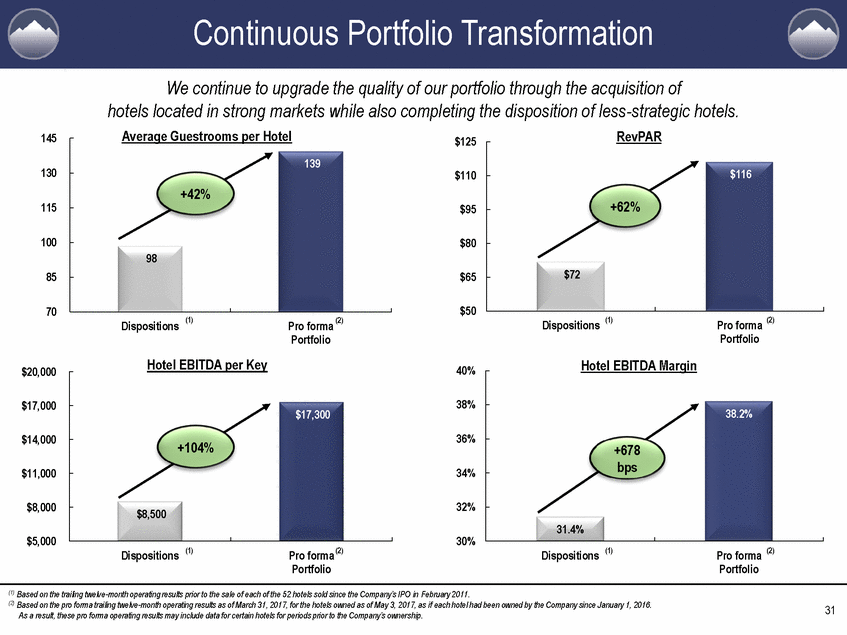
Continuous Portfolio Transformation We continue to upgrade the quality of our portfolio through the acquisition of hotels located in strong markets while also completing the disposition of less-strategic hotels. Average Guestrooms per Hotel RevPAR 145 $125 139 130 $116 $110 +42% +62% 115 $95 100 $80 98 $72 85 $65 $50 70 (1) (2) Pro forma Portfolio Dispositions (1) Pro forma (2) Portfolio Dispositions Hotel EBITDA per Key Hotel EBITDA Margin 40% $20,000 38% $17,000 38.2% $17,300 36% $14,000 +104% +678 bps 34% $11,000 32% $8,000 $8,500 31.4% 30% $5,000 (1) Pro forma (2) Portfolio (1) Pro forma (2) Portfolio Dispositions Dispositions (1) Based on the trailing twelve-month operating results prior to the sale of each of the 52 hotels sold since the Company’s IPO in February 2011. (2) Based on the pro forma trailing twelve-month operating results as of March 31, 2017, for the hotels owned as of May 3, 2017, as if each hotel had been owned by the Company since January 1, 2016. As a result, these pro forma operating results may include data for certain hotels for periods prior to the Company’s owner ship. 31
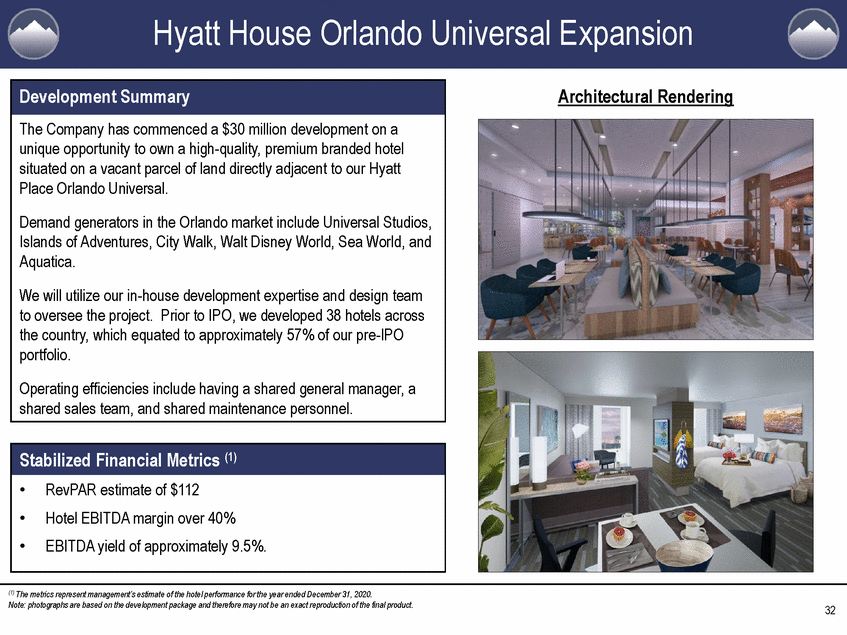
Hyatt House Orlando Universal Expansion Architectural Rendering (1) The metrics represent management’s estimate of the hotel performance for the year ended December 31, 2020. Note: photographs are based on the development package and therefore may not be an exact reproduction of the final product. 32 Stabilized Financial Metrics (1) •RevPAR estimate of $112 •Hotel EBITDA margin over 40% •EBITDA yield of approximately 9.5%. Development Summary The Company has commenced a $30 million development on a unique opportunity to own a high-quality, premium branded hotel situated on a vacant parcel of land directly adjacent to our Hyatt Place Orlando Universal. Demand generators in the Orlando market include Universal Studios, Islands of Adventures, City Walk, Walt Disney World, Sea World, and Aquatica. We will utilize our in-house development expertise and design team to oversee the project. Prior to IPO, we developed 38 hotels across the country, which equated to approximately 57% of our pre-IPO portfolio. Operating efficiencies include having a shared general manager, a shared sales team, and shared maintenance personnel.
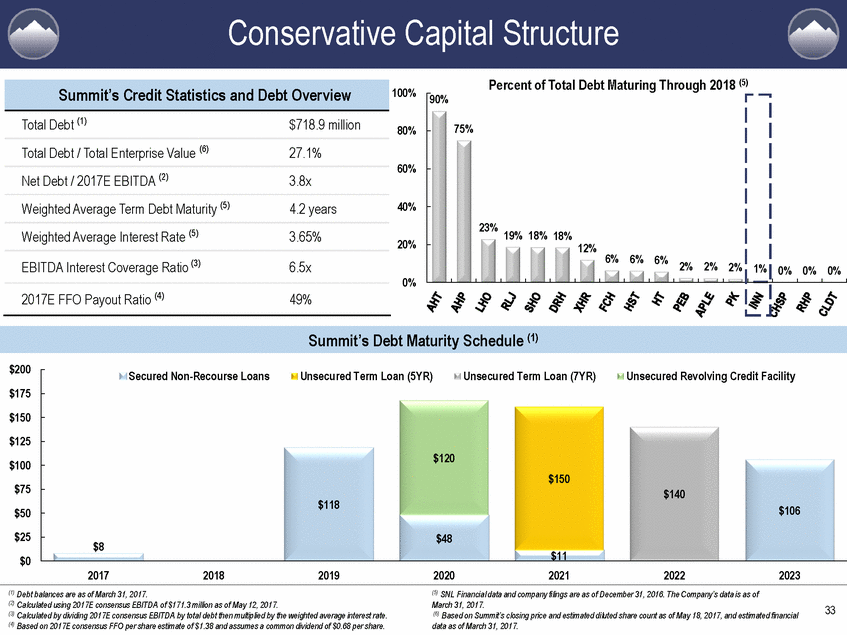
Conservative Capital Structure Percent of Total Debt Maturing Through 2018 (5) 100% 80% 60% 40% 23% 19% 18% 18% 20% 6% 6% 6% 2% 2% 2% 0% Summit’s Debt Maturity Schedule (1) $200 $175 $150 Secured Non-Recourse Loans Unsecured Term Loan (5YR) Unsecured Term Loan (7YR) Unsecured Revolving Credit Facility $125 $100 $75 $120 $150 $140 $118 $106 $50 $25 $0 $48 $8 $11 2017 2018 2019 2020 2021 2022 2023 (1) Debt balances are as of March 31, 2017. (2) Calculated using 2017E consensus EBITDA of $171.3 million as of May 12, 2017. (3) Calculated by dividing 2017E consensus EBITDA by total debt then multiplied by the weighted average interest rate. (4) Based on 2017E consensus FFO per share estimate of $1.38 and assumes a common dividend of $0.68 per share. (5) SNL Financial data and company filings are as of December 31, 2016. The Company’s data is as of March 31, 2017. (6) Based on Summit’s closing price and estimated diluted share count as of May 18, 2017, and estimated financial data as of March 31, 2017. 33 90% 75% 1% 0% 0% 0% 12% Summit’s Credit Statistics and Debt Overview Total Debt (1) $718.9 million Total Debt / Total Enterprise Value (6) 27.1% Net Debt / 2017E EBITDA (2) 3.8x Weighted Average Term Debt Maturity (5) 4.2 years Weighted Average Interest Rate (5) 3.65% EBITDA Interest Coverage Ratio (3) 6.5x 2017E FFO Payout Ratio (4) 49%
Well-Covered Dividend Our portfolio of high-quality hotels continues to generate strong free cash flow, which has afforded us the opportunity to increase our common dividend by 45% over the past three years while still maintaining a conservative payout ratio. (1) Current Dividend Yield (2) 10.0% 7.8% 8.0% 7.0% 6.9% 6.8% 6.6% 6.4% 6.4% 6.3% 6.2% 6.1% 6.0% 5.1% 4.9% 4.6% 4.4% 4.4% 4.0% 3.4% 4.0% 2.0% 0.0% (4) SHO AHT CHSP CLDT PK RLJ AHP APLE LHO XHR HT RHP PEB DRH HST INN FCH Dividend Payout Ratio (3) 100% 74% 80% 69% 67% 62% 61% 61% 60% 58% 58% 54% 60% 51% 50% 49% 48% 39% 40% 33% 27% 20% 0% (4) SHOXHR CHSP LHO APLE PK PEB CLDT RHP RLJ DRH HT INN HST AHP AHT FCH (1) Based on the Company’s Q4 2014 annualized dividend of $0.47 per share and the current annualized dividend of $0.68 per share. (2) SNL Financial data is based on the closing price of each company on May 18, 2017. (3) SNL Financial data is based on the 2017E S&P CapIQ Mean FFO per share estimate for each individual company. (4) Sunstone Hotel Investors, Inc. (SHO) annual dividend is based on the full-year dividend of $0.68 per share. This includes the special dividend paid within the year. 34
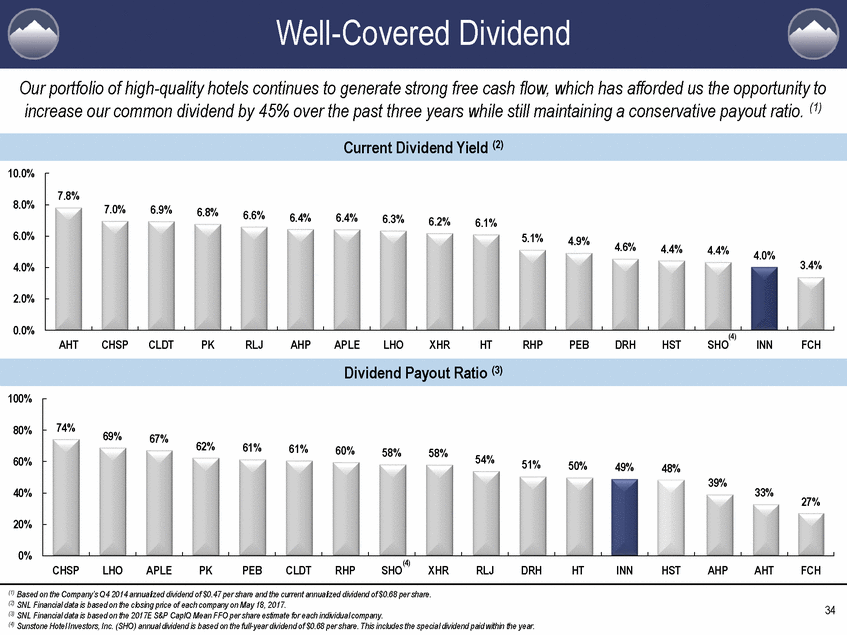
Table of Contents I. Company Overview II. Industry Overview III. Portfolio Overview IV. Asset Management Expertise V. Capital Allocation Strategy VI. Industry-Leading Results VII. New Orleans Market Update 35
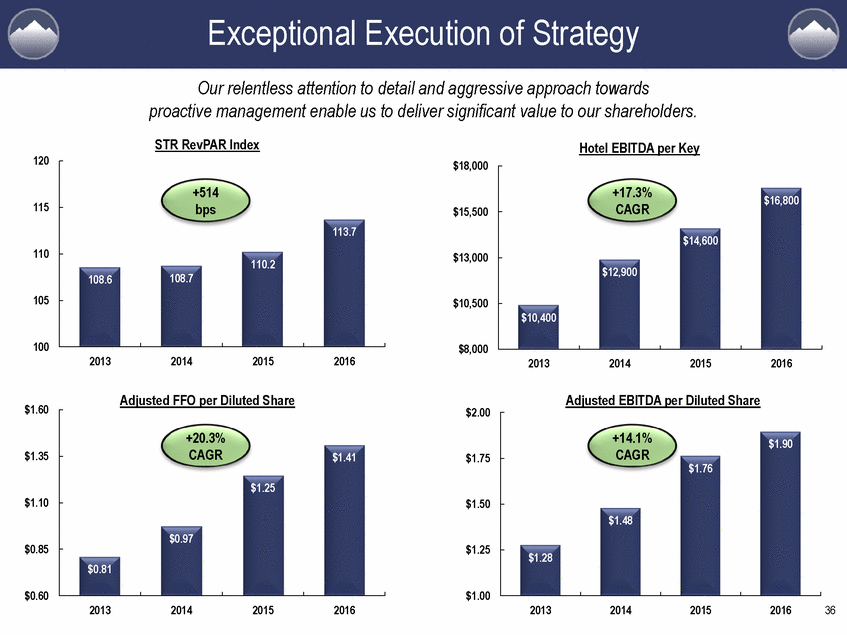
Exceptional Execution of Strategy Our relentless attention to detail and aggressive approach towards proactive management enable us to deliver significant value to our shareholders. STR RevPAR Index Hotel EBITDA per Key 120 $18,000 +514 bps +17.3% CAGR $16,800 115 $15,500 113.7 $14,600 110 $13,000 110.2 $12,900 108.7 108.6 105 $10,500 $10,400 100 $8,000 2013 2014 2015 2016 2013 2014 2015 2016 Adjusted FFO per Diluted Share Adjusted EBITDA per Diluted Share $1.60 $2.00 +20.3% CAGR +14.1% CAGR $1.90 $1.35 $1.41 $1.75 $1.76 $1.25 $1.10 $1.50 $1.48 $0.97 $0.85 $1.25 $1.28 $0.81 $0.60 $1.00 2013 2014 2015 2016 2013 2014 2015 2016 36
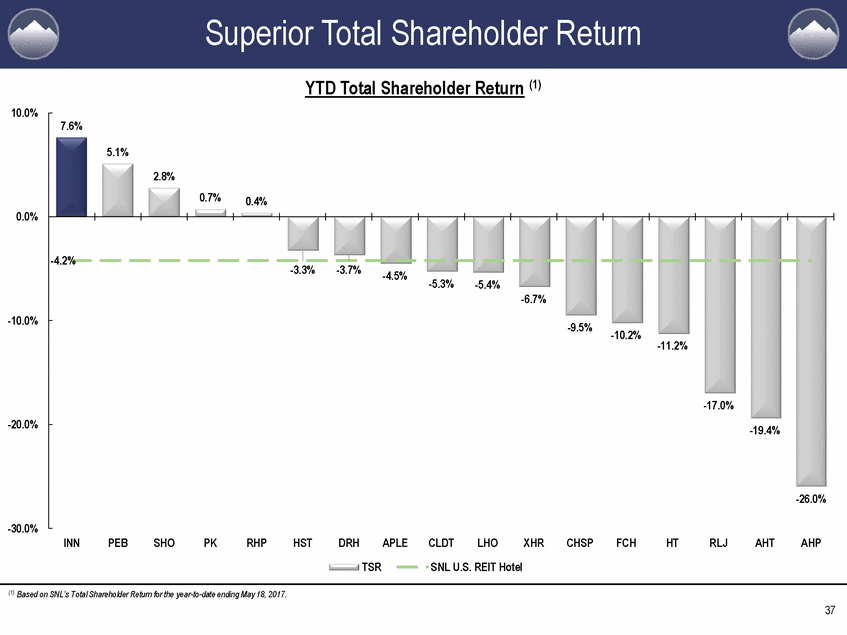
Superior Total Shareholder Return YTD Total Shareholder Return (1) 10.0% 7.6% 5.1% 2.8% 0.7% 0.4% 0.0% -3.3% -3.7% -4.5% -10.0% -9.5% -10.2% -11.2% -17.0% -20.0% -19.4% -26.0% -30.0% INN PEB SHO PK RHP HST DRH APLE CLDT LHO XHR CHSP FCH HT RLJ AHT AHP TSR SNL U.S. REIT Hotel (1) Based on SNL’s Total Shareholder Return for the year-to-date ending May 18, 2017. 37 -4.2% -5.3%-5.4% -6.7%
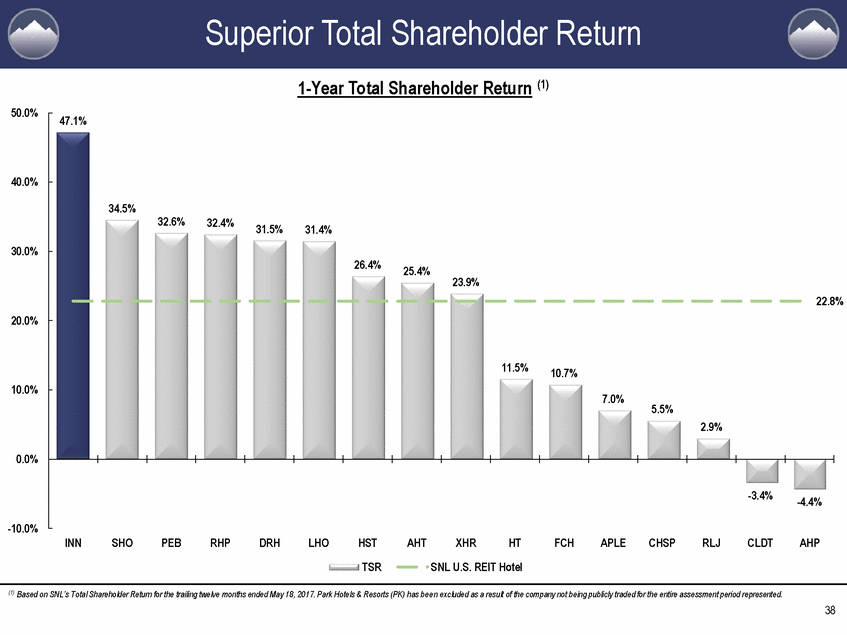
Superior Total Shareholder Return 1-Year Total Shareholder Return (1) 50.0% 47.1% 40.0% 34.5% 32.6% 32.4% 31.5% 31.4% 30.0% 26.4% 25.4% 23.9% 22.8% 20.0% 11.5% 10.7% 10.0% 7.0% 5.5% 2.9% 0.0% -10.0% INN SHO PEB RHP DRH LHO HST TSR AHT XHR HT FCH APLE CHSP RLJ CLDT AHP SNL U.S. REIT Hotel (1) Based on SNL’s Total Shareholder Return for the trailing twelve months ended May 18, 2017. Park Hotels & Resorts (PK) has bee n excluded as a result of the company not being publicly traded for the entire assessment period represented. 38 -3.4%-4.4%
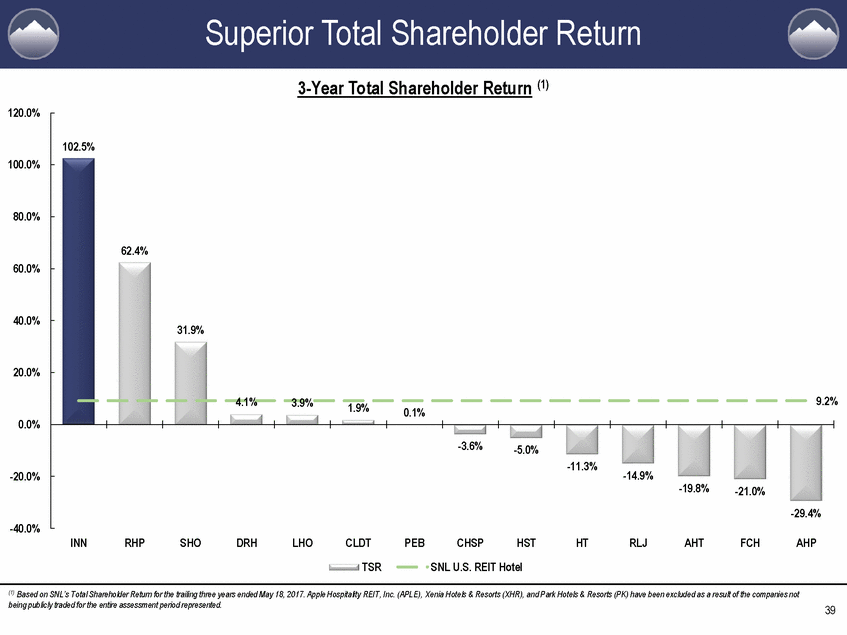
Superior Total Shareholder Return 3-Year Total Shareholder Return (1) 120.0% 102.5% 100.0% 80.0% 62.4% 60.0% 40.0% 31.9% 20.0% 9.2% 4.1% 3.9% 1.9% 0.1% 0.0% -20.0% -14.9% -19.8% -21.0% -29.4% -40.0% INN RHP SHO DRH LHO CLDT TSR PEB CHSP HST HT RLJ AHT FCH AHP SNL U.S. REIT Hotel (1) Based on SNL’s Total Shareholder Return for the trailing three years ended May 18, 2017. Apple Hospitality REIT, Inc. (APLE), Xenia Hotels & Resorts (XHR), and Park Hotels & Resorts (PK) have been excluded as a result of the companies not being publicly traded for the entire assessment period represented. 39 -3.6%-5.0% -11.3%
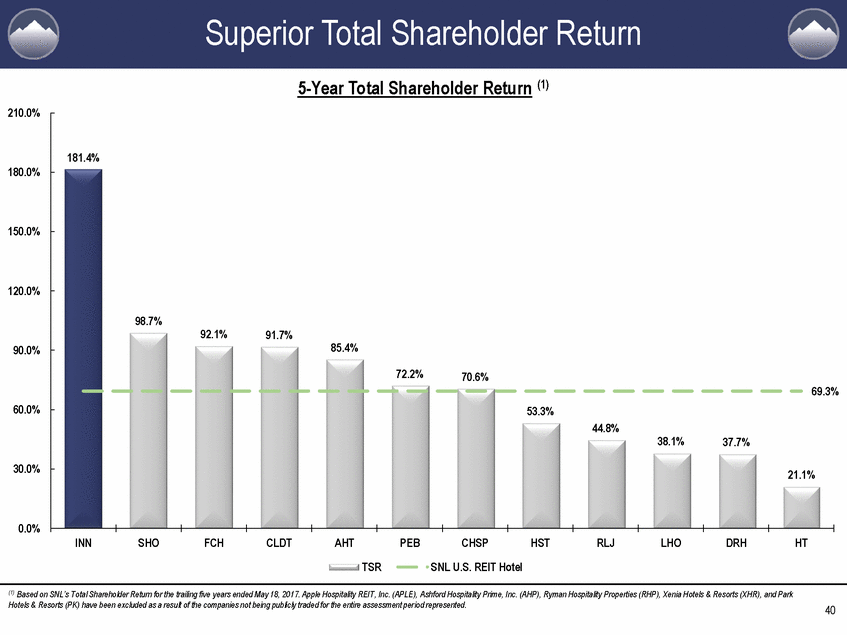
Superior Total Shareholder Return 5-Year Total Shareholder Return (1) 210.0% 181.4% 180.0% 150.0% 120.0% 98.7% 92.1% 91.7% 85.4% 90.0% 72.2% 70.6% 69.3% 60.0% 53.3% 44.8% 38.1% 37.7% 30.0% 21.1% 0.0% INN SHO FCH CLDT AHT PEB CHSP SNL U.S. REIT Hotel HST RLJ LHO DRH HT TSR (1) Based on SNL’s Total Shareholder Return for the trailing five years ended May 18, 2017. Apple Hospitality REIT, Inc. (APLE), Ashford Hospitality Prime, Inc. (AHP), Ryman Hospitality Properties (RHP), Xenia Hotels & Resorts (XHR), and Park Hotels & Resorts (PK) have been excluded as a result of the companies not being publicly traded for the entire assessment per iod represented. 40
Superior Total Shareholder Return Total Shareholder Return Since Summit IPO (1) 150.0% 128.0% 120.0% 90.0% 78.7% 70.6% 69.1% 60.0% 54.9% 41.7% 37.3% 29.2% 30.0% 12.9% 10.9% 0.0% -30.0% INN SHO PEB CHSP CLDT TSR AHT LHO DRH HST FCH HT SNL U.S. REIT Hotel (1) Based on SNL’s Total Shareholder Return from beginning February 11, 2011, and ended May 18, 2017. Apple Hospitality REIT, Inc . (APLE), Ashford Hospitality Prime, Inc. (AHP), Ryman Hospitality Properties (RHP), Xenia Hotels & Resorts (XHR), RLJ Lodging Trust (RLJ), and Park Hotels & Resorts (PK) have been excluded as a result of the companies not being publ icly traded for the entire assessment period represented. 41 -3.2% -8.9%
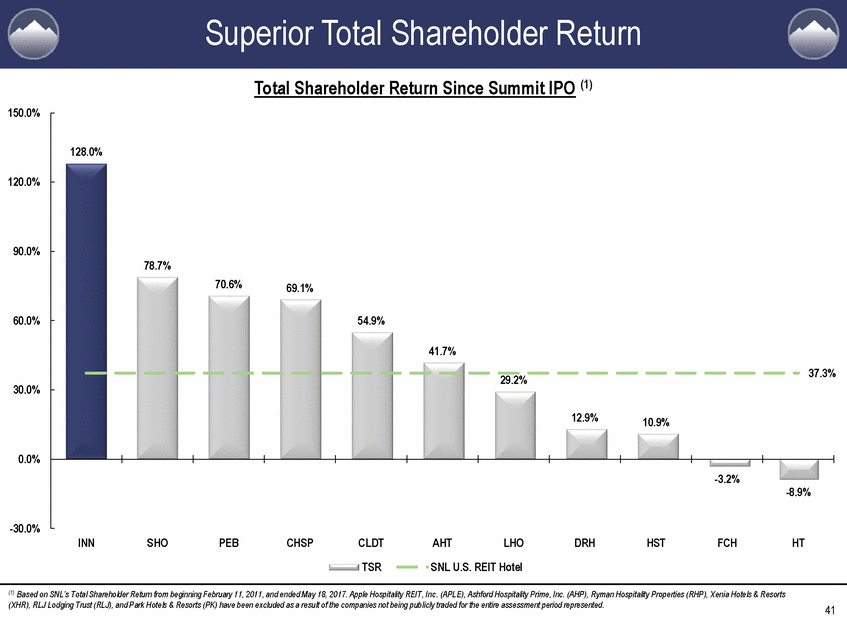
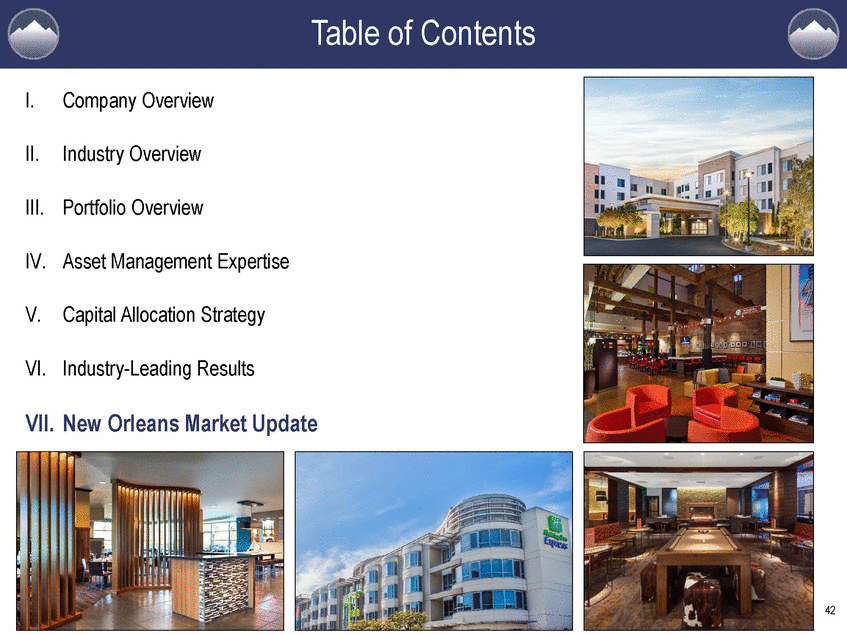
Table of Contents I. Company Overview II. Industry Overview III. Portfolio Overview IV. Asset Management Expertise V. Capital Allocation Strategy VI. Industry-Leading Results VII. New Orleans Market Update 42
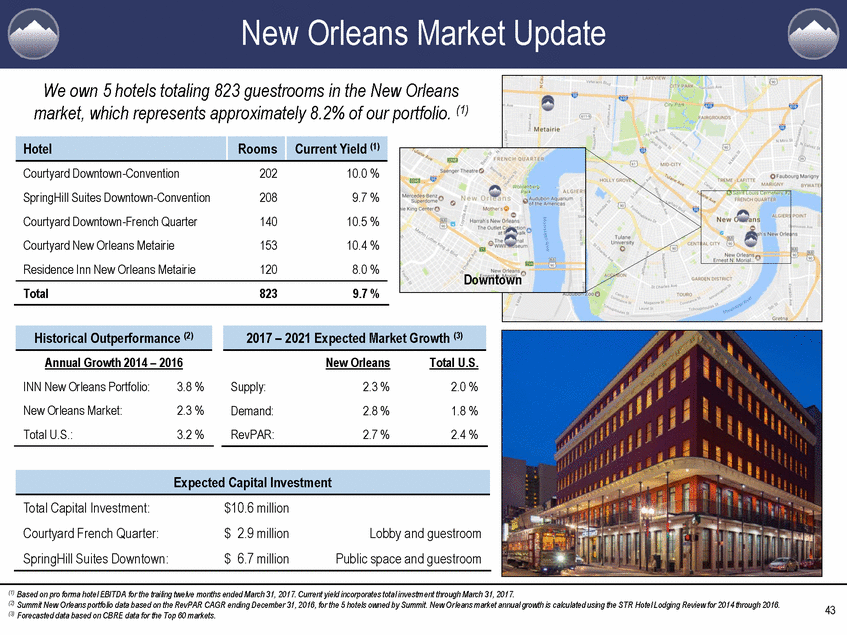
New Orleans Market Update We own 5 hotels totaling 823 guestrooms in the New Orleans market, which represents approximately 8.2% of our portfolio. (1) own Annual Growth 2014 – 2016 INN New Orleans Portfolio: New Orleans Market: Total U.S.: 3.8 % 2.3 % 3.2 % (1) Based on pro forma hotel EBITDA for the trailing twelve months ended March 31, 2017. Current yield incorporates total investm ent through March 31, 2017. (2) Summit New Orleans portfolio data based on the RevPAR CAGR ending December 31, 2016, for the 5 hotels owned by Summit. New Or leans market annual growth is calculated using the STR Hotel Lodging Review for 2014 through 2016. (3) Forecasted data based on CBRE data for the Top 60 markets. 43 Expected Capital Investment Total Capital Investment: $10.6 million Courtyard French Quarter: $ 2.9 million Lobby and guestroom SpringHill Suites Downtown: $ 6.7 million Public space and guestroom Historical Outperformance (2) 2017 – 2021 Expected Market Growth (3) New Orleans Total U.S. Supply: 2.3 % 2.0 % Demand: 2.8 % 1.8 % RevPAR: 2.7 % 2.4 % Hotel Rooms Current Yield (1) Courtyard Downtown-Convention 202 10.0 % SpringHill Suites Downtown-Convention 208 9.7 % Courtyard Downtown-French Quarter 140 10.5 % Courtyard New Orleans Metairie 153 10.4 % Residence Inn New Orleans Metairie 120 8.0 % Total 823 9.7 % Downt
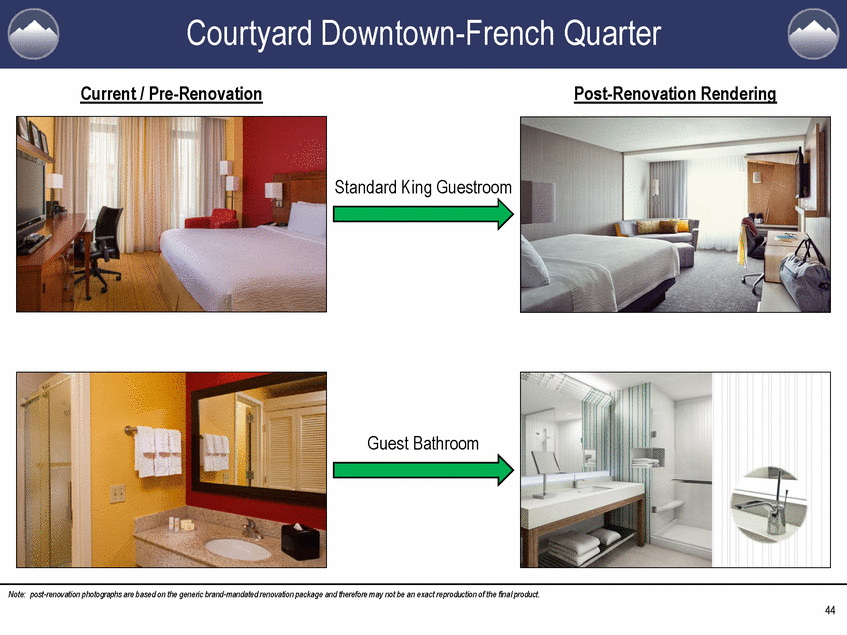
Courtyard Downtown-French Quarter Current / Pre-Renovation Post-Renovation Rendering Standard King Guestroom Guest Bathroom Note: post-renovation photographs are based on the generic brand-mandated renovation package and therefore may not be an exact reproduction of the final product. 44
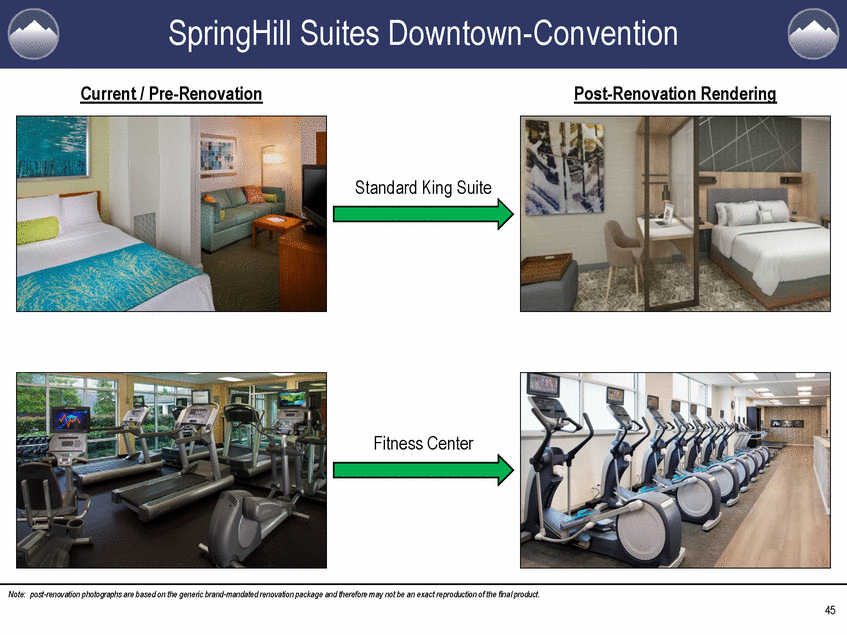
SpringHill Suites Downtown-Convention Current / Pre-Renovation Post-Renovation Rendering Standard King Suite Fitness Center Note: post-renovation photographs are based on the generic brand-mandated renovation package and therefore may not be an exact reproduction of the final product. 45
NYSE: INN
