Attached files
| file | filename |
|---|---|
| EX-32.2 - EXHIBIT 32.2 - Summit Hotel Properties, Inc. | a12-31x2016exhibit322.htm |
| EX-32.1 - EXHIBIT 32.1 - Summit Hotel Properties, Inc. | a12-31x2016exhibit321.htm |
| EX-31.2 - EXHIBIT 31.2 - Summit Hotel Properties, Inc. | a12-31x2016exhibit312.htm |
| EX-31.1 - EXHIBIT 31.1 - Summit Hotel Properties, Inc. | a12-31x2016exhibit311.htm |
| EX-23.1 - EXHIBIT 23.1 - Summit Hotel Properties, Inc. | a12-31x2016exhibit231.htm |
| EX-21.1 - EXHIBIT 21.1 - Summit Hotel Properties, Inc. | a12-31x2016exhibit211.htm |
| EX-12.1 - EXHIBIT 12.1 - Summit Hotel Properties, Inc. | a12-31x2016exhibit121.htm |
UNITED STATES
SECURITIES AND EXCHANGE COMMISSION
Washington, D.C. 20549
FORM 10-K
ý ANNUAL REPORT PURSUANT TO SECTION 13 OR 15(d) OF THE SECURITIES EXCHANGE ACT OF 1934
For the fiscal year ended December 31, 2016
OR
o TRANSITION REPORT PURSUANT TO SECTION 13 OR 15(d) OF THE SECURITIES EXCHANGE ACT OF 1934
For the transition period from to
Commission File Number: 001-35074
SUMMIT HOTEL PROPERTIES, INC.
(Exact name of registrant as specified in its charter)
Maryland | 27-2962512 | |
(State or other jurisdiction | (I.R.S. Employer Identification No.) | |
of incorporation or organization) | ||
12600 Hill Country Boulevard, Suite R-100
Austin, TX 78738
(Address of principal executive offices, including zip code)
(512) 538-2300
(Registrant’s telephone number, including area code)
Securities registered pursuant to Section 12(b) of the Act:
Title of each class | Name of each exchange on which registered | |
Common Stock, par value $0.01 per share | New York Stock Exchange | |
7.875% Series B Cumulative Redeemable Preferred Stock, par value $0.01 per share | New York Stock Exchange | |
7.125% Series C Cumulative Redeemable Preferred Stock, par value $0.01 per share | New York Stock Exchange | |
6.45% Series D Cumulative Redeemable Preferred Stock, par value $0.01 per share | New York Stock Exchange | |
Securities registered pursuant to Section 12(g) of the Act:
None
Indicate by check mark if the registrant is a well-known seasoned issuer, as defined in Rule 405 of the Securities Act. ý Yes o No
Indicate by check mark if the registrant is not required to file reports pursuant to Section 13 or Section 15(d) of the Act. o Yes ý No
Indicate by check mark whether the registrant (1) has filed all reports required to be filed by Section 13 or 15(d) of the Securities Exchange Act of 1934 during the preceding 12 months (or for such shorter period that the registrant was required to file such reports), and (2) has been subject to such filing requirements for the past 90 days. ý Yes o No
Indicate by check mark whether the registrant has submitted electronically and posted on its corporate Web site, if any, every Interactive Data File required to be submitted and posted pursuant to Rule 405 of Regulation S-T (§ 232.405) of this chapter) during the preceding 12 months (or for such shorter period that the registrant was required to submit and post such files). ý Yes o No
Indicate by check mark if disclosure of delinquent filers pursuant to Item 405 of Regulation S-K (§229.405 of this chapter) is not contained herein, and will not be contained, to the best of registrant’s knowledge, in definitive proxy or information statements incorporated by reference in Part III of this Form 10-K or any amendment to this Form 10-K. ý Yes o No
Indicate by check mark whether the registrant is a large accelerated filer, an accelerated filer, a non-accelerated filer, or a smaller reporting company in Rule 12b-2 of the Exchange Act.
Large accelerated filer x | Accelerated filer o | |
Non-accelerated filer o | Smaller reporting company o | |
Indicate by check mark whether the registrant is a shell company (as defined in Rule 12b-2 of the Exchange Act). o Yes ý No
The aggregate market value of the registrant’s voting and non-voting common equity held by non-affiliates of the registrant’s as of June 30, 2016 was $1,138,214,625 based on the closing sale price of the registrant’s common stock on the New York Stock Exchange as of June 30, 2016.
As of February 15, 2017 the number of outstanding shares of common stock of Summit Hotel Properties, Inc. was 93,513,014.
DOCUMENTS INCORPORATED BY REFERENCE
Portions of the registrant’s Definitive Proxy Statement on Schedule 14A for its 2017 annual meeting of stockholders, to be filed with the Securities and Exchange Commission not later than 120 days after the end of the fiscal year pursuant to Regulation 14A, are incorporated herein by reference into Part III, Items 10, 11, 12, 13 and 14.
ANNUAL REPORT ON FORM 10-K
FISCAL YEAR ENDED DECEMBER 31, 2016
SUMMIT HOTEL PROPERTIES, INC.
TABLE OF CONTENTS
Page | ||
Item 1. | ||
Item 1A. | ||
Item 1B. | ||
Item 2. | ||
Item 3. | ||
Item 4. | ||
Item 5. | ||
Item 6. | ||
Item 7. | ||
Item 7A. | ||
Item 8. | ||
Item 9. | ||
Item 9A. | ||
Item 9B. | ||
Item 10. | ||
Item 11. | ||
Item 12. | ||
Item 13. | ||
Item 14. | ||
Item 15. | ||
CAUTIONARY STATEMENT ABOUT FORWARD-LOOKING STATEMENTS
This report contains certain forward-looking statements within the meaning of Section 27A of the Securities Act of 1933, as amended (the “Securities Act”), and Section 21E of the Securities Exchange Act of 1934, as amended (the “Exchange Act”). We intend such forward-looking statements to be covered by the safe harbor provisions for forward-looking statements contained in the Private Securities Litigation Reform Act of 1995 and include this statement for purposes of complying with these safe harbor provisions. Forward-looking statements, which are based on certain assumptions and describe our future plans, strategies and expectations, are generally identifiable by use of the words “may,” “could,” “expect,” “intend,” “plan,” “seek,” “anticipate,” “believe,” “estimate,” “predict,” “forecast,” “project,” “potential,” “continue,” “likely,” “will,” “would” or similar expressions. Forward-looking statements in this report include, among others, statements about our business strategy, including acquisition and development strategies, industry trends, estimated revenues and expenses, ability to realize deferred tax assets and expected liquidity needs and sources (including capital expenditures and the ability to obtain financing or raise capital). You should not rely on forward-looking statements since they involve known and unknown risks, uncertainties and other factors that are, in some cases, beyond our control and which could materially affect actual results, performances or achievements. Factors that may cause actual results to differ materially from current expectations include, but are not limited to:
• | financing risks, including the risk of leverage and the corresponding risk of default on our existing indebtedness and potential inability to refinance or extend the maturities of our existing indebtedness as well as the risk of default by borrowers to which we lend or provide seller financing; |
•global, national, regional and local economic and geopolitical conditions;
•levels of spending for business and leisure travel, as well as consumer confidence;
• | adverse changes in, or declining rates of growth with respect to, occupancy, average daily rate (“ADR”) and revenue per available room (“RevPAR”) and other hotel operating metrics; |
•hostilities, including future terrorist attacks, or fear of hostilities that affect travel;
•financial condition of, and our relationships with, third-party property managers and franchisors;
•the degree and nature of our competition;
•increased interest rates and operating costs;
•increased renovation costs, which may cause actual renovation costs to exceed our current estimates;
•changes in zoning laws and increases in real property taxes;
• | risks associated with potential hotel acquisitions, including the ability to ramp up and stabilize newly acquired hotels with limited or no operating history or that require substantial amounts of capital improvements for us to earn stabilized economic returns consistent with our expectations at the time of acquisition, and risks associated with dispositions of hotel properties, including our ability to successfully complete the sale of hotel properties currently under contract to be sold, including the risk that the purchaser may not have access to the capital needed to complete the sale; |
• | the nature of our structure and transactions such that our federal and state taxes are complex and there is risk of successful challenges to our tax positions by the Internal Revenue Service or other federal and state taxing authorities; |
• | the recognition of taxable gains from the sale of hotel properties as a result of the inability to complete certain like-kind exchanges in accordance with Section 1031 of the Internal Revenue Code of 1986, as amended (the “IRC”); |
•availability of and our ability to retain qualified personnel;
•our failure to maintain our qualification as a real estate investment trust (“REIT”) under the IRC;
•changes in our business or investment strategy;
•availability, terms and deployment of capital;
•general volatility of the capital markets and the market price of our common stock;
•environmental uncertainties and risks related to natural disasters; and
•the other factors discussed under the heading “Risk Factors” in this report.
Accordingly, there is no assurance that our expectations will be realized. Except as otherwise required by the federal securities laws, we disclaim any obligations or undertaking to publicly release any updates or revisions to any forward-looking statement contained herein (or elsewhere) to reflect any change in our expectations with regard thereto or any change in events, conditions or circumstances on which any such statement is based.
1
PART I
Item 1. Business.
Unless the context otherwise requires, all references to “we”, “us,” “our,” or the “Company” refer to Summit Hotel Properties, Inc. and its consolidated subsidiaries.
Overview
Summit Hotel Properties, Inc. is a self-managed hotel investment company that was organized in June 2010 and completed its initial public offering (“IPO”) in February 2011. We focus on owning primarily premium-branded, select-service hotels. At December 31, 2016, our portfolio consisted of 81 hotels with a total of 10,957 guestrooms located in 23 states, including one hotel held by a qualified intermediary to complete a reverse like-kind exchange under Section 1031 of the IRC (“1031 Exchange”) as further described under Item 2. – “Properties – Our Portfolio.”
As of December 31, 2016, 86.6% of our guestrooms were located in the top 50 metropolitan statistical areas (“MSAs”), 95.4% were located within the top 100 MSAs and 99.4% of our hotel guestrooms operate under premium franchise brands owned by Marriott® International, Inc. (“Marriott”), Hilton® Worldwide (“Hilton”), Intercontinental® Hotel Group (“IHG”), and Hyatt® Hotels Corporation (“Hyatt”). Our hotels are typically located in markets with multiple demand generators such as corporate offices and headquarters, retail centers, airports, state capitols, convention centers, and leisure attractions.
Substantially all of our assets are held by, and all of our operations are conducted through our operating partnership, Summit Hotel OP, LP (the “Operating Partnership”). Through a wholly-owned subsidiary, we are the sole general partner of the Operating Partnership. At December 31, 2016, we owned, directly and indirectly, approximately 99.6% of the Operating Partnership’s issued and outstanding common units of limited partnership interest (“Common Units”), and all of the Operating Partnership’s issued and outstanding Series B, Series C, and Series D preferred units of limited partnership interest (“Preferred Units”). Pursuant to the Operating Partnership’s partnership agreement, we have full, exclusive and complete responsibility and discretion in the management and control of the Operating Partnership, including the ability to cause the Operating Partnership to enter into certain major transactions including acquisitions, dispositions and refinancings, to make distributions to partners and to cause changes in the Operating Partnership’s business activities.
We have elected to be taxed as a REIT for federal income tax purposes commencing with our short taxable year ended December 31, 2011. To qualify as a REIT, we cannot operate or manage our hotels. Accordingly, all of our hotels are leased to wholly-owned subsidiaries (our “TRS lessees”) of Summit Hotel TRS, Inc., our taxable REIT subsidiary. All of our hotels are operated pursuant to hotel management agreements between our TRS lessees and professional third-party hotel management companies that are not affiliated with us. We have one reportable segment as defined by generally accepted accounting principles (“GAAP”). See Item 8. – "Financial Statements and Supplementary Data – Note 2 – Summary of Significant Accounting Policies."
Our corporate offices are located at 12600 Hill Country Boulevard, Suite R-100, Austin, TX 78738. Our telephone number is (512) 538-2300. Our website is www.shpreit.com. The information contained on, or accessible through, our website is not incorporated by reference into this report and should not be considered a part of this report.
Business Strategy
Our strategy concentrates on focused asset management, targeted capital investment and strategic transactions, including increasing the cash flow of our portfolio through transformation of our portfolio, or capital recycling, by selling assets with lower operating margins and RevPAR growth opportunities and purchasing assets with higher operating margins and RevPAR growth opportunities. Our primary objective is to enhance stockholder value over time by generating strong, risk-adjusted returns for our stockholders. The key elements of our strategy that we believe will allow us to create long-term value are as follows:
Focus on Premium-Branded Hotels. We primarily focus on hotels in the Upscale segment of the lodging industry, as defined by Smith Travel Research ("STR"). We believe that our focus on this segment provides us the opportunity to achieve strong, risk-adjusted returns across multiple lodging cycles for several reasons, including:
• | RevPAR Growth. We believe that our hotels will continue to experience revenue growth based on the characteristics of our portfolio and current industry fundamentals and trends, but we expect that such growth will be at a slower pace than the prior year. |
2
• | Stable Cash Flow Potential. Our hotels can generally be operated with fewer employees than full-service hotels that offer more amenities including more expansive food and beverage options, which we believe enables us to generate consistent cash flows with less volatility. |
• | Broad Customer Base. Our target brands deliver consistently high-quality hotel accommodations with value-oriented pricing that we believe appeals to a wide range of customers, including both business and leisure travelers. We believe that our hotels are particularly popular with frequent business travelers who seek to stay in hotels operating under Marriott, Hilton, Hyatt, or IHG brands, which offer strong loyalty rewards program points that can be redeemed for travel. |
• | Enhanced Diversification. Premium-branded Upscale hotels generally cost less to acquire or build, on a per-key basis, than hotels in the Upper-upscale and Luxury segments of the industry. As a result, we can diversify our investment capital into ownership of a larger number of hotels than we could in more expensive segments. |
Capitalize on Investments in Our Hotels. We strongly believe in investing in our properties to enable them to be performance leaders in their respective markets. Over the past three years, we have invested $128.1 million in capital improvements to our hotels. We believe these investments produce attractive returns, and we intend to continue to use available capital to upgrade our hotels through strategic renovation and through brand-required hotel property improvement plans.
External Growth Through Acquisitions. We intend to continue to grow through acquisitions of existing hotels using a disciplined approach, while maintaining a prudent capital structure. We generally target premium-branded hotels that meet one or more of the following acquisition criteria:
• | potential for strong risk-adjusted returns and are located in the top 50 MSAs and other select markets; |
• | operate under leading franchise brands, which may include but are not limited to brands owned by Marriott, Hilton, IHG and Hyatt; |
• | located in close proximity to multiple demand generators, such as corporate offices and headquarters, retail centers, airports, state capitols, convention centers, and leisure attractions, with a diverse source of potential guests, including corporate, government and leisure travelers; |
• | located in markets with barriers to entry due to strong franchise areas of protection or other factors; |
• | can be acquired at a discount to replacement cost; and |
• | provide an opportunity to add value through operating efficiencies, repositioning, renovating or rebranding. |
Strategic Hotel Sales (Capital Recycling Program). We seek to maximize the cash flow of our portfolio and our return on invested capital. We periodically review our hotels to determine if any significant changes to area markets or our hotels have occurred or are anticipated to occur that would warrant the sale of a hotel or hotels. We intend to continue to pursue a disciplined capital allocation strategy designed to maximize the value of our investments by selectively selling hotel properties that we believe are no longer consistent with our investment strategy or whose returns on invested capital appear to have been maximized. To the extent that we sell hotel properties, we intend to redeploy the capital into acquisition and capital investment opportunities that we believe have the potential to generate significant improvements in RevPAR and earnings before interest, taxes, depreciation and amortization (“EBITDA”) as a result of our proactive asset management approach and by investing in our hotels in an effort to enhance their quality and attractiveness, increase their long-term value and generate more favorable returns on our invested capital.
Selectively Develop Hotels. We seek to identify attractive opportunities to partner on a selective basis with experienced hotel developers to acquire, upon completion, newly constructed hotels that meet our acquisition criteria. We will consider unique opportunities to develop hotels utilizing our own resources if and when circumstances warrant.
Our Financing Strategy
We rely on cash provided by operations, working capital, short-term borrowings under our unsecured credit facility, term debt, repayment of notes receivable, proceeds from the issuance of securities, the strategic sale of hotels and the release of restricted cash upon satisfaction of the usage requirements to finance our business. While the ratio will vary from time to time, we generally intend to limit our ratio of indebtedness to EBITDA, which amount may be adjusted for non-cash and non-recurring items, to no more than 6.0x. At December 31, 2016, our ratio of indebtedness to EBITDA was 3.2x. For purposes of calculating this ratio, we exclude preferred stock from indebtedness. During 2016, we financed our long-term growth with borrowings under our unsecured credit facility and unsecured term loan, issuance of securities, and proceeds from the strategic sale of hotels and intend to continue to do so in the future. Our debt includes, and may include in the future, mortgage debt secured by hotels and unsecured debt. As of December 31, 2016, we had $657.6 million in outstanding indebtedness.
3
When purchasing hotel properties, the Operating Partnership may issue Common Units or Preferred Units as full or partial consideration to sellers who may be interested in taking advantage of the opportunity to defer taxable gains on the sale of a property or participate in the potential appreciation in the value of our common stock.
Competition
We face competition for investments in hotel properties from institutional pension funds, private equity investors, REITs, hotel companies and others who are engaged in hotel acquisitions and investments. Some of these entities have substantially greater financial and operational resources than we have. This competition may increase the bargaining power of property owners seeking to sell, reduce the number of suitable investment opportunities available to us and increase the cost of acquiring our targeted hotel properties.
The lodging industry is highly competitive. Our hotels compete with other hotels for guests in their respective markets based on a number of factors, including location, convenience, brand affiliation, quality of the physical condition of the hotel, guestroom rates, range of services and guest amenities or accommodations offered and quality of customer service. Competition is often specific to the individual markets in which our hotels are located and includes competition from existing and new hotels. Competition could adversely affect our occupancy rates, our ADR and our RevPAR, and may require us to provide additional amenities or make capital improvements that we otherwise would not have to make, which may reduce our profitability.
Seasonality
Certain segments of the hotel industry are seasonal in nature. Leisure travelers tend to travel more during the summer. Business travelers occupy hotels relatively consistently throughout the year, but decreases in business travel occur during summer and the winter holidays. The hotel industry is also seasonal based upon geography. Hotels in the southern U.S. tend to have higher occupancy rates during the winter months. Hotels in the northern U.S. tend to have higher occupancy rates during the summer months.
Regulation
Our properties are subject to various covenants, laws, ordinances and regulations, including regulations relating to accessibility, fire and safety requirements. We believe each of our hotels has the necessary permits and approvals to operate its business.
Americans with Disabilities Act of 1990 (“ADA”)
Our properties must comply with Title III of the ADA to the extent that they are “public accommodations” as defined by the ADA. Under the ADA, all public accommodations must meet federal requirements related to access and use by disabled persons. The ADA may require removal of structural barriers to access by persons with disabilities in certain public areas of our properties where removal is readily achievable. Although we believe the properties in our portfolio substantially comply with present requirements of the ADA, a determination to the contrary could require removal of access barriers and non-compliance could result in litigation costs, costs to remediate deficiencies, U.S. government fines or in damages to private litigants. The obligation to make readily achievable accommodations is an ongoing one, and we will continue to assess our properties and to make alterations as appropriate in this respect.
4
Environmental, Health and Safety Matters
Our hotels and development land parcels are subject to various federal, state and local environmental laws that impose liability for contamination. Under these laws, governmental entities have the authority to require us, as the current owner of property, to perform or pay for the cleanup of contamination (including hazardous substances, waste, or petroleum products) at, on, under or emanating from the property and to pay for natural resource damages arising from contamination. These laws often impose liability without regard to whether the owner or operator or other responsible party knew of, or caused the contamination, and the liability may be joint and several. Because these laws also impose liability on persons who owned a property at the time it became contaminated, we could incur cleanup costs or other environmental liabilities even after we sell properties. Contamination at, on, under or emanating from our properties also may expose us to liability to private parties for costs of remediation, personal injury and death or property damage. In addition, environmental liens may be created on contaminated sites in favor of the government for damages and costs it incurs to address contamination. If contamination is discovered on our properties, environmental laws also may impose restrictions on the manner in which property may be used or businesses may be operated, and these restrictions may require substantial expenditures. Moreover, environmental contamination can affect the value of a property and therefore, an owner’s ability to borrow funds using the property as collateral or to sell the property on favorable terms or at all. Furthermore, persons who sent waste to a waste disposal facility, such as a landfill or an incinerator, may be liable for costs associated with cleanup of that facility.
Some of our properties may have contained historical uses which involved the use or storage of hazardous chemicals and petroleum products (for example, storage tanks, gas stations and dry cleaning operations) which if released, could have affected our properties. In addition, some of our properties may be near or adjacent to other properties that have contained or currently contain storage tanks containing petroleum products or conducted or currently conduct operations which use other hazardous or toxic substances. Releases from these adjacent or surrounding properties could affect our properties and we may be liable for any associated cleanup.
Independent environmental consultants conducted Phase I environmental site assessments on all of our properties prior to acquisition and we intend to conduct Phase I environmental site assessments on properties we acquire in the future. Phase I site assessments are intended to discover and evaluate information regarding the environmental condition of the surveyed properties and surrounding properties. These assessments do not generally include soil sampling, subsurface investigations or comprehensive asbestos surveys. In some cases, the Phase I environmental site assessments were conducted by another entity such as a lender, and we may not have the authority to rely on such reports. A few of our properties have experienced environmental contamination prior to our ownership, but all contamination has been remediated to the satisfaction of state regulatory agencies. None of the Phase I environmental site assessments of the hotel properties in our portfolio revealed any past or present environmental condition that we believe could have a material adverse effect on our business, financial position or results of operations. In addition, the Phase I environmental site assessments may also have failed to reveal all environmental conditions, liabilities or compliance concerns. The Phase I environmental site assessments were completed at various times and material environmental conditions, liabilities or compliance concerns may have arisen after the review was completed or may arise in the future; and future laws, ordinances or regulations may impose material additional environmental liability.
In addition, our hotels (including our real property, operations and equipment) are subject to various federal, state and local environmental, health and safety regulatory requirements that address a wide variety of issues, including, but not limited to the existence of mold and other airborne contaminants above regulatory thresholds, the registration, maintenance and operation of our boilers and storage tanks, the supply of potable water to our guests, air emissions from emergency generators, storm water and wastewater discharges, protection of natural resources, asbestos, lead-based paint, and waste management. Some of our hotels also routinely handle and use hazardous or regulated substances and wastes as part of their operations, which are subject to regulation (for example, swimming pool chemicals or biological waste). Our hotels incur costs to comply with these environmental, health and safety laws and regulations and if these regulatory requirements are not met or unforeseen events result in the discharge of dangerous or toxic substances at our hotels, we could be subject to fines and penalties for non-compliance with applicable laws and material liability from third parties for harm to the environment, damage to real property or personal injury or death. We are aware of no past or present environmental liability for non-compliance with environmental, health and safety laws and regulations that we believe would have a material adverse effect on our business, financial position or results of operations.
5
Tax Status
We have elected to be taxed as a REIT for federal income tax purposes commencing with our short taxable year ended December 31, 2011. Our qualification as a REIT depends upon our ability to meet, on a continuing basis, through actual investment and operating results, various complex requirements under the IRC relating to, among other things, the sources of our gross income, the composition and values of our assets, the timing and amount of our dividend distributions and the diversity of ownership of our stock. We believe that we have been organized and have operated in conformity with the requirements for qualification as a REIT under the IRC and that our current and intended manner of operation will enable us to continue to meet the requirements for qualification and taxation as a REIT for federal income tax purposes.
In order for the income from our hotel operations to constitute “rents from real property” for purposes of the gross income tests required for REIT qualification, we cannot directly operate any of our hotel properties. Accordingly, all of our hotels are leased to our TRS lessees, which are wholly-owned subsidiaries of Summit Hotel TRS, Inc. (our “TRS”). Our TRS is a “taxable REIT subsidiary,” which is a corporate subsidiary of a REIT that jointly elects with the REIT to be treated as a TRS and pays federal income tax at regular corporate rates on its taxable income. We will lease newly acquired hotels to our existing TRS or additional TRSs in the future. Our TRS lessees pay rent to us that will qualify as “rents from real property,” provided that the TRS lessees engage “eligible independent contractors” to manage our hotels. All of our hotels are operated pursuant to hotel management agreements with professional third-party hotel management companies. We believe each of the third-party managers qualifies as an “eligible independent contractor” under the IRC.
As a REIT, we generally will not be subject to federal income tax on our REIT taxable income that we distribute as dividends to our stockholders. Under the IRC, REITs are subject to numerous organizational and operational requirements, including a requirement that they distribute each year at least 90% of their taxable income, determined without regard to the deduction for dividends paid and excluding any net capital gains, which does not necessarily equal net income as calculated in accordance with GAAP. If we fail to qualify for taxation as a REIT in any taxable year and do not qualify for certain statutory relief provisions, our income for that year will be taxed at regular corporate rates, and we will be unable to re-elect REIT status until the fifth calendar year after the year in which we failed to qualify as a REIT, unless we satisfy certain relief provisions. Even if we qualify as a REIT for federal income tax purposes, we may still be subject to state and local taxes on our income and assets and to federal income and excise taxes on our undistributed income. Additionally, any income earned by our TRS will be fully subject to federal, state and local corporate income tax.
Employees
As of February 15, 2017, we employ 44 full-time employees. The staff at our hotels are employed by our third-party hotel managers.
Available Information
Our Internet website is located at www.shpreit.com. Copies of the charters of the committees of our board of directors, our code of business conduct and ethics and our corporate governance guidelines are available on our website. We will provide timely disclosures of amendments and waivers to the aforementioned documents via website posting. All reports that we have filed with the Securities and Exchange Commission (“SEC”) including this Annual Report on Form 10-K, our quarterly reports on Form 10-Q and our current reports on Form 8-K, can be obtained free of charge from the SEC’s website at www.sec.gov or through our website. In addition, all reports filed with the SEC may be read and copied at the SEC’s Public Reference Room at 100 F Street, NE, Washington, D.C. 20549-1090. Further information regarding the operation of the public reference room may be obtained by calling the SEC at 1-800-SEC-0330. The information contained on, or accessible through the SEC’s website or our website is not incorporated by reference into this report and should not be considered a part of this report.
6
Item 1A. Risk Factors.
The following risk factors address the material risks concerning our business. If any of the risks discussed in this report were to occur, our business, prospects, financial condition, results of operation and our ability to service our debt and make distributions to our stockholders could be materially and adversely affected and the market price per share of our stock could decline significantly. Some statements in this report, including statements in the following risk factors, constitute forward-looking statements. Please refer to the section entitled “Cautionary Statement Regarding Forward-Looking Statements.” The discussion of the potential effect of the following risk factors on our financial results relates to our consolidated financial position, consolidated results of operations and cash flows.
Risks Related to Our Business
Our business strategy, future results of operations and growth prospects are dependent on achieving revenue and net income growth from anticipated increases in demand for hotel guestrooms and general economic conditions.
Our business strategy includes achieving continued revenue and net income growth from anticipated improvement in demand for hotel guestrooms as the economy continues to grow. We, however, cannot provide any assurances that demand for hotel guestrooms will increase from current levels, or the time or extent of any demand growth that we do experience. If demand does not continue to increase as the economy grows, or if there is a setback in the general economy resulting in weakening demand, our operating results and growth prospects could be adversely affected. As a result, any slowdown in economic growth or a new economic downturn could adversely affect our future results of operations and our growth prospects.
We may be unable to complete acquisitions that would grow our business.
Our growth strategy includes the disciplined acquisition of hotels as opportunities arise. Our ability to acquire hotels on satisfactory terms or at all is subject to the following significant risks:
• | we may be unable to acquire, or may be forced to acquire at significantly higher prices, desired hotels because of competition from other real estate investors, including other real estate operating companies, REITs and investment funds; |
• | we may be unable to obtain the necessary debt or equity financing to consummate an acquisition or, if obtainable, financing may not be on satisfactory terms; and |
• | agreements for the acquisition of hotels are typically subject to customary conditions to closing, including satisfactory completion of due diligence investigations and the receipt of franchisor and lender consents, and we may spend significant time and incur significant transaction costs on potential acquisitions that we do not consummate. |
If we cannot complete hotel acquisitions on favorable terms or at all, our business, financial position, results of operations and cash flows, the market price per share of our common stock and our ability to satisfy our debt service obligations and make distributions to our stockholders could be materially adversely affected.
The sale of certain hotel properties could result in significant tax liabilities unless we are able to defer the taxable gain through 1031 Exchanges.
In general, we structure asset sales for possible inclusion in like-kind exchanges within the meaning of Section 1031 of the IRC. The ability to complete a like-kind exchange depends on many factors, including, among others, identifying and acquiring suitable replacement property within limited time periods, and the ownership structure of the properties being sold and acquired. Therefore, we are not always able to sell an asset as part of a like-kind exchange. When successful, a like-kind exchange enables us to defer the taxable gain on the asset sold. If we cannot defer the taxable gain resulting from the sales of certain hotel properties, our business, financial position, results of operations and cash flows, the market price per share of our common stock and our ability to satisfy our debt service obligations and make distributions to our stockholders could be materially adversely affected.
7
We may fail to successfully integrate and operate newly acquired hotels.
Our ability to successfully integrate and operate newly acquired hotels is subject to the following risks:
• | we may not possess the same level of familiarity with the dynamics and market conditions of any new markets that we may enter, which could result in us paying too much for hotels in new markets or not operating the hotels at their maximum potential; |
• | market conditions may result in lower than expected occupancy and guestroom rates; |
• | we may acquire hotels without any recourse, or with only limited recourse, for liabilities, whether known or unknown, such as cleanup of environmental contamination, claims by tenants, vendors or other persons against the former owners of the hotels and claims for indemnification by general partners, directors, officers and others indemnified by the former owners of the hotels; |
• | we may need to spend more than budgeted amounts to make necessary improvements or renovations to our newly acquired hotels; and |
• | we may be unable to quickly and efficiently integrate new acquisitions, particularly acquisitions of portfolios of hotels, into our existing operations. |
If we cannot operate acquired hotels to meet our expectations, our business, financial position, results of operations and cash flows, the market price per share of our stock and our ability to satisfy our debt service obligations and make distributions to our stockholders could be materially adversely affected.
We may assume liabilities in connection with the acquisition of hotel properties, including unknown liabilities.
We may assume existing liabilities in connection with the acquisition of hotel properties, some of which may be unknown or unquantifiable on the acquisition date. Unknown liabilities might include liabilities for cleanup or remediation of undisclosed environmental conditions, claims of hotel guests, vendors or other persons dealing with the seller of a particular hotel property, tax liabilities, employment-related issues and accrued but unpaid liabilities whether incurred in the ordinary course of business or otherwise. If the magnitude of such unknown liabilities is high, they could have a material adverse effect on our financial position, results of operations and cash flows, the market price of our stock and our ability to satisfy our debt service obligations and to make distributions to our stockholders.
We may not be able to cause our hotel management companies to operate any of our hotels in a manner that is satisfactory to us, and termination of our hotel management agreements may be costly and disruptive.
To qualify as a REIT, we cannot operate or manage our hotels. Accordingly, all of our hotels are leased to TRS lessees of our TRS. All of our hotels are operated pursuant to hotel management agreements with independent hotel management companies, each of which must qualify as an “eligible independent contractor” to operate our hotels. As a result, our financial position, results of operations and our ability to service debt and make distributions to stockholders are dependent on the ability of our hotel management companies to operate our hotels successfully. Any failure of our hotel management companies to provide quality services and amenities or maintain a quality brand name and reputation could have a negative effect on their ability to operate our hotels and could have a material adverse effect on our financial position, results of operations and cash flows.
Even if we believe a hotel is being operated inefficiently or in a manner that does not result in satisfactory operating results, we will have limited ability to require the hotel management company to change its method of operation. We generally attempt to resolve issues with our hotel management companies through discussions and negotiations, but otherwise will only be able to seek redress if a hotel management company violates the terms of the applicable hotel management agreement, and then only to the extent of the remedies provided for under the terms of the hotel management agreement. If we replace the hotel management company of any of our hotels, we may be required to pay a substantial termination fee and we may experience significant disruptions at the affected hotel.
Furthermore, we have certain indemnifications from our property managers that generally protect us from financial losses due to the gross negligence or willful misconduct of our property managers. However, the indemnifications may be insufficient or the property manager may not have the financial wherewithal to support their indemnification obligation to us. As such, the indemnification may not provide us with sufficient protection against third-party claims resulting from the gross negligence or willful misconduct of our property managers in the operation of our hotels.
Our hotel managers or their affiliates manage, and in some cases own, have invested in, or provided credit support or operating guarantees to hotels that compete with our hotels, all of which may result in conflicts of interest. As a result, our hotel
8
managers may in the future make decisions regarding competing lodging facilities that are not or would not be in our best interest.
Certain of our hotels are managed by affiliates of the franchisors for such hotels. In these situations, the management agreement and the franchise agreement are typically combined into one document. Thus, the termination of the management agreement due to poor performance or breach of the management agreement by the management company could also terminate our franchise license. Thus, we may have very limited options to remedy poor hotel management performance if we desire to retain the franchise license.
These conditions could have a material adverse effect on our financial position, results of operations and cash flows.
The management of a large number of hotels in our portfolio is currently concentrated with one hotel management company.
As of December 31, 2016, Interstate Management Company, LLC (“Interstate”) or its affiliate managed 40 of our 81 hotels. Thus, a substantial portion of our revenues is generated by hotels managed by Interstate. This significant concentration of operational risk in one hotel management company makes us more vulnerable economically than if our hotel management was more evenly diversified among several hotel management companies. Any adverse developments in Interstate’s business, financial strength or ability to operate our hotels efficiently and effectively could have a material adverse effect on our results of operations. We cannot provide assurance that Interstate will satisfy its obligations to us or effectively and efficiently operate our hotel properties. The failure or inability of Interstate to satisfy its obligations to us or effectively and efficiently operate our hotel properties could have a material adverse effect on our financial position, results of operations and cash flows, which could in turn reduce the amount of our distributable cash and cause the market price per share of our stock to decline.
Restrictive covenants and other provisions in hotel management and franchise agreements could preclude us from taking actions with respect to the sale, refinancing or rebranding of a hotel that would otherwise be in our best interest.
Our hotel management agreements and franchise agreements generally contain restrictive covenants and other provisions that do not provide us with flexibility to sell, refinance or rebrand a hotel without the consent of the manager or franchisor. For example, the terms of some of these agreements may restrict our ability to sell a hotel unless the purchaser is not a competitor of the hotel management company or franchisor, assumes the related agreement and meets specified other conditions. In addition, our franchise agreements restrict our ability to rebrand particular hotels without the consent of the franchisor, which could result in significant operational disruptions and litigation if we do not obtain the consent. We could be forced to pay consent or termination fees to hotel managers or franchisors under these agreements as a condition to changing management or franchise brands of our hotels, and these fees could deter us from taking actions that would otherwise be in our best interest or could cause us to incur substantial expense.
These conditions could have a material adverse effect on our financial position, results of operations and cash flows.
We are required to expend funds to maintain franchisor operating standards and we may experience a loss of a franchise license or a decline in the value of a franchise brand.
Our hotels operate under franchise agreements, and the maintenance of franchise licenses for our hotels is subject to our franchisors’ operating standards and other terms and conditions. We expect that franchisors will periodically inspect our hotels to ensure that we, our TRS and our hotel management companies maintain our franchisors’ standards. Failure by us, our TRS or our hotel management companies to maintain these standards or other terms and conditions could result in a franchise license being canceled. If a franchise license terminates due to our failure to make required improvements or to otherwise comply with its terms, we could also be liable to the franchisor for a termination payment, which varies by franchisor and by hotel. As a condition of our continued holding of a franchise license, a franchisor could also require us to make capital improvements to our hotels, even if we do not believe the improvements are necessary or desirable or would result in an acceptable return on our investment.
The loss of a franchise license could materially and adversely affect the operations or the underlying value of the hotel because of the loss of associated name recognition, marketing support and centralized reservation systems provided by the franchisor. Because our hotels are concentrated with a limited number of franchise brands, a loss of all of the licenses for a particular franchise could have a material adverse effect on our financial position, results of operations and cash flows.
Negative publicity related to one of the franchise brands or the general decline of a brand also may adversely affect the underlying value of our hotels or result in a reduction in business.
9
We rely on external sources of capital to fund future capital needs, and if we encounter difficulty in obtaining such capital, we may not be able to make future acquisitions necessary to grow our business or meet maturing obligations.
To qualify as a REIT under the IRC, we are required, among other things, to distribute each year to our stockholders at least 90% of our REIT taxable income, determined without regard to the dividends paid deduction and excluding any net capital gain. Because of this distribution requirement, we may not be able to fund, from cash retained from operations, all of our future capital needs, including capital needed to make investments and to satisfy or refinance maturing obligations.
We expect to continue to rely on external sources of capital, including debt and equity financing, to fund future capital needs. Part of our strategy involves the use of additional debt financing to supplement our equity capital which may include our unsecured credit facility, mortgage financing and other unsecured financing. Our ability to effectively implement and accomplish our business strategy will be affected by our ability to obtain and use additional leverage in sufficient amounts and on favorable terms. However, the capital environment is often characterized by extended periods of limited availability of both debt and equity financing, increasing financing costs, stringent credit terms and significant volatility. We may not be able to secure first mortgage financing or increase the availability under, extend the maturity of or refinance our unsecured credit facility. If we are unable to obtain needed capital on satisfactory terms or at all, we may not be able to make the investments needed to expand our business, or to meet our obligations and commitments as they mature. Our access to capital will depend upon a number of factors over which we have little or no control, including general market conditions, the market’s perception of our current and potential future earnings and cash distributions and the market price of the shares of our common stock. We may not be in a position to take advantage of attractive investment opportunities for growth if we are unable to access the capital markets on a timely basis or on favorable terms.
We have a significant amount of debt, and our organizational documents have no limitation on the amount of additional indebtedness that we may incur in the future.
We have a significant amount of debt. In the future, we may incur additional indebtedness to finance future hotel acquisitions, capital improvements and development activities and other corporate purposes. In addition, there are no restrictions in our charter or bylaws that limit the amount or percentage of indebtedness that we may incur or restrict the form in which our indebtedness will be incurred (including recourse or non-recourse debt or cross-collateralized debt).
A substantial level of indebtedness could have adverse consequences for our business, results of operations and financial position because it could, among other things:
• | require us to dedicate a substantial portion of our cash flow from operations to make principal and interest payments on our indebtedness, thereby reducing our cash flow available to fund working capital, capital expenditures and other general corporate purposes, including to pay dividends on our common stock and our preferred stock as currently contemplated or necessary to satisfy the requirements for qualification as a REIT; |
• | increase our vulnerability to general adverse economic and industry conditions and limit our flexibility in planning for, or reacting to, changes in our business and our industry; |
• | limit our ability to borrow additional funds or refinance indebtedness on favorable terms or at all to expand our business or ease liquidity constraints; and |
• | place us at a competitive disadvantage relative to competitors that have less indebtedness. |
Generally, our mortgage debt carries maturity dates or call dates such that the loans become due prior to their full amortization. It may be difficult to refinance or extend the maturity of such loans on terms acceptable to us, or at all, and we may not have sufficient borrowing capacity on our unsecured credit facility to repay any amounts that we are unable to refinance. Although we believe that we will be able to refinance or extend the maturity of these loans, or will have the capacity to repay them, if necessary, using draws under our unsecured credit facility, there can be no assurance that our unsecured credit facility will be available to repay such maturing debt, as draws under our unsecured credit facility are subject to limitations based upon our unencumbered assets and certain financial covenants.
These conditions could have a material adverse effect on our financial position, results of operations and cash flows.
10
The agreements governing our indebtedness place restrictions on us and our subsidiaries, reducing operational flexibility and creating default risks.
The agreements governing our indebtedness contain covenants that place restrictions on us and our subsidiaries. These covenants may restrict, among other activities, our and our subsidiaries’ ability to:
• merge, consolidate or transfer all or substantially all of our or our subsidiaries’ assets;
•sell, transfer, pledge or encumber our stock or the ownership interests of our subsidiaries;
• incur additional debt or place mortgages on our unencumbered hotels;
•enter into, terminate or modify leases for our hotels and hotel management and franchise agreements;
•make certain expenditures, including capital expenditures;
• pay dividends on or repurchase our capital stock; and
•enter into certain transactions with affiliates.
These covenants could impair our ability to grow our business, take advantage of attractive business opportunities or successfully compete. Our ability to comply with financial and other covenants may be affected by events beyond our control, including prevailing economic, financial and industry conditions. A breach of any of these covenants or covenants under any other agreements governing our indebtedness could result in an event of default. Cross-default provisions in our debt agreements could cause an event of default under one debt agreement to trigger an event of default under our other debt agreements. Upon the occurrence of an event of default under any of our debt agreements, the lenders could elect to declare all outstanding debt under such agreements to be immediately due and payable. If we were unable to repay or refinance the accelerated debt, the lenders could proceed against any assets pledged to secure that debt, including foreclosing on or requiring the sale of our hotels, and the proceeds from the sale of these hotels may not be sufficient to repay such debt in full.
These conditions could have a material adverse effect on our financial position, results of operations and cash flows.
Mortgage debt obligations expose us to the possibility of foreclosure, which could result in the loss of our investment in any hotel subject to mortgage debt.
Except for the borrowings under our unsecured credit facilities, all of our other long-term debt existing as of December 31, 2016 is secured by mortgages on our hotel properties and related assets. Incurring mortgages and other secured debt obligations increases our risk of property losses because defaults on secured indebtedness may result in foreclosure actions initiated by lenders and ultimately our loss of the hotels securing such loans. If we are in default under a cross-defaulted mortgage loan, we could lose multiple hotels to foreclosure. For tax purposes, a foreclosure of any of our hotels would be treated as a sale of the hotel for a purchase price equal to the outstanding balance of the debt secured by the mortgage. If the outstanding balance of the debt secured by the mortgage exceeds our tax basis in the hotel, we would recognize taxable income on foreclosure, but would not receive any cash proceeds, which could hinder our ability to meet the REIT distribution requirements imposed by the IRC. We may assume or incur new mortgage indebtedness on the hotels in our portfolio or hotels that we acquire in the future. Any default under any one of our mortgage debt obligations may increase the risk of our default on our other indebtedness.
These conditions could have a material adverse effect on our financial position, results of operations and cash flows.
An increase in interest rates would increase our interest costs on our variable rate debt.
With respect to our existing and future variable-rate debt, an increase in interest rates would increase our interest payments and reduce our cash flow available for other corporate purposes, including capital improvements to our hotels or acquisitions of additional hotels. In addition, rising interest rates could limit our ability to refinance existing debt when it matures and increase interest costs on any debt that is refinanced. Further, an increase in interest rates could increase the cost of financing, thereby decreasing the amount third parties are willing to pay for our hotels, which would limit our ability to dispose of hotels when necessary or desired. See “Management’s Discussion and Analysis of Financial Condition and Results of Operations — Qualitative and Quantitative Effects of Market Risk.”
These conditions could have a material adverse effect on our financial position, results of operations and cash flows.
11
Our success depends on key personnel whose continued service is not guaranteed.
We depend on the efforts and expertise of our management team to manage our day-to-day operations and strategic business activities. The loss of services from any of the members of our management team, and our inability to find suitable replacements on a timely basis could have an adverse effect on our financial position, results of operations and cash flows.
We hedge our interest rate exposure to manage our exposure to interest rate volatility.
We have entered into an interest rate swap having an aggregate notional amount of $75.0 million at December 31, 2016 to hedge against interest rate increases on certain of our outstanding variable-rate indebtedness. In the future, we may manage our exposure to interest rate volatility by using hedging arrangements, such as interest rate swaps and interest rate caps. Hedging arrangements involve the risk that the arrangement may fail to protect or adversely affect us because, among other things:
• | interest rate hedging can be expensive, particularly during periods of volatile interest rates; |
• | available interest rate hedges may not correspond directly with the interest rate risk for which protection is sought; |
• | the duration of the hedge may not match the duration of the related liability; |
• | the credit quality of the hedging counterparty owing money on the hedge may be downgraded to such an extent that it impairs our ability to sell or assign our side of the hedging transaction; and |
• | the hedging counterparty owing money in the hedging transaction may default on its obligation to pay. |
As a result of any of the foregoing, our hedging transactions, which are intended to limit losses and exposure to interest rate volatility, could have a material adverse effect on our financial position, results of operations and cash flows.
Our hotel managers and we rely on information technology in our operations.
We and our hotel managers rely on information technology networks and systems, including the Internet, to process, transmit and store electronic information, and to manage or support a variety of business processes, including financial transactions and records, personal identifying information, reservations, billing and operating data. We purchase some of our information technology from vendors, on whom our systems depend. We rely on commercially available systems, software, tools and monitoring to provide security for processing, transmission and storage of confidential customer information, such as individually identifiable information, including information relating to financial accounts. Although we have taken steps to protect the security of our information systems and the data maintained in those systems, it is possible that our safety and security measures will not be able to prevent the systems’ improper functioning or damage, or the improper access or disclosure of personally identifiable information such as in the event of cyber-attacks. Security breaches, including physical or electronic break-ins, computer viruses, attacks by hackers and similar breaches, can create system disruptions, shutdowns or unauthorized disclosure of confidential information. Any failure to maintain proper function, security and availability of our information systems could interrupt our operations, damage our reputation, subject us to liability claims or regulatory penalties.
These conditions could have a material adverse effect on our financial position, results of operations and cash flows.
Joint venture investments could be adversely affected by a lack of sole decision-making authority with respect to such investments, disputes with joint venture partners and the financial condition of joint venture partners.
In the future we may enter into strategic joint ventures with unaffiliated investors to acquire, develop, improve or dispose of hotels, thereby reducing the amount of capital required by us to make investments and diversifying our capital sources for growth. We may not have sole decision-making authority with respect to these investments, and as a result we may not be able to take actions which are in the best interest of our stockholders. Further, disputes between us and our joint venture partners may result in litigation or arbitration which could increase our expenses and prevent our officers and directors from focusing their time and effort on our business and could result in subjecting the hotels owned by the applicable joint venture to additional risks.
If a joint venture partner becomes bankrupt or otherwise defaults on its obligations under a joint venture agreement, we and any other remaining joint venture partners would generally remain liable for the joint venture liabilities. Furthermore, if a joint venture partner becomes bankrupt or otherwise defaults on its obligations under a joint venture agreement, we may be unable to continue the joint venture other than by purchasing such joint venture partner’s interests or the underlying assets at a premium to the market price. If any of the above risks are realized, it could have a material adverse effect on our financial position, results of operations and cash flows.
12
Actions by organized labor could have a material adverse effect on our business.
We believe that unions are generally becoming more aggressive about organizing workers at hotels in certain locations. If the workers employed by the third-party hotel management companies that manage our hotels unionize in the future, potential labor activities at any affected hotel could significantly increase the administrative, labor and legal expenses of the third-party hotel management company that we have engaged to manage that hotel, which likely would adversely affect the operating results of the hotel properties. If hotels in our portfolio are unionized, this could have a material adverse effect on our financial position, results of operations and cash flows.
Risks Related to the Lodging Industry
Economic conditions may adversely affect the lodging industry.
The performance of the lodging industry has historically been closely linked to the performance of the general economy and, specifically, growth in U.S. gross domestic product (“GDP”). The lodging industry is also sensitive to business and personal discretionary spending levels. Declines in corporate budgets and consumer demand due to adverse general economic conditions, risks affecting or reducing travel patterns, lower consumer confidence or adverse political conditions can lower the revenue and profitability of our assets and therefore the net operating profits of our investments. Economic weakness could have a material adverse effect on our financial position, results of operations and cash flows.
We experience a high level of competition from other Upscale and Upper-midscale hotels in the markets in which we operate.
The lodging industry is highly competitive. Our hotels compete with other hotels for guests in each market in which our hotels operate based on a number of factors, including location, convenience, brand affiliation, guestroom rates, range of services and guest amenities or accommodations offered and quality of customer service. We also compete with numerous owners and operators of vacation ownership resorts, as well as alternative lodging companies, such as HomeAway and Airbnb, which operate websites that market available furnished, privately-owned residential properties, including homes and condominiums, that can be rented on a nightly, weekly or monthly basis. Competition will often be specific to the individual markets in which our hotels are located and includes competition from existing and new hotels. Our competitors may have an operating model that enables them to offer guestrooms at lower rates than we can, which could result in our competitors increasing their occupancy at our expense. Competition could adversely affect our occupancy, ADR and RevPAR, and may require us to provide additional amenities or make capital improvements that we otherwise would not have to make.
These conditions could have a material adverse effect on our financial position, results of operations and cash flows.
13
Our operating results and ability to make distributions to our stockholders may be adversely affected by the risks inherent to the ownership of hotels and the markets in which we operate.
Hotels have different economic characteristics than many other real estate assets. A typical office property owner, for example, has long-term leases with third-party tenants, which provide a relatively stable long-term stream of revenue. By contrast, our hotels are subject to various operating risks common to the lodging industry, many of which are beyond our control, including the following:
• | dependence on business and commercial travelers and tourism; |
• | over-building of hotels in our markets, which could adversely affect occupancy and revenue at the hotels we acquire; |
• | increases in energy costs and other expenses affecting travel, which may affect travel patterns and reduce the number of business and commercial travelers and tourists; |
• | increases in operating costs, including increased real estate and personal property taxes, due to inflation and other factors that may not be offset by increased guestroom rates; |
• | potential increases in labor costs at our hotels, including as a result of unionization of the labor force and increasing health care insurance expense; |
• | adverse effects of international, national, regional and local economic and market conditions; |
• | changes in governmental laws and regulations, fiscal policies and zoning ordinances and the related costs of compliance with laws and regulations, fiscal policies and ordinances; and |
• | events beyond our control, such as instability in the national, European or global economy, terrorist attacks, travel related health concerns including pandemics and epidemics such as H1N1 influenza (swine flu), Zika virus, avian bird flu, Ebola and SARS, travel-related environmental concerns including water contamination and air pollution, political instability, regional hostilities, increases in fuel prices, imposition of taxes or surcharges by regulatory authorities and travel-related accidents and unusual weather patterns, including natural disasters such as hurricanes. |
These conditions could have a material adverse effect on our financial position, results of operations and cash flows.
We have significant ongoing needs to make capital expenditures at our hotels, which require us to devote funds to these purposes.
Our hotels have an ongoing need for renovations and other capital improvements, including replacements, from time to time, of furniture, fixtures and equipment. Our franchisors also require periodic capital improvements as a condition of keeping the franchise licenses. In addition, lenders and hotel management companies may require that we set aside annual amounts for capital improvements to our assets. These capital improvements and replacements may give rise to the following risks:
• | possible environmental problems; |
• | construction cost overruns and delays; |
• | a possible shortage of available cash to fund capital improvements and replacements and, the related possibility that financing for these capital improvements may not be available to us on affordable terms; and |
• | uncertainties as to market demand or a loss of market demand after capital improvements and replacements have begun. |
These conditions could have a material adverse effect on our financial position, results of operations and cash flows.
14
Hotel development is subject to timing, budgeting and other risks.
We may develop hotels or acquire hotels that are under development from time to time as suitable opportunities arise, taking into consideration general economic conditions. Hotel development involves a number of risks, including the following:
• | possible environmental problems; |
• | construction delays or cost overruns that may increase project costs; |
• | receipt of and expense related to zoning, occupancy and other required governmental permits and authorizations; |
• | development costs incurred for projects that are not pursued to completion; |
• | acts of God such as earthquakes, hurricanes, floods or fires that could adversely affect a project; |
• | inability to raise capital; and |
• | governmental restrictions on the nature or size of a project. |
To the extent we develop hotels or acquire hotels under development, we cannot provide assurance that any development project will be completed on time or within budget. Our inability to complete a project on time or within budget could have a material adverse effect on our financial position, results of operations and cash flows.
Customers may increasingly use Internet travel intermediaries.
Our hotel guestrooms are likely to be booked through Internet travel intermediaries, including, but not limited to Travelocity.com, Expedia.com and Priceline.com. As these Internet bookings increase, these intermediaries may be able to obtain higher commissions, reduced guestroom rates or other significant contract concessions from our management companies. Moreover, some of these Internet travel intermediaries are attempting to offer hotel guestrooms as a commodity, by increasing the importance of price and general indicators of quality (such as “three-star downtown hotel”) at the expense of brand identification. These agencies hope that consumers will eventually develop brand loyalties to their reservations system rather than to the brands under which our hotels are franchised. If the amount of sales made through Internet intermediaries increases significantly, guestroom revenue may flatten or decrease, which could have a material adverse effect on our financial position, results of operations and cash flows.
We could incur uninsured and underinsured losses.
We intend to maintain comprehensive insurance on our hotels, including liability, fire and extended coverage, of the type and amount we believe are customarily obtained for or by owners of hotels similar to our hotels. Various types of catastrophic losses, like earthquakes and floods, acts of terrorism, data breaches or losses related to business disruption from disputes with franchisors, may not be insurable or may not be economically insurable. In the event of a substantial loss, our insurance coverage may not be sufficient to cover the operating loss or the full market value or replacement cost of our lost investment. Should an uninsured loss or a loss in excess of insured limits occur, we could lose all or a portion of the capital we have invested in a hotel, as well as the anticipated future revenue from the hotel. In that event, we might nevertheless remain obligated for any mortgage debt or other financial obligations related to the asset. Loan covenants, inflation, changes in building codes and ordinances, environmental considerations and other factors might also keep us from using insurance proceeds to replace or renovate an asset after it has been damaged or destroyed. Under those circumstances, the insurance proceeds we receive might be inadequate to restore our economic position on the damaged or destroyed hotels.
These conditions could have a material adverse effect on our financial position, results of operations and cash flows.
Consumer trends and preferences, particularly with respect to younger generations, could change away from select-service hotels.
Consumer trends and preferences continuously change, especially within younger generations. Many new hotel brands have been introduced over recent years to specifically address the perceived unique needs and preferences of younger travelers. As our portfolio is concentrated in select-service hotels, significant consumer shifts in preferences away from select-service hotels could have a material adverse effect on our financial position, results of operations and cash flows.
15
Risks Related to the Real Estate Industry and Real Estate-Related Investments
Illiquidity of real estate investments could significantly impede our ability to respond to adverse changes in the performance of our hotels or to adjust our portfolio in response to changes in economic and other conditions.
Our ability to promptly sell one or more hotels in our portfolio in response to changing economic, financial and investment conditions may be limited. We cannot predict whether we will be able to sell any hotels for the price or on the terms set by us, or whether any price or other terms offered by a prospective purchaser would be acceptable to us. We also cannot predict the length of time needed to find a willing purchaser and to close the sale of an asset. The real estate market is affected by many factors that are beyond our control, including:
• | adverse changes in international, national, regional and local economic and market conditions; |
• | changes in interest rates and in the availability, cost and terms of debt financing; |
• | changes in governmental laws and regulations, fiscal policies and zoning ordinances and the related costs of compliance with laws and regulations, fiscal policies and ordinances; |
• | the ongoing need for capital improvements, particularly in older structures, that may require us to expend funds to correct defects or to make improvements before an asset can be sold; |
• | changes in operating expenses; and |
• | civil unrest, acts of God, including earthquakes, floods and other natural disasters, which may result in uninsured losses, and acts of war or terrorism, including the consequences of the terrorist acts such as those that occurred on September 11, 2001. |
These conditions could have a material adverse effect on our financial position, results of operations and cash flows.
We could incur significant costs related to government regulation and litigation over environmental, health and safety matters.
Our hotels and development land parcels are subject to various federal, state and local environmental laws that impose liability for contamination. Under these laws, governmental entities have the authority to require us, as the current or former owner of the property, to perform or pay for the cleanup of contamination (including hazardous substances, waste or petroleum products) at or emanating from the property and to pay for natural resource damage arising from contamination. These laws often impose liability without regard to whether the owner or operator knew of, or caused the contamination. We can also be liable to private parties for costs of remediation, personal injury and death and/or property damage resulting from contamination at or emanating from our properties. Moreover, environmental contamination can affect the value of a property and, therefore, an owner’s ability to borrow funds using the property as collateral or to sell the property on favorable terms or at all. Furthermore, persons who sent waste to a waste disposal facility, such as a landfill or an incinerator, may be liable for costs associated with cleanup of that facility.
In addition, our hotels (including our real property, operations and equipment) are subject to various federal, state and local environmental, health and safety regulatory requirements that address a wide variety of issues, including, but not limited to the registration, maintenance and operation of our boilers and storage tanks, air emissions from emergency generators, storm water and wastewater discharges, asbestos, lead-based paint, mold and mildew, and waste management. Some of our hotels also routinely handle and use hazardous or regulated substances and wastes as part of their operations, which are subject to regulation (for example, swimming pool chemicals or biological waste). Our hotels incur costs to comply with these environmental, health and safety laws and regulations and if these regulatory requirements are not met or unforeseen events result in the discharge of dangerous or toxic substances at our hotels, we could be subject to fines and penalties for non-compliance with applicable laws and material liability from third parties for harm to the environment, damage to real property or personal injury and death. We are aware of no past or present environmental liability for non-compliance with environmental, health and safety laws and regulations that we believe would have a material adverse effect on our business, assets or results of operations.
Certain hotels we currently own or those we acquire in the future contain, may contain, or may have contained, asbestos-containing material (“ACM”). Environmental, health and safety laws require that ACM be properly managed and maintained, and include requirements to undertake special precautions, such as removal or abatement, if ACM would be disturbed during maintenance, renovation, or demolition of a building. These laws regarding ACM may impose fines and penalties on building owners, employers and operators for failure to comply with these requirements or expose us to third-party liability.
These conditions could have a material adverse effect on our financial position, results of operations and cash flows.
16
Compliance with the laws, regulations and covenants that apply to our hotels, including permit, license and zoning requirements, may adversely affect our ability to make future acquisitions or renovations, result in significant costs or delays and adversely affect our growth strategy.
Our hotels are subject to various covenants and local laws and regulatory requirements, including permitting and licensing requirements which can restrict the use of our properties and increase the cost of acquisition, development and operation of our hotels. In addition, federal and state laws and regulations, including laws such as the ADA, impose further restrictions on our operations. Under the ADA, all public accommodations must meet federal requirements related to access and use by disabled persons. We have not conducted a comprehensive audit or investigation of all of our properties to determine our compliance. As such, some of our hotels currently may be in noncompliance with the ADA. If one or more of the hotels in our portfolio is not in compliance with the ADA or any other regulatory requirements, we may be required to incur additional costs to bring the hotel into compliance and we might incur damages or governmental fines. In addition, existing requirements may change and future requirements may require us to make significant unanticipated expenditures.
These conditions could have a material adverse effect on our financial position, results of operations and cash flows.
We have fixed obligations related to ground leases for land on which certain of our hotels are located.
If we default on the terms of any of our ground leases and are unable to cure the default in a timely manner, we may be liable for damages and could lose our leasehold interest in the applicable property and interest in the hotel on the applicable property. An event of default that is not timely cured could have a material adverse effect on our financial position, results of operations and cash flows.
The states and localities in which we own material amounts of property or conduct material business operations could raise their income and property tax rates or amend their tax regimes in a manner that increases our state and local tax liabilities.
We and our subsidiaries are subject to income tax and other taxes by states and localities in which we conduct business. Additionally, we are and will continue to be subject to property taxes in states and localities in which we own property, and our TRS lessees are and will continue to be subject to state and local corporate income tax. As these states and localities seek additional sources of revenue, they may, among other steps, raise income and property tax rates or amend their tax regimes to eliminate for state income tax purposes the favorable tax treatment REITs enjoy for federal income tax purposes. We cannot predict when or if any states or localities would make any such changes, or what form those changes would take. If states and localities in which we own material amounts of property or conduct material amounts of business make changes to their tax rates or tax regimes that increase our state and local tax liabilities, such increases could have a material adverse effect on our financial position, results of operations and cash flows.
Risks Related to Our Organization and Structure
Our fiduciary duties as the general partner of our Operating Partnership could create conflicts of interest.
We, through our wholly-owned subsidiary that serves as the sole general partner of our Operating Partnership, have fiduciary duties to our Operating Partnership’s limited partners, the discharge of which may conflict with the interests of our stockholders. The limited partners of our Operating Partnership have agreed for so long as we own a controlling interest in our Operating Partnership that, in the event of a conflict between the duties owed by our directors to our company and the duties that we owe, in our capacity as the sole general partner of our Operating Partnership, to the limited partners, our directors must give priority to the interests of our stockholders. In addition, those persons holding Common Units have the right to vote on certain amendments to the limited partnership agreement (which require approval by a majority interest of the limited partners, including us) and individually to approve certain amendments that would adversely affect their rights, as well as the right to vote on mergers and consolidations of the general partner or us in certain limited circumstances. These voting rights may be exercised in a manner that conflicts with the interests of our stockholders. For example, we cannot adversely affect the limited partners’ rights to receive distributions, as set forth in the limited partnership agreement, without their consent, even though modifying such rights might be in the best interest of our stockholders generally.
17
Provisions of our charter may limit the ability of a third party to acquire control of us by authorizing our board of directors to issue additional securities.
Our board of directors may, without stockholder approval, amend our charter to increase or decrease the aggregate number of our shares or the number of shares of any class or series that we have the authority to issue and to classify or reclassify any unissued shares of common stock or preferred stock, and set the preferences, rights and other terms of the classified or reclassified shares. As a result, our board of directors may authorize the issuance of additional shares or establish a series of common or preferred stock that may have the effect of delaying or preventing a change in control of our company, including transactions at a premium over the market price of our shares, even if stockholders believe that a change in control is in their interest. These provisions, along with the restrictions on ownership and transfer contained in our charter and certain provisions of Maryland law described below, could discourage unsolicited acquisition proposals or make it more difficult for a third party to gain control of us, which could adversely affect the market price of our securities.
Provisions of Maryland law may limit the ability of a third party to acquire control of us by requiring our board of directors or stockholders to approve proposals to acquire our company or effect a change in control.
Certain provisions of the Maryland General Corporation Law (the “MGCL”) applicable to Maryland corporations may have the effect of inhibiting a third party from making a proposal to acquire us or of impeding a change in control under circumstances that otherwise could provide our stockholders with the opportunity to realize a premium over the then-prevailing market price of such shares, including “business combination” and “control share” provisions.
By resolution of our board of directors, we have opted out of the business combination provisions of the MGCL and provided that any business combination between us and any other person is exempt from the business combination provisions of the MGCL, provided that the business combination is first approved by our board of directors (including a majority of directors who are not affiliates or associates of such persons). In addition, pursuant to a provision in our bylaws, we have opted out of the control share provisions of the MGCL. However, our board of directors may by resolution elect to opt in to the business combination provisions of the MGCL and we may, by amendment to our bylaws, opt in to the control share provisions of the MGCL in the future.
Our rights and the rights of our stockholders to take action against our directors and officers are limited.
Under Maryland law, generally, a director will not be liable if he or she performs his or her duties in good faith, in a manner he or she reasonably believes to be in our best interests and with the care that an ordinarily prudent person in a like position would use under similar circumstances. In addition, our charter limits the liability of our directors and officers to us and our stockholders for money damages, except for liability resulting from:
• | actual receipt of an improper benefit or profit in money, property or services; or |
• | active and deliberate dishonesty by the director or officer that was established by a final judgment as being material to the cause of action adjudicated. |
Our charter authorizes us to indemnify our directors and officers for actions taken by them in those capacities to the maximum extent permitted by Maryland law. Our bylaws require us to indemnify each director and officer, to the maximum extent permitted by Maryland law, in the defense of any proceeding to which he or she is made, or threatened to be made, a party by reason of his or her service to us. In addition, we may be obligated to advance the defense costs incurred by our directors and officers. As a result, we and our stockholders may have more limited rights against our directors and officers than might otherwise exist absent the current provisions in our charter and bylaws or that might exist with other companies.
18
Our stockholders have limited voting rights and our charter contains provisions that make removal of our directors difficult.
Our shares of common stock are the only class of our securities that carry full voting rights. Voting rights for holders of our preferred stock exist primarily with respect to the ability to elect two additional directors to our board of directors in the event that six quarterly dividends (whether or not consecutive) payable on the preferred stock are in arrears, and with respect to voting on amendments to our charter or articles supplementary relating to the preferred stock that materially and adversely affect the rights of the holders of preferred stock or create additional classes or series of senior equity securities. Further, our charter provides that a director may be removed only for cause (as defined in our charter) and then only by the affirmative vote of holders of shares entitled to cast at least two-thirds of the votes entitled to be cast generally in the election of directors. Our charter also provides that vacancies on our board of directors may be filled only by a majority of the remaining directors in office, even if less than a quorum. These requirements prevent stockholders from removing directors except for cause and with a substantial affirmative vote and from replacing directors with their own nominees and may prevent a change in control of our company or effect other management changes that are in the best interests of our stockholders.
The ability of our board of directors to change our major policies without the consent of stockholders may not be in our stockholders’ interest.
Our board of directors determines our major policies, including policies and guidelines relating to our acquisitions, leverage, financing, growth, operations and distributions to stockholders. Our board of directors may amend or revise these and other policies and guidelines from time to time without the vote or consent of our stockholders. Accordingly, our stockholders will have limited control over changes in our policies and those changes could have a material adverse effect on our financial position, results of operations and cash flows.
Our board of directors has the ability to revoke our REIT qualification without stockholder approval.
Our charter provides that our board of directors may revoke or otherwise terminate our REIT election, without the approval of our stockholders, if it determines that it is no longer in our best interest to continue to qualify as a REIT. If we cease to be a REIT, we would become subject to federal income tax on our taxable income and would no longer be required to distribute most of our taxable income to our stockholders, which may have adverse consequences on the total return to our stockholders.
We are a holding company with no direct operations. As a result, we rely on funds received from our Operating Partnership to pay liabilities and dividends, our stockholders’ claims will be structurally subordinated to all liabilities of our Operating Partnership and our stockholders will not have any voting rights with respect to our Operating Partnership activities, including the issuance of additional Common Units or Preferred Units.
We are a holding company and conduct all of our operations through our Operating Partnership. We do not have, apart from our ownership of our Operating Partnership, any independent operations. As a result, we rely on distributions from our Operating Partnership to pay any dividends we might declare on shares of our common or preferred stock. We also rely on distributions from our Operating Partnership to meet any of our obligations, including tax liability on taxable income allocated to us from our Operating Partnership (which might make distributions to us that do not equal the tax on such allocated taxable income).
In addition, because we are a holding company, stockholders’ claims will be structurally subordinated to all existing and future liabilities and obligations (whether or not for borrowed money) of our Operating Partnership and its subsidiaries. Therefore, in the event of our bankruptcy, liquidation or reorganization, claims of our stockholders will be satisfied only after all of our and our Operating Partnership’s and its subsidiaries’ liabilities and obligations have been paid in full.
We own approximately 99% of the Common Units in the Operating Partnership, all of the issued and outstanding 7.875% Series B Cumulative Redeemable Preferred Units of the Operating Partnership (“Series B Preferred Units”), all of the issued and outstanding 7.125% Series C Cumulative Redeemable Preferred Units of the Operating Partnership (“Series C Preferred Units”), and all of the issued and outstanding 6.45% Series D Cumulative Redeemable Preferred Units of the Operating Partnership (“Series D Preferred Units”), the Series D Preferred Units, Series C Preferred Units and Series B Preferred Units collectively referred to as Preferred Units. Any future issuances by our Operating Partnership of additional Common Units or Preferred Units could reduce our ownership percentage in our Operating Partnership. Because our common stockholders do not directly own any Common Units or Preferred Units, they will not have any voting rights with respect to any such issuances or other partnership-level activities of the Operating Partnership.
19
If we are unable to maintain an effective system of internal controls, we may not be able to produce and report accurate financial information on a timely basis or prevent fraud.
A system of internal controls that is well designed and properly functioning is critical for us to produce and report accurate and reliable financial information and effectively prevent fraud. At times, we may identify areas of our internal controls that are not properly functioning as designed, that need improvement or that must be developed to ensure that we have an adequate system of internal controls. Section 404 of the Sarbanes-Oxley Act of 2002 requires us to evaluate and report on our internal controls over financial reporting and have our independent auditors annually issue their own opinion on our internal controls over financial reporting. We cannot be certain that we will be successful in maintaining adequate internal controls over our financial reporting and processes. Additionally, as we grow our business, our internal controls will become more complex and we will require significantly more resources to ensure that our internal controls remain effective. If we or our independent auditors discover a material weakness, the disclosure of that fact, even if promptly remedied, could cause our stockholders to lose confidence in our financial results, which could reduce the market value of our common shares. Additionally, the existence of any material weakness or significant deficiency could require management to devote substantial time and incur significant expense to remediate any such conditions. There can be no assurance that management will be able to remediate any such material weaknesses or significant deficiencies in a timely manner.
Risks Related to Ownership of Our Securities
The New York Stock Exchange (“NYSE”) or another nationally-recognized exchange may not continue to list our securities.
Our common stock trades on the NYSE under the symbol “INN,” our 7.875% Series B Cumulative Redeemable Preferred Stock trades on the NYSE under the symbol “INNPrB,” our 7.125% Series C Cumulative Redeemable Preferred Stock trades on the NYSE under the symbol “INNPrC,” and our 6.45% Series D Cumulative Redeemable Preferred Stock trades on the NYSE under the symbol “INNPrD.” In order for our securities to remain listed, we are required to meet the continued listing requirements of the NYSE or, in the alternative, any other nationally-recognized exchange to which we apply. We may be unable to satisfy those listing requirements, and there is no guarantee our securities will remain listed on a nationally-recognized exchange. If our securities are delisted from the NYSE or another nationally-recognized exchange, we could face significant material adverse consequences, including:
• | a limited availability of market quotations for our securities; |
• | a limited ability of our stockholders to make transactions in our securities; |
• | additional trading restrictions being placed on us; |
• | reduced liquidity with respect to our securities; |
• | a determination that our common stock is “penny stock,” which will require brokers trading in our common stock to adhere to more stringent rules, possibly resulting in a reduced level of trading activity in the secondary trading market for the common stock; |
• | a limited amount of news and analyst coverage; and |
• | a decreased ability to issue additional securities or obtain additional financing in the future. |
20
The cash available for distribution may not be sufficient to make distributions at expected levels and we may use borrowed funds or funds from other sources to make distributions.
Subject to the preferential rights of the holders of our Series B, Series C, and Series D preferred stock and any other class or series of our stock that are senior to our common stock with respect to distribution rights, we intend to make quarterly distributions to holders of our common stock. Distributions declared by us will be authorized by our board of directors in its sole discretion out of funds legally available for distribution and will depend upon a number of factors, including restrictions under applicable law and the capital requirements of our company. All distributions will be made at the discretion of our board of directors and will depend on our earnings, our financial condition, the requirements for qualification as a REIT, restrictions under applicable law and other factors as our board of directors may deem relevant from time to time. We may be required to fund distributions from working capital, borrowings under our unsecured revolving credit facility, proceeds of future stock offerings or a sale of assets to the extent distributions exceed earnings or cash flows from operations. Funding distributions from working capital would restrict our operations. If we borrow from the unsecured revolving credit facility to pay distributions, we would be more limited in our ability to execute our strategy of using that unsecured revolving credit facility to fund acquisitions. Finally, selling assets may require us to dispose of assets at a time or in a manner that is not consistent with our disposition strategy. If we borrow to fund distributions, our leverage ratios and future interest costs would increase, thereby reducing our earnings and cash available for distribution from what they otherwise would have been. We may not be able to make distributions in the future. In addition, some of our distributions may be considered a return of capital for income tax purposes. If we decide to make distributions in excess of our current and accumulated earnings and profits, such distributions would generally be considered a return of capital for federal income tax purposes to the extent of the holder’s adjusted tax basis in their shares. A return of capital is not taxable, but it has the effect of reducing the holder’s adjusted tax basis in its investment. If distributions exceed the adjusted tax basis of a holder’s shares, they will be treated as gain from the sale or exchange of such stock.
The market price of our stock may be volatile due to numerous circumstances beyond our control.
The trading prices of equity securities issued by REITs and other real estate companies historically have been affected by changes in market interest rates. One of the factors that may influence the market price of our common or preferred stock is the annual yield from distributions on our common or preferred stock, respectively, as compared to yields on other financial instruments. An increase in market interest rates, or a decrease in our distributions to stockholders, may lead prospective purchasers of our common or preferred stock to demand a higher annual yield, which could reduce the market price of our common or preferred stock, respectively.
Other factors that could affect the market price of our stock include the following:
• | actual or anticipated variations in our quarterly results of operations; |
• | changes in market valuations of companies in the lodging industry; |
• | changes in expectations of future financial performance or changes in estimates of securities analysts; |
• | fluctuations in stock market prices and volumes; |
• | our issuances of common stock, preferred stock, or other securities in the future; |
• | the inclusion of our common stock and preferred stock in equity indices, which could induce additional purchases; |
• | the addition or departure of key personnel; |
• | announcements by us or our competitors of acquisitions, investments or strategic alliances; and |
• | unforeseen events beyond our control, such as instability in the national, European or global economy, terrorist attacks, travel related health concerns including pandemics and epidemics such as H1N1 influenza (swine flu), Zika virus, avian bird flu, Ebola and SARS, political instability, regional hostilities, increases in fuel prices, imposition of taxes or surcharges by regulatory authorities and travel-related accidents and unusual weather patterns, including natural disasters such as hurricanes. |
The market’s perception of our growth potential and our current and potential future cash distributions, whether from operations, sales or refinancings, as well as the real estate market value of the underlying assets, may cause our common and preferred stock to trade at prices that differ from our net asset value per share. If we retain operating cash flow for investment purposes, working capital reserves or other purposes, these retained funds, while increasing the value of our underlying assets, may not correspondingly increase the market price of our common and preferred stock. Our failure to meet the market’s expectations with regard to future earnings and distributions likely would adversely affect the market price of our common and preferred stock.
The trading market for our stock will rely in part on the research and reports that industry or financial analysts publish about us or our business. We do not control these analysts. Furthermore, if one or more of the analysts who do cover us
21
downgrades our stock or our industry, or the stock of any of our competitors, the price of our stock could decline. If one or more of these analysts ceases coverage of our company, we could lose attention in the market, which in turn could cause the price of our stock to decline.
The number of shares of our common stock and preferred stock available for future sale could adversely affect the market price per share of our common stock and preferred stock, respectively, and future sales by us of shares of our common stock, preferred stock, or issuances by our Operating Partnership of Common Units may be dilutive to existing stockholders.
Sales of substantial amounts of shares of our common stock or preferred stock in the public market, or upon exchange of Common Units or exercise of any equity awards, or the perception that such sales might occur, could adversely affect the market price of our common stock and preferred stock. As of February 15, 2017, a total of 396,713 Common Units are redeemable and could be converted into shares of our common stock and sold into the public market. The exchange of Common Units for common stock, the vesting of any equity-based awards granted to certain directors, executive officers and other employees under the 2011 Equity Incentive Plan which was amended and restated effective June 15, 2015 (as amended and restated, the “Equity Plan”), the issuance of our common stock or Common Units in connection with hotel, portfolio or business acquisitions and other issuances of our common stock or Common Units could have an adverse effect on the market price of the shares of our common stock.
We may execute future offerings of debt securities, which would be senior to our common and preferred stock upon liquidation, and issuances of equity securities (including Common Units).
In the future we may offer debt securities and issue equity securities, including Common Units, preferred stock or other preferred shares that may be senior to our common stock for purposes of dividend distributions or upon liquidation. Upon liquidation, holders of our debt securities and our preferred shares will receive distributions of our available assets prior to the holders of our common stock. Holders of our common stock are not entitled to pre-emptive rights or other protections against us offering senior debt or equity securities. Therefore, additional common share issuances, directly or through convertible or exchangeable securities (including Common Units), warrants or options, will dilute the holdings of our existing common stockholders and such issuances or the perception of such issuances may reduce the market price of our common stock. In addition, new issues of preferred stock could have a preference on liquidating distributions and a preference on dividend payments that could limit our ability to pay a dividend or make another distribution to the holders of our common stock. Because our decision to issue securities in any future offering will depend on market conditions and other factors beyond our control, we cannot predict or estimate the amount, timing or nature of future issuances. Thus, our stockholders bear the risk of our future offerings reducing the market price of our common stock and diluting their interest in us.
Risks Related to Our Status as a REIT
Failure to remain qualified as a REIT would cause us to be taxed as a regular corporation.
The REIT rules and regulations are highly technical and complex. We believe that our organization and method of operation has enabled us to meet the requirements for qualification and taxation as a REIT commencing with our short taxable year ended December 31, 2011. However, we cannot provide assurance that we will remain qualified as a REIT.
Failure to qualify as a REIT could result from a number of situations, including, without limitation:
• | if the leases of our hotels to our TRS lessees are not respected as true leases for federal income tax purposes; |
• | if our Operating Partnership is treated as a publicly traded partnership taxable as a corporation for federal income tax purposes; |
• | if our existing or future hotel management companies do not qualify as “eligible independent contractors” or if our hotels are not “qualified lodging facilities,” as required by federal income tax law; or |
• | if we fail to meet any of the required REIT qualifications. |
22
If we fail to qualify as a REIT in any taxable year, we will face serious tax consequences that will substantially reduce the funds available for distributions to our stockholders because:
• | we would not be allowed a deduction for dividends paid to stockholders in computing our taxable income and would be subject to federal income tax at regular corporate rates; |
• | we could be subject to the federal alternative minimum tax and possibly increased state and local taxes; and |
• | unless we are entitled to relief under certain federal income tax laws, we could not re-elect REIT status until the fifth calendar year after the year in which we failed to qualify as a REIT. |
In addition, if we fail to qualify as a REIT, we will no longer be required to make distributions. As a result of all these factors, our failure to qualify as a REIT could impair our ability to expand our business and raise capital, and it could adversely affect the value of our stock.
Even if we continue to qualify as a REIT, we may face other tax liabilities.
Even if we continue to qualify for taxation as a REIT, we may be subject to certain federal, state and local taxes on our income and assets including, but not limited to taxes on any undistributed income, tax on income from some activities conducted as a result of a foreclosure, and state or local income, property and transfer taxes. In addition, our TRS is subject to regular corporate federal, state and local taxes. Any of these taxes would decrease cash available for distributions to stockholders.
Failure to make required distributions would subject us to federal corporate income tax.
We intend to operate in a manner so as to qualify as a REIT for federal income tax purposes. To qualify as a REIT, we generally are required to distribute at least 90% of our REIT taxable income, determined without regard to the dividends paid deduction and excluding any net capital gain, each year to our stockholders. To the extent that we satisfy this distribution requirement, but distribute less than 100% of our REIT taxable income, we will be subject to federal corporate income tax on our undistributed taxable income. In addition, we will be subject to a 4% non-deductible excise tax if the actual amount that we pay out to our stockholders in a calendar year is less than a minimum amount specified under the IRC.
We have significant REIT distribution requirements to maintain our status as a REIT.
To satisfy the requirements for qualification as a REIT and to meet the REIT distribution requirements, we may need to borrow funds on a short-term basis or sell assets, even if the then-prevailing market conditions are not favorable for these borrowings or sales. Our cash flows from operations may be insufficient to fund required distributions as a result of differences in timing between the actual receipt of income and the recognition of income for federal income tax purposes, or the effect of non-deductible capital expenditures, the creation of reserves or required debt service or amortization payments. Our REIT distribution requirements could adversely affect our liquidity and may force us to borrow funds or sell assets during unfavorable market conditions or pay taxable stock dividends. The insufficiency of our cash flows to cover our distribution requirements could have an adverse effect on our ability to raise short- and long-term debt or sell equity securities to fund distributions required to maintain our qualification as a REIT. Also, although the Internal Revenue Service (“IRS”) has issued private letter rulings to other REITs, which may be relied upon only by the taxpayers to whom they were issued, and a revenue procedure applicable to our 2007 through 2011 taxable years sanctioning certain issuances of taxable stock dividends by REITs under certain circumstances, no assurance can be given that we will be able to pay taxable stock dividends to meet our REIT distribution requirements.
The formation of our TRS increases our overall tax liability.
Our TRS is subject to federal, state and local income tax on its taxable income, which typically consists of the revenue from the hotels leased by our TRS lessees, net of the operating expenses for such hotels and rent payments to us and, in the case of any hotel that is owned by a wholly-owned subsidiary of our TRS, the revenue from that hotel, net of the operating expenses. Accordingly, although our ownership of our TRS allows us to participate in the operating income from our hotels in addition to receiving rent, that operating income will be fully subject to income tax. The after-tax net income of our TRS is available for distribution to us.
23
Our TRS lessee structure subjects us to the risk of increased hotel operating expenses.
Our leases with our TRS lessees require our TRS lessees to pay us rent based in part on revenue from our hotels. Our operating risks include decreases in hotel revenue and increases in hotel operating expenses, including but not limited to the increases in wage and benefit costs, repair and maintenance expenses, energy costs and other operating expenses, which would adversely affect our TRS’ ability to pay us rent due under the leases. Increases in these operating expenses could have a material adverse effect on our financial condition, results of operations and cash flows.
Our Operating Partnership could be treated as a publicly traded partnership taxable as a corporation for federal income tax purposes.
Although we believe that our Operating Partnership will be treated as a partnership for federal income tax purposes, no assurance can be given that the IRS will not successfully challenge that position. If the IRS were to successfully contend that our Operating Partnership should be treated as a publicly traded partnership taxable as a corporation, we would fail to meet the 75% gross income test and certain of the asset tests applicable to REITs and, unless we qualified for certain statutory relief provisions, we would cease to qualify as a REIT. Also, our Operating Partnership would become subject to federal, state and local income tax, which would reduce significantly the amount of cash available for debt service and for distribution to us.
Our current hotel management companies, or any other hotel management companies that we may engage in the future may not qualify as “eligible independent contractors,” or our hotels may not be considered “qualified lodging facilities.”
Rent paid by a lessee that is a “related party tenant” of ours will not be qualifying income for purposes of the two gross income tests applicable to REITs. An exception is provided, however, for leases of “qualified lodging facilities” to a TRS so long as the hotels are managed by an “eligible independent contractor” and certain other requirements are satisfied. We lease all of our hotels to our TRS lessees. All of our hotels are operated pursuant to hotel management agreements with Interstate and other hotel management companies, each of which we believe qualifies as an “eligible independent contractor.” Among other requirements, to qualify as an eligible independent contractor, the hotel manager must not own, directly or through its stockholders, more than 35% of our outstanding shares, and no person or group of persons can own more than 35% of our outstanding shares and the shares (or ownership interest) of the hotel manager, taking into account certain ownership attribution rules. The ownership attribution rules that apply for purposes of these 35% thresholds are complex, and monitoring actual and constructive ownership of our shares by our hotel managers and their owners may not be practical. Accordingly, there can be no assurance that these ownership levels will not be exceeded.
In addition, for a hotel management company to qualify as an eligible independent contractor, such company or a related person must be actively engaged in the trade or business of operating “qualified lodging facilities” (as defined below) for one or more persons not related to the REIT or its TRS at each time that such company enters into a hotel management contract with a TRS or its TRS lessee. As of the date hereof, we believe each of our hotel management companies operates qualified lodging facilities for certain persons who are not related to us or our TRS. However, no assurances can be provided that our hotel management companies or any other hotel managers that we may engage in the future will in fact comply with this requirement. Failure to comply with this requirement would require us to find other managers for future contracts, and, if we hired a management company without knowledge of the failure, it could jeopardize our status as a REIT.
Finally, each property with respect to which our TRS lessees pay rent must be a “qualified lodging facility.” A “qualified lodging facility” is a hotel, motel or other establishment more than one-half of the dwelling units in which are used on a transient basis, including customary amenities and facilities, provided that no wagering activities are conducted at or in connection with such facility by any person who is engaged in the business of accepting wagers and who is legally authorized to engage in such business at or in connection with such facility. As of the date hereof, we believe that the properties that are leased to our TRS lessees are qualified lodging facilities. Although we intend to monitor future acquisitions and improvements of properties, REIT provisions of the IRC provide only limited guidance for making determinations under the requirements for qualified lodging facilities, and there can be no assurance that these requirements will be satisfied. If we are not deemed to be a "qualified lodging facility," we may fail to qualify as a REIT.
24
Our ownership of our TRS is subject to limitations and our transactions with our TRS could cause us to be subject to a 100% penalty tax on certain income or deductions if those transactions are not conducted on arm’s-length terms.
Overall, no more than 25% (20% for taxable years beginning after December 31, 2017) of the value of a REIT’s assets may consist of stock or securities of one or more TRSs. In addition, the IRC limits the deductibility of interest paid or accrued by a TRS to its parent REIT to provide assurance that the TRS is subject to an appropriate level of corporate taxation. The IRC also imposes a 100% excise tax on certain transactions between a TRS and its parent REIT that are not conducted on an arm’s-length basis. The 100% tax would apply, for example, to the extent that we were found to have charged our TRS lessees rent in excess of an arm’s-length rent. We monitor the value of our investment in our TRS for the purpose of ensuring compliance with TRS ownership limitations and structure our transactions with our TRS on terms that we believe are arm’s length to avoid incurring the 100% excise tax described above. There can be no assurance, however, that we will be able to comply with the 25% (20% for taxable years beginning after December 31, 2017) TRS limitations or to avoid application of the 100% excise tax.
We may be subject to adverse legislative or regulatory tax changes.
At any time, the federal income tax laws governing REITs or the administrative interpretations of those laws may be amended. We cannot predict when or if any new federal income tax law, regulation, or administrative interpretation, or any amendment to any existing federal income tax law, regulation or administrative interpretation, will be adopted, promulgated or become effective and any such law, regulation, or interpretation may take effect retroactively. We and our stockholders could be adversely affected by any such change in, or any new, federal income tax law, regulation or administrative interpretation and we could experience a reduction in the price of our stock.
Stockholders may be restricted from acquiring or transferring certain amounts of our stock.
The stock ownership restrictions of the IRC for REITs and the 9.8% stock ownership limit in our charter may inhibit market activity in our capital stock and restrict our business combination opportunities.
To qualify as a REIT for each taxable year, five or fewer individuals, as defined in the IRC, may not own, beneficially or constructively, more than 50% in value of our issued and outstanding stock at any time during the last half of a taxable year. Attribution rules in the IRC determine if any individual or entity beneficially or constructively owns our capital stock under this requirement. Additionally, at least 100 persons must beneficially own our capital stock during at least 335 days of a taxable year for each taxable year. To help insure that we meet these tests, our charter restricts the acquisition and ownership of shares of our capital stock.
Our charter, with certain exceptions, authorizes our directors to take such actions as are necessary and desirable to preserve our qualification as a REIT. Unless exempted by our board of directors, our charter prohibits any person from beneficially or constructively owning more than 9.8% in value or number of shares, whichever is more restrictive, of the outstanding shares of any class or series of our capital stock. Our board of directors may not grant an exemption from these restrictions to any proposed transferee whose ownership in excess of 9.8% of the value of our outstanding shares would result in our failing to qualify as a REIT. These restrictions on transferability and ownership will not apply, however, if our board of directors determines that it is no longer in our best interest to continue to qualify as a REIT.
We may pay taxable dividends in our common stock and cash, in which case stockholders may sell shares of our common stock to pay tax on such dividends.
We may distribute taxable dividends that are payable in cash and common stock at the election of each stockholder. If we made a taxable dividend payable in cash and common stock, taxable stockholders receiving such dividends will be required to include the full amount of the dividend as ordinary income to the extent of our current and accumulated earnings and profits, as determined for federal income tax purposes. As a result, stockholders may be required to pay income tax with respect to such dividends in excess of the cash dividends received. If a U.S. stockholder sells the common stock that it receives as a dividend to pay this tax, the sales proceeds may be less than the amount included in income with respect to the dividend, depending on the market price of our common stock at the time of the sale. Furthermore, with respect to certain non-U.S. stockholders, we may be required to withhold federal income tax with respect to such dividends, including in respect of all or a portion of such dividend that is payable in common stock. If we made a taxable dividend payable in cash and our common stock and a significant number of our stockholders determine to sell shares of our common stock to pay taxes owed on dividends, it may put downward pressure on the trading price of our common stock. We do not currently intend to pay a taxable dividend of our common stock and cash.
25
The 100% prohibited transactions tax may limit our ability to dispose of our properties, and we could incur a material tax liability if the IRS successfully asserts that the 100% prohibited transaction tax applies to some or all of our past or future dispositions.
A REIT’s net income from prohibited transactions is subject to a 100% tax. In general, prohibited transactions are sales or other dispositions of property, other than foreclosure property, held primarily for sale to customers in the ordinary course of business. We have selectively disposed of certain of our properties in the past and intend to make additional dispositions in the future. Although a safe harbor to the characterization of the sale of property by a REIT as a prohibited transaction is available, some of our past dispositions may not have qualified for that safe harbor and some or all of our future dispositions may not qualify for that safe harbor. We believe that our past dispositions will not be treated as prohibited transactions, and we may avoid disposing of property that may be characterized as held primarily for sale to customers in the ordinary course of business. Consequently, we may choose not to engage in certain sales of our properties or may conduct such sales through our TRS, which would be subject to federal and state income taxation as a corporation. Moreover, no assurance can be provided that the IRS will not assert that some or all of our past or future dispositions are subject to the 100% prohibited transactions tax. If the IRS successfully imposes the 100% prohibited transactions tax on some or all of our dispositions, the resulting tax liability could be material.
The IRS could determine that certain payments we have received in the nature of liquidated damages may not be ignored for purposes of the gross income tests applicable to REITs.
In connection with our purchases and sales of properties, we have received payments in the nature of liquidated damages. The IRC does not specify the treatment of litigation settlements and liquidated damages for purposes of the gross income tests applicable to REITs. The IRS has issued private letter rulings to other taxpayers ruling that such payments will be ignored for purposes of the gross income tests. A private letter ruling can be relied upon only by the taxpayer to whom it was issued. Based on the IRS’s private letters rulings and the advice of our tax advisors, we believe these payments should be ignored for purposes of the gross income tests. No assurance can be provided that the IRS will not successfully challenge that position. In the event of a successful challenge, we believe that we would be able to maintain our REIT status if we qualified to use a REIT “savings clause” and paid the required penalty.
Item 1B. Unresolved Staff Comments.
None.
26
Item 2. Properties.
Our Portfolio
A list of our hotel properties as of December 31, 2016 is included in the table below. According to current chain scales as defined by STR, as of December 31, 2016, one of our hotel properties with 157 guestrooms is categorized as an Upper-upscale hotel, 60 of our hotel properties with 8,361 guestrooms were categorized as Upscale hotels and 20 of our hotel properties with 2,439 guestrooms were categorized as Upper-midscale hotels. At December 31, 2016, legal title to one of our hotels was held by a qualified intermediary (a “Parked Asset”) pending completion of a reverse 1031 Exchange in connection with certain properties that were under contract for sale to affiliates of American Capital Realty Hospitality Trust, Inc. (“ARCH”). See Item 7. — “Management’s Discussion and Analysis of Financial Condition and Results of Operations — Hotel Property Portfolio Activity.” While a hotel is a Parked Asset, we retain essentially all of the legal and economic benefits and obligations related to the Parked Asset. As such, the Parked Asset is consolidated as a variable interest entity (“VIE”) in our Consolidated Balance Sheet at December 31, 2016 and the operating results of the Parked Asset are consolidated in our Consolidated Statement of Operations for the year then ended. Hotel information for the year ended December 31, 2016 is as follows:
Franchise/Brand | Location | Number of Guestrooms | |||
Marriott/Starwood(1) | |||||
Courtyard by Marriott(2) | Indianapolis, IN | 297 | |||
Courtyard by Marriott(3) | Nashville (West End), TN | 226 | |||
Courtyard by Marriott(3) | New Orleans (Convention), LA | 202 | |||
Courtyard by Marriott(3) | Atlanta (Decatur), GA | 179 | |||
Courtyard by Marriott(2) | Phoenix (Scottsdale), AZ | 153 | |||
Courtyard by Marriott(2) | New Orleans (Metairie), LA | 153 | |||
Courtyard by Marriott(3) | Atlanta (Downtown), GA | 150 | |||
Courtyard by Marriott(3) | New Orleans (French Quarter), LA | 140 | |||
Courtyard by Marriott(3)(7) | Jackson, MS | 117 | |||
Courtyard by Marriott(3) | Dallas (Arlington), TX | 103 | |||
Courtyard by Marriott(3)(7) | Memphis (Germantown), TN | 93 | |||
Courtyard by Marriott(3)(7) | El Paso, TX | 90 | |||
Fairfield Inn & Suites by Marriott(2) | Louisville, KY | 140 | |||
Fairfield Inn & Suites by Marriott(3)(7) | Memphis (Germantown), TN | 80 | |||
Fairfield Inn & Suites by Marriott(3) | Dallas (Fort Worth), TX | 70 | |||
Four Points(3) | San Francisco, CA | 101 | |||
Marriott(3) | Boulder, CO | 157 | |||
Residence Inn by Marriott(3) | Salt Lake City, UT | 189 | |||
Residence Inn by Marriott(3) | Atlanta (Midtown), GA | 160 | |||
Residence Inn by Marriott(3)(4) | Hunt Valley, MD | 141 | |||
Residence Inn by Marriott(2)(4) | Portland, OR | 124 | |||
Residence Inn by Marriott(2) | New Orleans (Metairie), LA | 120 | |||
Residence Inn by Marriott(3) | Branchburg, NJ | 101 | |||
Residence Inn by Marriott(3)(7) | Jackson (Ridgeland), MS | 100 | |||
Residence Inn by Marriott(3) | Dallas (Arlington), TX | 96 | |||
Residence Inn by Marriott(3)(7) | Memphis (Germantown), TN | 78 | |||
SpringHill Suites by Marriott(3) | New Orleans, LA | 208 | |||
SpringHill Suites by Marriott(2) | Louisville, KY | 198 | |||
SpringHill Suites by Marriott(2) | Indianapolis, IN | 156 | |||
SpringHill Suites by Marriott(2) | Phoenix (Scottsdale), AZ | 121 | |||
SpringHill Suites by Marriott(3) | Minneapolis (Bloomington), MN | 113 | |||
SpringHill Suites by Marriott(3) | Nashville, TN | 78 | |||
Total Marriott/Starwood (32 hotel properties) | 4,434 | ||||
27
Franchise/Brand | Location | Number of Guestrooms | |||
Hilton | |||||
DoubleTree(3) | San Francisco, CA | 210 | |||
Hampton Inn(3) | Boston (Norwood), MA | 139 | |||
Hampton Inn(2) | Santa Barbara (Goleta), CA | 101 | |||
Hampton Inn(3) | Provo, UT | 87 | |||
Hampton Inn & Suites(3) | Minneapolis, MN | 211 | |||
Hampton Inn & Suites(3)(4) | Austin, TX | 209 | |||
Hampton Inn & Suites(3) | Minneapolis (Bloomington), MN | 146 | |||
Hampton Inn & Suites(2) | Tampa (Ybor City), FL | 138 | |||
Hampton Inn & Suites(2) | Ventura (Camarillo), CA | 116 | |||
Hampton Inn & Suites(2) | San Diego (Poway), CA | 108 | |||
Hampton Inn & Suites(2) | Dallas (Fort Worth), TX | 105 | |||
Hampton Inn & Suites(3) | Nashville (Smyrna), TN | 83 | |||
Hilton Garden Inn(3)(4) | Houston (Galleria), TX | 190 | |||
Hilton Garden Inn(2) | Houston (Energy Corridor), TX | 182 | |||
Hilton Garden Inn(2) | Birmingham, AL | 130 | |||
Hilton Garden Inn(2) | Atlanta (Duluth), GA | 122 | |||
Hilton Garden Inn(2) | Greenville, SC | 120 | |||
Hilton Garden Inn(2) | Nashville (Smyrna), TN | 112 | |||
Hilton Garden Inn(2) | Dallas (Fort Worth), TX | 98 | |||
Hilton Garden Inn(3) | Minneapolis (Eden Prairie), MN | 97 | |||
Hilton Garden Inn(2) | Birmingham, AL | 95 | |||
Homewood Suites(3)(7) | Jackson (Ridgeland), MS | 91 | |||
Total Hilton (22 hotel properties) | 2,890 | ||||
Hyatt | |||||
Hyatt House(3) | Miami, FL | 156 | |||
Hyatt House(2) | Denver (Englewood), CO | 135 | |||
Hyatt Place(3) | Minneapolis, MN | 213 | |||
Hyatt Place(3)(6) | Chicago (Downtown), IL | 206 | |||
Hyatt Place(2) | Chicago (Lombard), IL | 151 | |||
Hyatt Place(2) | Orlando (Convention), FL | 150 | |||
Hyatt Place(2) | Orlando (Universal), FL | 150 | |||
Hyatt Place(2) | Atlanta, GA | 150 | |||
Hyatt Place(3) | Fort Myers, FL | 148 | |||
Hyatt Place(3)(4) | Portland, OR | 136 | |||
Hyatt Place(3) | Phoenix, AZ | 127 | |||
Hyatt Place(2) | Dallas (Arlington), TX | 127 | |||
Hyatt Place(2) | Denver (Lone Tree), CO | 127 | |||
Hyatt Place(2) | Phoenix (Scottsdale), AZ | 126 | |||
Hyatt Place (2) | Denver (Englewood), CO | 126 | |||
Hyatt Place(2) | Chicago (Hoffman Estates), IL | 126 | |||
Hyatt Place(2) | Baltimore (Owing Mills), MD | 123 | |||
Hyatt Place(3)(5) | Long Island (Garden City), NY | 122 | |||
Total Hyatt (18 hotel properties) | 2,599 | ||||
28
Franchise/Brand | Location | Number of Guestrooms | |||
IHG | |||||
Holiday Inn(3)(4) | Atlanta (Duluth), GA | 143 | |||
Holiday Inn Express(3) | Charleston, WV | 66 | |||
Holiday Inn Express & Suites(3) | San Francisco, CA | 252 | |||
Holiday Inn Express & Suites(3) | Minneapolis (Minnetonka), MN | 93 | |||
Holiday Inn Express & Suites(2) | Salt Lake City (Sandy), UT | 88 | |||
Hotel Indigo(3) | Asheville, NC | 115 | |||
Staybridge Suites(3) | Denver (Glendale), CO | 121 | |||
Staybridge Suites(3)(7) | Jackson, MS | 92 | |||
Total IHG (8 hotel properties) | 970 | ||||
Carlson | |||||
Country Inn & Suites by Carlson(3) | Charleston, WV | 64 | |||
Total Carlson (1 hotel property) | 64 | ||||
Total Portfolio (81 hotel properties) | 10,957 | ||||
(1) On September 23, 2016, Marriott completed its previously announced acquisition of Starwood Hotels & Resorts Worldwide, Inc. (“Starwood”). As a result of the transaction, Starwood became an indirect, wholly owned subsidiary of Marriott.
(2) | These hotel properties are subject to mortgage debt at December 31, 2016. For additional information concerning our mortgage debt and lenders, see Item 7. — “Management’s Discussion and Analysis of Financial Condition and Results of Operations — Outstanding Indebtedness,” and "Note 5-Debt,” to our Consolidated Financial Statements included under Item 8. — “Financial Statements and Supplementary Data.” |
(3) | These hotel properties are unencumbered or included in our borrowing base for our unsecured credit facilities at December 31, 2016. |
(4) | These hotel properties are subject to ground leases as described below in “Other Hotel Operating Agreements — Ground Leases.” |
(5) | This hotel property is subject to a PILOT (payment in lieu of taxes) lease as described below in “Other Hotel Operating Agreements — Ground Leases.” |
(6) | This hotel was a Parked Asset at December 31, 2016. See Item 7. — “Management’s Discussion and Analysis of Financial Condition and Results of Operations — Hotel Property Portfolio Activity.” |
(7) | These hotel properties are currently under contract to be sold to an affiliate of ARCH pursuant to a purchase and sale agreement that was reinstated on February 11, 2016. See Item 7. — “Management’s Discussion and Analysis of Financial Condition and Results of Operations — Hotel Property Portfolio Activity.” |
In addition to our hotel property portfolio, we own six parcels of land. Two of the parcels are designated as held for sale. The parcels are generally suitable for the development of new hotel properties, possible expansion of existing hotel properties or the development of restaurants. When unique opportunities to develop hotels utilizing our own resources arise, we may develop our own hotels on occasion. We may also sell these parcels in the future if and when market conditions warrant if we opt not to develop our own hotels on these parcels. To reduce the risk of incurring a prohibited transaction tax on any sales, we may transfer some or all of these parcels to our TRS.
Our Hotel Operating Agreements
Ground Leases
At December 31, 2016, six of our hotel properties are subject to ground lease agreements that cover all of the land underlying the respective hotel property.
• | The Residence Inn by Marriott located in Portland, OR is subject to a ground lease with an initial lease termination date of June 30, 2084 with one option to extend for an additional 14 years. Ground rent for the initial lease term was prepaid in full at the time we acquired the leasehold interest. If the option to extend is exercised, monthly ground rent will be charged based on a formula established in the ground lease. |
• | The Hampton Inn & Suites located in Austin, TX is subject to a ground lease with an initial lease termination date of May 31, 2050. Annual ground rent currently is estimated to be $0.4 million for 2017 including performance based incentive rent. Annual rent is increased every five years with the next adjustment coming in 2020. |
• | The Hilton Garden Inn located in Houston (Galleria Area), Texas is subject to a ground lease with an initial lease termination date of April 20, 2053 with one option to extend for an additional 10 years. Annual ground rent currently is estimated to be $0.5 million for 2017 including performance based incentive rent. Annual rent is increased every five years with the next adjustment coming in 2018. |
• | The Hyatt Place located in Portland, OR is subject to a ground lease with a lease termination date of June 30, 2084 with one option to extend for an additional 14 years. Ground rent for the initial lease term was prepaid in full at the time we acquired the leasehold interest. If the option to extend is exercised, monthly ground rent will be charged based on a formula established in the ground lease. |
29
• | The Holiday Inn located in Duluth, GA is subject to a ground lease with a lease termination date of April 1, 2069. Annual ground rent currently is estimated to be $0.2 million in 2017. Annual rent is increased annually by 3% for each successive lease year, on a cumulative basis. |
• | The Residence Inn by Marriott located in Baltimore (Hunt Valley), MD is subject to a ground lease with an initial termination date of December 31, 2019 and twelve successive five-year renewal periods with each term payment increasing by 12.5%. Annual ground rent is currently estimated to be $0.4 million for 2017. |
These ground leases generally require us to make rental payments and payments for our share of charges, costs, expenses, assessments and liabilities, including real property taxes and utilities. Furthermore, these ground leases generally require us to obtain and maintain insurance covering the subject property.
In addition, the Hyatt Place located in Garden City, NY is subject to a PILOT (payment in lieu of taxes) lease with the Town of Hempstead Industrial Development Authority (the “IDA”), as lessor. The lease expires on December 31, 2019. Upon expiration of the lease, we expect to exercise our right to acquire a fee simple interest in the Garden City hotel property from the IDA for a nominal consideration.
Franchise Agreements
At December 31, 2016, all of our hotel properties operate under franchise agreements with Marriott, Hilton, Hyatt, IHG, or Country Inns & Suites By Carlson, Inc. (“Carlson”). We believe that the public’s perception of the quality associated with a brand-name hotel is an important feature in its attractiveness to guests. Franchisors provide a variety of benefits to franchisees, including centralized reservation systems, national advertising, marketing programs and publicity designed to increase brand awareness, loyalty programs, training of personnel and maintenance of operational quality at hotels across the brand system.
The terms of our franchise agreements generally range from 10 to 20 years with various extension provisions. Each franchisor receives franchise fees ranging from 2% to 6% of each hotel property’s room revenue, and some agreements require that we pay marketing fees of up to 4% of room revenue. In addition, some of these franchise agreements require that we deposit into a reserve fund for capital expenditures up to 5% of the hotel property’s gross or room revenues depending on the franchisor to insure we comply with the franchisors’ standards and requirements. We also pay fees to our franchisors for services such as reservation and information systems.
30
Hotel Management Agreements
At December 31, 2016, all of our hotel properties are operated pursuant to hotel management agreements with third-party hotel management companies as follows:
Management Company | Number of Properties | Number of Guestrooms | ||||
Interstate Management Company, LLC and its affiliate Noble Management Group, LLC | 40 | 4,874 | ||||
Select Hotel Group, LLC | 12 | 1,681 | ||||
Affiliates of Marriott, including Courtyard Management Corporation, SpringHill SMC Corporation and Residence Inn by Marriott | 6 | 973 | ||||
White Lodging Services Corporation | 4 | 791 | ||||
Pillar Hotels and Resorts, LLC | 7 | 723 | ||||
OTO Development, LLC | 3 | 466 | ||||
Affiliates of IHG including IHG Management (Maryland) LLC and Intercontinental Hotel Group Resources, Inc. | 2 | 395 | ||||
American Liberty Hospitality, Inc. | 2 | 372 | ||||
Stonebridge Realty Advisors, Inc. | 2 | 367 | ||||
Kana Hotels, Inc. | 3 | 315 | ||||
Total | 81 | 10,957 | ||||
Our typical hotel management agreement requires us to pay a base fee to our hotel manager calculated as a percentage of hotel revenues. In addition, our hotel management agreements generally provide that the hotel manager can earn an incentive fee for revenue or EBITDA over certain thresholds. Our TRS lessees may employ other hotel managers in the future. We do not, and will not, have any ownership or economic interest in any of the hotel management companies engaged by our TRS lessees.
Item 3. Legal Proceedings.
We are involved from time to time in litigation arising in the ordinary course of business; however, there are currently no pending legal actions that we believe would have a material adverse effect on our financial position or results of operations.
Item 4. Mine Safety Disclosures.
Not applicable.
31
PART II
Item 5. | Market for Registrant’s Common Equity, Related Stockholder Matters and Issuer Purchases of Equity Securities. |
Market Information
Our common stock began trading on the NYSE on February 9, 2011 under the symbol “INN.” Prior to that time, there was no public trading market for our common stock. The last reported sale price for our common stock as reported on the NYSE on February 15, 2017 was $16.11 per share. The following table sets forth the high and low sales price per share of our common stock per quarter reported on the NYSE, and the distributions declared on our common stock for each of the quarters indicated.
2016 | High | Low | Distribution Declared Per Common Share/Unit | |||||||||
Fourth Quarter | $ | 16.04 | $ | 12.57 | $ | 0.1625 | ||||||
Third Quarter | $ | 14.37 | $ | 13.09 | $ | 0.1625 | ||||||
Second Quarter | $ | 13.24 | $ | 11.06 | $ | 0.1325 | ||||||
First Quarter | $ | 11.97 | $ | 9.28 | $ | 0.1325 | ||||||
2015 | High | Low | Distribution Declared Per Common Share/Unit | |||||||||
Fourth Quarter | $ | 13.75 | $ | 11.58 | $ | 0.1175 | ||||||
Third Quarter | $ | 14.61 | $ | 11.36 | $ | 0.1175 | ||||||
Second Quarter | $ | 14.22 | $ | 12.57 | $ | 0.1175 | ||||||
First Quarter | $ | 14.42 | $ | 12.25 | $ | 0.1175 | ||||||
Stockholder Information
As of February 15, 2017, our common stock was held of record by 321 holders and there were 93,513,014 shares of our common stock outstanding.
Distribution Information
As a REIT, we must distribute annually to our stockholders an amount at least equal to 90% of our REIT taxable income, determined without regard to the deduction for dividends paid and excluding any net capital gain. We will be subject to income tax on our taxable income that is not distributed and to an excise tax to the extent that certain percentages of our taxable income are not distributed by specified dates. Our cash available for distribution may be less than the amount required to meet the distribution requirements for REITs under the IRC and we may be required to borrow money, sell assets or issue capital stock to satisfy the distribution requirements to maintain our REIT status.
The timing and frequency of distributions will be authorized by our Board of Directors, in its sole discretion, and declared by us based upon a variety of factors deemed relevant by our directors, including financial condition, restrictions under applicable law and loan agreements, capital requirements and the REIT requirements of the IRC. Our ability to make distributions will generally depend on receipt of distributions from the Operating Partnership, which depends primarily on lease payments from our TRS lessees with respect to our hotels.
We are generally restricted from declaring or paying any distributions, or setting aside any funds for the payment of distributions, on our common stock unless full cumulative distributions on our preferred stock have been declared and either paid or set aside for payment in full for all past distribution periods.
32
Securities Authorized for Issuance Under Equity Compensation Plans
The following table provides information as of December 31, 2016 with respect to our securities that may be issued under existing equity compensation plans:
Plan Category | Number of Securities to be Issued Upon Exercise of Outstanding Options | Weighted Average Exercise Price of Outstanding Options | Number of Securities Remaining Available for Future Issuance Under Equity Compensation Plans (1) | |||||||
Equity Compensation Plans Approved by Summit Hotel Properties, Inc. Stockholders (2) | 235,000 | $ | 9.75 | 3,271,876 | ||||||
Equity Compensation Plans Not Approved by Summit Hotel Properties, Inc. Stockholders | — | — | — | |||||||
Total | 235,000 | $ | 9.75 | 3,271,876 | ||||||
(1) Excludes securities reflected in the column entitled “Number of Securities to be Issued Upon Exercise of Outstanding Options.”
(2) Consists of our Equity Plan.
During the year ended December 31, 2016, certain of our employees chose to have us acquire from them an aggregate of 61,622 common shares to pay their withholding taxes due upon vesting of restricted common shares granted pursuant to share award agreements. The average price paid by us for these shares was $11.63 per share.
33
Stock Performance Graph
The following graph compares the yearly change in our cumulative total stockholder return on our common shares from December 31, 2011 and through December 31, 2016, with the yearly change in the Standard and Poor’s 500 Stock Index (“S&P 500 Index”), and the SNL US REIT Hotel Index for the same period, assuming a base share price of $100.00 for our common stock, the S&P 500 Index and the SNL US REIT Hotel Index for comparative purposes. The SNL US REIT Hotel Index is composed of publicly traded REITs, all of which focus on investments in hotel properties. Total stockholder return equals appreciation in stock price plus dividends paid and assumes that all dividends are reinvested. The performance graph is not indicative of future investment performance. We do not make or endorse any predictions as to future share price performance.
Period Ended | ||||||||||||||||||
Index | 12/31/2011 | 12/31/2012 | 12/31/2013 | 12/31/2014 | 12/31/2015 | 12/31/2016 | ||||||||||||
Summit Hotel Properties, Inc. | 100.00 | 103.36 | 102.64 | 148.42 | 147.87 | 207.27 | ||||||||||||
S&P 500 Index | 100.00 | 114.23 | 151.23 | 171.93 | 174.31 | 195.16 | ||||||||||||
SNL US REIT Hotel | 100.00 | 111.44 | 140.78 | 185.83 | 143.76 | 178.17 | ||||||||||||
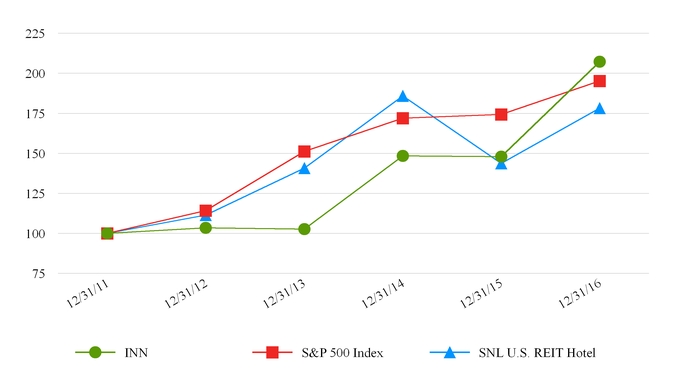
34
Item 6. Selected Financial Data.
The following information should be read in conjunction with “Management’s Discussion and Analysis of Financial Condition and Results of Operations” and our audited Consolidated Financial Statements and related notes thereto, appearing elsewhere in this Form 10-K.
(in thousands, except per share amounts) | 2016 | 2015 | 2014 | 2013 | 2012 | |||||||||||||||
Statement of Operations Data | ||||||||||||||||||||
Revenues: | ||||||||||||||||||||
Room | $ | 443,270 | $ | 436,202 | $ | 380,472 | $ | 283,279 | $ | 154,600 | ||||||||||
Other hotel operations revenue | 30,665 | 27,253 | 22,994 | 15,679 | 7,100 | |||||||||||||||
Total revenues | 473,935 | 463,455 | 403,466 | 298,958 | 161,700 | |||||||||||||||
Expenses: | ||||||||||||||||||||
Hotel operating expenses: | ||||||||||||||||||||
Room | 110,221 | 109,844 | 101,150 | 80,391 | 45,130 | |||||||||||||||
Other direct | 64,608 | 64,010 | 55,388 | 39,815 | 21,284 | |||||||||||||||
Other indirect | 120,852 | 121,974 | 104,959 | 78,136 | 44,028 | |||||||||||||||
Total hotel operating expenses | 295,681 | 295,828 | 261,497 | 198,342 | 110,442 | |||||||||||||||
Depreciation and amortization | 72,406 | 64,052 | 63,763 | 49,330 | 30,645 | |||||||||||||||
Corporate general and administrative | 19,292 | 21,204 | 19,884 | 12,929 | 9,573 | |||||||||||||||
Hotel property acquisition costs | 3,492 | 1,246 | 769 | 1,886 | 3,050 | |||||||||||||||
Loss on impairment of assets | 577 | 1,115 | 8,847 | 1,369 | 660 | |||||||||||||||
Total expenses | 391,448 | 383,445 | 354,760 | 263,856 | 154,370 | |||||||||||||||
Operating income | 82,487 | 80,010 | 48,706 | 35,102 | 7,330 | |||||||||||||||
Other income (expense): | ||||||||||||||||||||
Interest expense | (28,091 | ) | (30,414 | ) | (28,517 | ) | (21,991 | ) | (14,909 | ) | ||||||||||
Gain (loss) on disposal of assets, net | 49,855 | 65,067 | 391 | 363 | (199 | ) | ||||||||||||||
Other income (expense) | 2,560 | 11,146 | 595 | (1,955 | ) | 103 | ||||||||||||||
Total other income (expense), net | 24,324 | 45,799 | (27,531 | ) | (23,583 | ) | (15,005 | ) | ||||||||||||
Income (loss) from continuing operations before income taxes | 106,811 | 125,809 | 21,175 | 11,519 | (7,675 | ) | ||||||||||||||
Income tax benefit (expense) | 1,450 | (553 | ) | (744 | ) | (4,894 | ) | 728 | ||||||||||||
Income (loss) from continuing operations | 108,261 | 125,256 | 20,431 | 6,625 | (6,947 | ) | ||||||||||||||
Income (loss) from discontinued operations | — | — | 492 | (728 | ) | 4,677 | ||||||||||||||
Net income (loss) | 108,261 | 125,256 | 20,923 | 5,897 | (2,270 | ) | ||||||||||||||
Less - income attributable to non-controlling interests: | ||||||||||||||||||||
Operating partnership | (456 | ) | (819 | ) | (51 | ) | 297 | 1,194 | ||||||||||||
Joint venture | — | — | (1 | ) | (316 | ) | — | |||||||||||||
Net income (loss) attributable to Summit Hotel Properties, Inc. | 107,805 | 124,437 | 20,871 | 5,878 | (1,076 | ) | ||||||||||||||
Preferred dividends | (18,232 | ) | (16,588 | ) | (16,588 | ) | (14,590 | ) | (4,625 | ) | ||||||||||
Premium on redemption of Series A Preferred Stock | (2,125 | ) | — | — | — | — | ||||||||||||||
Net income (loss) attributable to common stockholders | $ | 87,448 | $ | 107,849 | $ | 4,283 | $ | (8,712 | ) | $ | (5,701 | ) | ||||||||
Earnings per share - Basic: | ||||||||||||||||||||
Net income (loss) per share from continuing operations | $ | 1.00 | $ | 1.25 | $ | 0.04 | $ | (0.11 | ) | $ | (0.28 | ) | ||||||||
Net income (loss) per share from discontinued operations | — | — | 0.01 | (0.01 | ) | 0.11 | ||||||||||||||
Net income (loss) per share | $ | 1.00 | $ | 1.25 | $ | 0.05 | $ | (0.12 | ) | $ | (0.17 | ) | ||||||||
Earnings per share - Diluted: | ||||||||||||||||||||
Net income (loss) per share from continuing operations | $ | 1.00 | $ | 1.24 | $ | 0.04 | $ | (0.11 | ) | $ | (0.28 | ) | ||||||||
Net income (loss) per share from discontinued operations | — | — | 0.01 | (0.01 | ) | 0.11 | ||||||||||||||
Net income (loss) per share | $ | 1.00 | $ | 1.24 | $ | 0.05 | $ | (0.12 | ) | $ | (0.17 | ) | ||||||||
Weighted average common shares outstanding: | ||||||||||||||||||||
Basic | 86,874 | 85,920 | 85,242 | 70,327 | 33,717 | |||||||||||||||
Diluted | 87,343 | 87,144 | 85,566 | 70,327 | 33,849 | |||||||||||||||
Dividends per share | $ | 0.55 | $ | 0.47 | $ | 0.46 | $ | 0.45 | $ | 0.45 | ||||||||||
Balance Sheet Data | ||||||||||||||||||||
Total assets | $ | 1,718,505 | $ | 1,575,394 | $ | 1,453,835 | $ | 1,288,540 | $ | 806,388 | ||||||||||
Debt | $ | 652,414 | $ | 671,536 | $ | 621,344 | $ | 429,653 | $ | 308,212 | ||||||||||
Total equity | $ | 1,013,470 | $ | 856,926 | $ | 785,201 | $ | 822,378 | $ | 473,537 | ||||||||||
35
Item 7. Management’s Discussion and Analysis of Financial Condition and Results of Operations.
Industry Trends and Outlook
Room-night demand in the U.S. lodging industry is generally correlated to macroeconomic trends. Key drivers of demand include growth in GDP, corporate profits, capital investments and employment. The recent volatility of the economy and lodging industry and the risk that global and domestic economic conditions may cause economic growth to slow or stall, could adversely affect industry growth expectations. Also, increasing supply in the industry may reduce growth expectations.
The U.S. lodging industry experienced a positive trend through 2016 that we expect to continue at a slower rate in 2017. According to a report prepared in January 2017 by PricewaterhouseCoopers, LLP, U.S. RevPAR growth in 2016 for Upscale hotels was 2.1%, while projected 2017 RevPAR growth is 1.2%. While we continue to have a positive outlook on national macro-economic conditions and their effect on RevPAR growth, room-night demand expectations for fiscal year 2017 are expected to decelerate from those experienced in 2016 based on anticipated levels of business and leisure travel. While the supply of new hotels under construction has increased and is expected to accelerate in 2017, we expect that our operating results will not be adversely affected to a substantial degree by near-term increases in lodging supply in our markets.
Operating Performance Metrics
We use a variety of operating performance indicators and other information to evaluate the financial condition and operating performance of our business. These key indicators include financial information that is prepared in accordance with GAAP, as well as other financial information that is not prepared in accordance with GAAP. In addition, we use other information that may not be financial in nature, including statistical information and comparative data. We use this information to measure the performance of individual hotel properties, groups of hotel properties and/or our business as a whole. We periodically compare historical information to our internal budgets as well as industry-wide information. These key indicators include:
• | Occupancy — Occupancy represents the total number of guestrooms occupied divided by the total number of guestrooms available. |
• | Average Daily Rate (ADR) — ADR represents total room revenues divided by the total number of guestrooms occupied. |
• | Revenue Per Available Room (RevPAR) — RevPAR is the product of ADR and Occupancy. |
Occupancy, ADR and RevPAR are commonly used measures within the hotel industry to evaluate operating performance. RevPAR is an important metric for monitoring operating performance at the individual hotel property level and across our business as a whole. We evaluate individual hotel RevPAR performance on an absolute basis with comparisons to budget and prior periods, as well as on a company-wide and regional basis. ADR and RevPAR are based only on room revenue. Room revenue depends on demand (as measured by occupancy), pricing (as measured by ADR), and our available supply of hotel guestrooms. Our ADR, occupancy and RevPAR performance may be affected by macroeconomic factors such as regional and local employment growth, personal income and corporate earnings, office vacancy rates and business relocation decisions, air travel and other business and leisure travel, new hotel property construction, and the pricing strategies of competitors. In addition, our ADR, occupancy and RevPAR performance is dependent on the continued success of our franchisors and brands.
36
Hotel Property Portfolio Activity
Acquisitions
We acquired four hotel properties in 2016 and seven hotel properties in 2015. A summary of these acquisitions is as follows (dollars in thousands):
Date Acquired | Franchise/Brand | Location | Guestrooms | Purchase Price(1) | ||||||||
Year Ended December 31, 2016 | ||||||||||||
January 19 | Courtyard by Marriott | Nashville, TN | 226 | $ | 71,000 | |||||||
January 20 | Residence Inn | Atlanta, GA | 160 | 38,000 | ||||||||
August 9 | Marriott | Boulder, CO | 157 | 61,400 | ||||||||
October 28 | Hyatt Place | Chicago, IL | 206 | 73,750 | ||||||||
749 | $ | 244,150 | (2) | |||||||||
Year Ended December 31, 2015 | ||||||||||||
April 13 | Hampton Inn & Suites | Minneapolis, MN | 211 | $ | 38,951 | |||||||
June 18 | Hampton Inn | Boston (Norwood), MA | 139 | 24,000 | ||||||||
June 30 | Hotel Indigo | Asheville, NC | 115 | 35,000 | ||||||||
July 24 | Residence Inn | Branchburg, NJ | 101 | 25,700 | ||||||||
July 24 | Residence Inn | Baltimore (Hunt Valley), MD | 141 | 31,100 | ||||||||
October 19 | Hyatt House | Miami, FL | 156 | 39,000 | ||||||||
October 20 | Courtyard by Marriott | Atlanta (Decatur), GA | 179 | 44,000 | ||||||||
1,042 | $ | 237,751 | (3) | |||||||||
(1) | In addition to the purchase price, we may anticipate investing additional amounts for hotel renovations at the time we purchase a hotel property. Such additional investments are included in our underwriting of the hotel property prior to purchase. See Item 7. – "Management's Discussion and Analysis of Financial Condition and Results of Operations – Capital Expenditures." |
(2) | The net assets acquired totaled $244.7 million due to the purchase at settlement of $0.6 million of net working capital assets. |
(3) | The net assets acquired totaled $237.9 million due to the purchase at settlement of $0.1 million of net working capital assets. |
The purchase price in 2016 was funded by the net proceeds of our Series D cumulative redeemable preferred stock offering, net proceeds from the sale of common stock, advances on our senior unsecured credit facility, cash generated from the sale of properties, and operating cash flows. The purchase price in 2015 was funded by advances on our senior unsecured credit facility, cash generated from the sale of properties and operating cash flows.
Dispositions to Affiliates of ARCH
On February 11, 2016, we completed the sale of six hotels to affiliates of American Realty Capital Hospitality Trust, Inc. ("ARCH") for an aggregate selling price of $108.3 million (the “ARCH Sale”), with the proceeds from the ARCH Sale being used to complete certain reverse 1031 Exchanges. The hotels acquired by us for the reverse 1031 Exchanges included the 179-guestroom Courtyard by Marriott, Atlanta (Decatur), GA on October 20, 2015, for a purchase price of $44.0 million and the 226-guestroom Courtyard by Marriott, Nashville, TN for a purchase price of $71.0 million on January 19, 2016. The completion of the reverse 1031 Exchanges resulted in the deferral of taxable gains of approximately $74.0 million and the pay-down of our unsecured revolving credit facility by $105.0 million. Additionally, we repaid a mortgage loan totaling $5.8 million related to sale of the Springhill Suites, Denver, CO to ARCH. The sale to ARCH resulted in a $56.8 million gain, of which $20.0 million was initially deferred related to the seller financing described below. Through December 31, 2016, we have recognized as income $5.0 million of the deferred gain upon receipt of scheduled repayments of the principal balance of the loan from ARCH.
On February 11, 2016, the Operating Partnership entered into a loan agreement with ARCH, as borrower, which provides for a loan by the Operating Partnership to ARCH in the amount of $27.5 million (the “Loan” or “Loan Agreement”) as further described below. The proceeds of the Loan were required to be applied by ARCH as follows: (i) $20.0 million was applied toward the payment of a portion of the $108.3 million purchase price for the six hotels acquired by ARCH as part of the ARCH Sale; and (ii) the remaining $7.5 million was applied by ARCH to fund the escrow deposit required by the Reinstatement Agreement described below.
37
As previously disclosed by us in a Current Report on 8-K filed on February 16, 2016, and a Current Report on 8-K filed on January 6, 2017, we and American Realty Capital Hospitality Portfolio SMT ALT, LLC (“ARCH Purchaser”), an affiliate of ARCH, entered into a letter agreement (the “Reinstatement Agreement”) to reinstate the Real Estate Purchase and Sale Agreement, dated as of June 2, 2015, as modified by the Reinstatement Agreement, (the “Purchase Agreement”) in its entirety, and further amended by the 2017 Letter Agreement defined below.
Pursuant to the Purchase Agreement, the ARCH Purchaser had the right to acquire from the Company fee simple interests in the eight hotels (the “Remaining Hotels”) listed below containing a total of 741 guestrooms for an aggregate purchase price of $77.2 million with a closing that was required to occur by January 10, 2017. On January 10, 2017, the Company and ARCH Purchaser entered into a letter agreement to extend the required closing date of the Purchase Agreement to January 12, 2017.
Hotel | Location | Guestrooms | |||
Courtyard by Marriott | Jackson, MS | 117 | |||
Courtyard by Marriott | Germantown, TN | 93 | |||
Courtyard by Marriott | El Paso, TX | 90 | |||
Fairfield Inn & Suites | Germantown, TN | 80 | |||
Homewood Suites | Ridgeland, MS | 91 | |||
Residence Inn | Jackson, MS | 100 | |||
Residence Inn | Germantown, TN | 78 | |||
Staybridge Suites | Ridgeland, MS | 92 | |||
Total | 741 | ||||
On January 12, 2017, the Company and the ARCH Purchaser entered into a letter agreement (the “2017 Letter Agreement”) to amend the terms of the Purchase Agreement as follows:
The closing date of the sale of the Remaining Hotels, except the Courtyard by Marriott, El Paso, TX (the “El Paso Courtyard”), is scheduled to occur on or before April 27, 2017 (the “Closing Date”), or at such later date as the closing may be adjourned or extended in accordance with the express terms of the Reinstatement Agreement. The closing date for the El Paso Courtyard is scheduled to occur on October 24, 2017 (the “El Paso Closing Date”). If, on the El Paso Closing Date, the El Paso Courtyard is under contract to be sold to a bona fide third-party purchaser that is not an affiliate of the Company, the ARCH Purchaser will not be obligated to purchase the hotel.
The Company continues to have the right to market and ultimately sell, without the consent of the ARCH Purchaser, any or all of the Remaining Hotels to a bona fide third-party purchaser that is not an affiliate of the Company. If the Company sells some, but not all, of the Remaining Hotels to a bona fide third-party purchaser, then the purchase price to be paid by the ARCH Purchaser for the Remaining Hotels will be reduced accordingly.
Modification of $27.5 Million Loan Agreement
On January 12, 2017, we entered into a First Amendment to Loan Agreement with ARCH modifying the terms of the Loan.
The outstanding principal amount of the Loan, and any accrued and unpaid interest, will be due and payable on February 11, 2018 (the “Maturity Date”), unless extended pursuant to the Loan Agreement. Any payment-in-kind (“PIK”) interest accrued as of January 12, 2017, under the terms of the Loan Agreement will be deferred until the earlier of the Closing Date or the termination of the Purchase Agreement as the result of a breach by the ARCH Purchaser. However, if the sale of the Remaining Hotels occurs on the Closing Date, the entire principal amount of the Loan and any accrued and unpaid interest, including the PIK interest accrued through the Closing Date, will be due and payable on the Closing Date. If the sale of the Remaining Hotels does not occur on the Closing Date, ARCH is required to immediately pay the outstanding PIK accrued through February 11, 2017, and to repay a portion of the outstanding principal balance of the Loan in an aggregate amount of $2.0 million, to be paid in two equal installments of $1.0 million, on the last day of August and September 2017. The Loan may be prepaid in whole or in part at any time by ARCH without payment of any penalty or premium. ARCH shall be deemed to be in default of the Second Loan Agreement (as defined below) if it is in default under the terms of the Loan Agreement.
38
Execution of $3.0 Million Loan Agreement
On January 12, 2017, we entered into a loan agreement with ARCH, as borrower, which provides for a loan to ARCH in the amount of $3.0 million (the “Second Loan” or “Second Loan Agreement”). The proceeds of the Second Loan will be deemed as consideration for the 2017 Letter Agreement, but shall not be collectible by us unless the Purchase Agreement is terminated as a result of a breach by the ARCH Purchaser.
The outstanding principal amount of the Second Loan, and any accrued and unpaid interest, shall be due and payable on July 31, 2017 (the “Maturity Date”). However, if the sale of the Remaining Hotels occurs on the Closing Date, the entire principal amount of the Second Loan shall be deemed paid in full and ARCH shall have no further obligations to us except for payment of any unpaid interest accrued and payable as of the Closing Date. If the sale of the Remaining Hotels does not occur on the Closing Date, ARCH is required to repay the principal amount of the Second Loan in installments of $1.0 million on the last day of each of May, June and July 2017. The Second Loan may be prepaid in whole or in part at any time, without payment of any penalty or premium. The ARCH Borrower shall be deemed to be in default of the Loan Agreement if it is in default of the Second Loan Agreement.
Interest will accrue on the unpaid principal balance of the Second Loan at a rate of 13.0% per annum from the date of the Second Loan to February 11, 2017, and at 14.0% per annum from February 11, 2017, to the earlier of the Closing Date or the Maturity Date. An amount equal to 9.0% per annum is to be paid monthly beginning January 31, 2017. The remaining 4.0%, 5.0% and any other unpaid interest, as the case may be, will accrue and be compounded monthly.
39
Other Dispositions
On May 13, 2016, we completed the sale of the Holiday Inn Express & Suites in Irving (Las Colinas), TX for $10.5 million.
We also completed the sale of two properties previously contracted for sale to the ARCH Purchaser to third parties unrelated to the ARCH Purchaser under the terms of the Reinstatement Agreement. The first sale was the Aloft in Jacksonville, FL for $8.6 million on June 1, 2016. The second sale was the Holiday Inn Express in Vernon Hills, IL for $5.9 million on June 7, 2016. The proceeds from the sale of the Holiday Inn Express & Suites in Irving (Las Colinas), TX and the Holiday Inn Express in Vernon Hills, IL were used to complete a reverse 1031 Exchange with the acquisition of the 160-guestroom Residence Inn by Marriott in Atlanta, GA on January 20, 2016 for a purchase price of $38.0 million. The completion of the reverse 1031 Exchange resulted in the deferral of taxable gains of approximately $5.1 million.
On July 6, 2016, we completed the sale of the Hyatt Place in Irving (Las Colinas), TX for $14.0 million. The proceeds from the sale of this property were used to complete a 1031 Exchange related to the purchase of the 157-guestroom Marriott in Boulder, CO on August 9, 2016 for a purchase price of $61.4 million. The completion of the 1031 Exchange resulted in the deferral of taxable gains of approximately $7.5 million.
The sale of these four properties during the year ended December 31, 2016 resulted in the realization of a combined net gain of $8.1 million.
A summary of the dispositions in 2016 and 2015 follows (dollars in thousands):
Disposition Date | Franchise/Brand | Location | Guestrooms | Gross Sales Price | |||||||
Year Ended December 31, 2016 | |||||||||||
February 11 | Fairfield Inn & Suites | Bellevue, WA | 144 | $ | 34,274 | ||||||
February 11 | Fairfield Inn & Suites | Spokane, WA | 84 | 13,542 | |||||||
February 11 | Fairfield Inn & Suites | Denver, CO | 160 | 19,118 | |||||||
February 11 | Springhill Suites | Denver, CO | 124 | 12,965 | |||||||
February 11 | Hampton Inn | Fort Collins, CO | 75 | 6,987 | |||||||
February 11 | Hilton Garden Inn | Fort Collins, CO | 120 | 21,397 | |||||||
May 13 | Holiday Inn Express | Irving (Las Colinas), TX | 128 | 10,500 | |||||||
June 1 | Aloft | Jacksonville, FL | 136 | 8,590 | |||||||
June 7 | Holiday Inn Express | Vernon Hills, IL | 119 | 5,900 | |||||||
July 6 | Hyatt Place | Irving (Las Colinas), TX | 122 | 14,000 | |||||||
Total | 1,212 | $ | 147,273 | ||||||||
Year Ended December 31, 2015 | |||||||||||
October 15 | Hampton Inn | Medford, OR | 75 | $ | 12,873 | ||||||
October 15 | DoubleTree | Baton Rouge, LA | 127 | 17,938 | |||||||
October 15 | Fairfield Inn & Suites | Baton Rouge, LA | 78 | 4,868 | |||||||
October 15 | Springhill Suites | Baton Rouge, LA | 78 | 7,593 | |||||||
October 15 | TownePlace Suites | Baton Rouge, LA | 90 | 8,086 | |||||||
October 15 | Hampton Inn & Suites | El Paso, TX | 139 | 22,672 | |||||||
October 15 | Hampton Inn | Fort Wayne, IN | 118 | 12,817 | |||||||
October 15 | Residence Inn | Fort Wayne, IN | 109 | 14,829 | |||||||
October 15 | Courtyard | Flagstaff, AZ | 164 | 31,609 | |||||||
October 15 | Springhill Suites | Flagstaff, AZ | 112 | 16,784 | |||||||
Total | 1,090 | $ | 150,069 | ||||||||
The sale of the ten properties during the year ended December 31, 2016 resulted in the realization of a combined net gain of $49.8 million.
Hotel Revenues and Operating Expenses
Our revenues are derived from hotel operations and consist of room revenue and other hotel operations revenue. As a result of our focus on select-service hotels, substantially all of our revenues are related to the sales of hotel guestrooms. Our other hotel operations revenue consists of ancillary revenues related to food and beverage sales, meeting rooms, retail space available for long-term lease and other guest services provided at certain of our hotel properties.
40
Our hotel operating expenses consist primarily of expenses incurred in the day-to-day operation of our hotel properties. Many of our expenses are fixed, such as essential hotel staff, real estate taxes, insurance, depreciation and certain types of franchise fees, and these expenses do not decrease even if the revenues at our hotel properties decrease. Our hotel operating expenses consist of room expenses (wages, payroll taxes and benefits, linens, cleaning and guestroom supplies, and complimentary breakfast), other direct expenses (office supplies, utilities, telephone, advertising and bad debts), and other indirect expenses (real and personal property taxes, insurance, travel agent and credit card commissions, hotel management fees, and franchise fees).
Results of Operations
The comparisons that follow should be reviewed in conjunction with the Consolidated Financial Statements included elsewhere in this Form 10-K. Hotel properties classified as discontinued operations prior to our adoption of Accounting Standards Update ("ASU") No. 2014-08, "Presentation of Financial Statements and Property, Plant and Equipment," are not included in the discussion below.
Comparison of 2016 to 2015
The following table contains key operating metrics for our total portfolio and our same-store portfolio for 2016 compared with 2015 (dollars in thousands, except ADR and RevPAR). We define same-store hotels as properties that we owned or leased as of December 31, 2016 and that we have owned or leased at all times since January 1, 2015.
2016 | 2015 | Year-over-Year Dollar Change | Year-over-Year Percentage/Basis Point Change | |||||||||||||||||||||||||||||||
Total Portfolio (81 hotels) | Same-Store Portfolio (70 hotels) | Total Portfolio (87 hotels) | Same-Store Portfolio (70 hotels) | Total Portfolio (81/87 hotels) | Same-Store Portfolio (70 hotels) | Total Portfolio (81/87 hotels) | Same-Store Portfolio (70 hotels) | |||||||||||||||||||||||||||
Total revenues | $ | 473,935 | $ | 384,815 | $ | 463,455 | $ | 372,370 | $ | 10,480 | $ | 12,445 | 2.3 | % | 3.3 | % | ||||||||||||||||||
Hotel operating expenses | $ | 295,681 | $ | 242,891 | $ | 295,828 | $ | 238,639 | $ | (147 | ) | $ | 4,252 | 0.0 | % | 1.8 | % | |||||||||||||||||
Occupancy | 77.9 | % | 77.7 | % | 77.2 | % | 77.1 | % | n/a | n/a | 70 | bps | 60 | bps | ||||||||||||||||||||
ADR | $ | 141.77 | $ | 138.75 | $ | 132.32 | $ | 135.27 | $ | 9.45 | $ | 3.48 | 7.1 | % | 2.6 | % | ||||||||||||||||||
RevPAR | $ | 110.41 | $ | 107.83 | $ | 102.20 | $ | 104.35 | $ | 8.21 | $ | 3.48 | 8.0 | % | 3.3 | % | ||||||||||||||||||
The total portfolio information above includes revenues and expenses from the four hotels we acquired in 2016 (the “2016 Acquired Hotels”) and the seven hotel properties we acquired in 2015 (the “2015 Acquired Hotels”) from the date of acquisition through December 31, 2016, and operating information (occupancy, ADR, and RevPAR) for the period each hotel was owned. Accordingly, the information does not reflect a full twelve months of operations in 2016 for the 2016 Acquired Hotels or a full twelve months of operations in 2015 for the 2015 Acquired Hotels. The combined 2016 Acquired Hotels and 2015 Acquired Hotels are referred to as the “2016/2015 Acquired Hotels.”
Revenues. Total revenues increased $10.5 million, or 2.3%, in 2016. The growth was due to a $12.4 million increase in same-store revenues and a $57.9 million increase in revenues at the 2016/2015 Acquired Hotels partially offset by a $59.8 million decrease in revenue related to the hotel properties sold during the period.
The same-store revenue increase of 3.3% in 2016, was due to a 60 basis point increase in same-store occupancy in 2016 compared with 2015, and a 2.6% increase in same-store ADR in 2016 compared with 2015. The increases in same-store occupancy and same-store ADR resulted in an 3.3% increase in same-store RevPAR from 2015 to 2016. These increases were due to general economic conditions, our strong revenue and asset management programs, hotel industry fundamentals and strategic and brand-required renovations made at our same-store hotel properties.
Hotel Operating Expenses. Hotel operating expenses for the total portfolio decreased $0.1 million in 2016, as fixed expense savings offset increases in variable costs related to the $10.5 million, or 2.3%, increase in total revenues. In addition, the increase in variable costs in 2016 for the total portfolio was driven by a $4.3 million increase in same-store portfolio expenses due to variable costs associated with the $12.4 million increase in same-store portfolio revenues. Operating Margins for the same-store portfolio improved in 2016, with same-store hotel operating expenses declining as a percentage of same-store revenue from 64.1% in 2015 to 63.1% in 2016, due to consistent fixed expenses and increases in revenues at the same-store hotel properties in 2016.
41
Other direct expense for the same-store portfolio increased by 2.6% in 2016, reflecting an increase commensurate with the increase in revenue. Other indirect expense for the same-store portfolio decreased by 0.1% in 2016 as property tax expense savings were offset by increased management expenses and travel agent commissions.
The following table summarizes our hotel operating expenses for our same-store (70 hotels) portfolio for 2016 and 2015 (dollars in thousands):
Percentage | Percentage of Revenue | ||||||||||||||||
2016 | 2015 | Change | 2016 | 2015 | |||||||||||||
Rooms expense | $ | 91,162 | $ | 88,139 | 3.4 | % | 23.7 | % | 23.7 | % | |||||||
Other direct expense | 52,962 | 51,595 | 2.6 | % | 13.8 | % | 13.9 | % | |||||||||
Other indirect expense | 98,767 | 98,905 | (0.1 | )% | 25.7 | % | 26.6 | % | |||||||||
Total hotel operating expenses | $ | 242,891 | $ | 238,639 | 1.8 | % | 63.1 | % | 64.1 | % | |||||||
Depreciation and Amortization. Depreciation and amortization expense increased $8.4 million, or 13.0%, in 2016, primarily due to incremental depreciation associated with the 2016/2015 Acquired Hotels partially offset by the decrease in depreciation and amortization related to the disposed properties, and properties moved to Assets Held for Sale resulting in depreciation expense no longer being recorded related to these assets in 2016. The 2016 depreciation and amortization expense includes $72.1 million of real estate-related depreciation and $0.3 million of franchise application fee amortization. The 2015 depreciation and amortization expense includes $63.7 million of real estate-related depreciation and $0.4 million of franchise application fee amortization.
Corporate General and Administrative. Corporate general and administrative expenses decreased by $1.9 million, or 9.0%, in 2016. This decrease was primarily due to non-recurring severance costs of $3.1 million in 2015. This decrease was partially offset by a $1.0 million increase in employee-related costs.
Loss on impairment of assets. At December 31, 2016, we were under contract to sell the Courtyard by Marriott in El Paso, TX for $11.0 million. We recorded a loss on impairment of assets of $0.6 million to reduce the carrying value of the assets to the estimated net selling price. This hotel is one of the eight remaining Reinstated Hotels and is under contract to be sold to a third party that is unrelated to ARCH. In 2015, we determined that the value of land parcels in San Antonio, TX, Fort Myers, FL and Flagstaff, AZ were impaired based on market conditions. As such, we recognized a loss on impairment of assets of $1.1 million for the year ended December 31, 2015.
Gain on Disposal of Assets. Gain on disposal of assets decreased by $15.2 million in 2016. This reduction is primarily due to the sale of ten hotels in 2015 for a net gain of $66.6 million and the sale of ten hotels in 2016 for a net gain of $49.8 million.
Other Income/Expense. Other income decreased by $8.6 million, or 77.0%, in 2016, primarily due to the earnest money deposit of $9.1 million that we received in the fourth quarter of 2015 as a result of ARCH terminating the agreement to purchase ten hotel properties that was scheduled to close on December 29, 2015.
Income Tax Expense/Benefit. Our total income tax benefit in 2016 was $1.5 million based on the performance of our TRS lessees and a deferred tax adjustment related to corporate general and administrative expenses allocated to our TRS lessees.
In 2015, income tax expense was $0.6 million due in part to the valuation allowance recorded against our deferred tax assets. At December 31, 2015, we reduced our valuation allowance to zero as we had sufficient positive evidence to conclude that a U.S. valuation allowance was no longer needed on our net deferred tax assets. The release of the valuation allowance resulted in a non-cash tax benefit of $0.1 million.
42
Comparison of 2015 to 2014
The following table contains key operating metrics for our total portfolio and our same-store portfolio for 2015 compared with 2014 (dollars in thousands, except ADR and RevPAR). We define same-store hotels as properties that we owned or leased as of December 31, 2015 and that we have owned or leased at all times since January 1, 2014.
2015 | 2014 | Year-over-Year Dollar Change | Year-over-Year Percentage/Basis Point Change | |||||||||||||||||||||||||||||||
Total Portfolio (87 hotels) | Same-Store Portfolio (74 hotels) | Total Portfolio (90 hotels) | Same-Store Portfolio (74 hotels) | Total Portfolio (87/90 hotels) | Same-Store Portfolio (74 hotels) | Total Portfolio (87/90 hotels) | Same-Store Portfolio (74 hotels) | |||||||||||||||||||||||||||
Total revenues | $ | 463,455 | $ | 357,701 | $ | 403,466 | $ | 330,353 | $ | 59,989 | $ | 27,348 | 14.9 | % | 8.3 | % | ||||||||||||||||||
Hotel operating expenses | $ | 295,828 | $ | 231,060 | $ | 261,497 | $ | 215,447 | $ | 34,331 | $ | 15,613 | 13.1 | % | 7.2 | % | ||||||||||||||||||
Occupancy | 77.2 | % | 76.9 | % | 75.7 | % | 75.3 | % | n/a | n/a | 150 | bps | 160 | bps | ||||||||||||||||||||
ADR | $ | 132.32 | $ | 128.48 | $ | 122.52 | $ | 121.18 | $ | 9.80 | $ | 7.30 | 8.0 | % | 6.0 | % | ||||||||||||||||||
RevPAR | $ | 102.20 | $ | 98.77 | $ | 92.71 | $ | 91.28 | $ | 9.49 | $ | 7.48 | 10.2 | % | 8.2 | % | ||||||||||||||||||
The total portfolio information above includes revenues and expenses from the seven hotels we acquired in 2015 (the “2015 Acquired Hotels”) and the six hotel properties we acquired in 2014 (the “2014 Acquired Hotels”) from the date of acquisition through December 31, 2015, and operating information (occupancy, ADR, and RevPAR) for the period each hotel was owned. Accordingly, the information does not reflect a full twelve months of operations in 2015 for the 2015 Acquired Hotels or a full twelve months of operations in 2014 for the 2014 Acquired Hotels. The combined 2015 Acquired Hotels and 2014 Acquired Hotels are referred to as the “2015/2014 Acquired Hotels.”
Revenues. Total revenues increased $60.0 million, or 14.9%, in 2015. The growth was due to a $27.3 million increase in same-store revenues and a $39.0 million increase in revenues at the 2015/2014 Acquired Hotels.
The same-store revenue increase of 8.3% in 2015 was due to a 160 basis point increase in same-store occupancy in 2015 compared with 2014, and a 6.0% increase in same-store ADR in 2015 compared with 2014. The increases in same-store occupancy and same-store ADR resulted in an 8.2% increase in same-store RevPAR in 2015. These increases were due to general economic conditions, our strong revenue and asset management programs, hotel industry fundamentals and strategic and brand-required renovations made at our same-store hotel properties.
Hotel Operating Expenses. Hotel operating expenses for the total portfolio increased $34.3 million, or 13.1%, in 2015. This increase is due in part to a $23.5 million increase in hotel operating expenses related to the 2015/2014 Acquired Hotels. In addition, the increase in hotel operating expenses in 2015 for the total portfolio was driven by a $15.6 million increase in same-store hotel operating expenses due to variable costs related to the $27.3 million, or 8.3%, increase in same-store revenue. Operating Margins for the same-store portfolio improved in 2015 compared to 2014, with same-store hotel operating expenses declining as a percentage of same-store revenue from 65.2% in 2014 to 64.6% in 2015, due to consistent fixed expenses and increasing revenues at the same-store hotel properties in 2015.
Other direct expense for the same-store portfolio increased by 8.1% in 2015, reflecting an increase commensurate with the increase in revenue. Other indirect expense for the same-store portfolio increased by 10.9% in 2015 due to a $4.4 million increase in management expenses and travel agent commissions and a $3.6 million increase in property tax expense.
The following table summarizes our hotel operating expenses for our same-store (74 hotels) portfolio for 2015 and 2014 (dollars in thousands):
Percentage | Percentage of Revenue | ||||||||||||||||
2015 | 2014 | Change | 2015 | 2014 | |||||||||||||
Rooms expense | $ | 86,665 | $ | 84,076 | 3.1 | % | 24.2 | % | 25.5 | % | |||||||
Other direct expense | 49,987 | 46,229 | 8.1 | % | 14.0 | % | 14.0 | % | |||||||||
Other indirect expense | 94,408 | 85,142 | 10.9 | % | 26.4 | % | 25.8 | % | |||||||||
Total hotel operating expenses | $ | 231,060 | $ | 215,447 | 7.2 | % | 64.6 | % | 65.2 | % | |||||||
43
Depreciation and Amortization. Depreciation and amortization expense increased $0.3 million, or 0.5%, in 2015, primarily due to incremental depreciation associated with the 2015/2014 Acquired Hotels offset by the effect of the reclassification of 26 hotel properties to Assets Held for Sale resulting in depreciation expense no longer being recorded related to these assets in 2015. The 2015 depreciation and amortization expense includes $63.7 million of real estate-related depreciation and $0.4 million of franchise application fee amortization. The 2014 depreciation and amortization expense includes $63.3 million of real estate-related depreciation and $0.5 million of franchise application fee amortization.
Corporate General and Administrative. Corporate general and administrative expenses increased by $1.3 million, or 6.6%, in 2015. This increase was primarily due to non-recurring severance costs of $3.1 million in 2015. This increase was partially offset by a $1.0 million reduction in professional fees incurred in 2014 but not in 2015 related to the establishment of new procedures and systems for intercompany account reconciliations and $0.8 million in executive and board of directors recruiting fees recorded during 2014.
Loss on impairment of assets. In 2015, we determined that the value of land parcels in San Antonio, TX, Fort Myers, FL and Flagstaff, AZ were impaired based on market conditions. As such, we recognized a loss on impairment of assets of $1.1 million in our Consolidated Statement of Operations for the year ended December 31, 2015. During the year ended December 31, 2014, we recognized a loss on impairment of assets of $8.2 million related to the Country Inn & Suites and three adjacent land parcels totaling 5.64 acres in San Antonio, TX, which was sold in the fourth quarter of 2014, and a loss on impairment of $0.7 million related to a land parcel in Spokane, WA.
In addition, in 2014, we recognized a loss on impairment of assets of $0.4 million related to the Hampton Inn in Fort Smith, AR. This property was classified as held for sale prior to the Company’s adoption of ASU No. 2014-08 and its operating results, including impairment charges, were included in discontinued operations.
Gain on Disposal of Assets. Gain on disposal of assets increased by $64.7 million in 2015. This increase was primarily due to the sale of ten properties to ARCH on October 15, 2015 for a gain of $66.6 million.
Other Income/Expense. Other income increased $10.6 million, or 1,773%, in 2015 primarily due to the earnest money deposit of $9.1 million that we received in the fourth quarter of 2015 as a result of ARCH terminating the agreement to purchase ten hotel properties that was scheduled to close on December 29, 2015.
Income Tax Expense/Benefit. Our total income tax expense in 2015 was $0.5 million. Our income tax expense was minimal due in part to the valuation allowance recorded against our deferred tax assets. At December 31, 2015, we reduced our valuation allowance to zero as we had sufficient positive evidence to conclude that a U.S. valuation allowance was no longer needed on our net deferred tax assets. The positive evidence included two consecutive years of profitability. The release of the valuation allowance resulted in a non-cash tax benefit of $0.1 million.
At December 31, 2014, we had valuation allowance of $2.4 million to offset deferred tax assets based on our assessment of realizability. During the year ended December 31, 2014, the utilization of tax attributes to offset taxable income reduced the overall amount of deferred tax assets subject to the valuation allowance. At December 31, 2015, we had gross deferred tax assets of $1.5 million primarily related to net operating loss carryforwards and $1.3 million in deferred tax liabilities related to an investment in a joint venture. We have concluded that it is more-likely-than-not that our deferred tax assets will be realized in the future and therefore, we reduced our valuation allowance to zero at December 31, 2015.
44
Discontinued Operations
Pursuant to our strategy, we periodically evaluate our hotel properties for potential sale and redeployment of capital. When a hotel property was sold or identified as being held for sale, we reported its historical and future results of operations, including impairment charges, in discontinued operations until we adopted ASU No. 2014-08 in the first quarter of 2014. Since adoption of ASU No. 2014-08, we have not included historical and future results of operations for our properties sold or identified as being held for sale. Discontinued operations in 2014 include the following hotel properties that have been sold:
•AmericInn Hotel & Suites and Aspen Hotel & Suites in Fort Smith, AR - sold on January 17, 2014; and
•Hampton Inn in Fort Smith, AR - sold on September 9, 2014.
A summary of results from our hotel properties included in discontinued operations follows (in thousands):
2014 | ||||
Revenues | $ | 3,128 | ||
Hotel operating expenses | (2,304 | ) | ||
Depreciation and amortization | (13 | ) | ||
Loss on impairment of assets | (400 | ) | ||
Operating income | 411 | |||
Gain on disposal of assets | 55 | |||
Income before taxes | 466 | |||
Income tax benefit | 26 | |||
Income from discontinued operations | $ | 492 | ||
Non-GAAP Financial Measures
We consider funds from operations (“FFO”) and EBITDA, both of which are non-GAAP financial measures, to be useful to investors as key supplemental measures of our operating performance. We caution investors that amounts presented in accordance with our definitions of FFO and EBITDA may not be comparable to similar measures disclosed by other companies, since not all companies calculate these non-GAAP measures in the same manner. FFO and EBITDA should be considered along with, but not as alternatives to, net income (loss) as a measure of our operating performance. FFO and EBITDA may include funds that may not be available for our discretionary use due to functional requirements to conserve funds for capital expenditures, property acquisitions, debt service obligations and other commitments and uncertainties. Although we believe that FFO and EBITDA can enhance the understanding of our financial condition and results of operations, these non-GAAP financial measures are not necessarily better indicators of any trend as compared to a comparable GAAP measure such as net income (loss).
45
Funds From Operations
As defined by the National Association of Real Estate Investment Trusts, (“NAREIT”), FFO represents net income or loss (computed in accordance with GAAP), excluding preferred dividends, gains (or losses) from sales of real property, impairment losses on real estate assets, items classified by GAAP as extraordinary, the cumulative effect of changes in accounting principles, plus depreciation and amortization related to real estate assets, and adjustments for unconsolidated partnerships and joint ventures. Unless otherwise indicated, we present FFO applicable to our common shares and Common Units. We present FFO because we consider it an important supplemental measure of our operational performance and believe it is frequently used by securities analysts, investors and other interested parties in the evaluation of REITs, many of which present FFO when reporting their results. FFO is intended to exclude GAAP historical cost depreciation and amortization, which assumes that the value of real estate assets diminishes ratably over time. Historically, however, real estate values have risen or fallen with market conditions. Because FFO excludes depreciation and amortization related to real estate assets, gains and losses from real property dispositions and impairment losses on real estate assets, it provides a performance measure that, when compared year over year, reflects the effect to operations from trends in occupancy, guestroom rates, operating costs, development activities and interest costs, providing perspective not immediately apparent from net income. Our computation of FFO differs slightly from the computation of NAREIT-defined FFO related to the reporting of corporate depreciation and amortization expense. Our computation of FFO may also differ from the methodology for calculating FFO used by other equity REITs and, accordingly, may not be comparable to such other REITs. FFO should not be considered as an alternative to net income (loss) (computed in accordance with GAAP) as an indicator of our liquidity, nor is it indicative of funds available to fund our cash needs, including our ability to pay dividends or make distributions. Where indicated in this Annual Report on Form 10-K, FFO is based on our computation of FFO and not the computation of NAREIT-defined FFO unless otherwise noted.
The following is a reconciliation of our GAAP net income to FFO for the years ended December 31, 2016, 2015 and 2014 (in thousands, except per share/unit amounts):
2016 | 2015 | 2014 | ||||||||||
Net income | $ | 108,261 | $ | 125,256 | $ | 20,923 | ||||||
Preferred dividends | (18,232 | ) | (16,588 | ) | (16,588 | ) | ||||||
Premium on redemption of Series A Preferred Stock | (2,125 | ) | — | — | ||||||||
Net income applicable to common shares and common units | 87,904 | 108,668 | 4,335 | |||||||||
Real estate-related depreciation | 72,063 | 63,675 | 63,291 | |||||||||
Loss on impairment of assets | 577 | 1,115 | 9,247 | |||||||||
Gain on disposal of assets | (49,855 | ) | (65,067 | ) | (446 | ) | ||||||
Non-controlling interest in joint venture | — | — | (1 | ) | ||||||||
Adjustments related to joint venture | — | — | (204 | ) | ||||||||
FFO applicable to common shares and common units | $ | 110,689 | $ | 108,391 | $ | 76,222 | ||||||
FFO per common share/common unit | $ | 1.26 | $ | 1.24 | $ | 0.88 | ||||||
Weighted average diluted common shares/common units(1) | 87,798 | 87,144 | 86,590 | |||||||||
(1) Includes Common Units in the Operating Partnership held by limited partners (other than us and our subsidiaries) because the Common Units are redeemable for cash or, at our election, shares of our common stock.
During the year ended December 31, 2016, FFO applicable to common shares and common units increased by $2.3 million, or 2.1%, over the prior year primarily due to an increase in total revenues of $10.5 million partially offset by a decrease in other income of $8.6 million during the year ended December 31, 2016 in comparison with the prior year. The increase in revenues was the result of increases in occupancy and ADR as discussed above under “Results of Operations — Comparison of 2016 to 2015 — Revenues.” The decline in other income was primarily due to the $9.1 million earnest money deposit that was forfeited by ARCH in the fourth quarter of 2015 as a result of terminating the agreement to purchase ten hotel properties that was scheduled to close on December 29, 2015.
During the year ended December 31, 2015, FFO applicable to common shares and common units increased by $32.2 million, or 42.2%, over the prior year primarily due to an increase in total revenues of $60.0 million during the year ended December 31, 2015 in comparison with the prior year, which resulted in an increase in net income (adjusted for non-cash items such as depreciation and amortization, loss on impairment of assets, equity-based compensation and gains on the disposal of assets) of $34.7 million for the year ended December 31, 2015 over the prior year. The increase in revenues was the result of increases in occupancy and ADR as discussed above under “Results of Operations — Comparison of 2015 to 2014 — Revenues.”
46
Earnings Before Interest, Taxes, Depreciation and Amortization
EBITDA represents net income or loss, excluding: (i) interest, (ii) income tax expense and (iii) depreciation and amortization. We believe EBITDA is useful to an investor in evaluating our operating performance because it provides investors with an indication of our ability to incur and service debt, to satisfy general operating expenses, to make capital expenditures and to fund other cash needs or reinvest cash into our business. We also believe it helps investors meaningfully evaluate and compare the results of our operations from period to period by removing the effect of our asset base (primarily depreciation and amortization) from our operating results. Our management also uses EBITDA as one measure in determining the value of acquisitions and dispositions.
The following is a reconciliation of our GAAP net income to EBITDA for the years ended December 31, 2016, 2015 and 2014 (in thousands):
2016 | 2015 | 2014 | ||||||||||
Net income | $ | 108,261 | $ | 125,256 | $ | 20,923 | ||||||
Depreciation and amortization | 72,406 | 64,052 | 63,776 | |||||||||
Interest expense | 28,091 | 30,414 | 28,517 | |||||||||
Interest income | (22 | ) | (998 | ) | (690 | ) | ||||||
Income tax (benefit) expense | (1,450 | ) | 553 | 718 | ||||||||
Non-controlling interest in joint venture | — | — | (1 | ) | ||||||||
Adjustments related to joint venture | — | — | (204 | ) | ||||||||
EBITDA | $ | 207,286 | $ | 219,277 | $ | 113,039 | ||||||
During the year ended December 31, 2016, EBITDA decreased by $12.0 million, or 5.5%, from the prior year primarily due to a decrease in gain on disposal of assets of $15.2 million and other income of $8.6 million, partially offset by an increase in total revenues of $10.5 million during the year ended December 31, 2016 in comparison with the prior year. The increase in revenues was the result of increases in occupancy and ADR as discussed above under “Results of Operations — Comparison of 2016 to 2015 — Revenues.” The decline in other income was primarily due to the $9.1 million earnest money deposit that was forfeited by ARCH in the fourth quarter of 2015 as a result of terminating the agreement to purchase ten hotel properties that was scheduled to close on December 29, 2015.
During the year ended December 31, 2015, EBITDA increased by $106.2 million, or 94.0%, over the prior year primarily due to an increase in net income of $104.3 million during the year ended December 31, 2015 in comparison with the prior year. The increase in net income was primarily driven by an increase in revenues of $60.0 million and an increase in gain on disposal of assets of $64.6 million during the year ended December 31, 2015. The increase in revenues was the result of increases in occupancy and ADR as discussed above under “Results of Operations — Comparison of 2015 to 2014 — Revenues.”
Liquidity and Capital Resources
Our short-term liquidity requirements consist primarily of operating expenses and other expenditures directly associated with our hotel properties, recurring maintenance and capital expenditures necessary to maintain our hotel properties in accordance with internal and brand standards, capital expenditures to improve our hotel properties, acquisitions, interest expense, settlement of interest swaps, scheduled principal payments on outstanding indebtedness, restricted cash funding obligations and distributions to our stockholders.
Our long-term liquidity requirements consist primarily of the costs of acquiring additional hotel properties, renovations and other non-recurring capital expenditures that periodically are made with respect to our hotel properties and scheduled debt payments, including maturing loans. On January 15, 2016, the Company entered into a new $450 million senior unsecured credit facility that replaced the former $300 million senior unsecured credit facility. The new credit facility extended the maturity date of the revolving line of credit under the former credit facility from 2017 to 2020 and the maturity date of the term loan component under the former credit facility from 2018 to 2021. See “Outstanding Indebtedness” below for further information.
To satisfy the requirements for qualification as a REIT, we must meet a number of organizational and operational requirements, including a requirement that we distribute annually at least 90% of our REIT taxable income to our stockholders,
47
determined without regard to the deduction for dividends paid and excluding any net capital gains. We intend to distribute a sufficient amount of our taxable income to maintain our status as a REIT and to avoid tax on undistributed income. Therefore, if sufficient funds are not available to us from hotel dispositions, our senior unsecured revolving credit facility and additional mortgage and other loans, we will need to raise capital to grow our business and invest in additional hotel properties.
We expect to satisfy our liquidity requirements with cash provided by operations, working capital, short-term borrowings under our $450 million senior unsecured credit facility, term debt, repayment of notes receivable, the strategic sale of hotels and the release of restricted cash upon satisfaction of the usage requirements. In addition, we may fund the purchase price of hotel acquisitions and cost of required capital improvements by borrowing under our senior unsecured credit facility, assuming existing mortgage debt, issuing securities (including Common Units issued by our Operating Partnership), or incurring mortgage or other types of debt. Further, we may seek to meet our liquidity requirements by raising capital through public or private offerings of our equity or debt securities. However, certain factors may have an adverse effect on our ability to access these capital sources, including our degree of leverage, the value of our unencumbered hotel properties, borrowing restrictions imposed by lenders, volatility in the equity and debt capital markets and other market conditions. We will continue to analyze which sources of capital are most advantageous to us at any particular point in time, but financing may not be consistently available to us on terms that are attractive, or at all. We believe that our cash provided by operations, working capital, borrowings available under our $450 million senior unsecured credit facility and other sources of funds available to us will be sufficient to meet our ongoing liquidity requirements for at least the next 12 months.
At December 31, 2016, we had $7.7 million of mortgage debt that matures in 2017. We have other scheduled principal debt payments in 2017 of $8.1 million. Although we believe we will have the capacity to satisfy these debt maturities and pay these scheduled principal debt payments or that we will be able to fund them using draws under our $450 million senior unsecured credit facility, there can be no assurances that our credit facility will be available to repay such amortizing debt as draws under our credit facility are subject to certain financial covenants.
We anticipate making renovations and other non-recurring capital expenditures with respect to our hotel properties pursuant to property improvement plans required by our franchisors and our internal quality standards. We expect 2017 capital expenditures for these activities at hotel properties we own as of February 15, 2017 to be in the range of $35.0 million to $45.0 million. Actual amounts may differ from our expectations. We may also make renovations and incur other non-recurring capital expenditures in 2017 at hotel properties we acquire in the future.
Cash Flow Analysis
The increase in net cash provided by operating activities of $5.7 million from 2015 to 2016 primarily resulted from an increase in net income of $2.4 million, after adjusting for non-cash items, and net changes in working capital of $3.4 million.
The $23.3 million increase in net cash used in investing activities in 2016 compared with 2015 is primarily due to an increase in cash used for asset acquisitions of $8.2 million and an increase in funding of real estate loans, net of repayments, of $17.1 million.
The $32.2 million increase in net cash from financing activities in 2016 compared with 2015 is primarily due to the net proceeds from stock offerings of $161.3 million partially offset by a decrease in net borrowings of $69.8 million, cash paid for the redemption of preferred stock of $50.0 million and an increase in dividends of $9.1 million.
The increase in net cash provided by operating activities of $30.1 million from 2014 to 2015 primarily resulted from an increase in net income of $34.7 million, after adjusting for non-cash items.
The $69.4 million reduction in net cash used in investing activities in 2015 compared with 2014 resulted from an increase in proceeds from asset dispositions of $130.8 million partially offset by an increase in hotel property acquisitions of $58.7 million.
The $100.6 million decrease in net cash from financing activities in 2015 compared with 2014 resulted primarily from a reduction in net borrowings of $97.5 million.
48
Outstanding Indebtedness
At December 31, 2016, we had $317.6 million in outstanding indebtedness secured by first priority mortgage liens on 33 hotel properties. We also had borrowed $200.0 million on our $450 million senior unsecured credit facility (the “2016 Unsecured Credit Facility”) and we had borrowed $140.0 million on our unsecured term loan, both of which were supported at December 31, 2016 by a borrowing base of 46 unencumbered hotel properties. At December 31, 2016, the maximum amount of borrowing permitted under the $450 million senior unsecured credit facility was $450.0 million, of which we had borrowed $200.0 million and $250.0 million was available to borrow.
At February 15, 2017, we had borrowed $185.0 million on our $450 million senior unsecured credit facility and we had borrowed $140.0 million on our unsecured term loan, both of which were supported by 46 hotel properties included in the credit facility borrowing bases. In addition, we have two other hotels with a total of 363 guestrooms unencumbered by mortgage debt that are available to be used as collateral for future loans. Please see "Note 5 - Debt" to the Consolidated Financial Statements for additional information concerning the 2016 Unsecured Credit Facility and our unsecured term loan.
In addition to the $72.3 million net proceeds from the completion of the Series D preferred stock offering, we intend to secure or assume term loan financing or use our senior unsecured credit facility, together with other sources of financing, to fund future acquisitions and capital improvements. We may not succeed in obtaining new financing on favorable terms, or at all, and we cannot predict the size or terms of future financings. Our failure to obtain new financing could adversely affect our ability to grow our business.
We intend to maintain a prudent capital structure and, while the ratio will vary from time to time, we generally intend to limit our ratio of indebtedness to EBITDA to no more than 6.0x. For purposes of calculating this ratio, we exclude preferred stock from indebtedness.
We have obtained financing through debt instruments having staggered maturities and intend to continue to do so in the future. Our debt includes, and may include in the future, debt secured by first priority mortgage liens on certain hotel properties and unsecured debt. We believe we will have adequate liquidity to meet requirements for scheduled maturities and principal repayments. However, we can provide no assurance that we will be able to refinance our indebtedness as it becomes due and, if refinanced, whether such refinancing will be available on favorable terms.
49
A summary of our debt at December 31, 2016 is as follows (dollars in thousands):
Lender | Interest Rate | Amortization Period (Years) | Maturity Date | Number of Encumbered Properties | Principle Amount Outstanding | |||||||
$450 Million Senior Unsecured Credit Facility | ||||||||||||
Deutsche Bank AG New York Branch | ||||||||||||
$300 Million Revolver | 2.27% Variable | n/a | March 31, 2020 | n/a | $ | 50,000 | ||||||
$150 Million Term Loan | 2.86% Variable(1) | n/a | March 31, 2021 | n/a | 150,000 | |||||||
Total Senior Unsecured Credit Facility | 200,000 | |||||||||||
Unsecured Term Loan | ||||||||||||
KeyBank National Association, as Administrative Agent | ||||||||||||
Term Loan | 2.57% Variable | n/a | April 7, 2022 | n/a | 140,000 | |||||||
Secured Mortgage Indebtedness | ||||||||||||
Voya (formerly ING Life Insurance and Annuity) | 5.18% Fixed | 20 | March 1, 2019 | 2(2) | 41,328 | |||||||
5.18% Fixed | 20 | March 1, 2019 | 4(2) | 37,042 | ||||||||
5.18% Fixed | 20 | March 1, 2019 | 3(2) | 23,889 | ||||||||
5.18% Fixed | 20 | March 1, 2019 | 1(2) | 16,970 | ||||||||
KeyBank National Association | 4.46% Fixed | 30 | February 1. 2023 | 4 | 27,473 | |||||||
4.52% Fixed | 30 | April 1, 2023 | 3 | 21,291 | ||||||||
4.30% Fixed | 30 | April 1, 2023 | 3 | 20,626 | ||||||||
4.95% Fixed | 30 | August 1, 2023 | 2 | 36,741 | ||||||||
Bank of America Commercial Mortgage | 6.41% Fixed | 25 | September 1, 2017 | 1 | 7,661 | |||||||
Western Alliance Bank (formerly GE Capital Financial, Inc.) | 5.39% Fixed | 25 | April 1, 2020 | 1 | 8,912 | |||||||
5.39% Fixed | 25 | April 1, 2020 | 1 | 4,798 | ||||||||
MetaBank | 4.25% Fixed | 20 | August 1, 2018 | 1 | 6,588 | |||||||
Bank of Cascades | 2.77% Variable | 25 | December 19, 2024 | 1(3) | 9,289 | |||||||
4.30% Fixed | 25 | December 19, 2024 | —(3) | 9,289 | ||||||||
Compass Bank | 3.17% Variable | 25 | May 6, 2020 | 3 | 23,394 | |||||||
Western Alliance Bank (formerly GE Capital Corp.) | 5.39% Fixed | 25 | April 1, 2020 | 1 | 5,910 | |||||||
5.39% Fixed | 25 | April 1, 2020 | 1 | 5,046 | ||||||||
U.S. Bank, NA | 6.13% Fixed | 25 | November 11, 2021 | 1 | 11,303 | |||||||
Total Mortgage Loans | 317,550 | |||||||||||
Total Debt | 33 | $ | 657,550 | |||||||||
(1) Our interest rate swap fixed a portion of the interest on this loan. See "Note 6 - Derivative Financial Instruments and Hedging" to the Consolidated Financial Statements.
(2) The ten hotel properties encumbered by the Voya mortgage loans are cross-collateralized, and the four Voya mortgage loans are cross-defaulted.
(3) The Bank of Cascades mortgage loans are secured by the same collateral and cross-defaulted.
Equity Transactions
On June 28, 2016, we completed the offering of 3,000,000 shares of our 6.45% Series D cumulative redeemable preferred stock for net proceeds of $72.3 million, after the underwriting discount and offering-related expenses of $2.7 million. The proceeds were used to repay the outstanding balance on our revolving line of credit and for other general corporate purposes.
On August 2, 2016, the Company and the Operating Partnership entered into separate sales agreements (the “Sales Agreements”) with each of Robert W. Baird & Co. Incorporated, Raymond James & Associates, Inc., Merrill Lynch, Pierce, Fenner & Smith Incorporated, Deutsche Bank Securities Inc., RBC Capital Markets, LLC, KeyBanc Capital Markets Inc., Canaccord Genuity Inc. and Jefferies LLC (collectively, the “Bank Group”), pursuant to which the Company may issue and sell from time to time up to $125.0 million in shares of its common stock, $0.01 par value per share, and shares of its 6.45% Series D Preferred Stock, $0.01 par value per share (collectively, the “Shares”), through members of the Bank Group, acting as agents or principals (the “2016 ATM Program”). At the same time, the Company terminated the sales agreement entered into in connection with its prior ATM offering program, which was established in August 2015 and under which no shares were sold.
50
Pursuant to the Sales Agreements, the Shares may be offered and sold through members of the Bank Group in transactions that are deemed to be “at the market” offerings as defined in Rule 415 under the Securities Act including sales made directly on the New York Stock Exchange or sales made to or through a market maker other than on an exchange or, with the prior consent of the Company, in privately negotiated transactions. Members of the Bank Group will be entitled to compensation of up to 2.0% of the gross proceeds of Shares sold through members of the Bank Group from time to time under the Sales Agreements. The Company has no obligation to sell any of the Shares under the Sales Agreements and may at any time suspend solicitations and offers under, or terminate, the Sales Agreements.
During the year ended December 31, 2016, we sold 6,151,514 shares of our common stock under the 2016 ATM Program for net proceeds of $89.1 million. The proceeds were used to pay down our revolving line of credit which had been used for acquisitions and other general corporate purposes.
On October 28, 2016, we paid $50.7 million to redeem all 2,000,000 of our outstanding 9.25% Series A cumulative redeemable preferred shares at a redemption price of $25 per share plus accrued and unpaid dividends.
Capital Expenditures
During the year ended December 31, 2016, we funded $42.4 million in capital expenditures. We anticipate spending an estimated $35.0 million to $45.0 million on capital expenditures in 2017. We expect to fund these expenditures through a combination of cash provided by operations, working capital, borrowings under our 2016 Unsecured Credit Facility, or other potential sources of capital, to the extent available to us.
Contractual Obligations
The following table outlines the timing of required payments related to our long-term debt and other contractual obligations at December 31, 2016 (dollars in thousands):
Payments Due By Period | ||||||||||||||||||||
Total | Less than One Year | One to Three Years | Three to Five Years | More than Five Years | ||||||||||||||||
Debt obligations (1) | $ | 770,526 | $ | 41,624 | $ | 228,832 | $ | 238,114 | $ | 261,956 | ||||||||||
Operating lease obligations (2) | 114,929 | 1,384 | 3,540 | 3,727 | 106,278 | |||||||||||||||
Purchase obligations (3) | 6,757 | 6,757 | — | — | — | |||||||||||||||
Total | $ | 892,212 | $ | 49,765 | $ | 232,372 | $ | 241,841 | $ | 368,234 | ||||||||||
(1) | Amounts shown include amortization of principal, maturities, and estimated interest payments. Interest payments on our variable rate debt have been estimated using the interest rates in effect at December 31, 2016, after giving effect to our interest rate swap. |
(2) | Amounts consist primarily of non-cancelable ground lease and corporate office lease obligations. |
(3) | This amount represents purchase orders and executed contracts for renovation projects at our hotel properties. |
Inflation
Operators of hotel properties, in general, possess the ability to adjust guestroom rates daily to reflect the effects of inflation on our operating expenses. However, competitive pressures may limit the ability of our management companies to raise guestroom rates and thus, we may not be able to offset increased expenses with an increase in revenues.
Critical Accounting Policies
See "Note 2 - Summary of Significant Accounting Policies" to the Consolidated Financial Statements.
New Accounting Standards
See "Note 2 - Summary of Significant Accounting Policies" to the Consolidated Financial Statements.
51
Recent Developments
Equity Transactions
On January 1, 2017, we had 39,959 of our outstanding performance-based restricted stock awards granted pursuant to our Equity Plan vest.
On January 24, 2017, our Board of Directors declared cash dividends of $0.1625 per share of common stock, $0.4921875 per share of 7.875% Series B Cumulative Redeemable Preferred Stock, $0.4453125 per share of 7.125% Series C Cumulative Redeemable Preferred Stock, and $0.403125 per share of 6.45% Series D Cumulative Redeemable Preferred Stock. These dividends are payable February 28, 2017 to stockholders of record on February 14, 2017.
Item 7A. Quantitative and Qualitative Disclosures about Market Risk.
Market Risk
Market risk includes risks that arise from changes in interest rates, foreign currency exchange rates, commodity prices, equity prices and other market changes that impact market-sensitive instruments. In pursuing our business strategies, the primary market risk to which we are exposed is interest rate risk. Our primary interest rate exposure is to 30-day LIBOR. We primarily use fixed interest rate financing to manage our exposure to fluctuations in interest rates. On a limited basis we also use derivative financial instruments to manage interest rate risk.
At December 31, 2016, we were party to an interest rate derivative agreement, with a total notional amount of $75.0 million, where we receive variable-rate payments in exchange for making fixed-rate payments. This agreement is accounted for as a cash flow hedge and has a termination value of $1.2 million. The interest rate swap expires on October 1, 2018.
At December 31, 2016, after giving effect to our interest rate derivative agreement, $359.9 million, or 54.7%, of our debt had fixed interest rates and $297.7 million, or 45.3%, had variable interest rates. At December 31, 2015, after giving effect to our interest rate derivative agreements, $402.7 million, or 59.5%, of our debt had fixed interest rates and $274.4 million, or 40.5%, had variable interest rates. Assuming no increase in the level of our variable rate debt outstanding as of December 31, 2016, if interest rates increased by 1.0% our cash flow would decrease by approximately $3.0 million per year.
As our fixed-rate debts mature, they will become subject to interest rate risk. In addition, as our variable-rate debts mature, lenders may impose interest rate floors on new financing arrangements because of the low interest rates experienced during the past few years. At December 31, 2016, we have $7.7 million of debt maturing in 2017 all of which has fixed rates. Additionally, we have other scheduled payments of principal on debt in 2017 totaling $8.1 million.
Item 8. Financial Statements and Supplementary Data.
The financial statements and supplementary data required by this item are included on pages F-1 through F-43 of this Annual Report on Form 10-K and are incorporated by reference herein.
Item 9. Changes in and Disagreements with Accountants on Accounting and Financial Disclosure.
None.
52
Item 9A. Controls and Procedures.
Disclosure Controls and Procedures
Our management evaluated, with the participation of our Chief Executive Officer and our Chief Financial Officer, the effectiveness of our disclosure controls and procedures (as defined in Rule 13a-15(e) under the Exchange Act) as of December 31, 2016. Based on that evaluation, our Chief Executive Officer and our Chief Financial Officer concluded that, as of December 31, 2016, our disclosure controls and procedures were effective to provide reasonable assurance that information required to be disclosed in the reports we file or submit under the Exchange Act is recorded, processed, summarized and reported within the time periods specified in the SEC’s rules and forms, and that such information is accumulated and communicated to our management to allow timely decisions regarding required disclosure.
Management’s Report on the Effectiveness of Internal Control Over Financial Reporting
Our management is responsible for establishing and maintaining adequate internal control over financial reporting. Internal control over financial reporting is a process designed by, or under the supervision of, our Chief Executive Officer and our Chief Financial Officer, and effected by our board of directors, management and other personnel, to provide reasonable assurance regarding the reliability of financial reporting and the preparation of financial statements for external purposes in accordance with GAAP and includes those policies and procedures that:
• | pertain to the maintenance of records that, in reasonable detail, accurately and fairly reflect the transactions and dispositions of our assets; |
• | provide reasonable assurance that transactions are recorded as necessary to permit preparation of financial statements in accordance with GAAP and that our receipts and our expenditures are being made only in accordance with authorizations of our management and our board of directors; and |
• | provide reasonable assurance regarding prevention or timely detection of unauthorized acquisition, use or disposition of our assets that could have a material effect on our financial statements. |
Because of its inherent limitations, internal control over financial reporting may not prevent or detect misstatements. Also, projections of any evaluation of effectiveness to future periods are subject to the risk that controls may become inadequate because of changes in conditions, or that the degree of compliance with the policies or procedures may deteriorate.
In connection with the preparation of this Annual Report on Form 10-K, our management, under the supervision of our Chief Executive Officer and our Chief Financial Officer, conducted an evaluation of the effectiveness of our internal control over financial reporting as of December 31, 2016, based on criteria established in Internal Control—Integrated Framework (2013) established by the Committee of Sponsoring Organizations of the Treadway Commission. Based on such evaluation, our management concluded that we had effective internal control over financial reporting as of December 31, 2016.
Ernst & Young LLP, our independent registered public accounting firm, has issued an auditor’s attestation report on our management’s assessment of the effectiveness of our internal control over financial reporting as of December 31, 2016. This report is included in Part II, Item 8 of this Annual Report on Form 10-K.
Changes in Internal Control Over Financial Reporting
There were no material changes in our internal control over financial reporting during the year ended December 31, 2016.
Item 9B. Other Information.
None.
53
PART III
Item 10. Directors, Executive Officers and Corporate Governance.
The information required by this item is incorporated by reference to our Definitive Proxy Statement on Schedule 14A (the “2017 Proxy Statement”) for the 2017 Annual Meeting of Stockholders.
Item 11. Executive Compensation.
The information required by this item is incorporated by reference to our 2017 Proxy Statement.
Item 12. Security Ownership of Certain Beneficial Owners and Management and Related Stockholder Matters.
The information required by this item is incorporated by reference to our 2017 Proxy Statement.
Item 13. Certain Relationships and Related Transactions, and Director Independence.
The information required by this item is incorporated by reference to our 2017 Proxy Statement.
Item 14. Principal Accountant Fees and Services.
The information required by this item is incorporated by reference to our 2017 Proxy Statement.
PART IV
Item 15. Exhibits and Financial Statement Schedules.
1. Financial Statements:
Included herein at pages F-1 through F-39
2. Financial Statement Schedules:
The following financial statement schedule is included herein at pages F-40 - F-43.
Schedule III — Real Estate and Accumulated Depreciation
3. Exhibits:
See the Exhibit Index that appears after the signature page to this Annual Report on Form 10-K, which is incorporated herein by reference.
All schedules for which provision is made in Regulation S-X are either not required to be included herein pursuant to the related instructions or are inapplicable or the related information is included in the footnotes to the applicable financial statement.
54
SIGNATURES
Pursuant to the requirements of Section 13 or 15(d) of the Securities Exchange Act of 1934, the registrant has duly caused this report to be signed on its behalf by the undersigned, thereunto duly authorized.
SUMMIT HOTEL PROPERTIES, INC. (registrant) | ||
Date: February 23, 2017 | By: | /s/ Daniel P. Hansen |
Daniel P. Hansen | ||
Chairman of the Board of Directors | ||
President and Chief Executive Officer | ||
Pursuant to the requirements of the Securities Exchange Act of 1934, this report has been signed by the following persons on behalf of the registrant and in the capacities and on the dates indicated.
Signature | Title | Date | ||
/s/ Daniel P. Hansen | Chairman of the Board of Directors President and Chief Executive Officer | February 23, 2017 | ||
Daniel P. Hansen | (Principal Executive Officer) | |||
/s/ Greg A. Dowell | Executive Vice President, Chief Financial Officer and Treasurer | February 23, 2017 | ||
Greg A. Dowell | (Principal Financial Officer) | |||
/s/ Paul Ruiz | Vice President and Chief Accounting Officer | February 23, 2017 | ||
Paul Ruiz | (Principal Accounting Officer) | |||
/s/ Bjorn R. L. Hanson | Director | February 23, 2017 | ||
Bjorn R. L. Hanson | ||||
/s/ Jeffrey W. Jones | Director | February 23, 2017 | ||
Jeffrey W. Jones | ||||
/s/ Kenneth J. Kay | Director | February 23, 2017 | ||
Kenneth J. Kay | ||||
/s/ Thomas W. Storey | Director | February 23, 2017 | ||
Thomas W. Storey | ||||
55
EXHIBIT INDEX
Exhibit Number | Description of Exhibit | |
3.1 | Articles of Amendment and Restatement of Summit Hotel Properties, Inc. (incorporated by reference to Exhibit 3.1 to Annual Report on Form 10-K filed by Summit Hotel Properties, Inc. on February 28, 2012). | |
3.2 | Articles Supplementary designating the Company’s 9.25% Series A Cumulative Redeemable Preferred Stock, $0.01 par value per share (incorporated by reference to Exhibit 3.1 to Current Report on Form 8-K filed by Summit Hotel Properties, Inc. on October 28, 2011). | |
3.3 | Articles Supplementary designating the Company’s 7.875% Series B Cumulative Redeemable Preferred Stock, $0.01 par value per share (incorporated by reference to Exhibit 3.1 to Current Report on Form 8-K filed by Summit Hotel Properties, Inc. on December 7, 2012). | |
3.4 | Articles Supplementary designating the Company’s 7.125% Series C Cumulative Redeemable Preferred Stock, $0.01 par value per share (incorporated by reference to Exhibit 3.1 to Current Report on Form 8-K filed by Summit Hotel Properties, Inc. on March 19, 2013). | |
3.5 | Articles Supplementary designating the Company’s 6.45% Series D Cumulative Redeemable Preferred Stock, $0.01 par value per share (incorporated by reference to Exhibit 3.1 to Registration Statement on Form 8-A filed by Summit Hotel Properties, Inc. on June 24, 2016). | |
3.6 | Amended and Restated Bylaws of Summit Hotel Properties, Inc. (incorporated by reference to Exhibit 3.2 to Amendment No. 2 to Registration Statement on Form S-11 filed by Summit Hotel Properties, Inc. on November 1, 2010). | |
3.7 | First Amended and Restated Agreement of Limited Partnership of Summit Hotel OP, LP, dated February 14, 2011, as amended (incorporated by reference to Exhibit 3.4 to the Quarterly Report on Form 10-Q filed by Summit Hotel Properties, Inc. on May 6, 2013). | |
3.8 | First Amendment to the First Amended and Restated Agreement of Limited Partnership of Summit Hotel OP, LP (incorporated by reference to Exhibit 3.2 to Current Report on Form 8-K filed by Summit Hotel Properties, Inc. on October 28, 2011). | |
3.9 | Second Amendment to the First Amended and Restated Agreement of Limited Partnership of Summit Hotel OP, LP (incorporated by reference to Exhibit 3.1 to Current Report on Form 8-K filed by Summit Hotel Properties, Inc. on April 16, 2012). | |
3.10 | Third Amendment to the First Amended and Restated Agreement of Limited Partnership of Summit Hotel OP, LP (incorporated by reference to Exhibit 3.2 to Current Report on Form 8-K filed by Summit Hotel Properties, Inc. on December 7, 2012). | |
3.11 | Fourth Amendment to the First Amended and Restated Agreement of Limited Partnership of Summit Hotel OP, LP (incorporated by reference to Exhibit 3.2 to Current Report on Form 8-K filed by Summit Hotel Properties, Inc. on March 19, 2013). | |
3.12 | Fifth Amendment to the First Amended and Restated Agreement of Limited Partnership of Summit Hotel OP, LP (incorporated by reference to Exhibit 3.2 of the Company’s Current Report on Form 8-K filed with the SEC on June 24, 2016). | |
3.13 | Sixth Amendment to the First Amended and Restated Agreement of Limited Partnership of Summit Hotel OP, LP. (incorporated by reference to Exhibit 3.5 of the Company’s Quarterly Report on Form 10-Q filed by Summit Hotel Properties, Inc. on August 2, 2016). | |
3.14 | Articles Supplementary to the Articles of Amendment and Restatement of Summit Hotel Properties, Inc. prohibiting election under Sections 3-803, 3-804(a), 3-804(b) and 3-805 of the MGCL without stockholder approval (incorporated by reference to Exhibit 3.1 of the Company’s Current Report on Form 8-K filed with the SEC on May 26, 2016). | |
4.1 | Specimen certificate of common stock of Summit Hotel Properties, Inc. (incorporated by reference to Exhibit 4.1 to Amendment No. 5 to Registration Statement on Form S-11 filed by Summit Hotel Properties, Inc. on February 7, 2011). | |
10.1 | $450,000,000 Credit Agreement, dated as of January 15, 2016, among Summit Hotel OP, LP, as Borrower, Summit Hotel Properties, Inc., as Parent Guarantor, the other guarantors named therein, as Subsidiary Guarantors, the Initial Lenders, Initial Issuing Banks and Swing Line Banks named therein, Deutsche Bank AG New York Branch, as Administrative Agent, Bank of America, N.A. and Regions Bank, as Co-Syndication Agents, with Deutsche Bank Securities Inc., Merrill Lynch, Pierce Fenner & Smith Incorporated and Regions Capital Markets, as Joint Lead Arrangers and as Joint Bookrunners (incorporated by reference to Exhibit 10.1 to the Current Report on Form 8-K filed by Summit Hotel Properties, Inc. on January 20, 2016). | |
56
10.2 | $125,000,000 Credit Agreement, dated as of April 7, 2015, among Summit Hotel OP, LP, Summit Hotel Properties, Inc., the subsidiary guarantors party thereto, Key Bank National Association, Regions Bank, Raymond James Bank, N.A., Branch Banking and Trust Company and U.S. Bank National Association (incorporated by reference to Exhibit 10.1 to Current Report on Form 8-K filed by Summit Hotel Properties, Inc. on April 13, 2015). | |
10.3 | Accession Agreement, dated April 21, 2015, among Summit Hotel OP, LP, Summit Hotel Properties, Inc., the subsidiary guarantors party thereto, American Bank N.A., and KeyBank National Association (incorporated by reference to Exhibit 10.6 to Quarterly Report on Form 10-Q filed by Summit Hotel Properties, Inc. on May 4, 2015). | |
10.4 | First Amendment to Credit Agreement dated as of December 21, 2015, among Summit Hotel OP, LP, KeyBank National Association and the financial institutions party to the Credit Agreement (incorporated by reference to Exhibit 10.4 to Quarterly Report on Form 10-K filed by Summit Hotel Properties, Inc. on February 21, 2016). | |
10.5 | Second Amendment to Credit Agreement dated as of January 15, 2016, among Summit Hotel OP, LP, KeyBank National Association and the financial institutions party to the Credit Agreement (incorporated by reference to Exhibit 10.5 to Quarterly Report on Form 10-K filed by Summit Hotel Properties, Inc. on February 24, 2016). | |
10.6 | Amended and Restated Hotel Management Agreement, dated February 14, 2011, among Interstate Management Company, LLC and the subsidiaries of Summit Hotel Properties, Inc. party thereto (incorporated by reference to Exhibit 10.4 to Current Report on Form 8-K filed by Summit Hotel Properties, Inc. on February 18, 2011). | |
10.7 | First Amendment to Amended and Restated Hotel Management Agreement, dated June 30, 2011, among Interstate Management Company, LLC and the subsidiaries of the Company party thereto (incorporated by reference to Exhibit 10.2 to Quarterly Report on Form 10-Q filed by Summit Hotel Properties, Inc. on August 15, 2011). | |
10.8 | Form of Lease Agreement between Summit Hotel OP, LP and TRS Lessee (incorporated by reference to Exhibit 10.4 to Amendment No. 2 to Registration Statement on Form S-11 filed by Summit Hotel Properties, Inc. on November 1, 2010). | |
10.9* | Summit Hotel Properties, Inc. 2011 Equity Incentive Plan, as amended and restated effective June 15, 2015 (incorporated by reference to Appendix B to the Definitive Proxy Statement on Schedule 14A filed by Summit Hotel Properties, Inc. on April 28, 2015). | |
10.10* | Form of Option Award Agreement (incorporated by reference to Exhibit 10.6 to Amendment No. 1 to Registration Statement on Form S-11 filed by Summit Hotel Properties, Inc. on September 23, 2010). | |
10.11* | Form of Incentive Award Agreement between Summit Hotel Properties, Inc. and its executive officers (incorporated by reference to Exhibit 10.2 to Quarterly Report on Form 10-Q filed by Summit Hotel Properties, Inc. on May 5, 2012). | |
10.12* | Form of Stock Award Agreement (Performance Based Shares) between Summit Hotel Properties, Inc. and its executive officers (incorporated by reference to Exhibit 10.3 to Quarterly Report on Form 10-Q filed by Summit Hotel Properties, Inc. on May 5, 2012). | |
10.13* | Form of Stock Award Agreement (Service-Based Shares) between Summit Hotel Properties, Inc. and its executive officers (incorporated by reference to Exhibit 10.4 to Quarterly Report on Form 10-Q filed by Summit Hotel Properties, Inc. on May 5, 2012). | |
10.14* | Form of Stock Award Agreement (Performance Based Shares) between Summit Hotel Properties, Inc. and its executive officers (incorporated by reference to Exhibit 10.5 to Quarterly Report on Form 10-Q filed by Summit Hotel Properties, Inc. on May 4, 2015). | |
10.15* | Form of Stock Award Agreement (Service-Based Shares) between Summit Hotel Properties, Inc. and its executive officers (incorporated by reference to Exhibit 10.5 of the Company’s Quarterly Report on Form 10-Q filed by Summit Hotel Properties, Inc. on May 3, 2016). | |
10.16* | Form of Stock Award Agreement (Performance Based Shares) between Summit Hotel Properties, Inc. and its executive officers (incorporated by reference to Exhibit 10.6 of the Company’s Quarterly Report on Form 10-Q filed by Summit Hotel Properties, Inc. on May 3, 2016). | |
10.17* | Form of Incentive Award Agreement between Summit Hotel Properties, Inc. and its executive officers (incorporated by reference to Exhibit 10.7 of the Company’s Quarterly Report on Form 10-Q filed by Summit Hotel Properties, Inc. on May 3, 2016). | |
10.18* | Employment Agreement, dated May 28, 2014, between Summit Hotel Properties, Inc. and Daniel P. Hansen (incorporated by reference to Exhibit 10.2 to Quarterly Report on Form 10-Q filed by Summit Hotel Properties, Inc. on August 6, 2014). | |
10.19* | Employment Agreement, dated May 28, 2014, between Summit Hotel Properties, Inc. and Craig J. Aniszewski (incorporated by reference to Exhibit 10.3 to Quarterly Report on Form 10-Q filed by Summit Hotel Properties, Inc. on August 6, 2014). | |
57
10.20* | Employment Agreement, dated May 28, 2014, between Summit Hotel Properties, Inc. and Christopher R. Eng (incorporated by reference to Exhibit 10.4 to Quarterly Report on Form 10-Q filed by Summit Hotel Properties, Inc. on August 6, 2014). | |
10.21* | Employment Agreement, dated September 11, 2014 and effective as of October 1, 2014, between Summit Hotel Properties, Inc. and Greg A. Dowell (incorporated by reference to Exhibit 10.1 to the Current Report on Form 8-K filed by Summit Hotel Properties, Inc. on September 11, 2014). | |
10.22* | Employment Agreement, dated March 3, 2015, between Summit Hotel Properties, Inc. and Paul Ruiz (incorporated by reference to Exhibit 10.3 to the Quarterly Report on Form 10-Q filed by Summit Hotel Properties, Inc. on May 4, 2015). | |
10.23* | Form of Indemnification Agreement between Summit Hotel Properties, Inc. and each of its Executive Officers and Directors (incorporated by reference to Exhibit 10.14 to Amendment No. 2 to Registration Statement on Form S-11 filed by Summit Hotel Properties, Inc. on November 1, 2010). | |
10.24 | Sales Agreement, dated as of August 3, 2015, by and among Summit Hotel Properties, Inc., Summit Hotel OP, LP and Robert W. Baird & Co. Incorporated (incorporated by reference to Exhibit 10.7 to the Quarterly Report on Form 10-Q filed by Summit Hotel Properties, Inc. on August 3, 2015). | |
10.25 | Real Estate Purchase and Sale Agreement, dated as of June 2, 2015, by and among the Sellers listed on Schedule 1 attached thereto, Summit Hotel OP, LP and American Realty Capital Hospitality Portfolio SMT, LLC, relating to the sale of 16 hotels (“ARCH PSA #1”) (incorporated by reference to Exhibit 10.3 to the Quarterly Report on Form 10-Q for the quarterly period ended June 30, 2015 filed by Summit Hotel Properties, Inc. on August 3, 2015). | |
10.26 | Letter Agreement, dated July 15, 2015, amending ARCH PSA #1 (incorporated by reference to Exhibit 10.4 to the Quarterly Report on Form 10-Q for the quarterly period ended June 30, 2015 filed by Summit Hotel Properties, Inc. on August 3, 2015). | |
10.27 | Real Estate Purchase and Sale Agreement, dated as of June 2, 2015, by and among the Sellers listed on Schedule 1 attached thereto, Summit Hotel OP, LP and American Realty Capital Hospitality Portfolio SMT, LLC, relating to the sale of 10 hotels (“ARCH PSA #2”) (incorporated by reference to Exhibit 10.5 to the Quarterly Report on Form 10-Q for the quarterly period ended June 30, 2015 filed by Summit Hotel Properties, Inc. on August 3, 2015). | |
10.28 | Letter Agreement, dated July 15, 2015, amending ARCH PSA #2 (incorporated by reference to Exhibit 10.5 to the Quarterly Report on Form 10-Q for the quarterly period ended June 30, 2015 filed by Summit Hotel Properties, Inc. on August 3, 2015). | |
10.29 | Letter Agreement, dated as of February 11, 2016, by and among Summit Hotel OP, LP, and certain affiliated entities, and American Realty Capital Hospitality Portfolio SMT, LLC, (incorporated by reference to Exhibit 10.1 to the Current Report on Form 8-K filed by Summit Hotel Properties, Inc. on February 16, 2016). | |
10.30 | $27.5 million Loan Agreement dated February 11, 2016 between American Realty Capital Hospitality Trust, Inc. and Summit Hotel OP, LP (incorporated by reference to Exhibit 10.2 to the Current Report on Form 8-K filed by Summit Hotel Properties, Inc. on February 16, 2016). | |
10.31 | Sales Agreement, dated as of August 2, 2016, by and among Summit Hotel Properties, Inc., Summit Hotel OP, LP and Robert W. Baird & Co. Incorporated (incorporated by reference to Exhibit 10.1 of the Company’s Quarterly Report on Form 10-Q filed by Summit Hotel Properties, Inc. on August 2, 2016). | |
10.32 | Sales Agreement, dated as of August 2, 2016, by and among Summit Hotel Properties, Inc., Summit Hotel OP, LP and Raymond James & Associates, Inc. (incorporated by reference to Exhibit 10.2 of the Company’s Quarterly Report on Form 10-Q filed by Summit Hotel Properties, Inc. on August 2, 2016). | |
10.33 | Sales Agreement, dated as of August 2, 2016, by and among Summit Hotel Properties, Inc., Summit Hotel OP, LP and Merrill Lynch, Pierce, Fenner & Smith, Incorporated. (incorporated by reference to Exhibit 10.3 of the Company’s Quarterly Report on Form 10-Q filed by Summit Hotel Properties, Inc. on August 2, 2016). | |
10.34 | Sales Agreement, dated as of August 2, 2016, by and among Summit Hotel Properties, Inc., Summit Hotel OP, LP and Deutsche Bank Securities, Inc. (incorporated by reference to Exhibit 10.4 of the Company’s Quarterly Report on Form 10-Q filed by Summit Hotel Properties, Inc. on August 2, 2016). | |
10.35 | Sales Agreement, dated as of August 2, 2016, by and among Summit Hotel Properties, Inc., Summit Hotel OP, LP and RBC Capital Markets, LLC. (incorporated by reference to Exhibit 10.5 of the Company’s Quarterly Report on Form 10-Q filed by Summit Hotel Properties, Inc. on August 2, 2016). | |
10.36 | Sales Agreement, dated as of August 2, 2016, by and among Summit Hotel Properties, Inc., Summit Hotel OP, LP and KeyBanc Capital Markets, Inc. (incorporated by reference to Exhibit 10.6 of the Company’s Quarterly Report on Form 10-Q filed by Summit Hotel Properties, Inc. on August 2, 2016). | |
10.37 | Sales Agreement, dated as of August 2, 2016, by and among Summit Hotel Properties, Inc., Summit Hotel OP, LP and Canaccord Genuity, Inc. (incorporated by reference to Exhibit 10.7 of the Company’s Quarterly Report on Form 10-Q filed by Summit Hotel Properties, Inc. on August 2, 2016). | |
58
10.38 | Sales Agreement, dated as of August 2, 2016, by and among Summit Hotel Properties, Inc., Summit Hotel OP, LP and Jefferies, LLC. (incorporated by reference to Exhibit 10.8 of the Company’s Quarterly Report on Form 10-Q filed by Summit Hotel Properties, Inc. on August 2, 2016). | |
10.39 | Letter Agreement, dated as of January 10, 2017, by and among Summit Hotel OP, LP and certain affiliated entities, and American Realty Capital Hospitality Portfolio SMT ALT, LLC (incorporated by reference to Exhibit 10.1 to the Current Report on Form 8-K filed by Summit Hotel Properties, Inc. on January 13, 2017). | |
10.40 | Letter Agreement, dated as of January12, 2017, by and among Summit Hotel OP, LP and certain affiliated entities, and American Realty Capital Hospitality Portfolio SMT ALT, LLC (incorporated by reference to Exhibit 10.2 to the Current Report on Form 8-K filed by Summit Hotel Properties, Inc. on January 13, 2017). | |
10.41 | First Amendment to Loan Agreement, dated as of January 12, 2017, between American Realty Capital Hospitality Trust, Inc. and Summit Hotel OP, LP (incorporated by reference to Exhibit 10.3 to the Current Report on Form 8-K filed by Summit Hotel Properties, Inc. on January 13, 2017). | |
10.42 | $3.0 million Loan Agreement, dated as of January 12, 2017, between American Realty Capital Hospitality Trust, Inc. and Summit Hotel OP, LP (incorporated by reference to Exhibit 10.4 to the Current Report on Form 8-K filed by Summit Hotel Properties, Inc. on January 13, 2017). | |
12.1† | Calculation of Ratio of Earnings to Fixed Charges and Preferred Stock Dividends | |
21.1† | List of Subsidiaries of Summit Hotel Properties, Inc. | |
23.1† | Consent of Ernst & Young, LLP | |
31.1† | Certification of Chief Executive Officer of Summit Hotel Properties, Inc. pursuant to Rule 13a-14(a)/15d-14(a), as adopted pursuant to Section 302 of the Sarbanes-Oxley Act of 2002 | |
31.2† | Certification of Chief Financial Officer of Summit Hotel Properties, Inc. pursuant to Rule 13a-14(a)/15d-14(a), as adopted pursuant to Section 302 of the Sarbanes-Oxley Act of 2002 | |
32.1† | Certification of Chief Executive Officer of Summit Hotel Properties, Inc. pursuant to 18 U.S.C. Section 1350, as adopted pursuant to Section 906 of the Sarbanes-Oxley Act of 2002 | |
32.2† | Certification of Chief Financial Officer of Summit Hotel Properties, Inc. pursuant to 18 U.S.C. Section 1350, as adopted pursuant to Section 906 of the Sarbanes-Oxley Act of 2002 | |
101.INS† | XBRL Instance Document | |
101.SCH† | XBRL Taxonomy Extension Schema Document | |
101.CAL† | XBRL Taxonomy Extension Calculation Linkbase Document | |
101.DEF† | XBRL Taxonomy Extension Definition Linkbase Document | |
101.LAB† | XBRL Taxonomy Extension Labels Linkbase Document | |
101.PRE† | XBRL Taxonomy Presentation Linkbase Document | |
* Management contract or compensatory plan or arrangement.
† Filed herewithin
59
SUMMIT HOTEL PROPERTIES, INC.
INDEX TO FINANCIAL STATEMENTS AND SCHEDULE
Page | |
F-1
REPORT OF INDEPENDENT REGISTERED PUBLIC ACCOUNTING FIRM
The Board of Directors and Stockholders of
Summit Hotel Properties, Inc.
We have audited the accompanying consolidated balance sheets of Summit Hotel Properties, Inc. (the Company) as of December 31, 2016 and 2015, and the related consolidated statements of operations, comprehensive income, changes in equity and cash flows for each of the three years in the period ended December 31, 2016. Our audits also included the financial statement schedule listed in the Index at Item 15.2. These financial statements and schedule are the responsibility of the Company’s management. Our responsibility is to express an opinion on these financial statements and schedule based on our audits.
We conducted our audits in accordance with the standards of the Public Company Accounting Oversight Board (United States). Those standards require that we plan and perform the audits to obtain reasonable assurance about whether the financial statements are free of material misstatement. An audit includes examining, on a test basis, evidence supporting the amounts and disclosures in the financial statements. An audit also includes assessing the accounting principles used and significant estimates made by management, as well as evaluating the overall financial statement presentation. We believe that our audits provide a reasonable basis for our opinion.
In our opinion, the consolidated financial statements referred to above present fairly, in all material respects, the consolidated financial position of Summit Hotel Properties, Inc. at December 31, 2016 and 2015, and the consolidated results of its operations and its cash flows for each of the three years in the period ended December 31, 2016, in conformity with U.S. generally accepted accounting principles. Also, in our opinion, the related financial statement schedule, when considered in relation to the basic financial statements taken as a whole, presents fairly in all material respects the information set forth therein.
As discussed in Note 2 to the consolidated financial statements, the Company changed its method for classifying debt issuance costs during 2016.
We also have audited, in accordance with the standards of the Public Company Accounting Oversight Board (United States), the Company’s internal control over financial reporting as of December 31, 2016, based on criteria established in Internal Control-Integrated Framework issued by the Committee of Sponsoring Organizations of the Treadway Commission (2013 Framework), and our report dated February 23, 2017 expressed an unqualified opinion thereon.
/s/ Ernst & Young LLP
Austin, Texas
February 23, 2017
F-2
REPORT OF INDEPENDENT REGISTERED PUBLIC ACCOUNTING FIRM
The Board of Directors and Shareholders of
Summit Hotel Properties, Inc.
We have audited Summit Hotel Properties, Inc.’s (the Company) internal control over financial reporting as of December 31, 2016, based on criteria established in Internal Control-Integrated Framework issued by the Committee of Sponsoring Organizations of the Treadway Commission 2013 framework (the COSO criteria). Summit Hotel Properties, Inc.’s management is responsible for maintaining effective internal control over financial reporting, and for its assessment of the effectiveness of internal control over financial reporting included in the accompanying Managements Report on the Effectiveness of Internal Control Over Financial Reporting. Our responsibility is to express an opinion on the company’s internal control over financial reporting based on our audit.
We conducted our audit in accordance with the standards of the Public Company Accounting Oversight Board (United States). Those standards require that we plan and perform the audit to obtain reasonable assurance about whether effective internal control over financial reporting was maintained in all material respects. Our audit included obtaining an understanding of internal control over financial reporting, assessing the risk that a material weakness exists, testing and evaluating the design and operating effectiveness of internal control based on the assessed risk, and performing such other procedures as we considered necessary in the circumstances. We believe that our audit provides a reasonable basis for our opinion.
A company’s internal control over financial reporting is a process designed to provide reasonable assurance regarding the reliability of financial reporting and the preparation of financial statements for external purposes in accordance with generally accepted accounting principles. A company’s internal control over financial reporting includes those policies and procedures that (1) pertain to the maintenance of records that, in reasonable detail, accurately and fairly reflect the transactions and dispositions of the assets of the company; (2) provide reasonable assurance that transactions are recorded as necessary to permit preparation of financial statements in accordance with generally accepted accounting principles, and that receipts and expenditures of the company are being made only in accordance with authorizations of management and directors of the company; and (3) provide reasonable assurance regarding prevention or timely detection of unauthorized acquisition, use, or disposition of the company’s assets that could have a material effect on the financial statements.
Because of its inherent limitations, internal control over financial reporting may not prevent or detect misstatements. Also, projections of any evaluation of effectiveness to future periods are subject to the risk that controls may become inadequate because of changes in conditions, or that the degree of compliance with the policies or procedures may deteriorate.
In our opinion, Summit Hotel Properties, Inc. maintained, in all material respects, effective internal control over financial reporting as of December 31, 2016, based on the COSO criteria.
We also have audited, in accordance with the standards of the Public Company Accounting Oversight Board (United States), the consolidated balance sheets of Summit Hotel Properties, Inc. as of December 31, 2016 and 2015, and the related consolidated statements of operations, consolidated statements of comprehensive income, consolidated statements of changes in equity and consolidated statements of cash flows for each of the three years in the period ended December 31, 2016 of Summit Hotel Properties, Inc. and our report dated February 23, 2017 expressed an unqualified opinion thereon.
/s/ Ernst & Young LLP
Austin, Texas
February 23, 2017
F-3
Summit Hotel Properties, Inc.
Consolidated Balance Sheets
(in thousands, except share amounts)
December 31, | ||||||||
2016 | 2015 | |||||||
ASSETS | ||||||||
Investment in hotel properties, net | $ | 1,538,868 | $ | 1,333,407 | ||||
Land held for development | 5,742 | 5,742 | ||||||
Assets held for sale | 62,695 | 133,138 | ||||||
Investment in real estate loans, net | 17,585 | 12,803 | ||||||
Cash and cash equivalents | 34,694 | 29,326 | ||||||
Restricted cash | 24,881 | 23,073 | ||||||
Trade receivables, net | 11,807 | 9,437 | ||||||
Prepaid expenses and other | 6,474 | 15,281 | ||||||
Deferred charges, net | 3,727 | 3,628 | ||||||
Other assets | 12,032 | 9,559 | ||||||
Total assets | $ | 1,718,505 | $ | 1,575,394 | ||||
LIABILITIES AND EQUITY | ||||||||
Liabilities: | ||||||||
Debt, net of debt issuance costs | $ | 652,414 | $ | 671,536 | ||||
Accounts payable | 4,623 | 2,947 | ||||||
Accrued expenses and other | 46,880 | 42,174 | ||||||
Derivative financial instruments | 1,118 | 1,811 | ||||||
Total liabilities | 705,035 | 718,468 | ||||||
Commitments and contingencies (Note 9) | ||||||||
Equity: | ||||||||
Preferred stock, $.01 par value per share, 100,000,000 shares authorized: | ||||||||
9.25% Series A - 2,000,000 shares issued and outstanding at December 31, 2015 (aggregate liquidation preference of $50,398 at December 31, 2015) | — | 20 | ||||||
7.875% Series B - 3,000,000 shares issued and outstanding at December 31, 2016 and 2015 (aggregate liquidation preference of $75,509 at December 31, 2016 and 2015) | 30 | 30 | ||||||
7.125% Series C - 3,400,000 shares issued and outstanding at December 31, 2016 and 2015 (aggregate liquidation preference of $85,522 at December 31, 2016 and 2015) | 34 | 34 | ||||||
6.45% Series D - 3,000,000 shares issued and outstanding at December 31, 2016 (aggregate liquidation preference of $75,417 at December 31, 2016) | 30 | — | ||||||
Common stock, $.01 par value per share, 500,000,000 shares authorized, 93,525,469 and 86,793,521 shares issued and outstanding at December 31, 2016 and 2015, respectively | 935 | 868 | ||||||
Additional paid-in capital | 1,011,412 | 894,060 | ||||||
Accumulated other comprehensive loss | (977 | ) | (1,666 | ) | ||||
Accumulated deficit and distributions | (1,422 | ) | (40,635 | ) | ||||
Total stockholders’ equity | 1,010,042 | 852,711 | ||||||
Non-controlling interests in operating partnership | 3,428 | 4,215 | ||||||
Total equity | 1,013,470 | 856,926 | ||||||
Total liabilities and equity | $ | 1,718,505 | $ | 1,575,394 | ||||
See Notes to Consolidated Financial Statements
F-4
Summit Hotel Properties, Inc.
Consolidated Statements of Operations
(in thousands, except per share amounts)
For the Years Ended December 31, | ||||||||||||
2016 | 2015 | 2014 | ||||||||||
Revenues: | ||||||||||||
Room | $ | 443,270 | $ | 436,202 | $ | 380,472 | ||||||
Other hotel operations revenue | 30,665 | 27,253 | 22,994 | |||||||||
Total revenues | 473,935 | 463,455 | 403,466 | |||||||||
Expenses: | ||||||||||||
Hotel operating expenses: | ||||||||||||
Room | 110,221 | 109,844 | 101,150 | |||||||||
Other direct | 64,608 | 64,010 | 55,388 | |||||||||
Other indirect | 120,852 | 121,974 | 104,959 | |||||||||
Total hotel operating expenses | 295,681 | 295,828 | 261,497 | |||||||||
Depreciation and amortization | 72,406 | 64,052 | 63,763 | |||||||||
Corporate general and administrative | 19,292 | 21,204 | 19,884 | |||||||||
Hotel property acquisition costs | 3,492 | 1,246 | 769 | |||||||||
Loss on impairment of assets | 577 | 1,115 | 8,847 | |||||||||
Total expenses | 391,448 | 383,445 | 354,760 | |||||||||
Operating income | 82,487 | 80,010 | 48,706 | |||||||||
Other income (expense): | ||||||||||||
Interest expense | (28,091 | ) | (30,414 | ) | (28,517 | ) | ||||||
Gain on disposal of assets, net | 49,855 | 65,067 | 391 | |||||||||
Other income, net | 2,560 | 11,146 | 595 | |||||||||
Total other income (expense) | 24,324 | 45,799 | (27,531 | ) | ||||||||
Income from continuing operations before income taxes | 106,811 | 125,809 | 21,175 | |||||||||
Income tax benefit (expense) | 1,450 | (553 | ) | (744 | ) | |||||||
Income from continuing operations | 108,261 | 125,256 | 20,431 | |||||||||
Income from discontinued operations, net of taxes | — | — | 492 | |||||||||
Net income | 108,261 | 125,256 | 20,923 | |||||||||
Less - income attributable to non-controlling interests: | ||||||||||||
Operating partnership | (456 | ) | (819 | ) | (51 | ) | ||||||
Joint venture | — | — | (1 | ) | ||||||||
Net income attributable to Summit Hotel Properties, Inc. | 107,805 | 124,437 | 20,871 | |||||||||
Preferred dividends | (18,232 | ) | (16,588 | ) | (16,588 | ) | ||||||
Premium on redemption of Series A Preferred Stock | (2,125 | ) | — | — | ||||||||
Net income attributable to common stockholders | $ | 87,448 | $ | 107,849 | $ | 4,283 | ||||||
Earnings per share - Basic: | ||||||||||||
Net income per share from continuing operations | $ | 1.00 | $ | 1.25 | $ | 0.04 | ||||||
Net income per share from discontinued operations | — | — | 0.01 | |||||||||
Net income per share | $ | 1.00 | $ | 1.25 | $ | 0.05 | ||||||
Earnings per share - Diluted: | ||||||||||||
Net income per share from continuing operations | $ | 1.00 | $ | 1.24 | $ | 0.04 | ||||||
Net income per share from discontinued operations | — | — | 0.01 | |||||||||
Net income per share | $ | 1.00 | $ | 1.24 | $ | 0.05 | ||||||
Weighted average common shares outstanding: | ||||||||||||
Basic | 86,874 | 85,920 | 85,242 | |||||||||
Diluted | 87,343 | 87,144 | 85,566 | |||||||||
Dividends per share | $ | 0.55 | $ | 0.47 | $ | 0.46 | ||||||
See Notes to Consolidated Financial Statements
F-5
Summit Hotel Properties, Inc.
Consolidated Statements of Comprehensive Income
(in thousands)
For the Years Ended December 31, | ||||||||||||
2016 | 2015 | 2014 | ||||||||||
Net income | $ | 108,261 | $ | 125,256 | $ | 20,923 | ||||||
Other comprehensive income (loss), net of tax: | ||||||||||||
Changes in fair value of derivative financial instruments | 693 | 81 | (371 | ) | ||||||||
Comprehensive income | 108,954 | 125,337 | 20,552 | |||||||||
Less - Comprehensive income attributable to non-controlling interests: | ||||||||||||
Operating partnership | (460 | ) | (820 | ) | (47 | ) | ||||||
Joint venture | — | — | (1 | ) | ||||||||
Comprehensive income attributable to Summit Hotel Properties, Inc. | 108,494 | 124,517 | 20,504 | |||||||||
Preferred dividends | (18,232 | ) | (16,588 | ) | (16,588 | ) | ||||||
Premium on redemption of Series A Preferred Stock | (2,125 | ) | — | — | ||||||||
Comprehensive income attributable to common stockholders | $ | 88,137 | $ | 107,929 | $ | 3,916 | ||||||
See Notes to Consolidated Financial Statements
F-6
Summit Hotel Properties, Inc.
Consolidated Statements of Changes in Equity
For the Years Ended December 31, 2016, 2015 and 2014
(in thousands, except share amounts)
Shares of Preferred Stock | Preferred Stock | Shares of Common Stock | Common Stock | Additional Paid-In Capital | Accumulated Other Comprehensive Income (Loss) | Accumulated Deficit and Distributions | Non-controlling Interests | |||||||||||||||||||||||||||||||||||
Total Shareholders’ Equity | Operating Partnership | Joint Venture | Total Equity | |||||||||||||||||||||||||||||||||||||||
Balance at December 31, 2013 | 8,400,000 | $ | 84 | 85,402,408 | $ | 854 | $ | 882,858 | $ | (1,379 | ) | $ | (72,577 | ) | $ | 809,840 | $ | 4,722 | $ | 7,816 | $ | 822,378 | ||||||||||||||||||||
Common stock redemption of common units | — | — | 438,631 | 4 | 2,425 | — | — | 2,429 | (2,429 | ) | — | — | ||||||||||||||||||||||||||||||
Common units issued for acquisition | — | — | — | — | — | — | — | — | 3,685 | — | 3,685 | |||||||||||||||||||||||||||||||
Acquisition of non-controlling interest in joint venture | — | — | — | — | (415 | ) | — | — | (415 | ) | — | (7,817 | ) | (8,232 | ) | |||||||||||||||||||||||||||
Dividends paid | — | — | — | — | — | — | (56,073 | ) | (56,073 | ) | (477 | ) | — | (56,550 | ) | |||||||||||||||||||||||||||
Equity-based compensation | — | — | 321,269 | 3 | 3,479 | — | — | 3,482 | 42 | — | 3,524 | |||||||||||||||||||||||||||||||
Other | — | — | (12,588 | ) | — | (156 | ) | — | — | (156 | ) | — | — | (156 | ) | |||||||||||||||||||||||||||
Other comprehensive loss | — | — | — | — | — | (367 | ) | — | (367 | ) | (4 | ) | — | (371 | ) | |||||||||||||||||||||||||||
Net income | — | — | — | — | — | — | 20,871 | 20,871 | 51 | 1 | 20,923 | |||||||||||||||||||||||||||||||
Balance at December 31, 2014 | 8,400,000 | 84 | 86,149,720 | 861 | 888,191 | (1,746 | ) | (107,779 | ) | 779,611 | 5,590 | — | 785,201 | |||||||||||||||||||||||||||||
Common stock redemption of common units | — | — | 268,947 | 3 | 1,919 | — | — | 1,922 | (1,922 | ) | — | — | ||||||||||||||||||||||||||||||
Dividends paid | — | — | — | — | — | — | (57,293 | ) | (57,293 | ) | (309 | ) | — | (57,602 | ) | |||||||||||||||||||||||||||
Equity-based compensation | — | — | 411,239 | 4 | 4,713 | — | — | 4,717 | 36 | — | 4,753 | |||||||||||||||||||||||||||||||
Other | — | — | (36,385 | ) | — | (763 | ) | — | — | (763 | ) | — | — | (763 | ) | |||||||||||||||||||||||||||
Other comprehensive income | — | — | — | — | — | 80 | — | 80 | 1 | — | 81 | |||||||||||||||||||||||||||||||
Net income | — | — | — | — | — | — | 124,437 | 124,437 | 819 | — | 125,256 | |||||||||||||||||||||||||||||||
Balance at December 31, 2015 | 8,400,000 | 84 | 86,793,521 | 868 | 894,060 | (1,666 | ) | (40,635 | ) | 852,711 | 4,215 | — | 856,926 | |||||||||||||||||||||||||||||
Net proceeds from sale of common stock | — | — | 6,151,514 | 62 | 88,995 | — | — | 89,057 | — | — | 89,057 | |||||||||||||||||||||||||||||||
Net proceeds from sale of preferred stock | 3,000,000 | 30 | — | — | 72,260 | — | — | 72,290 | — | — | 72,290 | |||||||||||||||||||||||||||||||
Redemption of preferred shares | (2,000,000 | ) | (20 | ) | — | — | (47,855 | ) | — | (2,125 | ) | (50,000 | ) | — | — | (50,000 | ) | |||||||||||||||||||||||||
Common stock redemption of common units | — | — | 119,308 | 1 | 1,022 | — | — | 1,023 | (1,023 | ) | — | — | ||||||||||||||||||||||||||||||
Dividends paid | — | — | — | — | — | — | (66,467 | ) | (66,467 | ) | (246 | ) | — | (66,713 | ) | |||||||||||||||||||||||||||
Equity-based compensation | — | — | 522,748 | 5 | 4,194 | — | — | 4,199 | 22 | — | 4,221 | |||||||||||||||||||||||||||||||
Other | — | — | (61,622 | ) | (1 | ) | (1,264 | ) | — | — | (1,265 | ) | — | — | (1,265 | ) | ||||||||||||||||||||||||||
Other comprehensive income | — | — | — | — | — | 689 | — | 689 | 4 | — | 693 | |||||||||||||||||||||||||||||||
Net income | — | — | — | — | — | — | 107,805 | 107,805 | 456 | — | 108,261 | |||||||||||||||||||||||||||||||
Balance at December 31, 2016 | 9,400,000 | $ | 94 | 93,525,469 | $ | 935 | $ | 1,011,412 | $ | (977 | ) | $ | (1,422 | ) | $ | 1,010,042 | $ | 3,428 | $ | — | $ | 1,013,470 | ||||||||||||||||||||
See Notes to Consolidated Financial Statements
F-7
Summit Hotel Properties, Inc.
Consolidated Statements of Cash Flows
(in thousands)
For the Years Ended December 31, | ||||||||||||
2016 | 2015 | 2014 | ||||||||||
OPERATING ACTIVITIES | ||||||||||||
Net income | $ | 108,261 | $ | 125,256 | $ | 20,923 | ||||||
Adjustments to reconcile net income to net cash provided by operating activities: | ||||||||||||
Depreciation and amortization | 72,406 | 64,052 | 63,776 | |||||||||
Amortization of deferred financing costs | 2,143 | 1,723 | 1,549 | |||||||||
Loss on impairment of assets | 577 | 1,115 | 9,247 | |||||||||
Equity-based compensation | 4,221 | 4,753 | 3,524 | |||||||||
Deferred tax asset, net | (2,391 | ) | 64 | (127 | ) | |||||||
Gain on disposal of assets, net | (49,855 | ) | (65,067 | ) | (446 | ) | ||||||
Other | 180 | 1,287 | 48 | |||||||||
Changes in operating assets and liabilities: | ||||||||||||
Restricted cash - operating | 1,195 | 18 | (631 | ) | ||||||||
Trade receivables, net | (2,655 | ) | (1,727 | ) | (419 | ) | ||||||
Prepaid expenses and other | (626 | ) | 28 | 3,618 | ||||||||
Accounts payable | 1,676 | (4,324 | ) | (312 | ) | |||||||
Accrued expenses and other | 2,803 | 5,038 | 1,389 | |||||||||
NET CASH PROVIDED BY OPERATING ACTIVITIES | 137,935 | 132,216 | 102,139 | |||||||||
INVESTING ACTIVITIES | ||||||||||||
Acquisitions of hotel properties | (244,714 | ) | (236,518 | ) | (177,820 | ) | ||||||
Improvements to hotel properties | (42,433 | ) | (43,197 | ) | (42,432 | ) | ||||||
Proceeds from asset dispositions, net of closing costs | 145,347 | 150,054 | 19,280 | |||||||||
Funding of real estate loans | (27,500 | ) | (2,634 | ) | (7,366 | ) | ||||||
Proceeds from repayment or sale of real estate loans | 7,814 | — | — | |||||||||
(Increase) decrease in restricted cash - FF&E reserve | (3,003 | ) | 11,304 | 16,275 | ||||||||
Decrease (increase) in escrow deposits for acquisitions | 10,046 | (10,046 | ) | — | ||||||||
Acquisition of non-controlling interest in joint venture | — | — | (8,232 | ) | ||||||||
Investment in hotel properties under development | — | (75 | ) | (253 | ) | |||||||
NET CASH USED IN INVESTING ACTIVITIES | (154,443 | ) | (131,112 | ) | (200,548 | ) | ||||||
FINANCING ACTIVITIES | ||||||||||||
Proceeds from issuance of debt | 405,000 | 600,407 | 263,601 | |||||||||
Principal payments on debt | (424,545 | ) | (550,150 | ) | (115,829 | ) | ||||||
Proceeds from equity offerings, net of offering costs | 161,347 | — | — | |||||||||
Redemption of preferred shares | (50,000 | ) | — | — | ||||||||
Dividends paid | (66,713 | ) | (57,602 | ) | (56,550 | ) | ||||||
Financing fees on debt | (1,948 | ) | (2,250 | ) | (782 | ) | ||||||
Other | (1,265 | ) | (764 | ) | (156 | ) | ||||||
NET CASH PROVIDED BY (USED IN) FINANCING ACTIVITIES | 21,876 | (10,359 | ) | 90,284 | ||||||||
Net change in cash and cash equivalents | 5,368 | (9,255 | ) | (8,125 | ) | |||||||
CASH AND CASH EQUIVALENTS | ||||||||||||
Beginning of period | 29,326 | 38,581 | 46,706 | |||||||||
End of period | $ | 34,694 | $ | 29,326 | $ | 38,581 | ||||||
SUPPLEMENTAL DISCLOSURE OF CASH FLOW INFORMATION | ||||||||||||
Cash payments for interest | $ | 26,156 | $ | 28,927 | $ | 26,925 | ||||||
Capitalized interest | $ | — | $ | 75 | $ | 253 | ||||||
Cash payments for income taxes, net of refunds | $ | 1,228 | $ | 2,436 | $ | 926 | ||||||
Mortgage debt assumed for acquisitions of hotel properties | $ | — | $ | — | $ | 43,172 | ||||||
Fair value of common units issued for acquisition of hotel | $ | — | $ | — | $ | 3,685 | ||||||
See Notes to Consolidated Financial Statements
F-8
SUMMIT HOTEL PROPERTIES, INC.
NOTES TO THE CONSOLIDATED FINANCIAL STATEMENTS
NOTE 1 –– DESCRIPTION OF BUSINESS
Summit Hotel Properties, Inc. (the “Company”) is a self-managed hotel investment company that was organized on June 30, 2010 as a Maryland corporation. The Company holds both general and limited partnership interests in Summit Hotel OP, LP (the “Operating Partnership”), a Delaware limited partnership also organized on June 30, 2010. On February 14, 2011, the Company closed on its initial public offering and completed certain formation transactions, including the merger of Summit Hotel Properties, LLC with and into the Operating Partnership. Unless the context otherwise requires, “we”, “us”, and “our” refer to the Company and its consolidated subsidiaries.
We focus primarily on owning premium-branded, select-service hotels. At December 31, 2016, our portfolio consisted of 81 hotels with a total of 10,957 guestrooms located in 23 states. We have elected to be taxed as a real estate investment trust (“REIT”) for federal income tax purposes commencing with our short taxable year ended December 31, 2011. To qualify as a REIT, we cannot operate or manage our hotels. Accordingly, all of our hotels are leased to subsidiaries (“TRS Lessees”) of our taxable REIT subsidiary (“TRS”). We indirectly own 100% of the outstanding equity interests in all of our TRS Lessees.
NOTE 2 –– SUMMARY OF SIGNIFICANT ACCOUNTING POLICIES
Basis of Presentation
The accompanying Consolidated Financial Statements of the Company consolidate the accounts of the Company and all entities that are controlled by ownership of a majority voting interest, as well as variable interest entities for which the Company is the primary beneficiary. All significant intercompany balances and transactions have been eliminated in the Consolidated Financial Statements.
We prepare our Consolidated Financial Statements in conformity with U.S. Generally Accepted Accounting Principles (“GAAP”), which requires us to make estimates and assumptions that affect the reported amounts of assets and liabilities at the date of the Consolidated Financial Statements and reported amounts of revenues and expenses in the reporting period. Actual results could differ from those estimates.
Segment Disclosure
Accounting Standards Codification (“ASC”), ASC 280, Segment Reporting, establishes standards for reporting financial and descriptive information about an enterprise’s reportable segments. We have determined that we have one reportable segment, with activities related to investing in real estate. Our investments in real estate are geographically diversified and the chief operating decision makers evaluate operating performance on an individual asset level. As each of our assets has similar economic characteristics, the assets have been aggregated into one reportable segment.
F-9
Investment in Hotel Properties
The Company allocates the purchase price of acquired hotel properties based on the fair value of the acquired land, land improvements, building, furniture, fixtures and equipment, identifiable intangible assets or liabilities, other assets and assumed liabilities. Intangible assets may include certain value associated with the on-going operations of the hotel business being acquired as part of the hotel property acquisition. Acquired intangible assets that derive their values from real property or an interest in real property, are inseparable from that real property or interest in real property, and do not produce or contribute to the production of income other than consideration for the use or occupancy of space, are recorded as a component of the related real estate asset in our Consolidated Financial Statements. Identifiable intangible assets or liabilities may also arise from assumed contractual arrangements as part of the acquisition of the hotel property, including terms that are above or below market compared to an estimated fair market value of the agreement on the acquisition date. We determine the acquisition-date fair values of all assets and assumed liabilities using methods similar to those used by independent appraisers, including using a discounted cash flow analysis that uses appropriate discount or capitalization rates and available market information. Estimates of future cash flows are based on a number of factors including historical operating results, known and anticipated trends, and market and economic conditions. Acquisition costs are expensed as incurred.
Our hotel properties and related assets are recorded at cost, less accumulated depreciation. We capitalize the costs of significant additions and improvements that materially upgrade, increase the value or extend the useful life of the property. These costs may include hotel refurbishment, renovation, and remodeling expenditures, as well as certain indirect internal costs related to construction projects. We expense the cost of repairs and maintenance as incurred.
We generally depreciate our hotel properties and related assets using the straight-line method over their estimated useful lives as follows:
Classification | Estimated Useful Lives | |
Buildings and improvements | 6 to 40 years | |
Furniture, fixtures and equipment | 2 to 15 years | |
We periodically re-evaluate asset lives based on current assessments of remaining utilization, which may result in changes in estimated useful lives. Such changes are accounted for prospectively and will increase or decrease future depreciation expense.
When depreciable property and equipment is retired or disposed, the related costs and accumulated depreciation are removed from the balance sheet and any gain or loss is reflected in current operations.
On a limited basis, we provide financing to developers of hotel properties for development projects. We evaluate these arrangements to determine if we participate in residual profits of the hotel property through the loan provisions or other agreements. Where we conclude that these arrangements are more appropriately treated as an investment in the hotel property, we reflect the loan as an investment in hotel properties under development in our Consolidated Balance Sheets. If classified as hotel properties under development, no interest income is recognized on the loan and interest expense is capitalized as part of our investment in the hotel property during the construction period.
We monitor events and changes in circumstances for indicators that the carrying value of a hotel property or land held for development may be impaired. Additionally, we perform at least annual reviews to monitor the factors that could trigger an impairment. Factors that we consider for an impairment analysis include, among others: i) significant underperformance relative to historical or anticipated operating results, ii) significant changes in the manner of use of a property or the strategy of our overall business, including changes in the estimated holding periods for hotel properties and land parcels, iii) a significant increase in competition, iv) a significant adverse change in legal factors or regulations, and v) significant negative industry or economic trends. When such factors are identified, we prepare an estimate of the undiscounted future cash flows of the specific property and determine if the carrying amount of the asset is recoverable. If an impairment is identified, we estimate the fair value of the property based on discounted cash flows or sales price if the property is under contract and an adjustment is made to reduce the carrying value of the property to its estimated fair value.
Intangible Assets
We amortize intangible assets with determined finite useful lives using the straight-line method. We do not amortize intangible assets with indefinite useful lives, but we evaluate these assets for impairment annually or at interim periods if events or circumstances indicate that the asset may be impaired.
F-10
Assets Held for Sale
We periodically review our hotel properties and our land held for development based on established criteria such as age, type of franchise, adverse economic and competitive conditions, and strategic fit to identify properties that we believe are either non-strategic or no longer complement our business. Based on our review, we periodically market properties for sale that no longer meet our investment criteria.
We classify assets as Assets Held for Sale in the period in which certain criteria are met, including when the sale of the asset within one year is probable. Assets classified as Assets Held for Sale are no longer depreciated and are carried at the lower of carrying amount or fair value less selling costs.
Variable Interest Entities
We consolidate variable interest entities (each a “VIE”) if we determine that we are the primary beneficiary of the entity. When evaluating the accounting for a VIE, we consider the purpose for which the VIE was created, the importance of each of the activities in which it is engaged and our decision-making role, if any, in those activities that significantly determine the entity’s economic performance relative to other economic interest holders. We determine our rights, if any, to receive benefits or the obligation to absorb losses that could potentially be significant to the VIE by considering the economic interest in the entity, regardless of form, which may include debt, equity, management and servicing fees, or other contractual arrangements. We consider other relevant factors including each entity’s capital structure, contractual rights to earnings or obligations for losses, subordination of our interests relative to those of other investors, contingent payments, and other contractual arrangements that may be economically significant.
Additionally, we have in the past and may in the future enter into purchase and sale transactions in accordance with Section 1031 of the Internal Revenue Code of 1986, as amended (“IRC”), for the exchange of like-kind property to defer taxable gains on the sale of real estate properties (“1031 Exchange”). For reverse transactions under a 1031 Exchange in which we purchase a new property prior to selling the property to be matched in the like-kind exchange (we refer to a new property being acquired by us in the 1031 Exchange prior to the sale of the related property as a “Parked Asset”), legal title to the Parked Asset is held by a qualified intermediary engaged to execute the 1031 Exchange until the sale transaction and the 1031 Exchange is completed. We retain essentially all of the legal and economic benefits and obligations related to the Parked Assets prior to completion of the 1031 Exchanges. As such, the Parked Assets are included in our Consolidated Balance Sheets and Consolidated Statements of Operations as a VIE until legal title is transferred to us upon completion of the 1031 Exchange.
Cash and Cash Equivalents
We consider all highly liquid investments purchased with an original maturity of three months or less to be cash equivalents. At times, cash on deposit may exceed the federally insured limit. We maintain our cash with high credit quality financial institutions.
Restricted Cash
Restricted cash consists of certain funds maintained in escrow for property taxes, insurance, and certain capital expenditures. Funds may be disbursed from the account upon proof of expenditures and approval from the lender or other party requiring the restricted cash reserves.
Trade Receivables and Credit Policies
We grant credit to qualified customers, generally without collateral, in the form of trade accounts receivable. Trade receivables result from the rental of hotel guestrooms and the sales of food, beverage, and banquet services and are payable under normal trade terms. Trade receivables are stated at the amount billed to the customer and do not accrue interest.
We regularly review the collectability of our trade receivables. A provision for losses is determined on the basis of previous loss experience and current economic conditions. Our allowance for doubtful accounts was $0.1 million at December 31, 2016 and 2015. Bad debt expense was $0.6 million, $0.3 million and $0.4 million for the years ended December 31, 2016, 2015 and 2014, respectively.
F-11
Deferred Charges, net
Initial franchise fees are capitalized and amortized over the term of the franchise agreement using the straight-line method.
Deferred Financing Fees
In accordance with ASU No. 2015-03, Simplifying the Presentation of Debt Issuance Costs, debt issuance costs are presented as a direct deduction from the carrying value of the debt liability on the Consolidated Balance Sheets. Debt issuance costs are amortized as a component of interest expense over the term of the related debt using the straight-line method, which approximates the interest method. All periods have been reclassified to conform to this presentation.
Non-controlling Interests
Non-controlling interests represent the portion of equity in a consolidated entity held by owners other than the consolidating parent. Non-controlling interests are reported in the Consolidated Balance Sheets within equity, separately from stockholders’ equity. Revenue, expenses and net income attributable to both the Company and the non-controlling interests are reported in the Consolidated Statements of Operations.
Our Consolidated Financial Statements include non-controlling interests related to common units of limited partnership interests (“Common Units”) in the Operating Partnership held by unaffiliated third parties.
Revenue Recognition
We recognize revenue when guestrooms are occupied and services have been rendered or fees are earned. Revenues are recorded net of any sales and other taxes collected from customers. All discounts are recorded as a reduction to revenue. Cash received prior to guest arrival is recorded as an advance from the customer and is recognized at the time of occupancy.
Occupancy, Sales and Other Taxes
We have operations in states and municipalities that impose occupancy, sales and other taxes on certain sales. We collect these taxes from our customers and remit the entire amount to the various governmental units. The taxes collected and remitted are excluded from revenues and are included in accrued expenses until remitted.
Equity-Based Compensation
Our 2011 Equity Incentive Plan, which was amended and restated effective June 15, 2015 (as amended, the “Equity Plan”), provides for the grant of stock options, stock appreciation rights, restricted stock, restricted stock units, dividend equivalent rights, and other stock-based awards. We account for the stock options granted upon completion of our IPO at fair value using the Black-Scholes option-pricing model and we account for time-based stock awards using the grant date fair value of those equity awards. Restricted stock awards with performance-based vesting conditions are market-based awards tied to total stockholder return and are valued using a Monte Carlo simulation model in accordance with ASC Topic 718, Compensation — Stock Compensation. We expense the fair value of awards under the Equity Plan ratably over the vesting period and market-based awards are not adjusted for performance. The amount of stock-based compensation expense may be subject to adjustment in future periods due to a change in forfeiture assumptions or modification of previously granted awards.
Derivative Financial Instruments and Hedging
All derivative financial instruments are recorded at fair value and reported as a derivative financial instrument asset or liability in our Consolidated Balance Sheets. We use interest rate derivatives to hedge our risks on variable-rate debt. Interest rate derivatives could include swaps, caps and floors. We assess the effectiveness of each hedging relationship by comparing changes in fair value or cash flows of the derivative financial instrument with the changes in fair value or cash flows of the designated hedged item or transaction.
For interest rate derivatives designated as cash flow hedges, the effective portion of changes in fair value is initially reported as a component of accumulated other comprehensive loss in the equity section of our Consolidated Balance Sheets and reclassified to interest expense in our Consolidated Statements of Operations in the period in which the hedged item affects earnings. The ineffective portion of changes in fair value is recognized in current earnings in Other Income (Expense) in the Consolidated Statements of Operations.
F-12
Income Taxes
We have elected to be taxed as a REIT under certain provisions of the IRC. To qualify as a REIT, we must meet certain organizational and operational requirements, including a requirement to distribute annually to our stockholders at least 90% of our REIT taxable income, determined without regard to the deduction for dividends paid and excluding net capital gains, which does not necessarily equal net income as calculated in accordance with GAAP. As a REIT, we generally will not be subject to federal income tax (other than taxes paid by our TRS at regular corporate income tax rates) to the extent we distribute 100% of our REIT taxable income to our stockholders. If we fail to qualify as a REIT in any taxable year, we will be subject to federal income tax on our taxable income at regular corporate income tax rates and generally will be unable to re-elect REIT status until the fifth calendar year after the year in which we failed to qualify as a REIT, unless we satisfy certain relief provisions.
Substantially all of our assets are held by and all of our operations are conducted through our Operating Partnership. Partnerships are not subject to U.S. federal income taxes as revenues and expenses pass through to and are taxed on the partners. Generally, the states and cities where partnerships operate follow the U.S. federal income tax treatment. However, there are a limited number of local and state jurisdictions that tax the taxable income of the Operating Partnership. Accordingly, we provide for income taxes in these jurisdictions for the Operating Partnership.
Taxable income related to our TRS is subject to federal, state and local income taxes at applicable tax rates. Our consolidated income tax provision includes the income tax provision related to the operations of the TRS as well as state and local income taxes related to the Operating Partnership.
Where required, we account for federal and state income taxes using the asset and liability method. Deferred tax assets and liabilities are recognized for: i) the future tax consequences attributable to differences between carrying amounts of existing assets and liabilities based on GAAP and the respective carrying amounts for tax purposes, and ii) operating losses and tax-credit carryforwards. Deferred tax assets and liabilities are measured using enacted tax rates expected to apply to taxable income in the years in which temporary differences are expected to be recovered or settled. The effect on deferred tax assets and liabilities of a change in tax rates is recognized in income in the period that includes the enactment date of the change in tax rates. However, deferred tax assets are recognized only to the extent that it is more likely than not they will be realized based on consideration of available evidence, including future reversals of taxable temporary differences, future projected taxable income and tax planning strategies.
We perform a review of any uncertain tax positions and if necessary will record expected future tax consequences of uncertain tax positions in the financial statements.
Fair Value Measurement
Fair value measures are classified into a three-tiered fair value hierarchy, which prioritizes the inputs used in measuring fair value as follows:
Level 1: | Observable inputs such as quoted prices in active markets. | |
Level 2: | Directly or indirectly observable inputs, other than quoted prices in active markets. | |
Level 3: | Unobservable inputs in which there is little or no market data, which require a reporting entity to develop its own assumptions. | |
Assets and liabilities measured at fair value are based on one or more of the following valuation techniques:
Market approach: | Prices and other relevant information generated by market transactions involving identical or comparable assets or liabilities. | |
Cost approach: | Amount required to replace the service capacity of an asset (replacement cost). | |
Income approach: | Techniques used to convert future amounts to a single amount based on market expectations (including present-value, option-pricing, and excess-earnings models). | |
Our estimates of fair value were determined using available market information and appropriate valuation methods. Considerable judgment is necessary to interpret market data and develop estimated fair value. The use of different market assumptions or estimation methods may have a material effect on the estimated fair value amounts. We classify assets and liabilities in the fair value hierarchy based on the lowest level of input that is significant to the fair value measurement.
F-13
We elected not to use the fair value option for cash and cash equivalents, restricted cash, trade receivables, prepaid expenses and other, debt, accounts payable, and accrued expenses and other. With the exception of our fixed-rate debt (See “Note 5 — Debt”), the carrying amounts of these financial instruments approximate their fair values due to their short-term nature or variable interest rates.
Use of Estimates
The preparation of financial statements in conformity with GAAP requires management to make certain estimates and assumptions that affect the reported amounts of assets and liabilities and the disclosure of contingent assets and liabilities at the date of the financial statements and the reported amounts of revenue and expenses during the reporting period. Actual results could differ from those estimates.
Reclassifications
Certain amounts reported in previous periods, such as the reporting of deferred financing costs, have been reclassified to conform to the current presentation primarily as a result of adopting new accounting standards in the current year. Reclassifications had no net effect on the Company’s previously reported financial position or results of operations.
New Accounting Standards
In May 2014, the FASB issued ASU No. 2014-09, Revenue from Contracts with Customers, which requires an entity to recognize the amount of revenue to which it expects to be entitled for the transfer of promised goods or services to customers. ASU No. 2014-09 will replace most existing revenue recognition guidance in GAAP when it becomes effective. The standard permits the use of either the retrospective or cumulative effect transition method. In July 2015, the FASB voted to defer the effective date to January 1, 2018 with early adoption beginning January 1, 2017. We have begun to evaluate each of our revenue streams under the new model. Based on preliminary assessments, we do not expect the adoption of ASU No. 2014-09 to have a material effect on our financial position or our results of operations.
In January 2016, the FASB issued ASU No. 2016-01, Recognition and Measurement of Financial Assets and Financial Liabilities, which enhances the reporting requirements surrounding the measurement of financial instruments and requires equity securities to be measured at fair value with changes in the fair value recognized through net income for the period. ASU No. 2016-01 is effective for our fiscal year commencing on January 1, 2018. The adoption of ASU No. 2016-01 will not have a material effect on our financial position or our results of operations.
In February 2016, the FASB issued ASU No. 2016-02, Leases, which changes lessee accounting to reflect the financial liability and right-of-use assets that are inherent to leasing an asset on the balance sheet. ASU No. 2016-02 is effective for our fiscal year commencing on January 1, 2019, but early adoption is permitted. We anticipate that we will adopt ASU No. 2016-02 for our fiscal year commencing on January 1, 2019. We expect to apply the modified retrospective approach such that we will account for leases that commenced before the effective date of ASU No. 2016-02 in accordance with previous GAAP unless the lease is modified, except we will recognize right-of-use assets and a lease liability for all operating leases at each reporting date based on the present value of the remaining minimum rental payments that were tracked and disclosed under previous GAAP. The effect that the adoption of ASU No. 2016-02 will have on our financial position or results of operations is not currently reasonably estimable.
In March 2016, the FASB issued ASU No. 2016-09, Improvements to Employee Share-Based Payment Accounting, which simplifies the accounting for income taxes for certain equity-based awards to employees. ASU No. 2016-09 is effective for our fiscal year commencing on January 1, 2017. The adoption of ASU No. 2016-09 will not have a material effect on our financial position or our results of operations.
In August 2016, the FASB issued ASU No. 2016-15, Classification of Certain Cash Receipts and Cash Payments, which addresses the Statement of Cash Flow classification and presentation of certain cash transactions. ASU No. 2016-15 is effective for our fiscal year commencing on January 1, 2018. The effect of this amendment is to be applied retrospectively where practical and early adoption is permitted. We expect to adopt ASU No. 2016-15 for our fiscal year commencing on January 1, 2018. The adoption of ASU No. 2016-15 will not have a material effect on our financial position or our results of operations.
In October 2016, the FASB issued ASU No. 2016-17, Interest Held Through Related Parties That Are Under Common Control, which amends the accounting guidance when determining the treatment of certain VIEs to include the interest of related parties under common control in a VIE when considering whether or not the reporting entity is the primary beneficiary of the VIE
F-14
when considering consolidation. ASU No. 2016-17 is effective for our fiscal year commencing on January 1, 2017. The adoption of ASU No. 2016-17 will not have a material effect on our financial position or our results of operations.
In November 2016, the FASB issued ASU No. 2016-18, Classification of Restricted Cash, which addresses the Statement of Cash Flow classification and presentation of restricted cash transactions. ASU No. 2016-18 is effective for our fiscal year commencing on January 1, 2018. The effect of this amendment is to be applied retrospectively and early adoption is permitted. We expect to adopt ASU No. 2016-18 for our fiscal year commencing on January 1, 2018. The adoption of ASU No. 2016-18 will not have a material effect on our financial position or our results of operations.
In January 2017, the FASB issued ASU No. 2017-01, Clarifying the Definition of a Business, with the objective of adding guidance to assist entities with evaluating whether transactions should be accounted for as an acquisition of assets or a business. ASU No. 2017-01 is effective for our fiscal year commencing on January 1, 2018. The effect of this guidance is to be applied prospectively and early adoption is permitted. We are evaluating early adoption of ASU No. 2017-01 for our fiscal year commencing on January 1, 2017. The adoption of ASU No. 2017-01 will not have a material effect on our financial position or our results of operations.
NOTE 3 –– INVESTMENT IN HOTEL PROPERTIES
Investment in Hotel Properties, net
Investment in hotel properties, net at December 31, 2016 and 2015 include (in thousands):
2016 | 2015 | |||||||
Land | $ | 178,423 | $ | 149,996 | ||||
Hotel buildings and improvements | 1,433,389 | 1,222,017 | ||||||
Construction in progress | 22,490 | 6,555 | ||||||
Furniture, fixtures and equipment | 129,437 | 123,332 | ||||||
1,763,739 | 1,501,900 | |||||||
Less - accumulated depreciation | (224,871 | ) | (168,493 | ) | ||||
$ | 1,538,868 | $ | 1,333,407 | |||||
Depreciation expense was $72.1 million, $63.7 million, and $63.3 million for the years ended December 31, 2016, 2015 and 2014, respectively.
Assets Held for Sale
Assets held for sale at December 31, 2016 and 2015 include the following (in thousands):
2016 | 2015 | |||||||
Land | $ | 10,907 | $ | 24,250 | ||||
Hotel building and improvements | 44,718 | 97,249 | ||||||
Furniture, fixtures and equipment | 6,649 | 10,906 | ||||||
Construction in progress | 29 | 42 | ||||||
Franchise fees | 392 | 691 | ||||||
$ | 62,695 | $ | 133,138 | |||||
On June 2, 2015, the Operating Partnership and certain affiliated entities entered into two separate agreements (collectively, the “ARCH Agreement”), as amended on July 15, 2015, to sell a portfolio of 26 hotels containing an aggregate of 2,793 guestrooms to affiliates of American Realty Capital Hospitality Trust, Inc. (“ARCH”) for an aggregate cash sales price of approximately $347.4 million (the “ARCH Sale”). The hotels were to be sold in three separate closings. As a result, the 26 hotels to be sold were reclassified as Assets Held for Sale upon execution of the ARCH Agreement. The first closing of 10 hotels consisting of 1,090 guestrooms was completed on October 15, 2015 for an aggregate cash payment of $150.1 million (the “First Closing”). The First Closing resulted in a gain on the sale of assets of $66.6 million that was recorded in the fourth quarter of 2015.
F-15
On February 11, 2016, we completed the sale of six hotels to ARCH for an aggregate selling price of $108.3 million, with the proceeds from the sale of the hotels being used to complete certain reverse 1031 Exchanges (the “ARCH Second Closing”). The hotels acquired by us for the reverse 1031 Exchanges included the 179-guestroom Courtyard by Marriott, Atlanta (Decatur), GA on October 20, 2015, for a purchase price of $44.0 million and the 226-guestroom Courtyard by Marriott, Nashville, TN for a purchase price of $71.0 million on January 19, 2016. The completion of the reverse 1031 Exchanges resulted in the deferral of taxable gains of approximately $74.0 million and the pay-down of our unsecured revolving credit facility by $105.0 million. Additionally, we repaid a mortgage loan totaling $5.8 million related to sale of the Springhill Suites, Denver, CO to ARCH. The sale to ARCH resulted in a $56.8 million gain, of which $20.0 million was initially deferred related to the seller financing described below. Through December 31, 2016, we have recognized as income $5.0 million of the deferred gain upon receipt of scheduled repayments of the principal balance of the loan from ARCH.
On February 11, 2016, the Operating Partnership entered into a loan agreement with ARCH, as borrower, which provides for a loan by the Operating Partnership to ARCH in the amount of $27.5 million (the “Loan” or “Loan Agreement”) as further described below. The proceeds of the Loan were required to be applied by ARCH as follows: (i) $20.0 million was applied toward the payment of a portion of the $108.3 million purchase price for the six hotels acquired by ARCH as part of the ARCH Second Closing; and (ii) the remaining $7.5 million was applied by ARCH to fund the escrow deposit required by the Reinstatement Agreement described below.
As previously disclosed by us in a Current Report on 8-K filed on February 16, 2016, and a Current Report on 8-K filed on January 6, 2017, we and American Realty Capital Hospitality Portfolio SMT ALT, LLC (“ARCH Purchaser”), an affiliate of ARCH, entered into a letter agreement (the “Reinstatement Agreement”) to reinstate the Real Estate Purchase and Sale Agreement, dated as of June 2, 2015, (the “Purchase Agreement”) in its entirety, except as modified by the Reinstatement Agreement and further amended by the 2017 Letter Agreement defined below.
Pursuant to the Purchase Agreement, the ARCH Purchaser had the right to acquire from us fee simple interests in the eight hotels (the “Remaining Hotels”) listed below containing a total of 741 guestrooms for an aggregate purchase price of $77.2 million with a closing that was required to occur by January 10, 2017. On January 10, 2017, the Company and ARCH Purchaser entered into a letter agreement to extend the required closing date of the Purchase Agreement to January 12, 2017.
Hotel | Location | Guestrooms | ||
Courtyard by Marriott | Jackson, MS | 117 | ||
Courtyard by Marriott | Germantown, TN | 93 | ||
Courtyard by Marriott | El Paso, TX | 90 | ||
Fairfield Inn & Suites | Germantown, TN | 80 | ||
Homewood Suites | Ridgeland, MS | 91 | ||
Residence Inn | Jackson, MS | 100 | ||
Residence Inn | Germantown, TN | 78 | ||
Staybridge Suites | Ridgeland, MS | 92 | ||
741 | ||||
On January 12, 2017, the Company and the ARCH Purchaser entered into a letter agreement (the “2017 Letter Agreement”) to amend the terms of the Purchase Agreement as follows:
The closing date of the sale of the Remaining Hotels, except the Courtyard by Marriott, El Paso, TX (the “El Paso Courtyard”), is scheduled to occur on or before April 27, 2017 (the “Closing Date”), or at such later date as the closing may be adjourned or extended in accordance with the express terms of the Reinstatement Agreement. The closing date for the El Paso Courtyard is scheduled to occur on October 24, 2017 (the “El Paso Closing Date”). If, on the El Paso Closing Date, the El Paso Courtyard is under contract to be sold to a bona fide third party purchaser that is not an affiliate of the Company, the ARCH Purchaser will not be obligated to purchase the hotel.
We continue to have the right to market and ultimately sell, without the consent of the ARCH Purchaser, any or all of the Remaining Hotels to a bona fide third party purchaser that is not an affiliate of ours. If we sell some, but not all, of the Remaining Hotels to a bona fide third party purchaser, then the purchase price to be paid by the ARCH Purchaser for the Remaining Hotels will be reduced accordingly.
F-16
We anticipate executing reverse and forward 1031 Exchanges for a substantial portion of the ARCH Sale to defer taxable gains that are expected to result from the sale. As such, certain hotels that we may purchase before the final closing of the ARCH Sale have been or will be consummated in a manner such that legal title is or will be held by a qualified intermediary engaged to execute the 1031 Exchanges until the ARCH Sale is consummated and the 1031 Exchanges are completed. We retain or will retain essentially all of the legal and economic benefits and obligations related to the Parked Assets. As such, the Parked Assets are or will be included in our Consolidated Balance Sheet and Consolidated Statements of Operations as VIE’s until legal title is transferred to us upon completion of the 1031 Exchanges.
In addition to the assets of the eight hotels noted above, Assets Held for Sale at December 31, 2016 includes land parcels in Spokane, WA and Flagstaff, AZ, which are being actively marketed for sale.
In addition to the assets of the hotels subject to the ARCH Sale, Assets Held for Sale at December 31, 2015, included land parcels in Spokane, WA, Fort Meyers, FL, and Flagstaff, AZ.
Modification of $27.5 million Loan Agreement
On January 12, 2017, we entered into a First Amendment to Loan Agreement with ARCH modifying the terms of the Loan.
The outstanding principal amount of the Loan, and any accrued and unpaid interest, will be due and payable on February 11, 2018 (the “Maturity Date”), unless extended pursuant to the Loan Agreement. Any payment-in-kind (“PIK”) interest accrued as of January 12, 2017, under the terms of the Loan Agreement will be deferred until the earlier of the Closing Date or the termination of the Purchase Agreement as the result of a breach by the ARCH Purchaser. However, if the sale of the Remaining Hotels occurs on the Closing Date, the entire principal amount of the Loan and any accrued and unpaid interest, including the PIK interest accrued through the Closing Date, will be due and payable on the Closing Date. If the sale of the Remaining Hotels does not occur on the Closing Date, ARCH is required to immediately pay the outstanding PIK accrued through February 11, 2017, and to repay a portion of the outstanding principal balance of the Loan in an aggregate amount of $2.0 million, to be paid in two equal installments of $1.0 million, on the last day of August and September 2017. The Loan may be prepaid in whole or in part at any time by ARCH without payment of any penalty or premium. ARCH shall be deemed to be in default of the Second Loan Agreement (as defined below) if it is in default under the terms of the Loan Agreement.
Execution of $3.0 Million Loan Agreement
On January 12, 2017, we entered into a loan agreement with ARCH, as borrower, which provides for a loan to ARCH in the amount of $3.0 million (the “Second Loan” or “Second Loan Agreement”). The proceeds of the Second Loan will be deemed as consideration for the 2017 Letter Agreement, but shall not be collectible by us unless the Purchase Agreement is terminated as a result of a breach by the ARCH Purchaser.
The outstanding principal amount of the Second Loan, and any accrued and unpaid interest, shall be due and payable on July 31, 2017 (the “Maturity Date”). However, if the sale of the Remaining Hotels occurs on the Closing Date, the entire principal amount of the Second Loan shall be deemed paid in full and ARCH shall have no further obligations to us except for payment of any unpaid interest accrued and payable as of the Closing Date. If the sale of the Remaining Hotels does not occur on the Closing Date, ARCH is required to repay the principal amount of the Second Loan in installments of $1.0 million on the last day of each of May, June and July 2017. The Second Loan may be prepaid in whole or in part at any time, without payment of any penalty or premium. The ARCH Borrower shall be deemed to be in default of the Loan Agreement if it is in default of the Second Loan Agreement.
Interest will accrue on the unpaid principal balance of the Second Loan at a rate of 13.0% per annum from the date of the Second Loan to February 11, 2017, and at 14.0% per annum from February 11, 2017, to the earlier of the Closing Date or the Maturity Date. An amount equal to 9.0% per annum is to be paid monthly beginning January 31, 2017. The remaining 4.0%, 5.0% and any other unpaid interest, as the case may be, will accrue and be compounded monthly.
F-17
Other Dispositions
On May 13, 2016, we completed the sale of the Holiday Inn Express & Suites in Irving (Las Colinas), TX for $10.5 million.
We also completed the sale of two properties previously contracted for sale to the ARCH Purchaser to third parties unrelated to the ARCH Purchaser under the terms of the Reinstatement Agreement. The first sale was the Aloft in Jacksonville, FL for $8.6 million on June 1, 2016. The second sale was the Holiday Inn Express in Vernon Hills, IL for $5.9 million on June 7, 2016. The proceeds from the sale of the Holiday Inn Express & Suites in Irving (Las Colinas), TX and the Holiday Inn Express in Vernon Hills, IL were used to complete a reverse 1031 Exchange with the acquisition of the 160-guestroom Residence Inn by Marriott in Atlanta, GA on January 20, 2016 for a purchase price of $38.0 million. The completion of the reverse 1031 Exchange resulted in the deferral of taxable gains of approximately $5.1 million.
On July 6, 2016, we completed the sale of the Hyatt Place in Irving (Las Colinas), TX for $14.0 million. The proceeds from the sale of this property were used to complete a 1031 Exchange related to the purchase of the 157-guestroom Marriott in Boulder, CO on August 9, 2016 for a purchase price of $61.4 million. The completion of the 1031 Exchange resulted in the deferral of taxable gains of approximately $7.5 million.
The sale of the ten properties during the year ended December 31, 2016 resulted in the realization of a combined net gain of $49.8 million.
Hotel Property Acquisitions
Hotel property acquisitions in 2016 and 2015 were as follows (in thousands):
Date Acquired | Franchise/Brand | Location | Guestrooms | Purchase Price | ||||||||
Year Ended December 31, 2016 | ||||||||||||
January 19 | Courtyard by Marriott | Nashville, TN | 226 | $ | 71,000 | |||||||
January 20 | Residence Inn | Atlanta, GA | 160 | 38,000 | ||||||||
August 9 | Marriott | Boulder, CO | 157 | 61,400 | ||||||||
October 28 | Hyatt Place (1) | Chicago, IL | 206 | 73,750 | ||||||||
749 | $ | 244,150 | (2) | |||||||||
Year Ended December 31, 2015 | ||||||||||||
April 13 | Hampton Inn & Suites | Minneapolis, MN | 211 | $ | 38,951 | |||||||
June 18 | Hampton Inn | Boston (Norwood), MA | 139 | 24,000 | ||||||||
June 30 | Hotel Indigo | Asheville, NC | 115 | 35,000 | ||||||||
July 24 | Residence Inn | Branchburg, NJ | 101 | 25,700 | ||||||||
July 24 | Residence Inn | Baltimore (Hunt Valley), MD | 141 | 31,100 | ||||||||
October 19 | Hyatt House | Miami, FL | 156 | 39,000 | ||||||||
October 20 | Courtyard by Marriott | Atlanta (Decatur), GA | 179 | 44,000 | ||||||||
1,042 | $ | 237,751 | (3) | |||||||||
(1) | This hotel was a Parked Asset at December 31, 2016 pending the completion of a reverse 1031 Exchange related to the sale of certain properties. See “Note 2 — Summary of Significant Accounting Policies — Variable Interest Entities” to these Consolidated Financial Statements. As such, the legal title to this Parked Asset was held by a qualified intermediary engaged to execute 1031 Exchanges. We retain essentially all of the legal and economic benefits and obligations related to the Parked Asset. As such, the Parked Asset was included in our Consolidated Balance Sheet at December 31, 2016 and Consolidated Statement of Operations for the year then ended as a VIE until legal title is transferred to us upon completion of the 1031 Exchange. |
(2) | The net assets acquired totaled $244.7 million due to the purchase at settlement of $0.6 million of net working capital assets. |
(3) | The net assets acquired totaled $237.9 million due to the purchase at settlement of $0.1 million of net working capital assets. |
F-18
The allocation of the aggregate purchase prices to the fair value of assets and liabilities acquired for the above acquisitions is as follows (in thousands):
2016 | 2015 | |||||||
Land | $ | 28,683 | $ | 18,947 | ||||
Hotel buildings and improvements | 207,433 | 208,864 | ||||||
Furniture, fixtures and equipment | 8,081 | 6,803 | ||||||
Other assets | 1,240 | 7,072 | ||||||
Total assets acquired | 245,437 | 241,686 | ||||||
Less lease liability assumed | — | (3,250 | ) | |||||
Less other liabilities | (723 | ) | (577 | ) | ||||
Net assets acquired | $ | 244,714 | $ | 237,859 | ||||
Total revenues and net income for hotel properties acquired in 2016 and 2015, which are included in our Consolidated Statements of Operations for the years ended December 31, 2016 and 2015, are as follows (in thousands):
2016 Acquisitions | 2015 Acquisitions | |||||||||||
2016 | 2016 | 2015 | ||||||||||
Revenues | $ | 28,560 | $ | 52,196 | $ | 22,811 | ||||||
Net income | $ | 6,992 | $ | 5,816 | $ | 3,317 | ||||||
The results of operations of acquired hotel properties are included in the Consolidated Statements of Operations beginning on their respective acquisition dates. The following unaudited condensed pro forma financial information presents the results of operations as if all acquisitions in 2016 and 2015 had taken place on January 1, 2015 and all dispositions had occurred prior to that date. The unaudited condensed pro forma financial information is for comparative purposes only and is not necessarily indicative of what actual results of operations would have been had the hotel acquisitions and dispositions taken place on or before January 1, 2015. This information does not purport to be indicative of or represent results of operations for future periods.
The unaudited condensed pro forma financial information for 2016 and 2015 is as follows (in thousands, except per share):
2016 | 2015 | |||||||
(unaudited) | ||||||||
Revenues | $ | 484,989 | $ | 460,422 | ||||
Net income (1) | $ | 66,099 | $ | 62,432 | ||||
Net income attributable to common stockholders, net of amount allocated to participating securities (1) | $ | 45,319 | $ | 45,381 | ||||
Net income per share attributable to common stockholders (1): | ||||||||
Basic | $ | 0.52 | $ | 0.53 | ||||
Diluted | $ | 0.52 | $ | 0.52 | ||||
(1) | The pro forma amounts exclude the $49.8 million and $66.6 million pre-tax gain on the sale of hotel properties during the years ended December 31, 2016 and 2015, respectively. |
F-19
NOTE 4 — SUPPLEMENTAL BALANCE SHEET INFORMATION
Investment in Real Estate Loans
Investment in real estate loans, net at December 31, 2016 and 2015 includes (in thousands):
2016 | 2015 | |||||||
Real estate loan | $ | 10,085 | $ | 10,085 | ||||
ARCH Loan (net of deferred gain of $15.0 million at December 31, 2016) | 7,500 | — | ||||||
Seller-financing note | — | 2,718 | ||||||
$ | 17,585 | $ | 12,803 | |||||
At December 31, 2016 and 2015, the real estate loan totaling $10.1 million had an interest rate of 10.0% per annum paid monthly and an initial maturity date of May 31, 2017. On January 12, 2017, the borrower exercised an option to extend the maturity date until May 13, 2018. The interest rate remains 10.0% per annum during the extension period and principal payments will be made based on a 25-year amortization schedule.
At December 31, 2016, the outstanding PIK interest related to the ARCH Loan totaled $0.9 million. We will recognize the PIK interest as payments are received from ARCH.
At December 31, 2015, we held two notes receivable totaling $2.7 million related to seller-financing for the sale in a prior year of two hotel properties in Emporia, KS (each an "Emporia Property"). The loans had matured and the buyer was in payment default under the terms of the loans. We were awarded legal title to one Emporia Property through foreclosure. We also purchased an additional note receivable from the first priority lien holder for the Emporia Property for which foreclosure proceedings were ongoing to facilitate the completion of the reacquisition of this Emporia Property through a foreclosure. On April 15, 2016, we completed the sale of the reacquired Emporia Property to a third party purchaser that was unrelated to the prior owner. On May 18, 2016, we completed the sale of the first and second lien notes related to the remaining Emporia Property to the same purchaser. The aggregate selling price of the Emporia Properties was approximately $4.5 million. As a result of the foreclosure activities and the sale of the notes, we have no further interest in either Emporia Property.
Restricted Cash
Restricted cash at December 31, 2016 and 2015 was as follows (in thousands):
2016 | 2015 | |||||||
FF&E reserves | $ | 22,000 | $ | 18,997 | ||||
Property taxes | 2,220 | 2,758 | ||||||
Other | 661 | 1,318 | ||||||
$ | 24,881 | $ | 23,073 | |||||
Prepaid Expenses and Other
Prepaid expenses and other at December 31, 2016 and 2015 was as follows (in thousands):
2016 | 2015 | |||||||
Prepaid insurance | $ | 2,218 | $ | 813 | ||||
Escrow deposits | — | 10,046 | ||||||
Other | 4,256 | 4,422 | ||||||
$ | 6,474 | $ | 15,281 | |||||
F-20
Deferred Charges
Deferred charges at December 31, 2016 and 2015 were as follows (in thousands):
2016 | 2015 | |||||||
Initial franchise fees | $ | 5,101 | $ | 4,760 | ||||
Less - accumulated amortization | (1,374 | ) | (1,132 | ) | ||||
Total | $ | 3,727 | $ | 3,628 | ||||
Amortization expense for the years ended December 31, 2016, 2015, and 2014 was $0.3 million, $0.4 million and $0.5 million, respectively.
Other Assets
Other assets at December 31, 2016 and 2015 was as follows (in thousands):
2016 | 2015 | |||||||
Acquired intangible assets | $ | 6,254 | $ | 6,122 | ||||
Prepaid land lease | 3,275 | 3,325 | ||||||
Deferred tax asset, net | 2,503 | 112 | ||||||
$ | 12,032 | $ | 9,559 | |||||
At December 31, 2016, intangible assets consisted of assumed contractual arrangements including terms that were above market compared to an estimated fair market value of the agreement at the acquisition date. These assets are being amortized using the straight-line method over a weighted average amortization period of 29.0 years.
Future amortization expense is expected to be as follows (in thousands):
2017 | $ | 471 | ||
2018 | 350 | |||
2019 | 213 | |||
2020 | 190 | |||
2021 | 190 | |||
Thereafter | 4,840 | |||
$ | 6,254 | |||
Accrued Expenses and Other
Accrued expenses and other at December 31, 2016 and 2015 was as follows (in thousands):
2016 | 2015 | |||||||
Accrued property, sales and income taxes | $ | 11,171 | $ | 12,901 | ||||
Accrued salaries and benefits | 10,802 | 9,366 | ||||||
Accrued interest | 1,655 | 1,862 | ||||||
Acquired unfavorable leases | 4,812 | 4,907 | ||||||
Accrued expenses at hotels | 12,356 | 10,536 | ||||||
Other | 6,084 | 2,602 | ||||||
$ | 46,880 | $ | 42,174 | |||||
F-21
NOTE 5 –– DEBT
At December 31, 2016, our indebtedness is comprised of borrowings under a $450 million senior unsecured credit facility, the 2015 Term Loan (as defined below), and indebtedness secured by first priority mortgage liens on various hotel properties. At December 31, 2015, our indebtedness was comprised of borrowings under the former $300.0 million senior unsecured credit facility, the 2015 Term Loan, and indebtedness secured by first priority mortgage liens on various hotel properties. The weighted average interest rate, after giving affect to our interest rate derivative, for all borrowings was 3.69% and 3.90% at December 31, 2016 and 2015, respectively.
Former $300 Million Senior Unsecured Credit Facility
At December 31, 2015, we had a $300.0 million senior unsecured credit facility. The senior unsecured credit facility was comprised of a $225.0 million revolving credit facility (the “$225 million Revolver”) and a $75.0 million term loan. At December 31, 2015, the maximum amount of borrowing permitted under the senior unsecured credit facility was $300.0 million, of which we had borrowed $170.0 million and $130.0 million was available to borrow. The $300.0 million senior unsecured credit facility was replaced by the $450.0 million senior unsecured credit facility as described below. The outstanding principal balance of $170.0 million on the former $300.0 million senior unsecured credit facility was transferred to the $450.0 million senior unsecured credit facility and the former $300.0 million senior unsecured credit facility was paid off in full and terminated.
$450 Million Senior Unsecured Credit Facility
On January 15, 2016, the Operating Partnership, as borrower, the Company, as parent guarantor, and each party executing the loan documentation as a subsidiary guarantor, entered into a $450.0 million senior unsecured facility (the “2016 Unsecured Credit Facility”). The 2016 Unsecured Credit Facility is comprised of a $300.0 million revolving credit facility (the “$300 million Revolver”) and a $150.0 million term loan (the “$150 million Term Loan”). At December 31, 2016, the maximum amount of borrowing provided by the 2016 Unsecured Credit Facility was $450.0 million, of which we had $200.0 million borrowed and $250.0 million available to borrow.
The 2016 Unsecured Credit Facility has an accordion feature which will allow the Company to increase the total commitments by an aggregate of up to $150.0 million. The $300 million Revolver will mature on March 31, 2020 and can be extended to March 31, 2021 at the Company’s option, subject to certain conditions. The $150 million Term Loan will mature on March 31, 2021.
The Company pays interest on revolving credit advances at varying rates based upon, at the Company’s option, either (i) 1, 2, 3, or 6-month LIBOR, plus a LIBOR margin between 1.50% and 2.25%, depending upon the Company’s leverage ratio (as defined in the 2016 Unsecured Credit Facility agreement), or (ii) the applicable base rate, which is the greatest of the administrative agent’s prime rate, the federal funds rate plus 0.50%, and 1-month LIBOR plus 1.00%, plus a base rate margin between 0.50% and 1.25%, depending upon the Company’s leverage ratio. The interest rate at December 31, 2016 was 2.27%.
Unencumbered Assets. The 2016 Unsecured Credit Facility is unsecured. However, borrowings under the 2016 Unsecured Credit Facility are limited by the value of hotel assets that qualify as unencumbered assets. At December 31, 2016, the Company had 46 unencumbered hotel properties supporting the 2016 Unsecured Credit Facility.
An interest rate swap entered into on September 5, 2013 with a notional value of $75.0 million, an effective date of January 2, 2014 and a maturity date of October 1, 2018 remains outstanding. This interest rate swap was designated as a cash flow hedge and effectively fixes LIBOR at 2.04% and the interest rate on borrowings under a portion of the $150 million Term Loan to a fixed rate of 3.49%.
F-22
Unsecured Term Loan
On April 7, 2015, our Operating Partnership, as borrower, the Company, as parent guarantor, and each party executing the term loan documentation as a subsidiary guarantor, entered into a $125.0 million unsecured term loan (the “2015 Term Loan”). The 2015 Term Loan matures on April 7, 2022 and has an accordion feature which allows us to increase the total commitments by an aggregate of $75.0 million prior to the maturity date, subject to certain conditions. On April 21, 2015, the Company exercised $15.0 million of the accordion and added American Bank, N.A. as a lender under the facility.
At closing, we were advanced the full $125.0 million amount of the 2015 Term Loan and on April 21, 2015, we were advanced the $15.0 million exercised on the accordion. All proceeds were used to pay down the principal balance of our $225 million Revolver provided under the former $300.0 million senior unsecured credit facility. We pay interest on advances equal to the sum of LIBOR or the administrative agent’s prime rate and the applicable margin. We are currently paying interest at 2.57% based on LIBOR at December 31, 2016.
Borrowings under the 2015 Term Loan are limited by the value of hotel assets that qualify as unencumbered assets. As of December 31, 2016, 46 of our hotel properties qualified as, and are deemed to be, unencumbered assets supporting the 2015 Term Loan.
F-23
At December 31, 2016 and 2015 our outstanding indebtedness was as follows (in thousands):
Lender | Reference | Interest Rate | Amortization Period (Years) | Maturity Date | Number of Properties Encumbered | Balance at | ||||||||||||
December 31, | ||||||||||||||||||
12/31/2016 | 2016 | 2015 | ||||||||||||||||
$450 Million Senior Unsecured Credit Facility | ||||||||||||||||||
Deutsche Bank AG New York Branch | ||||||||||||||||||
$300 Million Revolver | 2.27% Variable | n/a | March 31, 2020 | n/a | $ | 50,000 | $ | — | ||||||||||
$150 Million Term Loan | (1) | 2.86% Variable | n/a | March 31, 2021 | n/a | 150,000 | — | |||||||||||
Total Senior Unsecured Credit Facility | 200,000 | — | ||||||||||||||||
$300 Million Senior Unsecured Credit Facility | ||||||||||||||||||
Deutsche Bank AG New York Branch | ||||||||||||||||||
$225 Million Revolver | n/a | n/a | October 10, 2017 | n/a | $ | — | $ | 95,000 | ||||||||||
$75 Million Term Loan | n/a | n/a | October 10, 2018 | n/a | — | 75,000 | ||||||||||||
Total Former Unsecured Credit Facility | — | 170,000 | ||||||||||||||||
Unsecured Term Loan | ||||||||||||||||||
KeyBank National Association, as Administrative Agent | ||||||||||||||||||
Term Loan | 2.57% Variable | n/a | April 7, 2022 | n/a | 140,000 | 140,000 | ||||||||||||
Secured Mortgage Indebtedness | ||||||||||||||||||
Voya (formerly ING Life Insurance and Annuity) | (2) | 5.18% Fixed | 20 | March 1, 2019 | 2 | 41,328 | 42,574 | |||||||||||
(2) | 5.18% Fixed | 20 | March 1, 2019 | 4 | 37,042 | 38,159 | ||||||||||||
(2) | 5.18% Fixed | 20 | March 1, 2019 | 3 | 23,889 | 24,610 | ||||||||||||
(2) | 5.18% Fixed | 20 | March 1, 2019 | 1 | 16,970 | 17,482 | ||||||||||||
KeyBank National Association | (3) | 4.46% Fixed | 30 | February 1, 2023 | 4 | 27,473 | 27,991 | |||||||||||
(4) | 4.52% Fixed | 30 | April 1, 2023 | 3 | 21,291 | 21,683 | ||||||||||||
(5) | 4.30% Fixed | 30 | April 1, 2023 | 3 | 20,626 | 21,022 | ||||||||||||
(6) | 4.95% Fixed | 30 | August 1, 2023 | 2 | 36,741 | 37,352 | ||||||||||||
Bank of America Commercial Mortgage | (7) | 6.41% Fixed | 25 | September 1, 2017 | 1 | 7,661 | 7,916 | |||||||||||
Merrill Lynch Mortgage Lending Inc. | (8) | n/a | 30 | August 1, 2016 | n/a | — | 5,047 | |||||||||||
Western Alliance Bank (formerly GE Capital Financial Inc.) | (9) | 5.39% Fixed | 25 | April 1, 2020 | 1 | 8,912 | 9,110 | |||||||||||
(9) | 5.39% Fixed | 25 | April 1, 2020 | 1 | 4,798 | 4,905 | ||||||||||||
MetaBank | (10) | 4.25% Fixed | 20 | August 1, 2018 | 1 | 6,588 | 6,852 | |||||||||||
Bank of Cascades | (11) | 2.77% Variable | 25 | December 19, 2024 | 1 | 9,289 | 9,556 | |||||||||||
(11) | 4.30% Fixed | 25 | December 19, 2024 | — | 9,289 | 9,556 | ||||||||||||
Goldman Sachs | (12) | n/a | 25 | July 6, 2016 | n/a | — | 13,467 | |||||||||||
Compass Bank | (13) | 3.17% Variable | 25 | May 6, 2020 | 3 | 23,394 | 24,015 | |||||||||||
Western Alliance Bank (formerly GE Capital Corp) | (14) | 5.39% Fixed | 25 | April 1, 2020 | 1 | 5,910 | 5,160 | |||||||||||
(14) | 5.39% Fixed | 25 | April 1, 2020 | 1 | 5,046 | 6,041 | ||||||||||||
(15) | n/a | 20 | April 1, 2018 | n/a | — | 5,852 | ||||||||||||
U.S. Bank, NA | (16) | n/a | 30 | November 1, 2016 | n/a | — | 17,179 | |||||||||||
(17) | 6.13% Fixed | 25 | November 11, 2021 | 1 | 11,303 | 11,567 | ||||||||||||
Total Mortgage Loans | 33 | 317,550 | 367,096 | |||||||||||||||
Total Debt | 657,550 | 677,096 | ||||||||||||||||
Unamortized debt issuance costs | (5,136 | ) | (5,560 | ) | ||||||||||||||
Debt, net of issuance costs | $ | 652,414 | $ | 671,536 | ||||||||||||||
(1) Our interest rate swap fixed a portion of the interest on this loan. See "Note 6 - Derivative Financial Instruments and Hedging."
(2) On September 24, 2015, we modified an existing term loan collateralized by properties sold in 2015 to substitute collateral with properties not included in the sale in order to avoid significant yield maintenance costs associated with an early pay-off. We now have four term loans with Voya with an aggregate principal amount of $119.2 million, fixed interest rates of 5.18%, and a first call date of March 1, 2019. The ten hotel properties encumbered by the Voya mortgage loans are cross-collateralized, and the four mortgage loans are cross-defaulted.
(3) On January 25, 2013, we closed on a $29.4 million loan with a fixed rate of 4.46% and a maturity of February 1, 2023. This loan is secured by four of the Hyatt Place hotels we acquired in October 2012. These hotels are located in Chicago (Lombard), IL; Denver (Lone Tree), CO; Denver (Englewood), CO; and Dallas (Arlington), TX. This loan is subject to defeasance if prepaid.
F-24
(4) On March 7, 2013, we closed on a $22.7 million loan with a fixed rate of 4.52% and a maturity of April 1, 2023. This loan is secured by three of the Hyatt hotels we acquired in October 2012. These hotels include a Hyatt House in Denver (Englewood), CO and Hyatt Place hotels in Baltimore (Owings Mills), MD and Scottsdale, AZ. This loan is subject to defeasance if prepaid.
(5) On March 8, 2013, we closed on a $22.0 million loan with a fixed rate of 4.30% and a maturity of April 1, 2023. This loan is secured by the three Hyatt Place hotels we acquired in January 2013. These hotels are located in Chicago (Hoffman Estates), IL; Orlando (Convention), FL; and Orlando (Universal), FL. This loan is subject to defeasance if prepaid.
(6) On July 22, 2013, we closed on a $38.7 million loan with a fixed rate of 4.95% and a maturity of August 1, 2023. This loan is secured by two Marriott hotels we acquired in May 2013. These hotels include a Fairfield Inn & Suites and SpringHill Suites in Louisville, KY. This loan is subject to defeasance if prepaid.
(7) On May 16, 2012, we assumed a loan in our acquisition of the Hilton Garden Inn in Smyrna, TN. This loan is subject to defeasance if prepaid.
(8) On June 21, 2012, we assumed a loan in our acquisition of the Hampton Inn & Suites in Smyrna, TN. This loan was repaid in 2016. There were no prepayment penalties incurred in this transaction.
(9) On March 28, 2014, we amended the loans with GE Capital Financial, which are cross-collateralized by the Courtyard by Marriott and the SpringHill Suites by Marriott, both located in Scottsdale, AZ. The loans were amended to bear interest at a fixed rate of 5.39% and the maturity dates were extended to April 1, 2020.
(10) On July 26, 2013, we closed on a $7.4 million loan with a fixed rate of 4.25% and a maturity of August 1, 2018. This loan is secured by the Hyatt Place in Atlanta, GA. This loan has a prepayment penalty of: (i ) 3% until July 26, 2015, (ii) 2% until July 26, 2017, and (iii) 1% until February 1, 2018.
(11) On December 19, 2014, we refinanced our loan with Bank of the Cascades and increased the amount financed by $7.9 million. As part of the refinance the loan was split into two notes. Note A carries a variable interest rate of 30-day LIBOR plus 200 basis points and Note B carries a fixed interest rate of 4.3%. Both notes have amortization periods of 25 years and maturity dates of December 19, 2024. The Bank of Cascades mortgage loans are secured by the same collateral and cross-defaulted.
(12) This loan was secured by the SpringHill Suites by Marriott and the Hampton Inn & Suites in Bloomington, MN. This loan was repaid in 2016. There were no prepayment penalties incurred in this transaction.
(13) On May 6, 2014, we closed on a $25.0 million loan with Compass Bank. The loan carries a variable rate of 30-day LIBOR plus 240 basis points, amortizes over 25 years, and has a May 6, 2020 maturity date. The loan is secured by first mortgage liens on the Hampton Inn & Suites hotels located in San Diego (Poway), CA, Ventura (Camarillo), CA and Fort Worth, TX.
(14) On March 28, 2014, we amended two loans with General Electric Capital Corp., which are cross - collateralized by the Hilton Garden Inn (Lakeshore) and the Hilton Garden Inn (Liberty Park), both located in Birmingham, AL. Both loans were amended to bear interest at a fixed rate of 5.39% and the maturity dates were extended to April 1, 2020.
(15) This loan was secured by the SpringHill Suites by Marriott in Denver, CO. In anticipation of the ARCH Second Closing the interest rate swap was settled in 2015. This loan was repaid in 2016. There were no prepayment penalties incurred in this transaction.
(16) On January 9, 2014, as part of our acquisition of the 182-guestroom Hilton Garden Inn in Houston, TX, we assumed a $17.8 million mortgage loan with a fixed interest rate of 6.22%, an amortization period of 30 years, and a maturity date of November 1, 2016. This loan was repaid in 2016. There were no prepayment penalties incurred in this transaction.
(17) On January 10, 2014, as part of our acquisition of the 98-guestroom Hampton Inn in Santa Barbara (Goleta), CA, we assumed a $12.0 million mortgage loan with a fixed interest rate of 6.133%, an amortization period of 25 years, and a maturity date of November 11, 2021.
Our outstanding indebtedness requires us to comply with a series of financial and other covenants. At December 31, 2016, we were in compliance with all required covenants.
Our total fixed-rate and variable-rate debt at December 31, 2016 and 2015, after giving effect to our $75.0 million interest rate derivative, is as follows (in thousands):
2016 | 2015 | |||||||
Fixed-rate debt | $ | 359,867 | $ | 402,673 | ||||
Variable-rate debt | 297,683 | 274,423 | ||||||
$ | 657,550 | $ | 677,096 | |||||
F-25
Principal payments for each of the next five years are as follows (in thousands):
2017 | $ | 15,828 | ||
2018 | 14,557 | |||
2019 | 166,136 | |||
2020 | 197,049 | |||
2021 | 13,017 | |||
Thereafter | 250,963 | |||
$ | 657,550 | |||
Information about the fair value of our fixed-rate debt that is not recorded at fair value is as follows (in thousands):
2016 | 2015 | |||||||||||||||||
Carrying Value | Fair Value | Carrying Value | Fair Value | Valuation Technique | ||||||||||||||
Fixed-rate debt | $ | 284,867 | $ | 283,416 | $ | 327,673 | $ | 321,841 | Level 2 - Market approach | |||||||||
At both December 31, 2016 and 2015, we had $75.0 million of debt with variable interest rates that had been converted to fixed interest rates through derivative financial instruments which are carried at fair value. Differences between carrying value and fair value of our fixed-rate debt are primarily due to changes in interest rates. Inherently, fixed-rate debt is subject to fluctuations in fair value as a result of changes in the current market rate of interest on the valuation date. For additional information on our use of derivatives as interest rate hedges, refer to “Note 6 –– Derivative Financial Instruments and Hedging.”
NOTE 6 — DERIVATIVE FINANCIAL INSTRUMENTS AND HEDGING
We are exposed to interest rate risk through our variable-rate debt. We manage this risk primarily by managing the amount, sources, and duration of our debt funding and through the use of derivative financial instruments. Specifically, we enter into derivative financial instruments to manage our exposure to known or expected cash payments related to our variable-rate debt. The maximum length of time over which we have hedged our exposure to variable interest rates with our existing derivative financial instruments is approximately six years.
Our objectives in using derivative financial instruments are to add stability to interest expense and to manage our exposure to interest rate movements. To accomplish these objectives, we primarily use interest rate swaps as part of our interest rate risk management strategy. Our interest rate swap is designated as a cash flow hedge and involves the receipt of variable-rate payments from a counterparty in exchange for making fixed-rate payments over the life of the agreement without exchange of the underlying notional amount.
Our agreement with our derivative counterparty contains a provision where if we default, or are capable of being declared in default, on any of our indebtedness, then we could also be declared in default on our derivative financial instrument.
Information about our derivative financial instrument at December 31, 2016 and 2015 is as follows (dollar amounts in thousands):
December 31, 2016 | December 31, 2015 | |||||||||||||||||||||
Number of Instruments | Notional Amount | Fair Value | Number of Instruments | Notional Amount | Fair Value | |||||||||||||||||
Interest rate swaps (liability) | 1 | $ | 75,000 | $ | (1,118 | ) | 1 | $ | 75,000 | $ | (1,811 | ) | ||||||||||
1 | $ | 75,000 | $ | (1,118 | ) | 1 | $ | 75,000 | $ | (1,811 | ) | |||||||||||
Our interest rate swap has been designated as a cash flow hedge and is valued using a market approach, which is a Level 2 valuation technique. At December 31, 2016 and 2015, our interest rate swap was in a liability position. The interest rate swap expires on October 1, 2018. We are not required to post any collateral related to this agreement and are not in breach of any financial provisions of the agreement.
F-26
The table below details the location in the financial statements of the gain or loss recognized on derivative financial instruments designated as cash flow hedges (in thousands):
2016 | 2015 | 2014 | ||||||||||
Loss recognized in accumulated other comprehensive income on derivative financial instruments (effective portion) | $ | (497 | ) | $ | (1,846 | ) | $ | (2,112 | ) | |||
Loss reclassified from accumulated other comprehensive income to interest expense (effective portion) | $ | (1,190 | ) | $ | (1,927 | ) | $ | (1,741 | ) | |||
Loss recognized in Other Expense (ineffective portion) | $ | — | $ | (1 | ) | $ | (1 | ) | ||||
Amounts reported in accumulated other comprehensive income related to derivative financial instruments will be reclassified to interest expense as interest payments are made on the hedged variable-rate debt. In 2017, we estimate that an additional $0.8 million will be reclassified from other comprehensive income as an increase to interest expense.
NOTE 7 — EQUITY
Common Stock
The Company is authorized to issue up to 500,000,000 shares of common stock, $0.01 par value per share. Each outstanding share of our common stock entitles the holder to one vote on all matters submitted to a vote of stockholders, including the election of directors and, except as may be provided with respect to any other class or series of stock, the holders of such shares possess the exclusive voting power.
On August 2, 2016, the Company and the Operating Partnership entered into separate sales agreements (the “Sales Agreements”) with each of Robert W. Baird & Co. Incorporated, Raymond James & Associates, Inc., Merrill Lynch, Pierce, Fenner & Smith Incorporated, Deutsche Bank Securities Inc., RBC Capital Markets, LLC, KeyBanc Capital Markets Inc., Canaccord Genuity Inc. and Jefferies LLC (collectively, the “Bank Group”), pursuant to which the Company may issue and sell from time to time up to $125.0 million in shares of its common stock, $0.01 par value per share, and shares of its 6.45% Series D Preferred Stock, $0.01 par value per share (collectively, the “Shares”), through members of the Bank Group, acting as agents or principals (the “2016 ATM Program”). At the same time, the Company terminated the sales agreement entered into in connection with its prior ATM offering program, which was established in August 2015 and under which no shares were sold.
Pursuant to the Sales Agreements, the Shares may be offered and sold through members of the Bank Group in transactions that are deemed to be “at the market” offerings as defined in Rule 415 under the Securities Act of 1933, as amended, including sales made directly on the New York Stock Exchange or sales made to or through a market maker other than on an exchange or, with the prior consent of the Company, in privately negotiated transactions. Members of the Bank Group will be entitled to compensation of up to 2.0% of the gross proceeds of Shares sold through members of the Bank Group from time to time under the Sales Agreements. The Company has no obligation to sell any of the Shares under the Sales Agreements and may at any time suspend solicitations and offers under, or terminate, the Sales Agreements.
During the year ended December 31, 2016, we sold 6,151,514 shares of our common stock under the 2016 ATM Program for net proceeds of $89.1 million. The proceeds were used to pay down our revolving line of credit which had been used for acquisitions and other general corporate purposes.
F-27
Changes in common stock during the years ended December 31, 2016 and 2015 were as follows:
2016 | 2015 | |||||
Beginning common shares outstanding | 86,793,521 | 86,149,720 | ||||
Common stock issued | 6,151,514 | — | ||||
Grants under the Equity Plan | 446,686 | 320,845 | ||||
Common Unit redemptions | 119,308 | 268,947 | ||||
Exercise of stock options | 37,684 | 99,738 | ||||
Annual grants to independent directors | 32,180 | 30,440 | ||||
Common stock issued for director fees | 7,618 | 6,246 | ||||
Forfeitures | (1,420 | ) | (46,030 | ) | ||
Shares retained for employee tax withholding requirements | (61,622 | ) | (36,385 | ) | ||
Ending common shares outstanding | 93,525,469 | 86,793,521 | ||||
At December 31, 2016 and 2015, the Company had reserved 6,332,307 and 14,691,018 shares of common stock, respectively, for the issuance of common stock (i) upon the exercise of stock options, issuance of time-based restricted stock awards, issuance of performance-based restricted stock awards, grants of director stock awards, or other awards issued pursuant to our Equity Plan, (ii) upon redemption of Common Units, or (iii) under the 2016 ATM Program.
Preferred Stock
The Company is authorized to issue up to 100,000,000 shares of preferred stock, 0.01 par value per share, of which 88,600,000 is currently undesignated and 2,000,000 shares have been designated as 9.25% Series A Cumulative Redeemable Preferred Stock (the “Series A preferred shares”), 3,000,000 shares have been designated as 7.875% Series B Cumulative Redeemable Preferred Stock (the “Series B preferred shares”), 3,400,000 shares have been designated as 7.125% Series C Cumulative Redeemable Preferred Stock (the “Series C preferred shares”) and 3,000,000 shares have been designated as 6.45% Series D Cumulative Redeemable Preferred Stock (the "Series D preferred shares").
The Company completed the offering of 3,000,000 Series D preferred shares on June 28, 2016 for net proceeds of $72.3 million, after the underwriting discount and offering-related expenses of $2.7 million.
On October 28, 2016, the Company paid $50.7 million to redeem all 2,000,000 of its outstanding Series A preferred shares at a redemption price of $25 per share plus accrued and unpaid dividends.
The Company's preferred shares (collectively, “Preferred Shares”) rank senior to our common stock and on parity with each other with respect to the payment of dividends and distributions of assets in the event of a liquidation, dissolution, or winding up. The Preferred Shares do not have any maturity date and are not subject to mandatory redemption or sinking fund requirements. The Company may not redeem the Series B preferred shares, Series C preferred shares or Series D preferred shares prior to December 11, 2017, March 20, 2018 and June 28, 2021, respectively, except in limited circumstances relating to the Company’s continuing qualification as a REIT or in connection with certain changes in control. After those dates, the Company may, at its option, redeem the applicable Preferred Shares, in whole or from time to time in part, by payment of $25 per share, plus any accumulated, accrued and unpaid distributions up to, but not including, the date of redemption. If the Company does not exercise its rights to redeem the Preferred Shares upon certain changes in control, the holders of the Preferred Shares have the right to convert some or all of their shares into a number of the Company’s common shares based on a defined formula, subject to a share cap, or alternative consideration. The share cap on each Series B preferred share is 5.6497 shares of common stock, each Series C preferred share is 5.1440 shares of common stock and each Series D preferred share is 3.9216 shares of common stock, all subject to certain adjustments.
The Company pays dividends at an annual rate of $1.96875 for each Series B preferred share, $1.78125 for each Series C preferred share and $1.6125 for each Series D preferred share. Dividend payments are made quarterly in arrears on or about the last day of February, May, August and November of each year.
F-28
Non-controlling Interests in Operating Partnership
Pursuant to the limited partnership agreement of our Operating Partnership, beginning on February 14, 2012, the unaffiliated third parties who hold Common Units in our Operating Partnership have the right to cause us to redeem their Common Units in exchange for cash based upon the fair value of an equivalent number of our shares of common stock at the time of redemption; however, the Company has the option to redeem with shares of our common stock on a one-for-one basis. The number of shares of our common stock issuable upon redemption of Common Units may be adjusted upon the occurrence of certain events such as share dividend payments, share subdivisions or combinations.
At December 31, 2016 and 2015, unaffiliated third parties owned 396,713 and 516,021, respectively, of Common Units of the Operating Partnership, representing less than a 1% limited partnership interest in the Operating Partnership.
We classify outstanding Common Units held by unaffiliated third parties as non-controlling interests in the Operating Partnership, a component of equity in the Company’s Consolidated Balance Sheets. The portion of net income allocated to these Common Units is reported on the Company’s Consolidated Statement of Operations as net income attributable to non-controlling interests of the Operating Partnership.
Leasehold Venture
At December 31, 2015, we owned a majority interest in a joint venture that owned a fee simple interest in a hotel property and we also owned a minority interest in a related joint venture (“Leasehold Venture”) that held a leasehold interest in the property. On June 30, 2016, our joint venture partner in the Leasehold Venture exercised a put option to sell its joint venture interest in the Leasehold Venture to us for $0.4 million. We finalized the transaction in July 2016 and we own 100% of the fee simple interest and leasehold interest in the hotel property effective July 31, 2016.
NOTE 8 — FAIR VALUE MEASUREMENT
The following table presents information about our financial instruments measured at fair value on a recurring basis as of December 31, 2016 and 2015. In instances in which the inputs used to measure fair value fall into different levels of the fair value hierarchy, we classify assets and liabilities based on the lowest level of input that is significant to the fair value measurement. Our assessment of the significance of a particular input to the fair value measurement in its entirety requires judgment, and considers factors specific to the asset or liability.
Disclosures concerning financial instruments measured at fair value are as follows (in thousands):
Fair Value Measurement at December 31, 2016 using | ||||||||||||||||
Level 1 | Level 2 | Level 3 | Total | |||||||||||||
Liabilities: | ||||||||||||||||
Interest rate swaps | $ | — | $ | 1,118 | $ | — | $ | 1,118 | ||||||||
Fair Value Measurement at December 31, 2015 using | ||||||||||||||||
Level 1 | Level 2 | Level 3 | Total | |||||||||||||
Liabilities: | ||||||||||||||||
Interest rate swaps | $ | — | $ | 1,811 | $ | — | $ | 1,811 | ||||||||
There were no transfers between Level 1 and Level 2 of the fair value hierarchy during the years ended December 31, 2016 or 2015.
F-29
NOTE 9 — COMMITMENTS AND CONTINGENCIES
Ground Leases
We lease land for one hotel property in Duluth, GA under the terms of an operating ground lease agreement expiring April 1, 2069. We also have two prepaid land leases for two hotel properties in Portland, OR which expire in June of 2084 and have a remaining prepaid balance of $3.3 million at December 31, 2016 and 2015. We have one option to extend these leases for an additional 14 years. We lease land for one hotel property in Houston (Galleria Area), TX under the terms of an operating ground lease agreement with an initial termination date of April 20, 2053 with one option to extend for an additional 10 years. We lease land for one hotel property in Austin, TX with an initial lease termination date of May 31, 2050. We lease land for one hotel property in Baltimore (Hunt Valley), MD with a lease termination date of December 31, 2019 and twelve remaining options to extend for five additional years per extension. Total rent expense for these leases for the years ended December 31, 2016, 2015 and 2014 was $1.7 million, $1.2 million, and $1.1 million, respectively.
Future minimum rental payments for noncancelable operating leases with a remaining term in excess of one year are as follows (in thousands):
2017 | $ | 1,505 | |
2018 | 1,757 | ||
2019 | 1,748 | ||
2020 | 1,817 | ||
2021 | 1,831 | ||
Thereafter | 106,232 | ||
$ | 114,890 | ||
In addition, we lease land for one hotel property in Garden City, NY under a PILOT (payment in lieu of taxes) lease. We pay a reduced amount of property tax each year of the lease as rent. The lease expires on December 31, 2019. Upon expiration of the lease, we expect to exercise our right to acquire a fee simple interest in the hotel for nominal consideration.
Franchise Agreements
All of our hotel properties operate under franchise agreements with major hotel franchisors. The terms of our franchise agreements generally range from 10 to 20 years with various extension provisions. Each franchisor receives franchise fees ranging from 2% to 6% of each hotel property’s gross revenue, and some agreements require that we pay marketing fees of up to 4% of gross revenue. In addition, some of these franchise agreements require that we deposit a percentage of the hotel property’s gross revenue, generally not more than 5%, into a reserve fund for capital expenditures. In 2016, 2015, and 2014, we expensed fees related to our franchise agreements of $37.2 million, $37.8 million, and $33.6 million, respectively.
Management Agreements
Our hotel properties operate pursuant to management agreements with various third-party management companies. The terms of our management agreements range from three to twenty-five years with various extension provisions. Each management company receives a base management fee, generally a percentage of total hotel property revenues. In some cases there are also monthly fees for certain services, such as accounting, based on number of guestrooms. Generally there are also incentive fees based on attaining certain financial thresholds. In 2016, 2015, and 2014, we expensed fees related to our hotel management agreements of $18.8 million, $18.6 million, and $16.1 million, respectively.
Litigation
We are involved from time to time in litigation arising in the ordinary course of business. We are currently involved in litigation related to the settlement of a contractual obligation related to the purchase of a hotel property in 2012. We have accrued the amount of our expected liability to settle the contractual obligation at December 31, 2016. We are not currently aware of any actions against us that would have a material effect on our financial condition or results of operations.
F-30
NOTE 10 — EQUITY-BASED COMPENSATION
Our currently outstanding equity-based awards were issued under our Equity Plan which provides for the granting of stock options, stock appreciation rights, restricted stock, restricted stock units, dividend equivalent rights, and other equity-based awards or incentive awards.
Stock options granted may be either incentive stock options or non-qualified stock options. Vesting terms may vary with each grant, and stock option terms are generally five to ten years. We have outstanding equity-based awards in the form of stock options and restricted stock awards. All of our outstanding equity-based awards are classified as equity awards.
Stock Options Granted Under Our Equity Plan
Concurrent with the completion of our IPO and pursuant to our Equity Plan, we granted options to our executive officers to purchase 940,000 shares of common stock. These options have an exercise price of $9.75 per share, the market value of the common stock on the date of grant, and vest ratably over five years based on continued service, or upon a change in control.
The fair value of stock options granted was estimated using a Black-Scholes valuation model and the following assumptions:
Expected dividend yield | 5.09 | % | |
Expected stock price volatility | 56.6 | % | |
Risk-free interest rate | 2.57 | % | |
Expected life of options (in years) | 6.5 | ||
Weighted average estimated fair value of options at grant date per share | 3.48 | ||
The expected dividend yield was calculated based on our annual expected dividend payments at the time the options were granted. The expected volatility was based on historical price changes of a peer group of comparable entities based on the expected life of the options at the date of grant. The risk-free interest rate was based on the U.S. Treasury yield curve in effect at the date of grant. The expected life of the options is the average number of years we estimate that the options will be outstanding.
The following table summarizes stock option activity under our Equity Plan:
Number of Options | Weighted Average Exercise Price | Weighted Average Remaining Contractual Terms | Aggregate Intrinsic Value (Current Value Less Exercise Price) | ||||||||||
(per share) | (in years) | (in thousands) | |||||||||||
Outstanding at December 31, 2014 | 846,000 | $ | 9.75 | ||||||||||
Exercised | (376,000 | ) | 9.75 | ||||||||||
Outstanding at December 31, 2015 | 470,000 | 9.75 | |||||||||||
Exercised | (235,000 | ) | 9.75 | ||||||||||
Outstanding at December 31, 2016 | 235,000 | $ | 9.75 | 4.2 | $ | 1,476 | |||||||
Exercisable at December 31, 2016 | 235,000 | $ | 9.75 | 4.2 | $ | 1,476 | |||||||
All stock options outstanding at December 31, 2016 are vested. During the years ended December 31, 2016, 2015, and 2014, the total fair value of stock options that vested was $0.3 million, $0.9 million and $0.7 million, respectively. The intrinsic value of options exercised during the years ended December 31, 2016, 2015 and 2014 was $1.0 million, $1.3 million and $0.1 million, respectively.
The intrinsic value of outstanding and exercisable options at December 31, 2016 was $1.5 million. The intrinsic value of outstanding options and exercisable options at December 31, 2015 was $1.0 million and $0.8 million, respectively. At December 31, 2014, the intrinsic value of outstanding options and exercisable options was $2.3 million and $1.4 million, respectively.
F-31
Time-Based Restricted Stock Awards Made Pursuant to Our Equity Plan
On February 24, 2016, we granted time-based restricted stock awards for 22,010 shares of common stock to certain of our non-executive employees. The awards vest over a four-year period based on continued service (20% on March 9, 2017, 2018 and 2019, and 40% on March 9, 2020). On March 8, 2016, we granted time-based restricted stock awards for 169,707 shares of common stock to our executive officers. The awards vest 25% on March 9, 2017, 25% on March 9, 2018 and 50% on March 9, 2019, based on continuous service through the vesting dates or in certain circumstances upon a change in control. On September 2, 2016, we granted time-based restricted stock awards for 406 shares of common stock to certain of our non-executive employees. The awards vest over a four-year period based on continued service (20% on September 3, 2017, 2018 and 2019, and 40% on September 3, 2020).
On March 3, 2015, we granted time-based restricted stock awards for 149,410 shares of common stock to our executive officers and management. Of the total awards issued, 37,230 vest based on continued service on March 9, 2018, or upon a change in control. The remaining awards vest over a three year period based on continued service (25% on March 9, 2016 and 2017 and 50% on March 9, 2018), or upon a change in control.
On April 24, 2015, we granted a time-based restricted stock award for 16,930 shares of common stock to one of our executive officers. This award vested during the third quarter of 2015.
On May 28, 2014, we awarded time-based restricted stock awards for 116,981 shares of common stock to our executive officers and management. These awards vest over a three year period based on continued service (25% on May 27, 2015 and 2016 and 50% on May 27, 2017), or upon a change in control.
The holders of these awards have the right to vote the related shares of common stock and receive all dividends declared and paid whether or not vested. The fair value of time-based restricted stock awards granted is calculated based on the market value of our common stock on the date of grant.
The following table summarizes time-based restricted stock activity under our Equity Plan for 2016 and 2015:
Number of Shares | Weighted Average Grant Date Fair Value | Aggregate Current Value | |||||||||
(per share) | (in thousands) | ||||||||||
Non-vested December 31, 2014 | 181,116 | $ | 9.81 | ||||||||
Granted | 166,340 | 13.53 | |||||||||
Vested | (97,445 | ) | 10.46 | ||||||||
Non-vested December 31, 2015 | 250,011 | 12.03 | |||||||||
Granted | 192,123 | 11.36 | |||||||||
Vested | (82,869 | ) | 11.06 | ||||||||
Forfeited | (1,420 | ) | 10.27 | ||||||||
Non-vested December 31, 2016 | 357,845 | $ | 11.90 | $ | 5,736 | ||||||
During the years ended December 31, 2016, 2015, and 2014, the total fair value of time-based restricted stock awards that vested was $0.9 million, $1.0 million and $0.8 million, respectively.
Performance-Based Restricted Stock Awards Made Pursuant to Our Equity Plan
On March 8, 2016, we granted performance-based restricted stock awards for 254,563 shares of common stock to our executive officers. Our performance-based restricted stock awards are market-based awards and are accounted for based on the fair value of our common stock on the grant date. The fair value of the performance-based restricted stock awards granted was estimated using a Monte Carlo simulation valuation model. These awards generally vest based on our percentile ranking within the SNL U.S. REIT Hotel Index at the end of the period beginning on March 8, 2016 and ending on the earlier of March 8, 2019 or upon a change in control. The awards require continued service during the measurement period and are subject to the other conditions described in the Equity Plan or award document.
On March 3, 2015, we granted performance-based restricted stock awards for 154,505 shares of common stock to certain of our executive officers. The fair value of the performance-based restricted stock awards granted was estimated using a Monte Carlo
F-32
simulation valuation model. These awards vest based on our percentile ranking within the SNL U.S. REIT Hotel Index at the end of the period beginning on January 1, 2015 and ending on the earlier of December 31, 2017, or upon a change in control. The awards require continued service during the measurement period and are subject to the other conditions described in the Equity Plan or award document.
The number of shares the executive officers may earn under these awards range from zero shares to twice the number of shares granted based on our percentile ranking within the index at the end of the measurement period. In addition, a portion of the performance-based shares may be earned based on the Company's absolute total shareholder return calculated during the performance period. The holders of these grants have the right to vote the granted shares of common stock and any dividends declared will be accumulated and will be subject to the same vesting conditions as the awards. Further, if additional shares are earned based on our percentile ranking within the index, dividend payments will be issued as if the additional shares had been held throughout the measurement period.
On May 28, 2014 we awarded performance-based restricted stock awards for 161,935 shares of common stock to our executive officers. These awards vest ratably on January 1 in each year of the three-year period following the grant date subject to the attainment of certain performance goals and continued service, or upon a change in control.
The 2014 performance-based restricted stock awards are market-based awards and are accounted for based on the grant date fair value of our common stock. These awards vest based on a performance measurement that requires the Company’s total stockholder return (“TSR”) to exceed the TSR for the SNL U.S. Lodging REIT Index for a designated one, two or three year performance period. The holders of these awards have the right to vote the related shares of common stock and any dividends declared will be accumulated and will be subject to the same vesting conditions as the awards.
The fair value of performance-based restricted stock awards granted was estimated using a Monte Carlo simulation valuation model and the following assumptions:
2016 | 2015 | |||||||
Expected dividend yield | 4.01 | % | 3.42 | % | ||||
Expected stock price volatility | 24.2 | % | 22.2 | % | ||||
Risk-free interest rate | 1.04 | % | 1.02 | % | ||||
Monte Carlo iterations | 100,000 | 100,000 | ||||||
Weighted average estimated fair value of performance-based restricted stock awards | $ | 13.77 | $ | 18.78 | ||||
The expected dividend yield was calculated based on our annual expected dividend payments at the time of grant. The expected volatility was based on historical price changes of our common stock for a period comparable to the performance period. The risk-free interest rates were interpolated from the Federal Reserve Bond Equivalent Yield rates for “on-the-run” U.S. Treasury securities.
The following table summarizes performance-based restricted stock activity under our Equity Plan for 2016 and 2015:
Number of Shares | Weighted Average Grant Date Fair Value | Aggregate Current Value | |||||||||
(per share) | (in thousands) | ||||||||||
Non-vested December 31, 2014 | 384,558 | $ | 6.75 | ||||||||
Granted | 154,505 | 18.78 | |||||||||
Vested | (184,666 | ) | 6.86 | ||||||||
Forfeited | (46,030 | ) | 5.10 | ||||||||
Non-vested December 31, 2015 | 308,367 | 12.95 | |||||||||
Granted | 254,563 | 13.77 | |||||||||
Vested | (113,903 | ) | 7.10 | ||||||||
Non-vested December 31, 2016 | 449,027 | $ | 14.90 | $ | 7,198 | ||||||
F-33
Director Stock Awards Made Pursuant to Our Equity Plan
During the years ended December 31, 2016 and 2015, we granted 32,180 and 30,440 shares of common stock, respectively, to our non-employee directors as a part of our director compensation program. These grants were made pursuant to our Equity Plan and were vested upon grant.
Our non-employee directors have the option to receive shares of our common stock in lieu of cash for their director fees. In 2016 and 2015, we issued 7,618 and 6,246 shares of common stock, respectively, for director fees. The fair value of director stock awards is calculated based on the market value of our common stock on the date of grant.
Equity-Based Compensation Expense
Equity-based compensation expense included in Corporate General and Administrative expense in the Consolidated Statements of Operations for the years ended December 31, 2016, 2015, and 2014 was as follows (in thousands):
2016 | 2015 | 2014 | ||||||||||
Stock options | $ | 55 | $ | 633 | $ | 675 | ||||||
Time-based restricted stock | 1,594 | 1,691 | 960 | |||||||||
Performance-based restricted stock | 2,107 | 1,957 | 1,483 | |||||||||
Director stock | 465 | 472 | 406 | |||||||||
$ | 4,221 | $ | 4,753 | $ | 3,524 | |||||||
We recognize equity-based compensation expense ratably over the vesting terms. The amount of expense may be subject to adjustment in future periods due to a change in the forfeiture assumptions.
Unrecognized equity-based compensation expense for all non-vested awards pursuant to our Equity Plan was $6.0 million at December 31, 2016 as follows (in thousands):
Total | 2017 | 2018 | 2019 | 2020 | ||||||||||||||||
Time-based restricted stock | $ | 2,493 | $ | 1,503 | $ | 817 | $ | 163 | $ | 10 | ||||||||||
Performance-based restricted stock | 3,555 | 2,192 | 1,168 | 195 | — | |||||||||||||||
$ | 6,048 | $ | 3,695 | $ | 1,985 | $ | 358 | $ | 10 | |||||||||||
NOTE 11 — BENEFIT PLANS
On August 1, 2011, we initiated a qualified contributory retirement plan (the “Plan”) under Section 401(k) of the IRC, which covers all full-time employees who meet certain eligibility requirements. Voluntary contributions may be made to the Plan by employees. The Plan is a Safe Harbor Plan and requires a mandatory employer contribution. The employer contribution expense for the years ended December 31, 2016, 2015 and 2014 was $0.3 million, $0.2 million, and $0.2 million, respectively.
NOTE 12 — LOSS ON IMPAIRMENT OF ASSETS
At December 31, 2016, we were under contract to sell the Courtyard by Marriott in El Paso, TX for $11.0 million. We recorded a loss on impairment of assets of $0.6 million related to this transaction during 2016. This hotel is one of the eight remaining Reinstated Hotels and is under contract to be sold to a third party that is unrelated to ARCH.
During the year ended December 31, 2015, we determined that the value of land parcels in San Antonio, TX, Fort Myers, FL and Flagstaff, AZ were impaired based on market conditions. As such, we recognized a loss on impairment of assets of $1.1 million in our Consolidated Statement of Operations.
During the year ended December 31, 2014, we recognized a loss on impairment of assets of $0.4 million related to the Hampton Inn in Fort Smith, AR. This property was classified as held for sale prior to our adoption of ASU No. 2014-08 and its operating results, including impairment charges, were included in discontinued operations.
F-34
During the year ended December 31, 2014, we recognized a loss on impairment of assets of $8.2 million related to the Country Inn & Suites and three adjacent land parcels totaling 5.64 acres in San Antonio, TX, which was sold in the fourth quarter of 2014, and a loss on impairment of assets of $0.7 million related to a land parcel in Spokane, WA. These losses on impairment of assets were charged to operations.
NOTE 13 — INCOME TAXES
We have elected to be taxed as a REIT. As a REIT, we are generally not subject to corporate level income taxes on taxable income we distribute to our shareholders. We believe we have met the annual REIT distribution requirement by distribution of at least 90% of our taxable income to our shareholders.
Income related to our TRS is subject to federal, state and local taxes at applicable tax rates. Our consolidated tax provision includes the income tax provision related to the operations of the TRS as well as state and local income taxes related to the Operating Partnership.
The components of income tax expense (benefit) for the years ended December 31, 2016, 2015, and 2014 are as follows (in thousands):
2016 | 2015 | 2014 | ||||||||||
Current: | ||||||||||||
Federal | $ | 37 | $ | 81 | $ | 133 | ||||||
State and local | 904 | 408 | 712 | |||||||||
Deferred | ||||||||||||
Federal | (1,918 | ) | (159 | ) | — | |||||||
State and local | (473 | ) | 223 | (127 | ) | |||||||
Income tax expense (benefit) | $ | (1,450 | ) | $ | 553 | $ | 718 | |||||
Income tax expense (benefit) | ||||||||||||
From continuing operations | $ | (1,450 | ) | $ | 553 | $ | 744 | |||||
From discontinued operations | — | — | (26 | ) | ||||||||
Income tax expense (benefit) | $ | (1,450 | ) | $ | 553 | $ | 718 | |||||
A reconciliation of the federal statutory rate to the effective income tax rate for the TRS is as follows (in thousands):
2016 | 2015 | 2014 | ||||||||||
Tax provision (benefit) at U.S. statutory rates on TRS income (loss) subject to tax | $ | (1,157 | ) | $ | 2,345 | $ | 2,024 | |||||
State income tax, net of federal income tax benefit | 65 | 486 | 77 | |||||||||
Provision to return and deferred adjustment | (872 | ) | — | — | ||||||||
Effect of permanent differences and other | 31 | (161 | ) | 727 | ||||||||
Decrease in valuation allowance | — | (2,448 | ) | (2,580 | ) | |||||||
TRS income tax expense (benefit) | $ | (1,933 | ) | $ | 222 | $ | 248 | |||||
2016 | 2015 | 2014 | ||||||||||
Total provision (benefit) for TRS and Operating Partnership: | ||||||||||||
TRS income tax expense (benefit) | $ | (1,933 | ) | $ | 222 | $ | 248 | |||||
Operating Partnership state and local income tax expense | 483 | 331 | 470 | |||||||||
Income tax expense (benefit) | $ | (1,450 | ) | $ | 553 | $ | 718 | |||||
Current tax liabilities are included in Accrued Expenses and Other in the accompanying Consolidated Balance Sheets.
F-35
Significant components of deferred tax assets (liabilities) are as follows (in thousands):
2016 | 2015 | |||||||
Tax carryforwards | $ | 767 | $ | 1,481 | ||||
Investments | — | (1,349 | ) | |||||
Accrued expenses | 1,744 | — | ||||||
Other | (8 | ) | (20 | ) | ||||
Net deferred tax assets | $ | 2,503 | $ | 112 | ||||
Gross deferred tax assets | $ | 2,580 | $ | 1,515 | ||||
Gross deferred tax liabilities | (77 | ) | (1,403 | ) | ||||
Net deferred tax assets | $ | 2,503 | $ | 112 | ||||
At December 31, 2015, we reduced our valuation allowance to zero as we determined that it was more likely than not that our net deferred tax assets would be realized. The release of the valuation allowance resulted in a non-cash tax benefit of $0.1 million. During the year ended December 31, 2015, the TRS profits were offset by net operating loss carryforwards. As we had a valuation allowance against substantially all of our net deferred tax assets at December 31, 2014, the utilization of tax attributes to offset profits reduced the overall level of deferred tax assets subject to the valuation allowance. At December 31, 2015, we had gross deferred tax assets of $1.5 million primarily related to net operating loss carryforwards and a $1.3 million deferred tax liability related to an investment in a joint venture.
At December 31, 2016, we had (i) U.S. federal net operating losses of $1.1 million which expire in 2033 (ii) state net operating losses of $2.6 million which expire beginning in 2027 and (iii) federal minimum tax credits of $0.2 million which do not expire.
We had no unrecognized tax benefits at December 31, 2016 or in the three year period then ended. The Company recognizes interest expense and penalties associated with uncertain tax positions as a component of income tax expense. We have no material interest or penalties relating to unrecognized tax benefits in the Consolidated Statements of Operations for the years ended December 31, 2016, 2015 or 2014 or in the Consolidated Balance Sheets as of December 31, 2016 or 2015.
We file U.S. and state income tax returns in jurisdictions with varying statutes of limitations. We currently have no open audits related to our income tax returns. In general, we are not subject to tax examinations by tax authorities for years before 2013.
F-36
NOTE 14 — DISCONTINUED OPERATIONS
We have adjusted our Consolidated Statements of Operations for the year ended December 31, 2014 to reflect the operations of hotel properties sold or classified as held for sale in discontinued operations. No such adjustment was made during the years ended December 31, 2016 or 2015 due to the adoption of ASU No. 2014-08. Discontinued operations for the year ended December 31, 2014 include the following hotel properties that have been sold:
•AmericInn Hotel & Suites and Aspen Hotel & Suites in Fort Smith, AR - sold on January 17, 2014; and
•Hampton Inn in Fort Smith, AR — sold on September 9, 2014.
Condensed results for the hotel properties included in discontinued operations for the year ended December 31, 2014 is as follows (in thousands):
2014 | ||||
Revenues | $ | 3,128 | ||
Hotel operating expenses | (2,304 | ) | ||
Depreciation and amortization | (13 | ) | ||
Loss on impairment of assets | (400 | ) | ||
Operating income | 411 | |||
Gain on disposal of assets | 55 | |||
Income before taxes | 466 | |||
Income tax benefit | 26 | |||
Income from discontinued operations | $ | 492 | ||
Income from discontinued operations attributable to non-controlling interest | $ | 6 | ||
Income from discontinued operations attributable to common stockholders | $ | 486 | ||
NOTE 15 — EARNINGS PER SHARE
We apply the two-class method of computing earnings per share, which requires the calculation of separate earnings per share amounts for our non-vested time-based restricted stock awards with non-forfeitable dividends and for our common stock. Our non-vested time-based restricted stock awards with non-forfeitable rights to dividends are considered securities which participate in undistributed earnings with common stock. Under the two-class computation method, net losses are not allocated to participating securities unless the holder of the security has a contractual obligation to share in the losses. Our non-vested time-based restricted stock awards with non-forfeitable dividends do not have such an obligation so they are not allocated losses.
At December 31, 2014, we had 846,000 stock options outstanding which were not included in the computation of diluted earnings per share, as the effect would have been anti-dilutive. All outstanding stock options were included in the computation of diluted earnings per share for the years ended December 31, 2016 and 2015 due to their dilutive effect. The Common Units held by the non-controlling interest holders have been excluded from the denominator of the diluted earnings per share as there would be no effect on the amounts since the limited partners' share of income would also be added to derive net income attributable to common stockholders. For the years ended December 31, 2016, 2015, and 2014, we had unvested performance-based restricted stock awards of 409,068 shares, 194,463 shares and 256,373 shares, respectively, which were excluded from the denominator of the diluted earnings per share as the awards had not achieved the requisite performance conditions for vesting at each period end.
F-37
Below is a summary of the components used to calculate basic and diluted earnings per share (in thousands, except per share amounts):
2016 | 2015 | 2014 | ||||||||||
Numerator: | ||||||||||||
Income from continuing operations | $ | 108,261 | $ | 125,256 | $ | 20,431 | ||||||
Less: Preferred dividends | (18,232 | ) | (16,588 | ) | (16,588 | ) | ||||||
Premium on redemption of Series A Preferred Stock | (2,125 | ) | — | — | ||||||||
Allocation to participating securities | (342 | ) | (118 | ) | (94 | ) | ||||||
Attributable to non-controlling interest | (456 | ) | (819 | ) | (46 | ) | ||||||
Income from continuing operations attributable to common stockholders | 87,106 | 107,731 | 3,703 | |||||||||
Income from discontinued operations attributable to common stockholders | — | — | 486 | |||||||||
Net income attributable to common stockholders, net of amount allocated to participating securities | $ | 87,106 | $ | 107,731 | $ | 4,189 | ||||||
Denominator: | ||||||||||||
Weighted average common shares outstanding - basic | 86,874 | 85,920 | 85,242 | |||||||||
Dilutive effect of equity-based compensation awards | 469 | 1,224 | 324 | |||||||||
Weighted average common shares outstanding - diluted | 87,343 | 87,144 | 85,566 | |||||||||
Earnings per common share - basic: | ||||||||||||
Net income from continuing operations | $ | 1.00 | $ | 1.25 | $ | 0.04 | ||||||
Net income from discontinued operations | — | — | 0.01 | |||||||||
Net income per common share | $ | 1.00 | $ | 1.25 | $ | 0.05 | ||||||
Earnings per common share - diluted: | ||||||||||||
Net income from continuing operations | $ | 1.00 | $ | 1.24 | $ | 0.04 | ||||||
Net income from discontinued operations | — | — | 0.01 | |||||||||
Net income per common share | $ | 1.00 | $ | 1.24 | $ | 0.05 | ||||||
NOTE 16 — SELECTED QUARTERLY FINANCIAL DATA (UNAUDITED)
Selected quarterly financial data for the years ended December 31, 2016 and 2015 are as follows (in thousands, except per share amounts):
2016 | ||||||||||||||||
First Quarter | Second Quarter | Third Quarter | Fourth Quarter | |||||||||||||
Total revenues | $ | 118,082 | $ | 127,195 | $ | 118,336 | $ | 110,322 | ||||||||
Income from continuing operations | $ | 48,734 | $ | 21,955 | $ | 27,198 | $ | 10,374 | ||||||||
Net income | $ | 48,734 | $ | 21,955 | $ | 27,198 | $ | 10,374 | ||||||||
Net income attributable to Summit Hotel Properties, Inc. | $ | 48,485 | $ | 21,865 | $ | 27,083 | $ | 10,372 | ||||||||
Earnings per share - Basic and diluted | $ | 0.51 | $ | 0.20 | $ | 0.25 | $ | 0.04 | ||||||||
F-38
2015 | ||||||||||||||||
First Quarter | Second Quarter | Third Quarter | Fourth Quarter | |||||||||||||
Total revenues | $ | 107,648 | $ | 120,677 | $ | 125,091 | $ | 110,039 | ||||||||
Income from continuing operations | $ | 10,591 | $ | 16,301 | $ | 13,606 | $ | 84,758 | ||||||||
Net income | $ | 10,591 | $ | 16,301 | $ | 13,606 | $ | 84,758 | ||||||||
Net income attributable to Summit Hotel Properties, Inc. | $ | 10,534 | $ | 16,204 | $ | 13,540 | $ | 84,159 | ||||||||
Earnings per share: | ||||||||||||||||
Basic | $ | 0.07 | $ | 0.14 | $ | 0.11 | $ | 0.93 | ||||||||
Diluted | $ | 0.07 | $ | 0.14 | $ | 0.11 | $ | 0.92 | ||||||||
NOTE 17 — SUBSEQUENT EVENTS
Equity Transactions
On January 1, 2017, we had 39,959 of our outstanding performance-based restricted stock awards granted pursuant to our Equity Plan vest.
On January 24, 2017, our Board of Directors declared cash dividends of $0.1625 per share of common stock, $0.4921875 per share of 7.875% Series B Cumulative Redeemable Preferred Stock, $0.4453125 per share of 7.125% Series C Cumulative Redeemable Preferred Stock, and $0.403125 per share of 6.45% Series D Cumulative Redeemable Preferred Stock. These dividends are payable February 28, 2017 to stockholders of record on February 14, 2017.
F-39
SUMMIT HOTEL PROPERTIES, INC
Schedule III - Real Estate and Accumulated Depreciation
December 31, 2016
(in thousands)
Initial Cost | Cost Capitalized Subsequent to Acquisition | Total Cost | ||||||||||||||||||||||||||||||||||||||||
Location | Franchise | Year Acquired/ Constructed | Land | Building & Improvements | Land, Building & Improvements | Land | Building & Improvements | Total | Accumulated Depreciation | Total Cost Net of Accumulated Depreciation | Mortgage Debt | |||||||||||||||||||||||||||||||
Arlington, TX | Hyatt Place | 2012 | $ | 650 | $ | 8,405 | $ | 1,541 | $ | 650 | $ | 9,946 | $ | 10,596 | $ | (2,721 | ) | $ | 7,875 | $ | 27,473 | (1) | ||||||||||||||||||||
Arlington, TX | Courtyard by Marriott | 2012 | 1,497 | 13,503 | 2,070 | 1,497 | 15,573 | 17,070 | (2,368 | ) | 14,702 | |||||||||||||||||||||||||||||||
Arlington, TX | Residence Inn by Marriott | 2012 | 1,646 | 13,854 | 1,586 | 1,646 | 15,440 | 17,086 | (1,866 | ) | 15,220 | |||||||||||||||||||||||||||||||
Asheville, NC | Hotel Indigo | 2015 | 2,100 | 32,783 | 1,972 | 2,100 | 34,755 | 36,855 | (1,924 | ) | 34,931 | |||||||||||||||||||||||||||||||
Atlanta, GA | Hyatt Place | 2006 | 1,154 | 9,605 | 2,600 | 1,154 | 12,205 | 13,359 | (3,749 | ) | 9,610 | 6,588 | ||||||||||||||||||||||||||||||
Atlanta, GA | Courtyard by Marriott | 2012 | 2,050 | 26,850 | 1,119 | 2,050 | 27,969 | 30,019 | (4,934 | ) | 25,085 | |||||||||||||||||||||||||||||||
Atlanta, GA | Courtyard by Marriott | 2015 | 4,046 | 33,795 | 356 | 4,046 | 34,151 | 38,197 | (1,799 | ) | 36,398 | |||||||||||||||||||||||||||||||
Atlanta, GA | Residence Inn by Marriott | 2016 | 3,381 | 34,619 | 201 | 3,381 | 34,820 | 38,201 | (1,115 | ) | 37,086 | |||||||||||||||||||||||||||||||
Austin, TX | Hampton Inn and Suites | 2014 | — | (2) | 53,760 | 2,634 | — | 56,394 | 56,394 | (4,250 | ) | 52,144 | ||||||||||||||||||||||||||||||
Baltimore, MD | Hyatt Place | 2012 | 2,100 | 8,135 | 1,664 | 2,100 | 9,799 | 11,899 | (2,281 | ) | 9,618 | 21,291 | (1) | |||||||||||||||||||||||||||||
Baltimore, MD | Residence Inn by Marriott | 2015 | — | (2) | 34,350 | 1,086 | — | 35,436 | 35,436 | (1,863 | ) | 33,573 | ||||||||||||||||||||||||||||||
Birmingham, AL | Hilton Garden Inn | 2012 | 1,400 | 7,225 | 1,906 | 1,400 | 9,131 | 10,531 | (2,485 | ) | 8,046 | 5,046 | ||||||||||||||||||||||||||||||
Birmingham, AL | Hilton Garden Inn | 2012 | 1,400 | 10,100 | 1,921 | 1,400 | 12,021 | 13,421 | (2,404 | ) | 11,017 | 5,910 | ||||||||||||||||||||||||||||||
Bloomington, MN | SpringHill Suites by Marriott | 2007 | 1,658 | 14,071 | 690 | 1,658 | 14,761 | 16,419 | (4,118 | ) | 12,301 | |||||||||||||||||||||||||||||||
Bloomington, MN | Hampton Inn and Suites | 2007 | 1,658 | 14,596 | 627 | 1,658 | 15,223 | 16,881 | (4,409 | ) | 12,472 | |||||||||||||||||||||||||||||||
Boston, MA | Hampton Inn | 2015 | 2,000 | 22,000 | 1,922 | 2,000 | 23,922 | 25,922 | (3,157 | ) | 22,765 | |||||||||||||||||||||||||||||||
Boulder, CO | Marriott | 2016 | 11,115 | 48,843 | 361 | 11,115 | 49,204 | 60,319 | (800 | ) | 59,519 | |||||||||||||||||||||||||||||||
Branchburg, NJ | Residence Inn by Marriott | 2015 | 2,374 | 23,326 | 1,085 | 2,374 | 24,411 | 26,785 | (1,316 | ) | 25,469 | |||||||||||||||||||||||||||||||
Charleston, WV | Country Inn and Suites | 2004 | 1,042 | 3,489 | 1,686 | 1,042 | 5,175 | 6,217 | (2,140 | ) | 4,077 | |||||||||||||||||||||||||||||||
Charleston, WV | Holiday Inn Express | 2004 | 907 | 2,903 | 2,150 | 907 | 5,053 | 5,960 | (2,351 | ) | 3,609 | |||||||||||||||||||||||||||||||
Chicago, IL | Hyatt Place | 2016 | 5,395 | 68,355 | — | 5,395 | 68,355 | 73,750 | (511 | ) | 73,239 | |||||||||||||||||||||||||||||||
Denver, CO | Hyatt Place | 2012 | 1,300 | 9,230 | 2,474 | 1,300 | 11,704 | 13,004 | (3,008 | ) | 9,996 | (1) | ||||||||||||||||||||||||||||||
Denver, CO | Hyatt Place | 2012 | 2,000 | 9,515 | 2,435 | 2,000 | 11,950 | 13,950 | (2,903 | ) | 11,047 | (1) | ||||||||||||||||||||||||||||||
Denver, CO | Hyatt House | 2012 | 2,700 | 10,780 | 5,487 | 2,700 | 16,267 | 18,967 | (3,419 | ) | 15,548 | (1) | ||||||||||||||||||||||||||||||
Duluth, GA | Holiday Inn | 2011 | — | (2) | 7,000 | 466 | — | 7,466 | 7,466 | (1,896 | ) | 5,570 | ||||||||||||||||||||||||||||||
Duluth, GA | Hilton Garden Inn | 2011 | 2,200 | 11,150 | 1,544 | 2,200 | 12,694 | 14,894 | (3,145 | ) | 11,749 | (1) | ||||||||||||||||||||||||||||||
Eden Prairie, MN | Hilton Garden Inn | 2013 | 1,800 | 8,400 | 2,811 | 1,800 | 11,211 | 13,011 | (2,030 | ) | 10,981 | |||||||||||||||||||||||||||||||
El Paso, TX | Courtyard by Marriott | 2011 | 1,640 | 10,710 | 368 | 1,640 | 11,078 | 12,718 | (1,920 | ) | 10,798 | |||||||||||||||||||||||||||||||
Ft. Myers, FL | Hyatt Place | 2009 | 1,878 | 16,583 | (3,917 | ) | 1,878 | 12,666 | 14,544 | (2,425 | ) | 12,119 | ||||||||||||||||||||||||||||||
Ft. Worth, TX | Hampton Inn | 2007 | 1,500 | 8,184 | 953 | 1,500 | 9,137 | 10,637 | (2,442 | ) | 8,195 | 23,394 | (1) | |||||||||||||||||||||||||||||
Ft. Worth, TX | Fairfield Inn and Suites by Marriott | 2004 | 553 | 2,698 | 3,177 | 553 | 5,875 | 6,428 | (2,576 | ) | 3,852 | |||||||||||||||||||||||||||||||
Ft. Worth, TX | Hilton Garden Inn | 2012 | 903 | 6,226 | 3,584 | 903 | 9,810 | 10,713 | (2,229 | ) | 8,484 | 23,889 | (1) | |||||||||||||||||||||||||||||
Garden City, NY(3) | Hyatt Place | 2012 | 4,200 | 26,800 | 975 | 4,200 | 27,775 | 31,975 | (2,922 | ) | 29,053 | |||||||||||||||||||||||||||||||
Germantown, TN | Courtyard by Marriott | 2005 | 1,860 | 5,448 | 2,014 | 1,860 | 7,462 | 9,322 | (2,315 | ) | 7,007 | |||||||||||||||||||||||||||||||
Germantown, TN | Fairfield Inn and Suites by Marriott | 2005 | 767 | 2,700 | 2,206 | 767 | 4,906 | 5,673 | (1,175 | ) | 4,498 | |||||||||||||||||||||||||||||||
Germantown, TN | Residence Inn by Marriott | 2005 | 1,083 | 5,200 | 2,281 | 1,083 | 7,481 | 8,564 | (1,981 | ) | 6,583 | |||||||||||||||||||||||||||||||
F-40
SUMMIT HOTEL PROPERTIES, INC
Schedule III - Real Estate and Accumulated Depreciation
December 31, 2016
(in thousands)
Initial Cost | Cost Capitalized Subsequent to Acquisition | Total Cost | ||||||||||||||||||||||||||||||||||||||||
Location | Franchise | Year Acquired/ Constructed | Land | Building & Improvements | Land, Building & Improvements | Land | Building & Improvements | Total | Accumulated Depreciation | Total Cost Net of Accumulated Depreciation | Mortgage Debt | |||||||||||||||||||||||||||||||
Glendale, CO | Staybridge Suites | 2011 | 2,100 | 7,900 | 2,251 | 2,100 | 10,151 | 12,251 | (2,541 | ) | 9,710 | |||||||||||||||||||||||||||||||
Goleta, CA | Hampton Inn | 2014 | 4,100 | 23,800 | 2,391 | 4,100 | 26,191 | 30,291 | (2,591 | ) | 27,700 | 11,303 | ||||||||||||||||||||||||||||||
Greenville, SC | Hilton Garden Inn | 2013 | 1,200 | 14,050 | 516 | 1,200 | 14,566 | 15,766 | (2,079 | ) | 13,687 | (1) | ||||||||||||||||||||||||||||||
Hoffman Estates, IL | Hyatt Place | 2013 | 1,900 | 7,330 | 1,587 | 1,900 | 8,917 | 10,817 | (2,162 | ) | 8,655 | 20,626 | (1) | |||||||||||||||||||||||||||||
Houston, TX | Hilton Garden Inn | 2014 | — | (2) | 38,492 | 3,346 | — | 41,838 | 41,838 | (5,278 | ) | 36,560 | ||||||||||||||||||||||||||||||
Houston, TX | Hilton Garden Inn | 2014 | 2,800 | 33,200 | 577 | 2,800 | 33,777 | 36,577 | (2,343 | ) | 34,234 | 16,970 | ||||||||||||||||||||||||||||||
Indianapolis, IN | SpringHill Suites by Marriott | 2013 | 4,012 | 26,193 | 1,717 | 4,012 | 27,910 | 31,922 | (3,500 | ) | 28,422 | 41,328 | (1) | |||||||||||||||||||||||||||||
Indianapolis, IN | Courtyard by Marriott | 2013 | 7,788 | 50,846 | 3,538 | 7,788 | 54,384 | 62,172 | (6,838 | ) | 55,334 | (1) | ||||||||||||||||||||||||||||||
Jackson, MS | Courtyard by Marriott | 2005 | 1,301 | 7,322 | 2,332 | 1,301 | 9,654 | 10,955 | (3,572 | ) | 7,383 | |||||||||||||||||||||||||||||||
Jackson, MS | Staybridge Suites | 2007 | 698 | 8,454 | 1,766 | 698 | 10,220 | 10,918 | (2,428 | ) | 8,490 | |||||||||||||||||||||||||||||||
Lombard, IL | Hyatt Place | 2012 | 1,550 | 15,475 | 1,876 | 1,550 | 17,351 | 18,901 | (3,831 | ) | 15,070 | (1) | ||||||||||||||||||||||||||||||
Louisville, KY | Fairfield Inn and Suites by Marriott | 2013 | 3,120 | 21,903 | 2,328 | 3,120 | 24,231 | 27,351 | (3,814 | ) | 23,537 | 36,741 | (1) | |||||||||||||||||||||||||||||
Louisville, KY | SpringHill Suites by Marriott | 2013 | 4,880 | 34,258 | 3,103 | 4,880 | 37,361 | 42,241 | (6,295 | ) | 35,946 | (1) | ||||||||||||||||||||||||||||||
Miami, FL | Hyatt House | 2015 | 4,926 | 34,074 | 6,013 | 4,926 | 40,087 | 45,013 | (2,819 | ) | 42,194 | |||||||||||||||||||||||||||||||
Minneapolis, MN | Hyatt Place | 2013 | — | 32,506 | 1,520 | — | 34,026 | 34,026 | (3,955 | ) | 30,071 | |||||||||||||||||||||||||||||||
Minneapolis, MN | Hampton Inn and Suites | 2015 | 3,500 | 35,339 | 96 | 3,500 | 35,435 | 38,935 | (3,063 | ) | 35,872 | |||||||||||||||||||||||||||||||
Minnetonka, MN | Holiday Inn Express and Suites | 2013 | 1,000 | 5,900 | 1,762 | 1,000 | 7,662 | 8,662 | (1,556 | ) | 7,106 | |||||||||||||||||||||||||||||||
Nashville, TN | SpringHill Suites by Marriott | 2004 | 777 | 3,576 | 2,022 | 777 | 5,598 | 6,375 | (2,672 | ) | 3,703 | |||||||||||||||||||||||||||||||
Nashville, TN | Courtyard by Marriott | 2016 | 8,792 | 62,869 | (110 | ) | 8,792 | 62,759 | 71,551 | (2,002 | ) | 69,549 | ||||||||||||||||||||||||||||||
New Orleans, LA | Courtyard by Marriott | 2013 | 1,944 | 23,739 | 1,381 | 1,944 | 25,120 | 27,064 | (4,768 | ) | 22,296 | |||||||||||||||||||||||||||||||
New Orleans, LA | Courtyard by Marriott | 2013 | 1,860 | 21,679 | 3,489 | 1,860 | 25,168 | 27,028 | (4,367 | ) | 22,661 | (1) | ||||||||||||||||||||||||||||||
New Orleans, LA | Courtyard by Marriott | 2013 | 2,490 | 28,337 | 5,883 | 2,490 | 34,220 | 36,710 | (5,759 | ) | 30,951 | |||||||||||||||||||||||||||||||
New Orleans, LA | Residence Inn by Marriott | 2013 | 1,790 | 18,099 | 5,287 | 1,790 | 23,386 | 25,176 | (3,197 | ) | 21,979 | (1) | ||||||||||||||||||||||||||||||
New Orleans, LA | SpringHill Suites by Marriott | 2013 | 2,046 | 31,049 | 2,221 | 2,046 | 33,270 | 35,316 | (5,165 | ) | 30,151 | |||||||||||||||||||||||||||||||
Orlando, FL | Hyatt Place | 2013 | 3,100 | 9,152 | 2,191 | 3,100 | 11,343 | 14,443 | (3,270 | ) | 11,173 | (1) | ||||||||||||||||||||||||||||||
Orlando, FL | Hyatt Place | 2013 | 5,516 | 9,043 | 2,178 | 5,516 | 11,221 | 16,737 | (3,226 | ) | 13,511 | (1) | ||||||||||||||||||||||||||||||
Phoenix, AZ | Hyatt Place | 2012 | 582 | 4,438 | 709 | 582 | 5,147 | 5,729 | (1,091 | ) | 4,638 | |||||||||||||||||||||||||||||||
Portland, OR | Hyatt Place | 2009 | — | (2) | 16,713 | (2,013 | ) | — | 14,700 | 14,700 | (2,525 | ) | 12,175 | |||||||||||||||||||||||||||||
Portland, OR | Residence Inn by Marriott | 2009 | — | (2) | 16,409 | (780 | ) | — | 15,629 | 15,629 | (3,300 | ) | 12,329 | 18,578 | ||||||||||||||||||||||||||||
Provo, UT | Hampton Inn | 2004 | 909 | 2,862 | 2,154 | 909 | 5,016 | 5,925 | (2,568 | ) | 3,357 | |||||||||||||||||||||||||||||||
Ridgeland, MS | Residence Inn by Marriott | 2007 | 1,050 | 10,040 | (387 | ) | 1,050 | 9,653 | 10,703 | (1,868 | ) | 8,835 | ||||||||||||||||||||||||||||||
Ridgeland, MS | Homewood Suites | 2011 | 1,314 | 6,036 | 1,786 | 1,314 | 7,822 | 9,136 | (1,630 | ) | 7,506 | |||||||||||||||||||||||||||||||
Salt Lake City, UT | Residence Inn by Marriott | 2012 | 2,392 | 17,567 | 7,152 | 2,392 | 24,719 | 27,111 | (4,892 | ) | 22,219 | |||||||||||||||||||||||||||||||
San Diego, CA | Hampton Inn and Suites | 2013 | 2,300 | 12,850 | 1,878 | 2,300 | 14,728 | 17,028 | (1,667 | ) | 15,361 | (1) | ||||||||||||||||||||||||||||||
San Francisco, CA | Holiday Inn Express and Suites | 2013 | 15,545 | 44,955 | 4,514 | 15,545 | 49,469 | 65,014 | (8,240 | ) | 56,774 | |||||||||||||||||||||||||||||||
San Francisco, CA | DoubleTree | 2014 | 3,300 | 35,760 | 3,926 | 3,300 | 39,686 | 42,986 | (5,342 | ) | 37,644 | |||||||||||||||||||||||||||||||
San Francisco, CA | Four Points by Sheraton | 2014 | 1,200 | 20,050 | 1,347 | 1,200 | 21,397 | 22,597 | (3,145 | ) | 19,452 | |||||||||||||||||||||||||||||||
F-41
SUMMIT HOTEL PROPERTIES, INC
Schedule III - Real Estate and Accumulated Depreciation
December 31, 2016
(in thousands)
Initial Cost | Cost Capitalized Subsequent to Acquisition | Total Cost | ||||||||||||||||||||||||||||||||||||||||
Location | Franchise | Year Acquired/ Constructed | Land | Building & Improvements | Land, Building & Improvements | Land | Building & Improvements | Total | Accumulated Depreciation | Total Cost Net of Accumulated Depreciation | Mortgage Debt | |||||||||||||||||||||||||||||||
Sandy, UT | Holiday Inn Express and Suites | 2004 | 720 | 1,768 | 1,437 | 720 | 3,205 | 3,925 | (1,467 | ) | 2,458 | 37,042 | ||||||||||||||||||||||||||||||
Scottsdale, AZ | Hyatt Place | 2012 | 1,500 | 9,030 | 1,141 | 1,500 | 10,171 | 11,671 | (2,458 | ) | 9,213 | (1) | ||||||||||||||||||||||||||||||
Scottsdale, AZ | Courtyard by Marriott | 2004 | 3,225 | 10,152 | 2,419 | 3,225 | 12,571 | 15,796 | (5,352 | ) | 10,444 | 8,912 | ||||||||||||||||||||||||||||||
Scottsdale, AZ | SpringHill Suites by Marriott | 2004 | 2,195 | 7,120 | 2,376 | 2,195 | 9,496 | 11,691 | (4,464 | ) | 7,227 | 4,798 | ||||||||||||||||||||||||||||||
Smyrna, TN | Hampton Inn and Suites | 2012 | 1,145 | 6,855 | 2,430 | 1,145 | 9,285 | 10,430 | (1,873 | ) | 8,557 | |||||||||||||||||||||||||||||||
Smyrna, TN | Hilton Garden Inn | 2012 | 1,188 | 10,312 | 2,099 | 1,188 | 12,411 | 13,599 | (2,263 | ) | 11,336 | 7,661 | ||||||||||||||||||||||||||||||
Ventura, CA | Hampton Inn and Suites | 2013 | 2,200 | 13,550 | 3,816 | 2,200 | 17,366 | 19,566 | (2,334 | ) | 17,232 | (1) | ||||||||||||||||||||||||||||||
Yrbor City, FL | Hampton Inn and Suites | 2012 | 3,600 | 17,244 | 3,122 | 3,600 | 20,366 | 23,966 | (2,771 | ) | 21,195 | (1) | ||||||||||||||||||||||||||||||
Austin, TX | Corporate Office | 2012 | — | 210 | 3,482 | — | 3,692 | 3,692 | (472 | ) | 3,220 | |||||||||||||||||||||||||||||||
Land Parcels | 8,105 | — | (2,545 | ) | 5,560 | — | 5,560 | — | 5,560 | |||||||||||||||||||||||||||||||||
$ | 197,617 | $ | 1,493,697 | $ | 157,359 | $ | 195,072 | $ | 1,653,601 | $ | 1,848,673 | $ | (241,760 | ) | $ | 1,606,913 | $ | 317,550 | ||||||||||||||||||||||||
(2) Properties subject to ground lease, refer to "Note 9 - Commitments and Contingencies" in the Consolidated Financial Statements.
(3) Property subject to a PILOT lease, refer to "Note 9 - Commitments and Contingencies" in the Consolidated Financial Statements.
F-42
SUMMIT HOTEL PROPERTIES, INC
Schedule III - Real Estate and Accumulated Depreciation
December 31, 2016
(in thousands)
(a) ASSET BASIS
2016 | 2015 | 2014 | ||||||||||
Reconciliation of land, buildings and improvements: | ||||||||||||
Balance at beginning of period | $ | 1,683,803 | $ | 1,527,569 | $ | 1,349,088 | ||||||
Additions to land, buildings and improvements | 290,486 | 273,902 | 263,182 | |||||||||
Disposition of land, buildings and improvements | (125,039 | ) | (116,553 | ) | (75,454 | ) | ||||||
Impairment loss | (577 | ) | (1,115 | ) | (9,247 | ) | ||||||
Balance at end of period | $ | 1,848,673 | $ | 1,683,803 | $ | 1,527,569 | ||||||
(b) ACCUMULATED DEPRECIATION
2016 | 2015 | 2014 | ||||||||||
Reconciliation of accumulated depreciation: | ||||||||||||
Balance at beginning of period | $ | 212,207 | $ | 179,455 | $ | 173,149 | ||||||
Depreciation | 72,063 | 63,675 | 63,669 | |||||||||
Depreciation on assets sold or disposed | (42,510 | ) | (30,923 | ) | (57,363 | ) | ||||||
Balance at end of period | $ | 241,760 | $ | 212,207 | $ | 179,455 | ||||||
(c) The aggregate cost of land, buildings, furniture and equipment for Federal income tax purposes is approximately $1,384.1 million.
(d) Depreciation is computed based upon the following useful lives:
Buildings and improvements 6-40 years
Furniture and equipment 2-15 years
(e) We have mortgages payable on the properties as noted. Additional mortgage information can be found in "Note 5 - Debt" to the Consolidated Financial Statements.
(f) The negative balance for costs capitalized subsequent to acquisition include out-parcels sold, disposal of assets, and recorded impairment losses.
(g) The amounts presented in Schedule III exclude capitalized franchise costs that are included in Assets Held for Sale.
F-43