Attached files
| file | filename |
|---|---|
| EX-99.2 - STOCKHOLDER LETTER - Phillips Edison & Company, Inc. | ex99-2.htm |
| EX-99.1 - PRESS RELEASE - Phillips Edison & Company, Inc. | ex99-1.htm |
| 8-K - CURRENT REPORT - Phillips Edison & Company, Inc. | phld-8k_051817.htm |
Phillips Edison Grocery Center REIT I, Inc. 8-K
Exhibit 99.3

Phillips Edison Grocery Center REIT I to Acquire Phillips Edison Limited Partnership May 2017

2 · FORWARD - LOOKING STATEMENT DISCLOSURE Certain statements contained in this press release may be considered forward - looking statements within the meaning of Section 27 A of the Securities Act of 1933 , as amended (the “Securities Act ”), and Section 21 E of the Securities Exchange Act of 1934 , as amended (the “Exchange Act ”), including statements regarding the transaction and the ability to consummate the transaction and anticipated dividends . We intend for all such forward - looking statements to be covered by the safe harbor provisions for forward - looking statements contained in Section 27 A of the Securities Act and Section 21 E of the Exchange Act, as applicable . Such statements include, in particular, statements about PECO I’s plans, strategies, and prospects and are subject to certain risks and uncertainties , as well as known and unknown risks, which could cause actual results to differ materially from those projected or anticipated . Therefore, such statements are not intended to be a guarantee of PECO I’s performance in future periods . Such forward - looking statements can generally be identified by our use of forward - looking terminology such as “may,” “will,” “would ,” “ could,” “should,” “expect,” “intend,” “anticipate,” “estimate,” “believe,” “continue,” or other similar words . Readers are cautioned not to place undue reliance on these forward - looking statements , which speak only as of the date of this release . PECO I makes no representation or warranty (express or implied) about the accuracy of any such forward - looking statements contained in this release, and does not intend, and undertakes no obligation, to publicly update or revise any forward - looking statements, whether as a result of new information, future events, or otherwise . 2

3 · INFORMATION DISCLOSURE Additional Information About the Transaction and Where to Find It This communication does not constitute a solicitation of materials of any vote or approval in respect of the proposed transac tio n involving PECO I or otherwise. In connection with the proposed transaction, a stockholder meeting will be announced soon to obtain stockholder approval. In connection with the proposed transaction, PECO I intends to file relevant materials, includi ng a proxy statement, with the Securities and Exchange Commission (the “SEC”). Investors and security holders of PECO I are urged to read the definitive proxy statement and other relevant materials when they become available because they will contain importa nt information about PECO I and the proposed transaction. The proxy statement and other relevant materials (when they become available), and any other documents filed by PECO I with the SEC, may be obtained free of charge at the SEC’s website at www.sec.gov , at PECO I’s website at www.grocerycenterREIT1.com or by sending a written request to the Company at 11501 Northlake Drive, Cincinnati, OH 45249, Attention: Investor Relations. Participants in the Solicitation PECO I and its directors, executive officers and certain other members of management and employees may be deemed to be participants in soliciting proxies from the stockholders of PECO I in favor of the proposed transaction. Information regardin g t he persons who may, under the rules of the SEC, be considered to be participants in the solicitation of PECO I’s stockholders in connection with the proposed transaction and their ownership of PECO I’s common stock will be set forth in the proxy statemen t for its stockholder meeting. Investors can find more information about PECO I’s executive officers and directors in its Annu al Report on Form 10 - K for the fiscal year ended December 31, 2016 and in its definitive proxy statement filed with the SEC on Schedule 14A on June 28, 2016. 3

4 · AGENDA 4 • Review of Transaction – Transaction Details – Consideration – Capital Structure • Overview of PELP • Pro Forma Phillips Edison Grocery Center REIT I – Portfolio – Capital Structure – Financial Benefits • Timeline • Key Takeaways – Liquidity
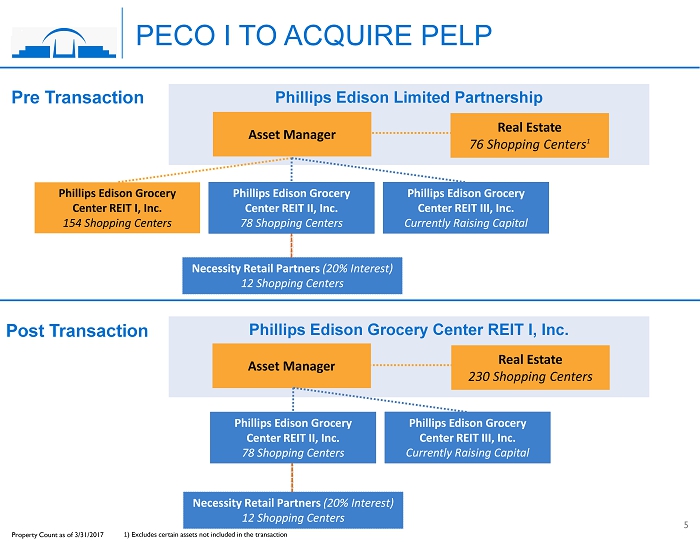
1 · Phillips Edison Limited Partnership Real Estate 76 Shopping Centers 1 Necessity Retail Partners (20 % Interest) 12 Shopping Centers Property Count as of 3/31/2017 PECO I TO ACQUIRE PELP Phillips Edison Grocery Center REIT II, Inc. 78 Shopping Centers Phillips Edison Grocery Center REIT I, Inc. 154 Shopping Centers Phillips Edison Grocery Center REIT III, Inc. Currently Raising Capital Phillips Edison Grocery Center REIT I, Inc. Pre Transaction Post Transaction Real Estate 230 Shopping Centers 5 Asset Manager Phillips Edison Grocery Center REIT II, Inc. 78 Shopping Centers Phillips Edison Grocery Center REIT III, Inc. Currently Raising Capital Asset Manager 1 ) Excludes certain assets not included in the transaction Necessity Retail Partners (20 % Interest) 12 Shopping Centers
1 · Phillips Edison Limited Partnership Real Estate 76 Shopping Centers 1 Necessity Retail Partners (20 % Interest) 12 Shopping Centers Property Count as of 3/31/2017 PECO I TO ACQUIRE PELP Phillips Edison Grocery Center REIT II, Inc. 78 Shopping Centers Phillips Edison Grocery Center REIT I, Inc. 154 Shopping Centers Phillips Edison Grocery Center REIT III, Inc. Currently Raising Capital Phillips Edison Grocery Center REIT I, Inc. Pre Transaction Post Transaction Real Estate 230 Shopping Centers 5 Asset Manager Phillips Edison Grocery Center REIT II, Inc. 78 Shopping Centers Phillips Edison Grocery Center REIT III, Inc. Currently Raising Capital Asset Manager 1 ) Excludes certain assets not included in the transaction Necessity Retail Partners (20 % Interest) 12 Shopping Centers
1 · Phillips Edison Limited Partnership Real Estate 76 Shopping Centers 1 Necessity Retail Partners (20 % Interest) 12 Shopping Centers Property Count as of 3/31/2017 PECO I TO ACQUIRE PELP Phillips Edison Grocery Center REIT II, Inc. 78 Shopping Centers Phillips Edison Grocery Center REIT I, Inc. 154 Shopping Centers Phillips Edison Grocery Center REIT III, Inc. Currently Raising Capital Phillips Edison Grocery Center REIT I, Inc. Pre Transaction Post Transaction Real Estate 230 Shopping Centers 5 Asset Manager Phillips Edison Grocery Center REIT II, Inc. 78 Shopping Centers Phillips Edison Grocery Center REIT III, Inc. Currently Raising Capital Asset Manager 1 ) Excludes certain assets not included in the transaction Necessity Retail Partners (20 % Interest) 12 Shopping Centers
5 · Phillips Edison Limited Partnership Real Estate 76 Shopping Centers 1 TPG Joint Venture (20 % Interest) 12 Shopping Centers Property Count as of 3/31/2017 PECO I TO ACQUIRE PELP Phillips Edison Grocery Center REIT II, Inc. 78 Shopping Centers Phillips Edison Grocery Center REIT I, Inc. 154 Shopping Centers Phillips Edison Grocery Center REIT III, Inc. Currently Raising Capital Phillips Edison Grocery Center REIT I, Inc. Pre Transaction Post Transaction Real Estate 230 Shopping Centers 5 Asset Manager TPG Joint Venture (20 % Interest) 12 Shopping Centers Phillips Edison Grocery Center REIT II, Inc. 78 Shopping Centers Phillips Edison Grocery Center REIT III, Inc. Currently Raising Capital Asset Manager 1 ) Excludes certain assets not included in the transaction

6 · DETAILS: PECO I TO ACQUIRE PELP PECO I PELP • Externally managed non - traded REIT with estimated $3.0B TEV • 154 shopping centers with 16.8M square feet of GLA • IPO closed in 2014; raised $1.75B • Vertically integrated owner and operator of 76 shopping centers • Exclusively focused on grocery - anchored shopping centers since inception in 1991 • Asset management platform advises approximately $4.9B of grocery - anchored shopping center assets, including PECO I POST TRANSACTION: • Estimated $4.0B TEV internally managed REIT with exclusive focus on grocery - anchored shopping centers • 230 properties with 25.5M square feet of GLA located in 32 states • Third party asset management business with over $1.9B of AUM and annual revenues of approximately $25M from PECO II, PECO III, and Necessity Retail Partners, a JV between PECO II and TPG Real Estate • Projected accretion of 8 - 10% for pro forma FFO per s hare for Q1 2017 compared to standalone PECO I * • Estimated pro forma dividend coverage expected to exceed 100% (on a FFO/Total Dividends basis), up from 92% for standalone PECO I for Q1 2017 * • Internally managed REIT well positioned for capital market opportunities, including strategic liquidity alternatives Phillips Edison Grocery Center REIT I (PECO I) to acquire Phillips Edison Limited Partnership (PELP) All figures are as of 3/31/17 unless otherwise noted *Please see the appendix for reconciliation of non - GAAP measures 6

7 · TRANSACTION CONSIDERATION • Assets acquired include 76 real estate assets and 100% of PELP’s third - party asset management businesses • Transaction consideration excludes internalization fees 1 in accordance with PECO I’s advisory agreement with PELP • Earnout structure incentivizes future performance: – 5 million additional OP Units earned if a liquidity event is achieved by December 31, 2019 at a share value of $10.20 or greater – 8 million additional OP Units earned based on achievement of certain fundraising targets for PECO III – Total earnout subject to cap of 12.49 million OP Units • Equity - based consideration and earn - out aligns management with stockholders and preserves capital for future investments • Management is receiving no cash consideration – 100% of cash will be used to retire certain minority interests in PELP in order to preserve PECO I REIT status • Management will be PECO I’s largest stockholder, owning over 18 million OP Units and common shares 3 , with a long term view of increasing stockholder value, and will be subject to significant lock up periods • Transaction will be subject to stockholder vote, although not legally required TRANSACTION CONSIDERATION 45.2 million PECO I Issued OP Units 2 ($10.20/share) $461 M Debt Assumed/ Refinanced $501 M Cash Consideration $50 M TOTAL VALUE $1,012 M 1. Refers to the absence of any fee paid with respect to advisory services provided to PECO I from PELP 2. Includes 4.8 million Class B OP Units in PECO I Operating Partnership received as payment for asset management services 3. Includes phantom shares held by employees 7

8 · TRANSACTION CAPITAL STRUCTURE • Transaction to be immediately accretive: Estimated pro forma FFO per share for Q1 2017 is higher by approximately 8 - 10% relative to the performance of stand - alone PECO I * • Estimated pro forma dividend coverage expected to exceed 100% (on a FFO/Total Dividends basis ), up from 92% for standalone PECO I for Q1 2017 * • PECO I stockholders to own 80.2% and PELP stockholders to own 19.8% of the combined company (without giving effect to the earn - out) • Pro forma debt to total enterprise value of 41.4% PRO FORMA CAPITAL STRUCTURE (NON - GAAP) 183.3 M PECO I Existing Equity ($10.20/share) $1,870 M 45.2 M PELP Owned OP Units 1 ($10.20/share) $461 M PECO I Total Outstanding Debt 2 $1,144 M PELP Debt Assumed/Refinanced in Transaction 2 $501 M TOTAL ENTERPRISE VALUE $3,976 M 1. Includes 4.8 million Class B OP Units in PECO I Operating Partnership received as payment for asset management services 2. Represents principal amount of outstanding debt and includes estimated transaction costs of $20.0 million in total and $50.0 million of cash consideration 3. Assumes all forward starting swaps are effective 8 PRO FORMA DEBT METRICS ESTIMATED 3/31/2017 Fixed Rate / Floating Rate 87% / 13% Portfolio Weighted Average Interest Rate 3 3.45 to 3.65% Weighted Average Term with Options 4.8 to 5.3 years *Please see the appendix for reconciliation of non - GAAP measures

9 · 2016 FFO/Share: $0.58 Projected accretion of 8 - 10% on estimated pro forma FFO per share for Q1 2017 * SSNOI Growth (‘16 v ‘15): 3.2% REAL ESTATE • National platform focused from its inception in 1991 on grocery - anchored shopping centers • Owns and operates 76 shopping centers, in 25 states, totaling 8.7 million square feet • PECO I and PELP share 4 out of the top 5 grocers by % of ABR: • Highly complementary portfolios: OVERVIEW OF PELP Local 15.7% National & Regional 39.5% Grocery 44.8% Pro Forma GLA by Tenant Type Local 14.0% National & Regional 33.1% Grocery 52.9% PECO I GLA by Tenant Type Local 19.2% National & Regional 52.6% Grocery 28.2% PELP GLA by Tenant Type 9 *Please see the appendix for reconciliation of non - GAAP measures

10 · ASSET MANAGEMENT BUSINESS • $4.8B of third - party assets under management as of December 31, 2016 • Consistent asset management fees from PECO I, PECO II, PECO III and Necessity Retail Partners, a value - added joint venture between PECO II and TPG Real Estate • Generates annual fee and management income of approximately $71 million • Sponsored 11 third party funds (high net worth, institutional and public non - traded REITs) since 2000 • Raised over $3.8 billion of equity capital • Generated strong investor returns: 5 of the 6 realized funds have achieved net IRRs in excess of 13% OVERVIEW OF PELP 10 1) Includes PECO I, PECO II, PECO III and Necessity Retail Partners and certain other third - party owned centers 2) Certain amounts of fee income have been normalized to the periods earned $839 $913 $1,002 $1,032 $1,271 $2,657 $3,063 $3,768 $4,759 2008 : $ 14.2 M 2016 : $ 70.9 M 10.0 30.0 50.0 70.0 90.0 110.0 130.0 150.0 170.0 190.0 2008 2009 2010 2011 2012 2013 2014 2015 2016 $0 $500 $1,000 $1,500 $2,000 $2,500 $3,000 $3,500 $4,000 $4,500 $5,000 Total Invested Capital Fee Income Strong Growth in Third Party Assets Under Management 1,2 (in Millions) (Excluding PELP)

11 · COMBINATION OF COMPLEMENTARY PORTFOLIOS 11 PELP PECO I COMBINED Property Count 76 in 25 states 154 in 28 states 230 in 32 states Square Feet 8.7 million 16.8 million 25.5 million Leased Occupancy 90.0% 96.0% 93.9% % ABR from Grocers, National, and Regional Tenants 76% 79% 78% PELP PECO I COMBINED Tenant % of ABR # Tenant % of ABR # Tenant % of ABR # Top 3 Grocers by % of ABR Kroger 8.7% 14 Kroger 8.4% 38 Kroger 8.5% 52 Albertsons – Safeway 3.0% 5 Publix 7.4% 31 Publix 5.9% 33 Ahold Delhaize 2.9% 9 Albertsons – Safeway 4.3% 14 Albertsons – Safeway 4.0% 19 Top 3 Inline Tenants by % of ABR H&R Block 0.8% 18 Subway 0.8% 45 Subway 0.8% 62 Dollar Tree 0.8% 7 Wells Fargo Financial 0.7% 14 Anytime Fitness 0.6% 26 Hibbett Sports 0.8% 11 Anytime Fitness 0.6% 18 H&R Block 0.6% 50

12 · AUGUST JULY PROJECTED TIMELINE May 2017 • Executed Contribution Agreement July 2017 • Proxy mailed to stockholders September 2017 • Stockholder vote • Receipt of required non recourse debt consents Q4 2017 • Transaction expected to close MAY JUNE SEPTEMBER Q4 2017 12

13 · KEY TAKEAWAYS • The result of this transaction will be the largest internally managed REIT exclusively focused on grocery - anchored properties • Expected to be immediately accretive to FFO per share • Estimated pro forma dividend coverage expected to exceed 100% • Strengthens balance sheet • Increases future earnings growth potential • Drives cost synergies realized through internal management • Improved valuation potential with increased earnings, scale and internalized manager • Transaction consideration does not include internalization fees 1 and management receives no cash consideration • Asset management fees provide consistent, predictable income through market cycles • Equity - based transaction enhances REIT I’s capital position and better aligns management with the stockholders • PECO I management is the REIT’s largest equity owner and will own over 18 million share equivalents (excluding earn - out) • Managed portfolios provide embedded acquisition pipeline with increased opportunities for growth 13 1. Refers to the absence of any fee paid with respect to advisory services provided to PECO I from PELP

14 · GOAL: TO PROVIDE LIQUIDITY FOR PECO I SHAREHOLDERS • Exclusive focus on grocery - anchored shopping centers: the most attractive space in shopping center real estate • Integrated veteran management team vested in the success of PECO I through a meaningful ownership stake • $4 billion TEV combined company with expected higher earnings per share and well positioned for future growth • Appropriately leveraged balance sheet All positive steps toward a liquidity event for PECO I shareholders 14

For more information please contact: • Phillips Edison & Company: Michael Koehler, Director of Investor Relations InvestorRelations@PhillipsEdison.com (513) 338 - 2743 15

16 · Funds from Operations Funds from operations (“FFO”) is a non - GAAP performance financial measure that is widely recognized as a measure of REIT operati ng performance. We use FFO as defined by the National Association of Real Estate Investment Trusts (“NAREIT”) to be net income (loss), computed in accor dan ce with GAAP, adjusted for gains (or losses) from sales of depreciable real estate property (including deemed sales and settlements of pre - existing relationships ), plus depreciation and amortization on real estate assets and impairment charges, and after related adjustments for unconsolidated partnerships, joint ventures, and noncontrolling interests. We believe that FFO is helpful to our investors and our management as a measure of operating performance because, when compared year to yea r, it reflects the impact on operations from trends in occupancy rates, rental rates, operating costs, development activities, general and administrative exp enses, and interest costs, which are not immediately apparent from net income . FFO should not be considered as an alternative to net income (loss) or income (loss) from continuing operations under GAAP, nor as an indication of our liquidity, nor is this measure indicative of funds available to fund our cash needs, includ ing our ability to fund distributions, Accordingly, FFO should be reviewed in connection with other GAAP measurements. FFO should not be viewed as more prominent me asu res of performance than our net income or cash flows from operations prepared in accordance with GAAP. Our FFO, as presented, may not be comparable t o a mounts calculated by other REITs. Pro Forma Funds from Operations – FFO for the quarter ended March 31, 2017, pro forma for the transaction, is not reasonably reconcilable to net income at this time as purchase accounting and other non - cash transaction adjustments have not yet been completed. The following section presents our calculation of FFO and provides additional information related to our operations (in thousands ): RECONCILIATION OF NON - GAAP FINANCIALS 16

17 · 17 Same - Center Net Operating Income We present Same - Center NOI as a supplemental measure of our performance. We define NOI as total operating revenues, adjusted to exc lude lease buy - out income and non - cash revenue items, less property operating expenses and real estate taxes. Same - Center NOI represents the NOI for the 1 32 properties for PECO I and 71 for PELP that were owned and operational for the entire portion of both comparable reporting periods, except for those proper tie s we currently classify as redevelopment. A property is removed from the Same - Center pool and classified as redevelopment when it is being repositioned in the market and such repositioning is expected to have a significant impact on property operating income. While there is judgment surrounding chan ges in designations, once a redevelopment property has stabilized, it is typically moved to the Same - Center pool the following year. Currently, we have iden tified five properties that we classify as redevelopment properties. We believe that NOI and Same - Center NOI provide useful information to our investors about our financial and operating performanc e because each provides a performance measure of the revenues and expenses directly involved in owning and operating real estate assets and provides a per spective not immediately apparent from net income. Because Same - Center NOI excludes the change in NOI from properties acquired after December 31, 2014, and those considered redevelopment properties, it highlights operating trends such as occupancy levels, rental rates, and operating costs on properties that wer e o perational for both comparable periods. Other REITs may use different methodologies for calculating Same - Center NOI, and accordingly, our Same - Center NOI may not be com parable to other REITs. Same - Center NOI should not be viewed as an alternative measure of our financial performance since it does not reflect the operat ions of our entire portfolio, nor does it reflect the impact of general and administrative expenses, acquisition expenses, depreciation and amortization, inter est expense, other income, or the level of capital expenditures and leasing costs necessary to maintain the operating performance of our properties that could materiall y i mpact our results from operations. RECONCILIATION OF NON - GAAP FINANCIALS
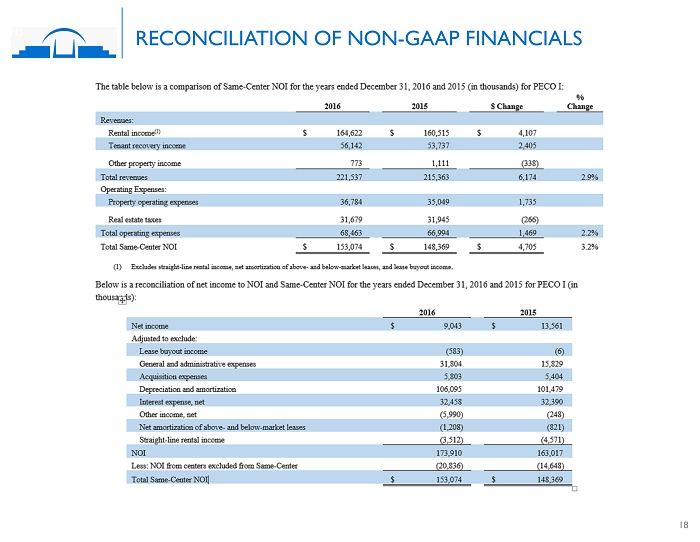
18 · 18 RECONCILIATION OF NON - GAAP FINANCIALS