Attached files
| file | filename |
|---|---|
| 8-K - FORM 8-K - ASB Bancorp Inc | v467441_8k.htm |
Annual Meeting of Shareholders May 18, 2017 Exhibit 99.1

2 This presentation, as well as other written communications made from time to time by the Company and its subsidiaries and oral communications made from time to time by authorized officers of the Company, may contain certain forward looking statements within the meaning of the Private Securities Litigation Reform Act of 1995 giving the Company’s and FBNC’s expectations or predictions of future financial or business performance or conditions. Forward - looking statements are typically identified by words such as “believe,” “expect,” “anticipate,” “intend,” “target,” “estimate,” “continue,” “positions,” “prospects” or “potential,” by future conditional verbs such as “will,” “would,” “should,” “could” or “may”, or by variations of such words or by similar expressions. Such forward - looking statements include, but are not limited to, statements about the benefits of the combination of the Company and FBNC, including future financial and operating results, expected cost savings, expected impact on future earnings, the combined company’s plans, objectives, expectations and intentions and other statements that are not historical facts. These forward - looking statements are subject to numerous assumptions, risks and uncertainties which change over time. Forward - looking statements speak only as of the date they are made and you are cautioned not to place undue reliance on any forward - looking statements. We assume no duty to update forward - looking statements . Forward - Looking Statements
3 In addition to factors previously disclosed in the Company’s and FBNC’s reports filed with the SEC, the following factors among others, could cause actual results to differ materially from forward - looking statements: ability to obtain regulatory approvals and meet other closing conditions to the Merger, including approval by the Company’s shareholders, on the expected terms and schedule; delay in closing the Merger; difficulties and delays in integrating the Company and FBNC businesses or fully realizing cost savings and other benefits; business disruption following the proposed transaction; changes in asset quality and credit risk; the inability to sustain revenue and earnings growth; changes in interest rates and capital markets; inflation; customer borrowing, repayment, investment and deposit practices; the introduction, withdrawal, success and timing of business initiatives; competitive conditions; the inability to realize cost savings or revenues or to implement integration plans and other consequences associated with mergers, acquisitions and divestitures; economic conditions; the reaction to the transaction of the companies’ customers, employees and counterparties; and the impact, extent and timing of technological changes, capital management activities, and other actions of the Board of Governors of the Federal Reserve and legislative and regulatory actions and reforms. Forward - Looking Statements (continued)
4 » Solid Franchise in Attractive Market Area » Significant Improvement in Key Performance Metrics » Strategic Initiative — Joining Forces with First Bank Investment Highlights

Solid Franchise in Attractive Market Area
6 » Headquartered in Asheville, North Carolina » Community bank founded in 1936 with total assets of $803 million at March 31, 2017 » 13 offices in 5 Western North Carolina counties » 153 full - time equivalent employees » Converted from the mutual form of ownership on October 11, 2011 » Announced signing of merger agreement with FBNC on May 1, 2017 ASBB Profile
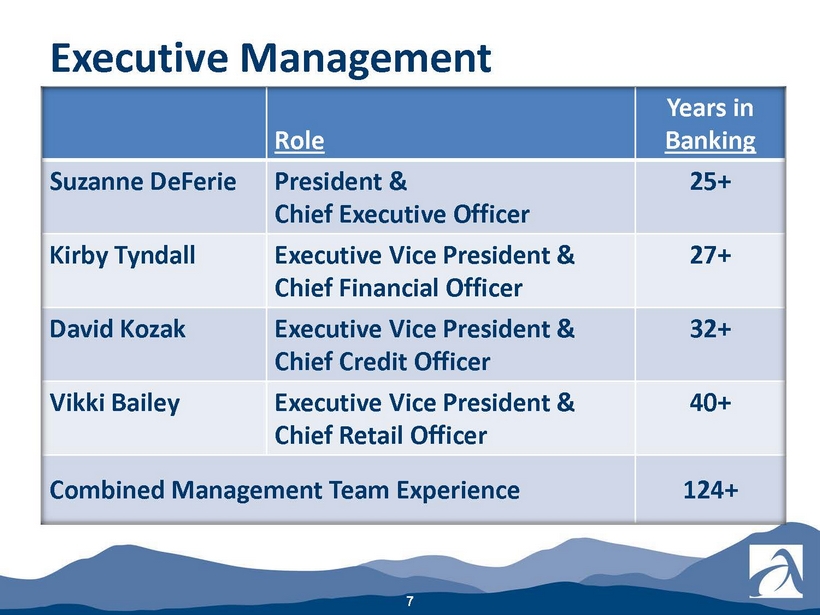
7 Executive Management Role Years in Banking Suzanne DeFerie President & Chief Executive Officer 25+ Kirby Tyndall Executive Vice President & Chief Financial Officer 27+ David Kozak Executive Vice President & Chief Credit Officer 32+ Vikki Bailey Executive Vice President & Chief Retail Officer 40+ Combined Management Team Experience 124+
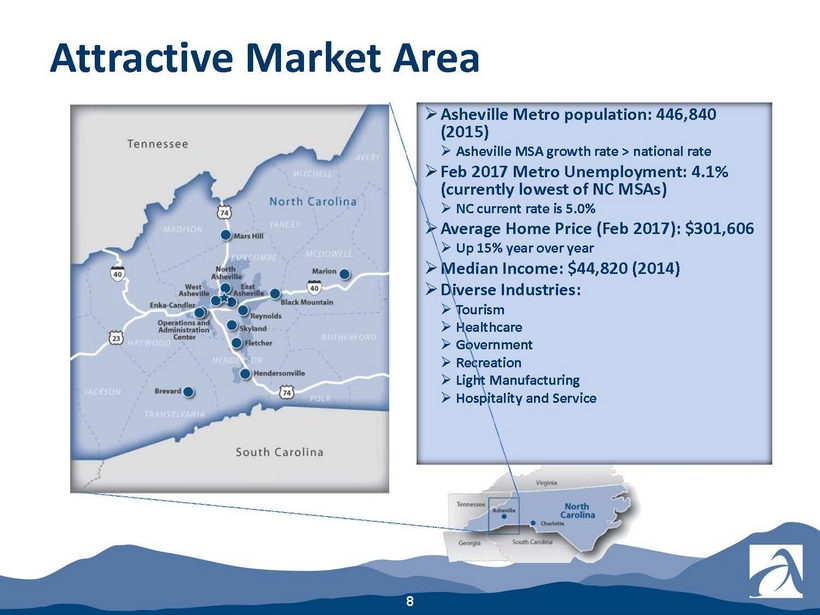
8 Attractive Market Area » Asheville Metro population: 446,840 (2015) » Asheville MSA growth rate > national rate » Feb 2017 Metro Unemployment: 4.1% (currently lowest of NC MSAs) » NC current rate is 5.0% » Average Home Price (Feb 2017): $301,606 » Up 15% year over year » Median Income: $44,820 (2014) » Diverse Industries: » Tourism » Healthcare » Government » Recreation » Light Manufacturing » Hospitality and Service
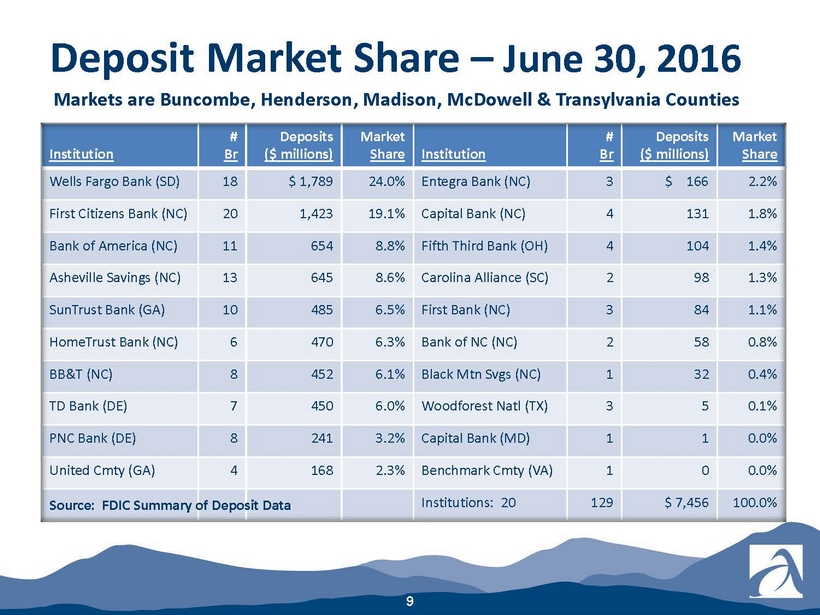
9 Deposit Market Share – June 30, 2016 Institution # Br Deposits ($ millions) Market Share Institution # Br Deposits ($ millions) Market Share Wells Fargo Bank (SD) 18 $ 1,789 24.0% Entegra Bank (NC) 3 $ 166 2.2% First Citizens Bank (NC) 20 1,423 19.1% Capital Bank (NC) 4 131 1.8% Bank of America (NC) 11 654 8.8% Fifth Third Bank (OH) 4 104 1.4% Asheville Savings (NC) 13 645 8.6% Carolina Alliance (SC) 2 98 1.3% SunTrust Bank (GA) 10 485 6.5% First Bank (NC) 3 84 1.1% HomeTrust Bank (NC) 6 470 6.3% Bank of N C (NC) 2 58 0.8% BB&T (NC) 8 452 6.1% Black Mtn Svgs (NC) 1 32 0.4% TD Bank (DE) 7 450 6.0% Woodforest Natl (TX) 3 5 0.1% PNC Bank (DE) 8 241 3.2% Capital Bank (MD) 1 1 0.0% United Cmty (GA) 4 168 2.3% Benchmark Cmty (VA) 1 0 0.0% Institutions: 20 129 $ 7,456 100.0% Markets are Buncombe, Henderson, Madison, McDowell & Transylvania Counties Source: FDIC Summary of Deposit Data
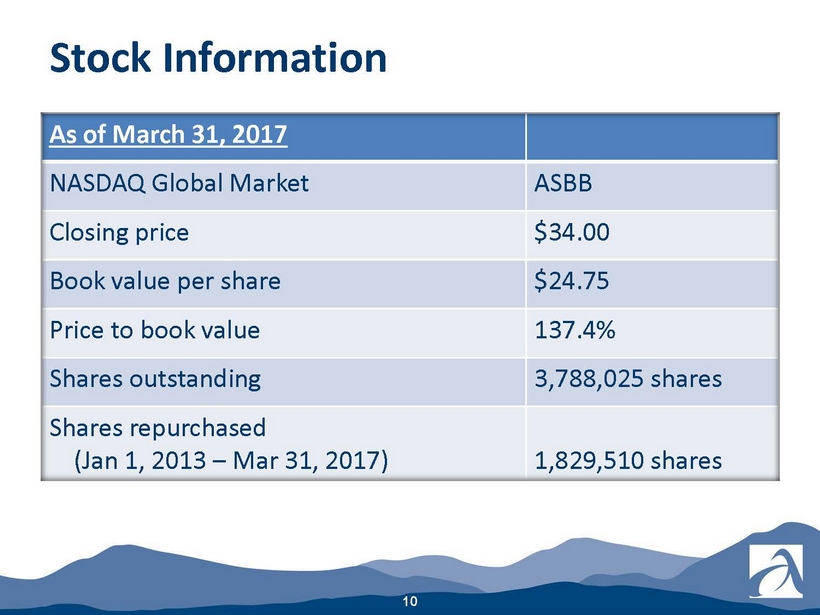
10 As of March 31, 2017 NASDAQ Global Market ASBB Closing price $34.00 Book value per share $24.75 Price to book value 137.4% Shares outstanding 3,788,025 shares Shares repurchased (Jan 1, 2013 ‒ Mar 31, 2017) 1,829,510 shares Stock Information

11 Change in Stock Price -10.00% 0.00% 10.00% 20.00% 30.00% 40.00% 50.00% 60.00% 70.00% Trailing Twelve Months ASBB (60.78%) SNL U.S. Bank $500M-$1B (42.73%) SNL U.S. Thrift $500M-$1B (35.55%) Source: SNL Financial, May 12, 2017

Significant Improvements in Key Performance Metrics
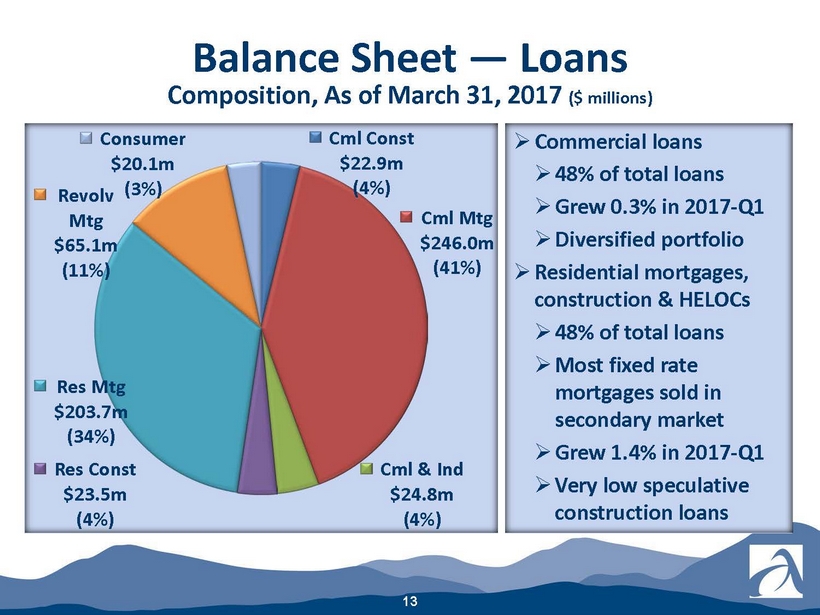
Balance Sheet — Loans Composition, As of March 31, 2017 ($ millions) 13 Cml Const $22.9m (4%) Cml Mtg $246.0m (41%) Cml & Ind $24.8m (4%) Res Const $23.5m (4%) Res Mtg $203.7m (34%) Revolv Mtg $65.1m (11%) Consumer $20.1m (3%) » Commercial loans » 48% of total loans » Grew 0.3% in 2017 - Q1 » Diversified portfolio » Residential mortgages, construction & HELOCs » 48% of total loans » Most fixed rate mortgages sold in secondary market » Grew 1.4% in 2017 - Q1 » Very low speculative construction loans
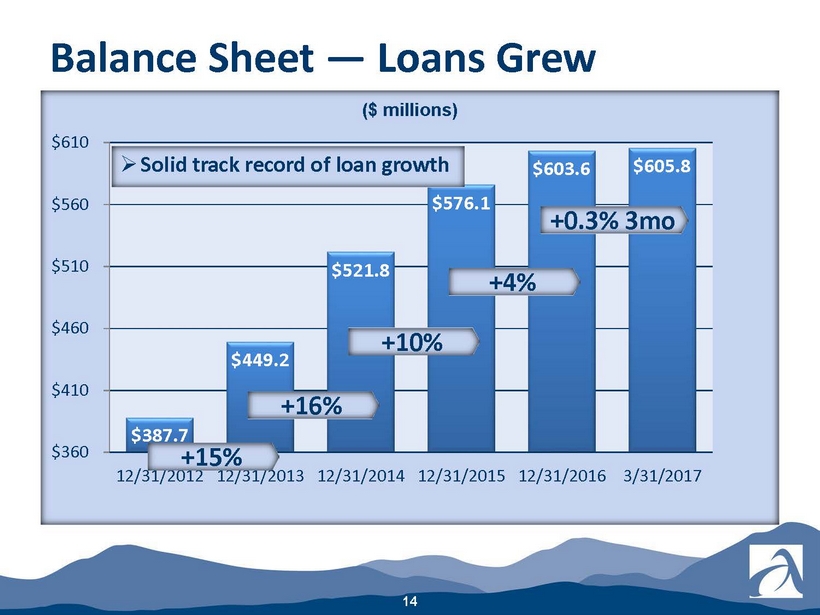
Balance Sheet — Loans Grew 14 $387.7 $449.2 $521.8 $576.1 $603.6 $605.8 $360 $410 $460 $510 $560 $610 12/31/2012 12/31/2013 12/31/2014 12/31/2015 12/31/2016 3/31/2017 ($ millions) +10% +16% » Solid track record of loan growth +15% +0.3% 3mo +4%
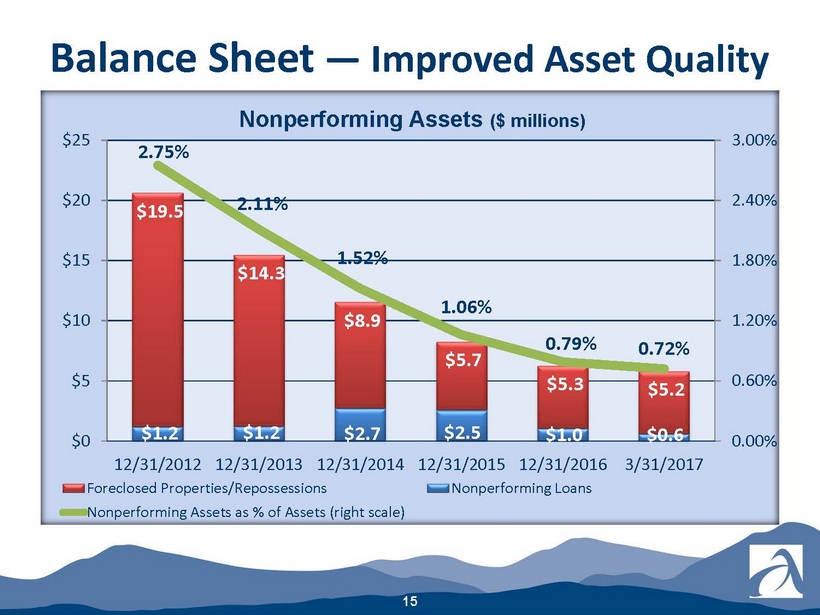
Balance Sheet — Improved Asset Quality 15 $1.2 $1.2 $2.7 $2.5 $1.0 $0.6 $19.5 $14.3 $8.9 $5.7 $5.3 $5.2 2.75% 2.11% 1.52% 1.06% 0.79% 0.72% 0.00% 0.60% 1.20% 1.80% 2.40% 3.00% $0 $5 $10 $15 $20 $25 12/31/2012 12/31/2013 12/31/2014 12/31/2015 12/31/2016 3/31/2017 Nonperforming Assets ($ millions) Foreclosed Properties/Repossessions Nonperforming Loans Nonperforming Assets as % of Assets (right scale)
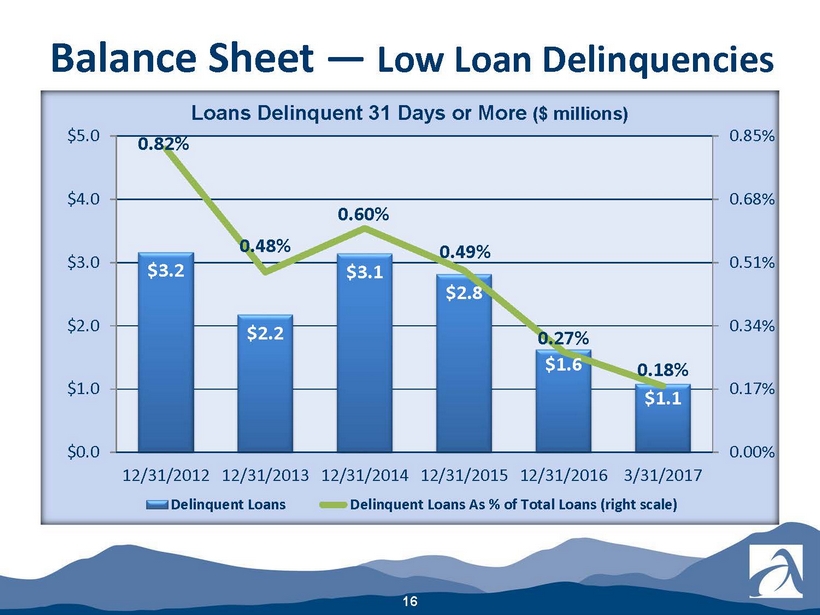
Balance Sheet — Low Loan Delinquencies 16 $3.2 $2.2 $3.1 $2.8 $1.6 $1.1 0.82% 0.48% 0.60% 0.49% 0.27% 0.18% 0.00% 0.17% 0.34% 0.51% 0.68% 0.85% $0.0 $1.0 $2.0 $3.0 $4.0 $5.0 12/31/2012 12/31/2013 12/31/2014 12/31/2015 12/31/2016 3/31/2017 Delinquent Loans Delinquent Loans As % of Total Loans (right scale) Loans Delinquent 31 Days or More ($ millions)
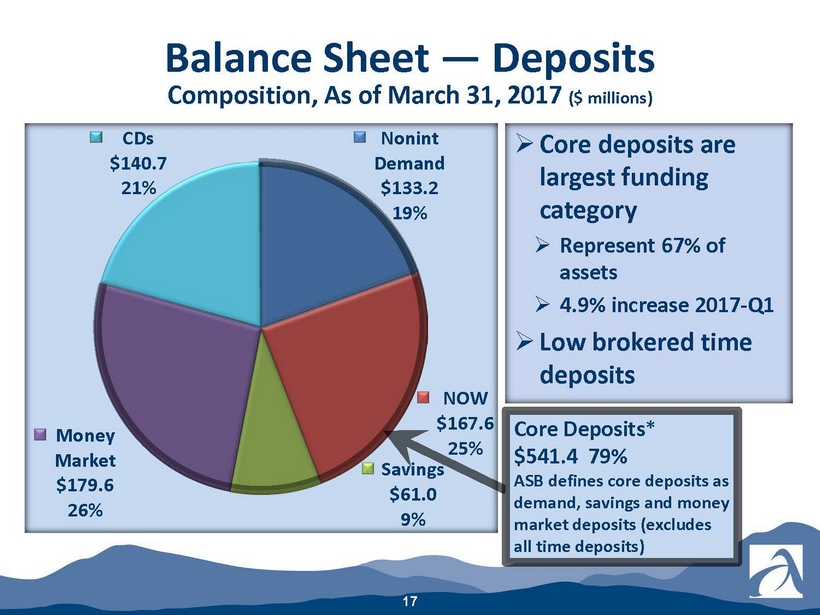
Balance Sheet — Deposits Composition, As of March 31, 2017 ($ millions) 17 Nonint Demand $133.2 19% NOW $167.6 25% Savings $61.0 9% Money Market $179.6 26% CDs $140.7 21% » Core deposits are largest funding category » Represent 67% of assets » 4.9% increase 2017 - Q1 » Low brokered time deposits Core Deposits * $541.4 79% ASB defines core deposits as demand, savings and money market deposits (excludes all time deposits)
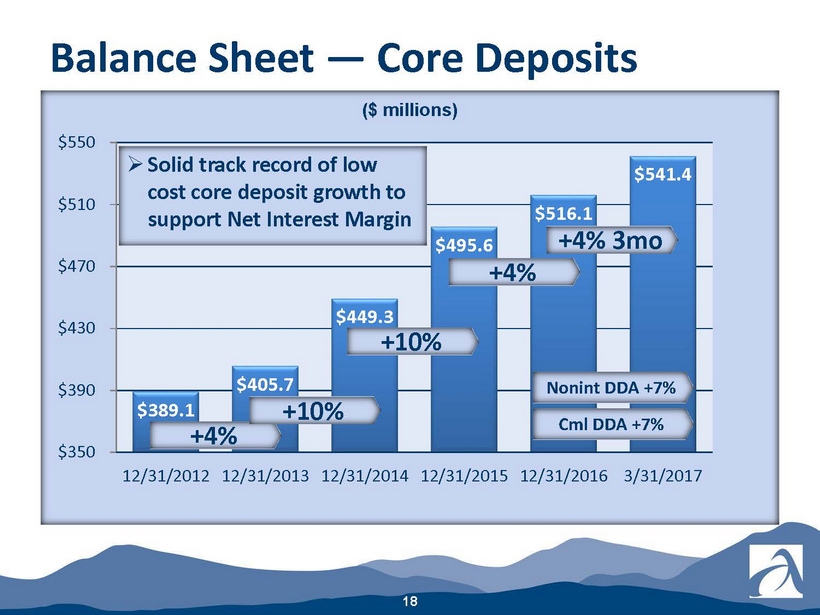
Balance Sheet — Core Deposits 18 $389.1 $405.7 $449.3 $495.6 $516.1 $541.4 $350 $390 $430 $470 $510 $550 12/31/2012 12/31/2013 12/31/2014 12/31/2015 12/31/2016 3/31/2017 ($ millions) » Solid track record of low cost core deposit growth to support Net Interest Margin +10% +4% Cml DDA +7% Nonint DDA +7% +4% 3mo +10% +4%

19 Balance Sheet — C ommercial C ore D eposits $85.3 $95.2 $121.6 $147.0 $155.3 $169.6 $70 $90 $110 $130 $150 $170 12/31/2012 12/31/2013 12/31/2014 12/31/2015 12/31/2016 3/31/2017 ($ millions) » Commercial deposits believed to be much less rate sensitive than retail deposits +28% +21% +9% 3mo +11% +5%
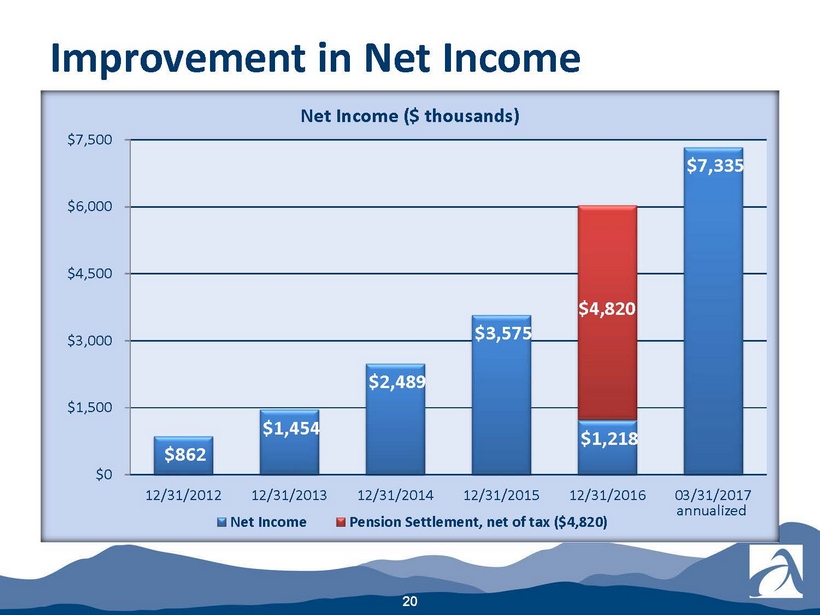
Improvement in Net Income 20 $862 $1,454 $2,489 $3,575 $1,218 $7,335 $0 $1,500 $3,000 $4,500 $6,000 $7,500 12/31/2012 12/31/2013 12/31/2014 12/31/2015 12/31/2016 03/31/2017 Net Income Pension Settlement, net of tax ($4,820) Net Income ($ thousands) $4,820 annualized
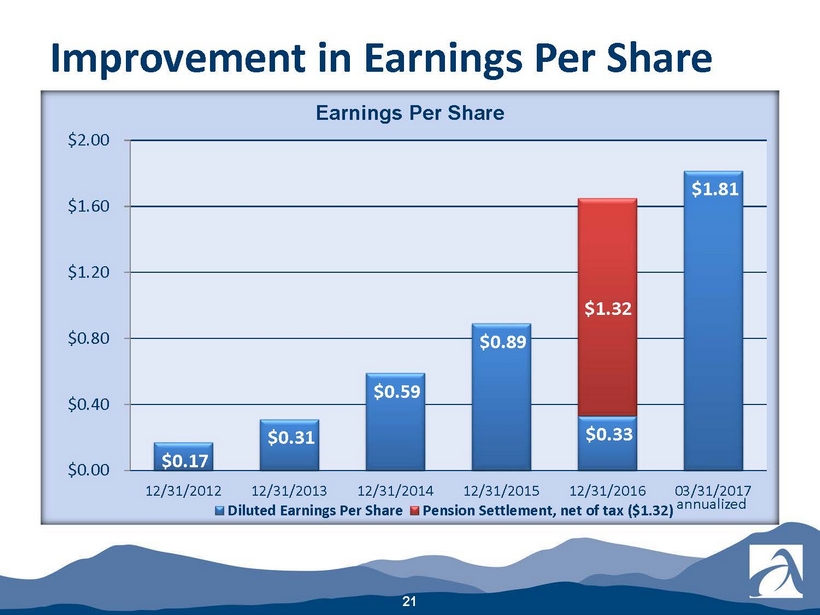
Improvement in Earnings Per Share 21 $0.17 $0.31 $0.59 $0.89 $0.33 $1.81 $0.00 $0.40 $0.80 $1.20 $1.60 $2.00 12/31/2012 12/31/2013 12/31/2014 12/31/2015 12/31/2016 03/31/2017 Diluted Earnings Per Share Pension Settlement, net of tax ($1.32) Earnings Per Share annualized $1.32

Improvement in Earnings Per Share 22 $0.30 $0.45 $0.48 $0.41 $0.50 ($1.00) ($0.67) ($0.33) $0.00 $0.33 $0.67 3/31/2016 6/30/2016 9/30/2016 12/31/2016 3/31/2017 Diluted Earnings Per Share Pension Settlement, net of tax Earnings Per Share by Quarter $(1.38)
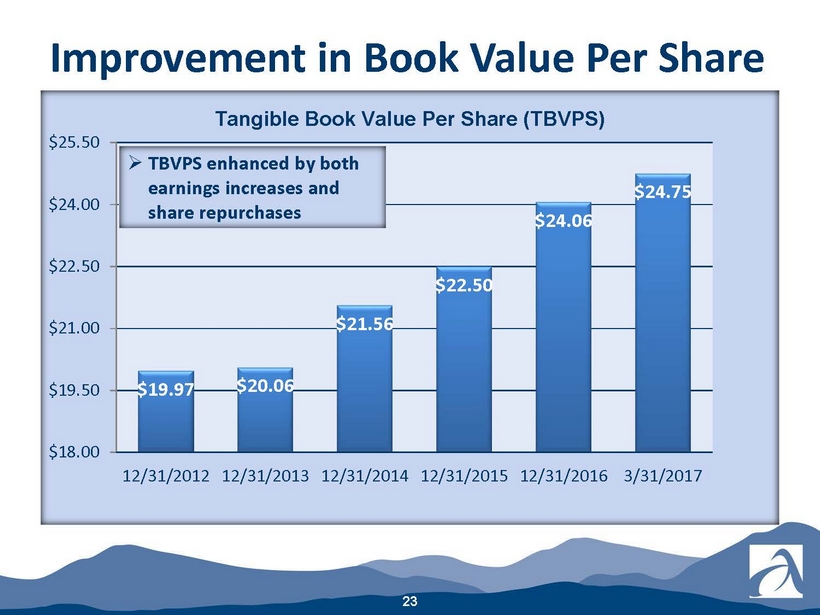
Improvement in Book Value Per Share 23 $19.97 $20.06 $21.56 $22.50 $24.06 $24.75 $18.00 $19.50 $21.00 $22.50 $24.00 $25.50 12/31/2012 12/31/2013 12/31/2014 12/31/2015 12/31/2016 3/31/2017 » TBVPS enhanced by both earnings increases and share repurchases Tangible Book Value Per Share (TBVPS)
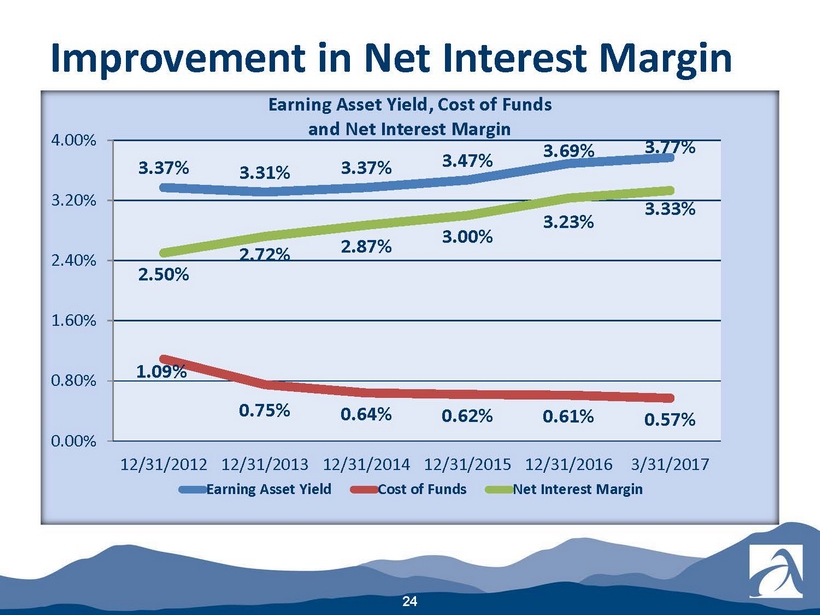
3.37% 3.31% 3.37% 3.47% 3.69% 3.77% 1.09% 0.75% 0.64% 0.62% 0.61% 0.57% 2.50% 2.72% 2.87% 3.00% 3.23% 3.33% 0.00% 0.80% 1.60% 2.40% 3.20% 4.00% 12/31/2012 12/31/2013 12/31/2014 12/31/2015 12/31/2016 3/31/2017 Earning Asset Yield Cost of Funds Net Interest Margin Earning Asset Yield, Cost of Funds and Net Interest Margin Improvement in Net Interest Margin 24
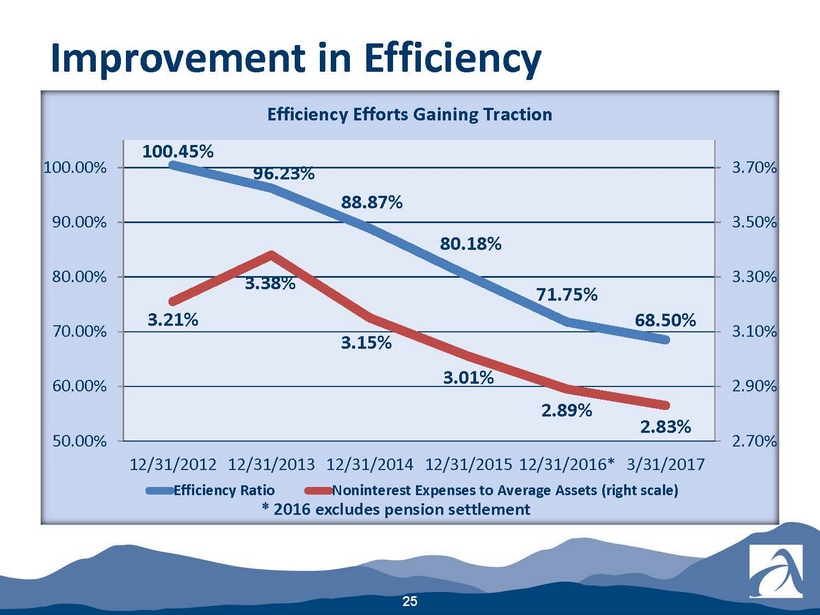
25 100.45% 96.23% 88.87% 80.18% 71.75% 68.50% 3.21% 3.38% 3.15% 3.01% 2.89% 2.83% 2.70% 2.90% 3.10% 3.30% 3.50% 3.70% 50.00% 60.00% 70.00% 80.00% 90.00% 100.00% 12/31/2012 12/31/2013 12/31/2014 12/31/2015 12/31/2016* 3/31/2017 Efficiency Ratio Noninterest Expenses to Average Assets (right scale) Efficiency Efforts Gaining Traction Improvement in Efficiency * 2016 excludes pension settlement

Strategic Initiative — Joining Forces With First Bank

27 Opportunity Overview & Rationale Branch Map Strategic Rationale ASBB : 13 branches FBNC : 96 branches » Create the premier independent North Carolina community bank with over $5bn in assets ; Top 3 position in attractive Asheville market ; Community focus and relationships ; Combined entity is well - positioned to significantly benefit from market disruption (SSB / PSTB; TOWN / PAG; PNFP / BNCN; FNB / YDKN; CBF / COB) » Financially compelling ; Mid - single digit EPS accretion ; Limited TBV dilution with earnback of ~2.5 years ; Improves ROA profile » Low risk ; Overlapping market presence ; Long management history in Asheville ; Internal and external detailed credit review ; ASBB CEO remains with combined company » Strong cultural fit ASBB Highlights Assets ($mm): $803.5 Loans ($mm): $605.8 Deposits ($mm): $682.1 Branches: 13 MRQ Core ROA 0.93% NPAs / Assets 0.72% TCE / TA 11.67% Source: SNL Financial, Company reports.
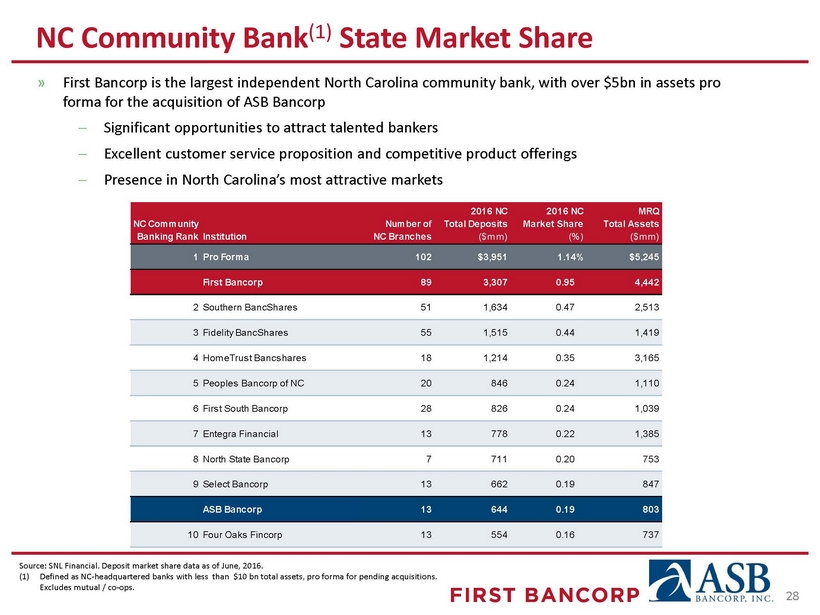
28 NC Community Bank (1) State Market Share Source: SNL Financial. Deposit market share data as of June, 2016. (1) Defined as NC - headquartered banks with less than $10 bn total assets, pro forma for pending acquisitions. Excludes mutual / co - ops. » First Bancorp is the largest independent North Carolina community bank, with over $5bn in assets pro forma for the acquisition of ASB Bancorp ; Significant opportunities to attract talented bankers ; Excellent customer service proposition and competitive product offerings ; Presence in North Carolina’s most attractive markets NC Community Banking RankInstitution Number of NC Branches 2016 NC Total Deposits ($mm) 2016 NC Market Share (%) MRQ Total Assets ($mm) 1Pro Forma 102 $3,951 1.14% $5,245 First Bancorp 89 3,307 0.95 4,442 2Southern BancShares 51 1,634 0.47 2,513 3Fidelity BancShares 55 1,515 0.44 1,419 4HomeTrust Bancshares 18 1,214 0.35 3,165 5Peoples Bancorp of NC 20 846 0.24 1,110 6First South Bancorp 28 826 0.24 1,039 7Entegra Financial 13 778 0.22 1,385 8North State Bancorp 7 711 0.20 753 9Select Bancorp 13 662 0.19 847 ASB Bancorp 13 644 0.19 803 10Four Oaks Fincorp 13 554 0.16 737

29 Asheville Market Demographic Overview 2014 – 2015 GDP Growth (%) Asheville MSA: Top 15 Banks by Market Share 2014 – 2016 Job Growth (%) Market Deposits Share Rank Company ($mm) (%) 1 Wells Fargo $1,750 23.8% 2 First Citizens 1,344 18.3 Pro Forma 649 8.8 3 Bank of America 602 8.2 4 HomeTrust 575 7.8 5 ASB Bancorp 565 7.7 6 SunTrust 543 7.4 7 BB&T 490 6.7 8 TD Bank 474 6.5 9 Entegra 200 2.7 10 PNC 198 2.7 11 United Community Banks 152 2.1 12 Capital Bank 131 1.8 13 Carolina Alliance 111 1.5 14 First Bancorp 84 1.2 15 Pinnacle 58 0.8 2.8% 3.0% 4.5% 5.2% 6.7% 6.8% 6.9% 9.4% Durham MSA Greensboro MSA Wilmington MSA Winston- Salem MSA Hickory MSA Charlotte MSA Asheville MSA Raleigh MSA (0.10%) 0.60% 0.80% 1.80% 4.20% 4.50% 5.30% 5.80% Hickory MSA Jacksonville MSA Burlington MSA Fayetteville MSA Durham MSA Greensboro MSA Asheville MSA Raleigh MSA Source: SNL Financial, United States Bureau of Economic Analysis, United States Bureau of Labor Statistics. Note: Market share data as of June, 2016.

Transaction Terms First Bancorp (Nasdaq: FBNC) Seller ASB Bancorp, Inc. (Nasdaq: ASBB) Stock Consideration 1.44 shares of FBNC stock for each share of ASBB stock, for 90% of ASBB shares (1) Aggregate Transaction Value $175 million (inclusive of value of options to be cashed out) (3) Pro Forma Ownership FBNC: 83% / ASBB: 17% (2) Board Representation 2 ASBB Board members will join the Board of FBNC Required Approvals ASBB shareholder vote and customary regulatory approvals 4 th Quarter 2017 Expected Closing Buyer 30 Indicative Price Per Share $43.12 (2) Cash Consideration $41.90 per share for 10% of ASBB shares (1) (1) Subject to a maximum issuance of no more than 19.9% of FBNC’s outstanding common shares. (2) Based on FBNC stock price of $30.04 as of April 28, 2017 and a cash payment of $41.90 per share. (3) Based on FBNC common shares outstanding of 24,663,241, ASBB common shares outstanding of 3,788,025 and stock options of 443,900 with a weighted average exercise price of $16.04 and a fixed exchange ratio of 1.44x.

(1) Based on ASBB’s tangible book value per share of $24.75 as of 3/31/17 (2) F or the quarter ended 3/31/17 (3) Based on ASBB’s closing price of $35.04 on April 28, 2017 and indicative price per share of $43.12. Transaction Multiples 31 Price / MRQ Annualized EPS 21.6x (2) Price / TBV 174% (1) Market Premium 23% (3)
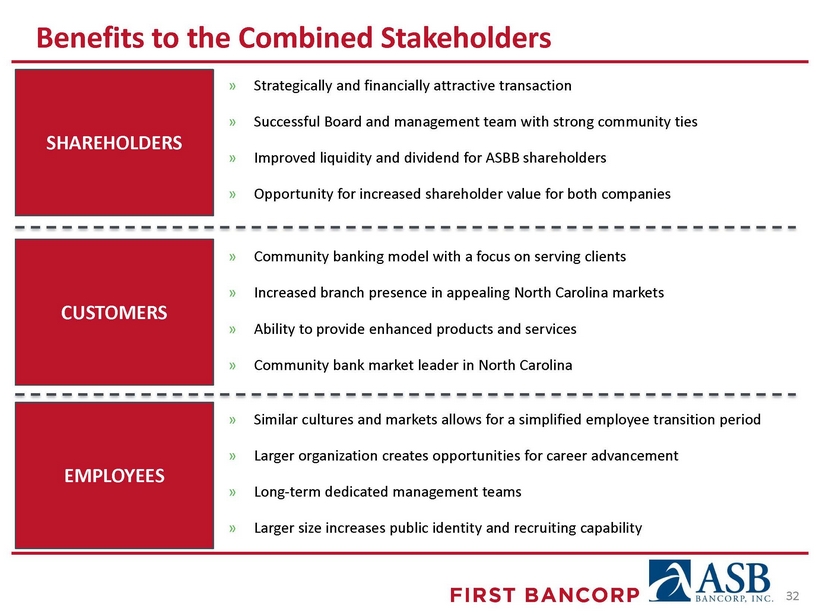
SHAREHOLDERS » Community banking model with a focus on serving clients » Increased branch presence in appealing North Carolina markets » Ability to provide enhanced products and services » Community bank market leader in North Carolina Benefits to the Combined Stakeholders » Strategically and financially attractive transaction » Successful Board and management team with strong community ties » Improved liquidity and dividend for ASBB shareholders » Opportunity for increased shareholder value for both companies » Similar cultures and markets allows for a simplified employee transition period » Larger organization creates opportunities for career advancement » Long - term dedicated management teams » Larger size increases public identity and recruiting capability CUSTOMERS EMPLOYEES 32
Additional Information About the Proposed Transaction Additional Information About the Proposed Transaction and Where to Find It This communication is being made in respect of the proposed transaction involving First Bancorp and ASB Bancorp, Inc. This material is not a solicitation of any vote or approval of ASB Bancorp, Inc.’s shareholders and is not a substitute for the proxy statement/prospectus or any other documents which First Bancorp and ASB Bancorp, Inc. may send in connection with the proposed merger . This communication does not constitute an offer to sell or the solicitation of an offer to buy any securities. In connection with the proposed transaction, First Bancorp intends to file with the SEC a Registration Statement on Form S - 4 tha t will include a proxy statement of ASB Bancorp, Inc. and a prospectus of First Bancorp, as well as other relevant documents concerning the pr opo sed transaction. Investors and security holders are also urged to carefully review and consider each of First Bancorp’s and ASB Ban corp, Inc.’s public filings with the SEC, including but not limited to their Annual Reports on Form 10 - K, their proxy statements, their Curre nt Reports on Form 8 - K and their Quarterly Reports on Form 10 - Q. ASB Bancorp, Inc. will mail the joint proxy statement/prospectus to the shar eholders of ASB Bancorp, Inc. BEFORE MAKING ANY VOTING OR INVESTMENT DECISIONS, INVESTORS AND SHAREHOLDERS OF ASB BANCORP, INC. ARE URGED TO CAREFULLY READ THE ENTIRE REGISTRATION STATEMENT AND PROXY STATEMENT/PROSPECTUS REGARDING THE PROPOSED MERGER WHEN IT BECOMES AVAILABLE AND ANY OTHER RELEVANT DOCUMENTS FILED WITH THE SEC, AS WELL AS ANY AMENDMENTS OR SUPPLEMENTS TO THOSE DOCUMENTS, BECAUSE THEY WILL CONTAIN IMPORTANT INFORMATION ABOUT THE PROPOSED TRANSACTION. Investors and security holders may obtain a free copy of the proxy statement/prospectus (when available) and other filings co nta ining information about First Bancorp and ASB Bancorp, Inc. at the SEC’s website at www.sec.gov. Investors and security holders may al so obtain free copies of the documents filed with the SEC by First Bancorp on its website at www.localfirstbank.com and by ASB Bancorp, In c. at www.ashevillesavingsbank.com. First Bancorp, ASB Bancorp, Inc. and certain of their respective directors and executive officers, under the SEC’s rules, may be deemed to be participants in the solicitation of proxies of ASB Bancorp, Inc.’s shareholders in connection with the proposed transaction. Information about the directors and executive officers of First Bancorp and their ownership of First Bancorp common stock is set forth in the p rox y statement for First Bancorp’s 2017 Annual Meeting of Shareholders, as filed with the SEC on Schedule 14A on March 27, 2017. Information about the directors and executive officers of ASB Bancorp, Inc. and their ownership of ASB Bancorp, Inc.’s common stock is set forth in the proxy statement for ASB Bancorp, Inc.’s 2017 Annual Meeting of Shareholders, as filed with the SEC on a Schedule 14A on April 5, 2017. Additional information regarding the interests of those participants and other persons who may be deemed participants in the transaction ma y be obtained by reading the proxy statement/prospectus regarding the proposed transaction when it becomes available. Free copies of this document may be obtained as described in the preceding paragraph. 33
Inquiries may be directed to : Suzanne DeFerie, President & Chief Executive Officer Kirby Tyndall, Executive Vice President & Chief Financial Officer