Attached files
| file | filename |
|---|---|
| EX-32.1 - EXHIBIT 32.1 - NEW RELIC, INC. | newr10kex321.htm |
| EX-31.2 - EXHIBIT 31.2 - NEW RELIC, INC. | newr10kex312.htm |
| EX-31.1 - EXHIBIT 31.1 - NEW RELIC, INC. | newr10kex311.htm |
| EX-23.1 - EXHIBIT 23.1 - NEW RELIC, INC. | newr10kex231.htm |
| EX-10.13 - EXHIBIT 10.13 - NEW RELIC, INC. | newr10kex1013.htm |
UNITED STATES
SECURITIES AND EXCHANGE COMMISSION
Washington, D.C. 20549
__________________________________________________________________
FORM 10-K
__________________________________________________________________
(Mark One)
☒ | ANNUAL REPORT PURSUANT TO SECTION 13 OR 15(d) OF THE SECURITIES EXCHANGE ACT OF 1934 |
For the fiscal year ended March 31, 2017
or
☐ | TRANSITION REPORT PURSUANT TO SECTION 13 OR 15(d) OF THE SECURITIES EXCHANGE ACT OF 1934 |
For the transition period from to
Commission File Number: 001-36766
__________________________________________________________________
New Relic, Inc.
(Exact name of registrant as specified in its charter)
__________________________________________________________________
Delaware | 26-2017431 | |
(State or other jurisdiction of incorporation or organization) | (I.R.S. Employer Identification No.) | |
188 Spear Street, Suite 1200
San Francisco, California 94105
(Address of principal executive offices, including zip code)
(650) 777-7600
(Registrant’s telephone number, including area code)
__________________________________________________________________
Securities registered pursuant to Section 12(b) of the Act:
Title of each class | Name of each exchange on which registered | |
Common Stock, par value $0.001 per share | New York Stock Exchange | |
Securities registered pursuant to Section 12(g) of the Act: None
__________________________________________________________________
Indicate by check mark if the registrant is a well-known seasoned issuer, as defined in Rule 405 of the Securities Act. Yes ☒ No ☐
Indicate by check mark if the registrant is not required to file reports pursuant to Section 13 or 15(d) of the Act. Yes ☐ No ☒
Indicate by check mark whether the registrant: (1) has filed all reports required to be filed by Section 13 or 15(d) of the Securities Exchange Act of 1934 during the preceding 12 months (or for such shorter period that the registrant was required to file such reports), and (2) has been subject to such filing requirements for the past 90 days. Yes ☒ No ☐
Indicate by check mark whether the registrant has submitted electronically and posted on its corporate Web site, if any, every Interactive Data File required to be submitted and posted pursuant to Rule 405 of Regulation S-T (§232.405 of this chapter) during the preceding 12 months (or for such shorter period that the registrant was required to submit and post such files). Yes ☒ No ☐
Indicate by check mark if disclosure of delinquent filers pursuant to Item 405 of Regulation S-K (§229.405) is not contained herein, and will not be contained, to the best of registrant’s knowledge, in definitive proxy or information statements incorporated by reference in Part III of this Form 10-K or any amendment to this Form 10-K. ☒
Indicate by check mark whether the registrant is a large accelerated filer, an accelerated filer, a non-accelerated filer, a smaller reporting company, or an emerging growth company. See the definitions of “large accelerated filer,” “accelerated filer,” “smaller reporting company,” and “emerging growth company” in Rule 12b-2 of the Exchange Act.
Large accelerated filer | ☒ | Accelerated filer | ☐ | |||
Non-accelerated filer | ☐ (Do not check if a small reporting company) | Small reporting company | ☐ | |||
Emerging growth company | ☐ | |||||
If an emerging growth company, indicate by check mark if the registrant has elected not to use the extended transition period for complying with any new or revised financial accounting standards provided pursuant to Section 13(a) of the Exchange Act. ☐
Indicate by check mark whether the registrant is a shell company (as defined in Rule 12b-2 of the Exchange Act). Yes ☐ No ☒
The aggregate market value of the voting and non-voting common equity held by non-affiliates of the registrant, based on the closing price of a share of the registrant’s common stock on September 30, 2016 as reported by the New York Stock Exchange on such date, was approximately $1,318,685,735. Shares of the registrant’s common stock held by each executive officer, director and holder of 10% or more of the outstanding common stock (as determined based on public filings) have been excluded in that such persons may be deemed to be affiliates. This calculation does not reflect a determination that certain persons are affiliates of the registrant for any other purpose.
As of May 11, 2017, there were 53,505,815 shares of the registrant’s common stock, par value $0.001 per share, outstanding.
Portions of the registrant’s Definitive Proxy Statement relating to the Annual Meeting of Stockholders are incorporated by reference into Part III of this Annual Report on Form 10-K where indicated. Such Definitive Proxy Statement will be filed with the Securities and Exchange Commission within 120 days after the end of the registrant’s fiscal year ended March 31, 2017.
TABLE OF CONTENTS
Page | ||
PART I | ||
Item 1. | ||
Item 1A. | ||
Item 1B. | ||
Item 2. | ||
Item 3. | ||
Item 4. | ||
PART II | ||
Item 5. | ||
Item 6. | ||
Item 7. | ||
Item 7A. | ||
Item 8. | ||
Item 9. | ||
Item 9A. | ||
Item 9B. | ||
PART III | ||
Item 10. | ||
Item 11. | ||
Item 12. | ||
Item 13. | ||
Item 14. | ||
PART IV | ||
Item 15. | ||
1
SPECIAL NOTE REGARDING FORWARD-LOOKING STATEMENTS
This Annual Report on Form 10-K contains forward-looking statements within the meaning of the federal securities laws, which statements involve substantial risks and uncertainties. Forward-looking statements generally relate to future events or our future financial or operating performance. In some cases, you can identify forward-looking statements because they contain words such as “may,” “will,” “should,” “would,” “shall,” “might,” “expects,” “plans,” “anticipates,” “could,” “intends,” “target,” “projects,” “contemplates,” “believes,” “estimates,” “predicts,” “potential,” or “continue” or the negative of these words or other similar terms or expressions that concern our expectations, strategy, plans, or intentions. Forward-looking statements contained in this Annual Report on Form 10-K include, but are not limited to, statements about:
• | our future financial performance, including our revenue, cost of revenue, gross profit, gross margin, operating expenses, ability to generate positive cash flow, and ability to achieve and maintain profitability; |
• | the sufficiency of our cash and cash equivalents to meet our working capital, capital expenditure, and liquidity needs; |
• | our ability to attract and retain customers to use our products, to optimize the pricing for our products, to expand our sales to our customers, and to convince our existing customers to renew subscriptions; |
• | the evolution of technologies affecting our products and markets; |
• | our ability to innovate and provide a superior user experience and our intentions and strategy with respect thereto; |
• | our ability to successfully penetrate enterprise markets; |
• | our ability to successfully expand in our existing markets and into new markets, including international markets; |
• | the attraction and retention of key personnel; |
• | our ability to effectively manage our growth and future expenses; |
• | our ability to maintain, protect, and enhance our intellectual property; |
• | worldwide economic conditions and their impact on spending; and |
• | our ability to comply with modified or new laws and regulations applying to our business, including privacy and data security regulations. |
We caution you that the foregoing list does not contain all of the forward-looking statements made in this Annual Report on Form 10-K.
You should not rely upon forward-looking statements as predictions of future events. We have based the forward-looking statements contained in this Annual Report on Form 10-K primarily on our current expectations and projections about future events and trends that we believe may affect our business, financial condition, operating results, and prospects. The outcome of the events described in these forward-looking statements is subject to risks, uncertainties, and other factors described in the section titled “Risk Factors” and elsewhere in this Annual Report on Form 10-K. Moreover, we operate in a very competitive and rapidly changing environment. New risks and uncertainties emerge from time to time, and it is not possible for us to predict all risks and uncertainties that could have an impact on the forward-looking statements contained in this Annual Report on Form 10-K. We cannot assure you that the results, events, and circumstances reflected in the forward-looking statements will be achieved or occur, and actual results, events, or circumstances could differ materially from those described in the forward-looking statements.
The forward-looking statements made in this Annual Report on Form 10-K relate only to events as of the date on which the statements are made. We undertake no obligation to update any forward-looking statements made in this Annual Report on Form 10-K to reflect events or circumstances after the date of this Annual Report on Form 10-K or to reflect new information or the occurrence of unanticipated events, except as required by law. We may not actually achieve the plans, intentions, or expectations disclosed in our forward-looking statements and you should not place undue reliance on our forward-looking statements. Our forward-looking statements do not reflect the potential impact of any future acquisitions, mergers, dispositions, joint ventures, or investments we may make.
2
PART I
Item 1. Business
Overview
We are defining a new category of enterprise software we call digital intelligence, designed to help companies see their business more clearly. Our cloud-based platform and suite of products, which we call the New Relic Digital Intelligence Platform, enable organizations to collect, store, and analyze massive amounts of data in real time so they can better understand their application and infrastructure performance, improve their digital customer experience, and achieve business success. We design all our products to be highly intuitive and frictionless; they are easy to deploy, and customers can rapidly, often within minutes, realize benefits and results. Software developers can build better applications faster, as they can see how their software will perform and is actually performing for end-users. IT operations teams can use our products to quickly find and fix performance problems as well as prevent future issues. Business users such as product managers can get answers to how their new product launch is being received, or how a pricing change impacted customer retention, without waiting for help from IT. For each of these audiences - software developers, IT operations, and business users - we aim to be the first, best place to look to understand their digital business.
Digital initiatives have become critical to the success of global businesses across industries. Software is driving modern customer experiences and is found in applications and throughout the architectures on which those applications run: servers, websites, operating systems, mobile devices, and other IT assets. The use of this software generates huge volumes of data about the end-user experience, how the application is performing, as well as the health of the underlying infrastructure. Historically, organizations collected and analyzed only a small fraction of this data due to technology and business constraints, including high costs and limited benefits, except for specific use cases such as application performance management, clickstream analysis, and web traffic measurement. Legacy software products were typically customized, expensive, required training, and thus limited to business-critical applications within large organizations. As a result, the vast majority of this data has been underutilized.
Fundamental technology and business trends are enabling digital intelligence today. First, organizations around the globe are adopting digital transformation strategies to meet the demands of an increasingly digitally savvy customer base. Second, companies are increasingly adopting cloud technologies, utilizing the cloud as a new foundational architecture to support their digital business. Both of these shifts have put tremendous pressure on internal technology teams to adapt to these new business demands. And, as a result, they are adopting new agile processes and DevOps practices that enable them to move to the cloud faster, and take advantage of modern infrastructure technologies like microservices and containers, in order to accelerate their pace of innovation and responsiveness of IT to business demands.
Amidst all of these changes to people, process, and technology, we saw the opportunity for our New Relic Digital Intelligence Platform to empower technology and business users to harness data in order to see their digital business more clearly. To do that, we provide customers with our software code, called agents, to add to their applications and infrastructure quickly and easily. These intelligent agents enable our users to identify vast amounts of data they would like to have sent to our cloud-based, big data database. Our database stores and organizes the data that we receive from our users for analysis through dynamic, real-time dashboards that users can easily configure to monitor their key metrics and events and quickly make queries using simple phrases. Our unified platform and intuitive product design results in users being able to quickly receive alerts and insights into their data. With this full-stack visibility, companies can significantly improve the quality of their digital initiatives, understand how their customers are engaging with their digital business in real-time, and scale the performance of their digital initiatives to confidently meet the demand of their busiest days.
Our New Relic Digital Intelligence Platform is made up of an integrated suite of products, a powerful big data database, and an open and extensible cloud platform. All of our products have a simple user interface, and require minimal training or integration. Our products for technology users focus on software performance management and monitoring and include New Relic APM (Application Performance Management), New Relic Mobile, New Relic Browser, New Relic Synthetics, and New Relic Infrastructure. Built into the core of our technology platform, New Relic Insights provides big data analytics to both business and technology users that enable them to easily extract actionable information from the massive quantities of data flowing through their software. In addition to these products, we offer key platform capabilities in the form of alerts and plugins. New Relic’s alerts capabilities offer policy management that delivers alerts across our entire suite of products. We also offer plugin architecture including application programming interfaces, or APIs, and software development kits, or SDKs, for customers and partners to embed and extend our platform into their products. Today, there are hundreds of plugins to extend our functionality to other applications and infrastructures including Amazon Web Services, Microsoft Azure, MongoDB, and Oracle mySQL.
3
Our go-to-market strategy centers on creating a frictionless experience for our customers, enabling them to quickly see results and share their insights broadly across their company. We combine grassroots user adoption with both low-touch and high-touch sales approaches. Our products are easy to download and use, which allowed us to build a large base of users and smaller organizations before we even began to grow and develop our enterprise sales organization. Over time, users within larger organizations began to grow our footprint within their companies, as they often purchase our products for a specific use case and subsequently expand their use of our products. This has led many of our top customers to develop into accounts with hundreds of users across multiple roles, each accessing a common set of data through the New Relic Digital Intelligence Platform to deliver real-time visibility into the performance of their digital business. Today, we have a direct enterprise sales and support operation in order to better market to and service the enterprise market, which now represents a majority of our revenue growth.
We have achieved rapid customer adoption, high customer retention, and significant growth since our founding. For our fiscal years ended March 31, 2017, 2016, and 2015, our revenue was $263.5 million, $181.3 million, and $110.4 million, respectively, representing year-over-year growth of 45% from the fiscal year ended March 31, 2016 to the fiscal year ended March 31, 2017, and 64% from the fiscal year ended March 31, 2015 to the fiscal year ended March 31, 2016. We had net losses of $61.1 million, $67.5 million, and $50.1 million for our fiscal years ended March 31, 2017, 2016, and 2015, respectively.
We were formed in Delaware in September 2007 as New Relic Software, LLC. We converted from a Delaware limited liability company to a Delaware corporation and changed our name to New Relic, Inc. in February 2008. Our principal executive offices are located at 188 Spear Street, Suite 1200, San Francisco, California 94105, and our telephone number is (650) 777-7600. Our website address is www.newrelic.com. Information contained on, or that can be accessed through, our website is not intended to be incorporated by reference into this Annual Report on Form 10-K and references to our website address in this Annual Report on Form 10-K are inactive textual references only. We completed our initial public offering in December 2014 and our common stock is listed on the New York Stock Exchange under the symbol “NEWR.” Unless the context requires otherwise, the words “New Relic,” “we,” “Company,” “us,” and “our” refer to New Relic, Inc. and our wholly owned subsidiaries. “New Relic,” the New Relic logo, and other trademarks or service marks of New Relic that may appear in this Annual Report on Form 10-K are our property. This Annual Report on Form 10-K contains additional trade names, trademarks, and service marks of other companies. We do not intend our use or display of other companies’ trade names, trademarks, or service marks to imply a relationship with, or endorsement or sponsorship of us by, these other companies.
Our Solution
We have developed the New Relic Digital Intelligence Platform suite of products, big data database, and open platform to help technology and business users make real-time, data-driven decisions to improve business and IT performance. In addition, developers and operations teams can quickly build better software, and keep it running optimally across a dynamic infrastructure - ultimately delivering better end-user experiences for their customers. Our platform enables users to collect, store, and analyze vast quantities of data flowing through and about their software.
We currently offer an integrated suite of products and platform capabilities that we continue to enhance and expand, which most notably include:
• | New Relic APM: Application performance monitoring |
• | New Relic Mobile: Mobile application performance monitoring |
• | New Relic Browser: End-user experience monitoring and performance monitoring |
• | New Relic Synthetics: Software testing through simulated usage |
• | New Relic Infrastructure: Complete visibility across dynamic infrastructure |
• | New Relic Insights: Real-time big data analytics for business managers |
This suite of products and platform capabilities use a common infrastructure to enable customers to:
• | Collect. Our intelligent agents are software code that developers and operations teams easily deploy into their applications and related IT infrastructure, including physical and virtual servers, browsers, and mobile devices. These agents configure automatically to their particular IT environment and securely collect and send event and performance data that is defined by the customer to our proprietary cloud database. The agents typically send this information once a minute, and are designed to cause minimal latency on the application. |
4
• | Store. Data received from the agents deployed by our customers is stored in our highly secure and scalable cloud-based, big data database. Our database has been crafted so that our customers do not need to build or maintain their own big data solution for digital intelligence. We have optimized this database to store data as well as handle the analytics and queries that we believe are important to drive decision making. Customers can easily define which data they want to collect and store for analysis. |
• | Analyze. Our simple and intuitive user interface consists of a dashboard of graphical charts for key performance indicators, which are easily configurable and enable deep drill-down and root cause analysis. Our New Relic Insights product includes two ways for technical and non-technical users to drill down into their data, diagnose problems, and make more informed decisions. New Relic Insights offers a visual data explorer that enables a user to understand data attributes, and drill down on graphs and attributes utilizing an intuitive point-and-click interface. New Relic Insights also offers a field for queries utilizing the New Relic Query Language, or NRQL, similar to the commonly used Structured Query Language, or SQL. Users can type a simple query into the NRQL field and receive the answer in a range of visual and graphical formats. We also provide a feature within New Relic Insights called Data Apps that enables users to create and publish a set of customer-curated dashboards, along with an optional search field, for use by non-technical business users. |
Key Elements of Our Solution
• | SaaS-Based Delivery Model. We designed our products based on cloud architecture and a SaaS delivery model. We are able to provide frequent updates to our software, enabling us to continuously improve it to reflect technology developments. This approach delivers a wide range of technology and financial benefits over on-premise architectures, including potential faster time to market, accelerated return on investment, and lower total cost of ownership for our customers. |
• | Scalable, Flexible Cloud Architecture. Our customers can collectively analyze billions of data points every second. Because we built our technology with a multi-tenant cloud architecture, customers can leverage its scale to rapidly run queries and get answers—without having to build their own expensive infrastructure. |
• | Flexibility to Monitor Cloud, Hybrid, and On-Premise Architectures. In addition to modern cloud architectures, our SaaS solution can monitor hybrid cloud and heterogeneous architectures, including on-premise software. Users are able to rapidly deploy our agents globally across their IT environment. New Relic Infrastructure includes native integrations with more than a dozen of the most popular services from Amazon Web Services. |
• | Built for Modern Software. We support a broad range of software development languages from the widely used Java and .NET, to more modern languages such as Python, Go, and Node.js, frameworks including AngularJS, React, Ember, Backbone.js, as well as mobile operating systems, including iOS and Android. Our agents are easily embedded into applications built using all of these languages, without the need for customized coding. |
• | Mobile Enabled. We provide a native mobile version of our digital intelligence products with nearly all functionality accessible and usable through mobile devices. Our products are designed to anticipate and handle the complexity of mobile architectures, such as mobile carrier performance and user location. |
• | Big Data Database and Analytics. Our proprietary, cloud-based database leverages modern big data technologies, including in-memory storage and distributed clustering techniques, which enable our users to collect and store billions of events and data points each day. Our database structure allows customers to easily build dashboards or make queries to deliver real-time insights. |
• | Easy and Intuitive. We design our products to be simple, intuitive, and user-friendly. Users are able to learn, deploy, and begin using our products with minimal or no training, often within a few minutes. This is important for developers and operations teams who do not need to do extra coding or configuration to use our products. It is also important for business and technical users who can leverage our products to augment their existing knowledge of applications and infrastructure. |
• | Low Total Cost of Ownership. We price our products on a subscription basis, with flexible pricing plans so each customer is only paying for the products and usage they are consuming. Our customers do not need to invest in additional hardware, infrastructure, or services to utilize our products. |
• | Integrated Suite. Our products and platform capabilities share a common design and user interface, and access the same cloud-based database structure. Users can move seamlessly among different analytic categories and use cases for their data. Users are able to easily add additional products to extend their ability to obtain insights from their same or new portions of their data. |
5
• | Extensible Platform. We provide APIs and SDKs for customers, partners, and developers to easily build applications that integrate with and embed our product functionality into other applications. Today, there are hundreds of plugins developed internally or by third parties making it even easier to embed our products into specific use cases. This enables our users to tailor our products to specific use cases and industries beyond the programming languages, frameworks, and operating systems that we support. |
• | Enterprise Grade Security. Our products are designed to be secure. By default, our data transmissions are encrypted in transit and stored in our secure tier 3 SSAE-16 certified data center. We also perform an annual SOC-2 type 2 audit. In addition, our management tools provide administrators with highly granular security controls including user provisioning, access, and privileges. |
Benefits of Our Solution
• | Software Developers. Software developers and modern DevOps teams can use our products to monitor a broad range of traditional and modern development languages and frameworks. With our products, they can better monitor software performance to continuously improve it as well as fix and prevent problems. Developers can build better software, build it faster, and keep it running optimally for better end-user experiences. |
• | IT Operations Users. Technology users can easily deploy our products across their IT architectures to monitor overall health and performance. They can more rapidly identify problems, isolate root causes, and address problems. Our analytics tools also enable them to prevent future issues. |
• | Business Users. Line of business managers can use our products to obtain deep real-time analytics about their business. They are able to access, interact, and analyze various dimensions of massive amounts of application, customer experience, and business data to drive business outcomes when traditional on-premise solutions have struggled to keep up with the scale and variety of data. Business users are also able to easily configure their graphical dashboards of key performance indicators, or quickly make queries, without needing to wait for a data scientist to design a new report or program a new query. |
Limitations of Existing Solutions
A number of legacy and emerging companies provide products to collect and analyze data for business and technology managers. However, these suffer from a range of limitations including:
• | Difficult and Time-Consuming. Existing solutions typically require developers and technology and business users to undergo upfront and ongoing user training to learn. The solutions are often customized and provisioned over the course of several months through the central IT function. Any changes to the collection, storage, or analyses of data needs to go through the IT group or specialized data scientists. |
• | High Total Cost of Ownership. The majority of existing products has been deployed on-premise, requiring substantial upfront investments in IT infrastructure and extensive implementation, customization, maintenance, and training costs. Organizations often choose not to deploy these products, or postpone implementations of upgraded versions, due to concerns relating to the substantial costs involved. |
• | On-Premise Architectures. Solutions built for legacy, on-premise architectures are highly customized, expensive to purchase and operate, and require frequent upgrades and maintenance. In addition, they are fundamentally unable to adapt to cloud architectures and SaaS models. They typically rely on systems to collect, store, and analyze data which are highly specific to the particular customer’s software applications and environment at a point in time. For example, the agents for collecting data need to be highly customized and typically involve significant latency to send data. |
• | Support Limited to Legacy Software. Developers using new languages and frameworks to build modern software need solutions that understand them. Most legacy solutions were built to understand COBOL, C++, Java, and .NET. However, modern languages and frameworks such as Python, Go, and Node.js represent a large and growing proportion of applications and websites. Companies of all sizes, from start-ups to the largest enterprises, require an APM solution that can monitor both legacy and modern applications. |
• | Lack of Support for Mobile Devices and Applications. Legacy solutions were typically designed for business or technology users sitting at their desktop. Today’s users increasingly expect and need to be able to do their jobs outside their office, wherever and whenever they want, on a variety of mobile devices. In addition, both legacy applications running on mobile devices and native mobile applications involved different architectures and are very difficult to be managed by systems designed to work on-premise. |
6
• | Lack of Big Data and Analytics. Existing solutions typically use structured transactional data, representing a small and shrinking portion of performance and event data. This significantly limited the types, timeliness, and flexibility of analyses they could support. Big data analytics are typically cost prohibitive for all but the largest organizations. |
• | Fragmented Point Solutions. Existing solutions were built for a wide range of specific use cases which had to be business or technology critical, such as traditional application performance management, CRM or ERP analytics, or clickstream analysis. These products addressed limited use cases and were not integrated with other applications, forcing businesses to select and integrate solutions from a variety of vendors, resulting in siloed analytics. |
Our Technology
Intelligent Software Agents
We have developed a library of purpose-built intelligent software agents that supports a wide variety of programming languages, mobile platforms, and operating systems. Our agent software code is deployed easily and quickly onto application servers, browsers, mobile devices, and operating systems. We currently provide intelligent software agents that support the following:
Programming Languages | Mobile Platforms | Operating Systems | ||
.NET | Android | Linux | ||
Java | iOS | Windows | ||
JavaScript | ||||
Node.js | ||||
PHP | ||||
Python | ||||
Ruby | ||||
Go | ||||
Once integrated, our agents quickly recognize their IT environment and configure themselves automatically. They then enable our users to collect performance and event data that is defined by the customer and report it each minute, on average, to our cloud-based database for storage and analysis.
Big Data Database and Analytics
Our cloud-based, big data database can store and prepare massive amounts of data for rapid analysis and flexible querying. Our New Relic Insights application, which utilizes a flexible and schema-less database architecture optimized for event data, allows seamless storage of new data types including data collected by agents and through our APIs, does not require indexing, and runs in a super-cluster with massive amounts of computing resources to query billions of events in real-time.
We provide a “single pane of glass” view into all of our applications with diagnostic capabilities including transaction details, database details, error details, topology maps, code deployment reports, and service level reports. Our user interfaces were built internally using modern web and mobile technologies, including HTML5 and JavaScript to deliver interactive and actionable data visualization such as charts and graphs that continuously refresh to provide real-time visibility. Users can interact with New Relic Insights through an easy-to-use, point and click data explorer or by using NRQL, which is a modified version of SQL, a language with which developers and many business analysts are already familiar. Users also have the choice of electing to integrate data received from the intelligent software agents they deploy and stored by us into other analytics applications and user interfaces of their choice.
Our Products and Platform Capabilities
We offer multiple tiers of our products to service customers of all sizes. At one end, our Lite version is offered at no charge to users and has basic functionality, 24-hour retention of data, and community support. At the other end, our paid Enterprise version includes the highest level of product functionality, our highest levels of support, a dedicated technical account manager, and defined service levels.
7
The New Relic Digital Intelligence Platform is an integrated suite of SaaS-based products, built on top of a common technology platform. The New Relic Digital Intelligence Platform is comprised of the following products:
New Relic APM
New Relic APM provides visibility into the performance and usage of server-based applications, such as data pertaining to response time, transaction throughput, error rates, top transactions, and user satisfaction. Other elements of New Relic APM include:
• | Comprehensive Diagnostics. New Relic APM provides a comprehensive set of features, including transaction tracing, x-ray sessions, cross application tracing, thread profiling, database diagnostics, and slow SQL traces. These give users visibility into the underlying source code which can significantly reduce the time needed to identify and fix the root cause of a problem by helping users pinpoint the exact lines of code causing the problem. |
• | Reporting and Alerts. New Relic APM provides reporting and alerts functionality through standard configurations as well as customer-defined policy configurations. These alerts include application performance degradation, falling traffic, and declining user satisfaction metrics. Alerts can be delivered through a variety of channels including email, text messages, push notifications, and social channels and can be integrated with bug tracking systems and group chat applications. |
• | Business Transaction Monitoring. Within New Relic APM, our key transactions feature enables business users to collect and analyze data generated by business transactions separately from data about application performance. |
New Relic Mobile
New Relic Mobile provides code-level visibility into the performance and health of mobile applications running on the iOS and Android mobile operating systems. Other elements of New Relic Mobile include:
• | End-to-End Visibility. When combined with New Relic APM, New Relic Mobile provides end-to-end visibility into the IT infrastructure affecting mobile application performance. Native mobile applications depend on code running on the device and on communications with backend services, such as mobile application servers, both internal and third party. New Relic Mobile provides code-level diagnostics for native app code running on the mobile device and enables performance, throughput, crash reporting, and error analysis for the interactions between the mobile application and the supporting backend services. |
• | Mobile Device Metrics. New Relic Mobile provides detail on usage of mobile device resources, including CPU, memory, and network bandwidth from actual user devices. This visibility helps developers understand how their applications affect their customers’ devices, and how to optimize them. |
• | User Interactions. The User Interactions feature provides detailed breakdowns of time spent in the code running on the device, including view loading, method calls, and data store activity. Mobile application developers leverage this feature to pinpoint problematic code and resolve problems. |
New Relic Browser
New Relic Browser monitors the page view experiences of actual end-users for desktop and mobile browser-based applications and provides code-level diagnostics for JavaScript code running directly in the browser. Other elements of New Relic Browser include:
• | End-User Experience Monitoring. New Relic Browser monitors the page load time for user interactions, providing data on how time is spent during each page load, including network time, request queuing, document object model processing, and page rendering. Customers utilize this data to improve the user experience by implementing caching techniques, reducing asset sizes, and leveraging content delivery network services. New Relic Browser supports the next generation of web applications built with current and future single-page application, or SPA, frameworks and libraries, including AngularJS, React, Ember, and Backbone.js. |
• | JavaScript Code Diagnostics. Web applications increasingly embed application logic into JavaScript code running within the user’s browser to build richer, browser-based applications. New Relic Browser provides developers with code-level visibility into the performance of JavaScript code within users’ browsers. |
• | Browser Comparison. Developers can compare how their software performs on various desktop and mobile browsers and versions, in order to identify browser-specific problems. |
8
• | Geographic Performance. New Relic Browser can automatically identify, track, and analyze the geographic location of each page view to provide performance analytics by geography, including response time, user satisfaction, application adoption, and usage trends. |
New Relic Synthetics
New Relic Synthetics simulates usage and reproduces business-critical functionality that enables our users to test their software throughout the entire development life cycle. Users benefit from enhanced visibility, availability, and reliability of their software without depending on interactions from real users. Other elements of New Relic Synthetics include:
• | Standards-Based. New Relic Synthetics uses open standards, including the open source scripting language Selenium, to make it easy to quickly get started and automate tests. |
• | Deep Integration. New Relic Synthetics is integrated into our product suite, including New Relic APM, New Relic Browser, and New Relic Insights. |
• | Global Test Locations. Users can select what region they want their test scripts to run from, giving them visibility into the regional performance of their web application. |
• | Private Locations. Users can also run test scripts on their own systems, offering even more choice for users to test the performance of their applications from around the globe. |
• | Preemptive Visibility. Users can resolve issues with business-critical transactions before end-users experience them. |
New Relic Infrastructure
New Relic Infrastructure is designed to give IT operations teams visibility into the health performance of their dynamic infrastructure, whether that runs in the cloud, on-premise or in a hybrid environment. It is designed to provide greater control of these environments to for our customers. Elements of New Relic Infrastructure include:
• | Precise Picture of Dynamically-Changing Systems. New Relic Infrastructure delivers real-time health metrics correlated with recent configuration changes, allowing operations teams to quickly resolve issues, scale rapidly, and deploy intelligently. |
• | Move Fast and Deploy with Confidence. New Relic Infrastructure allows customers to move fast and deploy with confidence by correlating configuration changes with health metrics in real time. New Relic Infrastructure is designed with a powerful infrastructure-wide search across every host in order to enable teams to find inconsistent configurations to detect and resolve issues quickly. |
• | Scale and Adapt. New Relic Infrastructure is designed to scale and adapt to diverse environments with any combination of cloud instances, microservices, containers, or traditional servers. |
New Relic Insights
New Relic Insights enables technology and business users to perform real-time analysis in order to make faster, data-driven decisions about their organizations.
New Relic Insights is both a standalone product and an integrated platform feature and includes eight days of event data retention with paid subscriptions of our New Relic APM, New Relic Browser, and New Relic Mobile products. Users can query their data in either a curated or ad hoc fashion. For predictable queries that provide visibility into application performance, we offer a curated experience directly within New Relic APM, New Relic Browser and New Relic Mobile. And, to perform ad hoc, deeper investigations into an issue, we enable users to uncover the root cause through the New Relic Insights product interface.
Other elements of New Relic Insights include:
• | Iterative Business Intelligence and Analytics. New Relic Insights is built on a proprietary event database, which is our purpose-built event database that runs in a cloud-hosted, highly distributed super-cluster. The database was built to query billions of data points in less than a second, enabling users to perform ad-hoc analytics of business data in real time through a point and click Data Explorer or through a NRQL query. It collects and stores this data from software sources including our New Relic Browser, New Relic Synthetics, New Relic APM and New Relic Mobile products. |
9
• | New Relic Query Language. We developed NRQL as a SQL-like query language optimized for real-time analytics. Users with experience with SQL can use NRQL immediately. The language is also easy to learn for non-technical users and users with no SQL experience. NRQL has autocomplete capabilities that assist users by providing proper syntax as they type, suggesting built-in analytics functions, and can list the attributes and event types available for querying. |
• | Data Visualizations and Dashboards. New Relic Insights produces intuitive data visualizations with every query, with pre-built charts and graphs to make the analysis easier to understand and share. Dashboards automatically update and refresh in real-time by continuously executing NRQL queries. New Relic’s real-time dashboards enable teams to instantly visualize performance for a specific incident time window as well as increase the depth of information available in a single dashboard, providing for more intelligent monitoring. Additionally, hundreds of pre-built charts from across the platform can be added to any New Relic Insights dashboard with a few clicks, and as a result teams do not have to start with a blank slate. Company-wide dashboards unlock even more power for New Relic’s customers, by providing a master view of any number of business units or subsidiaries, helping teams more quickly share data across their organization and up to their executive leadership. |
The New Relic Digital Intelligence Platform also features the following platform capabilities:
New Relic's Alerts
New Relic’s alerts platform is a centralized notification system that delivers alerts from across the products in the New Relic Digital Intelligence Platform. It allows users to manage alert policies and alert conditions in order to receive early notification to identify potential performance issues and take action. Other elements of New Relic’s alerts include:
• | Integration with Tools. New Relic’s alerts platform is designed to integrate easily with communication and collaboration applications like PagerDuty, Campfire, HipChat, and Slack, allowing software teams to quickly understand when critical issues arise and take action. |
• | Centralized UI. New Relic’s alerts platform provides a dedicated user interface for alert configuration and incident management across New Relic products. |
• | More Powerful Alerts. New Relic’s alerts platform is designed to automatically apply existing alert conditions and policies for dynamic infrastructure, in order to remove the need for manual configuration. With the ability to craft precise alerts from NRQL queries, organizations can benefit from nearly limitless flexibility and baseline alerts powered by New Relic’s cloud platform. |
New Relic's Plugins Architecture
New Relic’s plugins architecture, which is currently included with New Relic APM, provides customers, partners, and third-party developers with APIs and SDKs to build plugins that extend our functionality and data into almost any application or IT environment. For example, while our focus is on supporting modern programming languages and frameworks with our agents, some customers and developers have built plugins to address custom or legacy on-premise applications and architectures. In addition, plugins can also extend the functionality and data from other applications and sources into our databases. The New Relic plugin architecture allows for hundreds of easily downloadable plugins to users. Other elements include:
• | Extensibility. We provide APIs and SDKs to allow developers to easily and quickly integrate and embed the functionality of our products and data with other applications and data sources. We also offer a click and drag dashboard creation tool that allows users to customize their user experience. |
• | Plugins. Plugins have been built to monitor IT architecture elements including databases, networks, queuing systems, and communication tools, enabling customers to monitor their entire application stack. In general, data from sources other than our agents is presented in the same dashboard alongside the monitoring data from our agents. Many plugins are built and used within the workday. Plugins can be kept proprietary or shared with the broader public community. |
Employees
As of March 31, 2017, we had 1,088 employees, including temporary employees. We also engage consultants. None of our employees is covered by collective bargaining agreements and we consider our relations with our employees to be good.
10
Operations
We host our applications and serve all our customers from data centers located in the Chicago, Illinois area and, to a lesser extent, a combination of cloud hosting providers. We utilize third parties to manage the infrastructure at our Chicago data centers. We maintain a formal and comprehensive security program designed to ensure the security and integrity of our data, protect against security threats or data breaches, and prevent unauthorized access to the data of our customers. Our technology uses multi-tenant architecture, enabling all our customers to share the same version of our products and platform capabilities while securely partitioning their data.
Research and Development
Our research and development organization is responsible for the design, development, and testing of all aspects of the New Relic Digital Intelligence Platform suite of products and platform capabilities. We invest heavily in these efforts to continuously improve, innovate, and add new features to our solutions.
We deploy new features, functionality, and technologies through daily and weekly software releases or updates in order to minimize disruption and provide for constant improvement. Our product managers regularly engage with customers, partners, and industry analysts, as well as other stakeholders, in functions such as sales, customer success, marketing, and business development to understand customer needs as well as general trends in our industry. Once product improvements are identified, the development organization works closely together to design, develop, test, and launch a solution.
The majority of our research and development team is based in our Portland, Oregon office, as well as our San Francisco, California office. To foster rapid innovation, our team is further apportioned into smaller, agile development teams.
As of March 31, 2017, we had 267 employees in our research and development organization. Our research and development expenses were $61.1 million, $46.4 million, and $24.0 million for the fiscal years ended March 31, 2017, 2016, and 2015, respectively.
Sales and Marketing
Our sales and marketing organizations work together closely to drive market awareness, create and manage user and customer leads, provide qualified leads to our sales pipeline, and build customer relationships to drive revenue growth. As of March 31, 2017, we had 520 employees in our sales and marketing organization.
Sales
We sell our products to businesses of all sizes largely through our direct sales organization, with an increased focus on large enterprise companies. Our direct sales organization is organized by size of customer and geography and is focused on growing accounts and usage so as to provide our customers with a broader set of our product solutions.
Our sales organization has separate teams focused on smaller companies, mid-market organizations, and large enterprises. Our specific sales strategy is based on the size of account and the target user at an organization—software developers, business or product managers, or IT managers.
We experience increased seasonality in our sales and operating results as mid-market and enterprise customers become a larger percentage of our revenues. The first two quarters of each fiscal year usually have lower or potentially negative sequential deferred revenue growth than the third and fourth fiscal quarters, during which we generally benefit from a larger renewal base and opportunity to up-sell existing customers. Over time that would lead to stronger sequential revenue results in our fourth and first fiscal quarters as our deferred revenue is recognized.
Marketing
Our marketing strategy targets software developers, IT leaders, and technology executives across many industries and regions. Additionally, our events, demand generation, customer programs, corporate communications, and product marketing teams focus on building brand, engagement, and demand with our target markets. We utilize both online and offline marketing initiatives, including search engine and email marketing, online banner and video advertising, blogs, corporate communications, whitepapers, case studies, user events, sponsorships, and webinars. We believe an effective method to market our suite of products is for users to actively use and explore its capabilities. We encourage free trials of one or more of our products in order to successfully convert those accounts to paid subscriptions.
11
Customer Support
Our products and platform capabilities are designed to minimize the need for customer support, as users can easily download, install, and deploy our software agents without needing support. However, as we increase our customer account base with larger enterprises, these customers typically expect and require more support and accountability. We offer a range of customer support options with multiple levels of support. These include free community support, email support, and phone support, up to our enterprise customer support organization that provides dedicated customer success representatives, onsite support, with global capabilities and is available at all hours of the day.
Partnerships and Strategic Relationships
We have built marketing relationships with a number of technology companies to help promote and grow our user base and footprint. We also have developed close relationships with several cloud providers including Amazon Web Services, Google Cloud Platform, Microsoft Azure, IBM, Rackspace, Pivotal Cloud Foundry, and others where we collaborate to ensure our products and platform capabilities work well on applications running on their clouds. These providers offer access to our products and platform capabilities through links on their websites, refer developers and other potential users to us, and expand our marketing reach. We also have a partnership with Salesforce.com where developers using the Salesforce1 development platform can easily deploy our products and platform capabilities into their applications.
Competition
We operate in a highly competitive industry that is characterized by constant change and innovation. Changes in the applications and the programing languages used to develop applications, devices, operating systems, and technology landscape result in evolving customer requirements.
Our competitors fall into four primary categories:
• | performance monitoring providers such as AppDynamics, Inc. (an operating division of Cisco Systems, Inc.), Datadog, Inc., Dynatrace LLC, and Splunk Inc.; |
• | diversified technology companies such as Hewlett Packard Enterprise Company, International Business Machines Corporation, Microsoft Corporation, and Oracle Corporation; |
• | large enterprise software and service companies such as BMC Software, Inc. and CA, Inc.; and |
• | companies offering analytics products competing with our New Relic Insights product, including Amazon Web Services, Inc., and Google Inc. |
The principal competitive factors in our market include:
• | product and platform features, architecture, reliability, security, performance, effectiveness, and supported environments; |
• | product extensibility and ability to integrate with other technology infrastructures; |
• | digital intelligence expertise; |
• | ease of use of products and platform capabilities; |
• | total cost of ownership; |
• | adherence to industry standards and certifications; |
• | strength of sales and marketing efforts; |
• | brand awareness and reputation; and |
• | focus on customer success. |
We believe we generally compete favorably with our competitors on the basis of these factors. Many of our competitors have substantially greater financial, technical, and other resources, greater name recognition, larger sales and marketing budgets, broader distribution, and larger and more mature intellectual property portfolios.
12
Intellectual Property
We rely on federal, state, common law, and international rights, as well as contractual restrictions, to protect our intellectual property. We control access to our proprietary technology and algorithms by entering into confidentiality and invention assignment agreements with our employees and contractors, and confidentiality agreements with third parties.
In addition to these contractual arrangements, we also rely on a combination of trade secrets, copyrights, trademarks, service marks, and domain names to protect our intellectual property. As of March 31, 2017, we had six patent applications pending and two trademark registrations for “New Relic” in the United States, as well as one Patent Cooperation Treaty application and three trademark registrations and four trademark applications for “New Relic” outside of the United States.
Circumstances outside our control could pose a threat to our intellectual property rights. For example, effective intellectual property protection may not be available in the United States or other countries in which we operate. Also, the efforts we have taken to protect our proprietary rights may not be sufficient or effective. Any significant impairment of our intellectual property rights could harm our business or our ability to compete. Also, protecting our intellectual property rights is costly and time-consuming. Any unauthorized disclosure or use of our intellectual property could make it more expensive to do business and harm our operating results.
Companies in Internet-related industries may own large numbers of patents, copyrights, and trademarks and may frequently request license agreements, threaten litigation, or file suit against us based on allegations of infringement or other violations of intellectual property rights. We are currently subject to, and expect to face in the future, allegations that we have infringed the trademarks, copyrights, patents, and other intellectual property rights of third parties, including our competitors and non-practicing entities. As we face increasing competition and as our business grows, we will likely face more claims of infringement.
Geographic Information
For a description of our revenue and long-lived assets by geographic location, see note 13 of the notes to our consolidated financial statements included elsewhere in this Annual Report on Form 10-K.
Available Information
Our website is located at www.newrelic.com, and our investor relations website is located at http://ir.newrelic.com/. Copies of our Annual Report on Form 10-K, Quarterly Report on Form 10-Q, Current Reports on Form 8-K, and amendments to these reports filed or furnished pursuant to Section 13(a) or 15(d) of the Securities Exchange Act of 1934, as amended, or the Exchange Act, are available, free of charge, on our investor relations website as soon as reasonably practicable after we file such material electronically with or furnish it to the Securities and Exchange Commission, or the SEC. The SEC also maintains a website that contains our SEC filings. The address of the site is www.sec.gov. Further, a copy of this Annual Report on Form 10-K is located at the SEC’s Public Reference Room at 100 F Street, NE, Washington, D.C. 20549. Information on the operation of the Public Reference Room can be obtained by calling the SEC at 1-800-SEC-0330.
We webcast our earnings calls and certain events we participate in or host with members of the investment community on our investor relations website. Additionally, we provide notifications of news or announcements regarding our financial performance, including SEC filings, investor events, press and earnings releases, and blogs as part of our investor relations website. New Relic has used, and intends to continue to use, our investor relations website, as well as our Twitter account (@newrelic), as means of disclosing material non-public information and for complying with its disclosure obligations under Regulation FD. Further corporate governance information, including our corporate governance guidelines, board committee charters, and code of conduct, is also available on our investor relations website under the subheading “Corporate Governance.” The contents of our website or our Twitter account are not intended to be incorporated by reference into this Annual Report on Form 10-K or in any other report or document we file with the SEC, and any references to our websites are intended to be inactive textual references only.
13
Item 1A. Risk Factors
We have identified the following risks and uncertainties that may have a material adverse effect on our business, financial condition or results of operations. The risks described below are not the only ones we face. Additional risks not presently known to us or that we currently believe are immaterial may also significantly impair our business operations. Our business could be harmed by any of these risks. The trading price of our common stock could decline due to any of these risks, and you may lose all or part of your investment. In assessing these risks, you should also refer to the other information contained in this Annual Report on Form 10-K, including our condensed consolidated financial statements and accompanying notes.
We have a history of losses and we expect our revenue growth rate to continue to decline. As our costs increase, we may not be able to generate sufficient revenue to achieve and sustain profitability.
We have incurred net losses in each fiscal period since our inception, including net losses of $61.1 million, $67.5 million, and $50.1 million in the fiscal years ended March 31, 2017, 2016, and 2015, respectively. At March 31, 2017, we had an accumulated deficit of $260.2 million. We expect to continue to expend substantial financial and other resources on, among other things:
• | sales and marketing, including expanding our direct sales organization and marketing programs, particularly for larger customers; |
• | investments in our research and development team, and the development of new products, capabilities, features, and functionality; |
• | expansion of our operations and infrastructure, both domestically and internationally; |
• | hiring of additional employees; and |
• | general administration, including legal, accounting, and other expenses related to our growing operations and infrastructure. |
These investments may not result in increased revenue or growth of our business. We expect that our revenue growth rate will continue to decline over time. Accordingly, we may not be able to generate sufficient revenue to offset our expected cost increases and to achieve and sustain profitability. If we fail to achieve and sustain profitability, our operating results and business would be harmed.
We have a limited operating history, which makes it difficult to evaluate our current business and future prospects and increases the risk of your investment.
We were founded in 2007 and launched our first commercial product in 2008. This limited operating history limits our ability to forecast our future operating results and subjects us to a number of uncertainties, including our ability to plan for and model future growth. Our historical revenue growth should not be considered indicative of our future performance. We have encountered and will encounter risks and uncertainties frequently experienced by growing companies in rapidly changing industries, such as determining appropriate investments of our limited resources, market adoption of our existing and future products and platform capabilities, competition from other companies, acquiring and retaining customers, hiring, integrating, training and retaining skilled personnel, developing new products and platform capabilities, determining prices and pricing structures for our products and platform capabilities, unforeseen expenses, and challenges in forecasting accuracy. If our assumptions regarding these risks and uncertainties, which we use to plan our business, are incorrect or change, or if we do not address these risks successfully, our operating and financial results and our business could suffer.
We have experienced significant growth in recent periods and expect our growth to continue. If we are not able to manage this growth and expansion, or if our business does not grow as we expect, our operating results may suffer.
We have experienced significant growth in our customer adoption and have expanded and intend to continue to significantly expand our operations, including our domestic and international employee headcount. This growth has placed, and will continue to place, significant demands on our management and our operational and financial infrastructure.
To manage this growth effectively, we must continue to improve our operational, financial, and management systems and controls by, among other things:
• | effectively attracting, training, integrating, and retaining a large number of new employees, particularly members of our sales and marketing teams and employees and consultants in jurisdictions outside of the United States; |
14
• | further improving our key business systems, processes, and information technology infrastructure, including our and third-party hosted data centers, to support our business needs; |
• | enhancing our information, training, and communication systems to ensure that our employees are well-coordinated and can effectively communicate with each other and our customers; and |
• | improving our internal control over financial reporting and disclosure controls and procedures to ensure timely and accurate reporting of our operational and financial results. |
If we fail to manage our expansion, implement and transition to our new systems, implement improvements, or maintain effective internal controls and procedures, our costs and expenses may increase more than we plan and we may lose the ability to increase our customer adoption, enhance our existing solutions, develop new solutions, satisfy our customers, respond to competitive pressures, or otherwise execute our business plan. If we are unable to manage our growth, our operating results likely will be harmed.
Our business depends on our customers purchasing additional subscriptions and products from us and renewing their subscriptions. Any decline in our customer expansions and renewals would harm our future operating results.
Our future success depends in part on our ability to sell more subscriptions and additional products to our current customers. If our customers do not purchase additional subscriptions and products from us, our revenue may decline and our operating results may be harmed.
In addition, in order for us to maintain or improve our operating results, it is important that our customers enter into paid subscriptions and renew their subscriptions when the contract term expires. Many of our customers start their accounts on a free trial and have no obligation to begin a paid subscription. Our customers that enter into paid subscriptions have no obligation to renew their subscriptions after the expiration of their subscription period. Subscription periods are most often one year in length, but in recent fiscal years we have secured an increased percentage of multi-year commitments with respect to new paid business accounts. In addition, our customers may renew for lower subscription amounts or for shorter contract lengths. In the past, some of our customers have elected not to renew their agreements with us, and we cannot accurately predict future net expansion rates. Moreover, certain legacy customers with annual subscriptions have the right to cancel their agreements prior to the termination of the subscription term.
Our customer expansions and renewals may decline or fluctuate as a result of a number of factors, including: customer usage, customer satisfaction with our products and platform capabilities and customer support, our prices, the prices of competing products, mergers and acquisitions affecting our customer base, consolidation of affiliates’ multiple paid business accounts into a single paid business account, the effects of global economic conditions, or reductions in our customers’ spending levels generally. These factors may also be exacerbated to the extent our customer base continues to grow to encompass larger enterprises.
If we are not able to develop enhancements to our products, increase adoption and usage of our products, and introduce new products and capabilities that achieve market acceptance, our business could be harmed.
Our ability to attract new customers and increase revenue from existing customers depends in large part on our ability to enhance and improve our existing products, increase adoption and usage of our products, and introduce new products and capabilities. The success of any enhancement or new products depends on several factors, including timely completion, adequate quality testing, introduction, and market acceptance. For example, in November 2016 we launched our newest generally available product, New Relic Infrastructure. This or any other products that we develop may not be introduced in a timely or cost-effective manner, may contain errors or defects, or may not achieve the broad market acceptance necessary to generate sufficient revenue. If we are unable to successfully enhance our existing products to meet customer requirements, increase adoption and usage of our products, or develop new products, our business and operating results will be harmed.
If customers do not expand their use of our products beyond the current predominant use cases, our ability to grow our business and operating results may be adversely affected.
Most of our customers currently use our products to support application performance management functions, and the majority of our revenue to date has been from our application performance management products. Our ability to grow our business depends in part on our ability to persuade current and future customers to expand their use of our software to additional use cases, such as business analytics and customer usage analytics. If we fail to achieve market acceptance of our software, or if a competitor establishes a more widely adopted solution, our ability to grow our business and financial results will be adversely affected. In addition, as the amount of data stored for a given customer grows, that customer may have to
15
agree to higher subscription fees for certain of our software or limit the amount of data stored in order to stay within the limits of its existing subscription. If their fees grow significantly, customers may react adversely to this pricing model, particularly if they perceive that the value of our software has become eclipsed by such fees or otherwise.
We have limited experience with respect to determining the optimal prices and pricing structures for our products.
We expect that we may need to change our pricing model from time to time, including as a result of global economic conditions, reductions in our customers’ spending levels generally or changes in how computing infrastructure is broadly consumed. Similarly, as we introduce new products or services, or as a result of the evolution of our existing products and services, we may have difficulty determining the appropriate price structure for our products. In addition, as new and existing competitors introduce new products or services that compete with ours, or revise their pricing structures, we may be unable to attract new customers at the same price or based on the same pricing model as we have used historically. Moreover, as we continue to target selling our products to larger organizations, these larger organizations may demand substantial price concessions. As a result, we may be required from time to time to revise our pricing structure or reduce our prices, which could adversely affect our business.
Failure to effectively expand our marketing and sales capabilities could harm our ability to increase our customer adoption and achieve broader market acceptance of our products.
Our ability to increase our customer adoption and achieve broader market acceptance of our products will depend to a significant extent on our ability to expand our marketing and sales operations, with an emphasis on continuing to improve our ability to target sales to large enterprise organizations. We plan to continue expanding our sales force, both domestically and internationally. We also dedicate significant resources to sales and marketing programs, including online advertising and field marketing programs. For example, during the fiscal year ended March 31, 2017, sales and marketing expenses represented 64% of our revenue. The effectiveness of our marketing programs has varied over time and may vary in the future due to competition. All of these efforts have required and will continue to require us to invest significant financial and other resources. If we are unable to hire, develop, and retain talented sales personnel, if our sales personnel are unable to achieve desired productivity levels in a reasonable period of time, or if our sales and marketing programs are not effective, our ability to increase our customer adoption and achieve broader market acceptance of our products could be harmed.
If we are unable to continue to increase the sales of our solutions to large enterprises while mitigating the risks associated with serving such customers, our business, financial position, and results of operations may suffer.
Our growth strategy is dependent, in part, upon the continued increase of sales to large enterprises. Sales to large customers involve risks that may not be present or that are present to a lesser extent with sales to smaller entities, such as longer sales cycles, more complex customer requirements, substantial upfront sales costs, and less predictability in completing some of our sales. For example, enterprise customers may require considerable time to evaluate and test our applications and those of our competitors prior to making a purchase decision and placing an order. A number of factors influence the length and variability of our sales cycle, including the need to educate potential customers about the uses and benefits of our applications, the discretionary nature of purchasing and budget cycles, and the competitive nature of evaluation and purchasing approval processes. As a result, the length of our sales cycle, from identification of the opportunity to deal closure, may vary significantly from customer to customer, with sales to large enterprises typically taking longer to complete. Moreover, large enterprise customers often begin to deploy our products on a limited basis, but nevertheless demand extensive configuration, integration services, and pricing negotiations, which increase our upfront investment in the sales effort with no guarantee that these customers will deploy our products widely enough across their organization to justify our substantial upfront investment.
In addition, our ability to improve our sales of products to large enterprises is dependent on us continuing to attract and retain sales personnel with experience in selling to large organizations. Also, because security breaches with respect to larger, high-profile enterprises are likely to be heavily publicized, there is increased reputational risk associated with serving such customers. If we are unable to continue to increase sales of our products to large enterprise customers while mitigating the risks associated with serving such customers, our business, financial position, and results of operations may suffer.
Because users are able to configure our platform to collect and store personal information of their employees and end-users, privacy concerns could result in additional cost and liability to us or inhibit sales of our products.
Our operations involve protection of our intellectual property, along with the storage and transmission and processing of our customers’ proprietary data, which customers might choose to have include some personally identifiable information, and security breaches, computer malware, and computer hacking attacks could expose us to a risk of loss of this information, loss of business, severe reputational damage adversely affecting customer or investor confidence, regulatory investigations and orders,
16
litigation, indemnity obligations, damages for contract breach, penalties for violation of applicable laws or regulations, and significant costs for remediation and incentives offered to customers or other business partners in an effort to maintain business relationships after a breach and other liabilities.
Cyber-attacks and other malicious Internet-based activity continue to increase generally. If our security measures are perceived as weak or actually compromised as a result of third-party action, employee or customer error, malfeasance, stolen or fraudulently obtained log-in credentials, or otherwise, our customers may curtail or stop using our products, our reputation could be damaged, our business may be harmed, and we could incur significant liability. We may be unable to anticipate or prevent techniques used to obtain unauthorized access or to sabotage systems because they change frequently and generally are not detected until after an incident has occurred. As we increase our customer adoption and our brand becomes more widely known and recognized, we may become more of a target for third parties seeking to compromise our security systems or gain unauthorized access to our customers’ data.
If we are not able to detect and indicate activity on our platform that might be nefarious in nature, our customers could suffer harm. In such cases, we could face exposure, particularly if the customer suffered actual harm. We cannot assure you that any limitations of liability provisions in our contracts for a security lapse or breach would be enforceable or adequate or would otherwise protect us from any liabilities or damages with respect to any particular claim. We also cannot be sure that our existing insurance coverage will continue to be available on acceptable terms or will be available in sufficient amounts to cover one or more large claims related to a security breach, or that the insurer will not deny coverage as to any future claim. The successful assertion of one or more large claims against us that exceed available insurance coverage, or the occurrence of changes in our insurance policies, including premium increases or the imposition of large deductible or co-insurance requirements, could have a material adverse effect on our business, including our expansion rates, financial condition, operating results, and reputation.
Changes in privacy laws, regulations, and standards may cause our business to suffer.
We are subject to federal, state, and international laws relating to the collection, use, retention, security, and transfer of personally identifiable information. The regulatory framework for privacy and security issues worldwide is rapidly evolving and is likely to remain uncertain for the foreseeable future. We publicly post documentation regarding our practices concerning the processing, use, and disclosure of data. Any failure by us, our suppliers, or other parties with whom we do business to comply with this documentation or with other federal, state, or international regulations could result in proceedings against us by governmental entities or others. In many jurisdictions, enforcement actions and consequences for noncompliance are rising. In the United States, these include rules and regulations promulgated under the authority of federal agencies and state attorneys general and legislatures and consumer protection agencies. In addition, privacy advocates and industry groups have regularly proposed, and may propose in the future, self-regulatory standards with which we must legally comply or that contractually apply to us, like the Payment Card Industry Data Security Standard, or PCI DSS. If we fail to follow these security standards, such as those set forth in the PCI DSS, even if no customer information is compromised, we may incur significant fines or experience a significant increase in costs.
Internationally, virtually every jurisdiction in which we operate has established its own data security and privacy legal framework with which we or our customers must comply, including but not limited to the European Union, or EU. The EU’s data protection landscape is currently unstable, resulting in possible significant operational costs for internal compliance and risk to our business. While we have taken steps to mitigate the impact on us, such as implementing standard contractual clauses and self-certifying under the EU-US Privacy Shield, the efficacy of these mechanisms remain uncertain. In addition, the EU has adopted the General Data Protection Regulation, or GDPR, which is scheduled to go into effect in early 2018 and contains numerous requirements and changes, including more robust obligations on data processors and heavier documentation requirements for data protection compliance programs by companies. Complying with the GDPR may cause us to incur substantial operational costs or require us to change our business practices. Despite our efforts to bring practices into compliance before the effective date of the GDPR, we may not be successful either due to internal or external factors such as resource allocation limitations or a lack of vendor cooperation. Non-compliance could result in proceedings against us by governmental entities or others. We may also experience difficulty retaining or obtaining new European or multi-national customers due to the compliance cost, potential risk exposure, and uncertainty for these entities. We may find it necessary to establish systems to maintain personal data originating from the EU in the European Economic Area, which may involve substantial expense and distraction from other aspects of our business. In the meantime, there could be uncertainty as to how to comply with EU privacy law.
Because the interpretation and application of many privacy and data protection laws along with contractually imposed industry standards are uncertain, it is possible that these laws may be interpreted and applied in a manner that is inconsistent with our existing data management practices or the features of our products and platform capabilities. If so, in addition to the
17
possibility of fines, lawsuits, and other claims and penalties, we could be required to fundamentally change our business activities and practices or modify our products and platform capabilities, which could have an adverse effect on our business. Any inability to adequately address privacy and security concerns, even if unfounded, or comply with applicable privacy and data security laws, regulations, and policies, could result in additional cost and liability to us, damage our reputation, inhibit sales, and adversely affect our business. Furthermore, the costs of compliance with, and other burdens imposed by, the laws, regulations, and policies that are applicable to the businesses of our customers may limit the use and adoption of, and reduce the overall demand for, our products. Privacy and data security concerns, whether valid or not valid, may inhibit market adoption of our products, particularly in certain industries and foreign countries. If we are not able to adjust to changing laws, regulations, and standards related to the Internet, our business may be harmed.
If we fail to adapt and respond effectively to rapidly changing technology, evolving industry standards, and changing customer needs, requirements, or preferences, our products may become less competitive.
The software industry is subject to rapid technological change, evolving industry standards and practices, and changing customer needs, requirements, and preferences. The success of our business will depend, in part, on our ability to adapt and respond effectively to these changes on a timely basis. If we are unable to develop and sell new products that satisfy our customers and provide enhancements and new features for our existing products and platform capabilities that keep pace with rapid technological and industry change, our revenue and operating results could be adversely affected. If new technologies emerge that are able to deliver competitive products and applications at lower prices, more efficiently, more conveniently, or more securely, such technologies could adversely impact our ability to compete.
Our platform must also integrate with a variety of network, hardware, mobile, and software platforms, and technologies, and we need to continuously modify and enhance our products and platform capabilities to adapt to changes and innovation in these technologies. If developers widely adopt new software platforms, we would have to develop new versions of our products and platform capabilities to work with those new platforms. This development effort may require significant engineering, marketing, and sales resources, all of which would affect our business and operating results. Any failure of our products and platform capabilities to operate effectively with future infrastructure platforms and technologies could reduce the demand for our products. If we are unable to respond to these changes in a cost-effective manner, our products may become less marketable and less competitive or obsolete, and our operating results may be negatively affected.
We are dependent upon lead generation strategies to drive our sales and revenue. If these marketing strategies fail to continue to generate sales opportunities, our ability to grow our revenue will be adversely affected.
We are dependent upon lead generation strategies to generate sales opportunities. These strategies may not be successful in continuing to generate sufficient sales opportunities necessary to increase our revenue. To the extent that we are unable to successfully attract and grow paying customers, we will not realize the intended benefits of these marketing strategies and our ability to grow our revenue will be adversely affected.
The market in which we participate is intensely competitive, and if we do not compete effectively, our operating results could be harmed.
The market for application and infrastructure performance monitoring is rapidly evolving, significantly fragmented, and highly competitive, with relatively low barriers to entry in some segments. Our competitors fall into four primary categories:
• | performance monitoring providers such as AppDynamics, Inc. (an operating division of Cisco Systems, Inc.), Datadog, Inc., Dynatrace LLC, and Splunk Inc.; |
• | diversified technology companies such as Hewlett Packard Enterprise Company, International Business Machines Corporation, Microsoft Corporation, and Oracle Corporation; |
• | large enterprise software and service companies such as BMC Software, Inc. and CA, Inc.; and |
• | companies offering analytics products competing with our New Relic Insights product, including Amazon Web Services, Inc., and Google Inc. |
Some of our competitors and potential competitors are larger and have greater name recognition, longer operating histories, more established customer relationships, larger budgets, and significantly greater resources than we do, and have the operating flexibility to bundle competing products and services with other software offerings at little or no perceived incremental cost, including offering them at a lower price as part of a larger sale. As a result, our competitors may be able to respond more quickly and effectively than we can to new or changing opportunities, technologies, standards, or customer requirements. In addition, some competitors may offer products or services that address one or a limited number of functions at lower prices or with greater depth than our products. Our current and potential competitors may develop and market new
18
technologies with comparable functionality to our products and platform capabilities, and this could lead to us having to decrease prices in order to remain competitive.
With the introduction of new technologies, the evolution of our products and platform capabilities and new market entrants, we expect competition to intensify in the future. Moreover, as we expand the scope of our solutions, we may face additional competition. Additionally, some potential customers, particularly large enterprises, may elect to develop their own internal products. If one or more of our competitors were to merge or partner with another of our competitors or another large diversified technology company, the change in the competitive landscape could also adversely affect our ability to compete effectively. For example, in March 2017, Cisco Systems, Inc. completed its purchase of AppDynamics, Inc. If we are unable to maintain our current pricing due to the competitive pressures, our margins will be reduced and our operating results will be negatively affected. In addition, pricing pressures and increased competition generally could result in reduced sales, reduced margins, losses, or the failure of our solutions to achieve or maintain more widespread market acceptance, any of which could harm our business.
Because we recognize revenue from our subscriptions over the subscription term, downturns or upturns in new sales and renewals may not be immediately reflected in our operating results and may be difficult to discern.
We generally recognize revenue from customers ratably over the terms of their subscriptions. A portion of the revenue we report in each quarter is derived from the recognition of revenue relating to subscriptions entered into during previous quarters. Consequently, a decline in new or renewed subscriptions in any single quarter may have a small impact on our revenue for that quarter. However, such a decline will negatively affect our revenue in future quarters. Accordingly, the effect of significant downturns in sales and market acceptance of our solutions, and potential changes in our rate of renewals, may not be fully reflected in our results of operations until future periods. In addition, a significant majority of our costs are expensed as incurred, while revenue is recognized over the life of the agreement with our customer. As a result, increased growth in the number of our customers could continue to result in our recognition of more costs than revenue in the earlier periods of the terms of our agreements. In future periods we expect that the way in which we recognize this revenue will be impacted by Accounting Standards Update No. 2014-09, “Revenue from Contracts with Customers,” or Topic 606. Please see the risk factor under the heading “The nature of our business requires the application of complex revenue recognition rules. Significant changes in U.S. generally accepted accounting principles, or GAAP, from the adoption of recently issued accounting standards could materially affect our financial position and results of operations.” in this Part I, Item 1A for more information.
Seasonality may cause fluctuations in our sales and operating results.
We have experienced seasonality in our sales and operating results in the past, and we believe that we will increasingly experience seasonality in the future as we continue to target larger enterprise customers. The first two quarters of each fiscal year usually have lower or potentially negative sequential deferred revenue growth than the third and fourth fiscal quarters, during which we generally benefit from a larger renewal base and opportunity to up-sell existing customers. We believe that this results from the procurement, budgeting, and deployment cycles of many of our customers, particularly our enterprise customers, which tend to have a concentration of increased activity in the periods surrounding the change of the company’s fiscal year. As a result, over time we could potentially see stronger sequential revenue results in our fourth and first fiscal quarters as our deferred revenue is recognized. We expect that this seasonality will continue to affect our sales and operating results in the future, which can make it difficult to achieve sequential growth in certain financial metrics or could result in sequential declines on a quarterly basis. Accordingly, historical patterns should not be considered indicative of our future sales activity or performance.
Interruptions or performance problems associated with our technology and infrastructure may adversely affect our business and operating results.
Our continued growth depends in part on the ability of our existing and potential customers to access our products and platform capabilities at any time and within an acceptable amount of time. We have experienced, and may in the future experience, disruptions, outages, and other performance problems due to a variety of factors, including infrastructure changes, introductions of new functionality, human or software errors, capacity constraints due to an overwhelming number of users accessing our products and platform capabilities simultaneously, denial of service attacks, or other security related incidents. It may become increasingly difficult to maintain and improve our performance, especially during peak usage times and as our products and platform capabilities become more complex and our user traffic increases. If our products and platform capabilities are unavailable or if our users are unable to access our products and platform capabilities within a reasonable amount of time or at all, our business would be negatively affected. To the extent that we do not effectively address capacity constraints, upgrade our systems as needed, and continually develop our technology and network architecture to accommodate actual and anticipated changes in technology, our business and operating results may be adversely affected.
19
In addition, we currently serve our customers from third-party data centers located in the Chicago, Illinois area and, to a lesser extent, a combination of cloud hosting providers. The continuous availability of our products and platform capabilities depends on the operations of our Chicago facilities, on our cloud hosting providers, on a variety of network service providers, on third-party vendors, and on our own site operations staff. We depend on our third-party providers’ abilities to protect our Chicago data center facilities against damage or interruption from natural disasters, power or telecommunications failures, criminal acts, and similar events. If there are any lapses of service or damage to the facilities, we could experience lengthy interruptions in our products and platform capabilities as well as delays and additional expenses in arranging new facilities and services. Even with current and planned disaster recovery arrangements, which, to date, have not been tested in an actual crisis, our business could be harmed. Also, in the event of damage or interruption, our insurance policies may not adequately compensate us for any losses that we may incur. These factors in turn could further reduce our revenue, subject us to liability, and cause us to issue credits or cause customers not to renew their subscriptions, any of which could harm our business.
Defects or disruptions in our products and platform capabilities could diminish demand, harm our financial results, and subject us to liability.
Our customers use our products and platform capabilities for important aspects of their businesses, and any errors, defects, or disruptions to our products and platform capabilities or other performance problems with our products and platform capabilities could hurt our brand and reputation and may damage our customers’ businesses. We provide regular product updates, which may contain undetected errors when first introduced or released. In the past, we have discovered software errors, failures, vulnerabilities, and bugs in our products and platform capabilities after they have been released and new errors in our existing products and platform capabilities may be detected in the future. Real or perceived errors, failures, or bugs in our products and platform capabilities could result in negative publicity, loss of or delay in market acceptance of our products, loss of competitive position, delay of payment to us, lower renewal rates, or claims by customers for losses sustained by them. In such an event, we may be required, or may choose, for customer relations or other reasons, to expend additional resources in order to help correct the problem. In addition, we may not carry insurance sufficient to compensate us for the any losses that may result from claims arising from defects or disruptions in our products and platform capabilities. As a result, we could lose future sales and our reputation and our brand could be harmed.
Our ongoing and planned investments in data center hosting facilities are expensive and complex, may result in a negative impact on our cash flows, and may negatively impact our financial results.
We have made and will continue to make substantial investments in new equipment to support growth at our Chicago area data center hosting facilities, provide enhanced levels of products and platform capabilities to our customers, and potentially reduce future costs of subscription revenue. In addition, we may need to add additional data centers or similar resources to support our growth or as a result of regulatory requirements that may be applicable to us. We have also invested in a combination of cloud hosting providers to serve our customers for certain portions of our service. Ongoing or future improvements to our cloud infrastructure may be more expensive than we anticipate, and may not yield the expected savings in operating costs or the expected performance benefits. We may not be able to maintain or achieve cost savings from our investments, which could harm our financial results.
We may need to change our current operations infrastructure in order for us to achieve profitability and scale our operations efficiently, which makes our future prospects even more difficult to evaluate. For example, in order to grow sales to commercial and enterprise customers in a financially sustainable manner, we may need to further customize our offering and modify our go-to-market strategy to reduce our operating and customer acquisition costs. If we fail to implement these changes on a timely basis or are unable to implement them effectively, our business may suffer.
Because our long-term growth strategy involves further expansion of our sales to customers outside the United States, our business will be susceptible to risks associated with international operations.
A component of our growth strategy involves the further expansion of our operations and customer adoption internationally. Operating in international markets requires significant resources and management attention and subjects us to regulatory, economic, and political risks that are different from those in the United States. We have limited operating experience in international markets, and we cannot assure you that our expansion efforts into international markets will be successful. Our international expansion efforts may not be successful in creating further demand for our products outside of the United States or in effectively selling our products in the international markets we enter. Our current international operations and future initiatives involve a variety of risks, including:
• | changes in a specific country’s or region’s political or economic conditions; |
• | unexpected changes in regulatory requirements, taxes, or trade laws; |
20
• | regional data security and privacy laws and regulations and the unauthorized use of, or access to, commercial and personal information, particularly in the EU; |
• | differing labor regulations, especially in the EU, where labor laws are generally more advantageous to employees as compared to the United States, including deemed hourly wage and overtime regulations in these locations; |
• | challenges inherent in efficiently managing an increased number of employees over large geographic distances, including the need to implement appropriate systems, policies, benefits, and compliance programs; |
• | difficulties in managing a business in new markets with diverse cultures, languages, customs, legal systems, alternative dispute systems, and regulatory systems; |
• | increased travel, real estate, infrastructure, and legal compliance costs associated with international operations; |
• | currency exchange rate fluctuations and the resulting effect on our revenue and expenses, and the cost and risk of entering into hedging transactions if we chose to do so in the future; |
• | limitations on our ability to repatriate earnings; |
• | laws and business practices favoring local competitors, or general preferences for local vendors; |
• | limited or insufficient intellectual property protection; |
• | exposure to liabilities under anti-corruption, export controls and anti-money laundering laws, including the U.S. Foreign Corrupt Practices Act, and similar laws and regulations in other jurisdictions; and |
• | adverse tax burdens and foreign exchange controls that could make it difficult to repatriate earnings and cash or create other collection difficulties. |
Our limited experience operating our business internationally increases the risk that recent and any potential future expansion efforts will not be successful. If substantial time and resources invested to expand our international operations do not result in a successful outcome, our operating results and business will suffer.
If we lose key members of our management team or are unable to attract and retain executives and employees we need to support our operations and growth, our business may be harmed.
Our success and future growth depend largely upon the continued services of our executive officers and other key employees in the areas of research and development, marketing, sales, services, and general administrative functions. From time to time, there may be changes in our executive management team or other key employees resulting from the hiring or departure of these personnel. Our executive officers and other key employees are employed on an at-will basis, which means that these personnel could terminate their employment with us at any time. For example, our former President, Hilarie Koplow-McAdams, recently resigned as our President and announced her intention to retire in mid-June 2017. The loss of one or more of our executive officers, especially our Chief Executive Officer, Lewis Cirne, or the failure by our executive team to effectively work with our employees and lead our company, could harm our business. We also are dependent on the continued service of our existing software engineers because of the complexity of our products and platform capabilities.
In addition, to execute our growth plan, we must attract and retain highly qualified personnel. Competition for these personnel in the San Francisco Bay Area and the Portland area, where our headquarters and the majority of our research and development personnel are located, respectively, and in other locations where we maintain offices, is intense, especially for engineers experienced in designing and developing software and SaaS applications and experienced sales professionals. We have from time to time experienced, and we expect to continue to experience, difficulty in hiring and retaining employees with appropriate qualifications. Many of the companies with which we compete for experienced personnel have greater resources than we have. If we hire employees from competitors or other companies, their former employers may attempt to assert that these employees or we have breached their legal obligations, resulting in a diversion of our time and resources. In addition, prospective and existing employees often consider the value of the equity awards they receive in connection with their employment. If the perceived value of our equity awards declines, or experiences significant volatility, it may adversely affect our ability to recruit and retain key employees. If we fail to attract new personnel or fail to retain and motivate our current personnel, our business and future growth prospects could be adversely affected.
If we fail to enhance our brand, or to do so in a cost-effective manner, our ability to expand our customer adoption will be impaired and our financial condition may suffer.
We believe that our development of the New Relic brand is critical to achieving widespread awareness of our existing and future digital intelligence solutions, and, as a result, is important to attracting new customers and maintaining existing
21
customers. We also believe that the importance of brand recognition will increase as competition in our market increases. Successful promotion of our brand will depend largely on the effectiveness of our marketing efforts, including our ability to do so in a cost-effective manner, and on our ability to provide reliable and useful products at competitive prices. In the past, our efforts to build our brand have involved significant expenses. Brand promotion activities may not yield increased revenue, and even if they do, any increased revenue may not offset the expenses we incur in building our brand.
If we cannot maintain our corporate culture as we grow, we could lose the innovation, teamwork, passion, and focus on execution that we believe contribute to our success, and our business may be harmed.
We believe that our corporate culture has been a critical component to our success. We have invested substantial time and resources in building our team, including the hiring of a new Chief People Officer in February 2017. As we grow and mature as a public company, we may find it difficult to maintain our corporate culture. Any failure to preserve our culture could negatively affect our future success, including our ability to recruit and retain personnel and effectively focus on and pursue our corporate objectives.
Acquisitions, strategic investments, partnerships, or alliances could be difficult to identify, pose integration challenges, divert the attention of management, disrupt our business, dilute stockholder value, and adversely affect our operating results and financial condition.
We have in the past and may in the future seek to acquire or invest in businesses, products and platform capabilities, or technologies that we believe could complement or expand our products and platform capabilities, enhance our technical capabilities, or otherwise offer growth opportunities. Any acquisition may divert the attention of management and cause us to incur various expenses in identifying, investigating, and pursuing suitable acquisitions, whether or not the acquisitions are completed, and may result in unforeseen operating difficulties and expenditures. In particular, we may encounter difficulties assimilating or integrating the businesses, technologies, products and platform capabilities, personnel, or operations of the acquired companies, particularly if the key personnel of the acquired company choose not to work for us, their software is not easily adapted to work with our platform, or we have difficulty retaining the customers of any acquired business due to changes in ownership, management, or otherwise. Acquisitions may also disrupt our business, divert our resources, and require significant management attention that would otherwise be available for development of our existing business. Any acquisitions we are able to complete may not result in any synergies or other benefits we had expected to achieve, which could result in impairment charges that could be substantial. In addition, we may not be able to find and identify desirable acquisition targets or be successful in entering into an agreement with any particular target. Acquisitions could also result in dilutive issuances of equity securities or the incurrence of debt, which could adversely affect our operating results. In addition, if an acquired business fails to meet our expectations, our operating results, business, and financial condition may suffer or we may be exposed to unknown risks or liabilities.
We may be sued by third parties for alleged infringement of their proprietary rights.
There is considerable patent, copyright, trademark, trade secret, and other intellectual property development activity in our industry. Our success depends in part on not infringing upon the intellectual property rights of others. From time to time, our competitors or other third parties may claim that we are infringing upon their intellectual property rights, and we may be found to be infringing upon such rights. For example, we are currently party to a suit brought against us by CA, Inc. that alleges, among other things, that we have infringed on certain patents held by CA, Inc. For more information about these proceedings, see Part I, Item 3 “Legal Proceedings.” In the future, we may receive claims that our products, platform capabilities, and underlying technology infringe or violate the claimant’s intellectual property rights. Any claims or litigation, regardless of merit, could cause us to incur significant expenses and, if successfully asserted against us, could require that we pay substantial damages or ongoing royalty payments, prevent us from offering our products and platform capabilities, or require that we comply with other unfavorable terms.
Even if the claims do not result in litigation or are resolved in our favor, these claims, and the time and resources necessary to resolve them, could divert the resources of our management and harm our business and operating results. We expect that the occurrence of infringement claims is likely to grow as the market for digital intelligence products grows. Accordingly, our exposure to damages resulting from infringement claims could increase and this could further exhaust our financial and management resources.
22
Any failure to protect our intellectual property rights could impair our ability to protect our proprietary technology and our brand.
Our success depends to a significant degree on our ability to protect our proprietary technology and our brand. We rely on a combination of trademarks, trade secret laws, patent, copyrights, service marks, contractual restrictions, and other intellectual property laws and confidentiality procedures to establish and protect our proprietary rights. However, the steps we take to protect our intellectual property may be inadequate. We will not be able to protect our intellectual property if we are unable to enforce our rights or if we do not detect unauthorized use of our intellectual property. If we fail to protect our intellectual property rights adequately, our competitors may gain access to our technology and our business may be harmed. In addition, defending our intellectual property rights might entail significant expense. Any patents, trademarks, or other intellectual property rights that we obtain may be challenged by others or invalidated through administrative process or litigation. As of March 31, 2017, we had six patent applications pending and two trademark registrations for “New Relic” in the United States, as well as one Patent Cooperation Treaty application and three trademark registrations and four trademark applications for “New Relic” outside of the United States. Despite our pending patent applications, we may be unable to obtain any patent protection for our technology. In addition, any patents issued in the future may not provide us with competitive advantages, or may be successfully challenged by third parties. Furthermore, legal standards relating to the validity, enforceability, and scope of protection of intellectual property rights are uncertain. Despite our precautions, it may be possible for unauthorized third parties to copy our products and platform capabilities and use information that we regard as proprietary to create products and services that compete with ours. Effective patent, trademark, copyright, and trade secret protection may not be available to us in every country in which our products is available. The laws of some foreign countries may not be as protective of intellectual property rights as those in the United States, and mechanisms for enforcement of intellectual property rights may be inadequate. As we expand our international activities, our exposure to unauthorized copying and use of our products and platform capabilities and proprietary information will likely increase. Accordingly, despite our efforts, we may be unable to prevent third parties from infringing upon or misappropriating our intellectual property.
We enter into confidentiality and invention assignment agreements with our employees and consultants and enter into confidentiality agreements with other parties. No assurance can be given that these agreements will be effective in controlling access to and distribution of our proprietary information. Further, these agreements may not prevent our competitors from independently developing technologies that are substantially equivalent or superior to our products and platform capabilities.
In order to protect our intellectual property rights, we may be required to spend significant resources to monitor and protect our intellectual property rights. Litigation may be necessary in the future to enforce our intellectual property rights and to protect our trade secrets. Litigation brought to protect and enforce our intellectual property rights could be costly, time-consuming, and distracting to management, and could result in the impairment or loss of portions of our intellectual property. Further, our efforts to enforce our intellectual property rights may be met with defenses, counterclaims, and countersuits attacking the validity and enforceability of our intellectual property rights. Our inability to protect our proprietary technology against unauthorized copying or use, as well as any costly litigation or diversion of our management’s attention and resources, could delay further sales or the implementation of our products and platform capabilities, impair the functionality of our products and platform capabilities, delay introductions of new solutions, result in our substituting inferior or more costly technologies into our products, or injure our reputation.
Our use of open source software could negatively affect our ability to sell our products and subject us to possible litigation.
We use open source software in our products and platform capabilities and expect to continue to use open source software in the future. We may face claims from others claiming ownership of, or seeking to enforce the terms of, an open source license, including by demanding release of the open source software, derivative works, or our proprietary source code that was developed using such software. These claims could also result in litigation, require us to purchase a costly license, or require us to devote additional research and development resources to change our platform, any of which would have a negative effect on our business and operating results. In addition, if the license terms for the open source software we utilize change, we may be forced to reengineer or discontinue our products and platform capabilities or incur additional costs. We cannot be certain that we have not incorporated open source software in our products and platform capabilities in a manner that is inconsistent with our policies.
We provide service level commitments under some of our customer contracts. If we fail to meet these contractual commitments, we could be obligated to provide credits or refunds for prepaid amounts related to unused subscriptions or face contract terminations, which could adversely affect our revenue.
Some of our customer agreements provide service level commitments. If we are unable to meet the stated service level commitments or suffer extended periods of unavailability for our products and platform capabilities, we may be contractually
23
obligated to provide these customers with service credits or refunds for prepaid amounts related to unused subscriptions, or we could face contract terminations. Our revenue could be significantly affected if we suffer unscheduled downtime that exceeds the allowed downtimes under our agreements with our customers. Any extended service outages could adversely affect our reputation, revenue, and operating results.
If the market for our technology delivery model and SaaS develops more slowly than we expect, our growth may slow or stall, and our operating results would be harmed.
The market for SaaS business software is less mature than traditional on-premise software applications, and the adoption rate of SaaS business software may be slower among subscribers in industries with heightened data security interests or business practices requiring highly-customizable application software. Our success will depend to a substantial extent on the widespread adoption of SaaS business software in general, but we do not know to what extent the trend of adoption of SaaS solutions will continue in the future. In particular, many organizations have invested substantial personnel and financial resources to integrate legacy software into their businesses over time, and some have been reluctant or unwilling to migrate to SaaS. It is difficult to predict customer adoption rates and demand for our products, the future growth rate and size of the SaaS business software market, or the entry of competitive applications. The expansion of the SaaS business software market depends on a number of factors, including the cost, performance, and perceived value associated with SaaS, as well as the ability of SaaS providers to address data security and privacy concerns. If SaaS business software does not continue to achieve market acceptance, or there is a reduction in demand for SaaS business software caused by a lack of customer acceptance, technological challenges, weakening economic conditions, data security or privacy concerns, governmental regulation, competing technologies and products, or decreases in information technology spending, it would result in decreased revenue and our business would be adversely affected.
Our future performance depends in part on support from third-party software developers.
We provide software that enables third-party software developers to build plugins that integrate with our products and platform capabilities. We operate a community website for sharing these third-party plugins. This presents certain risks to our business, including:
• | third-party developers may not continue developing or supporting the plugins that they share on our community website; |
• | we cannot provide any assurance that these plugins meet the same quality standards that we apply to our own development efforts, and, to the extent they contain bugs, defects, or security risks, they may create disruptions in our customers’ use of our software or negatively affect our brand; |
• | we do not currently provide support for plugins developed by third-party software developers, and users may be left without support and potentially cease using our products if the third-party software developers do not provide support for these plugins; and |
• | these third-party software developers may not possess the appropriate intellectual property rights to develop and share their plugins. |
Many of these risks are not within our control to prevent, and our brand may be damaged if these plugins do not perform to our customers’ satisfaction and that dissatisfaction is attributed to us.
We may not be able to secure additional financing on favorable terms, or at all, to meet our future capital needs. If additional capital is not available, we may have to delay, reduce, or cease certain investments.
We may in the future require additional capital to respond to business opportunities that may arise, including the need to develop new products and platform capabilities or enhance our existing products and platform capabilities, enhance our operating infrastructure, possible acquisitions of complementary businesses and technologies, a decline in the level of subscriptions for our products, or other unforeseen circumstances. We may not be able to timely secure additional debt or equity financing on favorable terms, or at all. Any debt financing obtained by us could involve restrictive covenants relating to financial and operational matters, which may make it more difficult for us to obtain additional capital and to pursue business opportunities, including potential acquisitions. If we raise additional funds through further issuances of equity, convertible debt securities, or other securities convertible into equity, our existing stockholders could suffer significant dilution in their percentage ownership of our company, and any new equity securities we issue could have rights, preferences, and privileges senior to those of holders of our common stock. If we are unable to obtain adequate financing or financing on terms satisfactory
24
to us when we require it, our ability to support our business and to respond to business challenges could be significantly limited, and our business, operating results, financial condition, and prospects could be harmed.
Our estimates of market opportunity and forecasts of market growth may prove to be inaccurate, and even if the market in which we compete achieves the forecasted growth, our business could fail to grow at similar rates, if at all.
Market opportunity estimates and growth forecasts are subject to significant uncertainty and are based on assumptions and estimates that may not prove to be accurate. Our estimates and forecasts relating to the size and expected growth of our market may prove to be inaccurate. Even if the market in which we compete meets our size estimates and forecasted growth, our business could fail to grow at similar rates, if at all.
We are subject to the tax laws of various jurisdictions, which are subject to unanticipated changes and to interpretation, which could harm our future results.
We are subject to income taxes in the United States and foreign jurisdictions, and our domestic and international tax liabilities are subject to the allocation of expenses in differing jurisdictions. Our effective tax rate could be adversely affected by changes in the mix of earnings and losses in countries with differing statutory tax rates, certain non-deductible expenses as a result of acquisitions, the valuation of deferred tax assets and liabilities, and changes in federal, state, or international tax laws and accounting principles. Further, each jurisdiction has different rules and regulations governing sales and use, value added, and similar taxes, and these rules and regulations are subject to varying interpretations that change over time. Certain jurisdictions in which we did not collect such taxes may assert that such taxes are applicable, which could result in tax assessments, penalties, and interest, and we may be required to collect such taxes in the future. In addition, we may be subject to income tax audits by many tax jurisdictions throughout the world, many of which have not established clear guidance on the tax treatment of SaaS-based companies. Any tax assessments, penalties, and interest, or future requirements may adversely affect our results of operations. Moreover, imposition of such taxes on us going forward will effectively increase the cost of our products to our customers and might adversely affect our ability to retain existing customers or to gain new customers in the areas in which such taxes are imposed.
In addition, the application of the tax laws of various jurisdictions, including the United States, to our international business activities is subject to interpretation and depends on our ability to operate our business in a manner consistent with our corporate structure and intercompany arrangements. The taxing authorities of jurisdictions in which we operate may challenge our methodologies for valuing developed technology or intercompany arrangements, including our transfer pricing, or determine that the manner in which we operate our business does not achieve the intended tax consequences. As we operate in numerous taxing jurisdictions, the application of tax laws can also be subject to diverging and sometimes conflicting interpretations by tax authorities of these jurisdictions. It is not uncommon for taxing authorities in different countries to have conflicting views, for instance, with respect to, among other things, the manner in which the arm’s length standard is applied for transfer pricing purposes, or with respect to the valuation of intellectual property.
The nature of our business requires the application of complex revenue recognition rules. Significant changes in U.S. generally accepted accounting principles, or GAAP, from the adoption of recently issued accounting standards could materially affect our financial position and results of operations.
We prepare our financial statements in accordance with GAAP which are subject to interpretation or changes by the Financial Accounting Standards Board, or FASB, the SEC, and other various bodies formed to promulgate and interpret appropriate accounting principles. New accounting pronouncements and changes in accounting principles have occurred in the past and are expected to occur in the future, which may have a significant effect on our financial results. For example, in May 2014, the FASB issued Topic 606, which supersedes nearly all existing revenue recognition guidance under GAAP. Under the new standard, revenue is recognized when a customer obtains control of promised goods or services and is recognized in an amount that reflects the consideration which the entity expects to receive in exchange for those goods or services. This new standard is effective for our interim and annual periods beginning April 1, 2018, and we expect the new standard to have a significant impact on our deferred commissions asset and the related amortization expense. We do not anticipate the new standard to have a significant impact on our revenue. We are continuing to evaluate the impact of the adoption of this standard on our consolidated financial statements and our preliminary assessments are subject to change. Refer to Note 1 in the notes to our consolidated financial statements included elsewhere in this Annual Report on Form 10-K for additional information on the new guidance and its potential impact on us. Adoption of this standard and any difficulties in implementation of changes in accounting principles, including the ability to modify our accounting systems, could cause us to fail to meet our financial reporting obligations, which could result in regulatory discipline and harm investors’ confidence in us. In addition, certain choices in the method of implementation of the standard may have an adverse impact on our potential as an acquirer or an acquiree in a business combination.
25
Our ability to use our net operating loss carryforwards to offset future taxable income may be subject to certain limitations.
As of our fiscal year ended March 31, 2017, we had U.S. federal and state net operating losses of approximately $313.8 million and $161.4 million, respectively, which may be utilized against future income taxes. In general, a corporation that undergoes an “ownership change” is subject to limitations on its ability to utilize its pre-change net operating losses, or NOLs, to offset future taxable income. In general, an ownership change occurs if the aggregate stock ownership of certain stockholders (generally 5% stockholders, applying certain look-through and aggregation rules) increases by more than 50% over such stockholders’ lowest percentage ownership during the testing period (generally three years). Purchases of our common stock in amounts greater than specified levels, which are beyond our control, could create a limitation on our ability to utilize our NOLs for tax purposes in the future. Limitations imposed on our ability to utilize NOLs could cause U.S. federal and state income taxes to be paid earlier than would be paid if such limitations were not in effect and could cause such NOLs to expire unused, in each case reducing or eliminating the benefit of such NOLs. Furthermore, we may not be able to generate sufficient taxable income to utilize our NOLs before they expire. If any of these events occur, we may not derive some or all of the expected benefits from our NOLs. In addition, at the state level there may be periods during which the use of NOLs is suspended or otherwise limited, which would accelerate or may permanently increase state taxes owed.
We may face exposure to foreign currency exchange rate fluctuations.
While we have historically transacted in U.S. dollars with substantially all of our customers and vendors, we have transacted in foreign currencies and may transact in foreign currencies in the future. In addition, any international subsidiaries will maintain net assets that are denominated in currencies other than the functional operating currencies of these entities. Accordingly, changes in the value of foreign currencies relative to the U.S. dollar can affect our revenue and operating results due to transactional and translational remeasurement that is reflected in our earnings. As a result of such foreign currency exchange rate fluctuations, it could be more difficult to detect underlying trends in our business and results of operations. In addition, to the extent that fluctuations in currency exchange rates cause our results of operations to differ from our expectations or the expectations of our investors, the trading price of our common stock could be adversely affected. We do not currently maintain a program to hedge transactional exposures in foreign currencies. However, in the future, we may use derivative instruments, such as foreign currency forward and option contracts, to hedge certain exposures to fluctuations in foreign currency exchange rates. The use of such hedging activities may not offset any or more than a portion of the adverse financial effects of unfavorable movements in foreign exchange rates over the limited time the hedges are in place. Moreover, the use of hedging instruments may introduce additional risks if we are unable to structure effective hedges with such instruments.
Weakened global economic conditions may harm our industry, business, and results of operations.
Our overall performance depends in part on worldwide economic conditions. Global financial developments and downturns seemingly unrelated to us or the information technology industry may harm us. The United States and other key international economies have been impacted by falling demand for a variety of goods and services, restricted credit, poor liquidity, reduced corporate profitability, volatility in credit, equity and foreign exchange markets, bankruptcies, and overall uncertainty with respect to the economy. In particular, the decision by voters in the United Kingdom to leave the EU has resulted in significant and wide-ranging economic effects across multiple markets. A withdrawal could, among other outcomes, disrupt the free movement of goods, services, and people between the United Kingdom and the EU, undermine bilateral cooperation in key policy areas, and significantly disrupt trade between the United Kingdom and the EU. In addition, a withdrawal could lead to legal uncertainty and potentially divergent national laws and regulations as the United Kingdom determines which EU laws to replace or replicate. Given the lack of comparable precedent, it is unclear what financial, trade, and legal implications the withdrawal of the United Kingdom from the EU would have and how such withdrawal would affect us.
The revenue growth and potential profitability of our business depends on demand for software applications and products generally, and application performance monitoring and our other digital intelligence offerings specifically. In addition, our revenue is dependent on the number of users of our products and the degree of adoption of such users with respect to our digital intelligence products and platform capabilities. Historically, during economic downturns there have been reductions in spending on information technology systems as well as pressure for extended billing terms and other financial concessions, which would limit our ability to grow our business and negatively affect our operating results. These conditions affect the rate of information technology spending and could adversely affect our customers’ ability or willingness to purchase our products, delay prospective customers’ purchasing decisions, reduce the value or duration of their subscriptions, or affect renewal rates, all of which could harm our operating results.
26
Natural disasters and other events beyond our control could harm our business.
Natural disasters or other catastrophic events may cause damage or disruption to our operations, international commerce, and the global economy, and thus could have a strong negative effect on us. Our business operations are subject to interruption by natural disasters, fire, power shortages, pandemics, and other events beyond our control. We rely on our network and third-party infrastructure and enterprise applications, internal technology systems, and our website for our development, marketing, operational support, hosted products, and sales activities. The west coast of the United States contains active earthquake zones. Although we maintain crisis management and disaster response plans, in the event of a major earthquake, hurricane, or catastrophic event such as fire, power loss, telecommunications failure, cyber-attack, war, or terrorist attack, we may be unable to continue our operations and may endure system interruptions, reputational harm, delays in our product development, lengthy interruptions in service, breaches of data security, and loss of critical data, all of which could have an adverse effect on our future operating results.
The requirements of being a public company may strain our resources, divert management’s attention, and affect our ability to attract and retain executive management and qualified board members.
As a public company, we are subject to the reporting requirements of the Exchange Act, the Sarbanes-Oxley Act, the Dodd-Frank Wall Street Reform and Consumer Protection Act of 2010, the listing requirements of the New York Stock Exchange, and other applicable securities rules and regulations. Compliance with these rules and regulations increase our legal and financial compliance costs, make some activities more difficult, time-consuming, or costly, and increase demand on our systems and resources. The Exchange Act requires, among other things, that we file annual, quarterly, and current reports with respect to our business and operating results. The Sarbanes-Oxley Act requires, among other things, that we maintain effective disclosure controls and procedures and internal control over financial reporting. In order to maintain and, if required, improve our disclosure controls and procedures and internal control over financial reporting to meet this standard, significant resources and management oversight is required. We are required to disclose changes made in our internal control and procedures on a quarterly basis and we are required to furnish a report by management on, among other things, the effectiveness of our internal control over financial reporting. As a result of the complexity involved in complying with the rules and regulations applicable to public companies, our management’s attention may be diverted from other business concerns, which could adversely affect our business and operating results. Although we have already hired additional employees and have engaged outside consultants to assist us in complying with these requirements, we may need to hire more employees in the future or engage additional outside consultants, which will increase our operating expenses.
In addition, changing laws, regulations, and standards relating to corporate governance and public disclosure are creating uncertainty for public companies, increasing legal and financial compliance costs, and making some activities more time consuming. These laws, regulations, and standards are subject to varying interpretations, in many cases due to their lack of specificity, and, as a result, their application in practice may evolve over time as new guidance is provided by regulatory and governing bodies. This could result in continuing uncertainty regarding compliance matters and higher costs necessitated by ongoing revisions to disclosure and governance practices. We intend to invest substantial resources to comply with evolving laws, regulations, and standards, and this investment may result in increased general and administrative expenses and a diversion of management’s time and attention from revenue-generating activities to compliance activities. If our efforts to comply with new laws, regulations, and standards differ from the activities intended by regulatory or governing bodies due to ambiguities related to their application and practice, regulatory authorities may initiate legal proceedings against us and our business may be adversely affected.
Being a public company and these new rules and regulations have made it more expensive for us to obtain director and officer liability insurance, and in the future we may be required to accept reduced coverage or incur substantially higher costs to obtain coverage. These factors could also make it more difficult for us to attract and retain qualified members of our board of directors, particularly to serve on our audit committee and compensation committee, and qualified executive officers.
As a result of disclosure of information in our filings with the SEC, our business and financial condition have become more visible, which we believe may result in threatened or actual litigation, including by competitors and other third parties. If such claims are successful, our business and operating results could be adversely affected, and even if the claims do not result in litigation or are resolved in our favor, these claims, and the time and resources necessary to resolve them, could divert the resources of our management and adversely affect our business and operating results.
27
Our quarterly results may fluctuate, and if we fail to meet the expectations of analysts or investors, our stock price and the value of your investment could decline substantially.
Our quarterly financial results may fluctuate widely as a result of the risks and uncertainties described in this report, many of which are outside of our control. If our financial results fall below the expectations of investors or any securities analysts who follow our stock, the price of our common stock could decline substantially.
We believe that quarter-to-quarter comparisons of our revenue, operating results, and cash flows may not be meaningful and should not be relied upon as an indication of future performance. If our revenue or operating results fall below the expectations of investors or securities analysts in a particular quarter, or below any guidance we may provide, the price of our common stock could decline.
Our stock price has been subject to fluctuations, and will likely continue to be subject to fluctuations, which may be volatile and due to factors beyond our control.
The market price of our common stock is subject to wide fluctuations in response to various factors, some of which are beyond our control. Since shares of our common stock were sold in our IPO in December 2014 at a price of $23.00 per share, the reported high and low sales prices of our common stock has ranged from $40.13 to $20.39 through March 31, 2017. In addition to the factors discussed in this “Risk Factors” section and elsewhere in this report, factors that could cause fluctuations in the market price of our common stock include the following:
• | actual or anticipated fluctuations in our operating results; |
• | the financial projections we may provide to the public, any changes in these projections, or our failure to meet these projections; |
• | failure of securities analysts to initiate or maintain coverage of our company, changes in financial estimates and publication of other news by any securities analysts who follow our company, or our failure to meet these estimates or the expectations of investors; |
• | ratings changes by any securities analysts who follow our company; |
• | announcements by us or our competitors of significant technical innovations, acquisitions, strategic partnerships, joint ventures, or capital commitments; |
• | changes in operating performance and stock market valuations of other technology companies generally, or those in our industry in particular; |
• | price and volume fluctuations in the overall stock market from time to time, including as a result of trends in the economy as a whole; |
• | changes in accounting standards, policies, guidelines, interpretations, or principles, such as the adoption of FASB issued Topic 606, the new revenue recognition standard; |
• | actual or anticipated developments in our business or our competitors’ businesses or the competitive landscape generally; |
• | developments or disputes concerning our intellectual property or our products and platform capabilities, or third-party proprietary rights; |
• | announced or completed acquisitions of businesses or technologies by us or our competitors; |
• | new laws or regulations or new interpretations of existing laws, or regulations applicable to our business; |
• | changes in our board of directors or management; |
• | sales of shares of our common stock by us, our officers, directors, or other stockholders; |
• | lawsuits filed or threatened against us; and |
• | other events or factors, including those resulting from war, incidents of terrorism, or responses to these events. |
In addition, the market for technology stocks and the stock markets in general have experienced extreme price and volume fluctuations. Stock prices of many technology companies have fluctuated in a manner unrelated or disproportionate to the operating performance of those companies. In the past, stockholders have instituted securities class action litigation following periods of market volatility. If we were to become involved in securities litigation, it could subject us to substantial costs, divert resources and the attention of management from our business, and adversely affect our business, results of
28
operations, financial condition, and cash flows. A decline in the value of our common stock, including as a result of one or more factors set forth above, may result in substantial losses for our stockholders.
Substantial future sales of shares of our common stock could cause the market price of our common stock to decline.
The market price of our common stock could decline as a result of substantial sales of our common stock, particularly sales by our directors, executive officers, and significant stockholders, a large number of shares of our common stock becoming available for sale, or the perception in the market that holders of a large number of shares intend to sell their shares. Additionally, the shares of common stock subject to outstanding options under our equity incentive plans and the shares reserved for future issuance under our equity incentive plans, as well as shares issuable upon vesting of restricted stock awards, will become eligible for sale in the public market in the future, subject to certain legal and contractual limitations. Moreover, some holders of shares of our common stock have rights, subject to certain conditions, to require us to file registration statements covering their shares or to include their shares in registration statements that we may file for ourselves or our stockholders. We have also registered shares of common stock that we may issue under our employee equity incentive plans. Accordingly, these shares may be able to be sold freely in the public market upon issuance as permitted by any applicable vesting requirements.
If securities or industry analysts do not continue to publish research or publish inaccurate or unfavorable research about our business, our stock price and trading volume could decline.
The trading market for our common stock depends in part on the research and reports that securities or industry analysts publish about us or our business. If industry analysts cease coverage of us, the trading price for our common stock would be negatively affected. If one or more of the analysts who cover us downgrade our common stock or publish inaccurate or unfavorable research about our business, our common stock price would likely decline. If one or more of these analysts cease coverage of us or fail to publish reports on us regularly, demand for our common stock could decrease, which might cause our common stock price and trading volume to decline. In addition, independent industry analysts, such as Gartner and Forrester, often provide reviews of our products and platform capabilities, as well as those of our competitors, and perception of our offerings in the marketplace may be significantly influenced by these reviews. We have no control over what these industry analysts report, and because industry analysts may influence current and potential customers, our brand could be harmed if they do not provide a positive review of our products and platform capabilities or view us as a market leader.
Anti-takeover provisions in our charter documents and under Delaware law could make an acquisition of our company more difficult, limit attempts by our stockholders to replace or remove our current management and limit the market price of our common stock.
Provisions in our amended and restated certificate of incorporation and amended and restated bylaws may have the effect of delaying or preventing a change of control or changes in our management. Our amended and restated certificate of incorporation and amended and restated bylaws include provisions that:
• | authorize our board of directors to issue, without further action by the stockholders, shares of undesignated preferred stock with terms, rights, and preferences determined by our board of directors that may be senior to our common stock; |
• | require that any action to be taken by our stockholders be effected at a duly called annual or special meeting and not by written consent; |
• | specify that special meetings of our stockholders can be called only by our board of directors, the Chairman of our board of directors, or our Chief Executive Officer; |
• | establish an advance notice procedure for stockholder proposals to be brought before an annual meeting, including proposed nominations of persons for election to our board of directors; |
• | provide that our board of directors is divided into three classes, with each class serving three-year staggered terms; |
• | prohibit cumulative voting in the election of directors; |
• | provide that our directors may be removed only for cause; |
• | provide that vacancies on our board of directors may be filled only by a majority of directors then in office, even though less than a quorum; and |
29
• | require the approval of our board of directors or the holders of at least seventy-five percent (75%) of our outstanding shares of capital stock to amend our bylaws and certain provisions of our certificate of incorporation. |
These provisions may frustrate or prevent any attempts by our stockholders to replace or remove our current management by making it more difficult for stockholders to replace members of our board of directors, which is responsible for appointing the members of our management. In addition, because we are incorporated in Delaware, we are governed by the provisions of Section 203 of the Delaware General Corporation Law, which generally prohibits a Delaware corporation from engaging in any of a broad range of business combinations with any “interested” stockholder for a period of three years following the date on which the stockholder became an “interested” stockholder. Any delay or prevention of a change of control transaction or changes in our management could cause the market price of our common stock to decline.
We do not intend to pay dividends on our common stock so any returns will be limited to changes in the value of our common stock.
We have never declared or paid any cash dividends on our common stock. We currently anticipate that we will retain future earnings for the development, operation, and expansion of our business and do not anticipate declaring or paying any cash dividends for the foreseeable future. In addition, our ability to pay cash dividends on our common stock may be prohibited or limited by the terms of any future debt financing arrangements. Any return to stockholders will therefore be limited to the increase, if any, of our stock price, which may never occur.
Item 1B. Unresolved Staff Comments
Not applicable.
Item 2. Properties
Our corporate headquarters is located in San Francisco, California and consists of approximately 73,591 square feet of space under a lease that expires in July 2020. In addition to our headquarters, we lease approximately 42,201 square feet of additional office space in San Francisco under a lease that expires in October 2023. Our San Francisco offices include sales, marketing, business operations, and executive offices. In addition to our San Francisco offices, we lease space in Portland, Oregon as our primary research and development office under a lease that expires in June 2023. We also lease space in Dublin, Ireland for our European headquarters, which includes sales, customer support and business operations, and Barcelona, Spain, where we conduct additional research and development operations.
We do not own any real property and we lease or otherwise rent all of our facilities. We intend to procure additional space as we add employees and expand geographically. We believe our facilities are adequate and suitable for our current needs and that, should it be needed, suitable additional or alternative space will be available to accommodate any such expansion of our operations.
Item 3. Legal Proceedings
On November 5, 2012, CA, Inc. filed an action against us in the U.S. District Court for the Eastern District of New York alleging that we willfully infringe certain of its U.S. patents. CA, Inc. asserts that a portion of our application performance management software—the .NET and Java agents—infringes certain claims of those patents. Among other things, CA, Inc. has sought permanent injunctive relief against us and damages in an amount to be determined at trial. Specifically, CA, Inc. alleges in the complaint that we willfully infringe certain CA, Inc. United States Patents, including U.S. Patent Nos. 7,225,361 B2, or the ’361 patent, 7,512,935 B1, or the ’935 patent, and 7,797,580 B2, or the ’580 patent. Discovery is complete in the case, and the court has ruled on summary judgment motions filed by both parties. On April 8, 2015, the court granted CA, Inc.’s partial summary judgment motion seeking to estop New Relic from contesting the validity of the ’361 and ’580 patents. On September 28, 2015, the court granted New Relic’s partial summary judgment motion as to non-infringement of the ’935 patent by the Java and .NET agents, and denied summary judgment as to invalidity of the ’935 patent. Following the court’s summary judgment rulings, the only remaining claims for infringement in this litigation are CA, Inc.’s assertions that the Java agent infringes asserted claims of the ’361 and ’580 patents. A trial date is not currently set.
We intend to continue to contest this lawsuit vigorously. If this matter has an adverse outcome, it may have an impact on our financial position, results from operations, or cash flows. Should CA, Inc. prevail on its claims, we could be required to pay substantial damages for past sales of such products, enjoined from using and selling such products if a license or other right to continue selling our products is not made available to us, and required to pay substantial ongoing royalties and comply with unfavorable terms if such a license is made available to us. Any of these outcomes could result in a material adverse effect on
30
our business. However, we cannot at this time predict the likely outcome of this proceeding or estimate the amount or range of loss or possible loss that may arise from it. Even if we were to prevail, litigation is costly and time-consuming, and could divert the attention of our management and key personnel from our business operations and dissuade potential customers from purchasing our products, either of which could materially harm our business.
During the course of litigation, we anticipate announcements of the results of hearings and motions, and other interim developments related to the litigation, which our competitors could try to use to their competitive advantage by creating uncertainty amongst our customers. If securities analysts or investors regard these announcements as negative, the market price of our common stock may decline.
In addition, from time to time, we are involved in legal proceedings and are subject to claims arising in the ordinary course of our business. Although the results of litigation and claims cannot be predicted with certainty, we currently believe that the final outcome of these ordinary course matters will not have a material adverse effect on our business, operating results, financial condition, or cash flows. Regardless of the outcome, litigation can have an adverse impact on us because of defense and settlement costs, diversion of management resources, and other factors.
Item 4. Mine Safety Disclosures
Not applicable.
31
PART II
Item 5. Market for Registrant’s Common Equity, Related Stockholder Matters and Issuer Purchases of Equity Securities
Market Information for Common Stock
Our common stock began trading on the New York Stock Exchange under the symbol “NEWR” on December 12, 2014. Prior to that date, there was no public trading market for our common stock. The following table sets forth the high and low sales price per share of our common stock as reported on the New York Stock Exchange for trading days during the periods indicated:
Fiscal Year Ended March 31, 2016 | High | Low | |||||
First Quarter | $ | 35.97 | $ | 30.26 | |||
Second Quarter | $ | 39.99 | $ | 30.56 | |||
Third Quarter | $ | 40.13 | $ | 33.17 | |||
Fourth Quarter | $ | 36.23 | $ | 20.39 | |||
Fiscal Year Ended March 31, 2017 | High | Low | |||||
First Quarter | $ | 32.71 | $ | 23.55 | |||
Second Quarter | $ | 38.72 | $ | 28.76 | |||
Third Quarter | $ | 38.47 | $ | 27.85 | |||
Fourth Quarter | $ | 40.10 | $ | 28.40 | |||
Holders of Record
As of May 11, 2017, there were 98 holders of record of our common stock. Because many of our shares are held by brokers and other institutions on behalf of stockholders, we are unable to estimate the total number of stockholders represented by these record holders.
Dividend Policy
We have never declared or paid any cash dividend on our capital stock. We currently intend to retain all available funds and any future earnings for use in the operation of our business and do not anticipate paying any dividends on our common stock in the foreseeable future, if at all. Any future determination to declare cash dividends will be made at the discretion of our board of directors, subject to applicable laws, and will depend on a number of factors, including our financial condition, operating results, capital requirements, contractual restrictions, general business conditions, and other factors that our board of directors may deem relevant.
Recent Sales of Unregistered Securities
There were no sales of unregistered securities during the period covered by this Annual Report on Form 10-K, other than those previously reported in a Quarterly Report on Form 10-Q or in a Current Report on Form 8-K.
Use of Proceeds from Registered Securities
On December 17, 2014, we closed our initial public offering, or IPO, of 5,750,000 shares of our common stock, including 750,000 shares of common stock from the full exercise of the option to purchase additional shares granted to the underwriters, at a price to the public of $23.00 per share. The offer and sale of all of the shares in our IPO were registered under the Securities Act of 1933, as amended, or the Securities Act, pursuant to a registration statement on Form S-1 (File No. 333-200078), which was declared effective by the SEC on December 11, 2014.
There has been no material change in the planned use of proceeds from our IPO as described in our final prospectus filed with the SEC on December 12, 2014 pursuant to Rule 424(b)(4). Pending the uses described, we have invested the net proceeds from the offering in short-term, investment-grade interest-bearing securities such as money market accounts, certificates of deposit, commercial paper, and guaranteed obligations of the U.S. government.
32
Stock Performance Graph
This performance graph shall not be deemed “soliciting material” or to be “filed” with the SEC for purposes of Section 18 of the Exchange Act, or otherwise subject to the liabilities under that Section, and shall not be deemed to be incorporated by reference into any filing of New Relic, Inc. under the Securities Act.
The following graph compares the cumulative total return to stockholders on our common stock relative to the cumulative total returns of the Standard & Poor’s 500 Index, or S&P 500, and the Standard & Poor’s Composite 1500 Information Technology Index, or S&P 1500 IT. An investment of $100 (with reinvestment of all dividends) is assumed to have been made in our common stock and in each index on December 12, 2014, the date our common stock began trading on the NYSE, and its relative performance is tracked through March 31, 2017. The returns shown are based on historical results and are not intended to suggest future performance.
Comparison of Cumulative Total Return
Among New Relic, Inc., the S&P 500 Index, and the S&P Composite 1500 IT Index
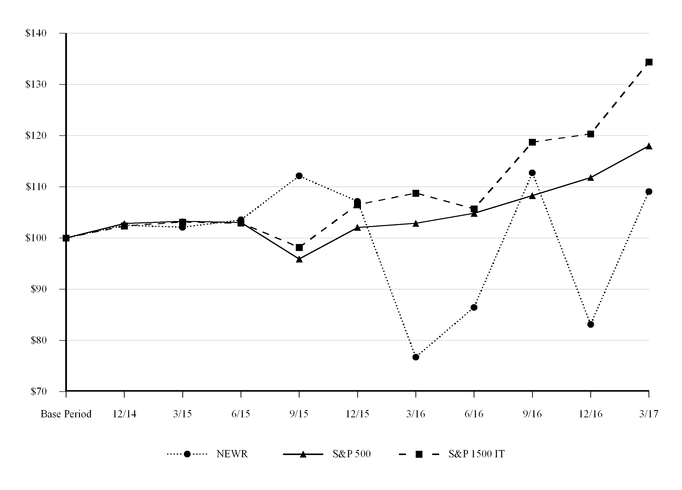
Base Period 12/12/14 | 12/31/14 | 3/31/15 | 6/30/15 | 9/30/15 | 12/31/15 | 3/31/16 | 6/30/16 | 9/30/16 | 12/31/16 | 3/31/17 | |||||||||||||||||||||||||||||||||
New Relic, Inc. | $ | 100.00 | $ | 102.50 | $ | 102.09 | $ | 103.53 | $ | 112.12 | $ | 107.18 | $ | 76.73 | $ | 86.44 | $ | 112.74 | $ | 83.11 | $ | 109.06 | |||||||||||||||||||||
S&P 500 | $ | 100.00 | $ | 102.83 | $ | 103.27 | $ | 103.04 | $ | 95.89 | $ | 102.08 | $ | 102.87 | $ | 104.82 | $ | 108.29 | $ | 111.81 | $ | 118.00 | |||||||||||||||||||||
S&P Composite 1500 Information Technology | $ | 100.00 | $ | 102.37 | $ | 103.12 | $ | 102.95 | $ | 98.19 | $ | 106.51 | $ | 108.77 | $ | 105.71 | $ | 118.74 | $ | 120.36 | $ | 134.40 | |||||||||||||||||||||
Issuer Purchases of Equity Securities
No shares of our common stock were repurchased during the three months ended March 31, 2017.
33
Item 6. Selected Financial Data
We have derived the selected consolidated statements of operations data for the fiscal years ended March 31, 2017, 2016, and 2015, and the consolidated balance sheet data as of March 31, 2017 and 2016 from our audited consolidated financial statements included elsewhere in this Annual Report on Form 10-K. The consolidated statements of operations data for the fiscal years ended March 31, 2014 and 2013 and the consolidated balance sheet data as of March 31, 2015, 2014, and 2013 have been derived from our audited consolidated financial statements not included in this Annual Report on Form 10-K. The selected consolidated financial data below should be read in conjunction with the section entitled “Management’s Discussion and Analysis of Financial Condition and Results of Operations” and our consolidated financial statements and related notes included elsewhere in this report. The selected consolidated financial data in this section are not intended to replace our consolidated financial statements and the related notes, and are qualified in their entirety by the consolidated financial statements and related notes included elsewhere in this report. Our historical results are not necessarily indicative of the results that may be expected for any period in the future.
Year Ended March 31, | |||||||||||||||||||
2017 | 2016 | 2015 | 2014 | 2013 | |||||||||||||||
(in thousands, except per share data) | |||||||||||||||||||
Consolidated Statements of Operations Data: | |||||||||||||||||||
Revenue | $ | 263,479 | $ | 181,309 | $ | 110,391 | $ | 63,174 | $ | 29,664 | |||||||||
Cost of revenue (1) | 49,990 | 37,183 | 21,802 | 10,780 | 5,078 | ||||||||||||||
Gross profit | 213,489 | 144,126 | 88,589 | 52,394 | 24,586 | ||||||||||||||
Operating expenses: | |||||||||||||||||||
Research and development (1) | 61,054 | 46,394 | 24,024 | 16,496 | 8,565 | ||||||||||||||
Sales and marketing (1) | 168,163 | 129,677 | 89,162 | 58,156 | 28,365 | ||||||||||||||
General and administrative (1) | 45,615 | 35,693 | 25,319 | 17,178 | 10,053 | ||||||||||||||
Total operating expenses | 274,832 | 211,764 | 138,505 | 91,830 | 46,983 | ||||||||||||||
Loss from operations | (61,343 | ) | (67,638 | ) | (49,916 | ) | (39,436 | ) | (22,397 | ) | |||||||||
Other income (expense): | |||||||||||||||||||
Interest income | 1,189 | 647 | 176 | 16 | 9 | ||||||||||||||
Interest expense | (87 | ) | (68 | ) | (104 | ) | (64 | ) | (48 | ) | |||||||||
Other expense, net | (572 | ) | (126 | ) | (390 | ) | (741 | ) | (105 | ) | |||||||||
Loss before income taxes | (60,813 | ) | (67,185 | ) | (50,234 | ) | (40,225 | ) | (22,541 | ) | |||||||||
Income tax provision (benefit) | 264 | 302 | (85 | ) | — | — | |||||||||||||
Net loss | $ | (61,077 | ) | $ | (67,487 | ) | $ | (50,149 | ) | $ | (40,225 | ) | $ | (22,541 | ) | ||||
Net loss per share, basic and diluted (2) | $ | (1.18 | ) | $ | (1.39 | ) | $ | (1.98 | ) | $ | (2.58 | ) | $ | (1.49 | ) | ||||
Weighted-average shares used to compute net loss per share, basic and diluted (2) | 51,715 | 48,410 | 25,290 | 15,596 | 15,096 | ||||||||||||||
(1) | Includes stock-based compensation expense as follows: |
Year Ended March 31, | |||||||||||||||||||
2017 | 2016 | 2015 | 2014 | 2013 | |||||||||||||||
(in thousands) | |||||||||||||||||||
Cost of revenue | $ | 1,847 | $ | 1,238 | $ | 591 | $ | 159 | $ | 212 | |||||||||
Research and development | 9,975 | 6,659 | 2,055 | 1,425 | 1,620 | ||||||||||||||
Sales and marketing | 13,042 | 9,258 | 5,108 | 1,373 | 2,060 | ||||||||||||||
General and administrative | 7,082 | 6,113 | 3,912 | 3,263 | 4,794 | ||||||||||||||
Total stock-based compensation expense | $ | 31,946 | $ | 23,268 | $ | 11,666 | $ | 6,220 | $ | 8,686 | |||||||||
(2) | See notes 1 and 11 of the notes to our consolidated financial statements for a description of how we compute net loss per share, basic and diluted. |
34
As of March 31, | |||||||||||||||||||
2017 | 2016 | 2015 | 2014 | 2013 | |||||||||||||||
(in thousands) | |||||||||||||||||||
Consolidated Balance Sheet Data: | |||||||||||||||||||
Cash and cash equivalents | $ | 88,305 | $ | 65,914 | $ | 105,257 | $ | 19,453 | $ | 57,099 | |||||||||
Short-term investments | 118,101 | 125,414 | 95,503 | — | — | ||||||||||||||
Working capital | 121,274 | 136,748 | 174,807 | 8,026 | 51,116 | ||||||||||||||
Total assets | 352,269 | 294,444 | 264,711 | 55,208 | 76,907 | ||||||||||||||
Deferred revenue | 126,404 | 74,723 | 29,309 | 10,359 | 4,970 | ||||||||||||||
Convertible preferred stock warrant liability | — | — | — | 830 | 112 | ||||||||||||||
Total liabilities | 165,425 | 101,211 | 49,841 | 23,956 | 12,229 | ||||||||||||||
Convertible preferred stock | — | — | — | 95,917 | 95,917 | ||||||||||||||
Total stockholders’ equity (deficit) | 186,844 | 193,233 | 214,870 | (64,665 | ) | (31,239 | ) | ||||||||||||
Item 7. Management’s Discussion and Analysis of Financial Condition and Results of Operations
The following discussion and analysis of our financial condition and results of operations should be read in conjunction with our consolidated financial statements and related notes appearing elsewhere in this Annual Report on Form 10-K. The following discussion and analysis contains forward-looking statements that involve risks and uncertainties. When reviewing the discussion below, you should keep in mind the substantial risks and uncertainties that could impact our business. In particular, we encourage you to review the risks and uncertainties described in Part I, Item 1A “Risk Factors” included elsewhere in this report. These risks and uncertainties could cause actual results to differ materially from those projected in forward-looking statements contained in this report or implied by past results and trends. Forward-looking statements are statements that attempt to forecast or anticipate future developments in our business, financial condition or results of operations. See the section titled “Special Note Regarding Forward-Looking Statements” in this report. These statements, like all statements in this report, speak only as of their date (unless another date is indicated), and we undertake no obligation to update or revise these statements in light of future developments.
Overview
We help companies see their digital business more clearly. Our cloud-based platform and suite of products, which we call the New Relic Digital Intelligence Platform, enables organizations to collect, store, and analyze massive amounts of data in real time so they can better understand their application and infrastructure performance, improve their digital customer experience, and achieve business success. We design all our products to be highly intuitive and frictionless; they are easy to deploy, and customers can rapidly, often within minutes, realize benefits and results. Software developers can build better applications faster, as they can see how their software will perform and is actually performing for end-users. IT operations teams can use our products to quickly find and fix performance problems as well as prevent future issues. Business users such as product managers can get answers to how their new product launch is being received, or how a pricing change impacted customer retention, without waiting for help from IT. For each of these audiences—software developers, IT operations, and business users—we aim to be the first, best place to look to understand their digital business.
We were founded in 2007 and we launched our first product offering, New Relic APM (Application Performance Management), in 2008. Since then, we have broadened our product offerings to support a wide variety of programming languages and frameworks and have added a number of additional products and platform capabilities that now form the New Relic Digital Intelligence Platform. For example, in 2013, we released New Relic Mobile to support mobile by providing native mobile application performance management for the iOS and Android mobile operating systems; in 2014, we released New Relic Browser to improve browser-side performance, New Relic Synthetics to enable our users to test their software through simulated usage and New Relic Insights to leverage big data analytics; and in 2016, we released New Relic Infrastructure to provide real-time visibility into critical configuration changes that affect a company’s cloud infrastructure.
We sell our products primarily through direct sales and marketing channels utilizing a wide range of online and offline sales and marketing activities. The majority of our users visit our website, create an account, and deploy our software. Many users initially subscribe to one of our products to address a particular use case and broaden the usage of our products as they become more familiar with our products. For larger mid-market and enterprise organizations, our sales team focuses on leveraging users in existing accounts to expand our product users and usage across the organization. Although enterprise organizations constitute a minority of our total paid business accounts, the revenue we receive from enterprise companies is on pace to provide a majority of our overall revenue by the end of the year ended March 31, 2018.
35
We offer access to the New Relic Digital Intelligence Platform under subscription plans that also include service and support. Our plans typically have terms of one year, although some of our customers commit for shorter or longer periods. We recognize revenue from subscription fees ratably over the service period. Historically, most of our customers have paid us on a monthly basis. As a result, our deferred revenue at any given period of time has been relatively low. In recent periods we have secured an increased percentage of multi-year commitments, which has grown as we have sold more to larger organizations. Because we generally invoice many of these larger organizations less frequently, our deferred revenue has increased over time, and we expect it to continue to increase on a year-over-year basis. However, due to our mix of subscription plans and billing frequencies, we do not believe that changes in our deferred revenue in a given period are directly correlated with our revenue growth.
We have grown rapidly in recent periods, with revenue for the year ended March 31, 2017, 2016, and 2015 of $263.5 million, $181.3 million, and $110.4 million, respectively, representing 45% growth from 2016 to 2017 and 64% growth from 2015 to 2016. We expect that the rate of growth in our revenue will decline over the long term as our business scales, even if our revenue continues to grow in absolute terms. We have continued to make significant expenditures and investments, including in personnel-related costs, sales and marketing, infrastructure and operations, and have incurred net losses in each period since our inception, including net losses of $61.1 million, $67.5 million, and $50.1 million for the years ended March 31, 2017, 2016, and 2015, respectively. Our accumulated deficit as of March 31, 2017 was $260.2 million.
Internationally, we currently offer our products in Europe, Middle East, and Africa, or EMEA; Asia-Pacific, or APAC; and other non-U.S. locations, as determined based on the billing address of our customers, and our revenue from those regions constituted 19%, 8%, and 6%, respectively, of our revenue for the year ended March 31, 2017, 19%, 8%, and 6%, respectively, of our revenue for the year ended March 31, 2016, and 19%, 8%, and 7%, respectively, of our revenue for the year ended March 31, 2015. We believe there is further opportunity to increase our international revenue overall and as a proportion of our revenue, and we are increasingly investing in our international operations and intend to invest in further expanding our footprint in international markets.
Our employee headcount has increased to 1,088 employees as of March 31, 2017 from 936 as of March 31, 2016 and we plan to continue to invest aggressively in the growth of our business to take advantage of our market opportunity. For example, we intend to continue to increase our investment in sales and marketing, as we further expand our sales teams, increase our marketing activities, and grow our international operations, particularly as we increase our sales to larger organizations. In addition, we plan to continue to invest in our research and development organization to enhance and further develop our products and platform capabilities.
While these areas represent significant opportunities for us, we also face significant risks and challenges that we must successfully address in order to sustain the growth of our business and improve our operating results. We are continuing to incur expenses in the near term as we continue to invest in the growth of our sales and expansion of paid business accounts. However, we may not realize any long-term benefit from these investments in the growth of our business. In addition, any investments that we make in sales and marketing or other areas will occur in advance of our experiencing any benefits from such investments, so it may be difficult for us to determine if we are efficiently allocating our resources in these areas. As a result, we have never achieved profitability and we do not expect to be profitable for the foreseeable future. Further, our reported revenue, operating results, and cash flows for a given period may not be indicative of future results due to our limited operating history and fluctuations in the number of new employees, the rate of our expansion, the timing of expenses we incur to grow our business and operations, levels of competition, and market demand for our products.
Factors Affecting Our Performance
Market Adoption of Our Products. We are defining a new category of software, which we refer to as digital intelligence. Our success is dependent on the market adoption of this emerging category of software, which may not yet be well understood by the market. For the foreseeable future, we expect that our revenue growth will be primarily driven by the pace of adoption and penetration of our products and we will incur significant expenses associated with educating the market about the benefits of our products.
Increasing the Number of Paid Business Accounts. Our future growth is dependent on our ability to increase the number of accounts that pay us to use our products. Many users experience our products with a free trial after which they have the option to purchase one or more of our subscription plans. We believe that we have a significant competitive advantage as our users experience the ease of installation and the full set of features that our products deliver during the free trial period.
Retention and Expansion within Paid Business Accounts. A key factor in our success is the retention and expansion of our subscription agreements with our existing customers. In order for us to continue to grow our business, it is important to
36
generate additional revenue from our existing customers, and we do this in several ways. As we improve our existing products and platform capabilities and introduce new products, we believe that the demand for our products will generally grow. We also believe that there is a significant opportunity for us to increase the number of subscriptions we sell to our current customers as they become more familiar with our products and adopt our products to address additional business use cases.
Investment in Sales and Marketing. We expect to continue to invest aggressively in sales and marketing to drive additional revenue. Any investments that we make in sales and marketing will occur in advance of our experiencing any benefits from such investments, so it may be difficult for us to determine if we are efficiently allocating our resources. As we continue to focus sales and marketing investments more heavily towards large organizations, this may require more of our resources. In addition, we expect our sales cycle to be longer and less predictable with respect to larger customers, which may delay realization of future sales. We also intend to increase our sales and marketing investment in international markets, such as Europe, and those markets may take longer and be more costly to develop than the U.S. market.
Key Operating Metrics
We review the following key metrics to evaluate our business, measure our performance, identify trends affecting our business, formulate business plans, and make key strategic decisions:
Number of Paid Business Accounts, Number of Paid Business Accounts with Annual Recurring Revenue over $5,000, and Number of Paid Business Accounts with Annual Recurring Revenue over $100,000. We believe that our ability to increase our number of paid business accounts is one indicator of our market penetration, the growth of our business and our potential future prospects. We define the number of paid business accounts at the end of any particular period as the number of accounts at the end of the period as identified by a unique account identifier for which we have recognized revenue on the last day of the period indicated. A single organization or customer may have multiple paid business accounts for separate divisions, segments, or subsidiaries. We expect the rate at which we add paid business accounts to decrease over time as we scale our business, but it may fluctuate from period to period as a result of the introduction of alternative pricing options for our products or other factors. The following table summarizes the number of paid business accounts at each quarter end presented:
Mar. 31, 2017 | Dec. 31, 2016 | Sept. 30, 2016 | Jun. 30, 2016 | ||||||||
Paid Business Accounts | 15,216 | 14,915 | 14,538 | 14,048 | |||||||
Although presented with specificity in the table above, we anticipate that we will round the number of paid business accounts down to the nearest hundred in future presentations. We believe a rounded number, while still providing investors with a significant understanding of the direction of our business with respect to the factors specified above, reduces the chance that an investor could place undue importance on small changes in the number from quarter to quarter when assessing the success of our business. For example, the increase in paid business accounts in a given quarter may be moderated as a result of a successful expansion within a given enterprise if the customer had multiple operating divisions that are consolidated into a single paid business account. These consolidations could become more prevalent if our enterprise customers centralize account management.
As a subset of our paid business accounts metric, we have in previous presentations provided the number of paid business accounts with annual recurring revenue over $5,000 to investors as an indicator of our business as it relates to the acquisition of larger accounts within our overall customer base, including our market penetration of larger mid-market and enterprise customers, as well as deeper penetration into our existing customer base. For this purpose, we define annual recurring revenue as the revenue we would contractually expect to receive from those customers over the following 12 months, without any increase or reduction in any of their subscriptions. The following table summarizes the number of paid business accounts with annual recurring revenue over $5,000 at each quarter end presented:
Mar. 31, 2017 | Dec. 31, 2016 | Sept. 30, 2016 | Jun. 30, 2016 | ||||||||
Paid Business Accounts > $5,000 | 6,485 | 6,349 | 6,229 | 6,068 | |||||||
We had 6,485 paid business accounts with annual recurring revenue over $5,000 as of March 31, 2017, which was a 10.2% increase compared to 5,887 paid business accounts with annual recurring revenue over $5,000 as of March 31, 2016.
Since the introduction of this additional metric, our annualized revenue per average paid business account has greatly expanded, in significant part due to increased penetration of our existing customer base with expanded product offerings and usage as well as our success in acquiring an increased number of larger mid-market and enterprise paid business accounts. As a
37
result, we now believe that $100,000 would be a more appropriate threshold for annual recurring revenue to show our success in acquiring and expanding our reach with larger mid-market and enterprise customers. Therefore, we intend to use this increased threshold in future presentations instead of the $5,000 threshold. The following table summarizes the number of paid business accounts with annual recurring revenue over $100,000 at each quarter end presented:
Mar. 31, 2017 | Dec. 31, 2016 | Sept. 30, 2016 | Jun. 30, 2016 | ||||||||
Paid Business Accounts > $100,000 | 517 | 478 | 427 | 398 | |||||||
We had 517 paid business accounts with annual recurring revenue over $100,000 as of March 31, 2017, which was a 40.9% increase compared to 367 paid business accounts with annual recurring revenue over $100,000 as of March 31, 2016. We believe this increase reflects our continued sales and marketing focus on larger mid-market and enterprise customers. As with our total paid business accounts and our total paid business accounts with annual recurring revenue over $5,000, we expect the rate at which we add paid business accounts with annual recurring revenue over $100,000 to decrease over time as a result of deeper penetration into the enterprise market.
Percentage of Annualized Recurring Revenue from Enterprise Paid Business Accounts. We believe that our ability to increase the percentage of annualized recurring revenue from enterprise paid business accounts relative to our overall business is an important indicator of our success with respect to our focus in recent periods to improve our market penetration with enterprise companies. We define an enterprise paid business account as a paid business account that we measure to have over 1,000 employees. The following table summarizes the percentages of annualized recurring revenue from enterprise paid business accounts at each quarter end presented:
Mar. 31, 2017 | Dec. 31, 2016 | Sept. 30, 2016 | Jun. 30, 2016 | ||||||||
Percentage of Annualized Recurring Revenue from Enterprise Paid Business Accounts | 46 | % | 44 | % | 43 | % | 43 | % | |||
Our percentage of annualized recurring revenue from enterprise paid business accounts was 46% as of March 31, 2017 compared to 42% as of March 31, 2016. We expect the percentage of annualized recurring revenue from enterprise paid business accounts to increase over time. However, because of the size of our large installed base and potential seasonality in regard to selling into enterprise customers, we believe the percentage may not move significantly from quarter to quarter.
Annualized Revenue per Average Paid Business Account. We believe that our annualized revenue per average paid business account is another indicator of our business as it relates to the acquisition of larger accounts within our overall customer base, including our market penetration of larger mid-market and enterprise customers, as well as deeper penetration into our existing customer base. We define our annualized revenue per average paid business account as the annualized revenue for the current period divided by the average of the number of paid business accounts at the end of the current period and the end of the prior period.
Our annualized revenue per average paid business account for the quarter ended March 31, 2017 grew to $19,471, an increase of 23.5%, from $15,761 for the quarter ended March 31, 2016. We believe this increase reflects our continued focus on larger mid-market and enterprise customers. We have experienced a decrease in the rate of growth of our annualized revenue per average paid business account and we expect the decrease to continue over time as our business scales and we introduce alternative pricing options for our products. Going forward, we expect to round down the annualized revenue per average paid business account to the nearest $500 for the same reasons that we anticipate rounding the number of paid business accounts in future presentations.
Dollar-Based Net Expansion Rate. Our ability to generate revenue is dependent on our ability to maintain and grow our relationships with our existing customers. We track our performance in this area by measuring our dollar-based net expansion rate. Our dollar-based net expansion rate increases when customers increase their use of our products, use additional products, or upgrade to a higher subscription tier. Our dollar-based net expansion rate is reduced when customers decrease their use of our products, use fewer products, or downgrade to a lower subscription tier.
Our dollar-based net expansion rate compares our recurring subscription revenue from customers from one period to the next. We measure our dollar-based net expansion rate on a monthly basis because many of our customers change their subscriptions more frequently than quarterly or annually. To calculate our annual dollar-based net expansion rate, we first establish the base period monthly recurring revenue from all our customers at the end of a month. This represents the revenue
38
we would contractually expect to receive from those customers over the following month, without any increase or reduction in any of their subscriptions. We then (i) calculate the actual monthly recurring revenue from those same customers at the end of that following month; then (ii) divide that following month’s recurring revenue by the base month’s recurring revenue to arrive at our monthly net expansion rate; then (iii) calculate a quarterly net expansion rate by compounding the net expansion rates of the three months in the quarter; and then (iv) calculate our annualized net expansion rate by compounding our quarterly net expansion rate over an annual period.
The following table summarizes our annualized dollar-based net expansion rate for each quarter:
Mar. 31, 2017 | Dec. 31, 2016 | Sept. 30, 2016 | Jun. 30, 2016 | ||||||||
Annualized Dollar-Based Net Expansion Rate | 132.9 | % | 124.6 | % | 116.3 | % | 118.2 | % | |||
The quarterly fluctuations in our dollar-based net expansion rate are primarily driven by transactions within a particular quarter in which certain paid business accounts from larger subscription customers either significantly upgrade or significantly downgrade their subscriptions and by increased sales to existing customers in particular quarters due to sales and marketing campaigns in a particular quarter. In addition, we believe that the composition of our customer base also has an impact on the net expansion rate, such that a relative increase in the number of paid business accounts from larger enterprises versus small to medium-sized organizations will tend to increase our quarterly net expansion rate and a relative increase in the number or paid business accounts from small to medium-sized organizations versus larger enterprises will tend to decrease the quarterly net expansion rate, as smaller businesses tend to cancel subscriptions more frequently than larger enterprises. This rate is also impacted by factors including, but not limited to, new product introductions, promotional activity, mix of customer size, and the variable timing of renewals.
Our annualized dollar-based net expansion rate declined to 132.9% for the three-month period ending March 31, 2017 from 139.7% for the three-month period ending March 31, 2016. In the period ending March 31, 2017, we saw a lower amount of upsell activity relative to our total installed base than the comparable period in the prior year. Although we drove larger upsell activity in absolute dollars during the fiscal quarter, the total installed base was larger than the comparable period in the prior year due to an increase in number of customers, which had a moderating effect on our annualized dollar-based net expansion rate.
Key Components of Results of Operations
Revenue
We offer access to our products under subscription plans that include service and support for one or more of our products. For our paying customers, we offer a variety of pricing plans based on the particular product purchased by an account, number of servers monitored, number of applications monitored, or number of mobile devices monitored. Our plans typically have terms of one year, although some of our customers commit for shorter or longer periods. Historically, most of our customers have paid us on a monthly basis. As a result, our deferred revenue at any given period of time has been relatively low. As we have increased our sales to larger organizations, we have increasingly been invoicing our customers on a less frequent basis, and therefore, we expect our deferred revenue to continue to increase on a year-over-year basis.
Additionally, we expect our business to become more seasonal as mid-market and enterprise customers start to represent a larger percentage of our revenues. The first two quarters of each fiscal year usually have lower sequential deferred revenue growth than the third and fourth fiscal quarters, during which we generally benefit from a larger renewal pool and opportunity to upsell existing customers. As a result, over time we could potentially see stronger sequential revenue results in our fourth and first fiscal quarters as our deferred revenue is recognized. We expect that this seasonality will continue to affect our sales and operating results in the future, which can make it difficult to achieve sequential growth in certain financial metrics or could result in sequential declines on a quarterly basis.
Cost of Revenue
Cost of revenue consists of expenses relating to data center operations, hosting-related costs, payment processing fees, depreciation and amortization, consulting costs, and salaries and benefits of operations and global customer support personnel. Salaries and benefits costs associated with our operations and global customer support personnel consist of salaries, benefits, bonuses, and stock-based compensation. We plan to continue increasing the capacity, capability, and reliability of our infrastructure to support the growth of our customer adoption and the number of products we offer.
39
Gross Profit and Margin
Gross profit is revenue less cost of revenue. Gross margin is gross profit expressed as a percentage of revenue. Our gross margin has been, and will continue to be, affected by a number of factors, including the timing and extent of our investments in our operations and global customer support personnel, hosting-related costs, and the amortization of capitalized software. We expect that our gross margin will decline modestly over the long term, although we expect our gross margin to fluctuate from period to period as a result of these factors.
Operating Expenses
Personnel costs, which consist of salaries, benefits, bonuses, stock-based compensation and, with regard to sales and marketing expenses, sales commissions, are the most significant component of our operating expenses. We also incur other non-personnel costs such as an allocation of our general overhead expenses.
Research and Development. Research and development expenses consist primarily of personnel costs and an allocation of our general overhead expenses. We continue to focus our research and development efforts on adding new features and products, and increasing the functionality and enhancing the ease of use of our existing products. We capitalize the portion of our software development costs that meets the criteria for capitalization.
We plan to continue to hire employees for our engineering, product management, and design teams to support our research and development efforts. As a result, we expect our research and development expenses to continue to increase in absolute dollars for the foreseeable future. However, we expect our research and development expenses to decrease modestly as a percentage of our revenue over the long term, although our research and development expenses may fluctuate from period to period depending on fluctuations in our revenue and the timing and extent of our research and development expenses.
Sales and Marketing. Sales and marketing expenses consist of personnel costs for our sales, marketing, and business development employees and executives. Commissions are expensed in the period when a customer contract is executed. Sales and marketing expenses also include the costs of our marketing and brand awareness programs.
We plan to continue investing in sales and marketing globally by increasing the number of our sales personnel, expanding our domestic and international marketing activities, building brand awareness, and sponsoring additional marketing events. We expect our sales and marketing expenses to continue to increase in absolute dollars and continue to be our largest operating expense category for the foreseeable future. However, we expect our sales and marketing expenses to decrease as a percentage of our revenue over the long term, although our sales and marketing expenses may fluctuate from period to period depending on fluctuations in our revenue and the timing and extent of our sales and marketing expenses.
General and Administrative. General and administrative expenses consist primarily of personnel costs for our administrative, legal, human resources, information technology, finance and accounting employees, and executives. Also included are non-personnel costs, such as legal and other professional fees.
We plan to continue to expand our business both domestically and internationally, and we expect to increase the size of our general and administrative function to support the growth of our business. We also expect that we will continue to incur additional general and administrative expenses as a result of being a publicly traded company. As a result, we expect our general and administrative expenses to continue to increase in absolute dollars for the foreseeable future. However, we expect our general and administrative expenses to decrease modestly as a percentage of our revenue over the long term, although our general and administrative expense may fluctuate from period to period depending on fluctuations in our revenue and the timing and extent of our general and administrative expenses, such as litigation costs.
Other Income (Expense), Net
Other income (expense), net consists primarily of interest income, interest expense, and foreign exchange gains and losses.
40
Results of Operations For Fiscal Years Ended March 31, 2017, 2016, and 2015
The following tables summarize our consolidated statements of operations data for the periods presented and as a percentage of our revenue for those periods. The period to period comparison of results is not necessarily indicative of results for future periods.
Year Ended March 31, | |||||||||||
2017 | 2016 | 2015 | |||||||||
(in thousands) | |||||||||||
Consolidated Statements of Operations Data: | |||||||||||
Revenue | $ | 263,479 | $ | 181,309 | $ | 110,391 | |||||
Cost of revenue (1) | 49,990 | 37,183 | 21,802 | ||||||||
Gross profit | 213,489 | 144,126 | 88,589 | ||||||||
Operating expenses: | |||||||||||
Research and development (1) | 61,054 | 46,394 | 24,024 | ||||||||
Sales and marketing (1) | 168,163 | 129,677 | 89,162 | ||||||||
General and administrative (1) | 45,615 | 35,693 | 25,319 | ||||||||
Total operating expenses | 274,832 | 211,764 | 138,505 | ||||||||
Loss from operations | (61,343 | ) | (67,638 | ) | (49,916 | ) | |||||
Other income (expense): | |||||||||||
Interest income | 1,189 | 647 | 176 | ||||||||
Interest expense | (87 | ) | (68 | ) | (104 | ) | |||||
Other expense, net | (572 | ) | (126 | ) | (390 | ) | |||||
Loss before income taxes | (60,813 | ) | (67,185 | ) | (50,234 | ) | |||||
Income tax provision (benefit) | 264 | 302 | (85 | ) | |||||||
Net loss | $ | (61,077 | ) | $ | (67,487 | ) | $ | (50,149 | ) | ||
(1) | Includes stock-based compensation expense as follows: |
Year Ended March 31, | |||||||||||
2017 | 2016 | 2015 | |||||||||
(in thousands) | |||||||||||
Cost of revenue | $ | 1,847 | $ | 1,238 | $ | 591 | |||||
Research and development | 9,975 | 6,659 | 2,055 | ||||||||
Sales and marketing | 13,042 | 9,258 | 5,108 | ||||||||
General and administrative | 7,082 | 6,113 | 3,912 | ||||||||
Total stock-based compensation expense | $ | 31,946 | $ | 23,268 | $ | 11,666 | |||||
41
Year Ended March 31, | ||||||||
2017 | 2016 | 2015 | ||||||
(as a percentage of revenue) | ||||||||
Revenue | 100 | % | 100 | % | 100 | % | ||
Cost of revenue (1) | 19 | 20 | 20 | |||||
Gross profit | 81 | 80 | 80 | |||||
Operating expenses: | ||||||||
Research and development (1) | 23 | 25 | 21 | |||||
Sales and marketing (1) | 64 | 72 | 81 | |||||
General and administrative (1) | 17 | 20 | 23 | |||||
Total operating expenses | 104 | 117 | 125 | |||||
Loss from operations | (23 | ) | (37 | ) | (45 | ) | ||
Other income (expense): | ||||||||
Interest income | — | — | — | |||||
Interest expense | — | — | — | |||||
Other expense, net | — | — | — | |||||
Income tax provision (benefit) | (23 | ) | (37 | ) | (45 | ) | ||
Benefit from income taxes | — | — | — | |||||
Net loss | (23 | %) | (37 | %) | (45 | %) | ||
(1) | Includes stock-based compensation expense as follows: |
Year Ended March 31, | ||||||||
2017 | 2016 | 2015 | ||||||
(as a percentage of revenue) | ||||||||
Cost of revenue | 1 | % | 1 | % | 1 | % | ||
Research and development | 4 | 4 | 2 | |||||
Sales and marketing | 5 | 5 | 5 | |||||
General and administrative | 2 | 3 | 4 | |||||
Total stock-based compensation expense | 12 | % | 13 | % | 12 | % | ||
Revenue
Year Ended March 31, | Change | Year Ended March 31, | Change | ||||||||||||||||||||||||||
2017 | 2016 | Amount | % | 2016 | 2015 | Amount | % | ||||||||||||||||||||||
(dollars in thousands) | |||||||||||||||||||||||||||||
United States | $ | 178,727 | $ | 121,588 | $ | 57,139 | 47 | % | $ | 121,588 | $ | 73,416 | $ | 48,172 | 66 | % | |||||||||||||
EMEA | 49,825 | 34,602 | 15,223 | 44 | % | 34,602 | 21,043 | 13,559 | 64 | % | |||||||||||||||||||
APAC | 19,887 | 14,118 | 5,769 | 41 | % | 14,118 | 8,732 | 5,386 | 62 | % | |||||||||||||||||||
Other | 15,040 | 11,001 | 4,039 | 37 | % | 11,001 | 7,200 | 3,801 | 53 | % | |||||||||||||||||||
Total revenue | $ | 263,479 | $ | 181,309 | $ | 82,170 | 45 | % | $ | 181,309 | $ | 110,391 | $ | 70,918 | 64 | % | |||||||||||||
Revenue increased $82.2 million, or 45%, in the fiscal year ended March 31, 2017 compared to the fiscal year ended March 31, 2016. The increase was primarily due to an increase in product adoption by existing paid business accounts, and to a lesser extent from an increase in number of paid business accounts. The number of paid business accounts increased to 15,216 at March 31, 2017 from 13,518 at March 31, 2016. Our revenue from EMEA increased $15.2 million, or 44%, in the fiscal year ended March 31, 2017 compared to the fiscal year ended March 31, 2016, and our revenue from APAC increased $5.8 million, or 41%, in the fiscal year ended March 31, 2017 compared to the fiscal year ended March 31, 2016, as a result of an increase in the number of paid business accounts and an increase in product adoption by existing paid business accounts located in these geographic regions.
Revenue increased $70.9 million, or 64%, in the fiscal year ended March 31, 2016 compared to the fiscal year ended March 31, 2015. The increase was primarily due to an increase in product adoption by existing paid business accounts, and to a
42
lesser extent from an increase in number of paid business accounts. The number of paid business accounts increased to 13,518 at March 31, 2016 from 11,910 at March 31, 2015. Our revenue from EMEA increased $13.6 million, or 64%, in the fiscal year ended March 31, 2016 compared to the fiscal year ended March 31, 2015, and our revenue from APAC increased $5.4 million, or 62%, in the fiscal year ended March 31, 2016 compared to the fiscal year ended March 31, 2015, as a result of an increase in the number of paid business accounts and an increase in product adoption by existing paid business accounts located in these geographic regions.
Cost of Revenue
Year Ended March 31, | Change | Year Ended March 31, | Change | ||||||||||||||||||||||||||
2017 | 2016 | Amount | % | 2016 | 2015 | Amount | % | ||||||||||||||||||||||
(dollars in thousands) | |||||||||||||||||||||||||||||
Cost of revenue | $ | 49,990 | $ | 37,183 | $ | 12,807 | 34 | % | $ | 37,183 | $ | 21,802 | $ | 15,381 | 71 | % | |||||||||||||
Cost of revenue increased $12.8 million, or 34%, in the fiscal year ended March 31, 2017 compared to the fiscal year ended March 31, 2016. The increase was primarily a result of an increase in personnel-related costs and hosting-related costs necessary to support our growth, as well as an increase in payment processing costs due to the increase in revenue. Personnel-related costs increased by $6.5 million, driven by higher headcount, and hosting-related costs and payment processing fees increased by $3.1 million, primarily due to increased operating costs to support revenue growth. Depreciation expense and amortization expense increased by $2.7 million, and software costs and other miscellaneous expenses increased by $0.5 million.
Cost of revenue increased $15.4 million, or 71%, in the fiscal year ended March 31, 2016 compared to the fiscal year ended March 31, 2015. The increase was primarily a result of an increase in personnel-related costs and hosting-related costs necessary to support our growth, as well as an increase in payment processing costs due to the increase in revenue. Personnel-related costs increased by $5.3 million, driven by higher headcount, and hosting-related costs, payment processing fees, software costs, depreciation expense, and amortization expense increased by $10.1 million, primarily due to increased operating costs to support revenue growth.
Research and Development
Year Ended March 31, | Change | Year Ended March 31, | Change | ||||||||||||||||||||||||||
2017 | 2016 | Amount | % | 2016 | 2015 | Amount | % | ||||||||||||||||||||||
(dollars in thousands) | |||||||||||||||||||||||||||||
Research and development | $ | 61,054 | $ | 46,394 | $ | 14,660 | 32 | % | $ | 46,394 | $ | 24,024 | $ | 22,370 | 93 | % | |||||||||||||
Research and development expenses increased $14.7 million, or 32%, in the fiscal year ended March 31, 2017 compared to the fiscal year ended March 31, 2016. The increase was primarily a result of an increase in personnel-related costs of $13.0 million driven by an increase in headcount, an increase of $0.8 million in software subscription expenses and depreciation expenses, and $0.9 million in other miscellaneous expenses.
Research and development expenses increased $22.4 million, or 93%, in the fiscal year ended March 31, 2016 compared to the fiscal year ended March 31, 2015. The increase was primarily a result of an increase in personnel-related costs of $19.5 million driven by an increase in headcount and an increase of $2.9 million in spending on outside services, software subscription expenses, and other miscellaneous expenses.
Sales and Marketing
Year Ended March 31, | Change | Year Ended March 31, | Change | ||||||||||||||||||||||||||
2017 | 2016 | Amount | % | 2016 | 2015 | Amount | % | ||||||||||||||||||||||
(dollars in thousands) | |||||||||||||||||||||||||||||
Sales and marketing | $ | 168,163 | $ | 129,677 | $ | 38,486 | 30 | % | $ | 129,677 | $ | 89,162 | $ | 40,515 | 45 | % | |||||||||||||
Sales and marketing expenses increased $38.5 million, or 30%, in the fiscal year ended March 31, 2017 compared to the fiscal year ended March 31, 2016. The increase was primarily a result of an increase of personnel-related costs of $32.3 million, allocated costs, including facilities, of $5.5 million, and travel expenses of $3.2 million, driven by higher headcount and an
43
increase of sales commissions due to revenue growth. The remaining increase was due to software subscription expenses of $1.5 million. The increase was offset by a decrease of $4.0 million in marketing programs.
Sales and marketing expenses increased $40.5 million, or 45%, in the fiscal year ended March 31, 2016 compared to the fiscal year ended March 31, 2015. The increase was primarily a result of an increase of personnel-related costs of $29.8 million and travel expenses of $2.5 million, driven by higher headcount and an increase of sales commissions due to revenue growth. Additionally, the increase was also due in part to the growth in our marketing programs of $4.6 million from tradeshows and sponsorships, which are related to our marketing efforts to expand brand awareness. The remaining increase was due to an increase in consultant expenses of $1.8 million, an increase in software subscription expenses of $1.6 million, and an increase in other miscellaneous expenses of $0.2 million.
General and Administrative
Year Ended March 31, | Change | Year Ended March 31, | Change | ||||||||||||||||||||||||||
2017 | 2016 | Amount | % | 2016 | 2015 | Amount | % | ||||||||||||||||||||||
(dollars in thousands) | |||||||||||||||||||||||||||||
General and administrative | $ | 45,615 | $ | 35,693 | $ | 9,922 | 28 | % | $ | 35,693 | $ | 25,319 | $ | 10,374 | 41 | % | |||||||||||||
General and administrative expenses increased $9.9 million, or 28%, in the fiscal year ended March 31, 2017 compared to the fiscal year ended March 31, 2016. The increase was primarily a result of an increase in personnel-related costs of $9.6 million, driven by an increase in headcount, and a $0.3 million increase related to outside services due to our growing operations and infrastructure.
General and administrative expenses increased $10.4 million, or 41%, in the fiscal year ended March 31, 2016 compared to the fiscal year ended March 31, 2015. The increase was primarily a result of an increase in personnel-related costs of $8.5 million, driven by an increase in headcount, and a $1.0 million increase related to outside services due to the costs of compliance associated with being a publicly traded company. The remaining increase is primarily related to an increase of $0.8 million in software subscription expense.
Other Income (Expense), Net
Year Ended March 31, | Change | Year Ended March 31, | Change | ||||||||||||||||||||||||||
2017 | 2016 | Amount | % | 2016 | 2015 | Amount | % | ||||||||||||||||||||||
(dollars in thousands) | |||||||||||||||||||||||||||||
Other income (expense), net | $ | 530 | $ | 453 | $ | 77 | 17 | % | $ | 453 | $ | (318 | ) | $ | 771 | 242 | % | ||||||||||||
Other income, net increased by $77,000, or 17%, in the fiscal year ended March 31, 2017 compared to the fiscal year ended March 31, 2016. The increase was primarily a result of an increase in interest income.
Other income, net increased $0.8 million, or 242%, in the fiscal year ended March 31, 2016 compared to the fiscal year ended March 31, 2015. The increase was primarily a result of an increase in interest income.
44
Quarterly Results of Operations
The following tables set forth selected unaudited quarterly consolidated statements of operations data for each of the eight quarters in the period ended March 31, 2017, as well as the percentage that each line item represents of our revenue for each quarter. The information for each of these quarters has been prepared on the same basis as the audited annual consolidated financial statements included elsewhere in this report and, in the opinion of management, includes all adjustments of a normal, recurring nature that are necessary for the fair presentation of the results of operations for these periods in accordance with generally accepted accounting principles in the United States. This data should be read in conjunction with our audited consolidated financial statements and related notes included elsewhere in this report. These quarterly operating results are not necessarily indicative of our operating results for a full fiscal year or any future period.
Three Months Ended | |||||||||||||||||||||||||||||||
Mar. 31, 2017 | Dec. 31, 2016 | Sept. 30, 2016 | Jun. 30, 2016 | Mar. 31, 2016 | Dec. 31, 2015 | Sept. 30, 2015 | Jun. 30, 2015 | ||||||||||||||||||||||||
(in thousands, except per share data) | |||||||||||||||||||||||||||||||
Revenue | $ | 73,336 | $ | 68,096 | $ | 63,440 | $ | 58,607 | $ | 52,492 | $ | 47,744 | $ | 42,928 | $ | 38,145 | |||||||||||||||
Cost of revenue (1) | 13,930 | 12,627 | 11,778 | 11,655 | 10,621 | 9,744 | 8,952 | 7,866 | |||||||||||||||||||||||
Gross profit | 59,406 | 55,469 | 51,662 | 46,952 | 41,871 | 38,000 | 33,976 | 30,279 | |||||||||||||||||||||||
Operating expenses: | |||||||||||||||||||||||||||||||
Research and development (1) | 15,967 | 14,377 | 14,741 | 15,969 | 15,009 | 12,015 | 10,616 | 8,754 | |||||||||||||||||||||||
Sales and marketing (1) | 45,537 | 43,458 | 40,382 | 38,786 | 36,476 | 35,153 | 29,365 | 28,683 | |||||||||||||||||||||||
General and administrative (1) | 12,968 | 11,578 | 10,833 | 10,236 | 9,679 | 9,070 | 8,960 | 7,984 | |||||||||||||||||||||||
Total operating expenses | 74,472 | 69,413 | 65,956 | 64,991 | 61,164 | 56,238 | 48,941 | 45,421 | |||||||||||||||||||||||
Loss from operations | (15,066 | ) | (13,944 | ) | (14,294 | ) | (18,039 | ) | (19,293 | ) | (18,238 | ) | (14,965 | ) | (15,142 | ) | |||||||||||||||
Other income (expense): | |||||||||||||||||||||||||||||||
Interest income | 393 | 325 | 250 | 221 | 199 | 158 | 149 | 141 | |||||||||||||||||||||||
Interest expense | (24 | ) | (21 | ) | (21 | ) | (21 | ) | (21 | ) | (20 | ) | (13 | ) | (14 | ) | |||||||||||||||
Other income (expense), net | (55 | ) | (280 | ) | (126 | ) | (111 | ) | 70 | (163 | ) | (31 | ) | (2 | ) | ||||||||||||||||
Loss before income taxes | (14,752 | ) | (13,920 | ) | (14,191 | ) | (17,950 | ) | (19,045 | ) | (18,263 | ) | (14,860 | ) | (15,017 | ) | |||||||||||||||
Income tax provision (benefit) | 241 | (37 | ) | (61 | ) | 121 | 149 | 92 | (41 | ) | 102 | ||||||||||||||||||||
Net loss | $ | (14,993 | ) | $ | (13,883 | ) | $ | (14,130 | ) | $ | (18,071 | ) | $ | (19,194 | ) | $ | (18,355 | ) | $ | (14,819 | ) | $ | (15,119 | ) | |||||||
Net loss per share, basic and diluted (2) | $ | (0.28 | ) | $ | (0.27 | ) | $ | (0.28 | ) | $ | (0.36 | ) | $ | (0.39 | ) | $ | (0.37 | ) | $ | (0.31 | ) | $ | (0.32 | ) | |||||||
Weighted-average shares used to compute net loss per share, basic and diluted (2) | 52,991 | 52,328 | 51,328 | 50,224 | 49,644 | 48,953 | 48,150 | 47,190 | |||||||||||||||||||||||
(1) | Includes stock-based compensation expense as follows: |
Three Months Ended | |||||||||||||||||||||||||||||||
Mar. 31, 2017 | Dec. 31, 2016 | Sept. 30, 2016 | Jun. 30, 2016 | Mar. 31, 2016 | Dec. 31, 2015 | Sept. 30, 2015 | Jun. 30, 2015 | ||||||||||||||||||||||||
(in thousands) | |||||||||||||||||||||||||||||||
Cost of revenue | $ | 478 | $ | 475 | $ | 513 | $ | 381 | $ | 345 | $ | 333 | $ | 309 | $ | 251 | |||||||||||||||
Research and development | 2,522 | 2,390 | 2,522 | 2,541 | 2,436 | 1,684 | 1,501 | 1,038 | |||||||||||||||||||||||
Sales and marketing | 3,392 | 3,479 | 3,409 | 2,762 | 2,624 | 2,588 | 2,070 | 1,976 | |||||||||||||||||||||||
General and administrative | 1,835 | 1,774 | 1,819 | 1,654 | 1,260 | 1,751 | 1,708 | 1,394 | |||||||||||||||||||||||
Total stock-based compensation expense | $ | 8,227 | $ | 8,118 | $ | 8,263 | $ | 7,338 | $ | 6,665 | $ | 6,356 | $ | 5,588 | $ | 4,659 | |||||||||||||||
(2) | See notes 1 and 11 of the notes to our consolidated financial statements for a description of how we compute net loss per share, basic and diluted. |
45
Three Months Ended | |||||||||||||||||||||||
Mar. 31, 2017 | Dec. 31, 2016 | Sept. 30, 2016 | Jun. 30, 2016 | Mar. 31, 2016 | Dec. 31, 2015 | Sept. 30, 2015 | Jun. 30, 2015 | ||||||||||||||||
(as a percentage of revenue) | |||||||||||||||||||||||
Revenue | 100 | % | 100 | % | 100 | % | 100 | % | 100 | % | 100 | % | 100 | % | 100 | % | |||||||
Cost of revenue (1) | 19 | 19 | 19 | 20 | 20 | 20 | 21 | 21 | |||||||||||||||
Gross profit | 81 | 81 | 81 | 80 | 80 | 80 | 79 | 79 | |||||||||||||||
Operating expenses: | |||||||||||||||||||||||
Research and development (1) | 22 | 21 | 23 | 27 | 29 | 25 | 25 | 23 | |||||||||||||||
Sales and marketing (1) | 62 | 64 | 64 | 66 | 70 | 74 | 68 | 75 | |||||||||||||||
General and administrative (1) | 18 | 17 | 17 | 18 | 18 | 19 | 21 | 21 | |||||||||||||||
Total operating expenses | 102 | 102 | 104 | 111 | 117 | 118 | 114 | 119 | |||||||||||||||
Operating loss | (21 | ) | (21 | ) | (23 | ) | (31 | ) | (37 | ) | (38 | ) | (35 | ) | (40 | ) | |||||||
Other income (expense): | |||||||||||||||||||||||
Interest income | 1 | 1 | 1 | — | — | — | — | — | |||||||||||||||
Interest expense | — | — | — | — | — | — | — | — | |||||||||||||||
Other income (expense), net | — | — | — | — | — | — | — | — | |||||||||||||||
Loss before income taxes | (20 | ) | (20 | ) | (22 | ) | (31 | ) | (37 | ) | (38 | ) | (35 | ) | (40 | ) | |||||||
Income tax provision (benefit) | — | — | — | — | — | — | — | — | |||||||||||||||
Net loss | (20 | %) | (20 | %) | (22 | %) | (31 | %) | (37 | %) | (38 | %) | (35 | %) | (40 | %) | |||||||
(1) | Includes stock-based compensation expense as follows: |
Three Months Ended | |||||||||||||||||||||||
Mar. 31, 2017 | Dec. 31, 2016 | Sept. 30, 2016 | Jun. 30, 2016 | Mar. 31, 2016 | Dec. 31, 2015 | Sept. 30, 2015 | Jun. 30, 2015 | ||||||||||||||||
(as a percentage of revenue) | |||||||||||||||||||||||
Cost of revenue | 1 | % | 1 | % | 1 | % | 1 | % | 1 | % | 1 | % | 1 | % | 1 | % | |||||||
Research and development | 3 | 4 | 4 | 4 | 5 | 3 | 3 | 3 | |||||||||||||||
Sales and marketing | 5 | 5 | 5 | 5 | 5 | 5 | 5 | 5 | |||||||||||||||
General and administrative | 2 | 2 | 3 | 3 | 2 | 4 | 4 | 3 | |||||||||||||||
Total stock-based compensation expense | 11 | % | 12 | % | 13 | % | 13 | % | 13 | % | 13 | % | 13 | % | 12 | % | |||||||
Quarterly Revenue Trends
Our quarterly revenue increased sequentially for each period presented, primarily due to sales of new subscriptions to our products and expanding use of our products by our existing customers. We cannot assure you that this pattern of sequential growth in revenue will continue. In future periods, as our rate of revenue growth declines, seasonality in our revenue may become more apparent.
Quarterly Gross Margin Trends
Our gross margin has remained relatively consistent over all periods presented, with the fluctuations primarily due to the timing and extent of our investments in our operations and global customer support personnel, and hosting-related costs.
Quarterly Expense Trends
Research and development, sales and marketing, and general and administrative expenses generally increased sequentially over the periods as we increased our headcount to support continued investment in our products, although were flat to modestly decreasing as a percent of revenue. The increase in personnel costs was related to increases in headcount, along with higher stock-based compensation expense.
46
Liquidity and Capital Resources
Year Ended March 31, | |||||||||||
2017 | 2016 | 2015 | |||||||||
(in thousands) | |||||||||||
Cash provided by (used in) operating activities | $ | 18,928 | $ | 4,006 | $ | (13,621 | ) | ||||
Cash used in investing activities | (18,520 | ) | (58,051 | ) | (118,680 | ) | |||||
Cash provided by financing activities | 21,983 | 14,702 | 218,105 | ||||||||
Net increase (decrease) in cash and cash equivalents | $ | 22,391 | $ | (39,343 | ) | $ | 85,804 | ||||
To date, we have financed our operations primarily through private and public equity financings and customer payments for subscription services. We believe that our existing cash, cash equivalents, and short-term investment balances, together with cash generated from operations, will be sufficient to meet our working capital and capital expenditure requirements for at least the next 12 months.
Our future capital requirements will depend on many factors, including our growth rate, the timing and extent of spending to support research and development efforts, the continued expansion of sales and marketing activities, the introduction of new and enhanced products, and the continued market acceptance of our products. In the event that additional financing is required from outside sources, we may not be able to raise such financing on terms acceptable to us or at all. If we are unable to raise additional capital when desired, our business, operating results, and financial condition would be adversely affected.
Operating Activities
During the fiscal year ended March 31, 2017, cash provided by operating activities was $18.9 million as a result of a net loss of $61.1 million, adjusted by non-cash charges of $51.9 million and a change of $28.1 million in our operating assets and liabilities. The change in our operating assets and liabilities was primarily the result of a $51.7 million increase in deferred revenue as a result of increased sales of subscriptions, a $5.6 million increase in accrued compensation and benefits and other liabilities due to increased headcount, a $4.1 million increase in deferred rent due to new offices space, and a $0.7 million increase in accounts payable. This was partially offset by a $30.2 million increase in accounts receivable due to increased sales of subscriptions, a $3.7 million increase in prepaid expenses and other assets.
During the fiscal year ended March 31, 2016, cash provided by operating activities was $4.0 million as a result of a net loss of $67.5 million, adjusted by non-cash charges of $40.8 million and a change of $30.7 million in our operating assets and liabilities. The change in our operating assets and liabilities was primarily the result of a $45.4 million increase in deferred revenue as a result of increased sales of subscriptions and a $7.2 million increase in accrued compensation and benefits and other liabilities due to increased headcount. This was partially offset by a $19.5 million increase in accounts receivable due to increased sales of subscriptions, a $1.8 million increase in prepaid expenses and other assets, and a $0.8 million decrease in accounts payable.
During the fiscal year ended March 31, 2015, operating activities used $13.6 million in cash as a result of a net loss of $50.1 million, adjusted by non-cash charges of $21.2 million and a change of $15.8 million in our operating assets and liabilities. The change in our operating assets and liabilities was primarily the result of a $18.9 million increase in deferred revenue as a result of increased sales of subscriptions, a $1.0 million increase in accounts payable due to increased expenditures, a $4.8 million increase in accrued compensation and benefits and other liabilities due to increased headcount, and a $1.0 million increase in deferred rent due to new office leases. This was partially offset by an $8.6 million increase in accounts receivable due to increased sales of subscriptions and a $1.4 million increase in prepaid expenses and other assets.
Investing Activities
Cash used in investing activities during the fiscal year ended March 31, 2017 was $18.5 million, primarily as a result of purchases of short-term investments of $168.9 million, purchases of property and equipment of $21.4 million, and increases in capitalization of software development costs of $4.1 million. These were offset by proceeds from the maturity of short-term investments of $175.9 million.
Cash used in investing activities during the fiscal year ended March 31, 2016 was $58.1 million, primarily as a result of purchases of short-term investments of $111.0 million, purchases of property and equipment of $11.7 million, increases in capitalization of software development costs of $6.7 million, payments of $5.5 million for the acquisition of Opsmatic, Inc., net of cash acquired, and an increase in restricted cash of $3.5 million. These were offset by proceeds from the maturity of short-term investments of $80.4 million.
47
Cash used in investing activities during the fiscal year ended March 31, 2015 was $118.7 million, primarily as a result of purchases of short-term investments of $114.5 million, purchases of property and equipment of $12.6 million, increases in capitalization of software development costs of $9.0 million, and payments of $2.3 million for the acquisition of Ducksboard, net of cash acquired. These were offset partially by proceeds from the sale of short-term investments of $15.0 million, maturity of short-term investments of $3.8 million, and decreases to restricted cash of $1.0 million.
Financing Activities
Cash provided by financing activities during the fiscal year ended March 31, 2017 was $22.0 million, which was the result of proceeds from the exercise of stock options and proceeds from our employee stock purchase plan.
Cash provided by financing activities during the fiscal year ended March 31, 2016 was $14.7 million, which was the result of proceeds from the exercise of stock options and proceeds from our employee stock purchase plan.
Cash provided by financing activities during the fiscal year ended March 31, 2015 was $218.1 million, primarily as the result of proceeds from our IPO, net of issuance costs, of $119.9 million, proceeds from our sale of preferred stock, net of issuance costs, of $97.2 million, and the exercise of stock options of $1.2 million. Cash provided by financing activities for the fiscal year ended March 31, 2015 was offset by principle payments on debt assumed through our acquisition of Ducksboard of $0.3 million.
Contractual Obligations
As of March 31, 2017, our future non-cancelable contractual obligations were as follows:
Payments due by period | |||||||||||||||||||
Total | Less than 1 year | 1 to 3 years | 3 to 5 years | After 5 years | |||||||||||||||
(in thousands) | |||||||||||||||||||
Operating lease obligations (1) | $ | 54,807 | $ | 10,335 | $ | 21,184 | $ | 13,661 | $ | 9,627 | |||||||||
Purchase obligations (2) | 29,941 | 16,093 | 13,827 | 21 | — | ||||||||||||||
Total | $ | 84,748 | $ | 26,428 | $ | 35,011 | $ | 13,682 | $ | 9,627 | |||||||||
(1) | Consists of future minimum lease payments under non-cancelable operating leases for office space. |
(2) | Consists of future minimum payments under non-cancelable purchase commitments primarily related to hosting services. |
Off-Balance Sheet Arrangements
As of March 31, 2017, we did not have any relationships with unconsolidated entities or financial partnerships, such as structured finance or special purpose entities, which were established for the purpose of facilitating off-balance sheet arrangements or other purposes.
Critical Accounting Policies
We prepare our consolidated financial statements in accordance with United States generally accepted accounting principles, or GAAP. In the preparation of these consolidated financial statements, we make estimates and assumptions that affect the reported amounts of assets and liabilities and disclosure of contingent assets and liabilities at the date of the consolidated financial statements and the reported amounts of income and expenses during the reporting period. These estimates are based on information available as of the date of the consolidated financial statements; therefore, actual results could differ from our estimates. To the extent that there are material differences between these estimates and actual results, our financial condition or results of operations would be affected. We base our estimates on past experience and other assumptions that we believe are reasonable under the circumstances, and we evaluate these estimates on an ongoing basis. We refer to accounting estimates of this type as critical accounting policies and estimates.
The critical accounting policies requiring estimates, assumptions, and judgments that we believe have the most significant impact on our consolidated financial statements are described below.
48
Revenue Recognition
We generate revenue from subscription-based arrangements that allow our customers to access our products. Our sales agreements have contract terms typically for one year.
We recognize revenue when the following criteria are met: (i) there is persuasive evidence of an arrangement; (ii) subscriptions have been or are being provided to the customer; (iii) the amount of fees to be paid by the customer is fixed and determinable; and (iv) collection is reasonably assured.
We recognize subscription revenue on a straight-line basis over the contractual period. Amounts that have been invoiced and that are due are recorded in deferred revenue or revenue, depending on whether the revenue recognition criteria have been met.
Stock-Based Compensation Expense
We measure and recognize compensation expense related to stock-based transactions, including employee and non-employee director stock options, restricted stock units, or RSUs, restricted stock awards, or RSAs, and the employee stock purchase plan, or ESPP, in our financial statements based on the fair value of the awards granted. We estimate the fair value of each option award on the grant date using the Black-Scholes option-pricing model and a single option award approach. The fair value of RSUs and RSAs is based on the closing price of our common stock as reported on the New York Stock Exchange. We recognize stock-based compensation expense, net of forfeitures, over the requisite service periods of the awards, which is generally four years.
Our use of the Black-Scholes option-pricing model requires the input of highly subjective assumptions, including the expected term of the option, the expected volatility of the price of our common stock, risk-free interest rates, the expected dividend yield of our common stock, and for grants prior to our IPO, the fair value of the underlying common stock. The assumptions we use in our option-pricing model represent management’s best estimates. These estimates involve inherent uncertainties and the application of management’s judgment. If factors change and different assumptions are used, our stock-based compensation expense could be materially different in the future.
These assumptions and estimates are as follows:
• | Fair Value of Common Stock. Prior to our IPO, the fair value of the common stock underlying the stock-based awards was determined by our board of directors. Given the absence of a public trading market, the board of directors considered numerous objective and subjective factors to determine the fair value of our common stock at each meeting at which awards were approved. These factors included, but were not limited to (i) contemporaneous third-party valuations of common stock; (ii) the rights and preferences of convertible preferred stock relative to common stock; (iii) the lack of marketability of common stock; (iv) developments in the business; and (v) the likelihood of achieving a liquidity event, such as an IPO or sale of the company, given prevailing market conditions. Since our IPO, we have used the market closing price of our common stock as reported on the New York Stock Exchange. |
• | Risk-Free Interest Rate. We base the risk-free interest rate used in the Black-Scholes option-pricing model on the implied yield available on U.S. Treasury zero-coupon issues with a remaining term equivalent to that of the options for each option group. |
• | Expected Term. We determine the expected term based on the average period the stock options are expected to remain outstanding generally calculated as the midpoint of the stock options vesting term and contractual expiration period, as we do not have sufficient historical information to develop reasonable expectations about future exercise patterns and post-vesting employment termination behavior. |
• | Expected Volatility. We determine the price volatility factor based on the historical volatilities of our publicly traded peer group as we do not have significant trading history for our common stock. Industry peers consist of several public companies in the technology industry that are similar to us in size, stage of life cycle, and financial leverage. We used the same set of peer group companies in all the relevant valuation estimates. We did not rely on implied volatilities of traded options in our industry peers’ common stock because the volume of activity was relatively low. We intend to continue to consistently apply this process using the same or similar public companies until a sufficient amount of historical information regarding the volatility of our own common stock share price becomes available, or unless circumstances change such that the identified companies are no longer similar to us, in which case, more suitable companies whose share prices are publicly available would be utilized in the calculation. |
49
• | Dividend Yield. The expected dividend assumption is based on our current expectations about our anticipated dividend policy. Consequently, we used an expected dividend yield of zero. |
In addition to the assumptions used in the Black-Scholes option-pricing model, we must also estimate a forfeiture rate to calculate the stock-based compensation expense for our awards. Our forfeiture rate is based on an analysis of our actual forfeitures. We will continue to evaluate the appropriateness of the forfeiture rate based on actual forfeiture experience, analysis of employee turnover, and other factors. Quarterly changes in the estimated forfeiture rate can have a significant impact on our stock-based compensation expense as the cumulative effect of adjusting the rate is recognized in the period the forfeiture estimate is changed.
We estimate the fair value of the rights to acquire stock under our ESPP using the Black-Scholes option-pricing formula. Our ESPP typically provides for consecutive six-month offering periods. Prior to February 2017, we used our peer group volatility data in the valuation of ESPP shares. Beginning in February 2017, we started to use our own historical volatility data. We recognize such compensation expense on a straight-line basis over the requisite service period.
We will continue to use judgment in evaluating the assumptions related to our stock-based compensation on a prospective basis. As we continue to accumulate additional data related to our common stock, we may have refinements to our estimates, which could materially impact our future stock-based compensation expense.
Business Combination
We recognize identifiable assets acquired and liabilities assumed at their acquisition date fair value. Goodwill as of the acquisition date is measured as the excess of consideration transferred over the net of the acquisition date fair values of the assets acquired and the liabilities assumed. While we use our best estimates and assumptions as a part of the purchase price allocation process to accurately value assets acquired and liabilities assumed at the acquisition date, our estimates are inherently uncertain and subject to refinement. As a result, during the measurement period, which may be up to one year from the acquisition date, we record adjustments to the assets acquired and liabilities assumed, with the corresponding offset to goodwill to the extent that we identify adjustments to the preliminary purchase price allocation. Upon the conclusion of the measurement period or final determination of the values of assets acquired or liabilities assumed, whichever comes first, any subsequent adjustments are recorded to our consolidated statements of operations.
Goodwill and Other Intangible Assets
Goodwill represents the excess of the purchase price of an acquired business over the fair value of the underlying net tangible and intangible assets. Goodwill is evaluated for impairment annually in the third quarter, and whenever events or changes in circumstances indicate the carrying value of goodwill may not be recoverable. Triggering events that may indicate impairment include, but are not limited to, a significant adverse change in customer demand or business climate that could affect the value of goodwill or a significant decrease in expected cash flows.
Intangible assets consist of identifiable intangible assets, primarily developed technology, resulting from our acquisitions. Acquired intangible assets are recorded at cost, net of accumulated amortization. Intangible assets are amortized on a straight-line basis over their estimated useful lives. Long-lived assets, including intangible assets, are reviewed for impairment whenever events or changes in circumstances indicate that the carrying amount of the asset may not be recoverable.
Software Development Costs
We capitalize certain development costs incurred in connection with our internal use software and website. These capitalized costs are primarily related to our digital intelligence tools that are hosted by us and accessed by our customers on a subscription basis. Costs incurred in the preliminary stages of development are expensed as incurred. Once an application has reached the development stage, internal and external costs, if direct and incremental, are capitalized until the software is substantially complete and ready for its intended use. Capitalization ceases upon completion of all substantial testing. We also capitalize costs related to specific upgrades and enhancements when it is probable the expenditures will result in additional features and functionality. Maintenance costs are expensed as incurred. Internal use software is amortized on a straight-line basis over its estimated useful life, generally three years.
Income Taxes
Deferred tax assets and liabilities are determined based on the differences between financial reporting and the tax bases of assets and liabilities, and are measured using the tax rates that will be in effect when the differences are expected to reverse.
50
Future tax benefits are recognized to the extent that realization of such benefits is considered to be more likely than not. A valuation allowance is provided on deferred tax assets if it is determined that it is more likely than not that the deferred tax asset will not be realized. We have considered our future anticipated market growth, historical and forecasted earnings, future taxable income and the mix of earnings in the jurisdictions in which we operate along with prudent, feasible and permissible tax planning strategies in determining the extent to which our deferred tax assets may be realizable. Projections inherently include a level of uncertainty that could result in lower or higher than expected future taxable income. When we determine that the deferred tax assets for which there is currently a valuation allowance would be realized in the future, the related valuation allowance will be reduced and a benefit to operations will be recorded. Conversely, if we were to make a determination that we will not be able to realize a portion of our net deferred tax assets in the future (using the “more likely than not” criteria), we would record an adjustment to our valuation allowance and a charge to operations in the period in which such determination is made.
We use a two-step approach to recognizing and measuring uncertain tax positions. The first step is to evaluate the tax position for recognition by determining if the weight of available evidence indicates it is more likely than not that the position will be sustained on audit, including resolution of related appeals or litigation processes, if any. The second step is to measure the tax benefit as the largest amount that is more than 50% likely of being realized upon ultimate settlement. We consider many factors when evaluating and estimating tax positions and tax benefits, which may require periodic adjustments and which may not accurately forecast actual outcomes. If interest and penalties related to unrecognized tax benefits were incurred, such amounts would be included in our provision for income taxes.
Recent Accounting Pronouncements
In May 2014, the FASB issued ASU 2014-09, Revenue from Contracts with Customers (Topic 606). The new guidance provides principles for recognizing revenue to which an entity expects to be entitled for the transfer of promised goods or services to customers. The new guidance will be effective for us in our fiscal year beginning April 1, 2018; early adoption is permitted for the fiscal year beginning April 1, 2017. The guidance may be applied retrospectively to each prior period presented (full retrospective method), or with the cumulative effect recognized as of the date of initial adoption (modified retrospective method).
We are currently evaluating the potential changes from adopting the new standard on our financial statements and disclosures. We are in the process of implementing appropriate changes to our business processes and controls to support revenue recognition and disclosures under the new standard. Based on this evaluation, we currently intend to adopt using the full retrospective approach, however our decision has not been finalized. We will adopt the requirements of the new standard in the first quarter of fiscal year 2019. The impact of adopting the new standard on total revenues is not expected to be significant. Additionally, as we continue to assess the new standard along with industry trends and internal progress, we may adjust our implementation plan accordingly.
Under the new standard, we expect to capitalize certain sales commission costs. We anticipate the most significant impacts of adopting the new standard will primarily relate to the deferral of sales commissions, which previously were expensed as incurred, and to the incremental disclosure requirements. Under the new standard, certain commissions will be capitalized and amortized over the expected period of benefit. We have not yet concluded the amortization period of our capitalized costs, which will affect the classification and magnitude of the deferred costs at each reporting period. We continue to quantify the effect of these changes on our consolidated financial statements.
In February 2016, the FASB issued ASU No. 2016-02, Leases (Topic 842), which requires lessees to put most leases on their balance sheets but recognize the expenses on their income statements in a manner similar to current practice. ASU 2016-02 states that a lessee would recognize a lease liability for the obligation to make lease payments and a right-to-use asset for the right to use the underlying asset for the lease term. The new standard will be effective for us in the fiscal year beginning April 1, 2019; early adoption is permitted. The amendments require a modified retrospective approach with optional practical expedients. We are currently evaluating the impact of this standard on our consolidated financial statements.
In March 2016, the FASB Issued ASU No. 2016-09, Compensation-Stock Compensation (Topic 718): Improvements to Employee Share-Based Payment Accounting. The updated guidance changes how companies account for certain aspects of share-based payment awards to employees, including the accounting for income taxes, forfeitures, and statutory tax withholding requirements, as well as classification in the statement of cash flows. The update to the standard is effective for us in the fiscal year beginning April 1, 2017. We will adopt this new guidance in the first quarter of fiscal year 2018. Adoption will require all tax benefits in excess of stock-based compensation costs to be recorded in the consolidated statements of operations as a component of the provision for income taxes, whereas they are currently recorded in equity. This change is required to be
51
applied prospectively to excess tax benefits resulting from settlements after the date of adoption. For excess tax benefits not previously recognized, we will be required to apply the modified retrospective method with a cumulative-effect adjustment to opening accumulated deficit. In the quarter ending June 30, 2017, we will recognize deferred tax assets for our accumulated net operating losses related to excess tax benefits that as of March 31, 2017 were not recognized. However, given the valuation allowance placed on substantially all of the deferred tax assets, the recognition upon adoption is not expected to have a material impact on our accumulated deficit.
In June 2016, the FASB issued ASU 2016-13, Financial Instruments-Credit Losses (Topic 326): Measurement of Credit Losses on Financial Instruments, which amends guidance on reporting credit losses for assets held at amortized cost basis and available-for-sale debt securities. The updated guidance requires that credit losses on available-for-sale debt securities be presented as an allowance rather than as a write-down. The measurement of credit losses for newly recognized financial assets and subsequent changes in the allowance for credit losses are recorded in the statement of income. The update to the standard is effective for us in the fiscal year beginning April 1, 2020; early adoption is permitted in the fiscal year beginning April 1, 2019. We are currently evaluating the effect the standard will have on our condensed consolidated financial statements.
In November 2016, the FASB issued ASU 2016-18, Statement of Cash Flows (Topic 230): Restricted Cash, which requires restricted cash and restricted cash equivalents to be included with cash and cash equivalents in the statements of cash flows. This standard is effective for us in the fiscal year beginning April 1, 2018; early adoption is permitted. Adoption will be applied on a retrospective basis to all periods presented. We do not believe that this standard will have a material impact on our consolidated financial statements.
In January 2017, the FASB issued ASU 2017-04, Intangibles—Goodwill and Other (Topic 350): Simplifying the Test for Goodwill Impairment, which eliminates Step 2 from the goodwill impairment test. This standard is effective for goodwill impairment tests performed in the fiscal year beginning April 1, 2020; early adoption is permitted. We do not believe that this standard will have a material impact on our consolidated financial statements or disclosures.
Item 7A. Quantitative and Qualitative Disclosures About Market Risk
Foreign Currency Exchange Risk
Our subscription agreements are primarily denominated in U.S. dollars. A portion of our operating expenses are incurred outside the United States and are denominated in foreign currencies and subject to fluctuations due to changes in foreign currency exchange rates, particularly changes in the Euro. Additionally, fluctuations in foreign currency exchange rates may cause us to recognize transaction gains and losses in our statements of operations. To date, foreign currency transaction gains and losses have not been material to our financial statements, and we have not engaged in any foreign currency hedging transactions. As our international operations grow, we will continue to reassess our approach to managing the risks relating to fluctuations in currency rates. The effect of a hypothetical 10% change in foreign currency exchange rates applicable to our business would not have a material impact on our historical consolidated financial statements.
Interest Rate Risk
We had cash and cash equivalents of $88.3 million as of March 31, 2017, consisting of bank deposits, money market funds, commercial paper, and U.S. agency securities. These interest-earning instruments carry a degree of interest rate risk. To date, fluctuations in our interest income have not been significant. We also had no outstanding debt for any of the periods presented. We have an agreement to maintain cash balances at a financial institution of no less than $8.0 million as collateral for three letters of credit in favor of our landlords. The letters of credit carry a fixed interest rate of 1%.
We had short-term investments of $118.1 million as of March 31, 2017, consisting of certificates of deposit, commercial paper, corporate notes and bonds, U.S. treasury securities, and U.S. agency securities. Our investments in marketable securities are made for capital preservation purposes. We do not enter into investments for trading or speculative purposes and have not used any derivative financial instruments to manage our interest rate risk exposure. Due to the short-term nature of these investments, we have not been exposed to, nor do we anticipate being exposed to, material risks due to changes in interest rates.
A hypothetical 10% change in interest rates during any of the periods presented would not have had a material impact on our consolidated financial statements.
Inflation Risk
We do not believe that inflation has had a material effect on our business, financial condition, or results of operations.
52
Item 8. Financial Statements and Supplementary Data
NEW RELIC, INC.
INDEX TO CONSOLIDATED FINANCIAL STATEMENTS
53
REPORT OF INDEPENDENT REGISTERED PUBLIC ACCOUNTING FIRM
To the Board of Directors and Stockholders of
New Relic, Inc.
San Francisco, California
We have audited the accompanying consolidated balance sheets of New Relic, Inc. and subsidiaries (the "Company") as of March 31, 2017 and 2016, and the related consolidated statements of operations, comprehensive loss, convertible preferred stock and stockholders' equity (deficit), and cash flows for each of the three years in the period ended March 31, 2017. These financial statements are the responsibility of the Company's management. Our responsibility is to express an opinion on the financial statements based on our audits.
We conducted our audits in accordance with the standards of the Public Company Accounting Oversight Board (United States). Those standards require that we plan and perform the audit to obtain reasonable assurance about whether the financial statements are free of material misstatement. An audit includes examining, on a test basis, evidence supporting the amounts and disclosures in the financial statements. An audit also includes assessing the accounting principles used and significant estimates made by management, as well as evaluating the overall financial statement presentation. We believe that our audits provide a reasonable basis for our opinion.
In our opinion, such consolidated financial statements present fairly, in all material respects, the financial position of New Relic, Inc. and subsidiaries as of March 31, 2017 and 2016, and the results of their operations and their cash flows for each of the three years in the period ended March 31, 2017, in conformity with accounting principles generally accepted in the United States of America.
We have also audited, in accordance with the standards of the Public Company Accounting Oversight Board (United States), the Company's internal control over financial reporting as of March 31, 2017, based on the criteria established in Internal Control—Integrated Framework (2013) issued by the Committee of Sponsoring Organizations of the Treadway Commission and our report dated May 18, 2017 expressed an unqualified opinion on the Company's internal control over financial reporting.
/s/ DELOITTE & TOUCHE LLP
San Francisco, California
May 18, 2017
54
NEW RELIC, INC.
CONSOLIDATED BALANCE SHEETS
(In thousands, except par value)
March 31, | |||||||
2017 | 2016 | ||||||
Assets | |||||||
Current assets: | |||||||
Cash and cash equivalents | $ | 88,305 | $ | 65,914 | |||
Short-term investments | 118,101 | 125,414 | |||||
Accounts receivable, net of allowance for doubtful accounts of $1,117 and $664, respectively | 62,032 | 32,514 | |||||
Prepaid expenses and other current assets | 8,169 | 6,109 | |||||
Total current assets | 276,607 | 229,951 | |||||
Property and equipment, net | 50,728 | 40,147 | |||||
Restricted cash | 8,115 | 8,115 | |||||
Goodwill | 11,828 | 11,828 | |||||
Intangible assets, net | 2,499 | 3,661 | |||||
Other assets, non-current | 2,492 | 742 | |||||
Total assets | $ | 352,269 | $ | 294,444 | |||
Liabilities and stockholders’ equity | |||||||
Current liabilities: | |||||||
Accounts payable | $ | 6,522 | $ | 4,450 | |||
Accrued compensation and benefits | 15,935 | 11,631 | |||||
Other current liabilities | 7,607 | 4,725 | |||||
Deferred revenue | 125,269 | 72,397 | |||||
Total current liabilities | 155,333 | 93,203 | |||||
Deferred rent, non-current | 8,272 | 4,658 | |||||
Deferred revenue, non-current | 1,135 | 2,326 | |||||
Other liabilities, non-current | 685 | 1,024 | |||||
Total liabilities | 165,425 | 101,211 | |||||
Commitments and contingencies (Note 7) | |||||||
Stockholders’ equity: | |||||||
Common stock, $0.001 par value; 100,000 shares authorized at March 31, 2017 and March 31, 2016; 53,539 shares and 50,241 shares issued at March 31, 2017 and March 31, 2016; and 53,279 shares and 49,981 shares outstanding at March 31, 2017 and March 31, 2016 | 53 | 50 | |||||
Treasury stock—at cost (260 shares) | (263 | ) | (263 | ) | |||
Additional paid-in capital | 447,314 | 392,511 | |||||
Accumulated other comprehensive income (loss) | (96 | ) | 22 | ||||
Accumulated deficit | (260,164 | ) | (199,087 | ) | |||
Total stockholders’ equity | 186,844 | 193,233 | |||||
Total liabilities and stockholders’ equity | $ | 352,269 | $ | 294,444 | |||
See notes to consolidated financial statements.
55
NEW RELIC, INC.
CONSOLIDATED STATEMENTS OF OPERATIONS
(In thousands, except per share data)
Year Ended March 31, | |||||||||||
2017 | 2016 | 2015 | |||||||||
Revenue | $ | 263,479 | $ | 181,309 | $ | 110,391 | |||||
Cost of revenue | 49,990 | 37,183 | 21,802 | ||||||||
Gross profit | 213,489 | 144,126 | 88,589 | ||||||||
Operating expenses: | |||||||||||
Research and development | 61,054 | 46,394 | 24,024 | ||||||||
Sales and marketing | 168,163 | 129,677 | 89,162 | ||||||||
General and administrative | 45,615 | 35,693 | 25,319 | ||||||||
Total operating expenses | 274,832 | 211,764 | 138,505 | ||||||||
Loss from operations | (61,343 | ) | (67,638 | ) | (49,916 | ) | |||||
Other income (expense): | |||||||||||
Interest income | 1,189 | 647 | 176 | ||||||||
Interest expense | (87 | ) | (68 | ) | (104 | ) | |||||
Other expense, net | (572 | ) | (126 | ) | (390 | ) | |||||
Loss before income taxes | (60,813 | ) | (67,185 | ) | (50,234 | ) | |||||
Income tax provision (benefit) | 264 | 302 | (85 | ) | |||||||
Net loss | $ | (61,077 | ) | $ | (67,487 | ) | $ | (50,149 | ) | ||
Net loss per share, basic and diluted | $ | (1.18 | ) | $ | (1.39 | ) | $ | (1.98 | ) | ||
Weighted-average shares used to compute net loss per share, basic and diluted | 51,715 | 48,410 | 25,290 | ||||||||
See notes to consolidated financial statements.
56
NEW RELIC, INC.
CONSOLIDATED STATEMENTS OF COMPREHENSIVE LOSS
(In thousands)
Year Ended March 31, | |||||||||||
2017 | 2016 | 2015 | |||||||||
Net loss | $ | (61,077 | ) | $ | (67,487 | ) | $ | (50,149 | ) | ||
Other comprehensive income (loss): | |||||||||||
Unrealized (loss)/gain on available-for-sale securities, net of tax | (118 | ) | 7 | 15 | |||||||
Comprehensive loss | $ | (61,195 | ) | $ | (67,480 | ) | $ | (50,134 | ) | ||
See notes to consolidated financial statements.
57
NEW RELIC, INC.
CONSOLIDATED STATEMENTS OF CONVERTIBLE PREFERRED STOCK AND STOCKHOLDERS’ EQUITY (DEFICIT)
(In thousands)
Convertible Preferred Stock | Common Stock | Additional Paid-In Capital | Treasury Stock | Accumulated Other Comprehensive Income | Accumulated Deficit | Total Stockholders’ Equity (Deficit) | ||||||||||||||||||||||||||||||
Shares | Amount | Shares | Amount | Shares | Amount | |||||||||||||||||||||||||||||||
Balance at March 31, 2014 | 21,357 | $ | 95,917 | 16,063 | $ | 16 | $ | 17,033 | 260 | $ | (263 | ) | $ | — | $ | (81,451 | ) | $ | (64,665 | ) | ||||||||||||||||
Issuance of Series F convertible preferred stock—net of issuance cost of $2,757 | 3,456 | 97,243 | — | — | — | — | — | — | — | — | ||||||||||||||||||||||||||
Conversion of convertible preferred stock to common stock upon initial public offering | (24,813 | ) | (193,160 | ) | 24,886 | 25 | 193,135 | — | — | — | — | 193,160 | ||||||||||||||||||||||||
Reclassification of preferred stock warrant liabilities into additional paid-in capital | — | — | — | — | 912 | — | — | — | — | 912 | ||||||||||||||||||||||||||
Issuance of common stock upon exercise of warrants | — | — | 40 | — | — | — | — | — | — | — | ||||||||||||||||||||||||||
Issuance of common stock upon initial public offering—net of offering costs of $3,069 | — | — | 5,750 | 6 | 119,918 | — | — | — | — | 119,924 | ||||||||||||||||||||||||||
Issuance of common stock for acquisition of Few Ducks, S.L. | — | — | 108 | — | 1,627 | — | — | — | — | 1,627 | ||||||||||||||||||||||||||
Issuance of common stock for acquisition of Few Ducks, S.L.—Escrow Shares | — | — | — | — | 188 | — | — | — | — | 188 | ||||||||||||||||||||||||||
Issuance of common stock upon exercise of stock options | — | — | 490 | — | 1,209 | — | — | — | — | 1,209 | ||||||||||||||||||||||||||
Issuance of restricted stock awards subject to vesting | — | — | 40 | — | — | — | — | — | — | — | ||||||||||||||||||||||||||
Stock-based compensation expense | — | — | — | — | 12,649 | — | — | — | — | 12,649 | ||||||||||||||||||||||||||
Other comprehensive income, net | — | — | — | — | — | — | — | 15 | — | 15 | ||||||||||||||||||||||||||
Net loss | — | — | — | — | — | — | — | — | (50,149 | ) | (50,149 | ) | ||||||||||||||||||||||||
Balance at March 31, 2015 | — | $ | — | 47,377 | $ | 47 | $ | 346,671 | 260 | $ | (263 | ) | $ | 15 | $ | (131,600 | ) | $ | 214,870 | |||||||||||||||||
Issuance of common stock upon exercise of stock options | — | — | 2,324 | 3 | 12,518 | — | — | — | — | 12,521 | ||||||||||||||||||||||||||
Issuance of common stock for vested restricted stock units | — | — | 166 | — | — | — | — | — | — | — | ||||||||||||||||||||||||||
Issuance of common stock related to employee stock purchase plan | 111 | — | 2,243 | — | — | — | — | 2,243 | ||||||||||||||||||||||||||||
Issuance of common stock related to acquisition of business | — | — | 263 | — | 6,777 | — | — | — | — | 6,777 | ||||||||||||||||||||||||||
Stock-based compensation expense | — | — | — | — | 24,302 | — | — | — | — | 24,302 | ||||||||||||||||||||||||||
Other comprehensive income, net | — | — | — | — | — | — | — | 7 | — | 7 | ||||||||||||||||||||||||||
Net loss | — | — | — | — | — | — | — | — | (67,487 | ) | (67,487 | ) | ||||||||||||||||||||||||
Balance at March 31, 2016 | — | $ | — | 50,241 | $ | 50 | $ | 392,511 | 260 | $ | (263 | ) | $ | 22 | $ | (199,087 | ) | $ | 193,233 | |||||||||||||||||
Issuance of common stock upon exercise of stock options | — | — | 2,474 | 2 | 16,665 | — | — | — | — | 16,667 | ||||||||||||||||||||||||||
Issuance of common stock for vested restricted stock units | — | — | 582 | 1 | (1 | ) | — | — | — | — | ||||||||||||||||||||||||||
Issuance of common stock related to employee stock purchase plan | 195 | — | 5,283 | — | — | — | — | 5,283 | ||||||||||||||||||||||||||||
Issuance of common stock related to acquisition of business | — | — | 47 | — | — | — | — | — | — | — | ||||||||||||||||||||||||||
Stock-based compensation expense | — | — | — | — | 32,856 | — | — | — | — | 32,856 | ||||||||||||||||||||||||||
Other comprehensive loss, net | — | — | — | — | — | — | — | (118 | ) | — | (118 | ) | ||||||||||||||||||||||||
Net loss | — | — | — | — | — | — | — | — | (61,077 | ) | (61,077 | ) | ||||||||||||||||||||||||
Balance at March 31, 2017 | — | $ | — | 53,539 | $ | 53 | $ | 447,314 | 260 | $ | (263 | ) | $ | (96 | ) | $ | (260,164 | ) | $ | 186,844 | ||||||||||||||||
See notes to consolidated financial statements.
58
NEW RELIC, INC.
CONSOLIDATED STATEMENTS OF CASH FLOWS
(In thousands)
Year Ended March 31, | |||||||||||
2017 | 2016 | 2015 | |||||||||
Cash flows from operating activities: | |||||||||||
Net loss: | $ | (61,077 | ) | $ | (67,487 | ) | $ | (50,149 | ) | ||
Adjustments to reconcile net loss to net cash provided by (used in) operating activities: | |||||||||||
Depreciation and amortization | 18,805 | 15,119 | 9,044 | ||||||||
Stock-based compensation expense | 31,946 | 23,268 | 11,666 | ||||||||
Other | 1,125 | 2,420 | 36 | ||||||||
Changes in operating assets and liabilities, net of acquisition of business: | |||||||||||
Accounts receivable, net | (30,251 | ) | (19,456 | ) | (8,565 | ) | |||||
Prepaid expenses and other assets | (3,658 | ) | (1,834 | ) | (1,449 | ) | |||||
Accounts payable | 658 | (774 | ) | 1,012 | |||||||
Accrued compensation and benefits and other liabilities | 5,550 | 7,205 | 4,790 | ||||||||
Deferred revenue | 51,681 | 45,414 | 18,948 | ||||||||
Deferred rent | 4,149 | 131 | 1,046 | ||||||||
Net cash provided by (used in) operating activities | 18,928 | 4,006 | (13,621 | ) | |||||||
Cash flows from investing activities: | |||||||||||
Purchases of property and equipment | (21,430 | ) | (11,732 | ) | (12,628 | ) | |||||
Acquisition of business, net of cash acquired | — | (5,498 | ) | (2,262 | ) | ||||||
Decrease (increase) in restricted cash | — | (3,492 | ) | 978 | |||||||
Purchases of short-term investments | (168,938 | ) | (110,978 | ) | (114,468 | ) | |||||
Proceeds from sale and maturity of short-term investments | 175,877 | 80,397 | 18,717 | ||||||||
Capitalized software development costs | (4,029 | ) | (6,748 | ) | (9,017 | ) | |||||
Net cash used in investing activities | (18,520 | ) | (58,051 | ) | (118,680 | ) | |||||
Cash flows from financing activities: | |||||||||||
Proceeds from issuances of preferred stock, net of issuance costs | — | — | 97,243 | ||||||||
Proceeds from initial public offering, net of issuance costs | — | — | 119,924 | ||||||||
Principal payments on debt | — | — | (271 | ) | |||||||
Proceeds from employee stock purchase plan | 5,283 | 2,243 | — | ||||||||
Proceeds from issuance of common stock | 16,700 | 12,459 | 1,209 | ||||||||
Net cash provided by financing activities | 21,983 | 14,702 | 218,105 | ||||||||
Net increase (decrease) in cash and cash equivalents | 22,391 | (39,343 | ) | 85,804 | |||||||
Cash and cash equivalents, beginning of period | 65,914 | 105,257 | 19,453 | ||||||||
Cash and cash equivalents, end of period | $ | 88,305 | $ | 65,914 | $ | 105,257 | |||||
Supplemental disclosure of cash flow information: | |||||||||||
Cash paid for interest and income taxes | $ | 253 | $ | 169 | $ | 91 | |||||
Noncash investing and financing activities: | |||||||||||
Issuance of common stock for the acquisition of business | $ | — | $ | 6,777 | $ | 1,826 | |||||
Conversion and net exercise of preferred stock warrants | $ | — | $ | — | $ | 632 | |||||
Net exercise of preferred stock warrants in connection with the initial public offering | $ | — | $ | — | $ | 280 | |||||
Property and equipment purchased but not paid yet | $ | 3,011 | $ | 828 | $ | 464 | |||||
See notes to consolidated financial statements.
59
NOTES TO CONSOLIDATED FINANCIAL STATEMENTS
1. | Description of Business and Summary of Significant Accounting Policies |
Description of Business—New Relic, Inc. (the “Company” or “New Relic”) was incorporated in Delaware on February 20, 2008. The Company is a software-as-a-service provider of digital intelligence products which allow users to monitor software and infrastructure performance and measure end user activities across desktop and mobile devices with applications deployed in the cloud or in a data center. New Relic’s digital intelligence products and platform capabilities enable software developers, IT operations, and business users to better understand their digital business.
Basis of Presentation and Consolidation—The consolidated financial statements include the accounts of New Relic and its wholly owned subsidiaries. These consolidated financial statements have been prepared in accordance with United States generally accepted accounting principles, or GAAP. All intercompany balances and transactions have been eliminated in consolidation.
Foreign Currency Translation and Transactions—The functional currency of the Company’s foreign subsidiaries is the U.S. dollar. The Company translates all monetary assets and liabilities denominated in foreign currencies into U.S. dollars using the exchange rates in effect at the balance sheet dates and other assets and liabilities using historical exchange rates.
Foreign currency denominated revenue and expenses have been re-measured using the average exchange rates in effect during each period. Foreign currency re-measurement gains and losses have been included in other income (expense).
Initial Public Offering—In December 2014, New Relic completed its initial public offering, or IPO, in which the Company issued and sold 5,750,000 shares of common stock at a public offering price of $23.00 per share. The Company received aggregate proceeds of approximately $123.0 million from the sale of shares of common stock, net of underwriters’ discounts and commissions, but before deducting offering expenses of approximately $3.1 million.
The sale of common stock in the IPO triggered the weighted average anti-dilution provisions set forth in the Company’s amended and restated certificate of incorporation. At the IPO price of $23.00 per share, the per share conversion rate for the Company’s Series F convertible preferred stock into common stock was approximately 1:1.02. The conversion rate for the Company’s Series A, Series B, Series C, Series D, and Series E convertible preferred stock was 1:1. As a result of the IPO, the 24,813,343 shares of the Company’s convertible preferred stock outstanding automatically converted into 24,885,778 shares of the Company’s common stock.
Use of Estimates—The preparation of the Company’s consolidated financial statements in conformity with GAAP requires management to make estimates and assumptions that affect the reported amounts of assets and liabilities and disclosure of contingent assets and liabilities at the date of the consolidated financial statements and the reported amounts of income and expenses during the reporting period. Significant items subject to such estimates and assumptions include the fair value of share-based awards, fair value of purchased intangible assets and goodwill, useful lives of purchased intangible assets, unrecognized tax benefits, and the capitalization and estimated useful life of the Company’s software development costs. These estimates are based on information available as of the date of the consolidated financial statements; therefore, actual results could differ from management’s estimates.
Segments—The Company’s chief operating decision maker is the Chief Executive Officer, who reviews financial information presented on a consolidated basis, accompanied by information about revenue by geographic region. Accordingly, the Company has determined that it has a single reportable segment.
Cash and Cash Equivalents—The Company considers all highly liquid investments with an original maturity of three months or less at the date of purchase to be cash and cash equivalents.
Restricted Cash—The Company has an agreement to maintain cash balances at a financial institution as collateral for letters of credit relating to the Company’s property leases.
Short-term Investments—Short-term investments consist of money market funds, certificates of deposit, commercial paper, U.S. treasury securities, U.S. agency securities, and corporate debt securities, and are classified as available-for-sale securities. The Company has classified its investments as current based on the nature of the investments and their availability for use in current operations. Available-for-sale securities are carried at fair value with unrealized gains and losses reported as a component of accumulated other comprehensive income, while realized gains and losses are reported within the statement of
60
operations. The Company reviews its debt securities classified as short-term investments on a regular basis to evaluate whether or not any security has experienced an other-than-temporary decline in fair value. The Company considers factors such as the length of time and extent to which the market value has been less than the cost, the financial position and near-term prospects of the issuer, and the Company’s intent to sell, or whether it is more likely than not the Company will be required to sell the investment before recovery of the investment’s amortized-cost basis. If the Company determines that an other-than-temporary decline exists in one of these securities, the respective investment would be written down to fair value. For debt securities, the portion of the write-down related to credit loss would be recognized to other income, net in the condensed consolidated statement of operations. Any portion not related to credit loss would be included in accumulated other comprehensive income (loss). The Company did not identify any investments as other-than-temporarily impaired as of March 31, 2017 or March 31, 2016.
Business Combinations—The Company recognizes identifiable assets acquired and liabilities assumed at their acquisition date fair value. Goodwill as of the acquisition date is measured as the excess of consideration transferred over the net of the acquisition date fair values of the assets acquired and the liabilities assumed. While the Company uses its best estimates and assumptions as a part of the purchase price allocation process to accurately value assets acquired and liabilities assumed at the acquisition date, its estimates are inherently uncertain and subject to refinement. As a result, during the measurement period, which may be up to one year from the acquisition date, the Company records adjustments to the assets acquired and liabilities assumed, with the corresponding offset to goodwill to the extent that the Company identifies adjustments to the preliminary purchase price allocation. Upon the conclusion of the measurement period or final determination of the values of assets acquired or liabilities assumed, whichever comes first, any subsequent adjustments are recorded to the Company’s consolidated statements of operations. There has been no such adjustment as of March 31, 2017.
Property and Equipment—Property and equipment are stated at cost. Depreciation is calculated using the straight-line method over the estimated useful lives of the assets. The Company uses an estimated useful life of three years for employee-related computers and software, three years for other office equipment and site-related computer hardware, and five years for furniture. Leasehold improvements are amortized over the shorter of the lease-term or the estimated useful life of the related asset. Down payments for property and equipment are recorded at cost and included in other assets in the accompanying consolidated balance sheet. Once the corresponding property and equipment item has been received, it will be reclassified to property and equipment and amortized.
Revenue Recognition—The Company generates revenue from subscription-based arrangements that allow customers to access its products. The Company recognizes revenue when all four of the following criteria are met:
•There is persuasive evidence of an arrangement.
•The subscriptions have been or are being provided to the customer.
•The amount of fees to be paid by the customer is fixed or determinable.
•The collection is reasonably assured.
Revenue from subscription-based arrangements is recognized ratably over the contractual period, generally from one to twelve months. All of the Company’s subscription-based arrangements are priced on a fixed-fee basis.
Deferred Revenue—Deferred revenue consists of billings or payments received in advance of revenue being recognized. The Company generally invoices its customers monthly, quarterly, or annually. Deferred revenue that will be recognized during the succeeding 12-month period is recorded as current deferred revenue and the remaining portion is recorded as non-current deferred revenue.
Cost of Revenue—Cost of revenue consists of expenses relating to data center operations, hosting-related costs, payment processing fees, depreciation and amortization, consulting costs, and salaries and benefits of operations and global customer support personnel.
Accounts Receivable and Allowance for Doubtful Accounts—Accounts receivable are recorded at the invoiced amount, net of allowances for doubtful accounts. The allowance for doubtful accounts is based on the Company’s assessment of the collectability of accounts. The Company regularly reviews the adequacy of the allowance for doubtful accounts by considering the age of each outstanding invoice and the collection history of each customer to determine whether a specific allowance is appropriate. Accounts receivable deemed uncollectable are charged against the allowance for doubtful accounts when identified. For all periods presented, the allowance for doubtful accounts activity was not significant.
61
Software Development Costs—The Company capitalizes certain development costs incurred in connection with its internal use software and website. These capitalized costs are primarily related to its digital intelligence tools that are hosted by the Company and accessed by its customers on a subscription basis. Costs incurred in the preliminary stages of development are expensed as incurred. Once an application has reached the development stage, internal and external costs, if direct and incremental, are capitalized until the software is substantially complete and ready for its intended use. Capitalization ceases when the software is released or made available. The Company also capitalizes costs related to specific upgrades and enhancements when it is probable the expenditures will result in additional features and functionality. Maintenance costs are expensed as incurred. Internal use software is amortized on a straight-line basis over its estimated useful life, generally three years. The Company capitalized $4.9 million, $7.7 million, and $10.0 million in internal use software during the fiscal years ended March 31, 2017, 2016, and 2015, respectively. Included in the capitalized development costs were $0.9 million, $1.0 million, and $1.0 million of stock-based compensation costs for the fiscal years ended March 31, 2017, 2016, and 2015, respectively. Amortization expense totaled $6.9 million, $6.7 million, and $3.9 million during the fiscal years ended March 31, 2017, 2016, and 2015, respectively. The net book value of capitalized internal use software as of March 31, 2017 and 2016, which is recorded in property and equipment on the accompanying consolidated balance sheets, was $10.3 million and $12.6 million, respectively.
Commissions—Sales and marketing commissions are recognized as an expense at the time of the customer order. Substantially all of the effort by the sales and marketing organization is expended through the time of closing the sale.
Advertising Expenses—Advertising is expensed as incurred and is included in sales and marketing in the consolidated statements of operations. Advertising expense was $21.7 million, $25.5 million, and $25.1 million for the fiscal years ended March 31, 2017, 2016, and 2015, respectively.
Operating Leases—The Company leases office space and data center facilities under operating leases. Certain lease agreements contain rent holidays, allowances, and rent escalation provisions. The Company recognizes rent expense under such leases on a straight-line basis over the term of the lease. Lease renewal periods are considered on a lease-by-lease basis in determining the lease term.
Impairment of Long-Lived Assets—Long-lived assets, such as property and equipment, acquired intangible assets, and capitalized software development costs subject to amortization, are reviewed for impairment whenever events or changes in circumstances indicate that the carrying amount of the asset may not be recoverable. If circumstances require a long-lived asset be tested for possible impairment, the Company first compares undiscounted cash flows expected to be generated by the asset to its carrying value. If the carrying value of the long-lived asset is not recoverable on an undiscounted cash flow basis, an impairment is recognized to the extent that the carrying value exceeds its fair value. Fair value is determined through various valuation techniques, including discounted cash flow models, quoted market values, and third-party independent appraisals, as considered necessary. For the fiscal years presented, the Company had not impaired any of its long-lived assets.
Goodwill—Goodwill represents the excess of the purchase price of an acquired business over the fair value of the underlying net tangible and intangible assets. Goodwill is evaluated for impairment annually in the third quarter of the Company’s fiscal year, and whenever events or changes in circumstances indicate the carrying value of goodwill may not be recoverable. Triggering events that may indicate impairment include, but are not limited to, a significant adverse change in customer demand or business climate that could affect the value of goodwill or a significant decrease in expected cash flows. Since inception through March 31, 2017, the Company did not have any goodwill impairment.
Intangible Assets—Intangible assets consist of identifiable intangible assets, primarily developed technology, resulting from the Company’s acquisitions. Acquired intangible assets are recorded at cost, net of accumulated amortization. Intangible assets are amortized on a straight-line basis over their estimated useful lives.
Stock-Based Compensation—The Company estimates the fair value of share-based awards on the date of grant. The value of the portion of the award that is ultimately expected to vest is recognized as expense over the requisite service periods in the statements of operations. The Company recognizes compensation expense over the vesting period of the entire award using the straight-line attribution method. These amounts are reduced by an estimated forfeiture rate. The forfeiture rate is estimated based on actual cancellation experience and is applied to all share-based awards. The rate is estimated at the time of grant and revised, if necessary, in subsequent periods if actual forfeitures differ from those estimates.
The Company selected the Black-Scholes option-pricing model as the method for determining the estimated fair value for stock options and shares pursuant to the Company’s 2014 Employee Stock Purchase Plan, or ESPP. The Black-Scholes option-pricing model requires the use of highly subjective and complex assumptions, which determine the fair value of share-based awards, including the option’s expected term and the price volatility of the underlying stock.
62
The authoritative guidance prohibits the recognition of a deferred tax asset for an excess tax benefit that has not yet been realized. As a result, the Company will only recognize a benefit from stock-based compensation in additional paid-in capital if an incremental tax benefit is realized or realizable after all other tax attributes currently available have been utilized.
Fair Value Measurements—The Company defines fair value as the price that would be received from selling an asset or paid to transfer a liability in an orderly transaction between market participants at the measurement date. When determining the fair value measurements for assets and liabilities that are required to be recorded at fair value, the Company considers the principal or most advantageous market in which to transact and the market-based risk. The Company applies fair value accounting for all financial assets and liabilities that are recognized or disclosed at fair value in the financial statements on a recurring basis. The carrying amounts reported in the consolidated financial statements approximate the fair value for cash and cash equivalents, restricted cash, accounts receivable, accounts payable, and accrued liabilities, due to their short-term nature.
Concentration of Risk—Financial instruments that potentially subject the Company to concentrations of credit risk consist primarily of cash and cash equivalents, restricted cash, short-term investments, and trade accounts receivable. The Company invests its excess cash in money market funds, certificates of deposit, commercial paper, U.S. treasury securities, U.S. agency securities, and corporate debt securities with major financial institutions. Management believes that the financial institutions that hold the Company’s investments are financially sound and, accordingly, are subject to minimal credit risk. One customer accounted for 12% of the Company’s accounts receivable balance as of March 31, 2017, and no customers represented more than 10% of accounts receivable as of March 31, 2016. In addition, there were no customers that individually exceeded 10% of the Company’s revenue during the fiscal years ended March 31, 2017, 2016, and 2015.
Income Taxes—The Company accounts for income taxes using the asset and liability method, which requires the recognition of deferred tax assets and liabilities for the expected future tax consequences of events that have been recognized in the Company’s financial statements or tax returns. In addition, deferred tax assets are recorded for the future benefit of utilizing net operating losses and research and development credit carryforwards. Valuation allowances are provided when necessary to reduce deferred tax assets to the amount expected to be realized.
The Company applies the authoritative accounting guidance prescribing a threshold and measurement attribute for the financial recognition and measurement of a tax position taken or expected to be taken in a tax return. The Company recognizes liabilities for uncertain tax positions based on a two-step process. The first step is to evaluate the tax position for recognition by determining if the weight of available evidence indicates that it is more likely than not that the position will be sustained on audit, including resolution of related appeals or litigation processes, if any. The second step requires the Company to estimate and measure the tax liability as the largest amount that is more likely than not to be realized upon ultimate settlement.
Net Loss Per Share—The Company calculates its basic and diluted net loss per share in conformity with the two-class method required for companies with participating securities. Under the two-class method, in periods when the Company has net income, net income is determined by allocating undistributed earnings, calculated as net income less current period convertible preferred stock non-cumulative dividends, between common stock and the convertible preferred stock. In computing diluted net income, undistributed earnings are re-allocated to reflect the potential impact of dilutive securities. The Company’s basic net loss per share is calculated by dividing the net loss by the weighted-average number of shares of common stock outstanding for the period. The diluted net loss per share is computed by giving effect to all potential dilutive common stock equivalents outstanding for the period. For purposes of this calculation, convertible preferred stock, options to purchase common stock, common stock reserved for issuance, restricted stock units, convertible preferred stock warrants, and shares issuable pursuant to the ESPP are considered common stock equivalents but have been excluded from the calculation of diluted net loss per share as their effect is antidilutive.
Recent Accounting Pronouncements—In May 2014, the FASB issued ASU 2014-09, Revenue from Contracts with Customers (Topic 606). The new guidance provides principles for recognizing revenue to which an entity expects to be entitled for the transfer of promised goods or services to customers. The new guidance will be effective for the Company in its fiscal year beginning April 1, 2018; early adoption is permitted for the fiscal year beginning April 1, 2017. The guidance may be applied retrospectively to each prior period presented (full retrospective method), or with the cumulative effect recognized as of the date of initial adoption (modified retrospective method).
The Company is currently evaluating the potential changes from adopting the new standard on its financial statements and disclosures. The Company is in the process of implementing appropriate changes to its business processes and controls to support revenue recognition and disclosures under the new standard. Based on this evaluation, the Company currently intends to adopt using the full retrospective approach, however its decision has not been finalized. The Company will adopt the requirements of the new standard in the first quarter of fiscal year 2019. The impact of adopting the new standard on the
63
Company’s total revenues is not expected to be significant. Additionally, as the Company continues to assess the new standard along with industry trends and internal progress, the Company may adjust its implementation plan accordingly.
Under the new standard, the Company expects to capitalize certain sales commission costs. The Company anticipates the most significant impacts of adopting the new standard will primarily relate to the deferral of sales commissions, which previously were expensed as incurred, and to the incremental disclosure requirements. Under the new standard, certain commissions will be capitalized and amortized over the expected period of benefit. The Company has not yet concluded the amortization period of its capitalized costs, which will affect the classification and magnitude of the deferred costs at each reporting period. The Company will continue to quantify the effect of these changes on its consolidated financial statements.
In February 2016, the FASB issued ASU No. 2016-02, Leases (Topic 842), which requires lessees to put most leases on their balance sheets but recognize the expenses on their income statements in a manner similar to current practice. ASU 2016-02 states that a lessee would recognize a lease liability for the obligation to make lease payments and a right-to-use asset for the right to use the underlying asset for the lease term. The new standard will be effective for the Company in the fiscal year beginning April 1, 2019; early adoption is permitted. The amendments require a modified retrospective approach with optional practical expedients. The Company is currently evaluating the impact of this standard on its consolidated financial statements.
In March 2016, the FASB Issued ASU No. 2016-09, Compensation-Stock Compensation (Topic 718): Improvements to Employee Share-Based Payment Accounting. The updated guidance changes how companies account for certain aspects of share-based payment awards to employees, including the accounting for income taxes, forfeitures, and statutory tax withholding requirements, as well as classification in the statement of cash flows. The update to the standard is effective for the Company in the fiscal year beginning April 1, 2017. The Company will adopt this new guidance in the first quarter of fiscal year 2018. Adoption will require all tax benefits in excess of stock-based compensation costs to be recorded in the consolidated statements of operations as a component of the provision for income taxes, whereas they are currently recorded in equity. This change is required to be applied prospectively to excess tax benefits resulting from settlements after the date of adoption. For excess tax benefits not previously recognized, the Company will be required to apply the modified retrospective method with a cumulative-effect adjustment to opening accumulated deficit. In the quarter ending June 30, 2017, the Company will recognize deferred tax assets for its accumulated net operating losses related to excess tax benefits that as of March 31, 2017 were not recognized. However, given the valuation allowance placed on substantially all of the deferred tax assets, the recognition upon adoption is not expected to have a material impact on the Company’s accumulated deficit.
In June 2016, the FASB issued ASU 2016-13, Financial Instruments-Credit Losses (Topic 326): Measurement of Credit Losses on Financial Instruments, which amends guidance on reporting credit losses for assets held at amortized cost basis and available-for-sale debt securities. The updated guidance requires that credit losses on available-for-sale debt securities be presented as an allowance rather than as a write-down. The measurement of credit losses for newly recognized financial assets and subsequent changes in the allowance for credit losses are recorded in the statement of income. The update to the standard is effective for the Company in the fiscal year beginning April 1, 2020; early adoption is permitted in the fiscal year beginning April 1, 2019. The Company is currently evaluating the effect the standard will have on its condensed consolidated financial statements.
In November 2016, the FASB issued ASU 2016-18, Statement of Cash Flows (Topic 230): Restricted Cash, which requires restricted cash and restricted cash equivalents to be included with cash and cash equivalents in the statements of cash flows. This standard is effective for the Company in the fiscal year beginning April 1, 2018; early adoption is permitted. Adoption will be applied on a retrospective basis to all periods presented. The Company does not believe that this standard will have a material impact on its consolidated financial statements.
In January 2017, the FASB issued ASU 2017-04, Intangibles-Goodwill and Other (Topic 350): Simplifying the Test for Goodwill Impairment, which eliminates Step 2 from the goodwill impairment test. This standard is effective for goodwill impairment tests performed by the Company in the fiscal year beginning April 1, 2020; early adoption is permitted. The Company does not believe that this standard will have a material impact on its consolidated financial statements or disclosures.
64
2. | Business Combination |
Opsmatic, Inc.
In October 2015, the Company completed the acquisition of Opsmatic, Inc. (“Opsmatic”), a provider of live-state server configuration monitoring across dynamic cloud infrastructure, pursuant to which the Company acquired all of the capital stock of Opsmatic for $5.5 million in cash, up to 161,116 shares of the Company’s common stock, a portion of which are subject to forfeiture in the event of certain indemnification claims by the Company, and 12,008 restricted stock units (“RSUs”) with fair values of $39.15 per share, resulting in an aggregate purchase price of $12.3 million. Of the total purchase price, $2.5 million was allocated to acquired technology and an immaterial amount to net assets acquired, with the excess $9.8 million of the purchase price over the fair value of net tangible and intangible assets acquired recorded as goodwill. The Company also recognized transaction costs of approximately $0.4 million, which is included in general and administrative expense in its consolidated statements of operations for the year ended March 31, 2016. The Opsmatic technology complements the Company’s existing server and infrastructure monitoring capabilities and has an estimated useful life of 3 years. The acquisition has been accounted for as a business combination under the acquisition method. Goodwill generated from the acquisition is attributable to expected synergies from future growth and potential future monetization opportunities, and is not deductible for tax purposes. Pro forma revenue and results of operations have not been presented because the historical results of Opsmatic were not material to the Company’s consolidated financial statements in any period presented.
The acquisition also included an obligation to issue up to 98,115 shares of the Company's common stock, with an aggregate grant date fair value of $3.8 million, to certain employees of Opsmatic, contingent upon their continuous employment with the Company. As such, compensation expense is being recorded on a straight-line basis over the requisite service period of thirty months. As of March 31, 2017, 69,291 of these shares were issued, 35,913 of which were subject to repurchase by the Company.
Few Ducks, S.L.
In October 2014, the Company closed the acquisition of Few Ducks, S.L., (“Ducksboard”), a provider of real-time dashboards for tracking business metrics from a broad set of application sources, pursuant to which the Company acquired all of the capital stock of Ducksboard for 121,493 shares of the Company’s common stock, all of which were issued upon the conclusion of the indemnity holdback period, and $2.3 million in cash resulting in an aggregate purchase price of $4.2 million. Of the total purchase price, $2.8 million was allocated to identifiable intangible assets and $0.7 million to net liabilities assumed, with the excess $2.1 million of the purchase price over the fair value of net tangible liabilities assumed and intangible assets acquired recorded as goodwill. The addition of the Ducksboard technology complements the Company’s visualization expertise and the Company believes it will readily expand the sources of data that are available to customers via the Company’s Digital Intelligence Platform. The Company accounted for the acquisition of Ducksboard as a purchase of a business. Goodwill generated from the acquisition is attributable to expected synergies from future growth and potential future monetization opportunities, and is not deductible for tax purposes. Pro forma revenue and results of operations have not been presented because the historical results of Ducksboard were not material to the Company’s consolidated financial statements in any period presented.
In connection with the acquisition, the Company also agreed to issue up to 128,507 shares of its common stock, with a grant date fair value of $1.9 million, to certain former employees of Ducksboard, contingent upon their continuous employment with the Company. From the date of acquisition, compensation expense is recorded straight-line over the requisite service period of three years. As of March 31, 2017, 85,156 of these shares were issued.
3. | Fair Value Measurements |
The Company reports assets and liabilities recorded at fair value on the Company’s consolidated balance sheets based upon the level of judgment associated with inputs used to measure their fair value. The categories are as follows:
Level 1—Inputs are unadjusted quoted prices in active markets for identical assets or liabilities.
Level 2—Inputs are quoted prices for similar assets and liabilities in active markets; quoted prices for identical assets or liabilities in markets with insufficient volume or infrequent transactions (less active markets); or inputs other than quoted prices that are observable for the assets or liabilities, either directly or indirectly through market corroboration, for substantially the full term of the financial instruments.
Level 3—Inputs are unobservable inputs based on the Company’s own assumptions used to measure assets and liabilities at fair value. The inputs require significant management judgment or estimation.
65
The following tables present information about the Company’s financial assets measured at fair value on a recurring basis as of March 31, 2017 and 2016 based on the three-tier fair value hierarchy (in thousands):
Fair Value Measurements as of March 31, 2017 | |||||||||||||||
Level 1 | Level 2 | Level 3 | Total | ||||||||||||
Cash and cash equivalents: | |||||||||||||||
Money market funds | $ | 36,180 | $ | — | $ | — | $ | 36,180 | |||||||
Commercial paper | — | 5,441 | — | 5,441 | |||||||||||
U.S. government agencies | — | 2,600 | — | 2,600 | |||||||||||
Short-term investments: | |||||||||||||||
Certificates of deposit | — | 28,210 | — | 28,210 | |||||||||||
Commercial paper | — | 10,549 | — | 10,549 | |||||||||||
Corporate notes and bonds | — | 17,378 | — | 17,378 | |||||||||||
U.S. treasury securities | 11,276 | — | — | 11,276 | |||||||||||
U.S. government agencies | — | 50,688 | — | 50,688 | |||||||||||
Restricted cash: | |||||||||||||||
Money market funds | 8,115 | — | — | 8,115 | |||||||||||
Total | $ | 55,571 | $ | 114,866 | $ | — | $ | 170,437 | |||||||
Included in cash and cash equivalents | $ | 44,221 | |||||||||||||
Included in short-term investments | $ | 118,101 | |||||||||||||
Included in restricted cash | $ | 8,115 | |||||||||||||
Fair Value Measurements as of March 31, 2016 | |||||||||||||||
Level 1 | Level 2 | Level 3 | Total | ||||||||||||
Cash and cash equivalents: | |||||||||||||||
Money market funds | $ | 36,118 | $ | — | $ | — | $ | 36,118 | |||||||
Short-term investments: | |||||||||||||||
Corporate notes and bonds | — | 15,933 | — | 15,933 | |||||||||||
U.S. treasury securities | 2,297 | — | — | 2,297 | |||||||||||
U.S. government agencies | — | 107,184 | — | 107,184 | |||||||||||
Restricted cash: | |||||||||||||||
Money market funds | 8,115 | — | — | 8,115 | |||||||||||
Total | $ | 46,530 | $ | 123,117 | $ | — | $ | 169,647 | |||||||
Included in cash and cash equivalents | $ | 36,118 | |||||||||||||
Included in short-term investments | $ | 125,414 | |||||||||||||
Included in restricted cash | $ | 8,115 | |||||||||||||
There were no transfers between fair value measurement levels during the fiscal year ended March 31, 2017.
Gross unrealized gains or losses for cash equivalents and available-for-sale marketable securities as of March 31, 2017 and 2016 were not significant. As of March 31, 2017 and 2016, there were no securities that were in an unrealized loss position for more than 12 months.
66
The following table classifies the Company’s available-for-sale short-term investments by contractual maturities as of March 31, 2017 and 2016 (in thousands):
March 31, 2017 | March 31, 2016 | ||||||
Due within one year | $ | 92,874 | $ | 103,822 | |||
Due in one to two years | 25,227 | 21,592 | |||||
Total | $ | 118,101 | $ | 125,414 | |||
For certain other financial instruments, including accounts receivable, accounts payable and other current liabilities, the carrying amounts approximate their fair value due to the relatively short maturity of these balances.
4. | Property and Equipment |
Property and equipment, net, consisted of the following (in thousands):
March 31, 2017 | March 31, 2016 | ||||||
Computers, software, and equipment | $ | 7,060 | $ | 4,835 | |||
Site operation equipment | 25,874 | 14,793 | |||||
Furniture and fixtures | 1,770 | 917 | |||||
Leasehold improvements | 30,586 | 22,217 | |||||
Capitalized software development costs | 32,618 | 28,054 | |||||
Total property and equipment | 97,908 | 70,816 | |||||
Less: accumulated depreciation and amortization | (47,180 | ) | (30,669 | ) | |||
Total property and equipment, net | $ | 50,728 | $ | 40,147 | |||
Depreciation and amortization expense related to property and equipment during the fiscal years ended March 31, 2017, 2016, and 2015 was $17.6 million, $14.0 million, and $8.5 million, respectively.
5. | Goodwill and Purchased Intangibles Assets |
There were no changes to the carrying amount of goodwill for the fiscal year ended March 31, 2017.
Purchased intangible assets subject to amortization as of March 31, 2017 consist of the following (in thousands):
Gross Carrying Amount | Accumulated Amortization | Net Carrying Amount | |||||||||
Developed technology | $ | 4,900 | $ | (2,401 | ) | $ | 2,499 | ||||
Customer relationships | 100 | (100 | ) | — | |||||||
Other intangible assets | 300 | (300 | ) | — | |||||||
$ | 5,300 | $ | (2,801 | ) | $ | 2,499 | |||||
Purchased intangible assets subject to amortization as of March 31, 2016 consist of the following (in thousands):
Gross Carrying Amount | Accumulated Amortization | Net Carrying Amount | |||||||||
Developed technology | $ | 4,900 | $ | (1,339 | ) | $ | 3,561 | ||||
Customer relationships | 100 | (75 | ) | 25 | |||||||
Other intangible assets | 300 | (225 | ) | 75 | |||||||
$ | 5,300 | $ | (1,639 | ) | $ | 3,661 | |||||
Amortization expense of purchased intangible assets for the fiscal years ended March 31, 2017, 2016, and 2015 was $1.1 million, $1.1 million, and $0.5 million, respectively.
67
Estimated future amortization expense as of March 31, 2017 is as follows (in thousands):
2018 | $ | 1,187 | |
2019 | 787 | ||
2020 | 525 | ||
$ | 2,499 | ||
6. | Other Current Liabilities |
Other current liabilities consisted of the following (in thousands):
As of March 31, | |||||||
2017 | 2016 | ||||||
Accrued liabilities | $ | 3,709 | $ | 2,480 | |||
Accrued tax liabilities | 975 | 787 | |||||
Deferred rent | 948 | 413 | |||||
Other | 1,975 | 1,045 | |||||
Total other current liabilities | $ | 7,607 | $ | 4,725 | |||
7. | Commitments and Contingencies |
Leases—The Company leases office space under non-cancelable operating lease agreements, which expire from 2017 through 2023.
Deferred Rent—Certain of the Company’s operating leases contain rent holidays, allowances, and rent escalation provisions. For these leases, the Company recognizes the related rental expense on a straight-line basis over the life of the lease from the date the Company takes possession of the office and records the difference between amounts charged to operations and amounts paid as deferred rent. These rent holidays, allowances, and rent escalations are considered in determining the straight-line expense to be recorded over the lease term. As of March 31, 2017 and 2016, $9.2 million and $5.1 million, respectively, was recorded as deferred rent.
Rent expense, net of sublease income, for operating leases was $9.8 million, $6.4 million, and $5.2 million for the fiscal years ended March 31, 2017, 2016, and 2015, respectively. For the fiscal years ended March 31, 2017, 2016, and 2015, rent expense was offset by $0.1 million, $31 thousand, and $0.7 million of sublease income, respectively.
Future minimum lease payments under non-cancelable operating leases as of March 31, 2017 were as follows (in thousands):
Years Ending March 31, | Operating Leases | ||
2018 | $ | 10,335 | |
2019 | 10,447 | ||
2020 | 10,737 | ||
2021 | 7,607 | ||
2022 | 6,054 | ||
Thereafter | 9,627 | ||
Total minimum future lease payments | $ | 54,807 | |
Future minimum sublease income under non-cancelable operating leases is $0.1 million for the fiscal year ending March 31, 2017.
Purchase Commitments—As of March 31, 2017 and 2016, the Company had purchase commitments of $29.9 million and $11.9 million, respectively, for specific contractual services.
Legal Proceedings—From time to time, the Company may become involved in various legal proceedings in the ordinary course of its business, and may be subject to third-party infringement claims.
68
On November 5, 2012, CA, Inc. filed suit against the Company in the United States District Court, Eastern District of New York for alleged patent infringement. CA, Inc.’s complaint against the Company claims that certain aspects of the Company’s products infringe certain patents held by CA, Inc. Discovery is complete in the case, and the court has ruled on summary judgment motions filed by both parties. A trial date has not been set as of March 31, 2017. The Company cannot at this time predict the likely outcome of this proceeding or estimate the amount or range of loss or possible loss that may arise from it. The Company has not accrued any loss related to the outcome of this case as of March 31, 2017.
In the normal course of business, the Company may agree to indemnify third parties with whom it enters into contractual relationships, including customers, lessors, and parties to other transactions with the Company, with respect to certain matters. The Company has agreed, under certain conditions, to hold these third parties harmless against specified losses, such as those arising from a breach of representations or covenants, other third-party claims that the Company’s products when used for their intended purposes infringe the intellectual property rights of such other third parties, or other claims made against certain parties. To date, the Company has not incurred any costs as a result of such obligations and has not accrued any liabilities related to such obligations in the consolidated financial statements. In addition, the Company indemnifies its officers, directors, and certain key employees while they are serving in good faith in their respective capacities. The Company does not currently believe there is a reasonable possibility that a loss may have been incurred under these indemnification obligations. To date, there have been no claims under any such indemnification provisions.
8. | Convertible Preferred Stock |
In April 2014, the Company sold 3,456,140 shares of Series F convertible preferred stock (“Series F”) at a price of $28.93 per share, receiving net proceeds of $97.2 million. Holders of the Company’s Series F voted together with the holders of the Company’s common stock and convertible preferred stock, with each share of Series F having a number of votes equal to the number of shares of common stock issuable upon the conversion of each share of Series F. In a liquidation event, holders of Series F were entitled to receive, ratably with the Series E convertible preferred stock and in preference to the holders of all other classes of convertible preferred stock, an amount equal to the original issuance price of the Series F plus any declared but unpaid dividends. The holders of Series F had the right to convert, at any time, into shares of common stock at an initial conversion ratio of 1:1, subject to adjustment based on antidilution protection, and all outstanding Series F would automatically convert into shares of common stock in the event that (i) the holders of a majority of outstanding Series F consent to conversion or (ii) immediately prior to the closing of a qualified IPO. The sale of common stock in the IPO triggered the weighted average anti-dilution provisions set forth in the Company’s amended and restated certificate of incorporation. At the IPO price of $23.00 per share, the per share conversion rate for the Company’s Series F convertible preferred stock into common stock was approximately 1:1.02.
Upon the completion of the IPO, all outstanding convertible preferred stock was converted into 24,885,778 shares of common stock and the Company’s certificate of incorporation was amended and restated to authorize the Company to issue 10,000,000 shares of preferred stock with a par value of $0.001 per share.
Convertible preferred stock immediately prior to the conversion into common stock consisted of the following (in thousands):
Shares Authorized | Shares Issued and Outstanding | Liquidation Preference | |||||||
Series A | 7,028 | 7,000 | $ | 3,500 | |||||
Series B | 6,492 | 6,492 | 7,940 | ||||||
Series C | 2,852 | 2,852 | 9,943 | ||||||
Series D | 1,643 | 1,566 | 15,000 | ||||||
Series E | 3,447 | 3,447 | 60,000 | ||||||
Series F | 3,500 | 3,456 | 100,000 | ||||||
24,962 | 24,813 | $ | 196,383 | ||||||
69
9. | Common Stock and Stockholders’ Equity |
Common stock reserved for issuance—The Company had reserved shares of common stock for future issuance as follows (in thousands):
As of March 31, | |||||
2017 | 2016 | ||||
Common stock options outstanding | 4,607 | 7,050 | |||
RSUs outstanding | 1,978 | 1,549 | |||
Common stock reserved for issuance in connection with acquisition | 43 | 90 | |||
Available for future stock option and RSU grants | 8,034 | 6,561 | |||
Available for future employee stock purchase plan awards | 1,648 | 1,360 | |||
16,310 | 16,610 | ||||
Employee Stock Purchase Plan—The Company’s board of directors adopted, and the Company’s stockholders approved, the Company’s ESPP, which became effective in December 2014. The ESPP initially reserved and authorized the issuance of up to 1,000,000 shares of common stock. The ESPP provides that the number of shares reserved and available for issuance under the ESPP automatically increases each April, beginning on April 1, 2015, by the lesser of 500,000 shares, 1% of the number of the Company’s common stock shares issued and outstanding on the immediately preceding March 31, or such lesser number of shares as determined by the Company’s board of directors. For the fiscal years ended March 31, 2017 and March 31, 2016, 0.2 million shares and 0.1 million shares of common stock were purchased under the ESPP, respectively, and a total of $1.8 million and $0.9 million of stock-based compensation expense was recorded, respectively. As of March 31, 2017, 1,647,744 shares of common stock were available for issuance under the ESPP.
2008 Equity Incentive Plan—The Company’s board of directors adopted the 2008 Equity Incentive Plan, or the 2008 Plan, in February 2008. The 2008 Plan was terminated in connection with the Company’s IPO, and accordingly, no shares are available for future issuance under this plan. The 2008 Plan continues to govern outstanding awards granted thereunder.
2014 Equity Incentive Plan—The Company’s board of directors adopted, and the Company’s stockholders approved, the Company’s 2014 Equity Incentive Plan (the "2014 Plan"), which became effective in December 2014. The 2014 Plan serves as the successor to the Company’s 2008 Plan. The 2014 Plan initially reserved and authorized the issuance of 5,000,000 shares of the Company’s common stock. Additionally, shares not issued or subject to outstanding grants under the 2008 Plan upon its termination became available under the 2014 Plan, resulting in a total of 5,184,878 available shares under the 2014 Plan as of the effective date of the 2014 Plan. Pursuant to the terms of the 2014 Plan, any shares subject to outstanding stock options or other stock awards under the 2008 Plan that (i) expire or terminate for any reason prior to exercise or settlement, (ii) are forfeited because of the failure to meet a contingency or condition required to vest such shares or otherwise return to the Company or (iii) are reacquired, withheld (or not issued) to satisfy a tax withholding obligation in connection with an award or to satisfy the purchase price or exercise price of a stock award will become available for issuance pursuant to awards granted under the 2014 Plan. The 2014 Plan provides that the number of shares reserved and available for issuance under the plan automatically increases each April 1, beginning on April 1, 2015, by 5% of the outstanding number of shares of the Company’s common stock shares issued and outstanding on the immediately preceding March 31, or such lesser number of shares as determined by the Company's board of directors. As of March 31, 2017, there were 8,033,841 shares available for issuance under the 2014 Plan.
70
The following table summarizes the Company’s stock option and RSU award activities for the fiscal year ended March 31, 2017 (in thousands, except per share information):
Options Outstanding | RSUs Outstanding | ||||||||||||||||||||||||
Number of Shares | Weighted- Average Exercise Price | Weighted-Average Remaining Contractual Term (in years) | Aggregate Intrinsic Value | Number of Shares | Weighted- Average Grant Date Fair Value | Weighted- Average Remaining Contractual Term (in years) | Aggregate Intrinsic Value | ||||||||||||||||||
Outstanding—April 1, 2016 | 7,050 | $ | 13.20 | 6.5 | $ | 95,326 | 1,549 | $ | 29.73 | 3.1 | $ | 40,387 | |||||||||||||
Stock options granted | 402 | 28.93 | |||||||||||||||||||||||
RSUs granted | 1,384 | 28.75 | |||||||||||||||||||||||
Stock options exercised | (2,474 | ) | 6.74 | 65,263 | |||||||||||||||||||||
RSUs vested | (582 | ) | 29.19 | ||||||||||||||||||||||
Stock options canceled/forfeited | (371 | ) | 20.15 | ||||||||||||||||||||||
RSUs canceled/forfeited | (373 | ) | 29.11 | ||||||||||||||||||||||
Outstanding - March 31, 2017 | 4,607 | $ | 17.49 | 7.1 | $ | 90,339 | 1,978 | $ | 29.32 | 2.8 | $ | 73,309 | |||||||||||||
Options vested and expected to vest - March 31, 2017 | 4,591 | $ | 17.45 | 7.1 | $ | 90,232 | |||||||||||||||||||
Options vested and exercisable - March 31, 2017 | 2,722 | $ | 13.96 | 6.6 | $ | 62,943 | |||||||||||||||||||
RSUs expected to vest - March 31, 2017 | 1,919 | $ | 29.36 | $ | 71,134 | ||||||||||||||||||||
The weighted-average grant-date fair value of options granted during the fiscal years ended March 31, 2017, 2016, and 2015 was $12.75, $14.41, and $9.20, respectively. Intrinsic value of options exercised during the fiscal years ended March 31, 2017, 2016, and 2015 was $65.3 million, $65.6 million, and $8.7 million, respectively. The total fair value of RSUs vested during the fiscal years ended March 31, 2017 and 2016 was $17.1 million and $5.5 million, respectively. There were no RSUs vested during the fiscal year ended March 31, 2015.
Aggregate intrinsic value for options and RSUs outstanding represents the difference between the closing stock price of the Company’s common stock and the exercise price of outstanding, in-the-money awards. The Company’s closing stock price as reported on the New York Stock Exchange as of March 31, 2017 was $37.07.
Employee Stock Options and ESPP Valuation—The Company estimates the fair value of stock options and ESPP shares on the date of grant using the Black-Scholes option-pricing model. Each of the Black-Scholes inputs is subjective and generally requires significant judgments to determine. The assumptions used to estimate the fair value of stock options granted and ESPP shares to be issued during the fiscal years ended March 31, 2017, 2016, and 2015 were as follows:
Stock Options: | |||||
Year Ended March 31, | |||||
2017 | 2016 | 2015 | |||
Expected term (years) | 5 - 6 | 6 | 5 - 6 | ||
Expected volatility | 46 - 47% | 45 - 47% | 45 - 51% | ||
Risk-free interest rate | 0.21 - 2.17% | 1.39 - 1.93% | 1.40 - 2.01% | ||
Dividend yield | — | — | — | ||
ESPP: | |||||
Year Ended March 31, | |||||
2017 | 2016 | 2015 | |||
Expected term (years) | 0.5 | 0.5 | — | ||
Expected volatility | 37 - 44% | 35 - 54% | — | ||
Risk-free interest rate | 0.46 - 0.67% | 0.25 - 0.42% | — | ||
Dividend yield | — | — | — | ||
Fair Value of Common Stock
Prior to its IPO, the fair value of the common stock underlying the stock-based awards was determined by the Company’s board of directors. Given the absence of a public trading market, the Company’s board of directors considered numerous objective and subjective factors to determine the fair value of the Company’s common stock at each meeting at which awards
71
were approved. These factors included, but were not limited to (i) contemporaneous third-party valuations of common stock; (ii) the rights and preferences of convertible preferred stock relative to common stock; (iii) the lack of marketability of common stock; (iv) developments in the business; and (v) the likelihood of achieving a liquidity event, such as an IPO or sale of the Company, given prevailing market conditions. Since the Company’s IPO, it has used the market closing price of its common stock as reported on the New York Stock Exchange.
Risk-Free Interest Rate
The Company bases the risk-free interest rate used in the Black-Scholes option-pricing model on the implied yield available on U.S. Treasury zero-coupon issues with an equivalent expected term of the options for each option group.
Expected Term
The Company determines the expected term based on the average period the stock options are expected to remain outstanding generally calculated as the midpoint of the stock options vesting term and contractual expiration period, as the Company does not have sufficient historical information to develop reasonable expectations about future exercise patterns and post-vesting employment termination behavior. The Company estimates the expected term for ESPP shares using the purchase period of 6 months.
Expected Volatility
The Company determines the price volatility factor based on the historical volatilities of its peer group as the Company did not have significant trading history for its common stock. Beginning in February 2017, the Company started to use it's historical volatility data when valuing ESPP shares.
Dividend Yield
The expected dividend assumption is based on the Company’s current expectations about its anticipated dividend policy.
Stock-Based Compensation Expense—Stock-based compensation expense for both employees and nonemployees was $31.9 million, $23.3 million, and $11.7 million for the fiscal years ended March 31, 2017, 2016, and 2015, respectively. Cost of revenue, research and development, sales and marketing, and general and administrative expenses were as follows (in thousands):
Year Ended March 31, | |||||||||||
2017 | 2016 | 2015 | |||||||||
Cost of revenue | $ | 1,847 | $ | 1,238 | $ | 591 | |||||
Research and development | 9,975 | 6,659 | 2,055 | ||||||||
Sales and marketing | 13,042 | 9,258 | 5,108 | ||||||||
General and administrative | 7,082 | 6,113 | 3,912 | ||||||||
Total stock-based compensation expense | $ | 31,946 | $ | 23,268 | $ | 11,666 | |||||
As of March 31, 2017, unrecognized stock-based compensation cost related to outstanding unvested stock options was $19.4 million, which is expected to be recognized over a weighted-average period of approximately 1.9 years. As of March 31, 2017, unrecognized stock-based compensation cost related to outstanding unvested stock awards was $53.1 million, which is expected to be recognized over a weighted-average period of approximately 2.7 years.
10. | Income Taxes |
The components of (loss) income before income taxes are as follows (in thousands):
Year Ended March 31, | |||||||||||
2017 | 2016 | 2015 | |||||||||
Domestic | $ | (62,526 | ) | $ | (67,988 | ) | $ | (50,031 | ) | ||
Foreign | 1,713 | 803 | (203 | ) | |||||||
Total | $ | (60,813 | ) | $ | (67,185 | ) | $ | (50,234 | ) | ||
72
The components of the provision (benefit) for income taxes are as follows (in thousands):
Year Ended March 31, | |||||||||||
2017 | 2016 | 2015 | |||||||||
Current Provision: | |||||||||||
Federal | $ | — | $ | — | $ | — | |||||
State | 18 | 93 | — | ||||||||
Foreign | 333 | 345 | 334 | ||||||||
Total current provision | 351 | 438 | 334 | ||||||||
Deferred Provision: | |||||||||||
Federal | — | (7 | ) | (8 | ) | ||||||
State | — | — | — | ||||||||
Foreign | (87 | ) | (129 | ) | (411 | ) | |||||
Total deferred provision | (87 | ) | (136 | ) | (419 | ) | |||||
Total income tax provision (benefit) | $ | 264 | $ | 302 | $ | (85 | ) | ||||
The items accounting for the difference between income taxes computed at the federal statutory rate and the provision for income taxes consist of the following:
Year Ended March 31, | ||||||||
2017 | 2016 | 2015 | ||||||
Federal statutory rate | 34.0 | % | 34.0 | % | 34.0 | % | ||
Effect of: | ||||||||
State taxes, net of federal benefits | 2.4 | 2.4 | 1.5 | |||||
Stock-based compensation | (1.8 | ) | (1.5 | ) | (4.5 | ) | ||
Research and development credit | 3.5 | 3.5 | 1.8 | |||||
Recognition of assets not previously recognized | — | 2.9 | — | |||||
Other | 0.4 | (0.3 | ) | — | ||||
Valuation allowance | (38.9 | ) | (41.4 | ) | (32.6 | ) | ||
Effective tax rate | (0.4 | %) | (0.5 | %) | 0.2 | % | ||
Deferred income taxes reflect the net tax effects of temporary differences between the carrying amounts of assets and liabilities for financial reporting purposes and the amounts used for income tax purposes. The following table presents the significant components of the Company’s deferred tax assets and liabilities for the periods presented (in thousands):
As of March 31, | |||||||
2017 | 2016 | ||||||
Deferred tax assets: | |||||||
Accrued expenses | $ | 5,120 | $ | 2,950 | |||
Depreciation and amortization | 3,183 | 1,677 | |||||
Net operating loss carryforwards | 75,949 | 62,909 | |||||
Stock based compensation | 7,109 | 4,645 | |||||
Research and development credits | 8,079 | 5,840 | |||||
Gross deferred tax assets | 99,440 | 78,021 | |||||
Valuation allowance | (94,352 | ) | (72,528 | ) | |||
Total deferred tax assets | 5,088 | 5,493 | |||||
Deferred tax liabilities: | |||||||
Prepaids | (1,912 | ) | (1,402 | ) | |||
Intangibles | 72 | (25 | ) | ||||
Capitalized research and development | (3,108 | ) | (4,013 | ) | |||
Total deferred tax liabilities | (4,948 | ) | (5,440 | ) | |||
Total net deferred tax assets | $ | 140 | $ | 53 | |||
73
The net deferred tax assets increased from the prior year primarily due to a reversal of deferred tax liabilities resulting from the acquisition of intangibles in Spain as well as increased deferred taxes from stock based compensation charges in the U.K.
Recognition of deferred tax assets is appropriate when realization of such assets is more likely than not. Management assesses the available positive and negative evidence to estimate if sufficient taxable income will be generated to use the existing deferred tax assets. Based upon the weight of available evidence, which includes the Company’s historical operating performance and the U.S. cumulative net losses in all prior periods, the Company has provided a valuation allowance against its U.S. deferred tax assets. The Company’s valuation allowance increased by $21.8 million and $28.8 million for the fiscal years ended March 31, 2017 and 2016, respectively.
As of March 31, 2017, the Company has U.S. federal and state net operating losses of approximately $313.8 million and $161.4 million, respectively, which expire beginning in the year 2028 and 2024, respectively. Of these amounts, $105.0 million and $51.4 million, respectively, represent federal and state tax deductions from stock-based compensation which will be recorded as an adjustment to additional paid-in capital when they reduce taxes payable. The Company also has federal, California, and Oregon research and development credits of $8.3 million, $1.8 million, and $1.8 million, respectively. The federal tax credit carryforwards will expire beginning in 2028 if not utilized. The California tax credit carryforwards do not expire. The Oregon tax credit carryforwards began to expire in 2014.
Utilization of the net operating loss carryforwards may be subject to a substantial annual limitation due to the ownership change limitations provided by the Internal Revenue Code of 1986, as amended (“Code”), and similar state provisions. The annual limitation may result in the expiration of net operating losses and credits before utilization.
Code Section 382 (“Section 382”) ownership change generally occurs if one or more stockholders or groups of stockholders who own at least 5% of the Company’s stock increase their ownership by more than 50 percentage points over their lowest ownership percentage within a rolling three years period. Similar rules may apply under state tax laws. The Company did experience one or more ownership changes in financial periods ending on or before March 31, 2017. In this regard, the Company has determined that based on the timing of the ownership changes and the corresponding Section 382 limitations, none of its net operating losses or other tax attributes appear to expire subject to such limitation.
The Company has not provided U.S. income tax on certain foreign earnings that are deemed to be indefinitely invested outside the U.S. As of March 31, 2017, 2016, and 2015, the amount of accumulated unremitted earnings from the Company’s foreign subsidiaries was approximately $2.2 million, $0.9 million, and $0.1 million.
The Company had unrecognized tax benefits of $5.0 million, $3.5 million, and $1.8 million as of March 31, 2017, 2016, and 2015. As of March 31, 2017, if recognized, the unrecognized tax benefit of $5.0 million would affect income tax expense, before consideration of any valuation allowance. The Company does not expect the unrecognized tax benefits to change significantly over the next 12 months.
A reconciliation of the beginning and ending amount of unrecognized tax benefits was as follows (in thousands):
Balance at March 31, 2014 | $ | 735 | |
Additions based on tax positions taken during the current period | 1,009 | ||
Additions based on tax positions taken during the prior period | 84 | ||
Reductions based on tax positions taken during the prior period | (2 | ) | |
Balance at March 31, 2015 | 1,826 | ||
Additions based on tax positions taken during the current period | 1,414 | ||
Additions based on tax positions taken during the prior period | 249 | ||
Balance at March 31, 2016 | 3,489 | ||
Additions based on tax positions taken during the current period | 1,503 | ||
Reductions based on tax positions taken during the prior period | (7 | ) | |
Balance at March 31, 2017 | $ | 4,985 | |
The Company recognizes interest and penalties related to unrecognized tax benefits within the income tax expense line in the consolidated statement of operations. Accrued interest and penalties have not been significant for the fiscal years ended March 31, 2017, 2016, and 2015.
74
The Company files income tax returns in the U.S., certain states, Ireland, Canada, Germany, Switzerland, UK, and Spain. All of the tax years, from the date of inception, are open for examination for foreign jurisdictions. Carryover attributes beginning March 31, 2008 remain open to adjustment by the U.S. and state authorities.
11. | Net Loss Per Share |
As the Company had net losses for the fiscal years ended March 31, 2017, 2016, and 2015, all potential common shares were determined to be anti-dilutive.
The following table sets forth the computation of net loss per share, basic and diluted (in thousands, except per share amounts):
Year Ended March 31, | |||||||||||
2017 | 2016 | 2015 | |||||||||
Numerator: | |||||||||||
Net loss | $ | (61,077 | ) | $ | (67,487 | ) | $ | (50,149 | ) | ||
Denominator: | |||||||||||
Weighted average shares used to compute net loss per share, basic and diluted | 51,715 | 48,410 | 25,290 | ||||||||
Net loss per share—basic and diluted | $ | (1.18 | ) | $ | (1.39 | ) | $ | (1.98 | ) | ||
The following outstanding options, unvested shares, and ESPP shares were excluded (as common stock equivalents) from the computation of diluted net loss per common share for the periods presented as their effect would have been antidilutive (in thousands):
As of March 31, | ||||||||
2017 | 2016 | 2015 | ||||||
Options to purchase common stock | 4,607 | 7,050 | 9,422 | |||||
Common stock reserved for issuance in connection with acquisition | 43 | 90 | 129 | |||||
Restricted stock units | 1,978 | 1,549 | 723 | |||||
ESPP shares | 38 | 46 | — | |||||
6,666 | 8,735 | 10,274 | ||||||
12. | Employee Benefit Plan |
The Company has established a 401(k) tax-deferred savings plan (the “401(k) Plan”), which permits participants to make contributions by salary deduction pursuant to Section 401(k) of the Code. The Company is responsible for administrative costs of the 401(k) Plan and may, at its discretion, make matching contributions to the 401(k) Plan. For the fiscal years ended March 31, 2017 and 2016, and 2015, the Company made contributions of $2.3 million, $2.1 million, and $1.4 million to the 401(k) Plan, respectively.
13. | Revenue by Geographic Location |
The following table shows the Company’s revenue by geographic areas, as determined based on the billing address of its customers (in thousands):
Year Ended March 31, | |||||||||||
2017 | 2016 | 2015 | |||||||||
United States | $ | 178,727 | $ | 121,588 | $ | 73,416 | |||||
EMEA | 49,825 | 34,602 | 21,043 | ||||||||
APAC | 19,887 | 14,118 | 8,732 | ||||||||
Other | 15,040 | 11,001 | 7,200 | ||||||||
Total revenue | $ | 263,479 | $ | 181,309 | $ | 110,391 | |||||
Substantially all of the Company’s long-lived assets were attributable to operations in the United States as of March 31, 2017 and 2016.
75
14. | Related Party Transactions |
Certain members of the Company’s board of directors serve on the board of directors of and/or are executive officers of, and, in some cases, are investors in, companies that are customers or vendors of the Company. Revenue from sales to these companies of $1.8 million, $0.9 million, and $0.7 million were recognized for the fiscal years ended March 31, 2017, 2016, and 2015, respectively. There was not a significant amount of accounts receivable due from these companies as of March 31, 2017 or March 31, 2016. $1.4 million, $1.8 million, and $3.3 million in expenses related to purchases from these companies were recorded during the fiscal years ended March 31, 2017, 2016, and 2015, respectively. There were $0.1 million and $0.1 million in accounts payable to these companies as of March 31, 2017 and 2016, respectively.
Item 9. Changes in and Disagreements With Accountants on Accounting and Financial Disclosure
None.
Item 9A. Controls and Procedures
Evaluation of Disclosure Controls and Procedures
Our management, with the participation of our Chief Executive Officer and Chief Financial Officer, has evaluated the effectiveness of our disclosure controls and procedures (as defined in Rules 13a- 15(e) and 15d- 15(e) under the Exchange Act) as of the end of the period covered by this Annual Report on Form 10-K.
Based on this evaluation, our Chief Executive Officer and Chief Financial Officer concluded that, as of March 31, 2017, our disclosure controls and procedures were effective to provide reasonable assurance that information we are required to disclose in reports that we file or submit under the Exchange Act is recorded, processed, summarized, and reported within the time periods specified in the SEC’s rules and forms, and that such information is accumulated and communicated to our management, including our Chief Executive Officer and Chief Financial Officer, as appropriate, to allow timely decisions regarding required disclosure.
Management’s Report on Internal Control Over Financial Reporting
Our management is responsible for establishing and maintaining adequate internal control over financial reporting, as defined in Rule 13a-15(f) of the Exchange Act. Our management conducted an evaluation of the effectiveness of our internal control over financial reporting based on the framework in Internal Control—Integrated Framework (2013) issued by the Committee of Sponsoring Organizations of the Treadway Commission. Our internal over control over financial reporting includes policies and procedures that provide reasonable assurance regarding the reliability of financial reporting and the preparation of financial statements for external reporting purposes in accordance with GAAP. Based on this evaluation, management concluded that our internal control over financial reporting was effective as of March 31, 2017. Our independent registered public accounting firm, Deloitte & Touche LLP, has issued an audit report with respect to our internal control over financial reporting, which appears in Part II, Item 8 of this Annual Report on Form 10-K.
Limitations on the Effectiveness of Controls
In designing and evaluating the disclosure controls and procedures and internal control over financial reporting, management recognizes that any controls and procedures, no matter how well designed and operated, can provide only reasonable assurance of achieving the desired control objectives. In addition, the design of disclosure controls and procedures and internal control over financial reporting must reflect the fact that there are resource constraints and that management is required to apply its judgment in evaluating the benefits of possible controls and procedures relative to their costs.
Changes in Internal Control over Financial Reporting
There was no change in our internal control over financial reporting identified in connection with the evaluation required by Rule 13a-15(d) and 15d-15(d) of the Exchange Act that occurred during the quarter ended March 31, 2017 that has materially affected, or is reasonably likely to materially affect, our internal control over financial reporting.
76
REPORT OF INDEPENDENT REGISTERED PUBLIC ACCOUNTING FIRM
To the Board of Directors and Stockholders of
New Relic, Inc.
San Francisco, California
We have audited the internal control over financial reporting of New Relic, Inc. and subsidiaries (the "Company") as of March 31, 2017, based on criteria established in Internal Control—Integrated Framework (2013) issued by the Committee of Sponsoring Organizations of the Treadway Commission. The Company's management is responsible for maintaining effective internal control over financial reporting and for its assessment of the effectiveness of internal control over financial reporting, included in the accompanying Management’s Report on Internal Control over Financial Reporting. Our responsibility is to express an opinion on the Company's internal control over financial reporting based on our audit.
We conducted our audit in accordance with the standards of the Public Company Accounting Oversight Board (United States). Those standards require that we plan and perform the audit to obtain reasonable assurance about whether effective internal control over financial reporting was maintained in all material respects. Our audit included obtaining an understanding of internal control over financial reporting, assessing the risk that a material weakness exists, testing and evaluating the design and operating effectiveness of internal control based on the assessed risk, and performing such other procedures as we considered necessary in the circumstances. We believe that our audit provides a reasonable basis for our opinion.
A company's internal control over financial reporting is a process designed by, or under the supervision of, the company's principal executive and principal financial officers, or persons performing similar functions, and effected by the company's board of directors, management, and other personnel to provide reasonable assurance regarding the reliability of financial reporting and the preparation of financial statements for external purposes in accordance with generally accepted accounting principles. A company's internal control over financial reporting includes those policies and procedures that (1) pertain to the maintenance of records that, in reasonable detail, accurately and fairly reflect the transactions and dispositions of the assets of the company; (2) provide reasonable assurance that transactions are recorded as necessary to permit preparation of financial statements in accordance with generally accepted accounting principles, and that receipts and expenditures of the company are being made only in accordance with authorizations of management and directors of the company; and (3) provide reasonable assurance regarding prevention or timely detection of unauthorized acquisition, use, or disposition of the company's assets that could have a material effect on the financial statements.
Because of the inherent limitations of internal control over financial reporting, including the possibility of collusion or improper management override of controls, material misstatements due to error or fraud may not be prevented or detected on a timely basis. Also, projections of any evaluation of the effectiveness of the internal control over financial reporting to future periods are subject to the risk that the controls may become inadequate because of changes in conditions, or that the degree of compliance with the policies or procedures may deteriorate.
In our opinion, the Company maintained, in all material respects, effective internal control over financial reporting as of March 31, 2017, based on the criteria established in Internal Control—Integrated Framework (2013) issued by the Committee of Sponsoring Organizations of the Treadway Commission.
We have also audited, in accordance with the standards of the Public Company Accounting Oversight Board (United States), the consolidated financial statements as of and for the year ended March 31, 2017 of the Company and our report dated May 18, 2017 expressed an unqualified opinion on those financial statements.
/s/ DELOITTE & TOUCHE LLP
San Francisco, California
May 18, 2017
77
Item 9B. Other Information
None.
78
PART III
Item 10. Directors, Executive Officers and Corporate Governance
The information called for by this item will be set forth under the captions “Election of Directors,” “Information Regarding the Board of Directors and Corporate Governance,” “Section 16(a) Beneficial Ownership Reporting Compliance,” “Report of the Audit Committee of the Board of Directors” and “Executive Officers and Other Executive Management” in our Definitive Proxy Statement for the 2017 Annual Meeting of Stockholders to be filed with the SEC within 120 days of the fiscal year ended March 31, 2017, or our Proxy Statement, and is incorporated herein by reference.
Item 11. Executive Compensation
The information called for by this item will be set forth under the captions “Executive Compensation,” “Director Compensation” and “Information Regarding the Board of Directors and Corporate Governance” in our Proxy Statement and is incorporated herein by reference.
Item 12. Security Ownership of Certain Beneficial Owners and Management and Related Stockholder Matters
The information called for by this item will be set forth under the captions “Security Ownership of Certain Beneficial Owners and Management” and “Equity Compensation Plan Information” in our Proxy Statement and is incorporated herein by reference.
Item 13. Certain Relationships and Related Transactions, and Director Independence
The information called for by this item will be set forth under the captions “Transactions with Related Persons” and “Information Regarding the Board of Directors and Corporate Governance” in our Proxy Statement and is incorporated herein by reference.
Item 14. Principal Accounting Fees and Services
The information called for by this item will be set forth under the caption “Ratification of Selection of Independent Registered Public Accounting Firm” in our Proxy Statement and is incorporated herein by reference.
79
PART IV
Item 15. Exhibits, Financial Statement Schedules
The following documents are filed as part of this Annual Report on Form 10-K:
(1) | Consolidated Financial Statements |
Our Consolidated Financial Statements are listed in the “Index to Consolidated Financial Statements” under Part II, Item 8 of this Annual Report on Form 10-K.
(2) | Financial Statement Schedules |
All financial statement schedules have been omitted because they are not required, not applicable, not present in amounts sufficient to require submission of the schedule, or the required information is shown in our Consolidated Financial Statements or Notes thereto.
(3) | Exhibits |
The exhibits listed in the accompanying Exhibit Index are filed, furnished or incorporated by reference as part of this Annual Report on Form 10-K.
80
SIGNATURES
Pursuant to the requirements of Section 13 or 15(d) of the Securities Exchange Act of 1934, as amended, the registrant has duly caused this Annual Report on Form 10-K to be signed on its behalf by the undersigned, thereunto duly authorized.
New Relic, Inc. | |||
Date: | May 18, 2017 | By: | /s/ Mark Sachleben |
Mark Sachleben | |||
Chief Financial Officer (Principal Financial and Accounting Officer and Duly Authorized Signatory) | |||
POWER OF ATTORNEY
Each person whose signature appears below constitutes and appoints Lewis Cirne and Mark Sachleben, and each of them, as his or her true and lawful attorney-in-fact and agent, with full power of substitution and resubstitution, for him or her and in his or her name, place and stead, in any and all capacities, to sign any and all amendments to this Annual Report on Form 10-K, and to file the same, with all exhibits thereto, and other documents in connection therewith, with the Securities and Exchange Commission, granting unto said attorneys-in-fact and agents, and each of them, full power and authority to do and perform each and every act and thing requisite and necessary to be done in connection therewith, as fully to all intents and purposes as he or she might or could do in person, hereby ratifying and confirming all that said attorneys-in-fact and agents, or any of them, or their or his substitutes, may lawfully do or cause to be done by virtue thereof.
Pursuant to the requirements of the Securities Exchange Act of 1934, as amended, this report has been signed below by the following persons on behalf of the registrant in the capacities and on the dates indicated.
Name | Title | Date | ||
/s/ Lewis Cirne | Chief Executive Officer and Director | May 18, 2017 | ||
Lewis Cirne | (Principal Executive Officer) | |||
/s/ Mark Sachleben | Chief Financial Officer | May 18, 2017 | ||
Mark Sachleben | (Principal Financial and Accounting Officer) | |||
/s/ Peter Fenton | Chairman and Director | May 18, 2017 | ||
Peter Fenton | ||||
/s/ Sohaib Abbasi | Director | May 18, 2017 | ||
Sohaib Abbasi | ||||
/s/ Sarah Friar | Director | May 18, 2017 | ||
Sarah Friar | ||||
/s/ Adam Messinger | Director | May 18, 2017 | ||
Adam Messinger | ||||
/s/ Dan Scholnick | Director | May 18, 2017 | ||
Dan Scholnick | ||||
/s/ James Tolonen | Director | May 18, 2017 | ||
James Tolonen | ||||
81
Exhibit Index
Exhibit No. | Description of Exhibit | Incorporated by Reference | Filed Herewith | ||||||
Form | File No. | Exhibit | File Date | ||||||
Amended and Restated Certificate of Incorporation of the Registrant. | 10-K | 001-36766 | 3.1 | May 28, 2015 | |||||
Amended and Restated Bylaws of the Registrant. | S-1 | 333-200078 | 3.4 | November 10, 2014 | |||||
Form of common stock certificate of the Registrant. | S-1/A | 333-200078 | 4.1 | December 1, 2014 | |||||
Amended and Restated Investor Rights Agreement by and among the Registrant and certain of its stockholders, dated as of April 17, 2014. | S-1 | 333-200078 | 4.2 | November 10, 2014 | |||||
Form of Indemnification Agreement between the Registrant and each of its directors and executive officers. | S-1/A | 333-200078 | 10.1 | December 1, 2014 | |||||
2008 Equity Incentive Plan, as amended, and related form agreements. | 10-Q | 001-36766 | 10.1 | February 13, 2015 | |||||
2014 Equity Incentive Plan and related form agreements. | S-8 | 333-201024 | 99.2 | December 17, 2014 | |||||
2014 Employee Stock Purchase Plan. | S-8 | 333-201024 | 99.3 | December 17, 2014 | |||||
Offer Letter between the Registrant and James Gochee, dated as of April 16, 2008. | 10-K | 001-36766 | 10.5 | May 26, 2016 | |||||
Offer Letter between the Registrant and Mark Sachleben, dated as of February 4, 2008. | S-1 | 333-200078 | 10.8 | November 10, 2014 | |||||
Offer Letter between the Registrant and Robin J. Schulman, dated as of November 7, 2014. | S-1/A | 333-200078 | 10.9 | December 1, 2014 | |||||
Office Lease by and between the Registrant and 555 SW Oak, LLC, dated as of June 15, 2012, as amended. | S-1 | 333-200078 | 10.10 | November 10, 2014 | |||||
Sixth Amendment to Office Lease by and between the Registrant and 555 SW Oak, LLC, dated as of March 30, 2016. | 10-K | 001-36766 | 10.9b | May 26, 2016 | |||||
Office Lease by and between the Registrant and 188 Spear Street LLC, dated as of July 13, 2012, as amended. | S-1 | 333-200078 | 10.11 | November 10, 2014 | |||||
Office Lease by and between the Registrant and Pacific Mission Corporation, dated as of June 17, 2015. | 10-Q | 001-36766 | 10.1 | August 12, 2015 | |||||
Form of Change in Control and Severance Agreement. | S-1/A | 333-200078 | 10.12 | December 1, 2014 | |||||
New Relic, Inc. Non-Employee Director Compensation Policy. | 10-K | 001-36766 | 10.13 | May 28, 2015 | |||||
Separation and Transition Agreement between the Registrant and Hilarie Koplow-McAdams, dated April 2, 2017. | X | ||||||||
List of subsidiaries of Registrant. | S-1 | 333-200078 | 21.1 | November 10, 2014 | |||||
Consent of Deloitte & Touche LLP, independent registered public accounting firm. | X | ||||||||
Power of Attorney (included on the signature page of this report). | X | ||||||||
82
Exhibit No. | Description of Exhibit | Incorporated by Reference | Filed Herewith | ||||||
Form | File No. | Exhibit | File Date | ||||||
Certification of Principal Executive Officer Pursuant to Rules 13a-14(a) and 15d-14(a) under the Securities Exchange Act of 1934, as Adopted Pursuant to Section 302 of the Sarbanes-Oxley Act of 2002. | X | ||||||||
Certification of Principal Financial Officer Pursuant to Rules 13a-14(a) and 15d-14(a) under the Securities Exchange Act of 1934, as Adopted Pursuant to Section 302 of the Sarbanes-Oxley Act of 2002. | X | ||||||||
32.1(1) | Certification of Principal Executive Officer and Principal Financial Officer Pursuant to 18 U.S.C. Section 1350, as Adopted Pursuant to Section 906 of the Sarbanes-Oxley Act of 2002. | X | |||||||
101.INS | XBRL Instance Document | X | |||||||
101.SCH | XBRL Taxonomy Extension Schema Document | X | |||||||
101.CAL | XBRL Taxonomy Extension Calculation Linkbase Document | X | |||||||
101.DEF | XBRL Taxonomy Extension Definition Linkbase Document | X | |||||||
101.LAB | XBRL Taxonomy Extension Label Linkbase Document | X | |||||||
101.PRE | XBRL Taxonomy Extension Presentation Linkbase Document | X | |||||||
+ | Indicates a management contract or compensatory plan or arrangement. |
(1) | The certifications attached as Exhibit 32.1 accompany this Annual Report on Form 10-K pursuant to 18 U.S.C. Section 1350, as adopted pursuant to Section 906 of the Sarbanes-Oxley Act of 2002, and shall not be deemed “filed” by the Registrant for purposes of Section 18 of the Securities Exchange Act of 1934, as amended, or the Exchange Act, and are not to be incorporated by reference into any of the Registrant’s filings under the Securities Act, irrespective of any general incorporation language contained in any such filing. |
83