Attached files
| file | filename |
|---|---|
| EX-32.2 - EXHIBIT 32.2 - BARRACUDA NETWORKS INC | cuda-20170228xexhibit322.htm |
| EX-32.1 - EXHIBIT 32.1 - BARRACUDA NETWORKS INC | cuda-20170228xexhibit321.htm |
| EX-31.2 - EXHIBIT 31.2 - BARRACUDA NETWORKS INC | cuda-20170228xexhibit312.htm |
| EX-31.1 - EXHIBIT 31.1 - BARRACUDA NETWORKS INC | cuda-20170228xexhibit311.htm |
| EX-23.1 - EXHIBIT 23.1 - BARRACUDA NETWORKS INC | cuda-20170228xexhibit231.htm |
| EX-21.1 - EXHIBIT 21.1 - BARRACUDA NETWORKS INC | cuda-20170228xexhibit211.htm |
| EX-10.18 - EXHIBIT 10.18 - BARRACUDA NETWORKS INC | cuda-20170228xexhibit1018.htm |
UNITED STATES
SECURITIES AND EXCHANGE COMMISSION
Washington, D.C. 20549
___________________________________________________
FORM 10-K
___________________________________________________
(Mark One)
x | ANNUAL REPORT PURSUANT TO SECTION 13 OR 15(d) OF THE SECURITIES EXCHANGE ACT OF 1934 |
For the fiscal year ended February 28, 2017
or
¨ | TRANSITION REPORT PURSUANT TO SECTION 13 OR 15(d) OF THE SECURITIES EXCHANGE ACT OF 1934 |
For the transition period from to
Commission File Number 001-36162
___________________________________________________
BARRACUDA NETWORKS, INC.
(Exact name of registrant as specified in its charter)
___________________________________________________
Delaware | 83-0380411 | |
(State or other jurisdiction of incorporation or organization) | (I.R.S. Employer Identification Number) | |
3175 S. Winchester Blvd.
Campbell, California 95008
(408) 342-5400
(Address, including zip code, and telephone number, including area code, of registrant’s principal executive offices)
___________________________________________________
Securities registered pursuant to Section 12(b) of the Act:
Title of each class | Name of each exchange on which registered | |
Common Stock, $0.001 par value | New York Stock Exchange | |
Securities registered pursuant to section 12(g) of the Act:
None
___________________________________________________
Indicate by check mark if the registrant is a well-known seasoned issuer, as defined in Rule 405 of the Securities Act. Yes ¨ No x
Indicate by check mark if the registrant is not required to file reports pursuant to Section 13 or Section 15(d) of the Act. Yes ¨ No x
Indicate by check mark whether the registrant (1) has filed all reports required to be filed by Section 13 or 15(d) of the Securities Exchange Act of 1934 during the preceding 12 months (or for such shorter period that the registrant was required to file such reports), and (2) has been subject to such filing requirements for the past 90 days. Yes x No ¨
Indicate by check mark whether the registrant has submitted electronically and posted on its corporate Web site, if any, every Interactive Data File required to be submitted and posted pursuant to Rule 405 of Regulation S-T (§ 232.405 of this chapter) during the preceding 12 months (or for such shorter period that the registrant was required to submit and post such files). Yes x No ¨
Indicate by check mark if disclosure of delinquent filers pursuant to Item 405 of Regulation S-K (§ 229.405 of this chapter) is not contained herein, and will not be contained, to the best of registrant’s knowledge, in definitive proxy or information statements incorporated by reference in Part III of this Form 10-K or any amendment to this Form 10-K. ¨
Indicate by check mark whether the registrant is a large accelerated filer, an accelerated filer, a non-accelerated filer, smaller reporting company, or an emerging growth company. See the definitions of "large accelerated filer," "accelerated filer," "smaller reporting company," and "emerging growth company" in Rule 12b-2 of the Exchange Act.
Large accelerated filer | ¨ | Accelerated filer | x |
Non-accelerated filer | ¨ (Do not check if a smaller reporting company) | ||
Smaller reporting company | ¨ | ||
Emerging growth company | x | ||
If an emerging growth company, indicate by check mark if the registrant has elected not to use the extended transition period for complying with any new or revised financial accounting standards provided pursuant to Section 13(a) of the Exchange Act. x
Indicate by check mark whether the registrant is a shell company (as defined in Rule 12b-2 of the Exchange Act). Yes ¨ No x
The aggregate market value of voting stock held by non-affiliates of the registrant was $584.6 million based on the closing price of $23.20 for shares of the registrant’s common stock as reported by the New York Stock Exchange as of the last business day of the registrant’s most recently completed second fiscal quarter. Shares of common stock held by each executive officer, director and each person who owns 5% or more of the outstanding common stock have been excluded in that such persons may be deemed to be affiliates. This determination of affiliate status is not necessarily a conclusive determination for other purposes.
The number of shares outstanding of the registrant’s common stock outstanding, as of March 31, 2017, was 52,925,162.
DOCUMENTS INCORPORATED BY REFERENCE
Information required in response to Part III of Form 10-K (Items 10, 11, 12, 13 and 14) is hereby incorporated by reference to portions of the registrant’s Definitive Proxy Statement for the Annual Meeting of Stockholders to be held in 2017. The Definitive Proxy Statement will be filed by the registrant with the Securities and Exchange Commission no later than 120 days after the end of the registrant’s fiscal year ended February 28, 2017.
EMERGING GROWTH COMPANY
The registrant is an "emerging growth company" as that term is defined in the Jumpstart Our Business Startups Act of 2012 and, as such, the registrant has elected to comply with certain reduced public company reporting requirements.
TABLE OF CONTENTS
Page | ||
PART I | ||
Item 1. | ||
Item 1A. | ||
Item 1B. | ||
Item 2. | ||
Item 3. | ||
Item 4. | ||
PART II | ||
Item 5. | ||
Item 6. | ||
Item 7. | ||
Item 7A. | ||
Item 8. | ||
Item 9. | ||
Item 9A. | ||
Item 9B. | ||
PART III | ||
Item 10. | ||
Item 11. | ||
Item 12. | ||
Item 13. | ||
Item 14. | ||
PART IV | ||
Item 15. | ||
SPECIAL NOTE REGARDING FORWARD-LOOKING STATEMENTS
This Annual Report on Form 10-K contains forward-looking statements within the meaning of the Section 27A of the Securities Act of 1933, as amended, and Section 21E of the Securities Exchange Act of 1934, as amended. All statements contained in this Annual Report on Form 10-K other than statements of historical fact, including statements regarding our future results of operations and financial position, our business strategy and plans, and our objectives for future operations, are forward-looking statements. The words "believe," "may," "will," "potentially," "estimate," "continue," "anticipate," "intend," "could," "would," "project," "plan," "expect" and the negative and plural forms of these words and similar expressions are intended to identify forward-looking statements. These forward-looking statements include, but are not limited to, statements concerning the following:
• | our future financial performance, including our expectations regarding our revenue, cost of revenue, gross profit or gross margin, operating expenses, including changes in research and development, sales and marketing and general and administrative expenses, and our ability to achieve and maintain future profitability; |
• | our business plan and our ability to effectively manage our growth and associated investments; |
• | anticipated trends, growth rates and challenges in our business and in the markets in which we operate; |
• | market acceptance of recently introduced security and data protection solutions; |
• | beliefs about and objectives for future operations; |
• | our ability to increase sales of our solutions and renewals of our subscriptions; |
• | our ability to attract and retain customers; |
• | our ability to cross-sell to our existing customers; |
• | maintaining and expanding our customer base and our relationships with our channel partners; |
• | our ability to timely and effectively scale and adapt our existing solutions; |
• | our ability to develop new solutions and bring them to market in a timely manner; |
• | our ability to maintain, protect and enhance our brand and intellectual property; |
• | our ability to continue to expand internationally; |
• | the effects of increased competition in our markets and our ability to compete effectively; |
• | sufficiency of cash to meet cash needs for at least the next 12 months; |
• | future acquisitions or investments; |
• | our ability to stay in compliance with laws and regulations that currently apply or become applicable to our business both in the United States and internationally; |
• | economic and industry trends or trend analysis; |
• | the attraction and retention of qualified employees and key personnel; |
• | the estimates and estimate methodologies used in preparing our consolidated financial statements; |
• | the impact of our stock repurchase program; and |
• | the future trading prices of our common stock. |
We have based these forward-looking statements largely on our current expectations and projections about future events and trends that we believe may affect our financial condition, results of operations, business strategy, short-term and long-term business operations and objectives and financial needs; however, these forward-looking statements are subject to a number of risks, uncertainties and assumptions, including those described in Part I, Item 1A. "Risk Factors" in this Annual Report on Form 10-K. Moreover, we operate in a very competitive and rapidly changing environment and new risks emerge from time to time. It is not possible for us to predict all risks, nor can we assess the impact of all factors on our business or the extent to which any factor, or combination of factors, may cause actual results to differ materially from those contained in any forward-looking statements we may make. In light of these risks, uncertainties and assumptions, the future events and trends discussed in this Annual Report on Form 10-K may not occur and actual results could differ materially and adversely from those anticipated or implied in the forward-looking statements.
1
We undertake no obligation to revise or publicly release the results of any revision to these forward-looking statements, except as required by law. Given these risks and uncertainties, readers are cautioned not to place undue reliance on such forward-looking statements. You should read this Annual Report on Form 10-K and the documents that we reference in this Annual Report on Form 10-K and have filed with the SEC as exhibits to this Annual Report on Form 10-K with the understanding that our actual future results, levels of activity, performance and events and circumstances may be materially different from what we expect.
Unless expressly indicated or the context requires otherwise, the terms "Barracuda," "company," "we," "us," and "our" in this document refer to Barracuda Networks, Inc., a Delaware corporation, and, where appropriate, its wholly owned subsidiaries. The term "Barracuda" may also refer to our products, regardless of the manner in which they are accessed.
2
PART I
Item 1. Business
Overview
Barracuda designs and delivers powerful yet easy-to-use security and data protection solutions. We offer cloud-enabled solutions that empower customers to address security threats, improve network performance and protect and store their data. Our security platform helps customers simplify their IT operations and address their most pressing security needs even as they adopt new deployment models and move applications, data and workloads to the cloud. Our business model is built on the core values of speed and agility, which we apply to all aspects of our approach, including our technology innovations, the delivery and deployment of our solutions and responses to customer inquiries. Since inception, our solutions have been trusted by more than 150,000 organizations worldwide.
Our platform incorporates subscription-based security and data protection solutions that are connected to our cloud services, which enable continuous software updates, offsite redundancy and distributed capacity. Our solutions are delivered as cloud-enabled appliances and virtual appliances, as well as public cloud and Software-as-a-Service-("SaaS")-based solutions. Our solutions are designed to fortify the security fabric across public, private and hybrid cloud deployments and they can be centrally managed from a single pane of glass. Our security solutions are designed to protect and optimize the performance of the most critical points within our customers’ IT infrastructures, including Microsoft Office 365 ("Office 365") environments, email servers, web applications, data centers and core networks. Our data protection solutions are designed to backup and archive business-critical data and make such data accessible for purposes such as compliance, disaster recovery and business intelligence. Our data protection solutions also allow users to securely and quickly access and sign files from Internet-connected devices. Our solutions can be managed centrally in any size or type of deployment through integrated, easy-to-use web interfaces that support configuration, monitoring and reporting.
We design our solutions specifically for IT professionals in environments subject to time, staff and resource constraints. These IT professionals seek to benefit from current and emerging trends in information technology such as the rapid growth in cloud computing, adoption of virtualization, proliferation of mobile devices and the associated explosion of data. Our customers work in all types of organizations, from small- and mid-market businesses, governments and educational institutions, to departments or divisions within Fortune 2000 enterprises.
We nurture a culture that delivers value through simplicity to optimize our customers’ experiences. From the design of our solutions to our sales processes, customer support, manufacturing and delivery, we strive to make our solutions easy to purchase, install, maintain and update. We believe that Barracuda has become a highly visible and recognizable brand as a trusted IT partner. We design our solutions to be easy to use and to deploy without the need for special expertise or external support from IT specialists. Our platform includes powerful capabilities that can be optimized to meet the requirements of resource-constrained environments. For most of our solutions, we employ a high-velocity sales model that incorporates a 30-day right to return, real-time order fulfillment and a simple, low-cost entry point to make our customers’ purchase decisions and deployments seamless, easy and efficient. Through our recurring subscription services, we provide our customers with up-to-date features, functionality and real-time security protection, eliminating the need for costly upgrades or additional software purchases. We answer our phones live 24x7x365 and endeavor to treat every customer call with the same high priority. Central to our culture is a focus on the long-term customer experience, including an ongoing dialogue with our customers to enhance our features and solutions. Our development and fulfillment processes rapidly deliver new services and functionality to our customers, enabling them to improve their time to value and return on technology investment through the low total cost of ownership, easy integration and accelerated deployment of our security and data protection solutions.
Industry Background
Modern IT Trends Offer Attractive Benefits to All Organizations
Organizations are looking to take advantage of important technology trends, particularly the rapid growth of cloud computing, including platforms such as Amazon Web Services ("AWS"), Google Cloud Platform ("GCP"), Microsoft Azure ("Azure") or Office 365; proliferation of mobile devices; widespread use of web applications like Facebook, LinkedIn, Twitter and YouTube; and increased adoption of virtualization and software defined networking. These advanced technology trends can be exploited by organizations to gain significant competitive advantages and to support core business operations, enable dramatic efficiency gains and open new go-to-market channels and revenue opportunities.
3
The Confluence of IT Trends Creates a Set of Obstacles that IT Professionals Must Address
IT trends are significantly changing the way that IT infrastructures are designed, deployed and secured, creating a complex and rapidly evolving set of challenges that need to be addressed by IT professionals. This complexity influences the way organizations design and deploy their networks and applications, including leveraging public cloud, SaaS and managed services solutions.
• | Escalating Security Threat Environment. Organizations face increasingly sophisticated and targeted security threats from a variety of attackers, including state-sponsored, profit-motivated, automated and internal attackers. These attacks can result in organizational disruption, as well as the theft of sensitive information such as credit card information, and can cause financial and reputational damage. These threats are exacerbated further as customers migrate their applications to public and private clouds. Organizations of all sizes are being forced to reexamine their security risks and technology investments as threats evolve and increase in number, complexity, variety and severity. |
• | Productivity and Security Challenges Posed by Cloud Services and Web Applications. Organizations can benefit greatly from popular web applications, which enable new channels to communicate and collaborate with customers and business partners, as well as a means to market their products and recruit employees. While many of these applications can benefit the business, they can introduce significant security vulnerabilities as well as inappropriate and unproductive activities in the workplace. Organizations need to safely enable the use of these applications, such that only the right individuals are using the right set of applications for their business functions. |
• | Explosion of Data and Increased Storage Consumption. Organizations and employees are increasingly dependent on the availability of information. As a result, organizations cannot afford to lose access to business-critical data and need a cost effective and scalable way to ensure that their data is being stored safely and can be recovered rapidly. |
• | Constrained IT Budgets. Macroeconomic conditions have kept IT budgets under significant pressure, and despite recent innovations in the industry, security and data protection infrastructures increasingly require greater investments to implement, run and manage. As a result, there is a need for security and data protection environments to become vastly more efficient. Further, many small- and mid-sized organizations are turning to managed service providers to implement these technology solutions on a "pay-as-you-go" basis with minimal upfront costs. |
Organizations Need a New Approach to IT in Resource-Constrained Environments
Rapidly changing dynamics in today’s IT landscape are forcing organizations of all sizes to evolve their IT strategies. Fortune 500 companies are better positioned to address these challenges as they typically have core IT departments that can comprise a significant number of highly skilled and specialized computer scientists and engineers, as well as IT budgets that can be in the billions of dollars. We believe that there are millions of underserved organizations without these resources. These organizations include small- and mid-market businesses, governments, educational institutions and departments or divisions within Fortune 2000 enterprises. IT professionals within these organizations seek powerful yet easy-to-use solutions to address the challenges posed by these trends.
We believe most traditional software and hardware vendors have designed their products and business operations to cater primarily to larger companies. These solutions typically fail to meet the needs of more resource-constrained organizations in several key ways:
• | Complex to Deploy and Use. Traditional IT solutions often are difficult to install, require significant configuration and necessitate specialized services and technical support to get the systems up and running. These solutions often take months to implement and require highly trained IT staff to manage and maintain. Moreover, traditional IT solutions often provide a wide variety of features that meet the specific needs of the largest, most sophisticated customers but are of little-to-no use to the vast majority of customers. |
• | Marketing Optimized for Large Organizations. Traditional IT solution vendors tend to focus marketing efforts primarily on high-touch, senior level interactions with a smaller number of large customers. As a result, IT professionals within resource-constrained organizations are frequently challenged to work effectively with these vendors to discern the products they require to solve their problems. |
• | Lengthy, High-Touch Sales Cycle. Because of the complexity and expense related to the purchase of traditional IT solutions, traditional vendors usually use high-touch direct sales models, typically to larger customers, in order to sell their products. As a result, the complexity of traditional IT solutions and the requirement for customers to tailor traditional IT solutions to their needs lead to longer sales cycles, prolonging the period of time before customers can solve their problems. These sales-related expenses typically are passed on to their customers through product prices. |
4
• | Lengthy Manufacturing and Fulfillment. Solutions from traditional IT vendors often have long delivery and installation times. In addition, vendors periodically experience delivery delays due to the inability of their supply chain to meet quality and delivery requirements consistently. The risk of these delays can be greater where custom or semi-custom components and configurations are involved. Due to their size, traditional IT solution vendors also need to manage a high degree of operational complexity and spend a significant amount of effort rationalizing these processes to improve their profitability, manage inventory and better match demand and supply. These factors result in additional costs, which traditional vendors may pass on to their customers through product prices. |
• | Unsatisfactory Customer Support. Traditional IT solution vendors often rely heavily on self-service telephone support and outsourced customer support located in remote geographies. This approach can lead to an unsatisfactory and frustrating customer support experience and lengthy time to resolution. |
Our Business Model
Since our founding, we have designed our solutions, established our culture and built our core business model to cater specifically to the needs of IT professionals in environments subject to time, staff and resource constraints. Our security platform helps customers simplify their IT operations and address their most pressing security needs even as they adopt new deployment models and move applications, data and workloads to the cloud. Our security and data protection solutions are delivered in the form of cloud-enabled appliances and virtual appliances, as well as public cloud and SaaS-based solutions, and enable our customers to address security threats, improve the performance of their networks and protect and store their data. Our business model is built on the core values of speed and agility, which we apply to all aspects of our approach, including our technology innovations, delivery and deployment of our solutions and responses to customer inquiries. We maintain control of the value chain across our solutions, marketing efforts, sales processes, manufacturing, delivery and customer support. This integrated model enables us to tailor the customer experience to deliver powerful yet easy-to-use security and data protection solutions and high-value, recurring subscriptions to IT professionals in the way that works best for their organizations.
Key elements of our business model include:
• | Powerful, Easy-to-Use Cloud-Enabled Solutions. Our security platform integrates solutions that are purpose-built to be easy to use and to deploy without the need for special expertise or external support from IT specialists. Our solutions provide robust functionality to address the most common IT challenges. We believe that whether a solution is an entry-level or company-wide deployment, it should provide powerful functionality and be easy to use. We have a continuous feedback loop with our customers, which gives us better insight into their needs and enables us to develop solutions that address our customers’ most important needs. |
• | Trusted Brand and Innovative Marketing. We believe partners and customers alike have come to rely on Barracuda as a trusted IT partner. We invest in brand development efforts to help solidify our position as a go-to provider of powerful yet easy-to-use security and data protection solutions. The principal focus of our marketing programs is to reach IT professionals within resource-constrained organizations and elevate their awareness of our portfolio of security and data protection solutions. Because of our strong investment in brand and differentiated ways to reach the customer at key decision points, we believe we have developed strong brand awareness. |
• | High-Velocity Sales. With our global partner network of more than 6,500 distributors, managed service providers and resellers, we offer straightforward, competitive pricing, making our solutions easier to purchase. Our inside sales force uses a disciplined approach to quickly and efficiently convert leads into paying customers. Our solutions and sales specialists work closely with our partners and IT professionals to answer questions and help match customer needs with Barracuda solutions. Customers can typically receive our solutions and deploy them within 24 hours. |
• | Efficient Manufacturing and Fulfillment. We manage our operations through customized, streamlined processes, using our backend logistics software system that enables efficient manufacturing and physical and digital distribution of our solutions. We develop, manufacture and fulfill our solutions primarily from our Silicon Valley locations. This approach gives us the speed and agility to facilitate quick and precise responses to customer needs. |
• | High-Value, Recurring Subscriptions. Our recurring subscription services provide our customers with up-to-date features, functionality and real-time security protection, as well as eliminate the need for future "forklift" system upgrades or additional software purchases. Our Barracuda Energize Updates subscriptions provide customers the benefits of new software capabilities we release, and hardware customers with continuous Instant Replacement subscriptions receive new physical appliances as part of their subscription every four years. We believe this investment protection is an important differentiator in how we deliver value to our customers. |
• | Proactive, Live, "Insourced" Customer Support. We provide our customers with high-quality, proactive customer support, including remote support, preventative diagnostics and a direct line to Barracuda support technicians |
5
available 24x7x365—with no phone trees—to answer customer calls and quickly and efficiently respond to their needs. Our support employees are strategically located close to our customers in geographies across the world. Our support also provides an important feedback loop, which enables us to continuously improve our solutions to better meet our customers’ needs.
Our security platform was designed with the midmarket in mind, offering flexible deployment options of cloud-enabled appliances and virtual appliances, as well as cloud-only solutions, that align with, and take advantage of, the benefits of each form factor. We believe that this alignment increases the overall value for our customers through more integrated solutions, and for our business through lower infrastructure and materials costs. Our high-velocity sales model provides customers with faster access to our solutions and benefits our business by enabling us to improve our return on investment in sales and marketing. Our efficient manufacturing and fulfillment enables fast delivery of our solutions to customers and benefits our business through our ability to maintain low inventory levels and minimal overhead expenses. Our customer support strives to quickly resolve customer issues and, we believe, the quality of our customer support results in higher renewal rates and new cross-sell opportunities for us. Our subscription model provides our customers with continuous and transparent access to the latest functionality enhancements and a highly visible, recurring revenue stream for our business.
Our Competitive Strengths
We believe we have many competitive advantages that will enable us to maintain and extend our leadership position including:
• | Vertically-Integrated Approach. With our vertically-integrated approach, we control the value chain across our solutions, including product design and functionality, marketing efforts, sales processes, manufacturing, delivery and customer support. This approach enables us to tailor the customer experience to deliver powerful yet easy-to-use security and data protection solutions aligned with our customers' IT environments. |
• | Hybrid, Cloud-Enabled Solution Design. Our hybrid solutions consist of cloud-enabled appliances and virtual appliances, as well as public cloud and SaaS-based solutions, that deliver security and data protection capabilities for our customers. By offering a portfolio of solutions and multiple deployment options, we are able to engineer functionality efficiently to align with, and take advantage of, the benefits of each form factor, thereby increasing overall value for our customers. |
• | Large, Engaged Customer Base. We have gained a strong foothold in our markets and, since inception, our solutions have been trusted by more than 150,000 organizations worldwide. Our broad customer base and solution portfolio provide us with a platform from which we can cross-sell solutions to our existing customers. We strive to maintain close contact with our customers so that we can tailor our solutions enhancements to better meet our customers’ needs and fuel our innovation cycle based on their feedback. |
• | Leadership and Dedicated Focus. Since our founding, we have focused on identifying common pain points and designing differentiated solutions to simplify complex IT problems for resource-constrained organizations. We have demonstrated our ability to execute our innovative business model successfully across multiple markets, including email security, network and application security, public cloud security, web security, archiving and data protection. |
• | Innovative Technology and Intellectual Property. We continue to invest in research and development to ensure our security platform incorporates powerful and innovative technology that is easy to use. Our cloud micro-services include a number of advanced services designed to thwart the most insidious attacks, across multiple threat vectors, and can be leveraged across multiple Barracuda product lines. We also operate Barracuda Central, our security intelligence center, to monitor and block the latest Internet threats. |
• | Strong Brand. We have built our brand with IT professionals in mind and our brand is at the core of our business model. We believe Barracuda is widely recognized as a trusted IT partner who combines leading technology solutions with highly responsive customer service, in order to make IT simple, secure and affordable for our customers. |
Our Strategy
The foundation of our business strategy has not changed since our founding, which is to make IT simple, secure and affordable for our customers. We continue to evolve our strategy by calibrating our product portfolio and investments with the fastest growing trends in our markets, optimize our routes to market and align our sales and operational resources to these opportunities, and focus on driving profitability in order to grow our bottom-line.
Key elements of our growth strategy include:
6
• | Increase Sales to New Customers. We believe there is a significant opportunity for us to simplify the complex security and data protection challenges for businesses that have resource-constrained IT environments. We plan to continue to engage with IT professionals through our differentiated business model in order to expand our customer base. We will continue to invest in our brand and marketing efforts to introduce new customers to our security platform that includes a broad portfolio of security and data protection solutions. |
• | Increase Our Solution and Deployment Footprint within Our Existing Customer Base. We believe that many customers would prefer to purchase IT solutions from fewer vendors. In addition to our initial solution sales to customers, our customers often come back to us when they need to expand into other IT solutions. We believe this cycle produces increased lifetime value in a customer. We plan to pursue cross-sell opportunities with our diverse, worldwide customer base, especially as they look to consolidate IT suppliers to reduce overall IT spending. |
• | Apply Our Business Model to New Technologies and Markets. We intend to focus on developing and acquiring technologies that fit within our business model and can address the needs of IT professionals. When we consider developing or acquiring a new technology, we evaluate each opportunity in a disciplined fashion to evaluate if the new technology can help us develop new solutions which can be optimized for IT professionals, produced simply, deployed easily and offered as a service. |
• | Expand and Optimize Our Worldwide Channel and Partner Network. We believe our worldwide channel and partner networks provide us with significant operating leverage. We currently have more than 6,500 distributors, managed service providers and resellers across the globe. We intend to continue driving operating leverage by expanding our partner network, especially in the managed service provider channel where customers seek to access and deploy technologies with minimal upfront costs, and in international regions where we can benefit from the local expertise of our partners. |
Our Solution Portfolio
Our solution portfolio includes cloud-enabled appliances and virtual appliances, public cloud solutions and SaaS-based solutions. Our appliances are pre-installed with our proprietary software, while our virtual appliances provide the same features in a software-only offering. Our SaaS solutions enable customers to provide comprehensive security and data protection without requiring additional on-premises infrastructure. Our on-premises and public cloud solutions leverage our cloud micro-services to deliver hybrid cloud-enabled solutions to our customers. These hybrid solutions enable us to optimize usage of on-premises hardware required while simultaneously leveraging the scalability of the cloud.
Security
Our security offerings help protect our customers against threats that propagate over the Internet. They also help ensure that business applications, and the networks they run on, are performing with optimal efficiency and reliability.
Email Security. Barracuda Essentials for Email Security (formerly Barracuda Email Security Service) offers comprehensive, scalable and affordable multi-layer cloud-based protection against email-based attacks, data loss and business disruption. Barracuda Essentials combines three of Barracuda’s innovative cloud technology solutions — email security, archiving and backup. Barracuda Email Threat Scan / Barracuda Email Threat Scanner is a cloud-based service that examines Office 365 mailboxes using machine learning and advanced threat protection techniques, including a full system emulated sandbox to identify latent threats, to provide administrators with an in-depth view of their risk profile.
The Barracuda Email Security Gateway (formerly Barracuda Spam Firewall) manages and filters all inbound and outbound email traffic to protect organizations from email-borne threats and data leaks. It includes spam and virus blocking, anti-phishing, fraud detection, Advanced Threat Protection, denial-of-service prevention, email continuity, encryption and policy management features. Barracuda Email Security Gateway customers can route their email through the Barracuda cloud performing advanced malware detection and pre-filtering to keep threats off their premises, reduce incoming connections to their network and spool mail in the event their sites become unavailable.
Next-Generation Firewall. Barracuda NextGen Firewalls are cloud-ready and purpose-built solutions for the modern, distributed, cloud-connected network, to secure the network and intelligently prioritize and optimize traffic flows in order to improve network performance and availability. Our next-generation firewall solutions offer application visibility and add user-identity awareness to safely enable access policies for specific users and user groups. They are designed for IT administrators seeking to enhance control of networks that include a combination of local servers, remote devices, cloud-hosted applications, such as Salesforce and Office 365, and public cloud payloads in AWS, Azure and GCP.
7
Application Security. The Barracuda Web Application Firewall provides comprehensive, reverse-proxy-based protection for applications deployed in physical, virtual or public cloud environments, and protects web applications and websites from data breaches and downtime by intercepting sophisticated application-layer attacks, such as SQL Injection, cross-site scripting, session hijacking and application-layer distributed denial of service ("DDoS"). The Barracuda Web Application Firewall incorporates Advanced Threat Protection, and is designed to proxy all incoming web traffic to block attacks and insulate the web servers. The Barracuda Vulnerability Remediation Service is a cloud-based web application vulnerability scanner that pinpoints vulnerabilities in web applications and websites and offers one-click remediation.
Web Security. The Barracuda Web Security Gateway (formerly Barracuda Web Filter) integrates several technologies, including Advanced Threat Protection, for setting and enforcing granular web filtering policies to protect users from rapidly evolving web-based threats and to increase productivity and optimize bandwidth. The Barracuda Web Security Gateway blocks user access to known malicious websites, scans web downloads for malware, enables granular enforcement based on existing user and group authentication and provides comprehensive web usage visibility through intuitive dashboards. The cloud-based Barracuda Web Security Service is designed to deliver web security and policy enforcement in highly distributed network environments.
Application Delivery Controllers. The Barracuda Load Balancer ADC is an integrated platform that distributes network traffic across multiple servers using advanced Layer 4 and Layer 7 load balancing techniques or even across multiple data centers using global server load balancing, content caching, data compression and connection pooling to offload computing functions from backend servers and improve application response time. Advanced features for application optimization and integrated security are designed to protect customers from malicious data, application-layer attacks and DDoS attacks before they reach internal servers.
Data Protection
Our data protection solutions provide a portfolio of solutions for on-premises and cloud-based archiving and backup.
Backup. Barracuda Backup is an end-to-end solution for protecting physical, virtual and SaaS-based environments. Barracuda Backup enables secure offsite replication to other Barracuda Backup appliances and to the Barracuda storage cloud. Barracuda Backup uses advanced deduplication technology to reduce the amount of backup data stored. Our LiveBoot and Cloud LiveBoot technology enables quick disaster recovery for virtual servers by running them directly from the backup appliance or the Barracuda cloud, without the overhead associated with restoring backup images to their original format.
Archiving. Barracuda Cloud Archiving provides cloud-based archiving. The service is designed for organizations using on-premises Microsoft Exchange, Office 365 or hybrid combinations, and helps ensure email is stored securely in a separate repository for as long as needed without risk of tampering or deletion. The Barracuda Message Archiver is available as a physical or virtual appliance on-premises and reduces archive sizes by eliminating duplicate messages, storing only one instance of each message attachment and then compressing the stored data.
Technology Architecture
Our technology architecture for both our security and data protection solutions consists of several common foundational components. We utilize a common architecture so that improvements of those components benefit our solutions, reducing development time.
Key common foundational components of our architecture include:
Common Core and Secure Platform
We use a proprietary operating system, built on the Linux open source kernel, which provides security and stability to protect the solutions that secure customer networks. The secure platform also provides foundational services that may include:
• | web and application servers that enable our user interface and application programming interfaces; |
• | infrastructure interoperability services, such as Kerberos and Active Directory; |
• | hardware abstraction layers that allow our solutions to scale from entry-level to high-capacity systems and to rapidly respond to changes in supply chain availability; |
• | auto-provisioned database systems that support many of the management features and applications; and |
8
• | common logging, notification and reporting services. |
Continuous Updates and Real-Time Protection
Our security and data protection applications are built to provide ongoing value as the technology and security landscapes evolve. Through continuous updates via Barracuda Energize Updates, our solutions are able to continuously receive up-to-date databases and agents including:
• | information that allows us to identify spam, viruses, spyware and other Layer 7 attacks by several means, including the content, behavior and source of the data; |
• | web category and application databases; |
• | information about the latest document types to properly identify text/content for indexing and searching; |
• | detailed formats of social media web requests that allow us to provide data loss prevention and archival services; |
• | backup agents for the latest versions of the newest desktop and server software; and |
• | policy definitions for enforcement of content policies, including social security number and credit card patterns. |
Shared Software Components
Many of our solutions share our proprietary software modules that are core to our business. This approach enables us to benefit from significant time and cost savings from rapid integration of our library of shared software components. For example, our antivirus technology is integrated into many solutions we have developed or acquired. Other examples include:
• | powerful and versatile proxy servers for web (HTTP forward and reverse), email (SMTP) and domain name services; |
• | high performance packet processing and flow tracking that allows identification of users and applications for security policy, prioritization and adaptive routing; |
• | content indexing and search capabilities; and |
• | agents for endpoints such as desktops, servers and mobile devices. |
Shared Cloud Services
By creating our own cloud micro-services, we are able to deliver the benefits of a cloud delivery model while maintaining a small footprint in our customers’ networks. Our appliances and virtual appliances communicate with our cloud micro-services so that we can deliver new service offerings, solutions and features, such as Advanced Threat Protection, Cloud Protection Layer, cloud web categorization and deduplicated file storage, without significantly increasing the requirements of the infrastructure installed in a customer’s network. This allows us to continue delivering features in a constantly evolving environment without the potential customer satisfaction issues that arise with frequent hardware updates.
Common Management Layer
We have invested significant resources into developing an architecture that allows for centralized solution management. Our solutions are designed with common user interfaces and provide central control across different solutions. They also enable control over highly distributed networks across multiple locations, devices and geographies by relying on a cloud service where security functionality is distributed but centralized control is desired. This capability enables administrators to control and enforce policies once and apply them across multiple distributed locations. The management layer allows a global view of many devices so that they can have the latest firmware, definitions and security policies.
Where appropriate, we employ a multi-tenant architecture that allows us to serve multiple customers while securely segregating their data. The platform includes intelligent route-optimization technology that dynamically routes customer traffic quickly and effectively.
Our core management technologies also include:
• | high availability and clustering software that allows a group of systems to be managed through a single configuration interface and allows the remaining systems to continue processing for any system that might become unavailable or fail; |
9
• | support tools that allows for rapid access and troubleshooting tools; and |
• | an update infrastructure for delivering new versions of our firmware, as well as the definitions and databases to ensure that the systems are up to date. |
Barracuda Central
Barracuda Central is our centralized and automated security intelligence center that enables continuous threat detection and monitoring. Data collected and aggregated at Barracuda Central is analyzed and used to create definitions for continuous automatic Barracuda Energize Updates for our solutions. Barracuda Central is comprised of four primary layers.
Internal and External Data Feeds
We receive data from four primary sources:
• | The Barracuda global data feed receives metadata for messages and web requests that pass through our networks from the appliances deployed in our subscribers’ networks. |
• | Barracuda Labs analyzes new threats and develops innovative security approaches. The team is focused on emerging threats such as social network, cloud, mobile and web-based exploits and other forms of modern malware attacks and develops advanced detection and protection techniques. |
• | Subscribers, their end-users and users of our free reputation services submit feedback on categorization, false-negatives and false-positives through various means. These means include email, web forms, user interfaces on our appliances/services and agents such as email add-ins. |
• | Via third-party and community data sharing, we are able to augment our accuracy while simultaneously giving back to the community. |
Automated and Manual Analysis
Through many automated and manual processes, the incoming data is analyzed and used to generate new threat definitions and new algorithms to continuously increase the effectiveness of our solutions.
• | Our security engineering team develops algorithms and mitigation techniques that are integrated into our cloud micro-services in order to increase effectiveness. We also develop corresponding algorithms and mitigation techniques that are delivered to our appliances or cloud services for local processing. |
• | With our cloud micro-services, we are able to process data feeds and automatically identify the vast majority of threats. As these threats are identified, they are added to the appropriate databases for delivery via our Barracuda Energize Updates subscriptions. |
• | Our security operations team monitors data feeds and tunes the algorithms in the Barracuda compute cloud. Our security operations team also works with our security engineering team to identify new algorithms that allow more threats to be automatically identified. |
Continuous Updates and Real-time Protection
• | Once threats are identified and definitions are created, the definitions are delivered securely to the appliances, virtual appliances and cloud services via our Barracuda Energize Updates subscriptions. Some of these definitions are updated many times over every hour and allow for fast local processing and offline operation. |
• | To reduce latency, size and performance impact of delivered definitions, we leverage our cloud micro-services, which consist of a set of protocols and services that allow our solutions to have access to up-to-the-second threat protection. |
Deployed Appliances, Virtual Appliances and Cloud Services
Our appliances, virtual appliances and cloud services use the data produced by Barracuda Central to block the latest threats. These systems automatically provide feedback and metadata back into the Barracuda Central data feeds enabling continued improvements to accuracy and performance.
Our Customers
10
We target customers across a wide range of industries, including education, government, financial services, healthcare, professional services, telecommunications, retail and manufacturing. Our revenue is diversified across our entire customer base with one distribution partner accounting for 25%, 22% and 20% of total revenue in fiscal 2017, 2016 and 2015, respectively. Sales to this distributor are subject to an agreement between the parties which provides for an initial term of one year, with automatic one year renewal terms and permits termination by either party with 90 days written notice prior to the termination date, restricts its sales to the United States and Canada and provides for net payment to us within 30 days of the date from the date of invoice. In addition, the agreement may terminate (i) at any time upon the mutual written agreement of the distributor and us, (ii) upon written notice, subject to applicable cure periods, if the other party has materially breached its obligations under the agreement or (iii) by either party upon the other party seeking an order for relief under the bankruptcy laws of the United States or similar laws of any other jurisdiction, a composition with or assignment for the benefit of creditors, or dissolution or liquidation.
For fiscal 2017, 2016 and 2015, we generated 29%, 31% and 32% of our total revenue, respectively, from customers located outside of the United States. Other financial information about our segment and geographic areas is incorporated herein by reference to Note 7 of the Notes to Consolidated Financial Statements included in Part II, Item 8 of this Annual Report on Form 10-K.
Sales and Marketing
Our sales and marketing approach is designed to be efficient for high volumes of transactions. Our marketing efforts focus on driving traffic to our websites and on generating high-quality sales leads. Our sales efforts focus on converting these leads into paying customers through a high volume, short duration sales process.
Sales
We sell our appliances, services and software to our customers using sales personnel and our global network of more than 6,500 distribution partners, managed service providers and resellers in more than 100 countries. Our inside sales force is devoted to turning highly qualified leads into purchasers of our solutions. The majority of our leads come from potential customers who have requested an evaluation of our solutions or from our existing customer base. As a result, our inside sales force typically calls potential buyers who already understand the value of our solutions and do not require a lengthy sales cycle. Our sales reach is augmented by our distributors, managed service providers and resellers to efficiently interact with our customer base for initial deployment and cross-selling additional solutions.
The Barracuda Networks Reseller Program (Barracuda Partner Program) is a global network of resellers offering our solutions, service and support to our customers. We believe that our solutions and innovative marketing, lead generation and training programs provide a significant opportunity for high-quality reseller and distributor partners. Our channel network leverages our channel partners’ industry, product and geographic knowledge and their customer reach to expand our customer base. Our relationships with our partners are generally governed by our standard, non-exclusive and non-transferable reseller agreement, which provides for the appointment of the channel partner in a specified territory and net payment to us from the channel partner within 30 days of the date from the date of invoice. Additionally, either party may terminate the agreement without cause upon 30 days prior written notice or immediately by giving notice to the other party if the other party is in breach of a material provision in the reseller agreement and fails to rectify such breach within 30 days of receiving such notice.
In October 2015, we further expanded our reach into the managed service provider market through the acquisition of Intronis. Many small- and mid-sized organizations are turning to managed service providers to implement various technology solutions on a fixed monthly or annual fee or a "pay-as-you-go" basis with minimal upfront costs. Further, these managed service providers procure solutions differently than traditional resellers and have different requirements around integrations, billing, self-branding and more. The Intronis platform is designed to meet the needs of these managed service providers, and we believe it can continue to be expanded to include additional Barracuda solutions. Since the Intronis acquisition, we have made Barracuda Essentials for Office 365, Barracuda Backup and Barracuda NextGen Firewall available via Intronis for our managed service provider partners.
We implement our approach through a disciplined sales process that provides clear guidelines for our sales force, and we actively measure and manage our sales results. We offer our solutions using standardized contract terms and we enable our customers to buy our solutions in a manner convenient to them.
Marketing
11
We use a variety of online marketing programs for lead generation, as well as more traditional direct marketing and indirect channel partner marketing programs to drive interest in our solutions. These efforts leverage the high level of use of Internet search engines through search engine marketing and optimization programs. Once we drive traffic to our websites, we have well-defined processes that allow us to automatically track visitors’ activities on our website, communicate with potential customers, encourage evaluations of our solutions and generate highly qualified leads to our sales organization.
Our marketing approach focuses on creating brand awareness, allowing us to build and maintain, through relevant web-based content and online communications, a substantial customer base and community, many of whom act as advocates for Barracuda. We employ an innovative approach to traditional visual marketing through the use of signs and billboards in key locations such as airports where our target customers often travel. We also enhance brand recognition and marketing through the use of vehicles wrapped with highly-visible branding.
In addition, we attend industry trade shows and conferences, regularly communicate with industry analysts and solicit their feedback on our solutions and strategies and host webinars on current issues to create awareness of our brand and solutions.
Our Go-to-Market Strategy. We have successfully grown our business by using a go-to-market strategy that includes the following:
• | Low-Touch Sales Model. Our marketing efforts drive customers to fill out online forms in which they provide information about their business and specific IT needs. Our inside sales force is responsible for following up on these qualified leads from our partners and our website and working to turn potential customer interest into opportunities that our channel partners can fulfill. For example, based on the information a customer completes on one of our online forms, our inside sales force may call the customer and walk them through an online demo and connect them to a channel partner. In larger transactions, our field sales team may become involved in a transaction to help a channel partner close an opportunity. |
• | Global Partner Network. We leverage our channel network to augment our inside sales force, giving us access to a broader potential customer base than we would be able to access on our own. We believe this greatly expands our distribution leverage as many times our customers order through our partner network without the involvement of our sales team. |
• | 30-Day Right to Return. For the majority of our solutions, new sales include a 30-day right to return. The risk-free nature of the transaction allows our customers to more quickly adopt Barracuda solutions and realize the value. |
• | Renewals and Cross-Selling. As our existing customers grow, we may have opportunities to sell more advanced versions of our solutions as well as cross-sell adjacent solutions. We have a dedicated sales team that focuses exclusively on renewals. We employ training and marketing programs to assist our sales force and channel partners to better sell into our sizable customer base. Because of our robust solution portfolio, an existing customer provides us with multiple additional sales points as they look to consolidate suppliers while expanding their IT systems. |
Customer Support
Barracuda Technical Support. Customer support is an essential element of our business model and we are focused on the impact of support on our customers’ experience. Our award-winning customer support includes multiple support options. All calls are answered and managed by trained Barracuda support agents 24x7x365. Moreover, we do not use phone trees and every call is answered live. We also offer multilingual support.
We hire our customer support agents based on their customer service experience and orientation and then provide supplemental in-house training to help them build their knowledge base and skill set. Our agents are categorized in tiers based on their skills. Tier 1 agents handle initial setup, basic support and troubleshooting. Tier 2 agents address detailed troubleshooting, analysis and support. Tier 3 agents address advanced issues, backend analysis and support. Finally, engineering support is available for any unresolved issues escalated appropriately. Agents of varying skill level sit together in groups in order to best serve our customers as well as foster a collaborative environment in which our agents can learn and grow their skills.
We offer self-service support in the form of our online knowledge base, community forum and documentation portal. We also offer an online community forum, which offers information, updates and peer support. We also offer Barracuda Campus to our customers, where they can access in-person and online trainings, technical documentation and whitepapers.
12
Support Subscriptions. We provide a number of support subscriptions with our portfolio of solutions.
Barracuda Energize Updates. The required Barracuda Energize Updates subscription and virtual appliance subscriptions provide our customers with access to Barracuda Technical Support.
Instant Replacement. Instant Replacement provides replacement hardware with next business day shipping. Along with providing priority replacements in case of equipment failure, the Instant Replacement subscription also provides ongoing migration to the latest hardware platforms through the Barracuda Hardware Refresh Program, enabling customers to receive a new hardware unit every four years at no additional cost.
Premium Support. Barracuda Premium Support provides for a dedicated account manager and a team of technical engineers to provide fast resolution of high-priority support issues, helping to ensure continuous uptime in mission-critical environments.
Manufacturing
We manufacture our appliances at our manufacturing facilities in Silicon Valley. By managing manufacturing locally and maintaining a highly flexible workforce, we are able to easily scale our manufacturing operations and react rapidly to customer needs. This enables us to support efficient, flexible, "just-in-time" manufacturing and key features of our business model such as real-time order fulfillment and our Instant Replacement program. Although we currently depend on a single source or a limited number of sources for certain components used in the manufacture of our appliances and are therefore subject to the risk of shortages in supply of these components, to date we have not experienced a significant delay in shipments. We generally use commodity hardware in our appliances, which is readily available from multiple sources, and we do not have any long-term supply agreements. Sourcing our materials from multiple suppliers enables us to fill orders with short lead-time and lower manufacturing costs.
Backlog
Appliances are shipped and billed shortly after receipt of an order. We do not believe that our appliance backlog at any particular time is meaningful because it is not necessarily indicative of future revenue in any given period as we offer our customers a 30-day right of return for the majority of our solutions. Additionally, the majority of our appliance revenue comes from orders that are received and shipped in the same quarter. Orders for subscriptions are billed shortly after receipt of an order and are included in deferred revenue. Timing of revenue recognition for subscriptions may vary depending on the contractual service period or when the services have commenced.
Research and Development
Our research and development efforts are focused on the development of new solutions, including software and cloud solutions, and the integration of additional features and capabilities into our existing solutions. Our product management and engineering teams have extensive security and data protection expertise and work closely with customers to identify their current and future needs. The experience of our design teams enables us to effectively assess the tradeoffs and advantages when determining which features and capabilities of our solutions should be implemented.
We believe that innovation and timely development of new features and solutions is essential to meeting the needs of our customers and improving our competitive position. We test our solutions thoroughly to certify and ensure interoperability with third-party hardware and software products.
Our research and development expenses were $75.1 million, $71.3 million and $58.7 million in fiscal 2017, 2016 and 2015, respectively.
Intellectual Property
Our success depends in part upon our ability to protect our core technology and intellectual property. To accomplish this, we rely on a combination of intellectual property rights, including patents, trade secrets, copyrights and trademarks, as well as customary contractual protections.
As of February 28, 2017, we had 65 issued patents that expire between July 2017 and April 2034 and 22 patent applications pending in the United States. We cannot assure you whether any of our patent applications will result in the issuance of a patent or whether the examination process will require us to narrow our claims. We also license software from
13
third parties for integration into our solutions, including open source software and other software available on commercially reasonable terms.
We control access to and use of our proprietary software and other confidential information through the use of internal and external controls, including contractual protections with employees, contractors, customers and partners, and our software is protected by U.S. and international copyright laws. Despite our efforts to protect our trade secrets and proprietary rights through intellectual property rights, licenses and confidentiality agreements, unauthorized parties may still copy or otherwise obtain and use our software and technology. In addition, we intend to expand our international operations and effective patent, copyright, trademark and trade secret protection may not be available or may be limited in foreign countries.
Our industry is characterized by the existence of a large number of patents and frequent claims and related litigation regarding patent and other intellectual property rights. In particular, leading companies in our markets have extensive patent portfolios and are regularly involved in litigation. From time to time, third parties, including certain of these leading companies, may assert patent, copyright, trademark and other intellectual property rights against us, our channel partners or our customers. Our standard license and other agreements may obligate us to indemnify our channel partners and customers against such claims. Successful claims of infringement by a third party could prevent us from distributing certain solutions or performing certain services, require us to expend time and money to develop non-infringing solutions or force us to pay substantial damages, including treble damages if we are found to have willfully infringed patents or copyrights, royalties or other fees. In addition, if we become more successful, competitors may try to develop solutions and services that are similar to ours that may infringe our proprietary rights. Competitors or other third parties may also be more likely to claim that our solutions infringe their proprietary rights. We cannot assure you that we do not currently infringe, or that we will not in the future infringe, upon any third-party patents or other proprietary rights.
Competition
We operate in the intensely competitive security and data protection markets that are characterized by constant change and innovation, and we expect competition to increase in the future from larger, well-established competitors and new market entrants. Changes in the application, threat and technology landscape result in evolving customer requirements. Our main competitors in these markets fall into two categories:
• | Independent content security, network security, application delivery and data protection vendors such as Check Point Software Technologies, Ltd., CommVault Systems, Inc., Datto, Inc., EMC Corporation, F5 Networks, Inc., Fortinet, Inc., Imperva, Inc., Juniper Networks, Inc., McAfee LLC, Mimecast Limited, Palo Alto Networks, Inc., Proofpoint, Inc., Sophos Ltd., Symantec Corporation, Veeam Software and Veritas Technologies that offer competing solutions. |
• | Diversified IT suppliers such as Cisco Systems, Inc., Dell Inc., Hewlett Packard Enterprise Company and International Business Machines that have acquired large security specialist vendors in recent years, that have software- or hardware-based storage solutions or that have the technical and financial resources to bring competitive solutions to the market. |
In addition, we compete with companies that offer point solutions that compete with some of the features present in our platform. As our market grows, we believe it will attract more highly specialized vendors as well as larger vendors that may continue to acquire or bundle their solutions more effectively.
The principal competitive factors in our market include:
• | solution ease-of-use; |
• | solution features, reliability, performance and effectiveness; |
• | solution line breadth and applicability; |
• | solution extensibility and ability to integrate with other technology infrastructures; |
• | price and total cost of ownership; |
• | proactive live technical support; |
• | strength of sales and marketing efforts; and |
• | brand awareness and reputation. |
14
We believe we generally compete favorably on the basis of these factors. However, many of our competitors have substantially greater financial, technical and other resources; greater name recognition; stronger reputations and longer operating histories; larger sales and marketing budgets; broader distribution and established relationships with distribution partners and customers; lower labor and development costs; greater customer support resources; larger and more mature intellectual property portfolios; and greater resources to make acquisitions.
Employees
As of February 28, 2017, we had 1,490 full-time employees. Although we are subject to collective bargaining agreements in certain countries, our U.S. employees are not represented by a labor union. We consider our employee relations to be good.
Corporate Information
We were incorporated in 2003 in the State of California under the name Barracuda Networks, Inc. and in 2004 reincorporated in the State of Delaware. Our principal executive offices are located at 3175 S. Winchester Blvd., Campbell, California 95008, and our telephone number is (408) 342-5400.
We file annual reports on Form 10-K, quarterly reports on Form 10-Q, current reports on Form 8-K and amendments to reports filed or furnished pursuant to Sections 13(a) and 15(d) of the Securities Exchange Act of 1934, as amended (the "Exchange Act"). The public may obtain these filings at the Securities and Exchange Commission’s Public Reference Room at 100 F Street, NE., Washington, DC 20549 or by calling the Security and Exchange Commission (the "SEC") at 1-800-SEC-0330. The SEC also maintains a website at www.sec.gov that contains reports, proxy and information statements and other information that we file with the SEC electronically. Our company website is located at www.barracuda.com and our investor relations website is located at investors.barracuda.com/company/investor-relations. Copies of our reports on Form 10-K, Forms 10-Q, Forms 8-K and amendments to those reports may be obtained, free of charge, electronically through our website as soon as reasonably practicable after we electronically file such material with, or furnish it to, the SEC. We have also used, and intend to continue to use, our investor relations website as means of disclosing material non-public information and for complying with its disclosure obligations under Regulation FD. Further corporate governance information, including our audit, compensation and nominating and corporate governance committee charters, corporate governance guidelines, code of business conduct and ethics and stockholder communications policy, is also available on our investor relations website. The contents of our website are not intended to be incorporated by reference into this Annual Report on Form 10-K or in any other report or document we file with the SEC, and any references to our website are intended to be inactive textual references only.
15
Item 1A. Risk Factors
Our operations and financial results are subject to various risks and uncertainties, including those described below. The risks and uncertainties described below are not the only ones we face. Additional risks and uncertainties that we are unaware of, or that we currently believe are not material, may also become important factors that affect us. If any of the following risks occur, our business, financial condition, operating results and prospects could be materially and adversely affected. In that event, the price of our common stock could decline.
Risks Related to Our Business and Our Industry
If we are unable to increase sales of our solutions to new customers and sell additional distinct solutions from our portfolio of solutions to our existing customers, our future revenue and operating results will be harmed.
Our future success depends on our ability to increase sales of our solutions to new customers as well as to increase sales of additional solutions to our existing customers. The rate at which new and existing customers purchase solutions depends on a number of factors, including certain factors outside of our control, such as customers’ perceived need for security and data protection solutions and general economic conditions. If our efforts to sell our solutions to new customers and additional solutions to our existing customers are not successful, our business and operating results may suffer.
A substantial majority of our billings in any particular period are derived from sales to customers with whom we began to engage during that same period and therefore our sales and the size and time to close the deals may vary from period to period and be difficult to predict. Given this unpredictability, we may be unable to accurately forecast our billings in any given period. A failure to accurately predict the level of demand for our solutions may adversely impact our future revenue and operating results, and we are unlikely to forecast such effects with any certainty in advance.
We rely significantly on revenue from subscriptions, which may decline, and, because we recognize revenue from subscriptions over the term of the relevant subscription period, downturns or upturns in sales are not immediately reflected in full in our operating results.
Our subscription revenue accounted for 77% and 72% of our total revenue for the fiscal years ended February 28, 2017 and February 29, 2016, respectively. Customers that purchase our subscriptions have no contractual obligation to renew their contracts after the initial contract period, which include monthly and annual terms ranging from one to five years, and we may not maintain our historical subscription renewal rates. The substantial majority of our subscriptions are for one-year periods and in fiscal 2017 we continued to see more customers opt for ratable subscription form factors and shorter contract lengths. New or renewal subscriptions, or the average length of such subscriptions, may decline or fluctuate as a result of a number of factors, including our customers’ level of satisfaction with our solutions and our customer support, the frequency and severity of subscription outages, our solution functionality and performance, changes in customer deployment models, the timeliness and success of solution and enhancement introductions by us and those of our competitors, the prices of our solutions, the prices of solutions offered by our competitors or reductions in our customers’ spending levels. If new or renewal subscriptions decline, our revenue or revenue growth may decline, and our business may suffer. In addition, we recognize subscription revenue ratably over the term of the relevant subscription period. As a result, much of the revenue we report each quarter is the recognition of billings from subscriptions entered into during previous quarters. Consequently, a decline in new or renewal subscriptions in any one quarter will not be fully reflected in revenue in that quarter, but will negatively affect our revenue in future quarters. Accordingly, the effect of significant downturns in sales of our solutions would not be reflected in full in our results of operations until future periods.
We have experienced net losses on a GAAP basis in recent periods and may not maintain profitability in the future. If we cannot maintain profitability, our financial performance will be harmed.
While we generated net income on a U.S. generally accepted accounting principles ("GAAP") basis for fiscal 2017, we experienced net losses on a GAAP basis for fiscal 2016, 2015 and 2014. While we have experienced revenue growth over these same periods, we may not be able to sustain or increase our growth or maintain profitability in the future or achieve it on a consistent basis. Over the past several years, we have spent substantial amounts of time and money to develop new security and data protection solutions and enhanced versions of our existing security and data protection solutions to position us for future growth. Additionally, we have incurred substantial expenses and expended significant resources upfront to market, promote and sell our solutions as well as to prepare for and develop solutions which can address the complex infrastructure environments of our customers including hybrid, public cloud and managed service provider solutions. These changes in IT infrastructure are accelerating and are driving significant changes in storage and compute architectures and solution requirements as well as
16
presenting challenges in the security market, which may materially and adversely affect our business and prospects in ways we do not currently anticipate.
We also expect to continue to invest for future growth and for the growing prevalence of cloud-based and other alternative IT infrastructures. As a result of our increased expenditures, we will have to generate and sustain increased revenue to maintain future profitability. Maintaining profitability will require us to increase revenues, manage our cost structure and avoid significant liabilities. Revenue growth may slow, revenue may decline, or we may incur significant losses in the future for a number of possible reasons, including general macroeconomic conditions, increasing competition, a decrease in the growth of the markets in which we operate, or if we fail for any reason to continue to capitalize on growth opportunities. Additionally, we may encounter unforeseen operating expenses, difficulties, complications, delays and other unknown factors that may result in losses in future periods. If these losses exceed our expectations or our revenue growth expectations are not met in future periods, our financial performance will be harmed and our stock price could be volatile or decline.
If we cannot successfully execute on our strategy and continue to develop, manufacture and market solutions that respond promptly to the security and data protection needs of our customers, our business and operating results may suffer.
The security and data protection markets are characterized by constant change and innovation, and we expect them to continue to evolve rapidly. Moreover, many of our customers operate in markets characterized by rapidly changing technologies and business models, which require them to develop and manage increasingly complex enterprise networks, incorporating a variety of hardware, software applications, operating systems and networking protocols. Our historical success has been based on our ability to identify common customer needs and design solutions to address complex IT problems in an organization’s threat vectors including email, web browsing, mobile devices and remote access. Furthermore, our sales and marketing initiatives are primarily focused on higher-growth segments within the security and data protection markets. To the extent we are unable to continue to identify common IT challenges and execute our business model to timely and effectively design and market solutions to address these challenges, as well as to continue to expand our sales to higher-growth segments within the security and data protection markets, our business, operating results and financial condition will be adversely affected. Additionally, our results could be negatively impacted if we are unable to capitalize on growing cloud-based and hybrid deployment, as well as managed service provider solution, opportunities and continue to develop and market virtual appliances and subscription-only solutions for cloud and SaaS applications.
The process of developing new technology is complex and uncertain, and if we fail to accurately predict customers’ changing needs, particularly in the higher-growth segments within the security and data protection markets, and emerging technological trends or if we fail to achieve the benefits expected from our investments, our business could be harmed. We believe that we must continue to dedicate a significant amount of resources to our research and development efforts to maintain our competitive position and we must commit significant resources to developing new solutions before knowing whether our investments will result in solutions the market will accept. Our new solutions or enhancements could fail to attain sufficient market acceptance for many reasons, including:
•delays in releasing our new solutions or enhancements to the market;
•failure to accurately predict market demand or customer demands;
• | changes in customer environments including migration to hybrid, public cloud, private cloud, SaaS applications, and managed service provider solutions; |
•inability to protect against new types of attacks or techniques used by hackers;
•defects, errors or failures in their design or performance;
•negative publicity about their performance or effectiveness;
•introduction or anticipated introduction of competing solutions by our competitors;
•poor business conditions for our customers, causing them to delay IT purchases;
•the perceived value of our solutions or enhancements relative to their cost;
•easing of regulatory requirements around security or storage; and
17
•reluctance of customers to purchase solutions incorporating open source software.
There can be no assurance that we will successfully identify new opportunities, develop and bring new solutions to market on a timely basis or achieve market acceptance of our solutions, or that solutions and technologies developed by others will not render our solutions or technologies obsolete or noncompetitive, all of which could adversely affect our business and operating results. If our new solutions or enhancements do not achieve adequate acceptance in the market, or if our new solutions or enhancements do not result in increased subscriptions, our competitive position will be impaired, our revenue will be diminished and the negative impact on our operating results may be particularly acute because of the upfront research, development, marketing, sales and other expenses we incurred in connection with the new solutions or enhancements.
Significant developments in IT infrastructure deployments, particularly cloud computing and other alternative IT infrastructure technologies, may materially adversely affect the demand for our products.
Developments or changes in IT infrastructure, such as the emergence of hosted cloud storage, SaaS and mobile data access, are driving significant changes in storage and compute architectures and solution requirements as well as presenting significant challenges in the security market, which may materially and adversely affect our business and prospects in ways we do not currently anticipate and have seen these developments and changes accelerate in recent periods. For example, public cloud providers with significantly greater resources may continue to expand their offerings to more directly compete with our solutions. The emergence of cloud computing and other alternative IT infrastructure technologies, in which technology services are provided on a remote-access basis, have begun to have, and may continue to have, a significant impact on the market for security and data protection solutions and may result in rapid changes in customer demands. This could be the case even if such advances do not deliver all of the benefits of our solutions. If alternative models gain traction, any failure by us to develop new or enhanced technologies or processes, or to react to changes or advances in existing technologies, could adversely affect our business and operating results.
We have recently introduced, and will continue to introduce, new security and data protection solutions and we may not gain broad market acceptance for these new solutions.
Over the past year, we have released several new security and data protection solutions and enhanced versions of our existing security and data protection solutions, which address the higher-growth segments of the security and data protection markets including hybrid, public cloud, SaaS and managed service provider deployment options, to incorporate additional features, improve functionality or deliver other enhancements in order to meet our customers’ rapidly evolving demands. The return on our investments in these development efforts may be lower, or may develop more slowly, than we expect. Further, given their recent introduction, we cannot assure you that these solutions will gain broad market acceptance and that they will prove to be profitable in the longer term. Additionally, we intend to continue introducing new security and data protection solutions to respond to the needs of our customers. If we fail to achieve high levels of market acceptance for these solutions or if market acceptance is delayed, or if the market segments we address with our new solutions do not grow as expected, we may fail to justify the amount of our investment in developing and bringing them to market, and our business, operating results and financial performance could be adversely affected.
Our quarterly and annual operating results and key metrics have varied in the past and may continue to vary and be unpredictable, which may cause our stock price to fluctuate.
Our quarterly and annual operating results and key metrics have varied from period to period in the past, and we expect that they may continue to fluctuate as a result of a number of factors, many of which are outside of our control, including:
•the timing and success of introductions of our new solutions;
•changes in the growth rate of the security and data protection markets;
•changes in renewal rates for our subscriptions and our ability to cross-sell additional solutions in a period;
• | the size of orders and the time it takes to close sales, which has increased in recent periods and may continue to increase; |
•the timing of orders from our customers;
•the timing of our marketing expenditures;
18
•the mix of solutions sold;
• | fluctuations in demand for our products and services, particularly seasonal variations in customer spending patterns in more than one of our addressable markets; |
• | the continued emergence of hosted cloud storage, SaaS and mobile data access which are driving significant changes in storage and compute architectures and solution requirements and related delays in customer buying decisions as they evaluate the impact of changing deployment environments on their long-term IT strategies; |
• | our ability to control costs, including operating expenses, the costs of hardware and software components, and other manufacturing costs; |
• | the costs associated with acquiring new businesses and technologies and the follow-on costs of integration and consolidating the results of acquired businesses; |
•the budgeting cycles and purchasing priorities of our customers;
•the timing of payments of sales commissions, bonuses or performance earnouts;
•changes in our distribution strategy to further leverage managed service providers and cloud deployments;
•the timing and potential provision of valuation allowances against our deferred tax assets;
•the level of perceived threats to network security, which may fluctuate from period to period;
•government regulations and customer requirements surrounding data storage and protection;
• | fines, penalties or changes or increases in liabilities for regulatory actions, litigation, intellectual property settlements or warranty claims; |
• | deferral of orders from customers in anticipation of new solutions or solution enhancements announced by us or our competitors or due to changes in deployment architectures; |
• | the discontinuation of non-core product offerings; |
• | any significant changes in the competitive environment, including the entry of new competitors and increased price competition; |
•disruption in our supply chain and the availability of the components of our appliances;
•levels of solution returns, particularly in connection with our 30-day right to return;
•the timing of revenue recognition for our sales, which may be affected by the term of subscriptions;
• | increases or decreases caused by fluctuations in foreign currency exchange rates, since a significant portion of our revenues are received, and our expenses are incurred and paid, in currencies other than U.S. dollars; |
• | general economic conditions, both domestically and in our foreign markets, which impact purchasing patterns of customers; and |
• | future accounting pronouncements or changes in our accounting policies, including, but not limited to, changes in the revenue recognition standard scheduled to take place in fiscal 2019. |
Any one of the factors above, or the cumulative effect of some of the factors referred to above, may result in significant fluctuations in our quarterly or annual operating results, including fluctuations in our key financial metrics. This variability and unpredictability could result in our failing to meet our revenue, billings or operating results expectations or those of securities analysts or investors for any period. In addition, a significant percentage of our operating expenses are fixed in nature and based on forecasted revenue trends. Accordingly, in the event of revenue shortfalls, we are generally unable to mitigate the negative impact on operating results in the short term. If we fail to meet or exceed such expectations for these or any other reasons, our
19
business and stock price could be materially adversely affected and we could face costly lawsuits, including securities class action suits.
We believe that our brand is integral to our success and if we fail to cost-effectively promote or protect our brand, our business and competitive position may be harmed.
We believe that cost-effectively promoting and maintaining awareness and integrity of our company and our brand are vital to achieving widespread acceptance of our existing and future solutions and are important elements in attracting new customers and retaining our existing customers, particularly as we seek to expand internationally. We believe that the importance of brand recognition will increase as competition in our market further intensifies. We have invested and expect to continue to invest substantial resources to promote and maintain our brand and generate sales leads, both domestically and internationally, but there is no guarantee that our brand development strategies will enhance the recognition of our brand or lead to increased sales. For example, we use radio advertisements, signs and billboards in key locations such as airports where target customers often travel, and strategic sponsorships. We also engage in activities such as promotional events and attending trade shows. Some of our existing and potential competitors have well-established brands with equal or greater recognition than we have. If our efforts to cost-effectively promote and maintain our brand are not successful, our operating results and our ability to attract and retain customers may be adversely affected. In addition, even if our brand recognition and loyalty increases, our revenue may not increase at a level that is commensurate with our marketing spend.
In addition, independent industry analysts often provide reviews of our solutions, as well as those of our competitors, and perception of our solutions in the marketplace may be significantly influenced by these reviews. We have no control over what these industry analysts report, and because industry analysts may influence current and potential customers, our brand could be harmed if they do not provide a positive review of our solutions or view us as a market leader.
We face intense competition in the security and data protection markets and other markets in which we compete, which are characterized by constant change and innovation, and we may lack sufficient financial or other resources to maintain or improve our competitive position.
The markets for security and data protection solutions are intensely competitive and are characterized by constant change and innovation, and we expect competition to increase in the future from larger, well-established competitors and new market entrants. Changes in the application, threat and technology landscape result in evolving customer requirements. Our main competitors in these markets fall into two categories:
• | Independent content security, network security, application delivery and data protection vendors such as Check Point Software Technologies, Ltd., CommVault Systems, Inc., Datto, Inc., EMC Corporation, F5 Networks, Inc., Fortinet, Inc., Imperva, Inc., Juniper Networks, Inc., McAfee LLC, Mimecast Limited, Palo Alto Networks, Inc., Proofpoint, Inc., Sophos Ltd., Symantec Corporation, Veeam Software and Veritas Technologies that offer competing solutions. |
• | Diversified IT suppliers such as Cisco Systems, Inc., Dell Inc., Hewlett Packard Enterprise Company and International Business Machines that have acquired large security specialist vendors in recent years, that have software- or hardware-based storage solutions or that have the technical and financial resources to bring competitive solutions to the market. |
In addition, we compete with companies that offer point solutions that compete with some of the features present in our platform. As our market grows, we believe it will attract more highly specialized vendors as well as larger vendors that may continue to acquire or bundle their solutions more effectively.
Many of our existing competitors have, and some of our potential competitors could have, substantial competitive advantages such as:
• | substantially greater financial, technical and other resources; |
• | greater name recognition, stronger reputations and longer operating histories; |
• | larger sales and marketing and customer support budgets and resources; |
• | broader distribution and established relationships with distribution partners and customers; |
• | lower labor and development costs; |
20
• | larger and more mature intellectual property portfolios; and |
• | greater resources to make acquisitions. |
In addition, our larger competitors have substantially broader solution offerings and leverage their relationships based on other solutions or incorporate functionality into existing solutions to gain business in a manner that discourages customers and potential customers from purchasing our solutions, including through selling at low or negative margins, product bundling or closed technology platforms. Potential customers may also prefer to purchase from their existing suppliers rather than a new supplier regardless of solution performance, price or features. These larger competitors often have broader product lines and market focus and will therefore not be as susceptible to downturns in our markets, thereby reducing their overall risk profile as compared to ours. Many of our smaller competitors that specialize in providing protection from a single type of network security threat are often able to deliver these specialized network security solutions to the market more quickly than we can, which could reduce the addressable market for our new solutions or enhancements to existing solutions. Conditions in our market could change rapidly and significantly as a result of technological advancements, partnering by our competitors or continuing market consolidation. New start-up companies that innovate and large competitors that are making significant investments in research and development may invent similar or superior solutions and technologies that compete with our solutions and technology. Our current and potential competitors may also establish cooperative relationships among themselves or with third parties that may further enhance their ability to compete.
Some of our competitors have made acquisitions of businesses that may allow them to offer more directly competitive and comprehensive solutions than they had previously offered. As a result of such acquisitions, our current or potential competitors might be able to adapt more quickly to new technologies and customer needs, devote greater resources to the promotion or sale of their solutions and services, initiate or withstand substantial price competition, take advantage of acquisition or other opportunities more readily, or develop and expand their solution offerings more quickly than we do.
Organizations may be more willing to incrementally add solutions to their existing IT infrastructure from competitors than to replace it with our solutions. These competitive pressures in our market or our failure to compete effectively may result in price reductions, fewer orders, reduced revenue and gross profits and loss of market share. Any failure to meet and address these factors could seriously harm our business and operating results.
To remain competitive, we may be required to make substantial additional investments in research, development, marketing and sales in order to respond to competition, and there can be no assurance that these investments will achieve any returns for us or that we will be able to compete successfully in the future.
Our business is dependent on overall demand for security and data protection solutions and therefore reduced security and data protection solution spending or overall adverse economic conditions may negatively impact our business and operating results.
Our business depends on the overall demand for security and data protection solutions. In addition, the purchase of our solutions is often discretionary. Weak global economic conditions, or a reduction in security and data protection solution spending even if economic conditions improve, could adversely impact our business, financial condition and operating results in a number of ways, including longer sales cycles, lower prices for our solutions, higher default rates among our customers and channel partners, reduced subscription renewals and lower our sales levels. As global economic conditions continue to be volatile or economic uncertainty remains, including any volatility resulting from the transition to the Trump administration in the United States or the outcome of the United Kingdom’s referendum to exit the European Union (the "EU"), trends in security and data protection spending also remain unpredictable and subject to reductions due to credit constraints and uncertainties about the future. Unfavorable economic conditions, including any stemming from an unstable political environment in the United States or abroad as well as those resulting from regulatory or tax policy changes from the Trump administration, as well as economic uncertainty or an economic downturn, may harm our business and operating results in the future.
We rely on third-party distributors, channel partners and managed service providers to fulfill substantially all of our sales orders and generate customer demand. If our distributors and reseller channel partners fail to perform, our ability to sell our solutions will be limited, and, if we fail to optimize our distributor and reseller channel partner model going forward, our operating results will be harmed.
A substantial portion of our sales orders are fulfilled by our channel partners, which include distributors and resellers. We depend upon our resellers and managed service providers to manage the customer sales process and to generate sales opportunities and our distributors to provide our solutions to our resellers. To the extent our distributors, resellers and managed service providers are unsuccessful in fulfilling our sales, managing the sales process or selling our solutions, or we are unable to
21
enter into arrangements with, and retain a sufficient number of high-quality, motivated distributors and resellers in each of the regions in which we sell our offerings, our ability to sell our solutions and operating results will be harmed. In order to support our growth strategy, we continue to expand our distributor, reseller and managed service provider network, both in the United States and internationally. If we are unable to successfully develop new distributor, reseller and managed service provider relationships, or if we experience reseller shifts between distributors or any channel conflict occurs, it could negatively impact our ability to meet our revenue and profitability goals.
We provide our channel partners with specific programs to assist them in selling our solutions, but there can be no assurance that these programs will be effective. In addition, our channel partners may be unsuccessful in marketing, selling and supporting our solutions. Our channel partners do not have minimum purchase requirements. They may also market, sell and support solutions that are competitive with ours, and may devote more resources to the marketing, sales and support of such solutions. Our agreements with our channel partners may generally be terminated for any reason by either party with advance written notice and our channel partners may stop selling our solutions at any time. We cannot assure you that we will retain these channel partners, that channel partners will sell our solutions effectively or that we will be able to secure additional or replacement channel partners. The loss of one or more of our significant channel partners or a decline in the number or size of orders from them could harm our operating results. In addition, our channel partner sales structure could subject us to lawsuits, potential liability, and reputational harm if, for example, any of our channel partners misrepresent the functionality of our solutions to customers or violate laws or our corporate policies.
We have made significant investments in recent periods to support our growth, including investments in our information technology, infrastructure and management team, and these investments may achieve delayed or lower than expected benefits, which could harm our operating results. Furthermore, if we do not effectively manage any future growth, or are unable to improve our systems and processes, our operating results will be adversely affected.
We continue to increase the breadth and scope of our offerings and, correspondingly, the breadth and scope of our operations. To support this growth, and to manage any future growth effectively, we must continue to improve and expand our information technology and financial infrastructure, our operating and administrative systems and our ability to manage headcount, capital and processes in an efficient manner. We have incurred, and will continue to incur, expenses as we invest in international operations and infrastructure such as the expansion of our sales and marketing presence globally, the addition of higher touch sales and marketing field resources to liaise with our channel partners as we continue to grow our sales both domestically and internationally and investments in software systems and additional data center resources to keep pace with the growth in the cloud and cloud-based solutions markets. We continue to make significant incremental investments in product development, corporate infrastructure and broadened distribution, and we intend to continue to invest in development of our solutions, our infrastructure and sales and marketing. We have recognized, and are likely to continue to recognize, the costs associated with these investments earlier than some of the anticipated benefits, and the return on these investments may be lower, or may develop more slowly, than we expect. If we do not achieve the benefits anticipated from these investments, or if the achievement of these benefits is delayed, our operating results may be adversely affected.
We have acquired, and in the future may acquire, other businesses which could require significant management attention, disrupt our business, dilute stockholder value and adversely affect our operating results.
As part of our business strategy, we have in the past made, and may in the future make, acquisitions or investments in complementary companies, solutions and technologies that we believe fit within our business model and can address the needs of IT professionals. With respect to our previous acquisitions, we cannot ensure that we will be able to successfully integrate the technology and resources to increase subscriptions and grow revenue derived from these acquisitions.
In the future, we may not be able to acquire and integrate other companies, solutions or technologies in a successful manner. We may not be able to find suitable acquisition candidates, and we may not be able to complete such acquisitions on favorable terms, if at all. Furthermore, we may not be able to find suitable acquisition candidates that enhance our subscription offerings. If we do complete acquisitions, we may not ultimately strengthen our competitive position or achieve our goals, including increases in subscriptions, and any acquisitions we complete could be viewed negatively by our customers, investors and industry analysts. Future acquisitions may reduce our cash available for operations and other uses and could result in an increase in amortization expense related to identifiable assets acquired. We may have to pay cash, incur debt or issue equity securities to pay for any such acquisition, each of which could adversely affect our financial condition or the value of our common stock. The sale of equity or issuance of debt to finance any such acquisitions could result in dilution to our stockholders. The incurrence of indebtedness would result in increased fixed obligations and could also include covenants or other restrictions that would impede our ability to manage our operations. In addition, our future operating results may be impacted by performance earnouts or contingent bonuses. Furthermore, acquisitions may require large one-time charges and can result in increased debt or contingent liabilities, adverse tax consequences, additional stock-based compensation expense
22
and the recording and subsequent amortization of amounts related to certain purchased intangible assets, any of which items could negatively impact our future results of operations. We may also record goodwill in connection with an acquisition and incur goodwill impairment charges in the future.
In addition, if we are unsuccessful at integrating such acquisitions, or the technologies associated with such acquisitions, into our company, the revenue and operating results of the combined company could be adversely affected. Any integration process may result in unforeseen operating difficulties and require significant time and resources, and we may not be able to manage the process successfully. In particular, we may encounter difficulties assimilating or integrating the companies, solutions, technologies, personnel or operations we acquire, particularly if the key personnel are geographically dispersed or choose not to work for us. Acquisitions may also disrupt our core business, divert our resources and require significant management attention that would otherwise be available for development of our business. We may not successfully evaluate or utilize the acquired technology or personnel, or accurately forecast the financial impact of an acquisition transaction, including accounting charges. If we fail to properly evaluate, execute or integrate acquisitions or investments, the anticipated benefits may not be realized, we may be exposed to unknown or unanticipated liabilities, and our business and prospects could be harmed.
We generate a significant amount of revenue from sales outside of the United States, and we are therefore subject to a number of risks associated with international sales and operations.
Sales outside of the United States represented 29% and 31% of our total revenue for the fiscal years ended February 28, 2017 and February 29, 2016, respectively. As a result, we must continue to hire and train experienced personnel to staff and manage our foreign operations. To the extent that we experience difficulties in recruiting, training, managing and retaining an international staff, and specifically staff related to sales management and sales personnel, we may experience difficulties in sales productivity in foreign markets. If we are not able to maintain successful channel partner and distributor relationships internationally or recruit additional companies to enter into strategic channel partner and distributor relationships, our future success in these international markets could be limited. Additionally, as sales outside of the United States have typically been denominated in U.S. dollars, fluctuations in exchange rates could cause our products to become relatively more expensive to our customers outside of the United States leading to a reduction in sales to those customers. Furthermore, an increasing portion of our operating expenses is incurred outside of the United States, is denominated in foreign currencies, and is subject to fluctuations due to changes in foreign currency exchange rates. A reduction in sales or an increase in operating expenses due to fluctuations in foreign currency exchange rates would have an adverse effect on our financial condition and operating results.
Additionally, our international sales and operations are subject to a number of risks, including the following:
• | greater difficulty in enforcing contracts and accounts receivable collection and longer collection periods; |
• | increased expenses incurred in establishing and maintaining office space and equipment for our international operations; |
• | greater costs and expenses associated with international sales and operations; |
• | management communication and integration problems resulting from cultural and geographic dispersion; |
• | risks associated with trade restrictions and foreign legal requirements, including the importation, certification and localization of our solutions required in foreign countries; |
• | greater risk of unexpected changes in regulatory practices, tariffs and tax laws and treaties; |
• | the uncertainty of protection for intellectual property rights in some countries; |
• | greater risk of a failure of foreign employees to comply with both U.S. and foreign laws, including export and antitrust regulations, the U.S. Foreign Corrupt Practices Act and any trade regulations ensuring fair trade practices; |
• | heightened risk of unfair or corrupt business practices in certain geographies and of improper or fraudulent sales arrangements that may impact financial results and result in restatements of, or irregularities in, financial statements; |
• | increased financial accounting and reporting burdens and complexities; |
23
• | the effects and any resulting negative economic impact of the outcome of the United Kingdom’s referendum to exit the EU; |
• | the potential for political unrest, terrorism, hostilities or war; and |
• | multiple and possibly overlapping tax structures. |
We have office locations in various international locations, including Austria, India and the United Kingdom. If we are unable to effectively manage a large and geographically dispersed group of employees or to anticipate our future growth and personnel needs, our business may be adversely affected. As we expand our business, we add complexity to our organization and must expand and adapt our operational infrastructure and effectively coordinate throughout our organization. As a result, we have incurred and expect to continue to incur additional expense related to our continued growth. In addition, the expansion of our existing international operations and entry into additional international markets have required and will continue to require significant management attention and financial resources.
Failure to manage any future growth effectively could harm our ability to gain future international revenues, result in increased costs, negatively impact our customers’ satisfaction with our solutions, and, consequently, materially impact our business, operating results and financial condition.
We are exposed to fluctuations in currency exchange rates, which could negatively affect our financial condition and operating results.
Given our volume of international sales, a substantial portion of our total revenue is subject to foreign currency risk. For example, 29% and 31% of our total revenue was generated from sales to customers located outside of the United States for the fiscal years ended February 28, 2017 and February 29, 2016, respectively. Additionally, further strengthening of the U.S. dollar could increase the real cost of our solutions to our customers outside of the United States, which could adversely affect our financial condition and operating results. In addition, a portion of our operating expenses is incurred outside of the United States, is denominated in foreign currencies, and is subject to fluctuations due to changes in foreign currency exchange rates. Beginning in fiscal 2015, we have utilized foreign exchange forward contracts to manage foreign currency risk. If our foreign exchange forward contracts do not successfully manage our foreign currency risk or if we are not otherwise able to successfully manage or hedge against the risks associated with currency fluctuations, our financial condition and operating results could be adversely affected.
Our business is substantially dependent on sales leads from Internet search engines and if we are unable to generate significant volumes of such leads, traffic to our websites and our revenue may decrease.
We generate a substantial portion of our sales leads through visits to our websites by potential customers interested in our solutions. Many of these potential customers find our websites by searching for security and data protection solutions through Internet search engines, particularly Google. A critical factor in attracting potential customers to our websites is how prominently our websites are displayed in response to search inquiries. If we are listed less prominently or fail to appear in search result listings for any reason, visits to our websites by customers and potential customers could decline significantly and we may not be able to replace this traffic. Furthermore, if the costs of search engine marketing services, such as Google AdWords, continue to increase we may be required to increase our sales and marketing expenses, which may not be offset by additional revenue, and our business and operating results could be adversely affected.
Failure to comply with governmental laws and regulations could harm our business.
Our business is subject to regulation by various federal, state, local and foreign governmental agencies, including agencies responsible for monitoring and enforcing employment and labor laws, workplace safety, product safety, environmental laws, consumer protection laws, anti-bribery laws, import/export controls, federal securities laws and tax laws and regulations. In certain foreign jurisdictions, these regulatory requirements may be more stringent than those in the United States. Noncompliance with applicable regulations or requirements could subject us to investigations, sanctions, mandatory product recalls, enforcement actions, disgorgement of profits, fines, damages, civil and criminal penalties or injunctions. If any governmental sanctions are imposed, or if we do not prevail in any possible civil or criminal litigation, our business, operating results, and financial condition could be materially adversely affected. In addition, responding to any action will likely result in a significant diversion of management’s attention and resources and an increase in professional fees. Enforcement actions and sanctions could harm our business, operating results and financial condition.
24
Defects, errors or vulnerabilities in our solutions, the failure of our solutions to block a virus or prevent a security breach or a false detection of applications, viruses, spyware, vulnerability exploits, data patterns or URL categories could harm our reputation and adversely impact our operating results.
Because our solutions are complex, they have contained and may in the future contain design or manufacturing defects or errors that are not detected until after their commercial release and deployment by our customers. For example, from time to time, certain of our customers have reported defects in our solutions related to performance, functionality and compatibility that were not detected before shipping the solution. Additionally, defects may cause our solutions to be vulnerable to security attacks, cause them to fail to help secure networks or temporarily interrupt customers’ networking traffic. Because the techniques used by computer hackers to access or sabotage networks change frequently and generally are not recognized until launched against a target, our solutions may not be able to protect our customers’ networks. Our security solutions may also fail to detect or prevent viruses, worms or similar threats due to a number of reasons such as the evolving nature of such threats and the continual emergence of new threats that we may fail to add to our threat intelligence database or other virus databases in time to protect our customers’ networks. In addition, defects or errors in our subscription updates or our solutions could result in a failure to effectively update customers’ solutions and thereby leave our customers vulnerable to attacks. Our data centers and networks may experience technical failures and downtime, may fail to distribute appropriate updates, or may fail to meet the increased requirements of a growing customer base, any of which could temporarily or permanently expose our customers’ networks, leaving their networks unprotected against the latest security threats. Any defects, errors or vulnerabilities in our solutions could result in:
• | expenditure of significant financial and product development resources in efforts to analyze, correct, eliminate or work-around errors or defects or to address and eliminate vulnerabilities; |
• | loss of existing or potential customers; |
• | delayed or lost revenue; |
• | delay or failure to attain market acceptance; |
• | negative publicity, which will harm our reputation and brand; |
• | an increase in warranty claims compared with our historical experience, or an increased cost of servicing warranty claims, either of which would adversely affect our operating results; and |
• | litigation, regulatory inquiries, or investigations that may be costly and harm our reputation and brand. |
Furthermore, our security solutions may falsely detect applications, content or threats that do not actually exist based on our classifications of application type, virus, malware, vulnerability exploits, data or URL categories. This risk is increased by the inclusion of "heuristics" analysis in our solutions, which attempts to identify threats not based on any known signatures but based on characteristics or anomalies which indicate that a particular item may be a threat. These false positives, while typical in our industry, may impair the perceived reliability of our solutions and may therefore adversely affect market acceptance of our solutions. Also, our anti-spam and anti-malware solutions may falsely identify emails or programs as unwanted spam or potentially unwanted programs, or alternatively fail to properly identify unwanted emails or programs, particularly as spam emails or malware are often designed to circumvent anti-spam or anti-malware solutions. Parties whose emails or programs are blocked by our solutions may seek redress against us for labeling them as spammers or malware or for interfering with their business. In addition, false identification of emails or programs as unwanted spam or potentially unwanted programs may reduce the adoption of our solutions. If our solutions restrict important files or applications based on falsely identifying them as malware or some other item that should be restricted, this could adversely affect customers’ systems and cause material system failures. Any such false identification of important files or applications could result in damage to our reputation, negative publicity, loss of customers and sales, increased costs to remedy any problem and risk of litigation.
If our security measures are breached or unauthorized access to customer data is otherwise obtained or our customers experience data losses, our brand, reputation and business could be harmed and we may incur significant liabilities.
Our customers rely on our security and data protection solutions to secure and store their data, which may include financial records, credit card information, business information, customer information, health information, other personally identifiable information or other sensitive personal information. A breach of our network security and systems or other events that cause the loss or public disclosure of, or access by third parties to, our customers’ stored files or data could have serious negative consequences for our business, including possible fines, penalties and damages, reduced demand for our solutions, an
25
unwillingness of our customers to use our solutions, harm to our brand and reputation, and time-consuming and expensive litigation. The techniques used to obtain unauthorized access, disable or degrade service, or sabotage systems change frequently, often are not recognized until launched against a target, and may originate from less regulated or remote areas around the world. As a result, we may be unable to proactively prevent these techniques, implement adequate preventative or reactionary measures, or enforce the laws and regulations that govern such activities. In addition, because of the large amount of data that we store for our customers, it is possible that hardware failures, human errors or errors in our systems could result in data loss or corruption, or cause the information that we collect to be incomplete or contain inaccuracies that our customers regard as significant. If our customers experience any data loss, or any data corruption or inaccuracies, whether caused by security breaches or otherwise, our brand, reputation and business could be harmed. Moreover, if a high profile security breach occurs with respect to another provider of cloud services, our clients and potential clients may lose trust in the security of the cloud business model generally, which could adversely impact our ability to retain existing clients or attract new ones.
If an actual or perceived breach of network security occurs in our internal systems, our services may be perceived as not being secure and clients may curtail or stop using our solutions.
As a provider of network security solutions, we are a high profile target and our networks and solutions may have vulnerabilities that may be targeted by hackers and could be targeted by attacks specifically designed to disrupt our business and harm our reputation. We will not succeed unless the marketplace continues to be confident that we provide effective network and security protection. If an actual or perceived breach of network security occurs in our internal systems it could adversely affect the market perception of our solutions. We may not be able to correct any security flaws or vulnerabilities promptly, or at all. In addition, such a security breach could impair our ability to operate our business, including our ability to provide subscription and support services to our customers. If this happens, our business and operating results could be adversely affected.
Because our solutions could be used to collect and store personal information of our customers’ employees or customers, privacy concerns could result in additional cost and liability to us or inhibit sales of our solutions.
Personal privacy has become a significant issue in the United States and in many other countries where we offer our solutions. The regulatory framework for privacy issues worldwide is currently complex and evolving, and it is likely to remain uncertain for the foreseeable future. Many federal, state and foreign government bodies and agencies have adopted or are considering adopting laws and regulations regarding the collection, use and disclosure of personal information. In the United States, these include rules and regulations promulgated under the authority of the Federal Trade Commission, the Health Insurance Portability and Accountability Act of 1996 and state breach notification laws. Internationally, virtually every jurisdiction in which we operate has established its own data security and privacy legal framework with which we or our customers must comply, including the Data Protection Directive established in the EU and the Federal Data Protection Act in Germany.
In addition to government regulation, privacy advocacy and industry groups may propose new and different self-regulatory standards that either legally or contractually apply to us. Because the interpretation and application of privacy and data protection laws are still uncertain, it is possible that these laws may be interpreted and applied in a manner that is in conflict with one another, and is inconsistent our existing data management practices or the features of our solutions. If so, in addition to the possibility of fines, lawsuits and other claims, we could be required to fundamentally change our business activities and practices or modify our software, which could have an adverse effect on our business. Any inability to adequately address privacy concerns, even if unfounded, or comply with applicable privacy or data protection laws, regulations and policies, could result in additional cost and liability to us, damage our reputation, inhibit sales and harm our business.
With respect to all of the above, any failure or perceived failure by us or our platform to comply with U.S., EU or other foreign privacy or security laws, policies, industry standards or legal obligations, or any security incident that results in the unauthorized access to, or acquisition, release or transfer of, personally identifiable information or other customer data may result in governmental investigations, inquiries, enforcement actions and prosecutions, private litigation, fines and penalties or adverse publicity. Such actions and penalties could divert management’s attention and resources, adversely affect our business, operating results, financial condition and cash flows, and cause our customers and channel partners to lose trust in our solutions, which could have an adverse effect on our reputation and business.
Any new laws, regulations, other legal obligations or industry standards, or any changed interpretation of existing laws, regulations or other standards may require us to incur additional costs and restrict our business operations. If our privacy or data security measures fail to comply with current or future laws, regulations, policies, legal obligations or industry standards, we may be subject to litigation, regulatory investigations, fines or other liabilities, as well as negative publicity and a potential loss of business. Moreover, if future laws, regulations, other legal obligations or industry standards, or any changed interpretations
26
of the foregoing, limit our customers’ or partners’ ability to use and share personally identifiable information or our ability to store, process and share personally identifiable information or other data, demand for our solutions could decrease, our costs could increase and our business, operating results and financial condition could be harmed.
Furthermore, the costs of compliance with, and other burdens imposed by, the laws, regulations, and policies that are applicable to the businesses of our customers may limit the use and adoption of, and reduce the overall demand for, our solutions. Privacy concerns, whether valid or not valid, may inhibit market adoption of our solutions particularly in certain industries and foreign countries.
Our business is subject to the risks of warranty claims and product liability claims and given our 30-day right to return policy on many of our solutions, we may experience increased frequency of returns, any of which may adversely affect our operating results and financial performance.
Our solutions have contained and may contain undetected defects or errors, especially when first introduced or when new versions are released. Defects or errors could affect the performance of our solutions and could delay the development or release of new solutions or new versions of solutions, adversely affect our reputation and our customers’ willingness to buy solutions from us and adversely affect market acceptance or perception of our offerings. Any such errors or delays in releasing new solutions or new versions of solutions or allegations of unsatisfactory performance could cause us to lose revenue or market share, increase our service costs, cause us to incur substantial costs in redesigning the solutions, cause us to lose significant customers, subject us to liability for damages and divert our resources from other tasks, any one of which could materially and adversely affect our business, operating results and financial condition. Furthermore, we offer customers a 30-day right to return for many of our solutions which is integral to our sales model. If we experience appliance defects, or if we experience increased frequency of returns, our sales cycles, operating results and financial performance may be adversely affected.
In addition, the occurrence of hardware or software errors which result in increased warranty or support claims could result in increased expenses or require us to maintain greater warranty reserves which would have an adverse effect on our business and financial performance.
Our ability to increase sales of our solutions is highly dependent on the quality of our customer support, and our failure to offer high-quality support would have an adverse effect on our business, reputation and operating results.
Our solutions are designed to be deployed by customers in resource-constrained IT environments. Our customers depend on our support services to assist them with questions as they implement our solutions within their IT infrastructure, and after deployment, our customers depend on our support organization to quickly resolve any issues relating to those solutions. A significant level of high-quality support is critical to ensure high rates of renewals and cross-selling of our solutions. Further, as we continue to broaden our portfolio of solutions, increase the size of our customer base and increase the size of our solution deployments within our customers IT infrastructure, we must continue to adapt our customer support organization to ensure that our customers continue to receive the high level of customer service which they have come to expect. If we fail to effectively assist our customers in deploying our solutions, succeed in helping them quickly resolve post-deployment issues or provide effective ongoing support, it could adversely affect our ability to sell our solutions to existing customers, decrease our subscription renewal rates and harm our reputation with potential new customers, all of which would have an adverse effect on our business, reputation and operating results.
If we are unable to hire, retain, train and motivate qualified personnel and senior management, or attract qualified board members, or if our senior management team is unable to perform effectively, our business could suffer.
Our future success depends, in part, on our ability to continue to attract and retain highly skilled personnel and the continued services of our senior management and other key personnel to execute on our business plan and to identify and pursue new opportunities and solution innovations. The loss of the services of our senior management or any of our key personnel, the inability to attract or retain qualified personnel, or delays in hiring required personnel, particularly in engineering and sales and marketing, could significantly delay or prevent the achievement of our development and strategic objectives, and may adversely affect our business, financial condition and operating results. Although we have entered into employment offer letters with our key personnel, these agreements have no specific duration and constitute at-will employment. Our productivity and the quality of our solutions may be adversely affected if we do not integrate and train our new employees quickly and effectively. Furthermore, if we are not effective in retaining our key personnel, our business could be adversely impacted and our operating results and financial condition could be harmed. Also, we recently announced the addition of two new members to our board of directors, and the departure of four of our long standing directors, each of whom served a minimum of ten years on our board. These changes could influence our business and strategic direction.
27
Competition for highly skilled personnel is often intense, especially in the San Francisco Bay Area where we have a substantial presence and need for highly skilled personnel. We may not be successful in attracting, integrating or retaining qualified personnel to fulfill our current or future needs. Also, to the extent we hire personnel from competitors, we may be subject to allegations that they have been improperly solicited, or that they have divulged proprietary or other confidential information, or that their former employers own their inventions or other work product.
Our customer-centric and collaborative corporate culture has contributed to our success, and if we cannot maintain this culture as we grow, we could lose the innovation, creativity and teamwork fostered by our culture, and our business may be harmed.
We believe that a critical contributor to our success has been our corporate culture, which we believe fosters innovation, creativity, a customer-centric focus, collaboration and loyalty. As we grow and change, we may find it difficult to maintain these important aspects of our corporate culture, which could limit our ability to innovate and operate effectively. Any failure to preserve our culture could also negatively affect our ability to retain and recruit personnel, continue to perform at current levels or execute on our business strategy.
We rely on a single source or a limited number of sources for some of our components. Insufficient supply and inventory may result in lost sales opportunities or delayed revenue, while excess inventory may harm our gross profit.
Our inventory management systems and related supply chain visibility tools may be inadequate to enable us to forecast accurately and effectively manage the supply of our components. Additionally, we carry little inventory of our appliances or components, and we rely on our suppliers to deliver necessary components in a timely manner. Insufficient supply levels may lead to shortages that result in delayed revenue or loss of sales opportunities altogether as potential customers turn to competitors’ solutions that could be more readily available. Additionally, any increases in the time required to manufacture our solutions could adversely affect our business, brand, sales cycle and reputation. If we are unable to effectively manage our supply and inventory, our operating results could be adversely affected.
We currently depend on a single source or a limited number of sources for certain components used in the manufacture of our solutions. We are therefore subject to the risk of shortages in supply of these components and the risk that component suppliers discontinue or modify components used in our solutions. If these suppliers were to discontinue production of a necessary part or component, we would be required to expend resources and time in locating and integrating replacement parts or components from another vendor. In addition, the introduction by component suppliers of new versions of their components, particularly if not anticipated by us, could require us to expend resources to incorporate these new components into our solutions. Our reliance on a single source or a limited number of suppliers involves a number of additional risks, including risks related to:
• | supplier capacity constraints; |
• | price volatility; |
• | timely delivery; |
• | component quality; |
• | failure of a key supplier to remain in business and adjust to market conditions; |
• | delays in, or the inability to execute on, a supplier roadmap for components and technologies; and |
• | natural disasters. |
In addition, for certain components, we are subject to potential price increases and limited availability as a result of market demand for these components. In the past, unexpected demand for computer and network products has caused worldwide shortages of certain electronic parts. If similar shortages occur in the future, our business could be adversely affected. We rely on purchase orders rather than long-term contracts with these suppliers, and as a result we might not be able to secure sufficient components, even if they were available, at reasonable prices or of acceptable quality to build appliances in a timely manner and, therefore, might not be able to meet customer demands for our solutions, which would have a material and adverse effect on our business, operating results and financial condition.
28
Assertions by third parties of infringement or other violations by us of their intellectual property rights, or other lawsuits brought against us, could result in significant costs and substantially harm our business and operating results.
Patent and other intellectual property disputes are common in the IT markets in which we compete. Some companies in the IT markets in which we compete, including some of our competitors, own large numbers of patents, copyrights, trademarks and trade secrets, which they may use to assert claims of infringement, misappropriation or other violations of intellectual property rights against us. There also is a market for intellectual property rights and a competitor, or other entity, could acquire intellectual property rights and assert similar claims based on the acquired intellectual property rights. They may also assert such claims against our customers or channel partners. As the number of patents and competitors in our market increase and overlaps occur, claims of infringement, misappropriation and other violations of intellectual property rights may increase. From time to time, we face allegations that we, our customers or our channel partners have infringed, misappropriated and violated intellectual property rights, including allegations made by our competitors or by non-practicing entities. For example, in fiscal 2016 we entered into an intellectual property settlement agreement whereby we agreed to make certain future cash payments to a third party in exchange for a license to certain patents and a covenant by the third party not to sue for any past or future infringement of such licensed patents. Our broad solution portfolio and the number of network and IT markets in which we compete further exacerbate this risk. Any claim of infringement, misappropriation or other violation of intellectual property rights by a third party, even those without merit, could cause us to incur substantial costs defending against the claim and could distract our management from our business.
In addition, future assertions of patent rights by third parties, and any resulting litigation, may involve non-practicing entities or other adverse patent owners who have no relevant revenue and against whom our own patents may therefore provide little or no deterrence or protection. We cannot assure you that we are not infringing or otherwise violating any third-party intellectual property rights.
An adverse outcome of a dispute may require us to, among other things, pay substantial damages including treble damages if we are found to have willfully infringed a third party’s patents or copyrights; cease making, using, selling, licensing, importing or otherwise commercializing solutions that are alleged to infringe or misappropriate the intellectual property rights of others; expend additional development resources to attempt to redesign our solutions or otherwise to develop non-infringing technology, which may not be successful; enter into potentially unfavorable royalty or license agreements in order to obtain the right to use necessary technologies or intellectual property rights or have royalty obligations imposed by a court; and indemnify our customers, partners and other third parties. Furthermore, we have agreed in certain instances to defend our channel partners against third-party claims asserting infringement of certain intellectual property rights, which may include patents, copyrights, trademarks or trade secrets, and to pay judgments entered on such claims. Any damages or royalty obligations we may become subject to, any prohibition against our commercializing our solutions and any third-party indemnity we may need to provide, as a result of an adverse outcome could harm our operating results.
Our use of open source technology could impose limitations on our ability to commercialize our solutions.
We use open source software in our solutions, and although we monitor our use of open source software to avoid subjecting our solutions to conditions we do not intend, the terms of many open source licenses have not been interpreted by U.S. or foreign courts. As a result, there is a risk that these licenses could be construed in a way that could impose unanticipated conditions or restrictions on our ability to commercialize our solutions. From time to time, we may face claims from third parties claiming ownership of, or demanding release of, the open source software or derivative works that we have developed using such software or otherwise seeking to enforce the terms of the applicable open source license. In such an event, we could be required to seek licenses from third parties to continue offering our solutions, to make our proprietary code generally available in source code form, to re-engineer our solutions or to discontinue the sale of our solutions if re-engineering could not be accomplished on a timely basis, any of which could adversely affect our business, operating results and financial condition.
Failure to protect our proprietary technology and intellectual property rights could substantially harm our business and operating results.
The success of our business depends on our ability to protect and enforce our patents, trademarks, copyrights, trade secrets and other intellectual property rights. We attempt to protect our intellectual property under patent, trademark, copyright and trade secret laws, and through a combination of confidentiality procedures, contractual provisions and other methods, all of which offer only limited protection.
As of February 28, 2017, we had 65 issued patents in the United States, but this number of patents is relatively small in comparison to some of our competitors and potential competitors. Additionally, as of February 28, 2017, we had 22 pending U.S. patent applications, and may file additional patent applications in the future. The process of obtaining patent protection is
29
expensive and time-consuming, and we may not be able to prosecute all necessary or desirable patent applications at a reasonable cost or in a timely manner. We may choose not to seek patent protection for certain innovations and may choose not to pursue patent protection in certain jurisdictions. Furthermore, it is possible that our patent applications may not issue as granted patents, that the scope of our issued patents will be insufficient or not have the coverage originally sought, that our issued patents will not provide us with any competitive advantages, and that our patents and other intellectual property rights may be challenged by others or invalidated through administrative process or litigation. In addition, issuance of a patent does not guarantee that we have an absolute right to practice the patented invention, or that we have the right to exclude others from practicing the claimed invention. As a result, we may not be able to obtain adequate patent protection or to enforce our issued patents effectively.
In addition to patented technology, we rely on our unpatented proprietary technology and trade secrets. Despite our efforts to protect our proprietary technology and trade secrets, unauthorized parties may attempt to misappropriate, reverse engineer or otherwise obtain and use them. The contractual provisions that we enter into with employees, consultants, partners, vendors and customers may not prevent unauthorized use or disclosure of our proprietary technology or intellectual property rights and may not provide an adequate remedy in the event of unauthorized use or disclosure of our proprietary technology or intellectual property rights. Moreover, policing unauthorized use of our technologies, solutions and intellectual property is difficult, expensive and time-consuming, particularly in foreign countries where the laws may not be as protective of intellectual property rights as those in the United States and where mechanisms for enforcement of intellectual property rights may be weak. We may be unable to determine the extent of any unauthorized use or infringement of our solutions, technologies or intellectual property rights.
From time to time, legal action by us may be necessary to enforce our patents and other intellectual property rights, to protect our trade secrets, to determine the validity and scope of the intellectual property rights of others or to defend against claims of infringement or invalidity. Such litigation could result in substantial costs and diversion of resources and could negatively affect our business, operating results, financial condition and cash flows. If we are unable to protect our intellectual property rights, we may find ourselves at a competitive disadvantage to others who need not incur the additional expense, time and effort required to create the innovative solutions that have enabled us to be successful to date.
We rely on the availability of third-party licenses for some of our solutions.
Some of our solutions include software or other intellectual property licensed from third parties. It may be necessary in the future to renew licenses relating to various aspects of these solutions or to seek new licenses for existing or new solutions. There can be no assurance that the necessary licenses will be available on acceptable terms, if at all. The inability to obtain certain licenses or other rights or to obtain such licenses or rights on favorable terms, could result in delays in solution releases until equivalent technology can be identified, licensed or developed, if at all, and integrated into our solutions and may have a material adverse effect on our business, operating results and financial condition. In addition, third parties may allege that additional licenses are required for our use of their software or intellectual property, and we may be unable to obtain such licenses on commercially reasonable terms or at all. Moreover, the inclusion in our solutions of software or other intellectual property licensed from third parties on a nonexclusive basis could limit our ability to differentiate our solutions from those of our competitors.
As a public company, we are obligated to develop and maintain proper and effective internal control over financial reporting. We may not complete our analysis of our internal control over financial reporting in a timely manner, or these internal controls may not be determined to be effective, which may adversely affect investor confidence in our company and, as a result, the value of our common stock.
Ensuring that we have adequate internal financial and accounting controls and procedures in place so that we can produce accurate financial statements on a timely basis is a costly and time-consuming effort. Our internal control over financial reporting is designed to provide reasonable assurance regarding the reliability of financial reporting and the preparation of financial statements in accordance with GAAP. We are in the costly and challenging process of compiling the system and processing documentation necessary to perform the evaluation needed to comply with Section 404 of the Sarbanes-Oxley Act of 2002 (the "Sarbanes-Oxley Act"). We may not be able to complete our evaluation, testing and any required remediation in a timely fashion. During the evaluation and testing process, if we identify one or more material weaknesses in our internal control over financial reporting, we will be unable to assert that our internal controls are effective.
We do not expect that disclosure controls or internal controls over financial reporting will prevent all errors and all fraud. A control system, no matter how well designed and operated, can provide only reasonable, not absolute, assurance that the control system’s objectives will be met. If we are unable to assert that our internal control over financial reporting is effective,
30
we could lose investor confidence in the accuracy and completeness of our financial reports, which would cause the price of our common stock to decline, and we may be subject to investigation or sanctions by the SEC.
We are required, pursuant to Section 404 of the Sarbanes-Oxley Act to furnish a report by management on, among other things, the effectiveness of our internal control over financial reporting as of the end of our fiscal year. This assessment will need to include disclosure of any material weaknesses identified by our management in our internal control over financial reporting.
We are required to disclose changes made in our internal controls and procedures on a quarterly basis. However, our independent registered public accounting firm will not be required to report on the effectiveness of our internal control over financial reporting pursuant to Section 404 of the Sarbanes-Oxley Act until the date we are no longer an "emerging growth company" as defined in the Jumpstart Our Business Startups Act of 2012 (the "JOBS Act"). At such time, our independent registered public accounting firm may issue a report that is adverse in the event it is not satisfied with the level at which our controls are documented, designed or operating. Our remediation efforts may not enable us to avoid a material weakness in the future.
Additionally, to comply with the requirements of being a public company, we may need to undertake various actions, such as implementing new internal controls and procedures and hiring accounting or internal audit staff, which may adversely affect our operating results and financial condition.
If our solutions do not interoperate with our end-customers’ infrastructure, sales of our solutions could be negatively affected, which would harm our business.
Our solutions must interoperate with our end-customers’ existing infrastructure, which often have different specifications, utilize multiple protocol standards, deploy products from multiple vendors, and contain multiple generations of products that have been added over time. As a result, when problems occur in a network, it may be difficult to identify the sources of these problems. Any delays in identifying the sources of problems or in providing necessary modifications to our software or hardware could have a negative impact on our reputation and our customers’ satisfaction with our solutions, and our ability to sell solutions could be adversely affected. In addition, customers may require our solutions to comply with certain security or other certifications and standards. If our solutions are late in achieving or fail to achieve compliance with these certifications and standards, or our competitors achieve compliance with these certifications and standards, we may be disqualified from selling our solutions to such end-customers, or at a competitive disadvantage, which would harm our business, operating results and financial condition.
If our solutions fail to help our customers achieve and maintain compliance with government regulations and industry standards, our business and operating results could be materially adversely affected.
We generate a portion of our revenues from our solutions because they help organizations achieve and maintain compliance with government regulations and industry standards. For example, many of our customers purchase our security and data protection solutions to help them comply with the security standards developed and maintained by the Payment Card Industry Security Standards Council (the "PCI Council"), which apply to companies that process or store credit card information. Industry organizations like the PCI Council may significantly change their security standards with little or no notice, including changes that could make their standards more or less onerous for businesses. Governments may also adopt new laws or regulations, or make changes to existing laws or regulations, that could impact whether our solutions enable our customers to demonstrate, maintain or audit their compliance. If we are unable to adapt our solutions to changing regulatory standards in a timely manner, or if our solutions fail to expedite our customers’ compliance initiatives, our customers may lose confidence in our solutions and could switch to solutions offered by our competitors. In addition, if regulations and standards related to data security are changed in a manner that makes them less onerous, our customers may view government and industry regulatory compliance as less critical to their businesses, and our customers may be less willing to purchase our solutions. In either case, our business, financial condition and operating results may suffer.
Our sales to government entities are subject to a number of challenges and risks.
We sell to state and local governmental agency customers, particularly schools, and we may increase sales to government entities in the future. Sales to government entities are subject to a number of challenges and risks. Selling to government entities can be highly competitive, expensive and time consuming, often requiring significant upfront time and expense without any assurance that these efforts will generate a sale. Government certification requirements for solutions like ours may change and in doing so restrict our ability to sell into the federal government sector until we have attained the revised certification. Government demand and payment for our solutions may be impacted by public sector budgetary cycles and funding
31
authorizations, with funding reductions or delays adversely affecting public sector demand for our solutions. Government entities may have statutory, contractual or other legal rights to terminate contracts with our distributors and resellers for convenience or due to a default, and any such termination may adversely impact our future operating results.
Our failure to generate the significant capital necessary to expand our operations and invest in new solutions could reduce our ability to compete and could harm our business.
We may need to raise additional funds in the future, and we may not be able to obtain additional debt or equity financing on favorable terms, if at all. If we raise additional equity financing, our stockholders may experience significant dilution of their ownership interests and the per share value of our common stock could decline. Furthermore, if we engage in debt financing, the holders of debt would have priority over the holders of our common stock, and we may be required to accept terms that restrict our ability to incur additional indebtedness. We may also be required to take other actions that would otherwise be in the interests of the debt holders and force us to maintain specified liquidity or other ratios, any of which could harm our business, operating results and financial condition. If we need additional capital and cannot raise it on acceptable terms, we may not be able to, among other things:
• | develop or enhance our solutions; |
• | continue to expand our sales and marketing and research and development organizations; |
• | acquire or invest in complementary businesses, solutions or technologies; |
• | expand operations in the United States or internationally; |
• | hire, train and retain employees; or |
• | respond to competitive pressures or unanticipated working capital requirements. |
Our failure to do any of these things could adversely affect our business, financial condition and operating results.
We are exposed to the credit risk of some of our distributors, resellers and customers and to credit exposure in weakened markets, which could result in material losses.
Most of our sales are on an open credit basis. Although we have programs in place that are designed to monitor and mitigate these risks, and our broad customer base and channel partner network mitigate these risks, we cannot assure you these programs will be effective in reducing our credit risks, especially as we expand our business internationally. Additionally, as our accounts receivable continue to increase, these risks, including the risk of doubtful accounts, will be exacerbated. If we are unable to adequately control these risks, our business, operating results and financial condition could be adversely affected.
If our estimates or judgments relating to our critical accounting policies are based on assumptions that change or prove to be incorrect, our operating results could fall below expectations of securities analysts and investors, resulting in a decline in our stock price.
The preparation of financial statements in conformity with GAAP requires management to make estimates and assumptions that affect the amounts reported in the condensed consolidated financial statements and accompanying notes. We base our estimates on historical experience and on various other assumptions that we believe to be reasonable under the circumstances, the results of which form the basis for making judgments about the carrying values of assets and liabilities that are not readily apparent from other sources. Our operating results may be adversely affected if our assumptions change or if actual circumstances differ from those in our assumptions, which could cause our operating results to fall below the expectations of securities analysts and investors, resulting in a decline in our stock price. Significant assumptions and estimates used in preparing our condensed consolidated financial statements include those related to revenue recognition, stock-based compensation expense, valuation of inventory and accounting for income taxes.
Unanticipated changes in effective tax rates or adverse outcomes resulting from examination of our income or other tax returns could adversely affect our operating results and financial condition.
We are subject to income taxes in the United States and various foreign jurisdictions, and our domestic and international tax liabilities will be subject to the allocation of expenses in differing jurisdictions. Our future effective tax rates could be subject to volatility or adversely affected by a number of factors, including:
32
• | changes in the valuation of our deferred tax assets and liabilities; |
• | expected timing and amount of the release of tax valuation allowances; |
• | detrimental changes in research and development tax credit laws; |
• | tax effects of stock-based compensation; |
• | costs related to intercompany restructurings; |
• | changes in tax laws, regulations, accounting principles or interpretations thereof; or |
• | future earnings being lower than anticipated in countries where we have lower statutory tax rates and higher than anticipated earnings in countries where we have higher statutory tax rates. |
In addition, we may be subject to audits of our income and sales taxes by the Internal Revenue Service and other foreign and state tax authorities. Outcomes from these audits could have an adverse effect on our operating results and financial condition.
The nature of our business requires the application of complex revenue and expense recognition rules and the current legislative and regulatory environment affecting generally accepted accounting principles is uncertain. Significant changes in current principles could affect our financial statements going forward and changes in financial accounting standards or practices may cause adverse, unexpected financial reporting fluctuations and harm our operating results.
The accounting rules and regulations that we must comply with are complex and subject to interpretation by the Financial Accounting Standards Board ("FASB"), the SEC and various bodies formed to promulgate and interpret appropriate accounting principles. Recent actions and public comments from the FASB and the SEC have focused on the integrity of financial reporting and internal controls. In addition, many companies’ accounting policies are being subject to heightened scrutiny by regulators and the public. Changes in financial accounting standards or practices can have a significant effect on our reported results and may even affect our reporting of transactions completed before the change is effective. New accounting pronouncements and varying interpretations of accounting pronouncements have occurred and may occur in the future that could materially impact our financial statements. For example, the FASB issued an accounting standards update related to revenue from contracts with customers, which supersedes the revenue recognition requirements in the current Accounting Standards Codification.
We are in the early stages of our evaluation of the impact of the new standard on our accounting policies, processes and system requirements and have not made a final decision regarding the adoption method. Our final determination will depend on a number of factors, such as the significance of the impact of the new standard on our financial results, system readiness, and our ability to accumulate and analyze the information necessary to assess the impact on prior period financial statements, as necessary. While we continue to assess the potential impacts of the new standard, we anticipate this standard could have an impact on our consolidated financial statements. However, we cannot reasonably estimate quantitative information related to the impact of the new standard on our financial statements at this time. The application of this new guidance may result in a change in the timing and pattern of revenue recognition. We cannot predict the impact of future changes to accounting principles or our accounting policies on our financial statements going forward, which could have a significant effect on our reported financial results, and could affect the reporting of transactions completed before the announcement of the change. In addition, if we were to change our critical accounting estimates, including those related to the recognition of revenue, our operating results could be significantly affected.
Our business is subject to the risks of earthquakes, fire, power outages, floods and other catastrophic events and to interruption by man-made problems such as terrorism.
A significant natural disaster, such as an earthquake, fire, flood or significant power outage could have a material adverse impact on our business, operating results and financial condition. Both our corporate headquarters and the location where our solutions are manufactured are located in the San Francisco Bay Area, a region known for seismic activity. In addition, natural disasters could affect our supply chain, manufacturing vendors, logistics providers’ or data center hosting providers’ ability to provide materials and perform services on a timely basis. In the event our or our service providers’ IT systems or manufacturing or logistics abilities are hindered by any of the events discussed above, shipments could be delayed, and our solutions could become unavailable resulting in missed financial targets, such as revenue and shipment targets, for a particular quarter. In addition, acts of terrorism and other geo-political unrest could cause disruptions in our business or the business of our supply
33
chain, manufacturers, logistics providers, partners or customers or the economy as a whole. Any disruption in the business of our supply chain, manufacturers, logistics providers, data center hosting partners or customers that impacts sales at the end of a fiscal quarter could have a significant adverse impact on our quarterly results. All of the aforementioned risks may be further increased if the disaster recovery plans for us and our suppliers prove to be inadequate. To the extent that any of the above should result in delays or cancellations of customer orders, or the delay in the manufacture, deployment or shipment of our solutions, our business, financial condition and operating results would be adversely affected.
If we fail to comply with environmental requirements, our business, financial condition, operating results and reputation could be adversely affected.
We are subject to various environmental laws and regulations including laws governing the hazardous material content of our solutions and laws relating to the collection of and recycling of electrical and electronic equipment. Examples of these laws and regulations include the EU Restrictions of Hazardous Substances Directive (the "RoHS Directive") and the EU Waste Electrical and Electronic Equipment Directive (the "WEEE Directive"), as well as the implementing legislation of the EU member states. Similar laws and regulations have been passed or are pending in China, South Korea, Norway and Japan and may be enacted in other regions, including in the United States, and we are, or may in the future be, subject to these laws and regulations.
The RoHS Directive and the similar laws of other jurisdictions ban the use of certain hazardous materials such as lead, mercury and cadmium in the manufacture of electrical equipment, including our solutions. Currently, we and other manufacturers of our hardware appliances and major component part suppliers comply with the RoHS Directive requirements. However, if there are changes to this or other laws (or their interpretation) or if new similar laws are passed in other jurisdictions, we may be required to re-engineer our solutions to use components compatible with these regulations. This re-engineering and component substitution could result in additional costs to us or disrupt our operations or logistics.
The WEEE Directive requires electronic goods producers to be responsible for the collection, recycling and treatment of such solutions. Changes in interpretation of the directive may cause us to incur costs or have additional regulatory requirements to meet in the future in order to comply with this directive, or with any similar laws adopted in other jurisdictions.
Our failure to comply with past, present and future similar laws could result in reduced sales of our solutions, inventory write-offs, reputational damage, penalties and other sanctions, any of which could harm our business and financial condition. We also expect that our solutions will be affected by new environmental laws and regulations on an ongoing basis. To date, our expenditures for environmental compliance have not had a material impact on our results of operations or cash flows, and although we cannot predict the future impact of such laws or regulations, they will likely result in additional costs and may increase penalties associated with violations or require us to change the content of our solutions or how they are manufactured, which could have a material adverse effect on our business, operating results and financial condition.
Regulations related to conflict minerals may cause us to incur additional expenses and could limit the supply and increase the costs of certain metals used in the manufacturing of our appliances.
As a public company, we are subject to certain requirements under the Dodd-Frank Wall Street Reform and Consumer Protection Act of 2010 (the "Dodd-Frank Act") that require us to diligence, disclose and report whether or not our appliances contain conflict minerals. As a recently public company, we filed our initial report with respect to conflict minerals in May 2016 for the 2015 calendar year. The implementation of these requirements could adversely affect the sourcing, availability and pricing of the materials used in the manufacture of components used in our solutions. In addition, we will incur additional costs to comply with the disclosure requirements, including costs related to conducting diligence procedures to determine the sources of conflict minerals that may be used or necessary to the production of our appliances and, if applicable, potential changes to appliances, processes or sources of supply as a consequence of such verification activities. It is also possible that we may face reputational harm if we determine that certain of our appliances contain minerals not determined to be conflict free or if we are unable to alter our appliances, processes or sources of supply to avoid such materials.
34
Risks Related to Ownership of Our Common Stock
Our actual operating results may differ significantly from our guidance.
From time to time, we have released, and may continue to release guidance in our quarterly earnings conference call, quarterly earnings releases, or otherwise, regarding our future performance that represents our management’s estimates as of the date of release. This guidance, which includes forward-looking statements, has been and will be based on projections prepared by our management. These projections are not prepared with a view toward compliance with published guidelines of the American Institute of Certified Public Accountants, and neither our registered public accountants nor any other independent expert or outside party compiles or examines the projections. Accordingly, no such person expresses any opinion or any other form of assurance with respect to the projections.
Projections are based upon a number of assumptions and estimates that, while presented with numerical specificity, are inherently subject to significant business, economic and competitive uncertainties and contingencies, many of which are beyond our control and are based upon specific assumptions with respect to future business decisions, some of which will change. We intend to state possible outcomes as high and low ranges which are intended to provide a sensitivity analysis as variables are changed but are not intended to imply that actual results could not fall outside of the suggested ranges. The principal reason that we release guidance is to provide a basis for our management to discuss our business outlook with analysts and investors. We do not accept any responsibility for any projections or reports published by any such third parties.
Guidance is necessarily speculative in nature, and it can be expected that some or all of the assumptions underlying the guidance furnished by us will not materialize or will vary significantly from actual results. Accordingly, our guidance is only an estimate of what management believes is realizable as of the date of release. Actual results may vary from our guidance and the variations may be material. We undertake no obligation to make revisions or publicly update our guidance in advance of actual results unless required by law. In light of the foregoing, investors are urged to consider all of the information we make publicly available in making an investment decision regarding our common stock and not rely solely upon our guidance.
Any failure to successfully implement our operating strategy or the occurrence of any of the events or circumstances set forth in this "Risk Factors" section could result in the actual operating results being different from our guidance, and the differences may be adverse and material.
We cannot assure you that our stock repurchase program will result in additional repurchases of our common stock or enhance long-term stockholder value, and repurchases, if any, could affect our stock price and increase its volatility and will diminish our cash reserves.
In September 2015, our board of directors authorized a stock repurchase program. Under this program, we are authorized to repurchase shares of our own common stock for an aggregate purchase price not to exceed $50.0 million through September 30, 2017. Although our board of directors has authorized the stock repurchase program, the stock repurchase program does not obligate us to repurchase any specific dollar amount or to acquire any specific number of shares. Stock will be purchased from time to time, in the open market or through private transactions, subject to market condition, in compliance with applicable state and federal securities laws. The timing and amount of repurchases, if any, will depend upon several factors, including market and business conditions, the trading price of our common stock and the nature of other investment opportunities. As of February 28, 2017, we had purchased approximately 2.0 million shares of common stock under this program at a weighted average price of $13.40 per share for an aggregate purchase price of $26.8 million.
Our stock repurchase program could affect our stock price and increase its volatility and will reduce the market liquidity for our stock. Additionally, our stock repurchase program could diminish our cash reserves, which may impact our ability to finance future growth and to pursue possible future strategic opportunities and acquisitions. There can be no assurance that any repurchases will enhance stockholder value because the market price of our common stock may decline below the levels at which we repurchased shares of stock. Although our stock repurchase program is intended to enhance long-term stockholder value, short-term stock price fluctuations could reduce the effectiveness of these repurchases.
Our share price has been and may continue to be volatile, and you may be unable to sell your shares at or above the price at which you purchased your stock.
Technology stocks have historically experienced high levels of volatility. The trading price of our common stock has been and is likely to continue to be highly volatile and subject to wide fluctuations in response to various factors, some of which are beyond our control and may not be related to our operating performance. Furthermore, our stock repurchase program could affect our stock price and increase its volatility and will reduce the market liquidity for our stock. Since shares of our common
35
stock were sold in our initial public offering in November 2013 at a price of $18.00 per share, the reported high and low sales prices of our common stock have ranged from $9.44 to $46.78 through February 28, 2017. These fluctuations could cause you to lose all or part of your investment in our common stock. Factors that may cause the market price of our common stock to fluctuate include:
• | price and volume fluctuations in the overall stock market from time to time; |
• | significant volatility in the market price and trading volume of technology companies in general, and of companies in our industry; |
• | actual or anticipated changes in our results of operations or fluctuations in our operating results; |
• | whether our operating results meet the expectations of securities analysts or investors; |
• | actual or anticipated changes in the expectations of investors or securities analysts; |
• | actual or anticipated developments in our competitors’ businesses or the competitive landscape generally; |
• | developments or disputes concerning our intellectual property or other proprietary rights; |
• | litigation or investigations involving us, our industry or both; |
• | regulatory developments in the United States, foreign countries or both; |
• | general economic conditions and trends; |
• | major catastrophic events; |
• | our stock repurchase program; |
• | sales of large blocks of our stock; or |
• | major changes in our board of directors or management or departures of key personnel. |
In addition, if the market for technology stocks, or the stock market in general, experiences a loss of investor confidence, the trading price of our common stock could decline for reasons unrelated to our business, operating results or financial condition. The trading price of our common stock might also decline in reaction to events that affect other companies in our industry even if these events do not directly affect us.
In the past, following periods of volatility in the market price of a company’s securities, securities class action litigation has often been brought against that company. If our stock price is volatile, we may become the target of securities litigation. Securities litigation could result in substantial costs and divert our management’s attention and resources from our business, and this could have a material adverse effect on our business, operating results and financial condition.
Sales of outstanding shares of our common stock into the market in the future could cause the market price of our common stock to drop significantly.
If our existing stockholders sell, or indicate an intent to sell, substantial amounts of our common stock in the public market, the trading price of our common stock could decline. As of February 28, 2017, there were 52,897,128 shares of common stock outstanding. All outstanding shares are freely tradable, unless such shares are held by "affiliates," as that term is defined in Rule 144 of the Securities Act of 1933, as amended.
In addition, we have filed registration statements on Form S-8 to register all shares subject to outstanding options and restricted stock units or reserved for future issuance under our equity compensation plans. If these additional shares are sold, or if it is perceived that they will be sold, in the public market, the trading price of our common stock could decline.
If securities analysts do not publish research or reports about our business, or if they downgrade our stock, the price of our stock could decline.
36
The trading market for our common stock could be influenced by any research and reports that securities or industry analysts publish about us or our business. In the event securities analysts who cover our company downgrade our stock or publish inaccurate or unfavorable research about our business, our stock price would likely decline. If one or more of these analysts cease coverage of our company or fail to publish reports on us regularly, demand for our stock could decrease, which could cause our stock price and trading volume to decline.
The requirements of being a public company may strain our resources, divert management’s attention and affect our ability to attract and retain executive management and qualified board members.
As a public company, we are subject to the reporting requirements of the Exchange Act, the Sarbanes-Oxley Act, the Dodd-Frank Act, the listing requirements of the New York Stock Exchange (the "NYSE") and other applicable securities rules and regulations. Compliance with these rules and regulations will increase our legal and financial compliance costs, make some activities more difficult, time-consuming or costly and increase demand on our systems and resources, particularly after we are no longer an "emerging growth company," as defined in the JOBS Act. The Exchange Act requires, among other things, that we file annual, quarterly and current reports with respect to our business and operating results. The Sarbanes-Oxley Act requires, among other things, that we maintain effective disclosure controls and procedures and internal control over financial reporting. In order to maintain and, if required, improve our disclosure controls and procedures and internal control over financial reporting to meet this standard, significant resources and management oversight may be required. As a result, management’s attention may be diverted from other business concerns, which could adversely affect our business and operating results. Although we have already hired additional employees to comply with these requirements, we may need to hire more employees in the future or engage outside consultants, which will increase our costs and expenses.
In addition, changing laws, regulations and standards relating to corporate governance and public disclosure are creating uncertainty for public companies, increasing legal and financial compliance costs and making some activities more time consuming. These laws, regulations and standards are subject to varying interpretations, in many cases due to their lack of specificity, and, as a result, their application in practice may evolve over time as new guidance is provided by regulatory and governing bodies. This could result in continuing uncertainty regarding compliance matters and higher costs necessitated by ongoing revisions to disclosure and governance practices. We intend to invest resources to comply with evolving laws, regulations and standards, and this investment may result in increased general and administrative expenses and a diversion of management’s time and attention from revenue-generating activities to compliance activities. If our efforts to comply with new laws, regulations and standards differ from the activities intended by regulatory or governing bodies due to ambiguities related to their application and practice, regulatory authorities may initiate legal proceedings against us, and our business may be adversely affected. However, for as long as we remain an "emerging growth company," we may take advantage of certain exemptions from various reporting requirements that are applicable to public companies that are not "emerging growth companies" including, but not limited to, not being required to comply with the auditor attestation requirements of Section 404 of the Sarbanes-Oxley Act, reduced disclosure obligations regarding executive compensation in our periodic reports and proxy statements, and exemptions from the requirements of holding a nonbinding advisory vote on executive compensation and stockholder approval of any golden parachute payments not previously approved. We may take advantage of these reporting exemptions until we are no longer an "emerging growth company."
We will cease to be an "emerging growth company" upon the earliest of: (i) the end of our fiscal year 2019, (ii) the beginning of our first fiscal year after our annual gross revenues are $1.0 billion or more, (iii) the date on which we have, during the previous three-year period, issued more than $1.0 billion in non-convertible debt securities or (iv) as of the end of any fiscal year in which the market value of our common stock held by non-affiliates exceeded $700 million as of the end of the second quarter of that fiscal year.
As a public company, our business and financial condition have become more visible, which we believe may result in threatened or actual litigation, including by competitors and other third parties. If such claims are successful, our business and operating results could be adversely affected, and even if the claims do not result in litigation or are resolved in our favor, these claims, and the time and resources necessary to resolve them, could divert the resources of our management and adversely affect our business and operating results.
We are an "emerging growth company," and we cannot be certain if the reduced disclosure requirements applicable to emerging growth companies will make our common stock less attractive to investors.
We are an "emerging growth company," as defined in the JOBS Act, and we may take advantage of certain exemptions from various reporting requirements that are applicable to public companies that are not "emerging growth companies" including, but not limited to, not being required to comply with the auditor attestation requirements of Section 404 of the Sarbanes-Oxley Act, reduced disclosure obligations regarding executive compensation in our periodic reports and proxy
37
statements, and exemptions from the requirements of holding a nonbinding advisory vote on executive compensation and stockholder approval of any golden parachute payments not previously approved. We cannot predict if investors will find our common stock less attractive because we may rely on these exemptions. If some investors find our common stock less attractive as a result, there may be a less active trading market for our common stock, and our stock price may be more volatile.
We do not intend to pay dividends for the foreseeable future.
We anticipate that we will retain all of our future earnings for use in the development of our business and for general corporate purposes. Any determination to pay dividends in the future will be at the discretion of our board of directors. In addition, our existing credit facility restricts and any future indebtedness may restrict our ability to pay dividends. Accordingly, investors must rely on sales of their common stock after price appreciation, which may never occur, as the only way to realize any future gains on their investments. Investors seeking cash dividends should not purchase our common stock.
We have incurred and will continue to incur increased costs as a result of being a public company.
As a public company, we have incurred and will continue to incur significant legal, accounting and other expenses that we did not incur as a private company. In addition, rules implemented by the SEC and the NYSE require certain corporate governance practices by public companies. These rules and regulations increase our legal and financial compliance costs and make some activities more time-consuming and costly. We also incur additional costs associated with our public company reporting requirements. These rules and regulations may also make it more difficult and more expensive for us to obtain director and officer liability insurance, and we may be required to accept reduced policy limits and coverage or incur substantially higher costs to obtain the same or similar coverage. As a result, it may be more difficult for us to attract and retain qualified people to serve on our board of directors or as executive officers.
Provisions in our certificate of incorporation and bylaws and under Delaware law might discourage, delay or prevent a change of control of our company or changes in our management and, therefore, depress the trading price of our common stock.
Our amended and restated certificate of incorporation and amended and restated bylaws contain provisions that could depress the trading price of our common stock by acting to discourage, delay or prevent a change of control of our company or changes in our management that the stockholders of our company may deem advantageous. These provisions:
• | establish a classified board of directors so that not all members of our board of directors are elected at one time; |
• | authorize the issuance of "blank check" preferred stock that our board of directors could issue to increase the number of outstanding shares to discourage a takeover attempt; |
• | prohibit stockholder action by written consent, which requires all stockholder actions to be taken at a meeting of our stockholders; |
• | prohibit stockholders from calling a special meeting of our stockholders; |
• | provide that the board of directors is expressly authorized to make, alter or repeal our bylaws; |
• | establish advance notice requirements for nominations for elections to our board of directors or for proposing matters that can be acted upon by stockholders at stockholder meetings; and |
• | provide that a state or federal court located within the State of Delaware will be the exclusive forum for any derivative action brought on our behalf, any action asserting a breach of fiduciary duty, any action asserting a claim against us arising under the Delaware General Corporation Law and certain other claims. |
Additionally, we are subject to Section 203 of the Delaware General Corporation Law, which generally prohibits a Delaware corporation from engaging in any of a broad range of business combinations with any "interested" stockholder for a period of three years following the date on which the stockholder became an "interested" stockholder and which may discourage, delay or prevent a change of control of our company.
The provisions of our amended and restated certificate of incorporation and amended and restated bylaws may frustrate or prevent attempts by our stockholders to replace or remove our current management by making it more difficult for stockholders to replace members of our board of directors, which is responsible for appointing the members of our management. The
38
provisions of our amended and restated certificate of incorporation and amended and restated bylaws or Delaware law may also have the effect of delaying or deterring a change in control, which could limit the opportunity for our stockholders to receive a premium for their shares of our common stock, and could also affect the price that some investors are willing to pay for our common stock.
Item 1B. Unresolved Staff Comments
None.
Item 2. Properties
Our principal executive offices consist of approximately 61,400 square feet of office space that we own in Campbell, California. We also lease approximately 42,000 square feet of office space for research and development in Ann Arbor, Michigan and approximately 47,000 square feet of office space for manufacturing and customer support in San Jose, California, with leases that expire in October 2017 and August 2018, respectively. We have additional office locations throughout the United States and in various international locations.
We believe that our existing facilities are adequate and sufficient for our current needs. We intend to add new facilities and expand our existing facilities as we add employees and grow our business, and we believe that additional or substitute space will be available on commercially reasonable terms to meet our future needs.
Item 3. Legal Proceedings
On April 18, 2016, R. David Hunt, as Seller Representative of the shareholders of C2C Systems Limited ("C2C"), filed a lawsuit against us in the Court of Chancery of the State of Delaware, for alleged breach of contract of the Share Purchase Agreement dated August 13, 2014, pursuant to which we acquired all of the assets and liabilities of C2C. On February 15, 2017, the parties entered into a settlement agreement in which we agreed to pay $1.25 million to the shareholders of C2C in exchange for a settlement of all claims under the Share Purchase Agreement. On February 17, 2017, the case was dismissed with prejudice.
On February 27, 2017, Realtime Data LLC filed a lawsuit against us in the United States District Court for the Eastern District of Texas, Tyler Division, alleging that certain of our products infringe U.S. patent numbers 9,054,728, 7,415,530, 9,116,908 and 8,717,204. We responded to the complaint on April 24, 2017. Given the early stage of the matter, we are unable to estimate a possible loss or range of possible loss, if any.
We may, from time to time, be party to litigation and subject to claims that arise in the ordinary course of business. In addition, third parties may, from time to time, assert claims against us in the form of letters and other communications. We currently believe that these ordinary course matters will not have a material adverse effect on our business, consolidated financial position, results of operations or cash flows; however, the results of litigation and claims are inherently unpredictable. Regardless of the outcome, litigation can have an adverse impact on us because of defense and settlement costs, diversion of management resources and other factors.
Item 4. Mine Safety Disclosures
Not applicable.
39
PART II
Item 5. Market for Registrant’s Common Equity, Related Stockholder Matters and Issuer Purchases of Equity Securities
Market Information
Our common stock is listed on the NYSE under the symbol "CUDA." The following table sets forth for the periods indicated the high and low sales prices of our common stock as reported on the NYSE.
Fiscal 2016 | Fiscal 2017 | ||||||||||||||||||||||||||||||
Q1 | Q2 | Q3 | Q4 | Q1 | Q2 | Q3 | Q4 | ||||||||||||||||||||||||
High | $ | 46.78 | $ | 43.22 | $ | 29.99 | $ | 19.88 | $ | 18.60 | $ | 23.90 | $ | 26.69 | $ | 25.66 | |||||||||||||||
Low | $ | 35.25 | $ | 21.85 | $ | 14.77 | $ | 9.44 | $ | 12.87 | $ | 13.91 | $ | 21.85 | $ | 20.64 | |||||||||||||||
On February 28, 2017, the last reported sale price of our common stock on the NYSE was $23.66 per share.
Holders of Record
As of March 31, 2017, there were 91 holders of record of our common stock. Because many of our shares of common stock are held by brokers and other institutions on behalf of stockholders, we are unable to estimate the total number of stockholders represented by these record holders.
Dividend Policy
We currently intend to retain all available funds and any future earnings for use in the operation of our business and do not anticipate paying any dividends on our common stock in the foreseeable future, if at all. Additionally, our ability to pay dividends on our common stock is limited by restrictions on our ability to pay dividends or make distributions under the terms of our existing credit facility. Any future determination to declare dividends will be made at the discretion of our board of directors and will depend on our financial condition, operating results, capital requirements, general business conditions and other factors that our board of directors may deem relevant.
Issuer Purchases of Equity Securities
In September 2015, our board of directors authorized a stock repurchase program. Under the program, we are authorized to repurchase shares of our common stock for an aggregate purchase price not to exceed $50.0 million through September 30, 2017. We began repurchasing common stock in the third quarter of fiscal 2016 and no shares were purchased other than through our stock repurchase program.
The following table summarizes all stock repurchases under our publicly announced stock repurchase program for the periods presented (in thousands, except per share data):
Total Number of Shares | Average Price Paid Per Share | Maximum Dollar Value of
Shares That May Yet Be
Purchased Under Our
Program | ||||||||
December 1, 2016 to December 31, 2016 | — | $ | — | $ | 23,543 | |||||
January 1, 2017 to January 31, 2017 | 16 | $ | 21.83 | $ | 23,188 | |||||
February 1, 2017 to February 28, 2017 | — | $ | — | $ | 23,188 | |||||
16 | $ | 21.83 | ||||||||
Stock Performance Graph
The following shall not be deemed "filed" for purposes of Section 18 of the Exchange Act, or incorporated by reference into any of our other filings under the Exchange Act or the Securities Act of 1933, as amended, except to the extent we specifically incorporate it by reference into such filing.
40
The following graph compares the cumulative total return of our common stock with the total return for the NYSE Composite Index and the Standard & Poor’s 500 Index (the "S&P 500") from November 6, 2013 through February 28, 2017. The graph assumes that $100 was invested on November 6, 2013 in our common stock, the NYSE Composite Index and the S&P 500, and assumes reinvestment of any dividends. The stock price performance on the following graph is not necessarily indicative of future stock price performance.
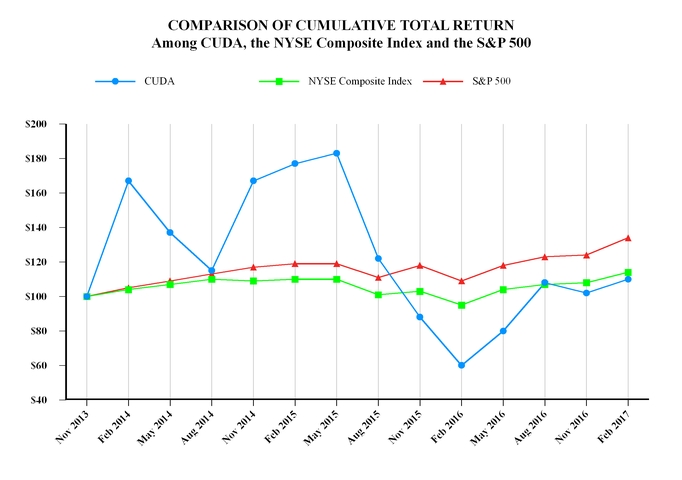
Recent Sales of Unregistered Securities
None.
Securities Authorized for Issuance Under Equity Compensation Plans
See Item 12, "Security Ownership of Certain Beneficial Owners and Management and Related Stockholder Matters" for information regarding securities authorized for issuance.
41
Item 6. Selected Financial Data
The following selected historical financial data below should be read in conjunction with Item 7, "Management’s Discussion and Analysis of Financial Condition and Results of Operations," our financial statements and the accompanying notes appearing in Item 8, "Financial Statements and Supplementary Data," of this Annual Report on Form 10-K to fully understand factors that may affect the comparability of the information presented below.
The statements of operations data for fiscal 2017, 2016 and 2015 and the balance sheet data as of February 28, 2017 and February 29, 2016 are derived from our audited financial statements appearing in Item 8, "Financial Statements and Supplementary Data," of this Annual Report on Form 10-K. The statements of operations for fiscal 2014 and 2013 and the balance sheet data as of February 28, 2015, 2014 and 2013 are derived from audited financial statements not included in this Annual Report on Form 10-K. Our historical results are not necessarily indicative of the results to be expected in the future.
Year Ended February 28/29, | |||||||||||||||||||
2017 | 2016 | 2015 | 2014 | 2013 | |||||||||||||||
(in thousands, except per share data) | |||||||||||||||||||
Consolidated Statements of Operations Data: | |||||||||||||||||||
Revenue: | |||||||||||||||||||
Appliance | $ | 82,732 | $ | 89,275 | $ | 83,146 | $ | 71,914 | $ | 59,528 | |||||||||
Subscription | 269,917 | 230,883 | 194,300 | 161,873 | 139,403 | ||||||||||||||
Total revenue | 352,649 | 320,158 | 277,446 | 233,787 | 198,931 | ||||||||||||||
Cost of revenue (1) | 83,772 | 70,132 | 58,667 | 53,768 | 45,088 | ||||||||||||||
Gross profit | 268,877 | 250,026 | 218,779 | 180,019 | 153,843 | ||||||||||||||
Operating expenses: | |||||||||||||||||||
Research and development (1) | 75,070 | 71,251 | 58,737 | 47,142 | 35,167 | ||||||||||||||
Sales and marketing (1) | 129,707 | 138,324 | 125,526 | 114,024 | 102,329 | ||||||||||||||
General and administrative (1) | 42,042 | 47,338 | 35,438 | 29,856 | 28,777 | ||||||||||||||
Total operating expenses | 246,819 | 256,913 | 219,701 | 191,022 | 166,273 | ||||||||||||||
Income (loss) from operations | 22,058 | (6,887 | ) | (922 | ) | (11,003 | ) | (12,430 | ) | ||||||||||
Other income (expense), net | (70 | ) | (262 | ) | (3,674 | ) | 51 | (839 | ) | ||||||||||
Income (loss) before income taxes and non-controlling interest | 21,988 | (7,149 | ) | (4,596 | ) | (10,952 | ) | (13,269 | ) | ||||||||||
Benefit from (provision for) income taxes (2) | (11,753 | ) | 2,727 | (62,902 | ) | 6,565 | 5,084 | ||||||||||||
Consolidated net income (loss) | 10,235 | (4,422 | ) | (67,498 | ) | (4,387 | ) | (8,185 | ) | ||||||||||
Net loss attributable to non-controlling interest | — | — | — | 761 | 794 | ||||||||||||||
Net income (loss) attributable to Barracuda Networks, Inc. | $ | 10,235 | $ | (4,422 | ) | $ | (67,498 | ) | $ | (3,626 | ) | $ | (7,391 | ) | |||||
Net income (loss) attributable to common stockholders | $ | 10,235 | $ | (4,422 | ) | $ | (67,498 | ) | $ | (3,626 | ) | $ | (9,203 | ) | |||||
Net income (loss) per share attributable to common stockholders: | |||||||||||||||||||
Basic | $ | 0.20 | $ | (0.08 | ) | $ | (1.30 | ) | $ | (0.10 | ) | $ | (0.29 | ) | |||||
Diluted | $ | 0.19 | $ | (0.08 | ) | $ | (1.30 | ) | $ | (0.10 | ) | $ | (0.29 | ) | |||||
Weighted-average shares used to compute net income (loss) per share attributable to common stockholders: | |||||||||||||||||||
Basic | 52,456 | 53,070 | 51,898 | 35,355 | 32,031 | ||||||||||||||
Diluted | 53,572 | 53,070 | 51,898 | 35,355 | 32,031 | ||||||||||||||
_________________
(1) | Includes stock-based compensation expense as follows: |
42
Year Ended February 28/29, | |||||||||||||||||||
2017 | 2016 | 2015 | 2014 | 2013 | |||||||||||||||
(in thousands) | |||||||||||||||||||
Cost of revenue | $ | 1,367 | $ | 1,062 | $ | 389 | $ | 201 | $ | 146 | |||||||||
Research and development | 11,651 | 8,247 | 4,410 | 2,374 | 2,059 | ||||||||||||||
Sales and marketing | 8,074 | 6,566 | 3,811 | 2,067 | 1,182 | ||||||||||||||
General and administrative | 11,613 | 12,971 | 8,448 | 6,195 | 5,400 | ||||||||||||||
$ | 32,705 | $ | 28,846 | $ | 17,058 | $ | 10,837 | $ | 8,787 | ||||||||||
(2) | In the fourth quarter of fiscal 2015, a valuation allowance was established against a significant portion of our deferred tax assets, including U.S. federal and state deferred tax assets, as well as certain foreign deferred tax assets, because realization of these tax benefits through future taxable income did not meet the more-likely-than-not threshold. |
February 28/29, | |||||||||||||||||||
2017 | 2016 | 2015 | 2014 | 2013 | |||||||||||||||
(in thousands) | |||||||||||||||||||
Consolidated Balance Sheet Data: | |||||||||||||||||||
Cash, cash equivalents and marketable securities | $ | 200,109 | $ | 155,048 | $ | 192,127 | $ | 135,879 | $ | 31,645 | |||||||||
Working capital (deficit) (1) | $ | 13,524 | $ | (41,875 | ) | $ | 29,070 | $ | 30,456 | $ | (67,797 | ) | |||||||
Total assets (1) | $ | 464,774 | $ | 419,804 | $ | 389,345 | $ | 350,056 | $ | 212,248 | |||||||||
Deferred revenue, current and non-current | $ | 407,082 | $ | 392,774 | $ | 373,157 | $ | 313,157 | $ | 261,243 | |||||||||
Note payable, current and non-current | $ | 4,115 | $ | 4,383 | $ | 4,635 | $ | 4,872 | $ | 5,094 | |||||||||
Redeemable convertible preferred stock | $ | — | $ | — | $ | — | $ | — | $ | 167,554 | |||||||||
Common stock and additional paid-in capital | $ | 370,798 | $ | 337,491 | $ | 316,088 | $ | 278,603 | $ | 23,108 | |||||||||
Total stockholders’ equity (deficit) (1) | $ | 6,423 | $ | (32,098 | ) | $ | (39,084 | ) | $ | (5,655 | ) | $ | (259,620 | ) | |||||
(1) | In the fourth quarter of fiscal 2015, a valuation allowance was established against a significant portion of our deferred tax assets, including U.S. federal and state deferred tax assets, as well as certain foreign deferred tax assets, because realization of these tax benefits through future taxable income did not meet the more-likely-than-not threshold. |
43
Item 7. Management’s Discussion and Analysis of Financial Condition and Results of Operations
You should read the following discussion and analysis of our financial condition and results of operations together with the consolidated financial statements and related notes that are included elsewhere in this Annual Report on Form 10-K. The last day of our fiscal year is February 28/29. Our fiscal quarters end on May 31, August 31, November 30 and February 28/29. This discussion contains forward-looking statements based upon current expectations that involve risks and uncertainties. Our actual results may differ materially from those anticipated in these forward-looking statements as a result of various factors, including those set forth above in the section titled "Risk Factors" and elsewhere in this Annual Report on Form 10-K.
Overview
Barracuda designs and delivers powerful yet easy-to-use security and data protection solutions. We offer cloud-enabled solutions that empower customers to address security threats, improve network performance and protect and store their data. Our security platform helps customers simplify their IT operations and address their most pressing security needs even as they adopt new deployment models and move applications, data and workloads to the cloud. Our business model is built on the core values of speed and agility, which we apply to all aspects of our approach, including our technology innovations, the delivery and deployment of our solutions and responses to customer inquiries.
We derive revenue from sales of appliances and subscriptions. Revenue from the sale of our appliances includes hardware and a perpetual license. Subscription revenue is generated primarily from our subscription services such as our Barracuda Energize Updates and our cloud solutions. Subscription revenue also includes revenue from fixed term licenses of our managed service provider solutions, virtual appliance software, support and maintenance. Our subscriptions include monthly and annual terms ranging from one to five years, the substantial majority of which are for one-year periods. Subscriptions are billed in advance of the purchased subscription period. Renewal rates from subscriptions, on a dollars basis, have been 92%, 93% and 94% in fiscal 2017, 2016 and 2015, respectively. Subscription annual recurring revenue, which is the annualized dollar amount of recurring subscription revenue in the final month of the fiscal year, increased to $286.3 million for fiscal 2017 from $255.0 million for fiscal 2016.
The growth of our business and our future success depend on many factors, including our ability to continue to expand our customer base, pursue cross-sale opportunities and grow revenues from our existing customer base, expand our distribution channels, particularly internationally, continue to develop new solutions to promptly respond to our customers’ needs and successfully integrate acquisitions into our business. In aligning our investments, product portfolio and routes to market to address our customers' growing adoption of public cloud, SaaS and managed service IT deployment models, we provide a security platform that spans email, management, network and application security as well as data protection, all of which can be deployed and centrally managed across diverse and distributed architectures. As our existing customers’ IT buying needs evolve, or as our customers realize the benefits of the solutions that they previously purchased, our platform provides us an opportunity to cross-sell additional solutions. To support our cross-sell efforts, we intend to continue adding higher touch sales and marketing field resources to liaise with our channel partners as we continue to grow our sales both domestically and internationally. We expect that our continued investment in resources to expand our cross-sell efforts to existing customers will result in longer-term revenue growth opportunities.
In addition to our cross-sell efforts, our sales and marketing initiatives are primarily focused on higher-growth segments within the security and data protection markets. Our future success will depend in part on our ability to continue to timely identify these higher-growth segments and expand our sales within them. While these areas represent significant opportunities for us, they also pose risks and challenges that we must successfully address in order to sustain the growth of our business and improve our operating results.
Furthermore, our business depends on the overall demand for security and data protection solutions. Weak global economic conditions, particularly market and financial uncertainty and instability in the United States and Europe, or a reduction in security and data protection solution spending even if general economic conditions are unaffected, could adversely impact our business, financial condition and operating results in a number of ways. Additionally, we face significant competition across all of our market segments, and must continue to execute across all functions and add qualified personnel to succeed.
Our Business Model
We generally invoice at the time of sale for the total price of the solutions we deliver, and we typically collect cash in 30 to 60 days. We refer to the total amount of invoices we issue in a period as gross billings. All of the gross billings we record are recognized as revenue ratably under U.S. generally accepted accounting principles ("GAAP"), once all revenue recognition
44
criteria have been met. Gross billings are initially recorded as deferred revenue, less reserves. The hardware appliance component of our gross billings is recognized ratably as revenue over the estimated customer relationship period, which is typically three years, commencing upon the activation of the unit by the end customer. The subscription component of our gross billings is recognized ratably as revenue over the contractual period of the subscription. Because we typically bill in advance for the entire term, substantially all of our new and renewal gross billings increase our deferred revenue balance, which contributes significantly to our cash flow.
Components of Results of Operations
Revenue
We generate revenue from the sales of our appliances and subscriptions.
• | Appliance Revenue. Revenue from the sale of our appliances includes hardware and a perpetual software license. We recognize hardware appliance revenue over the estimated customer relationship period of three years, commencing with the end-user’s activation of the appliance and related subscription, provided all other criteria for the recognition of appliance revenue are met. |
• | Subscription Revenue. Subscription revenue is generated primarily from our subscription services such as our Barracuda Energize Updates. Subscription revenue also includes revenue from fixed term licenses of our virtual appliance software, support and maintenance. Our subscription terms include monthly and annual terms ranging from one year to five years, the substantial majority of which are for one year periods. We recognize revenue from subscriptions, support and maintenance over the contractual service period. |
Cost of Revenue
Cost of revenue consists of costs related to our appliance and subscription revenue. Such costs include hardware, manufacturing, shipping and logistics, customer support, royalty, warranty, personnel costs, service delivery and data center costs and amortization of intangible assets related to acquired technology. We expect our cost of revenue to increase in absolute dollars, although it may fluctuate as a percentage of total revenue from period to period, as we continue to grow.
Gross Profit
Gross profit as a percentage of total revenue, or gross margin, has been and will continue to be affected by a variety of factors, including manufacturing costs, cost of technical support and the mix of our solutions sold. We expect our gross profit to fluctuate over time depending on the factors described above.
Operating Expenses
Our operating expenses consist of research and development, sales and marketing and general and administrative expenses. Personnel costs are the most significant component of operating expenses and consist of salaries, benefits, bonuses, stock-based compensation expense and travel-related expenses. Operating expenses also include allocated overhead costs for facilities, IT and depreciation. We expect operating expenses to increase in absolute dollars, although they may fluctuate as a percentage of total revenue from period to period, as we continue to grow. In particular, we expect our stock-based compensation expense to increase in absolute dollars as a result of our existing stock-based compensation expense to be recognized as options and restricted stock units ("RSUs") vest and as we issue additional stock-based awards to attract and retain employees.
• | Research and development. Research and development expenses consist primarily of salaries, benefits and stock-based compensation for employees and executives on our engineering and technical teams who are responsible for increasing the functionality and enhancing the ease-of-use of our appliance and subscription services, as well as the development of new products. We expense our research and development costs as they are incurred. We expect research and development expenses to increase in absolute dollars as we continue to invest in our future solutions, although our research and development expenses may fluctuate as a percentage of total revenue. |
• | Sales and marketing. Our sales and marketing expenses consist primarily of advertising, as well as salaries, commissions, benefits and stock-based compensation for our employees and executives engaged in sales, sales support, marketing, business development and customer service functions. Our advertising expenses include the costs of cooperative marketing programs developed with our channel partners and other marketing programs such as online lead generation, promotional events and web seminars. We market and sell our subscription services worldwide |
45
through our sales organization and distribution channels, such as strategic resellers and distributors. We capitalize and amortize the direct and incremental portion of our sales commissions over the period the related revenue is recognized. We expect sales and marketing expenses to increase in absolute dollars as we continue to introduce marketing campaigns and invest in sales resources in key focus areas, although our sales and marketing expenses may fluctuate as a percentage of total revenue.
• | General and administrative. Our general and administrative expenses consist primarily of salaries, benefits and stock-based compensation for our finance, legal, regulatory and compliance, human resources and other administrative employees and executives. In addition, general and administrative expenses include outside consulting, legal and accounting services and facilities and other supporting overhead costs. We expect general and administrative expenses to increase in absolute dollars due to professional services fees primarily related to outside legal, audit, investor relations and consulting services to support the business, although our general and administrative expenses may fluctuate as a percentage of total revenue. |
Other Income (Expense), Net
Other income (expense), net consists primarily of foreign exchange gains and losses, interest expense on our outstanding debt and interest income earned on our cash, cash equivalents and marketable securities, as well as realized gains and losses from our marketable securities portfolio. We expect interest income will vary each reporting period depending on our average investment balances during the period, types and mix of investments and market interest rates.
Benefit from (Provision for) Income Taxes
Our benefit from (provision for) income taxes consists primarily of federal and state income taxes in the United States and income taxes in foreign jurisdictions in which we conduct business. We estimate income taxes in each of the jurisdictions in which we operate. This process involves determining income tax expense together with calculating the deferred income tax expense related to temporary differences resulting from the differing treatment of items for tax and accounting purposes. Deferred tax assets and liabilities are measured using enacted tax rates in effect for the year in which those temporary differences are expected to be recovered or settled. These temporary differences result in deferred tax assets and liabilities, which are included within our consolidated balance sheets. Deferred tax assets are recognized for deductible temporary differences, along with net operating loss and credits carryforwards, if it is more likely than not that the tax benefits will be realized.
46
Results of Operations
The following tables summarize our consolidated results of operations for the periods presented (dollars in thousands) and as a percentage of our total revenue for those periods.
Year Ended February 28/29, | |||||||||||
2017 | 2016 | 2015 | |||||||||
Revenue: | |||||||||||
Appliance | $ | 82,732 | $ | 89,275 | $ | 83,146 | |||||
Subscription | 269,917 | 230,883 | 194,300 | ||||||||
Total revenue | 352,649 | 320,158 | 277,446 | ||||||||
Cost of revenue | 83,772 | 70,132 | 58,667 | ||||||||
Gross profit | 268,877 | 250,026 | 218,779 | ||||||||
Operating expenses: | |||||||||||
Research and development | 75,070 | 71,251 | 58,737 | ||||||||
Sales and marketing | 129,707 | 138,324 | 125,526 | ||||||||
General and administrative | 42,042 | 47,338 | 35,438 | ||||||||
Total operating expenses | 246,819 | 256,913 | 219,701 | ||||||||
Income (loss) from operations | 22,058 | (6,887 | ) | (922 | ) | ||||||
Other expense, net | (70 | ) | (262 | ) | (3,674 | ) | |||||
Income (loss) before income taxes | 21,988 | (7,149 | ) | (4,596 | ) | ||||||
Benefit from (provision for) income taxes | (11,753 | ) | 2,727 | (62,902 | ) | ||||||
Net income (loss) | $ | 10,235 | $ | (4,422 | ) | $ | (67,498 | ) | |||
Year Ended February 28/29, | ||||||||
2017 | 2016 | 2015 | ||||||
Revenue: | ||||||||
Appliance | 23 | % | 28 | % | 30 | % | ||
Subscription | 77 | 72 | 70 | |||||
Total revenue | 100 | 100 | 100 | |||||
Cost of revenue | 24 | 22 | 21 | |||||
Gross profit | 76 | 78 | 79 | |||||
Operating expenses: | ||||||||
Research and development | 21 | 22 | 21 | |||||
Sales and marketing | 37 | 43 | 45 | |||||
General and administrative | 12 | 15 | 13 | |||||
Total operating expenses | 70 | 80 | 79 | |||||
Income (loss) from operations | 6 | (2 | ) | — | ||||
Other expense, net | — | — | (1 | ) | ||||
Income (loss) before income taxes | 6 | (2 | ) | (1 | ) | |||
Benefit from (provision for) income taxes | (3 | ) | 1 | (23 | ) | |||
Net income (loss) | 3 | % | (1 | )% | (24 | )% | ||
47
Comparison of the Fiscal Years Ended February 28, 2017 and February 29, 2016
Revenue
Year Ended February 28/29, | ||||||||||||||
2017 | 2016 | Change | ||||||||||||
Amount | Amount | Amount | % | |||||||||||
(dollars in thousands) | ||||||||||||||
Appliance | $ | 82,732 | $ | 89,275 | $ | (6,543 | ) | (7 | )% | |||||
Subscription | 269,917 | 230,883 | 39,034 | 17 | ||||||||||
$ | 352,649 | $ | 320,158 | $ | 32,491 | 10 | % | |||||||
Total revenue increased $32.5 million, or 10%, for fiscal 2017 compared to fiscal 2016. Subscription revenue increased by $39.0 million, or 17%, primarily due to a 15% increase in active subscribers from 278,398 active subscribers as of February 29, 2016 to 321,241 active subscribers as of February 28, 2017. The increase in active subscribers was primarily driven by our high level of customer retention and an increase in the number of customers purchasing subscriptions from us. Total appliance revenue decreased by $6.5 million, or 7%, primarily due to the continuing shift by our customers from traditional and solely on-premises deployments to include the cloud, which includes hybrid network architectures, public and/or private clouds, SaaS applications and managed service solutions.
Cost of Revenue and Gross Margin
Year Ended February 28/29, | ||||||||||||||||||||
2017 | 2016 | Change | ||||||||||||||||||
Amount | Gross Margin | Amount | Gross Margin | Amount | % | |||||||||||||||
(dollars in thousands) | ||||||||||||||||||||
Cost of revenue | $ | 83,772 | $ | 70,132 | $ | 13,640 | 19 | % | ||||||||||||
Gross profit | $ | 268,877 | 76 | % | $ | 250,026 | 78 | % | $ | 18,851 | 8 | % | ||||||||
Cost of revenue increased for fiscal 2017 compared to fiscal 2016 commensurate with the increase in total revenue for the comparable periods. Gross margin decreased in fiscal 2017 compared to fiscal 2016, primarily due to product mix shifts and increases of $3.5 million in service delivery costs, $3.5 million in warranty and royalty costs, $1.8 million in amortization of intangible assets and $1.1 million in depreciation expenses. Additionally, our gross margin is generally impacted by the timing of investments in our data center infrastructure and our technical support.
Operating Expenses
Year Ended February 28/29, | ||||||||||||||||||||
2017 | 2016 | Change | ||||||||||||||||||
Amount | % of Total Revenue | Amount | % of Total Revenue | Amount | % | |||||||||||||||
(dollars in thousands) | ||||||||||||||||||||
Research and development | $ | 75,070 | 21 | % | $ | 71,251 | 22 | % | $ | 3,819 | 5 | % | ||||||||
Sales and marketing | 129,707 | 37 | 138,324 | 43 | (8,617 | ) | (6 | ) | ||||||||||||
General and administrative | 42,042 | 12 | 47,338 | 15 | (5,296 | ) | (11 | ) | ||||||||||||
$ | 246,819 | 70 | % | $ | 256,913 | 80 | % | $ | (10,094 | ) | (4 | )% | ||||||||
Research and development expenses increased $3.8 million, or 5%, in fiscal 2017 compared to fiscal 2016 primarily due to increases of $3.4 million in stock-based compensation expense, $1.6 million in consulting costs and $0.7 million in compensation and personnel related costs, partially offset by decreases of $0.8 million in travel and other related costs, $0.5 million in equipment and service expenses, $0.4 million in IT-related infrastructure expenses and $0.1 million in depreciation expense. As a percentage of total revenue, research and development expenses remained relatively consistent year over year.
Sales and marketing expenses decreased $8.6 million, or 6%, in fiscal 2017 compared to fiscal 2016 primarily due to decreases of $15.2 million in marketing and channel partner program expenses, primarily attributable to lower search engine
48
marketing, sponsorship and advertising spend and event and trade show costs, $0.8 million in travel and other related costs and $0.3 million in IT-related infrastructure expenses, partially offset by increases of $5.0 million in compensation and personnel costs, primarily attributable to higher sales commission attainment, $1.5 million in stock-based compensation expense, $0.5 million in consulting costs and $0.4 million in license and service fees. As a percentage of total revenue, sales and marketing expenses decreased year over year primarily due to the timing and nature of marketing campaigns.
General and administrative expenses decreased $5.3 million, or 11%, in fiscal 2017 compared to fiscal 2016 primarily due to decreases of $4.2 million in legal and settlement costs, which included a $2.3 million settlement charge for intellectual property matters and a $1.5 million settlement of an export compliance matter in fiscal 2016, $1.4 million in stock-based compensation expense, $0.5 million in travel and other related costs, $0.4 million in consulting costs and $0.3 million in equipment and software expense, partially offset by increases of $0.5 million in bad debt expense, $0.5 million in compensation and personnel related costs, $0.4 million in depreciation expense and $0.1 million in payment processing costs. As a percentage of total revenue, general and administrative expenses decreased year over year due to the legal and settlement costs associated with the matters noted above not recurring in fiscal 2017.
Other Expense, Net
Year Ended February 28/29, | |||||||||||||
2017 | 2016 | Change | |||||||||||
Amount | Amount | Amount | % | ||||||||||
(dollars in thousands) | |||||||||||||
Other expense, net | $ | (70 | ) | $ | (262 | ) | $ | 192 | NM | ||||
The change in other expense, net was due primarily to an increase of $1.1 million in realized gains from the sale of marketable securities, partially offset by an increase of $0.8 million in net foreign exchange losses during fiscal 2017 compared to fiscal 2016.
Benefit from (Provision for) Income Taxes
Year Ended February 28/29, | |||||||||||||
2017 | 2016 | Change | |||||||||||
Amount | Amount | Amount | % | ||||||||||
(dollars in thousands) | |||||||||||||
Benefit from (provision for) income taxes | $ | (11,753 | ) | $ | 2,727 | $ | (14,480 | ) | NM | ||||
We recorded an income tax provision of $11.8 million for fiscal 2017 and an income tax benefit of $2.7 million for fiscal 2016. We established a valuation allowance in fiscal 2015 against a significant portion of our deferred tax assets, including U.S. federal and state deferred tax assets, as well as certain foreign deferred tax assets, because realization of these tax benefits through future taxable income does not meet the more-likely-than-not threshold. We intend to maintain the valuation allowance until sufficient positive evidence exists to support its reversal. The difference between the income tax provision that would be derived by applying the statutory rate to our income before tax and the income tax provision actually recorded for fiscal 2017 is primarily due to the temporary differences, which we do not expect to benefit from due to our valuation allowance, non-deductible stock-based compensation expense and other currently non-deductible items.
Comparison of the Fiscal Years Ended February 29, 2016 and February 28, 2015
Revenue
Year Ended February 28/29, | ||||||||||||||
2016 | 2015 | Change | ||||||||||||
Amount | Amount | Amount | % | |||||||||||
(dollars in thousands) | ||||||||||||||
Appliance | $ | 89,275 | $ | 83,146 | $ | 6,129 | 7 | % | ||||||
Subscription | 230,883 | 194,300 | 36,583 | 19 | ||||||||||
$ | 320,158 | $ | 277,446 | $ | 42,712 | 15 | % | |||||||
49
Total revenue increased $42.7 million, or 15%, for fiscal 2016 compared to fiscal 2015. Subscription revenue increased by $36.6 million, or 19%, primarily due to a 14% increase in active subscribers from 243,578 active subscribers as of February 28, 2015 to 278,398 active subscribers as of February 29, 2016. The increase in active subscribers was primarily driven by our high level of customer retention and an increase in the number of customers purchasing subscriptions from us. Total appliance revenue grew by $6.1 million, or 7%, due to increased demand for our solutions, however, the growth rate decreased from the previous period due to an increasing number of customers shifting from traditional and solely on-premises deployments to include the cloud.
Cost of Revenue and Gross Margin
Year Ended February 28/29, | ||||||||||||||||||||
2016 | 2015 | Change | ||||||||||||||||||
Amount | Gross Margin | Amount | Gross Margin | Amount | % | |||||||||||||||
(dollars in thousands) | ||||||||||||||||||||
Cost of revenue | $ | 70,132 | $ | 58,667 | $ | 11,465 | 20 | % | ||||||||||||
Gross profit | $ | 250,026 | 78 | % | $ | 218,779 | 79 | % | $ | 31,247 | 14 | % | ||||||||
Cost of revenue increased for fiscal 2016 compared to fiscal 2015 commensurate with the increase in appliance and subscription revenue for the comparable periods. Gross margin decreased slightly in fiscal 2016 compared to fiscal 2015. The slight decrease was primarily due to product mix shifts and increased amortization of intangible assets and depreciation expenses. Additionally, our gross margin is generally impacted by the timing of investments in our data center infrastructure and our technical support.
Operating Expenses
Year Ended February 28/29, | ||||||||||||||||||||
2016 | 2015 | Change | ||||||||||||||||||
Amount | % of Total Revenue | Amount | % of Total Revenue | Amount | % | |||||||||||||||
(dollars in thousands) | ||||||||||||||||||||
Research and development | $ | 71,251 | 22 | % | $ | 58,737 | 21 | % | $ | 12,514 | 21 | % | ||||||||
Sales and marketing | 138,324 | 43 | 125,526 | 45 | 12,798 | 10 | ||||||||||||||
General and administrative | 47,338 | 15 | 35,438 | 13 | 11,900 | 34 | ||||||||||||||
$ | 256,913 | 80 | % | $ | 219,701 | 79 | % | $ | 37,212 | 17 | % | |||||||||
Research and development expenses increased $12.5 million, or 21%, in fiscal 2016 compared to fiscal 2015 primarily due to increases of $5.9 million in compensation and personnel related costs primarily attributable to a 9% increase in the average research and development headcount throughout fiscal 2016 compared to fiscal 2015 and our acquisition of Intronis in October 2015, $3.8 million in stock-based compensation expense, $0.9 million in consulting costs, $0.8 million in IT-related infrastructure expenses, $0.4 million in equipment and service expenses, $0.3 million in travel and other related costs and $0.2 million in license and service fees. As a percentage of total revenue, research and development expenses remained consistent year over year.
Sales and marketing expenses increased $12.8 million, or 10%, in fiscal 2016 compared to fiscal 2015 primarily due to increases of $7.6 million in compensation and personnel related costs, primarily attributable to an 18% increase in the average sales and marketing headcount throughout fiscal 2016 compared to fiscal 2015 and our acquisition of Intronis, $2.8 million in stock-based compensation expense, $1.2 million in amortization expense associated with the acquisition of Intronis and impairment charges related to certain acquisition-related customer relationship assets and $0.7 million in IT-related infrastructure expenses. As a percentage of total revenue, sales and marketing expenses slightly decreased year over year primarily due to a reversal of estimated contingent consideration obligations, which resulted in a $1.3 million reduction of compensation and personnel related costs.
General and administrative expenses increased $11.9 million, or 34%, in fiscal 2016 compared to fiscal 2015 primarily due to increases of $4.8 million in legal, compliance and consulting costs, which included a $2.3 million settlement charge for intellectual property matters and a $1.5 million settlement related to export compliance, $4.5 million in stock-based
50
compensation expense, $0.9 million in compensation and personnel related costs, primarily attributable to a 4% increase in the average general and administrative headcount throughout fiscal 2016 compared to fiscal 2015 and our acquisition of Intronis, $0.6 million in equipment and software expense, $0.6 million in depreciation expense and $0.2 million in payment processing costs. As a percentage of total revenue, general and administrative expenses slightly increased year over year primarily due to increased legal and settlement costs.
Other Expense, Net
Year Ended February 28/29, | |||||||||||||
2016 | 2015 | Change | |||||||||||
Amount | Amount | Amount | % | ||||||||||
(dollars in thousands) | |||||||||||||
Other expense, net | $ | (262 | ) | $ | (3,674 | ) | $ | 3,412 | NM | ||||
The change in other expense, net was due primarily to a decrease of $3.5 million in net foreign exchange losses during fiscal 2016 compared to fiscal 2015.
Benefit from (Provision for) Income Taxes
Year Ended February 28/29, | |||||||||||||
2016 | 2015 | Change | |||||||||||
Amount | Amount | Amount | % | ||||||||||
(dollars in thousands) | |||||||||||||
Benefit from (provision for) income taxes | $ | 2,727 | $ | (62,902 | ) | $ | 65,629 | NM | |||||
We recorded an income tax benefit of $2.7 million for fiscal 2016 and an income tax provision of $62.9 million for fiscal 2015. We established a valuation allowance in fiscal 2015 against a significant portion of our deferred tax assets, including U.S. federal and state deferred tax assets, as well as certain foreign deferred tax assets, because realization of these tax benefits through future taxable income does not meet the more-likely-than-not threshold. We intend to maintain the valuation allowances until sufficient positive evidence exists to support the reversal of the valuation allowances. The difference between the income tax benefit that would be derived by applying the statutory rate to our loss before tax and the income tax benefit actually recorded for fiscal 2016 is primarily due to the change in the valuation allowance, as well as non-deductible stock-based compensation expense and other currently non-deductible items, offset by the tax benefit from the tax credits.
Quarterly Results of Operations
The following tables set forth selected unaudited quarterly consolidated statements of operations data for each of the eight quarters in the period ended February 28, 2017, as well as the percentage that each line item represents of total revenue. The information for each of these quarters has been prepared on the same basis as the audited annual financial statements included elsewhere in this Annual Report on Form 10-K and, in the opinion of management, includes all adjustments, which includes only normal recurring adjustments, necessary for the fair presentation of the results of operations for these periods in accordance with GAAP. This data should be read in conjunction with our audited consolidated financial statements and related notes included in Item 8 of this Annual Report on Form 10-K. The results of historical periods are not necessarily indicative of the results of operations for a full year or any future period.
51
Three Months Ended | |||||||||||||||||||||||||||||||
February 28, 2017 | November 30, 2016 | August 31, 2016 | May 31, 2016 | February 29, 2016 | November 30, 2015 | August 31, 2015 | May 31, 2015 | ||||||||||||||||||||||||
(in thousands) | |||||||||||||||||||||||||||||||
Revenue: | |||||||||||||||||||||||||||||||
Appliance | $ | 19,908 | $ | 20,457 | $ | 21,034 | $ | 21,333 | $ | 21,650 | $ | 21,655 | $ | 22,288 | $ | 23,682 | |||||||||||||||
Subscription | 69,351 | 68,349 | 66,896 | 65,321 | 62,076 | 58,432 | 56,083 | 54,292 | |||||||||||||||||||||||
Total revenue | 89,259 | 88,806 | 87,930 | 86,654 | 83,726 | 80,087 | 78,371 | 77,974 | |||||||||||||||||||||||
Cost of revenue | 22,193 | 21,098 | 20,240 | 20,241 | 19,879 | 18,352 | 15,935 | 15,966 | |||||||||||||||||||||||
Gross profit | 67,066 | 67,708 | 67,690 | 66,413 | 63,847 | 61,735 | 62,436 | 62,008 | |||||||||||||||||||||||
Operating expenses: | |||||||||||||||||||||||||||||||
Research and development | 18,790 | 18,627 | 18,446 | 19,207 | 17,120 | 18,629 | 17,502 | 18,000 | |||||||||||||||||||||||
Sales and marketing | 32,865 | 33,368 | 32,144 | 31,330 | 33,504 | 36,218 | 34,470 | 34,132 | |||||||||||||||||||||||
General and administrative | 10,084 | 10,217 | 10,969 | 10,772 | 10,998 | 14,872 | 10,770 | 10,698 | |||||||||||||||||||||||
Total operating expenses | 61,739 | 62,212 | 61,559 | 61,309 | 61,622 | 69,719 | 62,742 | 62,830 | |||||||||||||||||||||||
Income (loss) from operations | 5,327 | 5,496 | 6,131 | 5,104 | 2,225 | (7,984 | ) | (306 | ) | (822 | ) | ||||||||||||||||||||
Other income (expense), net | (201 | ) | (2,374 | ) | 1,515 | 990 | 604 | (395 | ) | 97 | (568 | ) | |||||||||||||||||||
Income (loss) before income taxes | 5,126 | 3,122 | 7,646 | 6,094 | 2,829 | (8,379 | ) | (209 | ) | (1,390 | ) | ||||||||||||||||||||
Benefit from (provision for) income taxes | (1,905 | ) | (1,329 | ) | (5,209 | ) | (3,310 | ) | 406 | 6,793 | (2,030 | ) | (2,442 | ) | |||||||||||||||||
Net income (loss) | $ | 3,221 | $ | 1,793 | $ | 2,437 | $ | 2,784 | $ | 3,235 | $ | (1,586 | ) | $ | (2,239 | ) | $ | (3,832 | ) | ||||||||||||
Net income (loss) per share – basic | $ | 0.06 | $ | 0.03 | $ | 0.05 | $ | 0.05 | $ | 0.06 | $ | (0.03 | ) | $ | (0.04 | ) | $ | (0.07 | ) | ||||||||||||
Net income (loss) per share – diluted | $ | 0.06 | $ | 0.03 | $ | 0.05 | $ | 0.05 | $ | 0.06 | $ | (0.03 | ) | $ | (0.04 | ) | $ | (0.07 | ) | ||||||||||||
52
Three Months Ended | |||||||||||||||||||||||
February 28, 2017 | November 30, 2016 | August 31, 2016 | May 31, 2016 | February 29, 2016 | November 30, 2015 | August 31, 2015 | May 31, 2015 | ||||||||||||||||
Revenue: | |||||||||||||||||||||||
Appliance | 22 | % | 23 | % | 24 | % | 25 | % | 26 | % | 27 | % | 28 | % | 30 | % | |||||||
Subscription | 78 | 77 | 76 | 75 | 74 | 73 | 72 | 70 | |||||||||||||||
Total revenue | 100 | 100 | 100 | 100 | 100 | 100 | 100 | 100 | |||||||||||||||
Cost of revenue | 25 | 24 | 23 | 23 | 24 | 23 | 20 | 20 | |||||||||||||||
Gross profit | 75 | 76 | 77 | 77 | 76 | 77 | 80 | 80 | |||||||||||||||
Operating expenses: | |||||||||||||||||||||||
Research and development | 21 | 21 | 21 | 22 | 20 | 23 | 22 | 23 | |||||||||||||||
Sales and marketing | 37 | 38 | 37 | 36 | 40 | 45 | 44 | 44 | |||||||||||||||
General and administrative | 11 | 11 | 12 | 12 | 13 | 19 | 14 | 14 | |||||||||||||||
Total operating expenses | 69 | 70 | 70 | 70 | 73 | 87 | 80 | 81 | |||||||||||||||
Income (loss) from operations | 6 | 6 | 7 | 7 | 3 | (10 | ) | — | (1 | ) | |||||||||||||
Other income (expense), net | — | (2 | ) | 2 | 1 | 1 | — | — | (1 | ) | |||||||||||||
Income (loss) before income taxes | 6 | 4 | 9 | 8 | 4 | (10 | ) | — | (2 | ) | |||||||||||||
Benefit from (provision for) income taxes | (2 | ) | (2 | ) | (6 | ) | (4 | ) | — | 8 | (3 | ) | (3 | ) | |||||||||
Net income (loss) | 4 | % | 2 | % | 3 | % | 4 | % | 4 | % | (2 | )% | (3 | )% | (5 | )% | |||||||
Quarterly Revenue Trends
Our quarterly total revenue has increased sequentially for all periods presented. In the three months ended February 28, 2017, our subscription revenue increased by $1.0 million, or 1%, from $68.3 million in the three months ended November 30, 2016 to $69.4 million in the three months ended February 28, 2017. Our subscription revenue has continued to grow, while our appliance revenue has declined primarily due to the continuing shift by our customers from traditional and solely on-premises deployments to include the cloud.
Our total revenue has not been significantly impacted by seasonality.
Quarterly Gross Margin Trends
Gross profit increased sequentially for all periods presented, except the fourth quarter of fiscal 2017 and the third quarter of fiscal 2016, and total gross margin was between 75% and 80% for all periods presented. Our cost of revenue has increased as a function of gross billings growth. The decrease in gross margins is primarily due to increased investments to support our cloud-based solutions, including the expansion of our data center infrastructure, product mix shifts and increased service delivery costs, warranty and royalty costs, and amortization of intangible assets related to the acquisition of Intronis.
Quarterly Operating Expenses Trends
As a percentage of revenue, quarterly operating expenses decreased sequentially, except for the third quarter of fiscal 2016, primarily due to better leverage in our cost structure, our narrowing product focus and lower sales and marketing spend. The timing of acquisition and other charges also impacted our operating expenses. In fiscal 2016, we incurred charges associated with the resolution of a self-reported export compliance matter, the settlement of an intellectual property matter and transaction costs associated with our acquisitions, which primarily caused the higher operating expenses in the third quarter of fiscal 2016. Our sales and marketing expenses may experience variability based on the timing of our marketing programs and will be dependent on the timing of strategic initiatives and investment opportunities.
53
Liquidity and Capital Resources
Year Ended February 28/29, | |||||||||||
2017 | 2016 | 2015 | |||||||||
(in thousands) | |||||||||||
Net cash provided by operating activities | $ | 65,203 | $ | 49,266 | $ | 54,104 | |||||
Net cash used in investing activities | $ | (59,364 | ) | $ | (61,744 | ) | $ | (59,539 | ) | ||
Net cash provided by (used in) financing activities | $ | (4,117 | ) | $ | (20,396 | ) | $ | 21,704 | |||
As of February 28, 2017, we had cash and cash equivalents of $120.2 million, of which approximately $16.2 million was held outside of the United States and not presently available to fund domestic operations and obligations. In addition, we held marketable securities of $79.9 million as of February 28, 2017. If we were to repatriate cash held outside of the United States, it could be subject to U.S. income taxes, less any previously paid foreign income taxes.
Furthermore, we renewed our $25.0 million credit facility with Silicon Valley Bank (“SVB”) to expire in November 2017. The credit facility includes an option to request an increase of the available funds to $50.0 million and is secured by a security interest on substantially all of our assets and contains restrictive covenants. Upon drawing the credit facility, the financial covenants will require us to maintain a minimum adjusted EBITDA, as defined in the credit facility, and a minimum adjusted quick ratio. The credit facility also sets forth specified events of default. No amounts had been drawn under the credit facility through February 28, 2017.
We believe that our existing cash, cash equivalents and marketable securities, our available credit facility and net cash provided by operating activities will be sufficient to meet our working capital and capital expenditure requirements, as well as to fund any principal and interest payments on notes payable and repurchases of our common stock, for at least the next 12 months. Our future capital requirements will depend on many factors including our growth rate, the timing and extent of spending to support development efforts, the expansion of sales and marketing activities, the introduction of new and enhanced solutions and service offerings and the continuing market acceptance of our solutions. In the event that additional financing is required from outside sources, we may not be able to raise it on terms acceptable to us or at all. If we are unable to raise additional capital when desired, our business, operating results and financial condition would be adversely affected.
In addition, as described in the section "Legal Proceedings" we are currently involved in ongoing litigation. Any adverse settlements or judgments in any litigation could have a material adverse impact on our results of operations, cash balances and cash flows in the period in which such events occur.
Operating Activities
Our primary source of cash from operating activities has been from cash collections from our customers. We expect cash inflows from operating activities to be affected by increases in sales and timing of collections. Our primary uses of cash from operating activities have been for personnel costs and investment in sales and marketing and research and development infrastructure. We expect cash outflows from operating activities to be affected by increases in sales and increases in personnel costs as we grow our business.
For fiscal 2017, operating activities provided $65.2 million in cash as a result of non-cash charges of $49.1 million related to stock-based compensation, depreciation and amortization expenses, our net income of $10.2 million and a positive change of $6.6 million in our net operating assets and liabilities. The net change in our operating assets and liabilities was primarily the result of a $14.5 million increase in deferred revenue due to an increase in sales.
For fiscal 2016, operating activities provided $49.3 million in cash as a result of non-cash charges of $30.9 million and a net change of $22.8 million in our net operating assets and liabilities, partially offset by a net loss of $4.4 million. Non-cash charges primarily included changes in deferred income taxes, stock-based compensation and depreciation, amortization and impairment expenses. The net change in our operating assets and liabilities was primarily the result of a $19.0 million increase in deferred revenue due to an increase in sales.
For fiscal 2015, operating activities provided $54.1 million in cash as a result of non-cash charges of $76.5 million and a net change of $45.1 million in our net operating assets and liabilities, partially offset by a net loss of $67.5 million. Non-cash charges primarily included changes in deferred income taxes and stock-based compensation, depreciation and amortization expenses. The non-cash change in deferred income taxes was primarily due to a valuation allowance established against significant portion of our deferred tax assets, including U.S. federal and state deferred tax assets, as well as certain foreign
54
deferred tax assets. The net change in our operating assets and liabilities was primarily the result of a $59.3 million increase in deferred revenue due to an increase in sales, which also resulted in an offsetting effect from increased accounts receivable of $12.9 million.
Investing Activities
Our investing activities have generally consisted of transactions related to marketable and non-marketable securities, purchases of property and equipment and activity in connection with acquisitions. We expect to continue to purchase property and equipment to support the continued growth of our business as well as continue to invest in our data center infrastructure.
For fiscal 2017, cash used in investing activities was $59.4 million and primarily related to purchases of marketable securities of $74.5 million, acquisition related payments of $7.0 million, purchases of property and equipment of $6.3 million, purchases of intangible assets of $1.4 million, and purchases of non-marketable investments of $1.2 million, partially offset by proceeds from the sale and maturity of marketable securities of $31.1 million.
For fiscal 2016, cash used in investing activities was $61.7 million and primarily related to our acquisition of Intronis and other acquisition related payments of $56.9 million, purchases of marketable securities of $26.0 million, purchases of property and equipment of $7.8 million and investments of $1.4 million in non-marketable securities, partially offset by proceeds from the sale and maturity of certain marketable securities of $30.4 million.
For fiscal 2015, cash used in investing activities was $59.5 million and primarily related to purchases of marketable and non-marketable securities of $43.2 million, purchases of property and equipment of $12.5 million and our acquisition of C2C and acquisition related escrow payments of $4.8 million.
Our annual capital expenditures generally have varied between approximately 2% and 5% of annual total revenue. We believe future capital expenditures are likely to be consistent with historical experience with variations above or below the range depending upon specific strategic opportunities.
Financing Activities
Our financing activities generally consist of equity related transactions, including proceeds from the exercises of employee stock options, excess tax benefits from equity incentive plans and tax payments associated with the net share settlements of equity awards and repurchases of common stock.
For fiscal 2017, cash used in financing activities was $4.1 million and primarily related to repurchases of our common stock of $7.6 million and tax payments of $7.1 million related to net share settlements of equity awards. These cash outflows were partially offset by proceeds from stock option exercises of $8.9 million and excess tax benefits from equity compensation plans of $1.9 million.
For fiscal 2016, cash used in financing activities was $20.4 million and primarily related to repurchases of our common stock of $19.2 million, tax payments of $6.7 million related to net share settlements of equity awards and payments of $2.5 million related to remittances to tax authorities for employee equity transactions. These cash outflows were partially offset by proceeds from stock option exercises of $4.8 million and excess tax benefits from equity compensation plans of $3.8 million.
For fiscal 2015, financing activities provided $21.7 million in cash primarily as a result of proceeds from exercises of employee stock options of $16.5 million and the excess tax benefits of $9.0 million associated with such transactions, partially offset by $5.4 million in taxes paid for the net settlement of equity awards.
Key Metrics
We monitor the following key metrics to help us evaluate growth trends, establish budgets and assess operational efficiencies. In addition to our results determined in accordance with GAAP, we believe the following non-GAAP and operational measures are useful in evaluating our operating performance.
The following presents our key metrics and provides reconciliations of the most directly comparable GAAP financial measure to each non-GAAP financial measure (in thousands, except active subscribers and percentages).
55
Year Ended February 28/29, | |||||||||||
2017 | 2016 | 2015 | |||||||||
Gross billings | $ | 402,117 | $ | 377,515 | $ | 364,292 | |||||
Year-over-year percentage increase | 7 | % | 4 | % | 18 | % | |||||
Year-over-year percentage increase on a constant currency basis (1) | 7 | % | 6 | % | 18 | % | |||||
Adjusted EBITDA (2) | $ | 71,806 | $ | 40,247 | $ | 27,057 | |||||
Adjusted EBITDA as a percentage of total revenue | 20 | % | 13 | % | 10 | % | |||||
Free cash flow (2) | $ | 58,868 | $ | 41,448 | $ | 41,587 | |||||
Free cash flow as a percentage of total revenue | 17 | % | 13 | % | 15 | % | |||||
Active subscribers at period end | 321,241 | 278,398 | 243,578 | ||||||||
_________________
(1) | In order to determine how our business performed exclusive of the effect of foreign currency fluctuations, we compare the percentage change in our gross billings from one period to another using a constant currency. To present this gross billings information, the current and comparative prior period results for entities that operate in other than U.S. dollars are converted into U.S. dollars at constant exchange rates. For example, the rates in effect at February 29, 2016, which was the last day of our prior fiscal year, were used to convert current and comparable prior period gross billings rather than the actual exchange rates in effect during the respective period. |
(2) | Beginning in the third quarter of fiscal 2017, we modified our reporting practices to comply with recent SEC interpretations on the use of non-GAAP measures. As a result, we have modified our historical presentation of adjusted EBITDA and will no longer adjust for changes in deferred revenue and associated deferred costs in our calculation of adjusted EBITDA. Additionally, we have modified our historical presentation of adjusted free cash flow and will no longer adjust free cash flow for the cash payment impact of acquisition and other charges. Refer to the "Acquisition and Other Charges" section below for additional details. These changes do not impact our current and historical presentation of GAAP results. Prior period information has been recast to conform to the adjusted calculations. |
Gross billings. We define gross billings as total revenue plus the change in deferred revenue and other adjustments which primarily reflect returns and reserves during a particular period. We use gross billings as a performance measurement, based on our business model of invoicing our customers at the time of sale of our solutions and recognizing revenue ratably over subsequent periods. Accordingly, we believe gross billings provide valuable insight into the sales of our solutions and the performance of our business. The gross billings we record in any period reflect sales to new customers plus renewals and additional sales to existing customers adjusted for returns, rebates and other offsets, which we do not expect to be recognized as revenue in future periods. In many cases, these returns, rebates and other offsets occur in periods different from the period of sale and are unrelated to the marketing efforts leading to the initial sale, and therefore by adjusting for such offsets, we believe our computation of gross billings better reflects the effectiveness of our sales and marketing efforts.
The following table reconciles total revenue to gross billings (in thousands, except percentages):
Year Ended February 28/29, | |||||||||||
2017 | 2016 | 2015 | |||||||||
Total revenue | $ | 352,649 | $ | 320,158 | $ | 277,446 | |||||
Total deferred revenue, end of period (1) | 407,082 | 392,774 | 372,862 | ||||||||
Less: total deferred revenue, beginning of period (1) | (392,774 | ) | (372,862 | ) | (313,157 | ) | |||||
Add: deferred revenue adjustments | 35,160 | 37,445 | 27,141 | ||||||||
Total change in deferred revenue and adjustments | 49,468 | 57,357 | 86,846 | ||||||||
Gross billings | $ | 402,117 | $ | 377,515 | $ | 364,292 | |||||
Year-over-year percentage increase | 7 | % | 4 | % | 18 | % | |||||
Year-over-year percentage increase on a constant currency basis (2) | 7 | % | 6 | % | 18 | % | |||||
_________________
(1) | The balances for the prior fiscal years' comparable periods presented exclude any amounts related to the acquisition date deferred revenue assumed from C2C Systems Limited ("C2C"), which closed in the second quarter of fiscal 2015. We believe adjusting for the fair value of the assumed performance obligation allows us to better compare gross billings from period to period in order to assess the ongoing results of our business. |
(2) | In order to determine how our business performed exclusive of the effect of foreign currency fluctuations, we compare the percentage change in our gross billings from one period to another using a constant currency. To present this gross |
56
billings information, the current and comparative prior period results for entities that operate in other than U.S. dollars are converted into U.S. dollars at constant exchange rates. For example, the rates in effect at February 29, 2016, which was the last day of our prior fiscal year, were used to convert current and comparable prior period gross billings rather than the actual exchange rates in effect during the respective period.
Gross billings increased 7% from fiscal 2016 to 2017 and 4% from fiscal 2015 to 2016. The increases in gross billings were primarily driven by our continued ability to cross-sell additional solutions to existing customers and the growth in our renewal subscriptions as a result of our high level of customer retention as well as additional lead generation opportunities and associated new customer billings. In fiscal 2017, the increase was primarily due to increased sales of our core products, such as our NextGen Firewall and Web Application Firewall solutions and the Barracuda Essentials product suite, the addition of gross billings attributable to Intronis and increased sales of our managed service solutions due primarily to the expansion of our managed service provider channel through the addition of new partners and products to the Intronis platform. The decrease in the growth rate of gross billings for fiscal 2016, as compared to fiscal 2015, was primarily driven by weakness experienced in EMEA and in our data protection business. Additionally, in fiscal 2017 and 2016, we observed a shift by our customers from traditional and solely on-premises deployments to include the cloud, which includes hybrid network architectures, public and/or private clouds, SaaS applications and managed service solutions. These trends have led to longer sales cycles and delays in buying decisions, as well as more customers electing one-year renewal terms rather than multi-year arrangements as they evaluated their long-term strategies. When evaluating our gross billings from period to period, we also evaluate our gross billings for the comparable period using a fixed exchange rate, thereby excluding the effect of currency fluctuations.
Adjusted EBITDA. We define adjusted EBITDA as net income (loss) plus non-cash and non-operating charges, which include: (i) other expense, net, (ii) provision for (benefit from) income taxes, (iii) acquisition and other charges, (iv) stock-based compensation expense, (v) amortization of intangible assets, including certain losses on disposal and impairment of intangible assets, and (vi) depreciation expense, including certain losses on disposal of fixed assets. Because adjusted EBITDA excludes certain non-cash and non-operating charges, this measure enables us to eliminate the impact of items we do not consider indicative of our ongoing operating performance, and therefore provides a better indication of profitability from our operations, and provides a consistent measure of our performance from period to period. Prior period information has been recast to conform to the current period presentation and excludes changes in deferred revenue and associated deferred costs in our calculation of adjusted EBITDA.
The following table reconciles net income (loss) to adjusted EBITDA (in thousands, except percentages):
Year Ended February 28/29, | |||||||||||
2017 | 2016 | 2015 | |||||||||
Net income (loss) | $ | 10,235 | $ | (4,422 | ) | $ | (67,498 | ) | |||
Other expense, net | 70 | 262 | 3,674 | ||||||||
Provision for (benefit from) income taxes | 11,753 | (2,727 | ) | 62,902 | |||||||
Depreciation, amortization and impairment expense (1) | 16,431 | 13,300 | 8,631 | ||||||||
Stock-based compensation expense | 32,705 | 28,846 | 17,058 | ||||||||
Acquisition and other charges (2) | 612 | 4,988 | 2,290 | ||||||||
Adjusted EBITDA | $ | 71,806 | $ | 40,247 | $ | 27,057 | |||||
Adjusted EBITDA as a percentage of total revenue | 20 | % | 13 | % | 10 | % | |||||
_________________
(1) | Represents expenses for the amortization of intangible assets and property and equipment, as well as certain losses on disposal and impairment of long-lived assets. |
(2) | In calculating adjusted EBITDA, we also adjust for acquisition and other charges that we are non-recurring, infrequent and/or unusual in nature, can vary significantly in amount and frequency and are unrelated to our ongoing operating performance. We believe that adjusting for these charges allows us to better compare adjusted EBITDA from period to period in order to assess the ongoing operating results of our business. Refer to the "Acquisition and Other Charges" section below for additional details regarding these charges. |
Adjusted EBITDA increased from $27.1 million in fiscal 2015 to $40.2 million in fiscal 2016 and $71.8 million in fiscal 2016. The increases in adjusted EBITDA were primarily driven by better leverage in our cost structure, our narrowing product focus and lower sales and marketing spend.
57
Free cash flow. We define free cash flow as net cash provided by operating activities, less purchases of property and equipment. We consider free cash flow to be a useful liquidity measure that considers the investment in cloud and corporate infrastructure required to support our business. We use free cash flow to assess our business performance and evaluate the amount of cash generated by our business after adjusting for purchases of property and equipment. Prior period information has been recast to conform to the current period presentation of free cash flow and excludes the cash payment impact of acquisition and other charges.
The following table reconciles cash provided by operating activities to free cash flow (in thousands, except percentages):
Year Ended February 28/29, | |||||||||||
2017 | 2016 | 2015 | |||||||||
Net cash provided by operating activities | $ | 65,203 | $ | 49,266 | $ | 54,104 | |||||
Less: purchases of property and equipment | (6,335 | ) | (7,818 | ) | (12,517 | ) | |||||
Free cash flow | $ | 58,868 | $ | 41,448 | $ | 41,587 | |||||
Free cash flow as a percentage of total revenue | 17 | % | 13 | % | 15 | % | |||||
Free cash flow was consistent from fiscal 2015 to fiscal 2016 and increased from $41.4 million in fiscal 2016 to $58.9 million in fiscal 2017. The increase in free cash flow in fiscal 2017 was driven primarily by a $15.9 million increase in net cash provided by operating activities as we incurred lower sales and marketing expenses in fiscal 2017 due to the timing and nature of certain marketing campaigns.
Active subscribers. We define an active subscriber as a discrete appliance, virtual appliance or cloud-only service that has activated at least one valid subscription that has not been terminated. We monitor the total number of active subscribers as a measure of the growth in our installed base, the success of our sales and marketing activities and the value that our solutions bring to our customers. As of February 28, 2017, February 29, 2016 and February 28, 2015, we had 321,241, 278,398 and 243,578 active subscribers, respectively. The increase in active subscribers over these periods is primarily related to our ability to attract and acquire new customers. In fiscal 2017, we renewed 92% of the expiring subscriptions, on a dollar basis, as we continued to see more customers opt for ratable subscription form factors and shorter contract lengths.
Our non-GAAP measures have limitations as analytical tools and you should not consider them in isolation or as a substitute for an analysis of our results under GAAP. There are a number of limitations related to the use of these non-GAAP financial measures versus their nearest GAAP equivalents. First, gross billings, adjusted EBITDA and free cash flow are not substitutes for total revenue, net income (loss) and cash provided by operating activities, respectively. Second, other companies may calculate non-GAAP financial measures differently or may use other measures to evaluate their performance, all of which could reduce the usefulness of our non-GAAP financial measures as tools for comparison. Finally, adjusted EBITDA excludes some costs, namely, non-cash stock-based compensation and depreciation, amortization and impairment expenses, which are recurring. Therefore adjusted EBITDA does not reflect the non-cash impact of stock-based compensation expense or working capital needs that will continue for the foreseeable future.
Acquisition and Other Charges
In calculating adjusted EBITDA, we exclude certain expense items resulting from acquisitions and other charges, which we believe are non-recurring, infrequent and/or unusual in nature, can vary significantly in amount and frequency and are unrelated to our ongoing operating performance indicative of ongoing operating performance or do not expect to recur in our continuing operating results. We believe that adjusting for these charges allows us to better compare adjusted EBITDA from period to period in order to assess the ongoing operating results of our business. We refer to costs related to our acquisitions, export compliance and intellectual property settlement as our "acquisition and other charges" throughout this Annual Report on Form 10-K. These costs consist of the following:
Acquisition and other costs. Acquisition costs (including costs associated with prospective acquisitions) include acquisition-related expenses for legal, accounting and other professional fees, integration costs, fair value remeasurements of contingent consideration obligations and contingent consideration payments made under the terms of acquisition agreements. We believe these costs are unpredictable, can vary based on the size and complexity of each transaction, and are unrelated to our core operations or those of acquired businesses. Other costs include legal expenses incurred in connection with the C2C litigation matter involving R. David Hunt, as Seller Representative of the stockholders of C2C, and costs that are non-recurring, infrequent and/or unusual in nature and can vary significantly in amount and frequency. The acquisition and other costs are classified within operating expenses in our consolidated statements of operations.
58
Export compliance. Export compliance costs include the settlement payments and the legal expenses incurred in connection with an internal investigation of our export controls compliance procedures and the submission and final resolution of all issues associated with our voluntary self-disclosures to the U.S. government in this regard. These costs are classified as general and administrative expenses in our consolidated statements of operations.
Intellectual property settlement. Intellectual property settlement costs represent the allocated charges for the resolution of any past intellectual property infringement claims and the settlement payments. These costs are classified as general and administrative expenses in our consolidated statements of operations.
The following table presents the details of our acquisition and other charges and their impact on adjusted EBITDA (in thousands):
Year Ended February 28/29, | |||||||||||
2017 | 2016 | 2015 | |||||||||
Acquisition and other costs | $ | 646 | $ | 1,142 | $ | 2,114 | |||||
Export compliance | (34 | ) | 1,570 | 176 | |||||||
Intellectual property settlement | — | 2,276 | — | ||||||||
$ | 612 | $ | 4,988 | $ | 2,290 | ||||||
Quarterly Key Metrics
The following table presents unaudited key metrics for each of the eight quarters through February 28, 2017. In addition to our results determined in accordance with GAAP, we believe the following non-GAAP and operational measures are useful in evaluating our operating performance.
Three Months Ended | |||||||||||||||||||||||||||||||
February 28, 2017 | November 30, 2016 | August 31, 2016 | May 31, 2016 | February 29, 2016 | November 30, 2015 | August 31, 2015 | May 31, 2015 | ||||||||||||||||||||||||
(in thousands, except active subscribers and percentages) | |||||||||||||||||||||||||||||||
Gross billings | $ | 103,219 | $ | 100,399 | $ | 100,298 | $ | 98,201 | $ | 95,788 | $ | 89,008 | $ | 98,445 | $ | 94,274 | |||||||||||||||
Period-over-period percentage increase | 3 | % | — | % | 2 | % | 3 | % | 5 | % | 3 | % | 2 | % | |||||||||||||||||
Adjusted EBITDA (1) | $ | 16,616 | $ | 18,854 | $ | 18,622 | $ | 17,714 | $ | 13,589 | $ | 7,907 | $ | 9,782 | $ | 8,969 | |||||||||||||||
Adjusted EBITDA as a percentage of total revenue | 19 | % | 21 | % | 21 | % | 20 | % | 16 | % | 10 | % | 12 | % | 12 | % | |||||||||||||||
Free cash flow (1) | $ | 15,422 | $ | 13,786 | $ | 19,495 | $ | 10,165 | $ | 13,077 | $ | 3,195 | $ | 20,750 | $ | 4,426 | |||||||||||||||
Free cash flow as a percentage of total revenue | 17 | % | 16 | % | 22 | % | 12 | % | 16 | % | 4 | % | 26 | % | 6 | % | |||||||||||||||
Active subscribers as of period end | 321,241 | 309,323 | 298,739 | 286,602 | 278,398 | 269,467 | 261,613 | 252,460 | |||||||||||||||||||||||
_________________
(1) | Beginning in the third quarter of fiscal 2017, we modified our reporting practices to comply with recent SEC interpretations on the use of non-GAAP measures. As a result, we have modified our historical presentation of adjusted EBITDA and will no longer adjust for changes in deferred revenue and associated deferred costs in our calculation of adjusted EBITDA. Additionally, we have modified our historical presentation of adjusted free cash flow and will no longer adjust free cash flow for the cash payment impact of acquisition and other charges. These changes do not impact our current and historical presentation of GAAP results. Prior period information has been recast to conform to the adjusted calculations. |
The following table reconciles total revenue to gross billings (in thousands):
59
Three Months Ended | |||||||||||||||||||||||||||||||
February 28, 2017 | November 30, 2016 | August 31, 2016 | May 31, 2016 | February 29, 2016 | November 30, 2015 | August 31, 2015 | May 31, 2015 | ||||||||||||||||||||||||
Total revenue | $ | 89,259 | $ | 88,806 | $ | 87,930 | $ | 86,654 | $ | 83,726 | $ | 80,087 | $ | 78,371 | $ | 77,974 | |||||||||||||||
Total deferred revenue, end of period (1) | 407,082 | 401,300 | 398,878 | 393,072 | 392,774 | 391,617 | 389,835 | 381,003 | |||||||||||||||||||||||
Less: total deferred revenue, beginning of period (1) | (401,300 | ) | (398,878 | ) | (393,072 | ) | (392,774 | ) | (391,617 | ) | (389,835 | ) | (381,003 | ) | (372,862 | ) | |||||||||||||||
Add: deferred revenue adjustments | 8,178 | 9,171 | 6,562 | 11,249 | 10,905 | 7,139 | 11,242 | 8,159 | |||||||||||||||||||||||
Total change in deferred revenue and adjustments | 13,960 | 11,593 | 12,368 | 11,547 | 12,062 | 8,921 | 20,074 | 16,300 | |||||||||||||||||||||||
Gross billings | $ | 103,219 | $ | 100,399 | $ | 100,298 | $ | 98,201 | $ | 95,788 | $ | 89,008 | $ | 98,445 | $ | 94,274 | |||||||||||||||
_________________
(1) | The balances for the prior fiscal year's comparable quarters presented exclude any amounts related to the acquisition date deferred revenue assumed from C2C Systems Limited ("C2C"), which closed in the second quarter of fiscal 2015. We believe adjusting for the fair value of the assumed performance obligation allows us to better compare gross billings from period to period in order to assess the ongoing results of our business. |
The following table reconciles net income (loss) to adjusted EBITDA (in thousands):
Three Months Ended | |||||||||||||||||||||||||||||||
February 28, 2017 | November 30, 2016 | August 31, 2016 | May 31, 2016 | February 29, 2016 | November 30, 2015 | August 31, 2015 | May 31, 2015 | ||||||||||||||||||||||||
Net income (loss) | $ | 3,221 | $ | 1,793 | $ | 2,437 | $ | 2,784 | $ | 3,235 | $ | (1,586 | ) | $ | (2,239 | ) | $ | (3,832 | ) | ||||||||||||
Other expense (income), net | 201 | 2,374 | (1,515 | ) | (990 | ) | (604 | ) | 395 | (97 | ) | 568 | |||||||||||||||||||
Provision for (benefit from) income taxes | 1,905 | 1,329 | 5,209 | 3,310 | (406 | ) | (6,793 | ) | 2,030 | 2,442 | |||||||||||||||||||||
Depreciation, amortization and impairment expense | 3,989 | 3,975 | 4,186 | 4,281 | 5,373 | 3,458 | 2,295 | 2,174 | |||||||||||||||||||||||
Stock-based compensation expense | 7,655 | 9,217 | 7,896 | 7,937 | 7,430 | 7,706 | 7,166 | 6,544 | |||||||||||||||||||||||
Acquisition and other charges (1) | (355 | ) | 166 | 409 | 392 | (1,439 | ) | 4,727 | 627 | 1,073 | |||||||||||||||||||||
Adjusted EBITDA (2) | $ | 16,616 | $ | 18,854 | $ | 18,622 | $ | 17,714 | $ | 13,589 | $ | 7,907 | $ | 9,782 | $ | 8,969 | |||||||||||||||
_________________
(1) | The following table details the acquisition and other charges affecting adjusted EBITDA (in thousands): |
Three Months Ended | |||||||||||||||||||||||||||||||
February 28, 2017 | November 30, 2016 | August 31, 2016 | May 31, 2016 | February 29, 2016 | November 30, 2015 | August 31, 2015 | May 31, 2015 | ||||||||||||||||||||||||
Acquisition costs | $ | (355 | ) | $ | 211 | $ | 409 | $ | 381 | $ | (1,426 | ) | $ | 929 | $ | 622 | $ | 1,017 | |||||||||||||
Export compliance | — | (45 | ) | — | 11 | (13 | ) | 1,522 | 5 | 56 | |||||||||||||||||||||
Intellectual property settlement | — | — | — | — | — | 2,276 | — | — | |||||||||||||||||||||||
Total acquisition and other charges | $ | (355 | ) | $ | 166 | $ | 409 | $ | 392 | $ | (1,439 | ) | $ | 4,727 | $ | 627 | $ | 1,073 | |||||||||||||
(2) | As described above, we have modified our historical presentation of adjusted EBITDA. These changes do not impact our current and historical presentation of GAAP results. Prior period information has been recast to conform to the adjusted calculations. |
The following table reconciles cash provided by operating activities to free cash flow (in thousands):
60
Three Months Ended | |||||||||||||||||||||||||||||||
February 28, 2017 | November 30, 2016 | August 31, 2016 | May 31, 2016 | February 29, 2016 | November 30, 2015 | August 31, 2015 | May 31, 2015 | ||||||||||||||||||||||||
Cash provided by operating activities | $ | 17,492 | $ | 15,082 | $ | 20,515 | $ | 12,114 | $ | 15,395 | $ | 5,252 | $ | 22,317 | $ | 6,302 | |||||||||||||||
Less: purchases of property and equipment | (2,070 | ) | (1,296 | ) | (1,020 | ) | (1,949 | ) | (2,318 | ) | (2,057 | ) | (1,567 | ) | (1,876 | ) | |||||||||||||||
Free cash flow (1) | $ | 15,422 | $ | 13,786 | $ | 19,495 | $ | 10,165 | $ | 13,077 | $ | 3,195 | $ | 20,750 | $ | 4,426 | |||||||||||||||
_________________
(1) | As described above, we have modified our historical presentation of free cash flow. These changes do not impact our current and historical presentation of GAAP results. Prior period information has been recast to conform to the adjusted calculations. |
Quarterly Non-GAAP Financial Measure Trends
Gross billings. Our quarterly gross billings results reflect some seasonality in sales of our solutions. We typically have seasonally higher gross billings in our first and fourth quarters, as the first quarter generally experiences stronger renewals and the fourth quarter is generally driven by demand related to calendar year-end budget needs. We experienced sequential quarterly growth in fiscal 2017, whereas in fiscal 2016, we experienced lower than expected growth rates due to weakness experienced in the EMEA region and in our data protection business. Additionally, in fiscal 2017 and 2016, we observed a shift by our customers from traditional and solely on-premises deployments to include the cloud, which includes hybrid network architectures, public and/or private clouds, SaaS applications and managed service solutions. These trends led to longer sales cycles and delays in buying decisions, as well as more customers electing one-year renewal terms rather than multi-year arrangements as they evaluated their long-term strategies. We have made strategic investments in our core product offerings, which drove the sequential increases in fiscal 2017 primarily related to our NextGen Firewall and Web Application Firewall solutions and the Barracuda Essentials solution suite.
Adjusted EBITDA. Adjusted EBITDA is subject to quarterly changes based on investment objectives and the timing of sales and marketing expenses based on strategic initiatives. The trends in adjusted EBITDA from period to period were based primarily upon changes in gross billings and operating expenses. Generally, operating expenses as a percentage of revenue has decreased fiscal 2017 primarily related to better leverage in our cost structure, our narrowing product focus and lower sales and marketing spend.
Free cash flow. Free cash flow is impacted by the seasonality trends in operating expenses discussed above. Additionally, free cash flow is subject to the timing of investments in capital expenditures, which principally relate to investment in cloud and corporate infrastructure required to support the growth of our business. While our management plans for these types of infrastructure investments, the timing of the investment is driven, most importantly, by customer need, and can vary from our plan. The trends in free cash flow during the periods presented were primarily impacted by the trends in our gross billings and adjusted EBITDA.
Active Subscribers. To date, changes in active subscribers have not been materially impacted by seasonal trends. The increase and linearity of the active subscribers is related to our ability to maintain a high renewal rate of subscriptions. Active subscribers are also impacted by our ability to attract and acquire new customers. In fiscal 2017, we renewed 92% of the expiring subscriptions, on a dollar basis, as we continued to see more customers opt for ratable subscription form factors and shorter contract lengths.
Contractual Obligations and Commitments
The following summarizes our contractual obligations and commitments as of February 28, 2017:
61
Payments Due by Period | |||||||||||||||||||
Total | Less Than 1 Year | 1 - 3 Years | 3 - 5 Years | More Than 5 Years | |||||||||||||||
(in thousands) | |||||||||||||||||||
Operating leases (1) | $ | 7,226 | $ | 3,197 | $ | 3,586 | $ | 443 | $ | — | |||||||||
Debt obligations (2) | 4,115 | 4,115 | — | — | — | ||||||||||||||
Interest payable associated with debt obligations (2) | 105 | 105 | — | — | — | ||||||||||||||
Unrecognized purchase commitments (3) | 32,930 | 26,123 | 6,807 | — | — | ||||||||||||||
$ | 44,376 | $ | 33,540 | $ | 10,393 | $ | 443 | $ | — | ||||||||||
_________________
(1) | Consists of contractual obligations from office space and equipment under non-cancelable operating leases. |
(2) | Consists of debt obligations related to our corporate headquarters. |
(3) | Consists of future unrecognized contractual obligations, primarily for purchase commitments of goods and services related to inventory, advertising and marketing, royalty and licensing arrangements and data center operations. |
The contractual obligation table above excludes tax liabilities of $10.0 million related to gross unrecognized tax benefits because we are unable to make a reasonably reliable estimate of the timing of settlement, if any, of these future payments. Additionally, we agreed to make contingent consideration payments as part of certain acquisitions, which are not included in the table above. As of February 28, 2017, we estimated the fair value of the contingent consideration liabilities to be $0.9 million. Refer to Note 3 to Consolidated Financial Statements for additional information.
62
Off-Balance Sheet Arrangements
As of February 28, 2017, we did not have any relationships with unconsolidated organizations or financial partnerships, such as structured finance or special purpose entities that would have been established for the purpose of facilitating off-balance sheet arrangements or other contractually narrow or limited purposes.
Critical Accounting Policies and Estimates
Our consolidated financial statements have been prepared in accordance with GAAP. The preparation of these consolidated financial statements requires us to make estimates and assumptions that affect the reported amounts of assets, liabilities, revenue, expenses and related disclosures. We base our estimates on historical experience and on various other assumptions that we believe are reasonable under the circumstances. We evaluate our estimates and assumptions on an ongoing basis. Actual results may differ from these estimates. To the extent that there are material differences between these estimates and our actual results, our future financial statements will be affected.
The critical accounting policies requiring estimates, assumptions, and judgments that we believe have the most significant impact on our consolidated financial statements are described below.
Revenue Recognition
We typically provide access to our solutions through appliances and related subscription agreements, whereby the customer is charged an upfront fee for the appliance and is required to purchase a related subscription agreement. The subscription agreements are subject to customer renewal at the end of each subscription period. Our appliances contain hardware and embedded proprietary software. The subscriptions, referred to as Barracuda Energize Updates, provide hourly spam, anti-malware and security updates, and are required to be purchased to access our solutions. The subscriptions also entitle customers to phone support and software updates on a when and if available basis. We have determined that the elements of our customer arrangements, where an appliance and subscription are both purchased, do not qualify for treatment as a separate unit of accounting. Accordingly, all fees received under these customer agreements are accounted for as a single unit of accounting, and, except for any upfront fees for the appliance, such fees are recognized ratably on a daily basis over the term of the subscription agreement. Subscription revenue also includes revenue from fixed term licenses of our managed service provider solutions, virtual appliance software, support and maintenance. Subscription revenue is recognized ratably over the term of the license. Recognition of revenue commences when there is persuasive evidence of an arrangement, the fee is fixed and determinable, collectability is deemed reasonably assured and the services have commenced.
We receive an upfront fee from customers for delivery and transfer of title for their appliance. No further fees related to the appliance are required to be paid by the customer in subsequent periods. Because the appliance does not have value to the customer on a stand-alone basis and requires a subscription agreement to access our solutions, the delivery of the appliance does not represent the culmination of a separate earnings process associated with the payment of the upfront fee. Accordingly, the amount of the upfront fee is recorded as deferred revenue upon invoicing and the amount is recognized as revenue ratably on a daily basis over the estimated average customer relationship period of three years.
Customers have a 30-day right to return, after which time the arrangement is non-cancelable. We make estimates and maintain a reserve for expected customer cancellations. These estimates involve inherent uncertainties and management judgment.
Income Taxes
We account for income taxes using the liability method, which requires the recognition of deferred tax assets and liabilities for the expected future tax consequences of events that have been recognized in the financial statements or in our tax returns. Deferred taxes are determined based on the difference between the financial statement and tax basis of assets and liabilities using enacted tax rates in effect in the years in which the differences are expected to reverse. Changes in deferred tax assets and liabilities are recorded in the provision for income taxes. We assess the likelihood that our deferred tax assets will be recovered from future taxable income and, to the extent we believe, based upon the weight of available evidence, that it is more likely than not that all or a portion of deferred tax assets will not be realized, a valuation allowance is established through a charge to income tax expense. Potential for recovery of deferred tax assets is evaluated by estimating the future taxable profits expected from each subsidiary and considering prudent and feasible tax planning strategies.
We account for uncertainty in income taxes recognized in our financial statements by applying a two-step process to determine the amount of tax benefit to be recognized. First, the tax position must be evaluated to determine the likelihood that
63
it will be sustained upon examination by the taxing authorities, based on the technical merits of the position. If the tax position is deemed more-likely-than-not to be sustained, the tax position is then assessed to determine the amount of benefit to recognize in the financial statements. The amount of the benefit that may be recognized is the largest amount that has a greater than 50% likelihood of being realized upon ultimate settlement. The provision for income taxes includes the effects of any resulting tax reserves, or unrecognized tax benefits, that are considered appropriate as well as the related net interest and penalties.
The factors used to assess the likelihood of realization of our deferred tax assets include our forecast of future taxable income and available tax planning strategies that could be implemented to realize the net deferred tax assets. Assumptions represent management’s best estimates and involve inherent uncertainties and the application of management’s judgment. Should actual amounts differ from our estimates, the amount of our tax expense and liabilities could be materially impacted.
Loss Contingencies
We are subject to the possibility of various loss contingencies arising in the ordinary course of business. We consider the likelihood of loss or impairment of an asset, or the incurrence of a liability, as well as our ability to reasonably estimate the amount of loss, in determining loss contingencies. An estimated loss contingency is accrued when it is probable that an asset has been impaired or a liability has been incurred and the amount of loss can be reasonably estimated. If we determine that a loss is possible and the range of the loss can be reasonably determined, then we disclose the range of the possible loss. We regularly evaluate current information available to us to determine whether an accrual is required, an accrual should be adjusted or a range of possible loss should be disclosed.
Business Combinations
We allocate the fair value of purchase consideration to the tangible assets acquired, liabilities assumed and intangible assets acquired based on their estimated fair values. The excess of the fair value of purchase consideration over the fair values of these identifiable assets and liabilities is recorded as goodwill. When determining the fair values of assets acquired and liabilities assumed, management makes significant estimates and assumptions, especially with respect to intangible assets.
Critical estimates in valuing certain intangible assets include, but are not limited to, future expected cash flows from customer relationships and acquired developed technology and discount rates. Management’s estimates of fair value are based upon assumptions believed to be reasonable, but which are inherently uncertain and unpredictable and, as a result, actual results may differ materially from estimates. Other estimates associated with the accounting for acquisitions may change as additional information becomes available regarding the assets acquired and liabilities assumed.
Intangible and Long-Lived Assets
Intangible assets consist of customer relationships, trade names, acquired technology, developed software, in-process research and development and patents. Intangible assets are recorded at fair values at the date of the acquisition and, for those assets having finite useful lives, are amortized using the straight-line method over their estimated useful lives. We periodically review our intangible and other long-lived assets for impairment whenever events or changes in circumstances indicate that the carrying amount of such assets may not be recoverable. Determination of recoverability is based on the lowest level of identifiable estimated undiscounted cash flows resulting from use of the asset and its eventual disposition. If not recoverable, an impairment loss would be calculated based on the excess of the carrying amount over the fair value.
Long-lived assets, including property and equipment, long-term prepayments, and intangible assets, excluding goodwill, are reviewed for impairment whenever events or changes in circumstances indicate that the carrying amount of an asset may not be recoverable. The evaluation is performed at the lowest level of identifiable cash flows independent of other assets. An impairment loss would be recognized when estimated undiscounted future cash flows generated from the assets are less than their carrying amount. Measurement of an impairment loss would be based on the excess of the carrying amount of the asset group over its fair value.
Impairment of Non-Marketable Securities
We periodically review our non-marketable securities for impairment. If we conclude that any of these investments are impaired, we determine whether such impairment is other-than-temporary. We consider factors such as the duration, severity and the reason for the decline in value, the potential recovery period and whether we intend to sell. For marketable debt securities, we also consider whether (i) it is more likely than not that we will be required to sell the debt securities before
64
recovery of their amortized cost basis, and (ii) the amortized cost basis cannot be recovered as a result of credit losses. If any impairment is considered other-than-temporary, we will write-down the security to its fair value.
Recent Accounting Pronouncements
Refer to "Recent Accounting Pronouncements" in Note 1 to Consolidated Financial Statements included in Part II, Item 8 of this Annual Report on Form 10-K.
Item 7A. Quantitative and Qualitative Disclosures About Market Risk
Foreign Currency Exchange Risk
A portion of our revenue and operating expenses are incurred outside the United States and are denominated in foreign currencies, which are subject to exchange rate fluctuations. Our most significant currency exposures are the Euro, the Japanese yen and the British pound. Our reported revenues and operating results may be impacted by fluctuations in foreign currency exchange rates. Fluctuations in foreign currency exchange rates may also cause us to recognize transaction gains and losses in our statement of operations. For fiscal 2017 and 2015, we recognized net foreign exchange losses of $0.8 million and $3.6 million, respectively, in other expense, net in the consolidated statement of operations, while for fiscal 2016, net foreign exchange gains (losses) were not significant.
We have foreign subsidiaries that operate and sell our products in various markets around the world. As a result, we are exposed to foreign exchange risks. Beginning in fiscal 2015, we utilized foreign exchange forward contracts to manage foreign currency risk associated with foreign currency denominated monetary assets and liabilities, primarily trade receivables, and to reduce the volatility of earnings and cash flows related to foreign currency transactions. There were no open contracts as of February 28, 2017.
Interest Rate Sensitivity
We had cash, cash equivalents and marketable securities of $200.1 million and $155.0 million as of February 28, 2017 and February 29, 2016, respectively. The primary objectives of our investment activities are to preserve principal, provide liquidity and maximize income without significantly increasing risk. Some of our investments are subject to market risk in which changes in the prevailing interest rates may cause the principal amount of the investment to fluctuate. To minimize this risk, we maintain our portfolio of cash equivalents and short-term marketable securities in a variety of instruments, such as money market funds, government and corporate debt securities and asset- and mortgage-backed securities. We typically invest in highly-rated securities and our investment policy limits the amount of credit exposure to any one issuer. The risk associated with fluctuating interest rates relates primarily to our portfolio of marketable securities. A hypothetical 100 basis point increase in interest rates would not have a significant impact to our portfolio as of February 28, 2017 and February 29, 2016.
65
Item 8. Financial Statements and Supplementary Data
BARRACUDA NETWORKS, INC.
INDEX TO CONSOLIDATED FINANCIAL STATEMENTS
66
REPORT OF INDEPENDENT REGISTERED PUBLIC ACCOUNTING FIRM
The Board of Directors and Stockholders of Barracuda Networks, Inc.
We have audited the accompanying consolidated balance sheets of Barracuda Networks, Inc. as of February 28, 2017 and February 29, 2016, and the related consolidated statements of operations, comprehensive income (loss), stockholders’ equity (deficit) and cash flows for each of the three years in the period ended February 28, 2017. Our audits also included the financial statement schedule listed in the Index at Item 15. These financial statements and schedule are the responsibility of the Company’s management. Our responsibility is to express an opinion on these financial statements and schedule based on our audits.
We conducted our audits in accordance with the standards of the Public Company Accounting Oversight Board (United States). Those standards require that we plan and perform the audit to obtain reasonable assurance about whether the financial statements are free of material misstatement. We were not engaged to perform an audit of the Company’s internal control over financial reporting. Our audits included consideration of internal control over financial reporting as a basis for designing audit procedures that are appropriate in the circumstances, but not for the purpose of expressing an opinion on the effectiveness of the Company’s internal control over financial reporting. Accordingly, we express no such opinion. An audit also includes examining, on a test basis, evidence supporting the amounts and disclosures in the financial statements, assessing the accounting principles used and significant estimates made by management, and evaluating the overall financial statement presentation. We believe that our audits provide a reasonable basis for our opinion.
In our opinion, the financial statements referred to above present fairly, in all material respects, the consolidated financial position of Barracuda Networks, Inc. at February 28, 2017 and February 29, 2016, and the consolidated results of its operations and its cash flows for each of the three years in the period ended February 28, 2017, in conformity with U.S. generally accepted accounting principles. Also, in our opinion, the related financial statement schedule, when considered in relation to the basic financial statements taken as a whole, presents fairly in all material respects the information set forth therein.
/s/ Ernst & Young LLP
San Jose, California
May 12, 2017
67
BARRACUDA NETWORKS, INC.
CONSOLIDATED BALANCE SHEETS
(in thousands, except share and per share data)
As of February 28/29, | |||||||
2017 | 2016 | ||||||
Assets | |||||||
Current assets: | |||||||
Cash and cash equivalents | $ | 120,194 | $ | 118,654 | |||
Marketable securities | 79,915 | 36,394 | |||||
Accounts receivable, net of allowance for doubtful accounts of $2,857 and $2,018 as of February 28, 2017 and February 29, 2016, respectively | 40,560 | 36,520 | |||||
Inventories, net | 5,847 | 5,648 | |||||
Prepaid income taxes | 11,050 | 7,645 | |||||
Deferred costs | 32,598 | 31,943 | |||||
Other current assets | 5,245 | 4,805 | |||||
Total current assets | 295,409 | 241,609 | |||||
Property and equipment, net | 29,979 | 31,910 | |||||
Deferred costs, non-current | 27,285 | 27,019 | |||||
Deferred income taxes, non-current | 1,554 | 2,992 | |||||
Other non-current assets | 8,607 | 7,293 | |||||
Intangible assets, net | 32,145 | 39,386 | |||||
Goodwill | 69,795 | 69,595 | |||||
Total assets | $ | 464,774 | $ | 419,804 | |||
Liabilities and stockholders’ equity (deficit) | |||||||
Current liabilities: | |||||||
Accounts payable | $ | 11,439 | $ | 15,939 | |||
Accrued payroll and related benefits | 13,593 | 12,371 | |||||
Other accrued liabilities | 12,942 | 19,495 | |||||
Deferred revenue | 239,796 | 235,411 | |||||
Note payable | 4,115 | 268 | |||||
Total current liabilities | 281,885 | 283,484 | |||||
Long-term liabilities: | |||||||
Deferred revenue, non-current | 167,286 | 157,363 | |||||
Deferred income taxes, non-current | 2,803 | 2,478 | |||||
Note payable, non-current | — | 4,115 | |||||
Other long-term liabilities | 6,377 | 4,462 | |||||
Commitments and contingencies (Note 9) | |||||||
Stockholders’ equity (deficit): | |||||||
Preferred stock, $0.001 par value; 20,000,000 shares authorized; zero shares issued and outstanding as of February 28, 2017 and February 29, 2016, respectively | — | — | |||||
Common stock, $0.001 par value; 1,000,000,000 shares authorized; 52,897,128 and 52,135,194 shares issued and outstanding as of February 28, 2017 and February 29, 2016, respectively | 53 | 52 | |||||
Additional paid-in capital | 370,745 | 337,439 | |||||
Accumulated other comprehensive loss | (5,226 | ) | (4,509 | ) | |||
Accumulated deficit | (359,149 | ) | (365,080 | ) | |||
Total stockholders’ equity (deficit) | 6,423 | (32,098 | ) | ||||
Total liabilities and stockholders’ equity (deficit) | $ | 464,774 | $ | 419,804 | |||
See accompanying notes.
68
BARRACUDA NETWORKS, INC.
CONSOLIDATED STATEMENTS OF OPERATIONS
(in thousands, except per share data)
Year Ended February 28/29, | |||||||||||
2017 | 2016 | 2015 | |||||||||
Revenue: | |||||||||||
Appliance | $ | 82,732 | $ | 89,275 | $ | 83,146 | |||||
Subscription | 269,917 | 230,883 | 194,300 | ||||||||
Total revenue | 352,649 | 320,158 | 277,446 | ||||||||
Cost of revenue | 83,772 | 70,132 | 58,667 | ||||||||
Gross profit | 268,877 | 250,026 | 218,779 | ||||||||
Operating expenses: | |||||||||||
Research and development | 75,070 | 71,251 | 58,737 | ||||||||
Sales and marketing | 129,707 | 138,324 | 125,526 | ||||||||
General and administrative | 42,042 | 47,338 | 35,438 | ||||||||
Total operating expenses | 246,819 | 256,913 | 219,701 | ||||||||
Income (loss) from operations | 22,058 | (6,887 | ) | (922 | ) | ||||||
Other expense, net | (70 | ) | (262 | ) | (3,674 | ) | |||||
Income (loss) before income taxes | 21,988 | (7,149 | ) | (4,596 | ) | ||||||
Benefit from (provision for) income taxes | (11,753 | ) | 2,727 | (62,902 | ) | ||||||
Net income (loss) | $ | 10,235 | $ | (4,422 | ) | $ | (67,498 | ) | |||
Net income (loss) per share: | |||||||||||
Basic | $ | 0.20 | $ | (0.08 | ) | $ | (1.30 | ) | |||
Diluted | $ | 0.19 | $ | (0.08 | ) | $ | (1.30 | ) | |||
Weighted-average shares used to compute net income (loss) per share: | |||||||||||
Basic | 52,456 | 53,070 | 51,898 | ||||||||
Diluted | 53,572 | 53,070 | 51,898 | ||||||||
See accompanying notes.
69
BARRACUDA NETWORKS, INC.
CONSOLIDATED STATEMENTS OF COMPREHENSIVE INCOME (LOSS)
(in thousands)
Year Ended February 28/29, | |||||||||||
2017 | 2016 | 2015 | |||||||||
Net income (loss) | $ | 10,235 | $ | (4,422 | ) | $ | (67,498 | ) | |||
Other comprehensive income (loss), net of tax: | |||||||||||
Change in net foreign currency translation adjustment | (60 | ) | (669 | ) | (3,408 | ) | |||||
Available-for-sale investments: | |||||||||||
Change in net unrealized gain (loss) (net of tax effect of $0, $0 and $5) | 73 | 403 | (8 | ) | |||||||
Less: reclassification adjustment for net gains included in net income (loss) (net of tax effect of $393, $5 and $0) | (730 | ) | (10 | ) | — | ||||||
Net change | (657 | ) | 393 | (8 | ) | ||||||
Other comprehensive loss | (717 | ) | (276 | ) | (3,416 | ) | |||||
Comprehensive income (loss) | $ | 9,518 | $ | (4,698 | ) | $ | (70,914 | ) | |||
See accompanying notes.
70
BARRACUDA NETWORKS, INC.
CONSOLIDATED STATEMENTS OF STOCKHOLDERS’ EQUITY (DEFICIT)
(in thousands, except share data)
Stockholders’ Equity (Deficit) | ||||||||||||||||||||||
Common Stock | Additional Paid-In Capital | Accumulated Other Comprehensive Loss | Accumulated Deficit | Total Stockholders’ Equity (Deficit) | ||||||||||||||||||
Shares | Amount | |||||||||||||||||||||
Balance as of February 28, 2014 | 51,045,196 | $ | 52 | $ | 278,551 | $ | (817 | ) | $ | (283,441 | ) | $ | (5,655 | ) | ||||||||
Issuance of common stock | 2,012,749 | 1 | 16,475 | 16,476 | ||||||||||||||||||
Tax withholding related to net share settlement of equity awards | (176,943 | ) | — | (5,369 | ) | (5,369 | ) | |||||||||||||||
Stock-based compensation expense | 17,058 | 17,058 | ||||||||||||||||||||
Excess tax benefits from equity compensation plans | 8,947 | 8,947 | ||||||||||||||||||||
Repayment of employee loans, net | 373 | 373 | ||||||||||||||||||||
Change in unrealized gain (loss) on available-for-sale securities, net of tax effect | (8 | ) | (8 | ) | ||||||||||||||||||
Foreign currency translation adjustment | (3,408 | ) | (3,408 | ) | ||||||||||||||||||
Net loss | (67,498 | ) | (67,498 | ) | ||||||||||||||||||
Balance as of February 28, 2015 | 52,881,002 | $ | 53 | $ | 316,035 | $ | (4,233 | ) | $ | (350,939 | ) | $ | (39,084 | ) | ||||||||
Issuance of common stock | 1,019,686 | 1 | 4,844 | 4,845 | ||||||||||||||||||
Tax withholding related to net share settlement of equity awards | (262,511 | ) | — | (6,734 | ) | (6,734 | ) | |||||||||||||||
Repurchases of common stock | (1,502,983 | ) | (2 | ) | (9,495 | ) | (9,719 | ) | (19,216 | ) | ||||||||||||
Stock-based compensation expense | 28,846 | 28,846 | ||||||||||||||||||||
Excess tax benefits from equity compensation plans | 3,788 | 3,788 | ||||||||||||||||||||
Repayment of employee loans, net | 155 | 155 | ||||||||||||||||||||
Change in unrealized gain (loss) on available-for-sale securities, net of tax effect | 393 | 393 | ||||||||||||||||||||
Foreign currency translation adjustment | (669 | ) | (669 | ) | ||||||||||||||||||
Net loss | (4,422 | ) | (4,422 | ) | ||||||||||||||||||
Balance as of February 29, 2016 | 52,135,194 | $ | 52 | $ | 337,439 | $ | (4,509 | ) | $ | (365,080 | ) | $ | (32,098 | ) | ||||||||
Issuance of common stock | 1,581,954 | 1 | 8,898 | 8,899 | ||||||||||||||||||
Tax withholding related to net share settlement of equity awards | (334,492 | ) | — | (7,061 | ) | (7,061 | ) | |||||||||||||||
Repurchases of common stock | (498,077 | ) | — | (3,292 | ) | (4,304 | ) | (7,596 | ) | |||||||||||||
Stock-based compensation expense | 32,705 | 32,705 | ||||||||||||||||||||
Excess tax benefits from equity compensation plans | 1,909 | 1,909 | ||||||||||||||||||||
Issuance of common stock in connection with business combinations | 12,549 | 147 | 147 | |||||||||||||||||||
Change in unrealized gain (loss) on available-for-sale securities, net of tax effect | (657 | ) | (657 | ) | ||||||||||||||||||
Foreign currency translation adjustment | (60 | ) | (60 | ) | ||||||||||||||||||
Net income | 10,235 | 10,235 | ||||||||||||||||||||
Balance as of February 28, 2017 | 52,897,128 | $ | 53 | $ | 370,745 | $ | (5,226 | ) | $ | (359,149 | ) | $ | 6,423 | |||||||||
See accompanying notes.
71
BARRACUDA NETWORKS, INC.
CONSOLIDATED STATEMENTS OF CASH FLOWS
(in thousands)
Year Ended February 28/29, | |||||||||||
2017 | 2016 | 2015 | |||||||||
Operating activities | |||||||||||
Net income (loss) | $ | 10,235 | $ | (4,422 | ) | $ | (67,498 | ) | |||
Adjustments to reconcile net income (loss) to net cash provided by operating activities: | |||||||||||
Depreciation, amortization and impairment expense | 16,431 | 13,300 | 8,631 | ||||||||
Stock-based compensation expense | 32,705 | 28,846 | 17,058 | ||||||||
Excess tax benefits from equity compensation plans | (1,909 | ) | (3,788 | ) | (8,947 | ) | |||||
Deferred income taxes | 1,642 | (6,592 | ) | 59,261 | |||||||
Other | (493 | ) | (865 | ) | 486 | ||||||
Changes in operating assets and liabilities: | |||||||||||
Accounts receivable, net | (4,103 | ) | 4,427 | (12,945 | ) | ||||||
Inventories, net | (202 | ) | (1,193 | ) | 1,189 | ||||||
Income taxes, net | 1,931 | 2,756 | (485 | ) | |||||||
Deferred costs | (725 | ) | (1,112 | ) | (8,189 | ) | |||||
Other assets | (888 | ) | (2,187 | ) | (2,158 | ) | |||||
Accounts payable | (5,388 | ) | (720 | ) | 2,835 | ||||||
Accrued payroll and related benefits | 1,033 | 3,339 | 1,959 | ||||||||
Other liabilities | 397 | (1,526 | ) | 3,566 | |||||||
Deferred revenue | 14,537 | 19,003 | 59,341 | ||||||||
Net cash provided by operating activities | 65,203 | 49,266 | 54,104 | ||||||||
Investing activities | |||||||||||
Purchases of marketable securities | (74,527 | ) | (26,021 | ) | (41,977 | ) | |||||
Proceeds from the sale of marketable securities | 13,461 | 10,310 | 249 | ||||||||
Proceeds from maturity of marketable securities | 17,597 | 20,047 | 735 | ||||||||
Purchases of non-marketable investments | (1,236 | ) | (1,400 | ) | (1,200 | ) | |||||
Purchases of property and equipment | (6,335 | ) | (7,818 | ) | (12,517 | ) | |||||
Purchases of intangible assets | (1,374 | ) | — | (38 | ) | ||||||
Business combinations, net of cash acquired | (6,950 | ) | (56,862 | ) | (4,791 | ) | |||||
Net cash used in investing activities | (59,364 | ) | (61,744 | ) | (59,539 | ) | |||||
Financing activities | |||||||||||
Proceeds from issuance of common stock | 8,899 | 4,845 | 16,476 | ||||||||
Taxes paid related to net share settlement of equity awards | (7,061 | ) | (6,734 | ) | (5,369 | ) | |||||
Repurchases of common stock | (7,596 | ) | (19,216 | ) | — | ||||||
Excess tax benefits from equity compensation plans | 1,909 | 3,788 | 8,947 | ||||||||
Repayment of employee loans, net of loans extended | — | (2,464 | ) | 1,921 | |||||||
Repayment of note payable | (268 | ) | (285 | ) | (237 | ) | |||||
Other | — | (330 | ) | (34 | ) | ||||||
Net cash provided by (used in) financing activities | (4,117 | ) | (20,396 | ) | 21,704 | ||||||
Effect of exchange rate changes on cash and cash equivalents | (182 | ) | 155 | (775 | ) | ||||||
Net increase (decrease) in cash and cash equivalents | 1,540 | (32,719 | ) | 15,494 | |||||||
Cash and cash equivalents at beginning of period | 118,654 | 151,373 | 135,879 | ||||||||
Cash and cash equivalents at end of period | $ | 120,194 | $ | 118,654 | $ | 151,373 | |||||
Supplemental cash flow disclosures | |||||||||||
Cash paid during the period for: | |||||||||||
Interest | $ | 264 | $ | 287 | $ | 326 | |||||
Income taxes, net of tax refunds | $ | 7,938 | $ | 353 | $ | 3,191 | |||||
See accompanying notes.
72
BARRACUDA NETWORKS, INC.
NOTES TO CONSOLIDATED FINANCIAL STATEMENTS
1. Organization and Summary of Significant Accounting Policies
Nature of Operations
Barracuda Networks, Inc., also referred to in this report as "we," "our," "us," "Barracuda" or "the Company," is headquartered in Campbell, California, and designs and delivers powerful yet easy-to-use security and data protection solutions. We offer cloud-enabled solutions that help our customers address security threats, improve network performance and protect and store their data. Our solutions are designed to simplify IT operations for our customers, allowing them to enhance their return on technology investments. We refer to the fiscal years ended February 28, 2017, February 29, 2016 and February 28, 2015 as fiscal 2017, fiscal 2016 and fiscal 2015, respectively.
Basis of Presentation
The accompanying consolidated financial statements have been prepared in accordance with generally accepted accounting principles in the United States ("GAAP") and include the accounts of Barracuda Networks, Inc. and our wholly and majority-owned subsidiaries. All significant intercompany accounts and transactions have been eliminated.
Use of Estimates
The preparation of financial statements in conformity with GAAP requires management to make estimates and assumptions that affect the reported amounts of assets and liabilities and disclosure of contingent liabilities at the date of the financial statements and the reported amounts of revenue and expenses during the reporting period. We evaluate our estimates on an ongoing basis, including those related to revenue recognition, income taxes and contingent liabilities, among others. We base our estimates on historical experience and on various other assumptions that we believe to be reasonable, the results of which form the basis for making judgments about the carrying values of assets and liabilities. Actual results could differ from those estimates and such differences could be material to our consolidated financial position and results of operations.
Cash and Cash Equivalents
Cash and cash equivalents consist of cash on deposit with banks and money market funds with an original maturity of three months or less.
Marketable Securities
Marketable securities have been classified as available-for-sale securities in the consolidated balance sheets. Available-for-sale securities are carried at fair value, and realized gains and losses and declines in value determined to be other than temporary are included in other expense, net in the consolidated statements of operations. Interest income on securities classified as available-for-sale securities is also included in other income (expense), net. The cost of securities sold is based on the specific-identification method.
We periodically review our marketable securities for other-than-temporary impairment. We consider factors such as the duration, severity and the reason for the decline in value, the potential recovery period and whether we intend to sell. For marketable debt securities, we also consider whether (i) it is more likely than not that we will be required to sell the debt securities before recovery of their amortized cost basis and (ii) the amortized cost basis cannot be recovered as a result of credit losses.
Fair Value
The carrying value of our financial instruments, including cash and cash equivalents, accounts receivable, accounts payable and accrued liabilities, approximates fair value because of the short-term nature of such financial instruments.
We measure certain assets, including goodwill, intangible assets, net and other investments in non-marketable securities at fair value on a nonrecurring basis when there are identifiable events or changes in circumstances that may have a significant adverse impact on the fair value of these assets.
73
Concentration of Credit Risk and Significant Customers
Financial instruments that potentially subject us to concentrations of credit risk consist principally of cash and cash equivalents, marketable securities and accounts receivable.
We primarily invest only in high-quality credit instruments and maintain our cash, cash equivalents and marketable securities with high-quality institutions. Deposits held with banks, including those held in foreign branches of global banks, may exceed the amount of insurance provided on such deposits. These deposits may be redeemed upon demand and bear minimal risk. We believe that the institutions that hold our instruments are financially sound and are subject to minimal credit risk.
Our accounts receivable are derived from customers located in the United States and certain foreign countries and regions, including Europe, the Middle East, Latin America and Asia-Pacific. Sales to foreign customers accounted for 29%, 31% and 32% of total revenue in fiscal 2017, 2016 and 2015, respectively. We perform ongoing credit evaluations of our customers’ financial condition and typically require no collateral from our customers. Credit risk with respect to accounts receivable is dispersed due to the large number of customers. As of February 28, 2017, one distribution partner accounted for 12% of receivables. As of February 29, 2016, no customer accounted for more than 10% of receivables.
One distribution partner accounted for 25%, 22% and 20% of total revenue in fiscal 2017, 2016 and 2015, respectively.
We currently depend on a single source or a limited number of sources for certain components used in the manufacture of our appliances. The inability of any supplier to fulfill our supply requirements could negatively impact future operating results.
Accounts Receivable and Allowance for Doubtful Accounts
Accounts receivable are recorded at the invoiced amount, net of allowances for doubtful accounts. The allowance for doubtful accounts is based on our assessment of the collectability of accounts. We regularly review the adequacy of the allowance of doubtful accounts by considering the age of outstanding invoices, customers’ expected ability to pay and collection history, when applicable, to determine whether a specific allowance is appropriate. Accounts receivable deemed uncollectible are charged against the allowance for doubtful accounts when identified.
Inventories
Inventories are recorded at the lower of cost (using the first-in, first-out ("FIFO") method) or market. Cost is derived using actual cost on a FIFO basis. Our inventories include material, labor and manufacturing overhead costs. We evaluate our ending inventories for estimated excess quantities and obsolescence. This evaluation includes analysis of usage rate and projected future demand. Inventories in excess of estimated future demand are written down and charged to cost of revenue. In addition, we assess the impact of changing technology to our inventories and we write down inventories that are considered obsolete.
Property and Equipment
Property and equipment are stated at cost, less accumulated depreciation and amortization. Land is not depreciated. Depreciation is calculated using the straight-line method over the following estimated useful lives:
Asset Classification | Estimated Useful Life |
Buildings | 39 years |
Computer equipment and software | 1 to 3 years |
Vehicles, machinery and equipment | 5 years |
Leasehold improvements | Lesser of the useful life of the asset, generally 5 years, or remaining lease term |
Business Combinations
We include the results of operations of the businesses that we acquire as of the respective dates of acquisition. We allocate the fair value of the purchase price of our acquisitions to the assets acquired and liabilities assumed based on their estimated fair values. The excess of the fair value of the purchase price over the fair values of these identifiable assets and liabilities is recorded as goodwill.
74
Intangible Assets and Impairment of Long-Lived Assets
Intangible assets consist of customer relationships, trade names, acquired technology, developed software, in-process research and development and patents. Intangible assets are recorded at fair values at the date of the acquisition and, for those assets having finite useful lives, are amortized using the straight-line method over their estimated useful lives, which generally range from three to ten years. In-process research and development is recorded as an indefinite-lived asset until the underlying project is completed, at which time the intangible asset is amortized over the estimated useful life. We periodically review our intangible and other long-lived assets for impairment whenever events or changes in circumstances indicate that the carrying amount of such assets may not be recoverable. Determination of recoverability is based on the lowest level of identifiable estimated undiscounted cash flows resulting from use of the asset and its eventual disposition. If not recoverable, an impairment loss would be calculated based on the excess of the carrying amount over the fair value. In fiscal 2017, 2016 and 2015, we recorded impairment charges of zero, $1.2 million and zero, respectively. Refer to Note 2 to Consolidated Financial Statements for additional information.
Goodwill
Goodwill represents the excess of the purchase price over the fair value of assets acquired and liabilities assumed. We test goodwill for impairment at least annually or more frequently if events or changes in circumstances indicate that this asset may be impaired. We have elected to first assess the qualitative factors to determine whether it is more likely than not that the fair value of our single reporting unit is less than its carrying amount as a basis for determining whether it is necessary to perform the two-step goodwill impairment test. If we determine that it is more likely than not that its fair value is less than its carrying amount, then the two-step goodwill impairment test will be performed. The first step, identifying a potential impairment, compares the fair value of the reporting unit with its carrying amount. If the carrying amount exceeds its fair value, the second step will be performed; otherwise, no further step is required. The second step, measuring the impairment loss, compares the implied fair value of the goodwill with the carrying amount of the goodwill. Any excess of the goodwill carrying amount over the applied fair value is recognized as an impairment loss, and the carrying value of goodwill is written down to fair value.
Revenue Recognition
We typically provide access to our solutions through appliances and related subscription agreements, whereby the customer is charged an upfront fee for the appliance and is required to purchase a related subscription agreement. The subscription agreements are subject to customer renewal at the end of each subscription period. Our appliances contain hardware and embedded proprietary software. The subscriptions, referred to as Barracuda Energize Updates, provide hourly spam, anti-malware and security updates, and are required to be purchased to access our solutions. The subscriptions also entitle customers to phone support and software updates on a when and if available basis. We have determined that the elements of our customer arrangements, where an appliance and subscription are purchased, do not qualify for treatment as a separate unit of accounting. Accordingly, all fees received under these customer agreements are accounted for as a single unit of accounting, and, except for any upfront fees for the appliance, such fees are recognized ratably on a daily basis over the term of the subscription agreement. Subscription revenue also includes revenue from fixed term licenses of our managed service provider solutions, virtual appliance software, support and maintenance. Subscription revenue is recognized ratably over the term of the license. Recognition of revenue commences when there is persuasive evidence of an arrangement, the fee is fixed and determinable, collectability is deemed reasonably assured and the services have commenced.
We receive an upfront fee from customers for delivery and transfer of title for their appliance. No further fees related to the appliance are required to be paid by the customer in subsequent periods. Because the appliance does not have value to the customer on a stand-alone basis and requires a subscription agreement to access our solutions, the delivery of the appliance does not represent the culmination of a separate earnings process associated with the payment of the upfront fee. Accordingly, the amount of the upfront fee is recorded as deferred revenue upon invoicing and the amount is recognized as revenue ratably on a daily basis over the estimated average customer relationship period of three years.
Customers have a 30-day right to return, after which time the arrangement is non-cancelable. We make estimates and maintain a reserve for expected customer cancellations. These estimates involve inherent uncertainties and management judgment.
Cost of Revenue
Cost of revenue consists of costs related to our appliance and subscription revenue. Such costs include hardware, manufacturing, shipping and logistics, customer support, royalty, warranty, personnel costs, service delivery and data center
75
costs and amortization of intangible assets related to acquired technology. We jointly manage the cost of providing appliances and subscription services and, accordingly, we present aggregate cost of revenue.
Deferred Revenue
Deferred revenue represents amounts billed to customers or payments received from customers for which revenue has not yet been recognized. Deferred revenue that is expected to be recognized as revenue within one year is recorded as current deferred revenue and the remaining portion is recorded as non-current deferred revenue.
Warranty and Instant Replacement Service
We provide a standard one-year warranty on our appliances. We also offer separately priced extended warranty contracts on our appliances, which entitle customers to expedited replacement hardware, with next business day shipping, on our appliances. Such separately-priced extended warranty contracts are available to customers coterminous with the standard one-year warranty. Revenue from extended warranty contracts is recognized ratably over the contractual term. Costs associated with our standard warranty and extended warranty contracts are expensed as incurred. Total warranty costs, including costs incurred under our instant replacement extended warranty contracts and costs to support our standard one-year appliance warranty, in fiscal 2017, 2016 and 2015 were $6.6 million, $4.4 million and $4.6 million, respectively.
Deferred Appliance Costs
We receive an upfront fee from our customers related to the sale of our appliance. We defer the costs of the appliance, including shipping costs, as they are directly related to the revenues that we derive from the sale of the appliance. Such deferred costs are amortized ratably over the estimated average customer relationship period of three years. Amortization of deferred appliance costs is included in cost of revenue in the consolidated statements of operations.
Deferred Commissions
We capitalize commission costs that are incremental and directly related to the acquisition of customer contracts. Sales commissions are deferred when earned and amortized over the same period that revenues are recognized. Commission payments are paid in full after the customer has paid. Amortization of deferred commission costs is included in sales and marketing expenses in the consolidated statements of operations.
Income Taxes
We account for income taxes using the liability method, which requires the recognition of deferred tax assets and liabilities for the expected future tax consequences of events that have been recognized in the financial statements or in our tax returns. Deferred taxes are determined based on the difference between the financial statement and tax basis of assets and liabilities using enacted tax rates in effect in the years in which the differences are expected to reverse. Changes in deferred tax assets and liabilities are recorded in the provision for income taxes. We assess the likelihood that our deferred tax assets will be recovered from future taxable income and, to the extent we believe, based upon the weight of available evidence, that it is more likely than not that all or a portion of deferred tax assets will not be realized, a valuation allowance is established through a charge to income tax expense. Potential for recovery of deferred tax assets is evaluated by estimating the future taxable profits expected from each subsidiary and considering prudent and feasible tax planning strategies.
We account for uncertainty in income taxes recognized in our financial statements by applying a two-step process to determine the amount of tax benefit to be recognized. First, the tax position must be evaluated to determine the likelihood that it will be sustained upon examination by the taxing authorities, based on the technical merits of the position. If the tax position is deemed more-likely-than-not to be sustained, the tax position is then assessed to determine the amount of benefit to recognize in the financial statements. The amount of the benefit that may be recognized is the largest amount that has a greater than 50% likelihood of being realized upon ultimate settlement. The provision for income taxes includes the effects of any resulting tax reserves, or unrecognized tax benefits, that are considered appropriate as well as the related net interest and penalties.
Software Development Costs
Software development costs incurred prior to the establishment of technological feasibility are charged to research and development expenses as incurred. Technological feasibility is established upon completion of a working model, which is typically demonstrated by initial beta shipment. Software development costs incurred subsequent to the time a product’s
76
technological feasibility has been established through the time the product is available for general release to customers are capitalized if material. No software development costs have been capitalized in the periods presented.
Advertising Costs
We expense advertising costs as incurred. Advertising expenses totaled $44.9 million, $58.2 million and $58.7 million for fiscal 2017, 2016 and 2015, respectively.
Stock-Based Compensation
We record stock-based compensation awards based on fair value as of the grant date. We use the Black-Scholes-Merton option-pricing model to estimate the fair value of our stock options and our employee stock purchase plan ("ESPP") shares. The fair value of restricted stock units is based on the fair value of our common stock, which is the closing market price of our common stock on the grant date.
Given our limited history with employee grants, we use the "simplified" method in estimating the expected term for stock option awards. The "simplified" method, as permitted by the SEC, is calculated as the average of the contractual term and the average vesting period. Estimated volatility is based upon the historical volatility of similar entities whose share prices are publicly available, as we did not have sufficient trading history for our common stock. The risk-free interest rate is based on the yield curve of a zero-coupon U.S. Treasury bond on the date the stock option award is granted, with a maturity equal to the expected term of the stock option award. The expected dividend assumption is based on our current expectations about our anticipated dividend policy.
We amortize the fair value of an award expected to vest on a straight-line basis over the requisite service period of the award, which is generally the period from the grant date to the end of the vesting period, or on a graded basis for awards that are contingent on the achievement of performance conditions. We use historical data to estimate the number of future forfeitures.
Foreign Currency
For those subsidiaries whose functional currency is not the U.S. dollar, assets and liabilities are translated into U.S. dollar equivalents at the exchange rate in effect on the balance sheet date and revenues and expenses are translated into U.S. dollars using the average exchange rate over the period. Resulting currency translation adjustments are recorded in accumulated other comprehensive income (loss) in the consolidated balance sheets. We record net gains (losses) resulting from foreign exchange transactions in other expense, net in the consolidated statements of operations. For fiscal 2017, 2016 and 2015, we recorded net gains (losses) of $(0.8) million, zero and $(3.6) million, respectively.
We have foreign subsidiaries that operate and sell our products in various markets around the world. As a result, we are exposed to foreign exchange risks. We may utilize foreign exchange forward contracts to manage foreign currency risk associated with foreign currency denominated monetary assets and liabilities, primarily trade receivables, and to reduce the volatility of earnings and cash flows related to foreign currency transactions. There were no open contracts as of February 28, 2017 and February 29, 2016. The change in the fair value of these foreign currency forward contracts is recorded as gain (loss) in other expense, net in the consolidated statements of operations.
Accumulated Other Comprehensive Income (Loss)
The accumulated other comprehensive income (loss) balance consists of unrealized gains and losses on available-for-sale securities and translation gains and losses related to our international subsidiaries with functional currencies other than the U.S. dollar, primarily the Euro.
Recent Accounting Pronouncements
In March 2017, the Financial Accounting Standards Board (the "FASB") issued Accounting Standards Update No. 2017-08 ("ASU 2017-08"), which shortens the amortization period for certain callable debt securities held at a premium and requires the premium to be amortized to the earliest call date. ASU 2017-08 is effective for fiscal years beginning after December 15, 2018 and interim periods within those fiscal years, and early adoption is permitted, including in an interim period. If early adopted in an interim period, any adjustments should be reflected as of the beginning of the fiscal year that includes that interim period. ASU 2017-08 is to be applied on a modified retrospective basis through a cumulative-effect
77
adjustment directly to retained earnings as of the beginning of the period of adoption. We are currently evaluating the timing of adoption and do not expect the adoption of ASU 2017-08 to have a material impact on our consolidated financial statements.
In January 2017, the FASB issued Accounting Standards Update No. 2017-04 ("ASU 2017-04"), which eliminates Step 2 from the goodwill impairment test. Under ASU 2017-04, an entity should perform its annual, or interim, goodwill impairment test by comparing the fair value of a reporting unit with its carrying amount. An entity should recognize an impairment charge for the amount by which the carrying amount exceeds the reporting unit’s fair value; however, the loss recognized should not exceed the total amount of goodwill allocated to that reporting unit. Additionally, an entity should consider income tax effects from any tax deductible goodwill on the carrying amount of the reporting unit when measuring the goodwill impairment loss, if applicable. ASU 2017-04 is effective for annual or any interim goodwill impairment tests in fiscal years beginning after December 15, 2019, and early adoption is permitted for impairment tests performed on testing dates after January 1, 2017. ASU 2017-04 is to be applied on a prospective basis. We are currently evaluating the timing of adoption and do not expect the adoption of ASU 2017-04 to have a material impact on our consolidated financial statements.
In January 2017, the FASB issued Accounting Standards Update No. 2017-01 ("ASU 2017-01"), which clarifies the definition of a business, with the objective of adding guidance to assist entities with evaluating whether transactions should be accounted for as acquisitions (or disposals) of assets or businesses. ASU 2017-01 is effective for fiscal years beginning after December 15, 2017 and interim periods within those fiscal years, and early adoption is permitted for transactions which occur before the issuance or effective date of the amendments, only when the transaction has not been reported in the financial statements that have been issued or made available for issuance. ASU 2017-01 is to be applied on a prospective basis. We do not intend to early adopt ASU 2017-01 and do not expect the adoption of ASU 2017-01 to have a material impact on our consolidated financial statements.
In November 2016, the FASB issued Accounting Standards Update No. 2016-18 ("ASU 2016-18"), which requires a statement of cash flows to explain the change during the period in the total of cash, cash equivalents and amounts generally described as restricted cash or restricted cash equivalents. Amounts generally described as restricted cash and restricted cash equivalents should be included with cash and cash equivalents when reconciling the beginning-of-period and end-of-period total amounts shown on the statement of cash flows. ASU 2016-18 is effective for fiscal years beginning after December 15, 2017 and interim periods within those fiscal years, and early adoption is permitted, including in an interim period. If early adopted in an interim period, any adjustments should be reflected as of the beginning of the fiscal year that includes that interim period. ASU 2016-18 is to be applied through a retrospective transition method to each period presented. We are currently evaluating the timing of adoption and do not expect the adoption of ASU 2016-18 to have a material impact on our consolidated statements of cash flows.
In October 2016, the FASB issued Accounting Standards Update No. 2016-17 ("ASU 2016-17") to amend Accounting Standards Update No. 2015-02 ("ASU 2015-02"), Consolidation (Topic 810): Amendments to the Consolidation Analysis, which addresses how a reporting entity that is the single decision maker of a variable interest entity ("VIE") should treat indirect interests in the entity held through related parties that are under common control with the reporting entity when determining whether it is the primary beneficiary of that VIE. ASU 2016-17 is effective for fiscal years beginning after December 15, 2016 and interim periods within those fiscal years. Since we adopted ASU 2015-02 in fiscal 2017, ASU 2016-17 is to be applied retrospectively to all relevant prior periods beginning with the first quarter of fiscal 2017. We do not expect the adoption of ASU 2016-17 to have a material impact on our consolidated financial statements.
In August 2016, the FASB issued Accounting Standards Update No. 2016-15 ("ASU 2016-15") which addresses eight cash flow classification issues. ASU 2016-15 is effective for fiscal years beginning after December 15, 2017 and interim periods within those fiscal years, and early adoption is permitted, including in an interim period. If early adopted in an interim period, any adjustments should be reflected as of the beginning of the fiscal year that includes that interim period. Early adoption requires the adoption of all the amendments in the same period. ASU 2016-15 is to be applied through a retrospective transition method to each period presented. If it is impracticable to apply retrospectively for some of the issues, the amendments for those issues would be applied prospectively as of the earliest date practicable. We are currently evaluating the timing of adoption and do not expect the adoption of ASU 2016-15 to have a material impact on our consolidated statements of cash flows.
In June 2016, the FASB issued Accounting Standards Update No. 2016-13 ("ASU 2016-13") which requires measurement and recognition of expected credit losses for financial assets held. ASU 2016-13 is effective for fiscal years beginning after December 15, 2019 and interim periods within those fiscal years, and early adoption is permitted as of the fiscal years beginning after December 15, 2018, including interim periods within those fiscal years. ASU 2016-13 is to be applied through a cumulative-effect adjustment to retained earnings as of the beginning of the first reporting period in which the guidance is
78
effective. We are currently evaluating the timing and the impact of adopting ASU 2016-13 on our consolidated financial statements.
In March 2016, the FASB issued Accounting Standards Update No. 2016-09 ("ASU 2016-09") to simplify employee shared-based payment accounting. ASU 2016-09 is effective for fiscal years beginning after December 15, 2016 and interim periods within those fiscal years. Amendments related to the timing of when excess tax benefits are recognized, minimum statutory withholding requirements and forfeitures should be applied using a modified retrospective transition method by means of a cumulative-effect adjustment to equity as of the beginning of the period in which the guidance is adopted. Amendments related to the presentation of employee taxes paid on the statement of cash flows when an employer withholds shares to meet the minimum statutory withholding requirement should be applied retrospectively. Amendments requiring recognition of excess tax benefits and tax deficiencies in the income statement and the practical expedient for estimating expected term should be applied prospectively. An entity may elect to apply the amendments related to the presentation of excess tax benefits on the statement of cash flows using either a prospective transition method or a retrospective transition method. We are currently evaluating the impact of adopting ASU 2016-09 on our consolidated financial statements.
In March 2016, the FASB issued Accounting Standards Update No. 2016-07 ("ASU 2016-07") to eliminate the requirement to retroactively adopt the equity method of accounting for an investment that qualifies for use of the equity method as a result of an increase in the level of ownership interest or degree of influence. ASU 2016-07 requires that the equity method investor add the cost of acquiring the additional interest in the investee to the current basis of the investor’s previously held interest and adopt the equity method of accounting as of the date the investment becomes qualified for equity method accounting. For an available-for-sale equity security that becomes qualified for the equity method of accounting, an entity is required to recognize through earnings the unrealized holding gain or loss in accumulated other comprehensive income (loss) at the date the investment becomes qualified for use of the equity method. ASU 2016-07 is effective for fiscal years beginning after December 15, 2016 and interim periods within those years. ASU 2016-07 is to be applied prospectively upon their effective date to increases in the level of ownership interest or degree of influence that result in the adoption of the equity method. We do not expect the adoption of ASU 2016-07 to have a material impact on our consolidated financial statements.
In February 2016, the FASB issued Accounting Standards Update No. 2016-02 ("Topic 842") to amend lease accounting requirements and requires entities to generally recognize on the balance sheet operating and financing lease liabilities and corresponding right-of-use assets. Topic 842 will require significant additional disclosures about the amount, timing and uncertainty of cash flows from leases. Topic 842 is effective for fiscal years beginning after December 15, 2018 and interim periods within those years, and early adoption is permitted. Topic 842 is to be applied using a modified retrospective approach and includes a number of optional practical expedients that entities may elect to apply. We are currently evaluating the timing and the impact of adopting Topic 842 on our consolidated financial statements and expect that most of our operating lease commitments will be subject to Topic 842 and recognized as operating lease liabilities and right-of-use assets upon the adoption.
In January 2016, the FASB issued Accounting Standards Update No. 2016-01 ("ASU 2016-01") to enhance the reporting model for financial instruments by amending certain aspects of recognition, measurement, presentation and disclosure of financial instruments. ASU 2016-01 is effective for fiscal years beginning after December 15, 2017 and interim periods within those years. Early application to financial statements of fiscal years or interim periods that have not yet been issued is permitted by presenting separately in other comprehensive income the portion of the total change in the fair value of a liability resulting from a change in the instrument-specific credit risk if we elected to measure the liability at fair value in accordance with the fair value option for financial instruments, otherwise, early adoption is not permitted. ASU 2016-01 is to be applied with a cumulative-effect adjustment to the balance sheet as of the beginning of the fiscal year of adoption. The amendments related to equity securities without readily determinable fair values (including disclosure requirements) should be applied prospectively to equity investments that exist as of the date of adoption. We are currently evaluating the impact of adopting ASU 2016-01 on our consolidated financial statements.
In May 2014, the FASB issued Accounting Standards Update No. 2014-09 ("Topic 606") which completed the joint effort by the FASB and the International Accounting Standards Board to clarify the principles for recognizing revenue and improving financial reporting. Topic 606 also provides guidance on the recognition of costs related to obtaining and fulfilling customer contracts. The FASB issued subsequent amendments to the initial guidance collectively under Topic 606. Topic 606 supersedes nearly all existing revenue recognition guidance under GAAP. The core principle of Topic 606 is to recognize revenues when promised goods or services are transferred to customers in an amount that reflects the consideration that is expected to be received for those goods or services. Topic 606 defines a five-step process to achieve this core principle, and more judgment and estimates may be required under the Topic 606 revenue recognition process than are required under existing GAAP, including identifying performance obligations in the contract, estimating the amount of variable consideration to include in the transaction price and allocating the transaction price to each separate performance obligation, among others.
79
Topic 606 is required to be effective for us as of the first quarter of fiscal 2019. While we are allowed to early adopt as of the first quarter of fiscal 2018, we do not intend to early adopt Topic 606, and accordingly, we will adopt the new standard effective March 1, 2018. Topic 606 allows for full retrospective adoption applied to all periods presented or retrospective adoption with the cumulative effect of initially applying Topic 606 recognized at the date of initial application. We are currently considering adopting using the full retrospective approach; however, our final decision will depend on a number of factors such as the significance of the impact of the new standard on our financial results, system readiness and our ability to accumulate and analyze the information necessary to assess the impact on prior period financial statements, as necessary.
Currently, we are in the process of reviewing our historical contracts and evaluating the impact of Topic 606 on our accounting policies, processes and system requirements, and have assigned internal resources and engaged third-party service providers to assist in our evaluation. Furthermore, we will continue to make investments in systems to enable timely and accurate reporting under the new standard. While we continue to assess all potential impacts under the new standard, there is the potential for significant changes to the pattern of revenue recognition for our arrangements resulting from, for example, the identification of performance obligations, inclusion of variable consideration in the transaction price, allocation of the transaction price based on relative standalone selling prices, timing of recognition, accounting for contract acquisition costs, among other areas, as well as the related financial statement disclosures. With respect to contract acquisition costs, we preliminarily believe that we will capitalize additional costs of obtaining the contract, including additional sales commissions, as the new cost guidance, as interpreted by the FASB Transition Resource Group for Revenue Recognition, requires the capitalization of all incremental costs that we incur to obtain a contract with a customer that we would not have incurred if the contract had not been obtained, provided we expect to recover the costs. Under our current accounting policy, we would only capitalize such costs if they are both incremental and directly related to acquiring the customer.
As we are in the initial stages of our evaluation of the impact of the new standard and the impact on our accounting policies across our multiple solutions, we do not know or cannot reasonably estimate quantitative information related to the impact of Topic 606 on our consolidated financial statements, including the effect on our operating results and our accounting for deferred commission balances, at this time.
2. Balance Sheet Information and Fair Value
Cash, Cash Equivalents and Marketable Securities
The following table summarizes our cash and cash equivalents by category (in thousands):
As of February 28/29, | |||||||
2017 | 2016 | ||||||
Cash and cash equivalents: | |||||||
Cash | $ | 103,726 | $ | 60,252 | |||
Money market funds | 16,468 | 58,402 | |||||
$ | 120,194 | $ | 118,654 | ||||
The following table summarizes our marketable securities by category (in thousands):
As of February 28, 2017 | |||||||||||||||
Amortized Cost | Gross Unrealized Gains | Gross Unrealized Losses | Fair Value | ||||||||||||
Asset-backed securities | $ | 9,597 | $ | 6 | $ | (28 | ) | $ | 9,575 | ||||||
Corporate debt securities | 41,822 | 11 | (140 | ) | 41,693 | ||||||||||
Foreign government bonds | 650 | — | (1 | ) | 649 | ||||||||||
Mortgage-backed securities | 3,324 | — | (22 | ) | 3,302 | ||||||||||
U.S. government agency securities | 12,707 | 1 | (77 | ) | 12,631 | ||||||||||
U.S. government notes | 12,092 | 2 | (29 | ) | 12,065 | ||||||||||
$ | 80,192 | $ | 20 | $ | (297 | ) | $ | 79,915 | |||||||
80
As of February 29, 2016 | |||||||||||||||
Amortized Cost | Gross Unrealized Gains | Gross Unrealized Losses | Fair Value | ||||||||||||
Asset-backed securities | $ | 4,717 | $ | 9 | $ | (3 | ) | $ | 4,723 | ||||||
Corporate debt securities | 19,135 | 11 | (22 | ) | 19,124 | ||||||||||
Equity securities | 3,095 | 380 | — | 3,475 | |||||||||||
Foreign government bonds | 205 | — | — | 205 | |||||||||||
Mortgage-backed securities | 2,341 | — | (13 | ) | 2,328 | ||||||||||
U.S. government agency securities | 2,242 | 6 | (14 | ) | 2,234 | ||||||||||
U.S. government notes | 4,279 | 26 | — | 4,305 | |||||||||||
$ | 36,014 | $ | 432 | $ | (52 | ) | $ | 36,394 | |||||||
We use the specific-identification method to determine any realized gains or losses from the sale of our marketable securities classified as available-for-sale. For fiscal 2017, we realized gross gains of $1.1 million. For fiscal 2016 and 2015, we realized insignificant amounts of gross gains. For all periods presented, we realized insignificant amounts of gross losses. We reflect these gains and losses as a component of other expense, net in our consolidated statements of operations.
The following table presents gross unrealized losses and fair values for those marketable securities that were in an unrealized loss position aggregated by investment category and the length of time that individual securities have been in a continuous loss position (in thousands):
As of February 28, 2017 | |||||||||||||||||||||||
Less Than 12 Months | 12 Months or Greater | Total | |||||||||||||||||||||
Fair Value | Unrealized Losses | Fair Value | Unrealized Losses | Fair Value | Unrealized Losses | ||||||||||||||||||
Asset-backed securities | $ | 6,086 | $ | (28 | ) | $ | — | $ | — | $ | 6,086 | $ | (28 | ) | |||||||||
Corporate debt securities | 35,095 | (140 | ) | — | — | 35,095 | (140 | ) | |||||||||||||||
Foreign government bonds | 650 | (1 | ) | — | — | 650 | (1 | ) | |||||||||||||||
Mortgage-backed securities | 3,204 | (22 | ) | — | — | 3,204 | (22 | ) | |||||||||||||||
U.S. government agency securities | 11,306 | (65 | ) | 731 | (12 | ) | 12,037 | (77 | ) | ||||||||||||||
U.S. government notes | 7,265 | (29 | ) | — | — | 7,265 | (29 | ) | |||||||||||||||
$ | 63,606 | $ | (285 | ) | $ | 731 | $ | (12 | ) | $ | 64,337 | $ | (297 | ) | |||||||||
As of February 29, 2016 | |||||||||||||||||||||||
Less Than 12 Months | 12 Months or Greater | Total | |||||||||||||||||||||
Fair Value | Unrealized Losses | Fair Value | Unrealized Losses | Fair Value | Unrealized Losses | ||||||||||||||||||
Asset-backed securities | $ | 1,788 | $ | (3 | ) | $ | — | $ | — | $ | 1,788 | $ | (3 | ) | |||||||||
Corporate debt securities | 12,088 | (22 | ) | — | — | 12,088 | (22 | ) | |||||||||||||||
Mortgage-backed securities | 1,746 | (8 | ) | 385 | (5 | ) | 2,131 | (13 | ) | ||||||||||||||
U.S. government agency securities | 887 | (10 | ) | 622 | (4 | ) | 1,509 | (14 | ) | ||||||||||||||
$ | 16,509 | $ | (43 | ) | $ | 1,007 | $ | (9 | ) | $ | 17,516 | $ | (52 | ) | |||||||||
Unrealized losses related to these investments are due to interest rate fluctuations as opposed to changes in credit quality. We do not intend to sell and it is not more likely than not that we would be required to sell these investments before recovery of
81
their amortized cost basis, which may be at maturity. As of February 28, 2017, we have recognized no other-than-temporary impairment loss. The following table classifies our marketable debt securities by contractual maturities (in thousands):
As of February 28, 2017 | |||
Due in 1 year | $ | 21,501 | |
Due in 1 year through 5 years | 50,657 | ||
Due in 5 years through 10 years | 3,583 | ||
Due after 10 years | 4,174 | ||
$ | 79,915 | ||
Fair Value Measurements
We determine fair value based on the fair value hierarchy, which requires an entity to maximize the use of observable inputs and minimize the use of unobservable inputs when measuring fair value. Fair value is defined as the price that would be received to sell an asset or paid to transfer a liability in an orderly transaction between market participants at the measurement date. The fair value assumes that the transaction to sell the asset or transfer the liability occurs in the principal or most advantageous market for the asset or liability and establishes that the fair value of an asset or liability shall be determined based on the assumptions that market participants would use in pricing the asset or liability. The classification of a financial asset or liability within the hierarchy is based upon the lowest level input that is significant to the fair value measurement. The fair value hierarchy prioritizes the inputs into three levels that may be used to measure fair value:
Level 1: | Inputs are unadjusted quoted prices in active markets for identical assets or liabilities. |
Level 2: | Inputs are quoted prices for similar assets and liabilities in active markets or inputs that are observable for the asset or liability, either directly or indirectly through market corroboration, for substantially the full term of the financial instrument. |
Level 3: | Inputs are unobservable inputs based on our assumptions. |
Cash equivalents and marketable equity securities are classified within Level 1 because they are valued using quoted market prices or alternative pricing sources and models utilizing market observable inputs. Marketable debt securities and derivative assets are classified within Level 2 if the investments are valued using model driven valuations which use observable inputs such as quoted market prices, benchmark yields, reported trades, broker/dealer quotes or alternative pricing sources with reasonable levels of price transparency. Our marketable securities are held by custodians who obtain investment prices from a third-party pricing provider that incorporates standard inputs in various asset price models.
We estimated the fair value of our Level 3 contingent consideration liabilities based on a weighted probability assessment of achieving the milestones related to certain of our acquisitions. Significant increases (decreases) in the probability assumptions in isolation would result in a significantly higher (lower) fair value measurement. In developing these estimates, we considered unobservable inputs that are supported by little or no market activity and reflect our own assumptions.
Financial assets measured at fair value on a recurring basis are summarized below (in thousands):
82
As of February 28, 2017 | |||||||||||||||
Level 1 | Level 2 | Level 3 | Total | ||||||||||||
Cash equivalents: | |||||||||||||||
Money market funds | $ | 16,468 | $ | — | $ | — | $ | 16,468 | |||||||
Marketable securities: | |||||||||||||||
Asset-backed securities | $ | — | $ | 9,575 | $ | — | $ | 9,575 | |||||||
Corporate debt securities | $ | — | $ | 41,693 | $ | — | $ | 41,693 | |||||||
Foreign government bonds | $ | — | $ | 649 | $ | — | $ | 649 | |||||||
Mortgage-backed securities | $ | — | $ | 3,302 | $ | — | $ | 3,302 | |||||||
U.S. government agency securities | $ | — | $ | 12,631 | $ | — | $ | 12,631 | |||||||
U.S. government notes | $ | — | $ | 12,065 | $ | — | $ | 12,065 | |||||||
Other accrued liabilities (current): | |||||||||||||||
Contingent consideration liability | $ | — | $ | — | $ | 902 | $ | 902 | |||||||
As of February 29, 2016 | |||||||||||||||
Level 1 | Level 2 | Level 3 | Total | ||||||||||||
Cash equivalents: | |||||||||||||||
Money market funds | $ | 58,402 | $ | — | $ | — | $ | 58,402 | |||||||
Marketable securities: | |||||||||||||||
Asset-backed securities | $ | — | $ | 4,723 | $ | — | $ | 4,723 | |||||||
Corporate debt securities | $ | — | $ | 19,124 | $ | — | $ | 19,124 | |||||||
Equity securities | $ | 3,475 | $ | — | $ | — | $ | 3,475 | |||||||
Foreign government bonds | $ | — | $ | 205 | $ | — | $ | 205 | |||||||
Mortgage-backed securities | $ | — | $ | 2,328 | $ | — | $ | 2,328 | |||||||
U.S. government agency securities | $ | — | $ | 2,234 | $ | — | $ | 2,234 | |||||||
U.S. government notes | $ | — | $ | 4,305 | $ | — | $ | 4,305 | |||||||
Other accrued liabilities (current): | |||||||||||||||
Contingent consideration liability | $ | — | $ | — | $ | 1,160 | $ | 1,160 | |||||||
Other long-term liabilities: | |||||||||||||||
Contingent consideration liability | $ | — | $ | — | $ | 161 | $ | 161 | |||||||
The following table summarizes the change in fair value of our Level 3 contingent consideration amounts (in thousands):
Balance as of February 29, 2016 | $ | 1,321 | |
Total remeasurement recognized in earnings | (419 | ) | |
Balance as of February 28, 2017 | $ | 902 | |
The contingent consideration remeasurement for fiscal 2017 was recognized within research and development expense in the consolidated statements of operations. Refer to Note 3 to the Consolidated Financial Statements for additional information.
Assets Measured at Fair Value on a Non-Recurring Basis
We periodically review our intangible and other long-lived assets for impairment whenever events or changes in circumstances indicate that the carrying amount of such assets may not be recoverable. Determination of recoverability is based on the lowest level of identifiable estimated undiscounted cash flows resulting from use of the asset and its eventual disposition. If not recoverable, an impairment loss would be calculated based on the excess of the carrying amount over the fair value.
We utilized an income approach to estimate the fair value and the inputs used are classified as Level 3 within the fair value hierarchy due to the significance of unobservable inputs using company-specific information. In fiscal 2016, we determined there was an impairment due to a decrease in the projected cash flows related to certain developed technologies and
83
customer relationships. We recorded an impairment charge of $1.2 million associated with these assets, included as amortization expense within cost of revenue and sales and marketing expenses in the consolidated statements of operations. No impairment charges were recorded in fiscal 2017 and 2015.
Inventories, Net
Inventories, net consisted of the following (in thousands):
As of February 28/29, | |||||||
2017 | 2016 | ||||||
Raw materials | $ | 3,479 | $ | 2,459 | |||
Finished goods | 2,878 | 3,659 | |||||
Reserves | (510 | ) | (470 | ) | |||
$ | 5,847 | $ | 5,648 | ||||
Deferred Costs
Deferred costs consisted of the following (in thousands):
As of February 28/29, | |||||||
2017 | 2016 | ||||||
Appliance | $ | 39,474 | $ | 41,548 | |||
Commissions | 20,409 | 17,414 | |||||
$ | 59,883 | $ | 58,962 | ||||
Property and Equipment, Net
Property and equipment, net consisted of the following (in thousands):
As of February 28/29, | |||||||
2017 | 2016 | ||||||
Land | $ | 9,849 | $ | 9,578 | |||
Building | 6,549 | 6,549 | |||||
Computer hardware and software | 32,850 | 26,450 | |||||
Vehicles, machinery and equipment | 4,797 | 4,711 | |||||
Leasehold improvements | 4,379 | 4,401 | |||||
58,424 | 51,689 | ||||||
Accumulated depreciation and amortization | (28,445 | ) | (19,779 | ) | |||
$ | 29,979 | $ | 31,910 | ||||
Depreciation and amortization expense related to property and equipment was $9.2 million, $7.7 million and $5.2 million for fiscal 2017, 2016 and 2015, respectively.
Other Investments
As of February 28, 2017 and February 29, 2016, we held approximately $1.8 million and $1.6 million, or approximately 23% and 24% ownership interest, respectively, in stock of a privately-held company that was accounted for under the equity method. We recognize our proportional share of earnings and losses of the investee in other expense, net in the statements of operations and adjust the carrying amount of our investment accordingly. For fiscal 2017 and 2016, our proportionate share of the investee’s losses was $0.3 million and $0.4 million, respectively. For fiscal 2015, our proportionate share of the investee’s earnings and losses was not material.
84
As of February 28, 2017 and February 29, 2016, we held approximately $2.3 million and $1.6 million, respectively, in stock of a privately-held company, which was accounted for under the cost method.
Other investments are classified in other non-current assets in the consolidated balance sheets and are reviewed periodically for impairment.
Accumulated Other Comprehensive Income (Loss)
The components of accumulated other comprehensive income (loss), net of tax, were as follows (in thousands):
Foreign Currency Translation Adjustments | Unrealized Gain (Loss) on Available-for- Sale Investments | Total | |||||||||
Balance as of February 29, 2016 | $ | (4,894 | ) | $ | 385 | $ | (4,509 | ) | |||
Other comprehensive income (loss) before reclassifications | (60 | ) | 73 | 13 | |||||||
Amounts reclassified from accumulated other comprehensive income (loss) | — | (730 | ) | (730 | ) | ||||||
Other comprehensive loss | (60 | ) | (657 | ) | (717 | ) | |||||
Balance as of February 28, 2017 | $ | (4,954 | ) | $ | (272 | ) | $ | (5,226 | ) | ||
3. Acquisitions
Fiscal 2017
Sookasa, Inc.
In March 2016, we acquired Sookasa, Inc. ("Sookasa"), a provider of encryption, security and compliance solutions for cloud-based integration partners. We acquired all of the outstanding equity interests of Sookasa for cash consideration of $0.3 million, which included the settlement of the outstanding indebtedness of Sookasa with SVB Financial Group, and the issuance of 10,000 shares of our common stock to SVB Financial Group in connection with such settlement. The total aggregate consideration, inclusive of cash, debt settlement and equity, was approximately $0.4 million, of which $0.4 million was allocated to goodwill. The goodwill is primarily attributable to the acquired assembled workforce and is not expected to be deductible for income tax purposes.
The results of operations of Sookasa, since the acquisition date, were not material to our consolidated results of operations for the fiscal year ended February 28, 2017. The following unaudited pro forma information presents the combined results of operations of Barracuda and Sookasa as if the acquisition had been completed on March 1, 2015, the beginning of the comparable prior annual reporting period. The unaudited pro forma information does not reflect any cost saving synergies from operating efficiencies or the effect of the incremental costs incurred in integrating the two companies. Accordingly, this unaudited pro forma information is presented for informational purposes only and is not necessarily indicative of what the actual results of operations of the combined company would have been if the acquisition had occurred at the beginning of the period presented, nor are they indicative of future results of operations.
Year Ended February 28/29, | |||||||
2017 | 2016 | ||||||
(in thousands) | |||||||
Pro forma revenue | $ | 352,660 | $ | 320,411 | |||
Pro forma net income (loss) | $ | 10,151 | $ | (7,569 | ) | ||
Fiscal 2016
Intronis, Inc.
In October 2015, we acquired all outstanding equity interests of Intronis, a leader in providing data protection solutions to managed service providers. The acquisition expanded our channel reach with the addition of Intronis’ existing customer base and its purpose-built platform designed to streamline how managed service providers service the data protection needs of their end customers. The aggregate purchase consideration was $65.3 million in cash. During fiscal 2017, we made payments of $6.7
85
million related to amounts held back, at the acquisition date, for potential indemnification obligations of the equityholders of Intronis.
We recorded the assets acquired and liabilities assumed at their estimated fair value, with the difference between the fair value of the net assets acquired and the purchase consideration reflected as goodwill. The following table reflects the fair values of assets acquired and liabilities assumed subsequent to the measurement period adjustments (in thousands):
Cash | $ | 2,327 | |
Accounts receivable | 376 | ||
Other current assets | 654 | ||
Property and equipment | 4,203 | ||
Other non-current assets | 750 | ||
Developed technology | 21,500 | ||
Customer relationships | 11,870 | ||
Trade name | 300 | ||
Goodwill | 29,718 | ||
Accounts payable | (685 | ) | |
Accrued expenses | (1,149 | ) | |
Deferred revenue (current) | (649 | ) | |
Deferred tax liabilities | (3,930 | ) | |
Total value of assets acquired and liabilities assumed | $ | 65,285 | |
As of the acquisition date, Intronis’ developed technology, customer relationships and trade name had weighted-average useful lives of 7.0 years, 7.0 years and 4.0 years, respectively. The total weighted-average useful life of these acquired intangible assets is 7.0 years. The goodwill is primarily attributed to the synergies expected to be realized following the acquisition. Goodwill is not expected to be deductible for income tax purposes.
Included in our results of operations for fiscal 2016 are $9.4 million and $1.3 million of revenue and net loss, respectively, attributable to Intronis since the acquisition.
The following unaudited pro forma information presents the combined results of operations of Barracuda and Intronis as if the acquisition had been completed on March 1, 2014, the beginning of the comparable prior annual reporting period. The unaudited pro forma information includes (i) amortization associated with estimates for the acquired intangible assets; and (ii) the associated tax impact on these unaudited pro forma adjustments and certain changes in judgment of valuation allowance as a combined business. The unaudited pro forma information does not reflect any cost saving synergies from operating efficiencies or the effect of the incremental costs incurred in integrating the two companies. Accordingly, this unaudited pro forma information is presented for informational purposes only and is not necessarily indicative of what the actual results of operations of the combined company would have been if the acquisition had occurred at the beginning of the period presented, nor are they indicative of future results of operations.
Year Ended February 28/29, | |||||||
2016 | 2015 | ||||||
(in thousands) | |||||||
Pro forma revenue | $ | 333,963 | $ | 295,738 | |||
Pro forma net loss | $ | (12,727 | ) | $ | (67,665 | ) | |
Other
In July 2015, we completed an acquisition for total consideration of approximately $1.1 million, which included an estimated fair value for contingent consideration of $0.3 million. $0.7 million was allocated to intangible assets and $0.3 million to goodwill. The goodwill is primarily attributed to the synergies expected to be realized following the acquisition and is expected to be deductible for income tax purposes. As of the acquisition date, customer relationships and developed technology had weighted-average useful lives of 7.0 years and 1.0 year, respectively. The results of operations, since the acquisition date, and pro forma information were not material to our consolidated results of operations for the year ended February 29, 2016.
86
As of February 28, 2017, we estimated the fair value of the contingent consideration liability to be $0.2 million.
Fiscal 2015
C2C Systems Limited
In August 2014, we completed our acquisition of C2C Systems Limited ("C2C"), a provider of personal storage table file management, email archiving and information management solutions based in the United Kingdom, and were required to pay contingent consideration up to $4.9 million upon the attainment of certain billings levels and performance integration targets through August 2017. As of February 28, 2017 and February 29, 2016, we estimated the fair value of the contingent consideration liability to be $0.7 million and $1.2 million, respectively. In fiscal 2017, $0.5 million was recorded as a reduction of research and development expenses and, in fiscal 2016, $1.9 million was recorded as a reduction of research and development and sales and marketing expenses.
During the fourth quarter of fiscal 2017, as part of a legal settlement, an agreement was reached to resolve all potential amounts due, or which could become due, to the shareholders of C2C in connection with the acquisition, including obligations for the contingent consideration and the purchase consideration held back for potential indemnification claims. We agreed to pay approximately $1.25 million which would settle the contingent consideration liability of $0.7 million and the purchase consideration held back for potential indemnification claims of $0.5 million. All payments were made in March 2017. Refer to Note 9 to the Consolidated Financial Statements for additional information regarding the settlement of the C2C legal matter.
4. Goodwill and Intangible Assets
The changes in the carrying amount of goodwill are summarized as follows (in thousands):
Balance as of February 29, 2016 | $ | 69,595 | |
Goodwill acquired | 409 | ||
Effect of foreign exchange rates | (209 | ) | |
Balance as of February 28, 2017 | $ | 69,795 | |
As of February 28, 2017, no impairment of goodwill has been identified.
Intangible assets subject to amortization are summarized as follows (in thousands):
As of February 28, 2017 | |||||||||||
Gross Carrying Amount | Accumulated Amortization | Net Carrying Value | |||||||||
Acquired developed technology | $ | 50,013 | $ | (30,105 | ) | $ | 19,908 | ||||
Customer relationships | 19,736 | (9,348 | ) | 10,388 | |||||||
Patents | 2,999 | (1,781 | ) | 1,218 | |||||||
Trade name | 812 | (375 | ) | 437 | |||||||
$ | 73,560 | $ | (41,609 | ) | $ | 31,951 | |||||
As of February 29, 2016 | |||||||||||
Gross Carrying Amount | Accumulated Amortization | Net Carrying Value | |||||||||
Acquired developed technology | $ | 50,082 | $ | (25,643 | ) | $ | 24,439 | ||||
Customer relationships | 19,809 | (7,313 | ) | 12,496 | |||||||
Patents | 2,999 | (1,295 | ) | 1,704 | |||||||
Trade name | 812 | (259 | ) | 553 | |||||||
$ | 73,702 | $ | (34,510 | ) | $ | 39,192 | |||||
87
Certain intangible assets were removed from the presentation above as they were fully amortized as of the periods presented above. In addition to the above, we maintain other intangible assets not subject to amortization of $0.2 million as of February 28, 2017 and February 29, 2016.
Amortization expense, including impairment charges, for fiscal 2017, 2016 and 2015 was $7.2 million, $5.6 million and $3.4 million, respectively.
As of February 28, 2017, amortization expense for intangible assets for each of the next five years is as follows: $6.9 million in fiscal 2018, $6.0 million in fiscal 2019, $5.8 million in fiscal 2020, $5.3 million in fiscal 2021, $4.9 million in fiscal 2022 and $3.1 million thereafter.
5. Stockholders’ Equity (Deficit)
Authorized Stock
We are authorized to issue 1,020,000,000 shares, consisting of 1,000,000,000 shares of common stock, par value $0.001 per share, and 20,000,000 shares of preferred stock, par value $0.001 per share. Our board of directors is authorized, without stockholder approval, except as required by the listing standards of the New York Stock Exchange, to issue additional shares of our capital stock.
Common Stock
Dividend Rights—Subject to preferences that may apply to any shares of preferred stock outstanding at the time, the holders of our common stock are entitled to receive dividends out of funds legally available if our board of directors, in its discretion, determines to issue dividends and then only at the times and in the amounts that our board of directors may determine.
Voting Rights—Holders of our common stock are entitled to one vote for each share held on all matters submitted to a vote of stockholders.
Preemptive or Similar Rights—Our common stock is not entitled to preemptive rights, and is not subject to conversion, redemption or sinking fund provisions.
Liquidation Distributions—If we become subject to a liquidation, dissolution or winding-up, the assets legally available for distribution to our stockholders would be distributable ratably among the holders of our common stock and any participating preferred stock outstanding at that time, subject to prior satisfaction of all outstanding debt and liabilities and the preferential rights of and the payment of liquidation preferences, if any, on any outstanding shares of preferred stock.
Preferred Stock
Our board of directors is authorized to issue preferred stock in one or more series, to establish the number of shares to be included in each series, and to fix the designation, powers, preferences and rights of the shares of each series and any of its qualifications, limitations or restrictions. Our board of directors may also authorize the issuance of preferred stock with voting or conversion rights that could adversely affect the voting power or other rights of the holders of our common stock.
Employee Stock Purchase Plan
Our ESPP allows eligible employee participants to purchase shares of our common stock at a discount through payroll deductions. The ESPP consists of offering periods that are approximately six months in length and employees may purchase shares in each period at 85% of the lower of our fair market value on the first trading day of each offering period or on the purchase date. The ESPP will continue until the earlier to occur of (i) the termination of the ESPP by our board of directors, or (ii) June 15, 2035. As of February 28, 2017, we had reserved 673,745 shares of our common stock for issuance under the ESPP and all such shares remain available for future issuance.
The following weighted-average input assumptions were used to estimate the fair value of ESPP grants:
88
Year Ended February 28/29, | |||||||||||
2017 | 2016 | 2015 | |||||||||
Expected volatility | 40 | % | 42 | % | — | % | |||||
Expected term (in years) | 0.50 | 0.50 | 0.00 | ||||||||
Risk-free interest rate | 0.41 | % | 0.27 | % | — | % | |||||
Dividend yield | — | — | — | ||||||||
Estimated fair value of stock options granted during the year | $ | 5.25 | $ | 5.37 | $ | — | |||||
Stock Option Plan and Restricted Stock Units
Our stock plans provide for the grant of stock options, stock appreciation rights, restricted stock and restricted stock units ("RSUs") to employees, directors and contractors. Options granted are exercisable for periods not to exceed 10 years. Options and RSUs granted typically vest over three or four years, contingent upon employment or service with us on the vesting date. The following table presents shares authorized and available for grant:
Shares Available for Grant | ||
Balance at February 29, 2016 | 6,360,677 | |
Authorized | 2,346,083 | |
Granted | (2,232,166 | ) |
Canceled/forfeited | 1,113,224 | |
Balance at February 28, 2017 | 7,587,818 | |
The following weighted-average input assumptions were used to estimate the fair value of employee stock option grants:
Year Ended February 28/29, | |||||||||||
2017 | 2016 | 2015 | |||||||||
Expected volatility | 44 | % | 43 | % | 45 | % | |||||
Expected term (in years) | 6.21 | 6.25 | 6.25 | ||||||||
Risk-free interest rate | 1.52 | % | 1.80 | % | 1.87 | % | |||||
Dividend yield | — | — | — | ||||||||
Estimated fair value of stock options granted during the year | $ | 7.95 | $ | 13.80 | $ | 13.98 | |||||
The following table summarizes stock option activity under our plans:
Options Outstanding | ||||||||||||
Shares | Weighted- Average Exercise Price | Weighted- Average Remaining Contractual Term | Aggregate Intrinsic Value | |||||||||
(in years) | ||||||||||||
Balance at February 29, 2016 | 4,208,201 | $ | 20.42 | |||||||||
Granted | 279,746 | $ | 20.04 | |||||||||
Exercised | (622,848 | ) | $ | 12.52 | ||||||||
Canceled/forfeited | (350,821 | ) | $ | 27.86 | ||||||||
Balance at February 28, 2017 | 3,514,278 | $ | 21.05 | |||||||||
As of February 28, 2017: | ||||||||||||
Vested and exercisable | 2,580,061 | $ | 18.60 | 6.00 | $ | 19,423,229 | ||||||
Vested and expected to vest | 3,435,251 | $ | 20.78 | 6.49 | $ | 21,317,808 | ||||||
During fiscal 2017, 2016 and 2015, the total grant-date fair value of stock options vested was $7.9 million, $10.5 million and $7.5 million, respectively. During fiscal 2017, 2016 and 2015, the aggregate intrinsic value of stock option awards
89
exercised, which is measured as the difference between the exercise price and the value of our common stock at the date of exercise, was $5.1 million, $8.6 million and $33.1 million, respectively.
As of February 28, 2017, there was $9.2 million of unrecognized compensation cost related to outstanding stock options, net of forecasted forfeitures, expected to be recognized over a weighted-average period of 1.92 years. To the extent the actual forfeiture rate is different from what we have estimated, stock-based compensation related to these options will be different from our expectations.
The following table summarizes RSU activity under our plan:
Unvested Restricted Stock Units | ||||||
Number of Shares | Weighted- Average Grant Date Fair Value | |||||
Unvested at February 29, 2016 | 2,450,819 | $ | 25.38 | |||
Granted | 1,952,420 | $ | 19.46 | |||
Vested | (882,851 | ) | $ | 23.18 | ||
Canceled/forfeited | (427,911 | ) | $ | 22.83 | ||
Unvested at February 28, 2017 | 3,092,477 | $ | 22.62 | |||
Expected to vest after February 28, 2017 | 2,719,152 | $ | 22.71 | |||
As of February 28, 2017, there was $49.0 million of unrecognized compensation cost related to unvested RSUs, net of forecasted forfeitures. This amount is expected to be recognized over a weighted-average period of 2.71 years. To the extent the actual forfeiture rate is different from what we have estimated, stock-based compensation related to these RSUs will be different from our expectations.
Total stock-based compensation expense has been classified as follows in the consolidated statements of operations (in thousands):
Year Ended February 28//29, | |||||||||||
2017 | 2016 | 2015 | |||||||||
Cost of revenue | $ | 1,367 | $ | 1,062 | $ | 389 | |||||
Research and development | 11,651 | 8,247 | 4,410 | ||||||||
Sales and marketing | 8,074 | 6,566 | 3,811 | ||||||||
General and administrative | 11,613 | 12,971 | 8,448 | ||||||||
$ | 32,705 | $ | 28,846 | $ | 17,058 | ||||||
Stock Repurchase Program
In September 2015, our board of directors authorized a stock repurchase program to repurchase shares of our common stock for an aggregate purchase price not to exceed $50.0 million through September 30, 2017. The stock repurchase program does not obligate us to repurchase any specific dollar amount or to acquire any specific number of shares. Stock will be purchased from time to time, in the open market or through private transactions, subject to market condition, in compliance with applicable state and federal securities laws. The timing and amount of repurchases, if any, will depend upon several factors, including market and business conditions, the trading price of our common stock and the nature of other investment opportunities.
The following table summarizes our common stock repurchases (in thousands, except per share data):
Year Ended February 28//29, | |||||||||||
2017 | 2016 | 2015 | |||||||||
Total number of shares repurchased | 498 | 1,503 | — | ||||||||
Dollar amount of shares repurchased | $ | 7,596 | $ | 19,216 | $ | — | |||||
Average price paid per share | $ | 15.25 | $ | 12.79 | $ | — | |||||
Remaining amount authorized as of the end of period | $ | 23,188 | $ | 30,784 | $ | — | |||||
90
6. Income Taxes
Income (loss) before income taxes consists of the following (in thousands):
Year Ended February 28/29, | |||||||||||
2017 | 2016 | 2015 | |||||||||
United States | $ | 12,276 | $ | (7,792 | ) | $ | (7,326 | ) | |||
Foreign | 9,712 | 643 | 2,730 | ||||||||
$ | 21,988 | $ | (7,149 | ) | $ | (4,596 | ) | ||||
The provision for (benefit from) income taxes consists of the following (in thousands):
Year Ended February 28/29, | |||||||||||
2017 | 2016 | 2015 | |||||||||
Current: | |||||||||||
Federal | $ | 7,880 | $ | 2,519 | $ | 2,479 | |||||
State | 1,439 | 839 | 299 | ||||||||
Foreign | 792 | 507 | 863 | ||||||||
10,111 | 3,865 | 3,641 | |||||||||
Deferred: | |||||||||||
Federal | 357 | (2,707 | ) | 51,820 | |||||||
State | 13 | (850 | ) | 4,674 | |||||||
Foreign | 1,272 | (3,035 | ) | 2,767 | |||||||
1,642 | (6,592 | ) | 59,261 | ||||||||
$ | 11,753 | $ | (2,727 | ) | $ | 62,902 | |||||
Deferred tax assets (liabilities) comprise the following (in thousands):
As of February 28/29, | |||||||
2017 | 2016 | ||||||
Deferred tax assets: | |||||||
Deferred revenue | $ | 65,152 | $ | 63,357 | |||
Stock-based compensation | 9,335 | 6,983 | |||||
Accruals and other | 5,228 | 4,606 | |||||
Research and development credits | 5,436 | 6,484 | |||||
Net operating losses | 9,424 | 12,705 | |||||
Total deferred tax assets | 94,575 | 94,135 | |||||
Valuation allowance | (77,513 | ) | (73,399 | ) | |||
Total deferred tax assets, net of valuation allowance | 17,062 | 20,736 | |||||
Deferred tax liabilities: | |||||||
Depreciation and amortization | (12,642 | ) | (14,954 | ) | |||
Prepaid expense and other | (1,372 | ) | (1,151 | ) | |||
Deferred sales commission | (4,297 | ) | (4,117 | ) | |||
Total deferred tax liabilities | (18,311 | ) | (20,222 | ) | |||
Net deferred tax assets (liabilities) | $ | (1,249 | ) | $ | 514 | ||
91
The following is a reconciliation of the statutory federal income tax rate to our effective tax rate (in thousands):
Year Ended February 28/29, | |||||||||||
2017 | 2016 | 2015 | |||||||||
Tax expense (benefit) at federal statutory rate | $ | 7,696 | $ | (2,502 | ) | $ | (1,608 | ) | |||
State taxes, net of federal benefit | 1,071 | (363 | ) | 4,845 | |||||||
Non-deductible expenses | 295 | 368 | 823 | ||||||||
Stock-based compensation | 1,241 | 2,134 | 520 | ||||||||
Transaction costs | 179 | 732 | (1,454 | ) | |||||||
Change in valuation allowance | 3,291 | 1,674 | 58,685 | ||||||||
Foreign rate differential | 941 | (2,752 | ) | 2,730 | |||||||
Research and development credits | (1,995 | ) | (2,482 | ) | (1,792 | ) | |||||
Domestic production activities deduction | (769 | ) | (63 | ) | — | ||||||
Litigation settlements | — | 584 | — | ||||||||
Other | (197 | ) | (57 | ) | 153 | ||||||
$ | 11,753 | $ | (2,727 | ) | $ | 62,902 | |||||
In assessing the realization of deferred tax assets, management considers whether it is more likely than not that some portion or all of deferred assets will be realized. The ultimate realization of the deferred tax assets is dependent upon the generation of future taxable income during the periods in which those temporary differences become deductible.
In fiscal 2015, we established a valuation allowance against a significant portion of our deferred tax assets, including U.S. federal and state deferred tax assets and certain foreign deferred tax assets, because realization of these tax benefits through future taxable income did not meet the more-likely-than-not threshold. We intend to maintain the valuation allowances until sufficient positive evidence exists to support its reversal. A valuation allowance of $77.5 million and $73.4 million is provided against our deferred tax assets as of February 28, 2017 and February 29, 2016, respectively, primarily related to temporary differences, foreign net operating losses, research credits and net operating losses acquired as part of our acquisitions. The net change in valuation allowance for the year ended February 28, 2017 was $4.1 million and primarily related to the change in the temporary differences.
Net excess tax benefits resulting from our equity compensation plans are recorded as an increase in stockholders’ equity and were $1.9 million, $3.8 million and $8.9 million in fiscal 2017, 2016 and 2015, respectively.
As of February 28, 2017, we had $15.9 million of federal and $6.8 million of state net operating loss carryforwards available. If not utilized, the federal net operating losses expire in various fiscal years ending between 2019 and 2035. The state net operating losses expire in various fiscal years ending between 2028 and 2035. We have foreign net operating losses of $9.9 million. Of these, $9.6 million of the net operating losses can be carried forward indefinitely. The remaining foreign net operating losses expire in various fiscal years, starting with fiscal 2019, if not utilized.
We had research and development credit carryforwards of $0.6 million, $6.5 million and $0.3 million for federal, California and other state income tax purposes, respectively. If not utilized, the federal research and development credit begins to expire in fiscal 2029 while the California credit can be carried forward indefinitely. If not utilized, other state research and development credit begins to expire in fiscal 2021. We have a California Enterprise Zone credit of $0.3 million, which will begin to expire in fiscal 2024, if not utilized.
Utilization of our net operating loss and credit carryforwards may be subject to annual limitations due to ownership change provisions by the Internal Revenue Code of 1986, as amended, and similar state provisions. The annual limitation may result in the expiration of net operating losses and tax credits before utilization. We have performed an analysis under Section 382 of the Internal Revenue Code on behalf of our recent acquisition of Intronis as of October 12, 2015 and it does not appear that Intronis has experienced an ownership change prior to our acquisition. As a result, the existing net operating losses and tax credits are not currently subject to limitations arising from an ownership change, other than the annual limitation arising from our acquisition of Intronis. Future changes in our stock ownership, some of which are outside of our control, could result in an ownership change under Section 382 of the Internal Revenue Code and result in a limitation on our net operating losses and tax credits.
92
As of February 28, 2017, we had $6.7 million of cumulative undistributed earnings of our foreign subsidiaries. Deferred tax liabilities have not been recognized for undistributed earnings of foreign subsidiaries because we intend to permanently reinvest such undistributed earnings outside the United States. If these foreign earnings were to be repatriated in the future, the related U.S. tax liability may be reduced by any foreign income taxes previously paid on these earnings. Determination of the amount of an unrecognized deferred tax liability related to these earnings is not practicable.
Our total unrecognized tax benefits as of February 28, 2017, February 29, 2016 and February 28, 2015 were $10.0 million, $6.4 million and $5.3 million, respectively. Total unrecognized tax benefits that, if recognized, would affect our effective tax rate were $5.1 million, $2.6 million and $4.3 million as of February 28, 2017, February 29, 2016 and February 28, 2015, respectively.
The following table summarizes the activity related to our gross unrecognized tax benefits (in thousands):
Year Ended February 28/29, | |||||||||||
2017 | 2016 | 2015 | |||||||||
Balance at beginning of year | $ | 6,388 | $ | 5,322 | $ | 4,980 | |||||
Tax positions related to the current year: | |||||||||||
Increases | 3,879 | 1,841 | 1,050 | ||||||||
Tax positions related to prior years: | |||||||||||
Increases | — | 231 | 58 | ||||||||
Decreases | (34 | ) | (4 | ) | (53 | ) | |||||
Settlements with taxing authorities: | |||||||||||
Settlements | — | (710 | ) | — | |||||||
Releases—statute of limitations expired | (276 | ) | (292 | ) | (713 | ) | |||||
Balance at the end of the year | $ | 9,957 | $ | 6,388 | $ | 5,322 | |||||
We recognize interest and/or penalties related to uncertain tax positions in income tax expense. To the extent accrued interest and penalties do not ultimately become payable, amounts accrued will be reduced and reflected as a reduction of the overall income tax provision in the period that such determination is made. During fiscal 2017, 2016 and 2015, interest and penalties recorded in the consolidated statements of operations were $0.1 million, zero and $0.1 million, respectively. The amounts of accrued interest and penalties recorded on the consolidated balance sheets as of February 28, 2017 and February 29, 2016 were $0.9 million and $0.8 million, respectively. We do not believe there will be material changes in our unrecognized tax positions over the next 12 months. Our policy to include interest and penalties related to gross unrecognized tax benefits within our provision for income taxes did not change.
We file income tax returns in the U.S. federal jurisdiction, various states and certain foreign jurisdictions. The statute of limitations have not expired for audits of fiscal 2014 through 2017 and fiscal 2012 through 2017 in the U.S. federal and state jurisdictions, respectively, and for fiscal 2011 through 2017 in foreign jurisdictions. In fiscal 2017, we closed the tax audit of fiscal year 2015 by the Internal Revenue Service ("IRS") of the United States.
7. Segment Information
Operating segments are defined as components of an enterprise about which separate financial information is available that is evaluated regularly by the chief operating decision maker in deciding how to allocate resources and in assessing performance. Our chief operating decision maker is our chief executive officer. Our chief executive officer reviews financial information presented on a consolidated basis, accompanied by information about sales by geographic region, for purposes of allocating resources and evaluating financial performance. We have one business activity and there are no segment managers who are held accountable for operations, operating results and plans for levels or components below the consolidated level. Accordingly, we have determined that we have a single reportable segment and operating segment structure.
Revenue by geographic region is based on our customers' billing addresses and is presented as follows (in thousands):
93
Year Ended February 28/29, | |||||||||||
2017 | 2016 | 2015 | |||||||||
North America | $ | 264,607 | $ | 235,275 | $ | 201,724 | |||||
United States | 249,328 | 222,210 | 189,640 | ||||||||
Other | 15,279 | 13,065 | 12,084 | ||||||||
Latin America | 4,861 | 4,322 | 3,345 | ||||||||
Asia-Pacific | 20,845 | 18,772 | 18,158 | ||||||||
EMEA | 62,336 | 61,789 | 54,219 | ||||||||
$ | 352,649 | $ | 320,158 | $ | 277,446 | ||||||
Revenue earned in any one foreign country did not exceed 10% of total revenue in fiscal 2017, 2016 and 2015.
Long-lived assets, excluding intercompany receivables, investments in subsidiaries, intangible assets and deferred tax assets, by geographic region are presented as follows (in thousands):
As of February 28/29, | |||||||
2017 | 2016 | ||||||
United States | $ | 59,096 | $ | 60,619 | |||
International | 6,775 | 5,603 | |||||
$ | 65,871 | $ | 66,222 | ||||
8. Borrowings
Note Payable
We have a note payable with a financial institution which bears interest at 6.23% per annum. The estimated fair value of the note payable approximates its carrying value. The debt is repayable in equal monthly payments of principal and interest of $44,445, with a final payment of unpaid principal and interest in July 2017. Penalty interest of 0.0625% is due on default of payments, and prepayment of amounts owed are subject to a prepayment fee calculated as the greater of a) 1% of the principal being repaid and b) the present value of the future principal and interest payments less the principal repaid. Interest expense for fiscal 2017, 2016 and 2015 was $0.3 million, $0.3 million and $0.3 million, respectively, and was recorded in other expense, net of the consolidated statements of operations.
Future principal and interest payments for the note payable in fiscal 2018 are $4.2 million.
Credit Facility
We have a $25.0 million credit facility with Silicon Valley Bank ("SVB"), which was amended in fiscal 2017 to extend the expiration date to November 2017. The credit facility includes an option to request an increase of the available funds to $50.0 million and is secured by a security interest on substantially all of our assets and contains restrictive covenants. Upon drawing the credit facility, the financial covenants will require us to maintain a minimum adjusted EBITDA, as defined in the credit facility, and a minimum adjusted quick ratio. The credit facility also sets forth specified events of default. No amounts had been drawn under the credit facility through February 28, 2017.
9. Commitments and Contingencies
Lease Arrangements
We lease facilities and equipment under non-cancelable operating lease arrangements with various expiration dates through fiscal 2021. Certain of these arrangements provide for free or escalating rent payment provisions and for options to renew, which could increase future minimum lease payments if exercised. We account for rent of our facilities on a straight-line basis over the respective lease terms. Rent expense was $3.8 million, $3.5 million and $3.1 million in fiscal 2017, 2016 and 2015, respectively.
94
Future minimum payments under our operating leases agreements are as follows (in thousands):
Fiscal Years Ending February 28/29: | |||
2018 | $ | 3,197 | |
2019 | 2,270 | ||
2020 | 1,316 | ||
2021 | 443 | ||
$ | 7,226 | ||
Unrecognized Purchase Commitments
We have future unrecognized contractual obligations, primarily for purchase commitments of goods and services related to inventory, advertising and marketing, royalty and licensing arrangements and data center operations. Future minimum payments for these unrecognized purchase commitments are as follows (in thousands):
Fiscal Years Ending February 28/29: | |||
2018 | $ | 26,123 | |
2019 | 5,430 | ||
2020 | 1,377 | ||
$ | 32,930 | ||
Intellectual Property Settlement
In fiscal 2016, we entered into an intellectual property settlement agreement (the "Agreement"), whereby we resolved all current and potential future claims between us and a third party relating to certain patents. Under the terms of the Agreement, we agreed to make future settlement payments in exchange for a license to the relevant patents and a covenant by the third party not to sue for any past or future infringement of such licensed patents. We accounted for the Agreement as a multiple-element arrangement and allocated the fair value of the consideration to the identifiable elements based on their estimated fair values. We determined that the primary benefit of the arrangement is avoided litigation costs and the release of any potential past claims. $2.3 million was allocated to the resolution of any past claims and recorded as a legal settlement charge within general and administrative expenses in fiscal 2016, while $1.4 million was ascribed to patent assets based on the estimated future economic benefits of the license acquired in the Agreement.
Legal Matters
Export Compliance
In late 2011, following a voluntary internal review of our compliance with U.S. export control and sanctions laws, our management team became aware that certain of our physical appliances had been sold indirectly into embargoed countries via our distributors and resellers, potentially in violation of U.S. export control and economic sanctions laws. In addition, certain of our solutions incorporate encryption components and may be exported from the United States only with the required approvals; in the past, we may have exported products prior to receiving these required authorizations. After completion of a comprehensive internal investigation conducted by outside counsel, we submitted voluntary disclosures regarding these matters to the U.S. Commerce Department, Bureau of Industry and Security ("BIS"), and to the U.S. Treasury Department, Office of Foreign Assets Control ("OFAC"). These disclosures summarized potential violations of export controls and economic sanctions laws, including reexports by third parties and provision of services to end users in embargoed countries including Iran, Sudan and Syria. In May 2015, we agreed to a settlement with OFAC pursuant to which we agreed to pay $38,930 as consideration for the final resolution of all issues related to the voluntary disclosure that we submitted to OFAC. In November 2015, we agreed to a settlement with BIS pursuant to which we agreed to pay $1.5 million as consideration for the final resolution of all issues related to the voluntary disclosure that we submitted to BIS.
C2C Systems Limited
On April 18, 2016, R. David Hunt, as Seller Representative of the shareholders of C2C Systems Limited ("C2C"), filed a lawsuit against us in the Court of Chancery of the State of Delaware, for alleged breach of contract of the Share Purchase Agreement dated August 13, 2014, pursuant to which we acquired all of the assets and liabilities of C2C. On February 15,
95
2017, the parties entered into a settlement agreement in which we agreed to pay $1.25 million to the shareholders of C2C in exchange for a settlement of all claims under the Share Purchase Agreement. On February 17, 2017, the case was dismissed with prejudice. As such, the remeasurement of our contingent consideration liability was recognized within research and development expense in the consolidated statements of operations. Refer to Note 3 to the Consolidated Financial Statements for additional information.
On February 27, 2017, Realtime Data LLC filed a lawsuit against us in the United States District Court for the Eastern District of Texas, Tyler Division, alleging that certain of our products infringe U.S. patent numbers 9,054,728, 7,415,530, 9,116,908 and 8,717,204. We responded to the complaint on April 24, 2017. Given the early stage of the matter, we are unable to estimate a possible loss or range of possible loss, if any.
We may, from time to time, be party to litigation and subject to claims that arise in the ordinary course of business. In addition, third parties may, from time to time, assert claims against us in the form of letters and other communications. We currently believe that these ordinary course matters will not have a material adverse effect on our business, consolidated financial position, results of operations or cash flows; however, the results of litigation and claims are inherently unpredictable. Regardless of the outcome, litigation can have an adverse impact on us because of defense and settlement costs, diversion of management resources and other factors.
10. Employee Benefit Plan
Our 401(k) tax-deferred savings plan (the "401(k) Plan") permits eligible U.S. participants to make contributions by salary deduction pursuant to Section 401(k) of the Internal Revenue Code of 1986, as amended. Under the 401(k) Plan, participating employees may defer a portion of their pre-tax earnings, up to the IRS annual contribution limit, and we will match contributions up to a certain amount of each employee’s eligible earnings. We incurred 401(k) Plan contribution expenses of $1.3 million, $1.2 million and $1.0 million in fiscal 2017, 2016 and 2015, respectively.
11. Other Expense, Net
The components of other expense, net, are presented as follows (in thousands):
Year Ended February 28/29, | |||||||||||
2017 | 2016 | 2015 | |||||||||
Interest and miscellaneous income | $ | 468 | $ | 344 | $ | 579 | |||||
Interest expense | (285 | ) | (308 | ) | (417 | ) | |||||
Foreign currency exchange losses, net | (798 | ) | (14 | ) | (3,558 | ) | |||||
Other | 545 | (284 | ) | (278 | ) | ||||||
$ | (70 | ) | $ | (262 | ) | $ | (3,674 | ) | |||
12. Net Income (Loss) Per Share
Basic net income (loss) per share is computed by dividing the net income (loss) available to common stockholders by the weighted-average number of common shares outstanding for the period. Diluted net income (loss) per share available to common stockholders is computed by using the weighted-average number of common shares outstanding, including potential dilutive common shares assuming the dilutive effect of outstanding stock options and RSUs using the treasury stock method. For periods in which there was a net loss, the number of shares used in the computation of diluted net loss per share was the same as that used for the computation of basic net loss per share, as the inclusion of dilutive common shares would be anti-dilutive.
The following table presents the calculation of basic and diluted net income (loss) per share (in thousands, except per share amounts):
96
Year Ended February 28/29, | |||||||||||
2017 | 2016 | 2015 | |||||||||
Net income (loss) | $ | 10,235 | $ | (4,422 | ) | $ | (67,498 | ) | |||
Weighted-average shares used to compute net income (loss) per share, basic | 52,456 | 53,070 | 51,898 | ||||||||
Dilutive shares from stock options and RSUs | 1,116 | — | — | ||||||||
Weighted-average shares used to compute net income (loss) per share, diluted | 53,572 | 53,070 | 51,898 | ||||||||
Net income (loss) per share, basic | $ | 0.20 | $ | (0.08 | ) | $ | (1.30 | ) | |||
Net income (loss) per share, diluted | $ | 0.19 | $ | (0.08 | ) | $ | (1.30 | ) | |||
Item 9. Changes in and Disagreements with Accountants on Accounting and Financial Disclosure
None.
Item 9A. Controls and Procedures
Evaluation of Disclosure Controls and Procedures
Our management is responsible for establishing and maintaining adequate internal control over financial reporting. Management, with the participation of our chief executive officer and our chief financial officer, evaluated the effectiveness of our disclosure controls and procedures as of February 28, 2017. The term "disclosure controls and procedures," as defined in Rules 13a-15 and 15d-15 under the Exchange Act, means controls and other procedures of a company that are designed to ensure that information required to be disclosed by a company in the reports that it files or submits under the Exchange Act is recorded, processed, summarized and reported, within the time periods specified in the SEC’s rules and forms. Disclosure controls and procedures include, without limitation, controls and procedures designed to ensure that information required to be disclosed by a company in the reports that it files or submits under the Exchange Act is accumulated and communicated to the company’s management, including its principal executive and principal financial officers, as appropriate to allow timely decisions regarding required disclosure. Management recognizes that any controls and procedures, no matter how well designed and operated, can provide only reasonable assurance of achieving their objectives, and management necessarily applies its judgment in evaluating the cost-benefit relationship of possible controls and procedures. Based on the evaluation of our disclosure controls and procedures as of February 28, 2017, our chief executive officer and chief financial officer concluded that our disclosure controls and procedures were effective at a reasonable assurance level.
Management’s Annual Report on Internal Control Over Financial Reporting
Our management is responsible for establishing and maintaining adequate internal control over financial reporting (as defined in Rule 13a-15(f) under the Exchange Act). Management conducted an assessment of the effectiveness of our internal control over financial reporting based on the criteria set forth in Internal Control—Integrated Framework issued by the Committee of Sponsoring Organizations of the Treadway Commission (2013 framework). Based on the assessment, management has concluded that its internal control over financial reporting was effective as of February 28, 2017 to provide reasonable assurance regarding the reliability of financial reporting and the preparation of financial statements in accordance with U.S. GAAP.
This Annual Report on Form 10-K does not include an attestation report of our registered public accounting firm on our internal control over financial reporting due to an exemption established by the JOBS Act for "emerging growth companies."
Changes in Internal Control over Financial Reporting
There were no changes in our internal control over financial reporting identified in connection with the evaluation required by Rule 13a-15 and 15d-15 of the Exchange Act that occurred during the quarter ended February 28, 2017 that have materially affected, or are reasonably likely to materially affect, our internal control over financial reporting.
Item 9B. Other Information
None.
97
PART III
Item 10. Directors, Executive Officers and Corporate Governance
The information required by this item is incorporated by reference to our Definitive Proxy Statement for our 2017 Annual Meeting of Stockholders. The Definitive Proxy Statement will be filed with the Securities and Exchange Commission within 120 days after the end of our 2017 fiscal year.
Our board of directors has adopted Corporate Governance Guidelines. These guidelines address, among other items, the responsibilities of our directors, the structure and composition of our board of directors and corporate governance policies and standards applicable to us in general. In addition, our board of directors has adopted a Code of Business Conduct and Ethics that applies to all of our employees, directors and principal executive officers, including our chief executive officer, chief financial officer and senior financial officers. This code of ethics is posted on our website at https://investors.barracuda.com. Alternatively, you may obtain a copy of this code of ethics by contacting our corporate offices by calling (408) 342-5400 or by visiting our principal executive offices at 3175 S. Winchester Blvd., Campbell CA 95008.
Item 11. Executive Compensation
The information required by this item is incorporated by reference to our Definitive Proxy Statement relating to our 2017 Annual Meeting of Stockholders. The Definitive Proxy Statement will be filed with the Securities and Exchange Commission within 120 days after the end of our 2017 fiscal year.
Item 12. Security Ownership of Certain Beneficial Owners and Management and Related Stockholder Matters
The information required by this item is incorporated by reference to our Definitive Proxy Statement relating to our 2017 Annual Meeting of Stockholders. The Definitive Proxy Statement will be filed with the Securities and Exchange Commission within 120 days after the end of our 2017 fiscal year.
Item 13. Certain Relationships and Related Transactions, and Director Independence
The information required by this item is incorporated by reference to our Definitive Proxy Statement relating to our 2017 Annual Meeting of Stockholders. The Definitive Proxy Statement will be filed with the Securities and Exchange Commission within 120 days after the end of our 2017 fiscal year.
Item 14. Principal Accounting Fees and Services
The information required by this item is incorporated by reference to our Definitive Proxy Statement relating to our 2017 Annual Meeting of Stockholders. The Definitive Proxy Statement will be filed with the Securities and Exchange Commission within 120 days after the end of our 2017 fiscal year.
98
PART IV
Item 15. Exhibits, Financial Statement Schedules
Documents filed as part of this Annual Report on Form 10-K are as follows:
1. | Consolidated Financial Statements |
Our consolidated financial statements are listed in the "Index to Consolidated Financial Statements" under Part II, Item 8 of this Annual Report on Form 10-K.
2. | Financial Statement Schedules |
SCHEDULE II—VALUATION AND QUALIFYING ACCOUNTS
Year Ended February 28/29, | |||||||||||
2017 | 2016 | 2015 | |||||||||
(in thousands) | |||||||||||
Allowance for doubtful accounts: | |||||||||||
Beginning balance | $ | 2,018 | $ | 1,531 | $ | 2,134 | |||||
Charged to costs and expenses | 839 | 586 | 289 | ||||||||
Bad debt write-offs | — | (99 | ) | (892 | ) | ||||||
Ending balance | $ | 2,857 | $ | 2,018 | $ | 1,531 | |||||
Sales return reserve: | |||||||||||
Beginning balance | $ | 2,026 | $ | 1,849 | $ | 1,862 | |||||
Charged to deferred revenue | 22,162 | 25,340 | 18,151 | ||||||||
Sales returns | (22,373 | ) | (25,163 | ) | (18,164 | ) | |||||
Ending balance | $ | 1,815 | $ | 2,026 | $ | 1,849 | |||||
All other schedules have been omitted because the information called for is not required or is shown either in the consolidated financial statements or in the notes thereto.
3. | Exhibits |
See the Exhibit Index immediately following the signature page of this Annual Report on Form 10-K.
99
SIGNATURES
Pursuant to the requirements of Section 13 or 15(d) of the Securities and Exchange Act of 1934, the Registrant has duly caused this report to be signed on its behalf by the undersigned, thereunto duly authorized, on May 12, 2017.
BARRACUDA NETWORKS, INC. | ||
By: | /s/ William D. Jenkins, Jr. | |
William D. Jenkins, Jr. | ||
Chief Executive Officer | ||
POWER OF ATTORNEY
Each person whose signature appears below constitutes and appoints William D. Jenkins, Jr. and Dustin Driggs, and each of them, as his or her true and lawful attorney-in-fact and agent, with full power of substitution and resubstitution, for him or her and in his or her name, place and stead, in any and all capacities, to sign any and all amendments to this Annual Report on Form 10-K, and to file the same, with all exhibits thereto, and other documents in connection therewith, with the Securities and Exchange Commission, granting unto said attorneys-in-fact and agents, and each of them, full power and authority to do and perform each and every act and thing requisite and necessary to be done in connection therewith, as fully to all intents and purposes as he or she might or could do in person, hereby ratifying and confirming all that said attorneys-in-fact and agents, or any of them, or their or his substitutes, may lawfully do or cause to be done by virtue thereof.
Pursuant to the requirements of the Securities and Exchange Act of 1934, this report has been signed by the following persons in the capacities and on the dates indicated.
Signature | Title | Date | ||
/s/ William D. Jenkins, Jr. | Chief Executive Officer and Director | May 12, 2017 | ||
William D. Jenkins, Jr. | (Principal Executive Officer) | |||
/s/ Dustin Driggs | Chief Financial Officer | May 12, 2017 | ||
Dustin Driggs | (Principal Accounting and Financial Officer) | |||
/s/ Jeffry R. Allen | Lead Independent Director | May 12, 2017 | ||
Jeffry R. Allen | ||||
/s/ Chet Kapoor | Director | May 12, 2017 | ||
Chet Kapoor | ||||
/s/ John H. Kispert | Director | May 12, 2017 | ||
John H. Kispert | ||||
/s/ Stephen P. Mullaney | Director | May 12, 2017 | ||
Stephen P. Mullaney | ||||
/s/ Michael D. Perone | Director | May 12, 2017 | ||
Michael D. Perone | ||||
100
EXHIBIT INDEX
Exhibit Number | Incorporated by Reference | |||||||||
Description | Form | File No. | Exhibit | Filing Date | ||||||
2.1+ | Agreement and Plan of Merger by and among Barracuda Networks, Inc., Sookasa Inc. and S Acquisition Corp., dated as of March 16, 2016. | 8-K | 001-36162 | 2.1 | March 23, 2016 | |||||
3.1 | Amended and Restated Certificate of Incorporation of the Registrant. | 10-Q | 001-36162 | 3.1 | January 13, 2014 | |||||
3.2 | Amended and Restated Bylaws of the Registrant. | 10-Q | 001-36162 | 3.2 | January 13, 2014 | |||||
4.1 | Amended and Restated Investors’ Rights Agreement dated as of October 3, 2012, between the registrant and the other parties thereto. | S-1 | 333-191510 | 4.1 | October 1, 2013 | |||||
4.2 | Specimen common stock certificate of the registrant. | S-1/A | 333-191510 | 4.2 | October 11, 2013 | |||||
4.3 | 2015 Employee Stock Purchase Plan and form of agreement thereunder. | S-8 | 333-206689 | 4.3 | August 31, 2015 | |||||
10.1 | Form of Indemnification Agreement between the registrant and its directors and officers. | S-1 | 333-191510 | 10.1 | October 1, 2013 | |||||
10.2 | 2004 Stock Option Plan, and form of agreements thereunder. | S-1 | 333-191510 | 10.2 | October 1, 2013 | |||||
10.3 | 2012 Equity Incentive Plan, as amended, and form of agreements thereunder. | S-1/A | 333-191510 | 10.3 | October 23, 2013 | |||||
10.4 | SignNow 2011 Equity Incentive Plan, form of agreements thereunder. | S-1 | 333-191510 | 10.4 | October 1, 2013 | |||||
10.5 | Purewire, Inc. 2008 Stock Incentive Plan, form of agreements thereunder. | S-1 | 333-191510 | 10.5 | October 1, 2013 | |||||
10.6 | Offer Letter, between the registrant and William D. Jenkins, Jr., dated June 7, 2013. | S-1 | 333-191510 | 10.6 | October 1, 2013 | |||||
10.7 | Offer Letter, between the registrant and Michael D. Perone, dated July 24, 2013. | S-1 | 333-191510 | 10.8 | October 1, 2013 | |||||
10.8 | Offer Letter, between the registrant and Diane C. Honda, dated September 13, 2012. | S-1 | 333-191510 | 10.9 | October 1, 2013 | |||||
10.9 | Offer Letter, between the registrant and Michael D. Hughes, dated August 25, 2012. | S-1 | 333-191510 | 10.10 | October 1, 2013 | |||||
10.10 | Offer Letter, between the registrant and Zachary S. Levow, dated July 24, 2013. | S-1 | 333-191510 | 10.11 | October 1, 2013 | |||||
10.11 | Purchase and Sale Agreement and Escrow Instructions dated as of July 31, 2011, between the registrant and Bryan Family Partnership II, Ltd. | S-1 | 333-191510 | 10.12 | October 1, 2013 | |||||
10.12 | Credit Agreement dated as of October 3, 2012, between the registrant and Silicon Valley Bank. | S-1 | 333-191510 | 10.13 | October 1, 2013 | |||||
10.13 | Lease dated as of June 19, 2013, between the registrant and M West Propco XVII, LLC. | S-1 | 333-191510 | 10.14 | October 1, 2013 | |||||
10.14 | Lease dated as of May 24, 2012, between the registrant and 317 Maynard LLC. | S-1 | 333-191510 | 10.17 | October 1, 2013 | |||||
10.15 | Summary of 2014 Executive Bonus Plan. | S-1/A | 333-191510 | 10.19 | October 11, 2013 | |||||
10.16 | Second Amendment Agreement, dated as of January 23, 2015, between Barracuda Networks, Inc. and Silicon Valley Bank. | 8-K | 001-36162 | 10.1 | January 29, 2015 | |||||
10.17 | Transition Services Agreement, between the Company and David Faugno, dated July 29, 2016. | 8-K | 001-36162 | 10.1 | August 3, 2016 | |||||
101
Exhibit Number | Incorporated by Reference | |||||||||
Description | Form | File No. | Exhibit | Filing Date | ||||||
10.18 | Offer Letter, between the registrant and Dustin Driggs, dated July 16, 2013. | |||||||||
21.1 | List of subsidiaries of registrant. | |||||||||
23.1 | Consent of Ernst & Young LLP, Independent Registered Public Accounting Firm. | |||||||||
31.1 | Certification of William D. Jenkins, Jr., Chief Executive Officer, pursuant to Rule 13a-14(a)/15d-14(a), as adopted pursuant to Section 302 of the Sarbanes-Oxley Act of 2002. | |||||||||
31.2 | Certification of Dustin Driggs, Chief Financial Officer, pursuant to Rule 13a-14(a)/15d-14(a), as adopted pursuant to Section 302 of the Sarbanes-Oxley Act of 2002. | |||||||||
32.1* | Certification of William D. Jenkins, Jr., Chief Executive Officer, pursuant to 18 U.S.C. Section 1350, as adopted pursuant to Section 906 of the Sarbanes-Oxley Act of 2002. | |||||||||
32.2* | Certification of Dustin Driggs, Chief Financial Officer, pursuant to 18 U.S.C. Section 1350, as adopted pursuant to Section 906 of the Sarbanes-Oxley Act of 2002. | |||||||||
101.INS | XBRL Instance Document. | |||||||||
101.SCH | XBRL Taxonomy Extension Schema Document. | |||||||||
101.CAL | XBRL Taxonomy Extension Calculation Linkbase Document. | |||||||||
101.DEF | XBRL Taxonomy Extension Definition Linkbase Document. | |||||||||
101.LAB | XBRL Taxonomy Extension Label Linkbase Document. | |||||||||
101.PRE | XBRL Taxonomy Extension Presentation Linkbase Document. | |||||||||
+ | Schedules and exhibits have been omitted pursuant to Item 601(b)(2) of Regulation S-K. A copy of any omitted schedule or exhibit will be furnished supplementally to the Securities and Exchange Commission upon request; provided, however that Barracuda Networks, Inc. may request confidential treatment pursuant to Rule 24b-2 of the Securities Exchange Act of 1934, as amended, for any schedules or exhibits so furnished. | |
* | The certifications furnished in Exhibit 32.1 and Exhibit 32.2 hereto are deemed to accompany this Annual Report on Form 10-K and will not be deemed "filed" for purposes of Section 18 of the Securities Exchange Act of 1934, as amended. Such certifications will not be deemed to be incorporated by reference into any filings under the Securities Act of 1933, as amended, or the Securities Exchange Act of 1934, as amended, except to the extent that the registrant specifically incorporates it by reference. | |
102