Attached files
| file | filename |
|---|---|
| EX-99.2 - EXHIBIT 99.2 - Internap Corp | t1700325_ex99-2.htm |
| EX-99.1 - EXHIBIT 99.1 - Internap Corp | t1700325_ex99-1.htm |
| 8-K - FORM 8-K - Internap Corp | t1700325_8k.htm |
Exhibit 99.3
Confidential – Property of Internap Corporation 1 st Quarter 2017 Earnings Peter D. Aquino President & Chief Executive Officer Robert M. Dennerlein Chief Financial Officer May 9, 2017
2 FORWARD - LOOKING STATEMENTS This presentation contains forward - looking statements. These forward - looking statements include statements related to cost reductions, improved profitability, operations improvements, rebuilding our salesforce, opportunistic M&A discussions and our expectations for full - year 2017 revenue, Adjusted EBITDA and capital expenditures. Our ability to achieve these forward - looking statements is based on certain assumptions, including our ability to execute on our business strategy, leveraging of multiple routes to market, expanded brand awareness for high - performance Internet infrastructure services and customer churn levels. These assumptions may prove inaccurate in the future. Because such forward - looking statements are not guarantees of future performance and involve risks and uncertainties, there are important factors that could cause Internap’s actual results to differ materially from those in the forward - looking statements. These factors include our ability to execute o n our business strategy and drive growth; our ability to maintain current customers and obtain new ones, whether in a cost - effective manner or at all; the robustness of the IT infrastructure services market; our ability to achieve or sustain profit abi lity; our ability to expand margins and drive higher returns on investment; our ability to sell into new and existing data center space; the actual performance of our IT infrastructure services; our ability to correctly forecast capital needs, demand planning and space utilization; our ability to respond successfully to technological change and the resulting competition; th e availability of services from Internet network service providers or network service providers providing network access loops and local loops on favorable terms, or at all; failure of third party suppliers to deliver their products and services on fav ora ble terms, or at all; failures in our network operations centers, data centers, network access points or computer systems; our ability to provide or improve Internet infrastructure services to our customers; and our ability to protect our intellectual property; market conditions and the terms of any issuance of equity or debt securities or the refinancing or amendment of our indebtedness; risks related to our indebtedness, including our substantial amount of debt, our ability to incur debt and increases in interest rates or in our borrowing margins; our ability to meet the financial and other covenants contained in o ur credit agreement; as well as other factors discussed in our filings with the Securities and Exchange Commission. Given these risks and uncertainties, investors should not place undue reliance on forward - looking statements as a prediction of actual results. We undertake no obligation to update, amend or clarify any forward - looking statement for any reason. Confidential & Proprietary
3 NON - GAAP MEASURES In addition to results presented in accordance with GAAP, this presentation includes non - GAAP financial measures. The Company believes these non - GAAP financial measures provide additional information that is useful to investors in helping to understand our underlying performance and trends. Non - GAAP financial measures have inherent limitations, which are not required to be uniformly applied. Readers should be aware of these limitations and should be cautious with respect to the use of such measures. To compensate for these limitations, we use non - GAAP financial measures as comparative tools, together with GAAP financial measures, to assist in the evaluation of our operating performance or financial condition. Our method of calculating these non - GAAP financial measures may differ from methods used by other companies. These non - GAAP financial measures should not be considered in isolation or as a substitute for those financial measures prepared in accordance with GAAP. As required by SEC rules, we have provided in this presentation reconciliations of the non - GAAP financial measures included in this presentation to the most directly comparable GAAP financial measures. Reconciliations of non - GAAP financial measures are also available in the attachment to our first quarter 2017 earnings press release available on our website at www.ir.Internap.com. Confidential & Proprietary
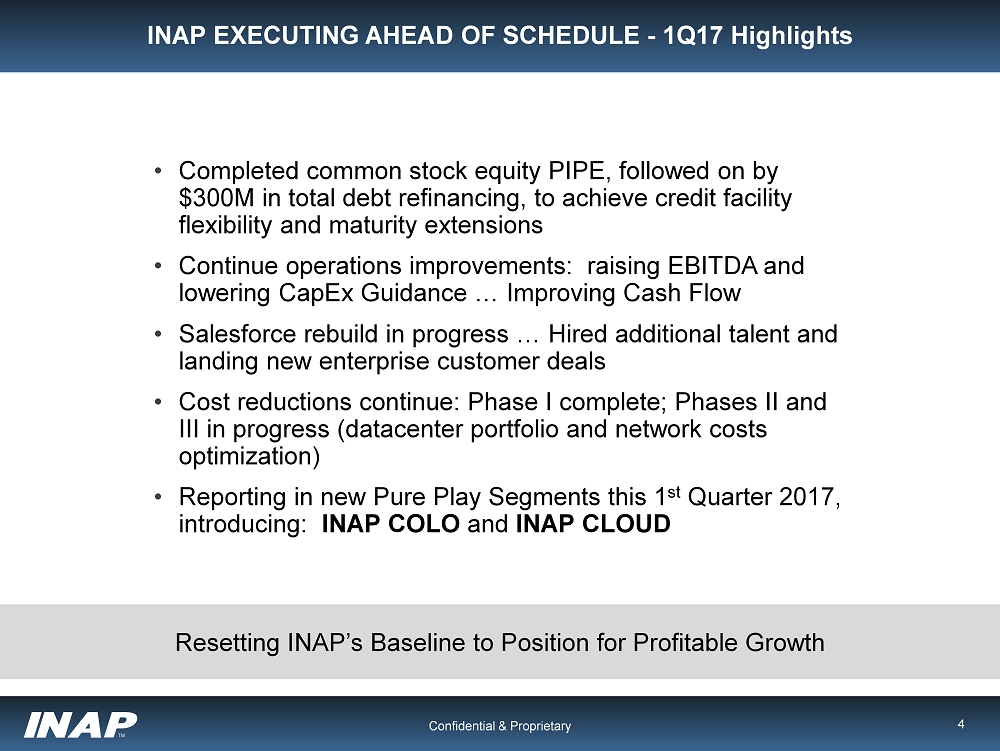
4 INAP EXECUTING AHEAD OF SCHEDULE - 1Q17 Highlights • Completed common stock equity PIPE, followed on by $300M in total debt refinancing, to achieve credit facility flexibility and maturity extensions • Continue operations improvements: raising EBITDA and lowering CapEx Guidance … Improving Cash Flow • Salesforce rebuild in progress … Hired additional talent and landing new enterprise customer deals • Cost reductions continue: Phase I complete; Phases II and III in progress (datacenter portfolio and network costs optimization) • Reporting in new Pure Play Segments this 1 st Quarter 2017, introducing: INAP COLO and INAP CLOUD Confidential & Proprietary Resetting INAP’s Baseline to Position for Profitable Growth
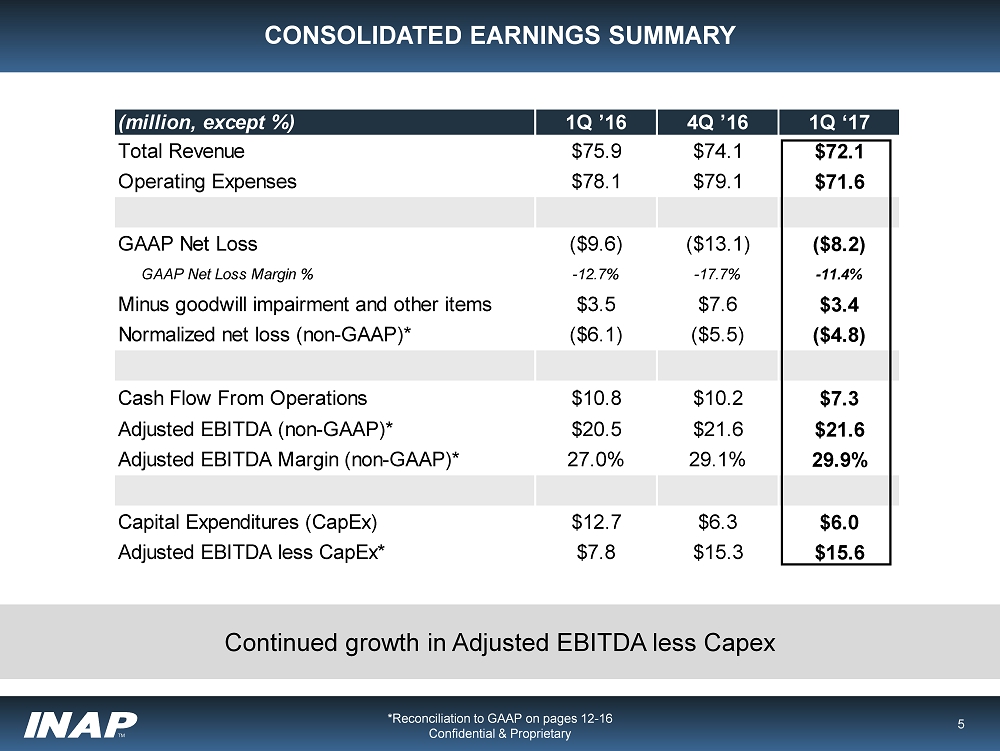
5 (million, except %) 1Q ’16 4Q ’16 1Q ‘17 Total Revenue $75.9 $74.1 $72.1 Operating Expenses $78.1 $79.1 $71.6 GAAP Net Loss ($9.6) ($13.1) ($8.2) GAAP Net Loss Margin % -12.7% -17.7% -11.4% Minus goodwill impairment and other items $3.5 $7.6 $3.4 Normalized net loss (non-GAAP)* ($6.1) ($5.5) ($4.8) Cash Flow From Operations $10.8 $10.2 $7.3 Adjusted EBITDA (non-GAAP)* $20.5 $21.6 $21.6 Adjusted EBITDA Margin (non-GAAP)* 27.0% 29.1% 29.9% Capital Expenditures (CapEx) $12.7 $6.3 $6.0 Adjusted EBITDA less CapEx* $7.8 $15.3 $15.6 CONSOLIDATED EARNINGS SUMMARY *Reconciliation to GAAP on pages 12 - 16 Confidential & Proprietary Continued growth in Adjusted EBITDA less Capex
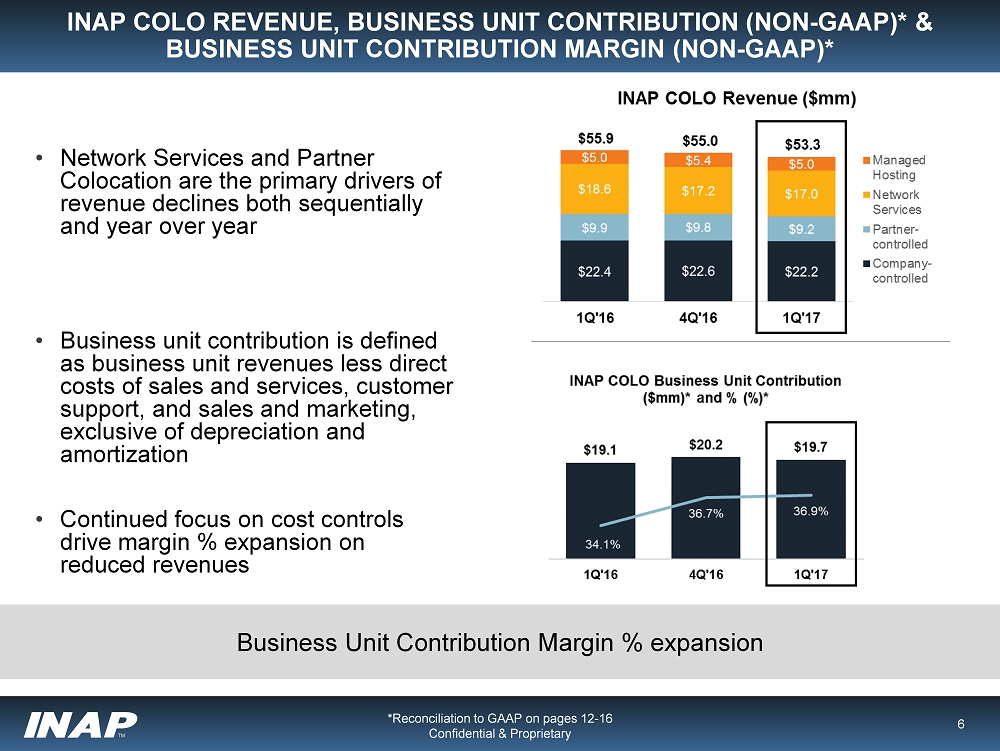
6 INAP COLO REVENUE, BUSINESS UNIT CONTRIBUTION (NON - GAAP)* & BUSINESS UNIT CONTRIBUTION MARGIN (NON - GAAP)* *Reconciliation to GAAP on pages 12 - 16 Confidential & Proprietary [Strengthening sequential performance in revenue generation and profitability.] • Network Services and Partner Colocation are the primary drivers of revenue declines both sequentially and year over year • Business unit contribution is defined as business unit revenues less direct costs of sales and services, customer support, and sales and marketing, exclusive of depreciation and amortization • Continued focus on cost controls drive margin % expansion on reduced revenues Business Unit Contribution Margin % expansion
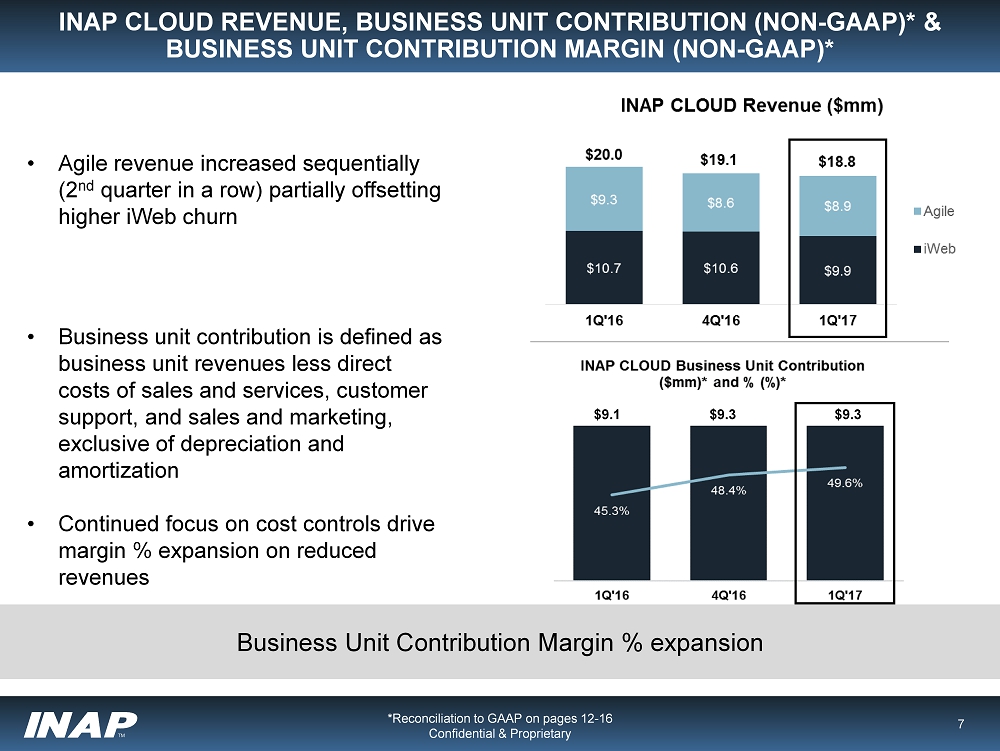
7 INAP CLOUD REVENUE, BUSINESS UNIT CONTRIBUTION (NON - GAAP)* & BUSINESS UNIT CONTRIBUTION MARGIN (NON - GAAP)* *Reconciliation to GAAP on pages 12 - 16 Confidential & Proprietary Business Unit Contribution Margin % expansion • Agile revenue increased sequentially (2 nd quarter in a row) partially offsetting higher iWeb churn • Business unit contribution is defined as business unit revenues less direct costs of sales and services, customer support, and sales and marketing, exclusive of depreciation and amortization • Continued focus on cost controls drive margin % expansion on reduced revenues $9.1 $9.3 $9.3
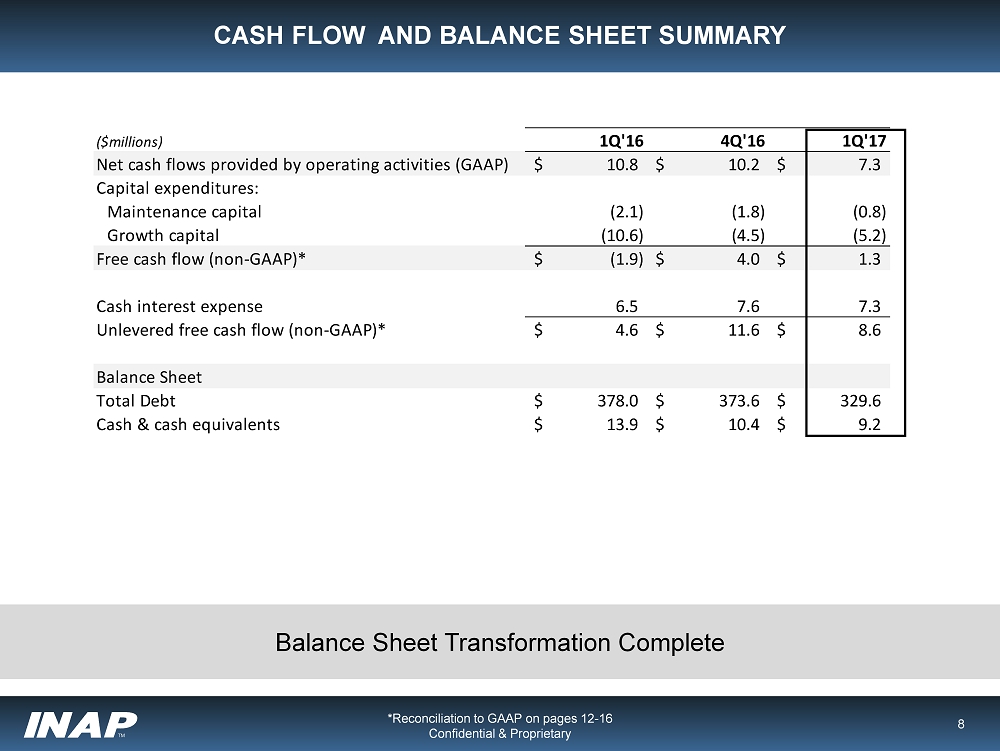
8 CASH FLOW AND BALANCE SHEET SUMMARY *Reconciliation to GAAP on pages 12 - 16 Confidential & Proprietary Balance Sheet Transformation Complete ($millions) 1Q'16 4Q'16 1Q'17 Net cash flows provided by operating activities (GAAP) 10.8$ 10.2$ 7.3$ Capital expenditures: Maintenance capital (2.1) (1.8) (0.8) Growth capital (10.6) (4.5) (5.2) Free cash flow (non-GAAP)* (1.9)$ 4.0$ 1.3$ Cash interest expense 6.5 7.6 7.3 Unlevered free cash flow (non-GAAP)* 4.6$ 11.6$ 8.6$ Balance Sheet Total Debt 378.0$ 373.6$ 329.6$ Cash & cash equivalents 13.9$ 10.4$ 9.2$
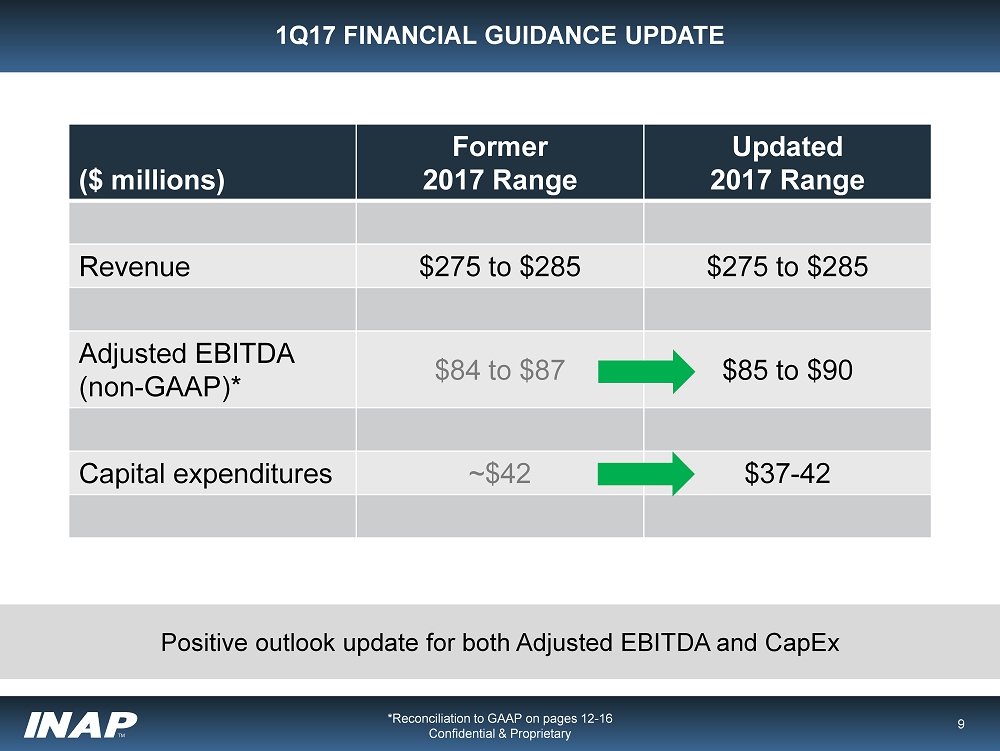
9 1Q17 FINANCIAL GUIDANCE UPDATE ($ millions) Former 2017 Range Updated 2017 Range Revenue $275 to $285 $275 to $285 Adjusted EBITDA (non - GAAP)* $84 to $87 $85 to $90 Capital expenditures ~$42 $37 - 42 *Reconciliation to GAAP on pages 12 - 16 Confidential & Proprietary Positive outlook update for both Adjusted EBITDA and CapEx
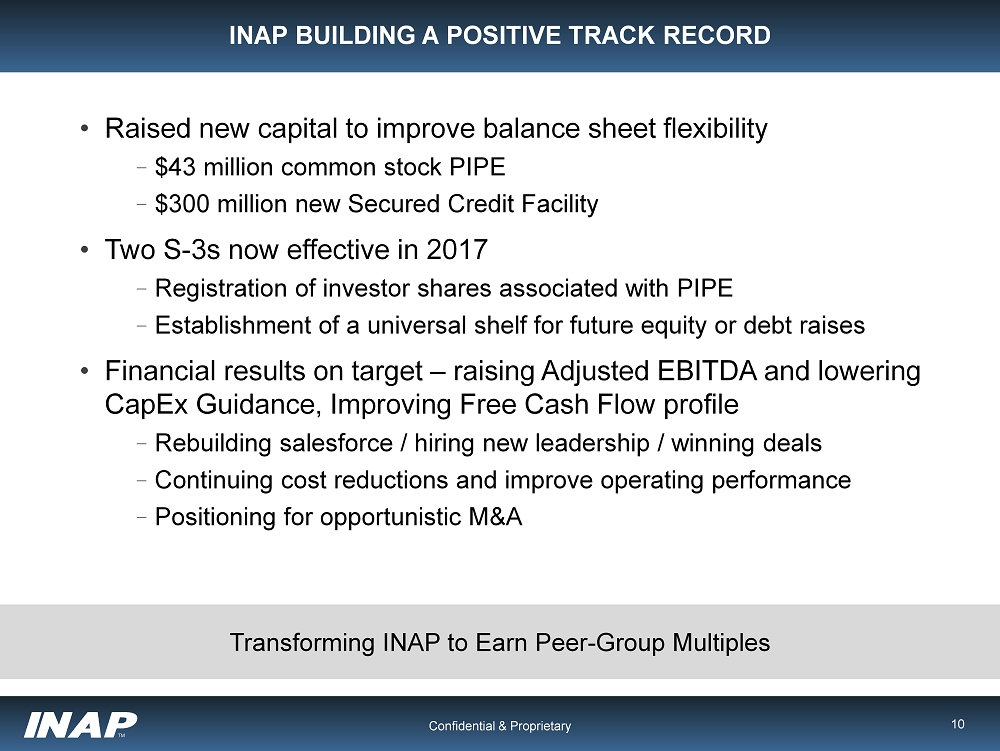
10 INAP BUILDING A POSITIVE TRACK RECORD Confidential & Proprietary Transforming INAP to Earn Peer - Group Multiples • Raised new capital to improve balance sheet flexibility – $43 million common stock PIPE – $300 million new Secured Credit Facility • Two S - 3s now effective in 2017 – Registration of investor shares associated with PIPE – Establishment of a universal shelf for future equity or debt raises • Financial results on target – raising Adjusted EBITDA and lowering CapEx Guidance, Improving Free Cash Flow profile – Rebuilding salesforce / hiring new leadership / winning deals – Continuing cost reductions and improve operating performance – Positioning for opportunistic M&A
11 Confidential & Proprietary APPENDIX Reconciliation of Non - GAAP Financial Measures
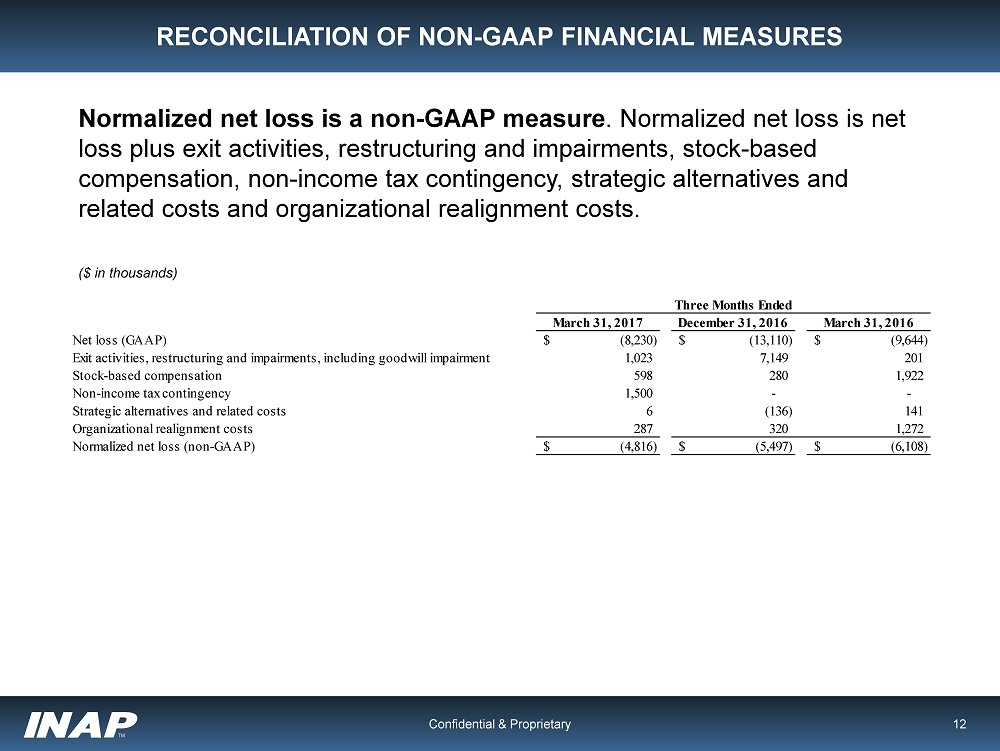
12 RECONCILIATION OF NON - GAAP FINANCIAL MEASURES Normalized net loss is a non - GAAP measure . Normalized net loss is net loss plus exit activities, restructuring and impairments, stock - based compensation, non - income tax contingency, strategic alternatives and related costs and organizational realignment costs. ($ in thousands) Confidential & Proprietary March 31, 2017 December 31, 2016 March 31, 2016 Net loss (GAAP) (8,230)$ (13,110)$ (9,644)$ Exit activities, restructuring and impairments, including goodwill impairment 1,023 7,149 201 Stock-based compensation 598 280 1,922 Non-income tax contingency 1,500 - - Strategic alternatives and related costs 6 (136) 141 Organizational realignment costs 287 320 1,272 Normalized net loss (non-GAAP) (4,816)$ (5,497)$ (6,108)$ Three Months Ended
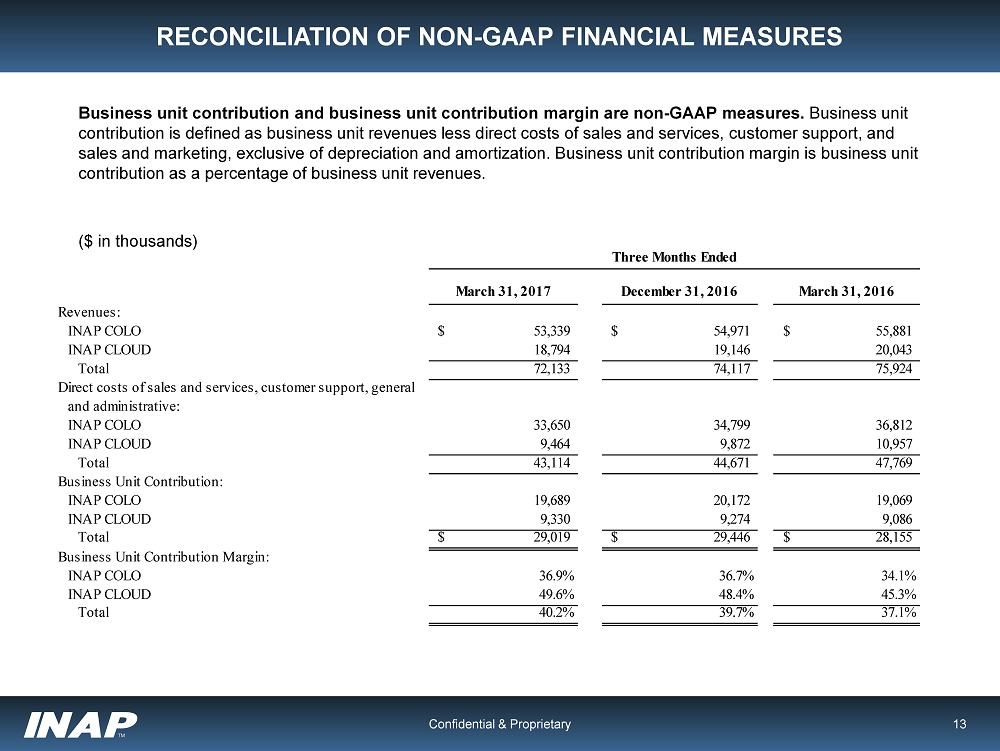
13 RECONCILIATION OF NON - GAAP FINANCIAL MEASURES Business unit contribution and business unit contribution margin are non - GAAP measures. Business unit contribution is defined as business unit revenues less direct costs of sales and services, customer support, and sales and marketing, exclusive of depreciation and amortization. Business unit contribution margin is business unit contribution as a percentage of business unit revenues. ($ in thousands) Confidential & Proprietary March 31, 2017 December 31, 2016 March 31, 2016 Revenues: INAP COLO 53,339$ 54,971$ 55,881$ INAP CLOUD 18,794 19,146 20,043 Total 72,133 74,117 75,924 Direct costs of sales and services, customer support, general and administrative: INAP COLO 33,650 34,799 36,812 INAP CLOUD 9,464 9,872 10,957 Total 43,114 44,671 47,769 Business Unit Contribution: INAP COLO 19,689 20,172 19,069 INAP CLOUD 9,330 9,274 9,086 Total 29,019$ 29,446$ 28,155$ Business Unit Contribution Margin: INAP COLO 36.9% 36.7% 34.1% INAP CLOUD 49.6% 48.4% 45.3% Total 40.2% 39.7% 37.1% Three Months Ended
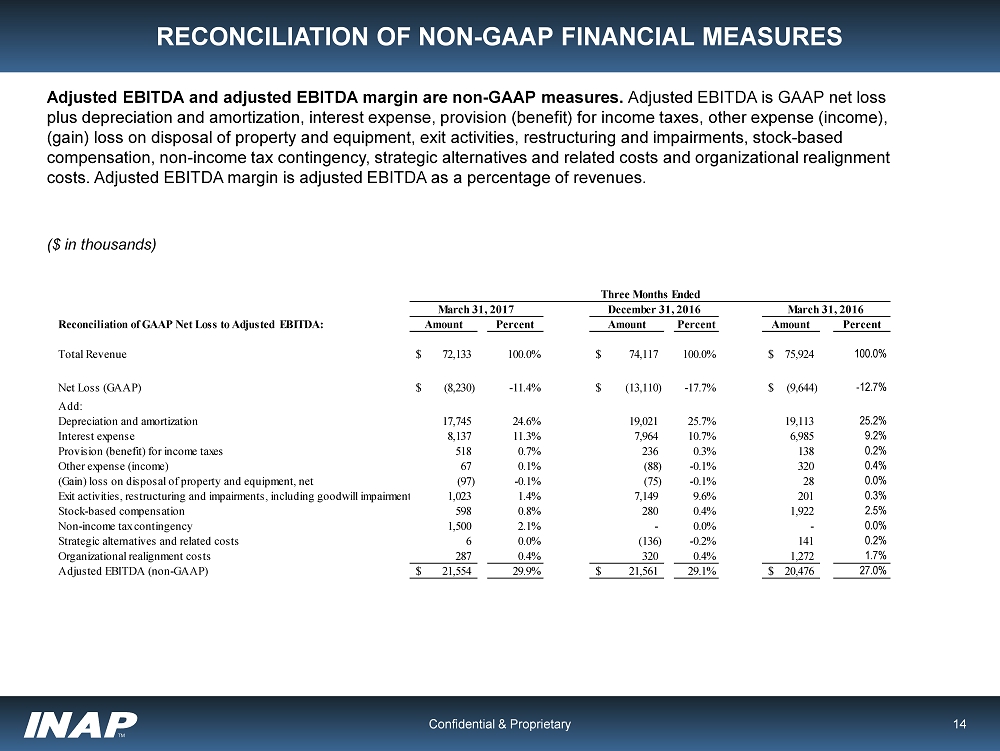
14 RECONCILIATION OF NON - GAAP FINANCIAL MEASURES Adjusted EBITDA and adjusted EBITDA margin are non - GAAP measures. Adjusted EBITDA is GAAP net loss plus depreciation and amortization, interest expense, provision (benefit) for income taxes, other expense (income), (gain) loss on disposal of property and equipment, exit activities, restructuring and impairments, stock - based compensation, non - income tax contingency, strategic alternatives and related costs and organizational realignment costs. Adjusted EBITDA margin is adjusted EBITDA as a percentage of revenues. ($ in thousands) Confidential & Proprietary Reconciliation of GAAP Net Loss to Adjusted EBITDA: Amount Percent Amount Percent Amount Percent Total Revenue 72,133$ 100.0% 74,117$ 100.0% 75,924$ 100.0% Net Loss (GAAP) (8,230)$ -11.4% (13,110)$ -17.7% (9,644)$ -12.7% Add: Depreciation and amortization 17,745 24.6% 19,021 25.7% 19,113 25.2% Interest expense 8,137 11.3% 7,964 10.7% 6,985 9.2% Provision (benefit) for income taxes 518 0.7% 236 0.3% 138 0.2% Other expense (income) 67 0.1% (88) -0.1% 320 0.4% (Gain) loss on disposal of property and equipment, net (97) -0.1% (75) -0.1% 28 0.0% Exit activities, restructuring and impairments, including goodwill impairment 1,023 1.4% 7,149 9.6% 201 0.3% Stock-based compensation 598 0.8% 280 0.4% 1,922 2.5% Non-income tax contingency 1,500 2.1% - 0.0% - 0.0% Strategic alternatives and related costs 6 0.0% (136) -0.2% 141 0.2% Organizational realignment costs 287 0.4% 320 0.4% 1,272 1.7% Adjusted EBITDA (non-GAAP) 21,554$ 29.9% 21,561$ 29.1% 20,476$ 27.0% March 31, 2017 December 31, 2016 March 31, 2016 Three Months Ended
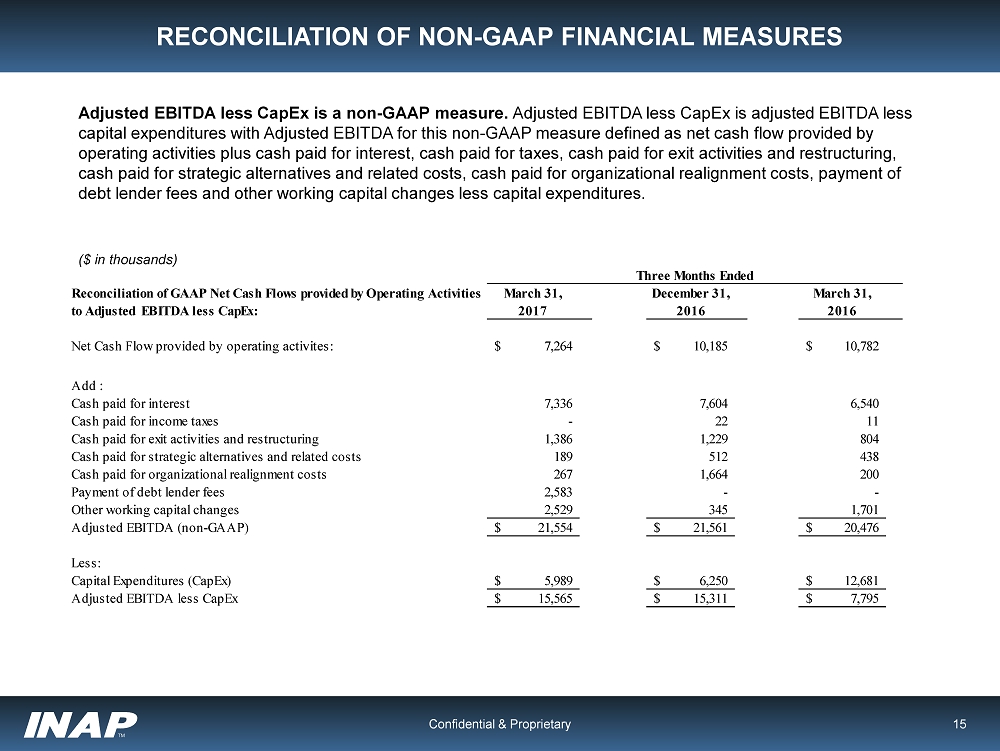
15 RECONCILIATION OF NON - GAAP FINANCIAL MEASURES Adjusted EBITDA less CapEx is a non - GAAP measure. Adjusted EBITDA less CapEx is adjusted EBITDA less capital expenditures with Adjusted EBITDA for this non - GAAP measure defined as net cash flow provided by operating activities plus cash paid for interest, cash paid for taxes, cash paid for exit activities and restructuring, cash paid for strategic alternatives and related costs, cash paid for organizational realignment costs, payment of debt lender fees and other working capital changes less capital expenditures. ($ in thousands) Confidential & Proprietary Reconciliation of GAAP Net Cash Flows provided by Operating Activities to Adjusted EBITDA less CapEx: March 31, 2017 December 31, 2016 March 31, 2016 Net Cash Flow provided by operating activites: 7,264$ 10,185$ 10,782$ Add : Cash paid for interest 7,336 7,604 6,540 Cash paid for income taxes - 22 11 Cash paid for exit activities and restructuring 1,386 1,229 804 Cash paid for strategic alternatives and related costs 189 512 438 Cash paid for organizational realignment costs 267 1,664 200 Payment of debt lender fees 2,583 - - Other working capital changes 2,529 345 1,701 Adjusted EBITDA (non-GAAP) 21,554$ 21,561$ 20,476$ Less: Capital Expenditures (CapEx) 5,989$ 6,250$ 12,681$ Adjusted EBITDA less CapEx 15,565$ 15,311$ 7,795$ Three Months Ended
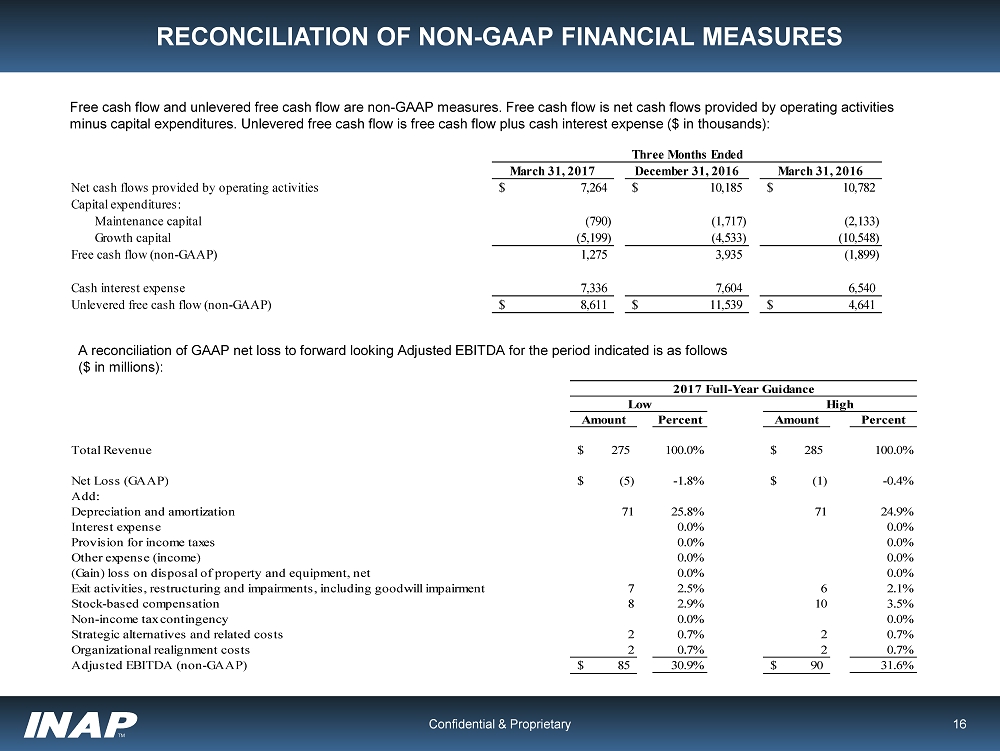
16 RECONCILIATION OF NON - GAAP FINANCIAL MEASURES Confidential & Proprietary Free cash flow and unlevered free cash flow are non - GAAP measures. Free cash flow is net cash flows provided by operating activi ties minus capital expenditures. Unlevered free cash flow is free cash flow plus cash interest expense ($ in thousands): March 31, 2017 December 31, 2016 March 31, 2016 Net cash flows provided by operating activities 7,264$ 10,185$ 10,782$ Capital expenditures: Maintenance capital (790) (1,717) (2,133) Growth capital (5,199) (4,533) (10,548) Free cash flow (non-GAAP) 1,275 3,935 (1,899) Cash interest expense 7,336 7,604 6,540 Unlevered free cash flow (non-GAAP) 8,611$ 11,539$ 4,641$ Three Months Ended A reconciliation of GAAP net loss to forward looking Adjusted EBITDA for the period indicated is as follows ($ in millions): Amount Percent Amount Percent Total Revenue 275$ 100.0% 285$ 100.0% Net Loss (GAAP) (5)$ -1.8% (1)$ -0.4% Add: Depreciation and amortization 71 25.8% 71 24.9% Interest expense 0.0% 0.0% Provision for income taxes 0.0% 0.0% Other expense (income) 0.0% 0.0% (Gain) loss on disposal of property and equipment, net 0.0% 0.0% Exit activities, restructuring and impairments, including goodwill impairment 7 2.5% 6 2.1% Stock-based compensation 8 2.9% 10 3.5% Non-income tax contingency 0.0% 0.0% Strategic alternatives and related costs 2 0.7% 2 0.7% Organizational realignment costs 2 0.7% 2 0.7% Adjusted EBITDA (non-GAAP) 85$ 30.9% 90$ 31.6% Low High 2017 Full-Year Guidance