Attached files
| file | filename |
|---|---|
| 8-K - FORM 8-K - PREMIER FINANCIAL CORP | v466936_8k.htm |
Exhibit 99

Meet and Greet May 11, 2017

Stephen L. Boomer Vice Chairman & Lead Director Retired President & CEO Arps Dairy | Defiance, OH Welcome & Introductions Board of Directors William J. Small Chairman Donald P. Hileman President & CEO 2

Robert E. Beach Retired President & CEO Commercial Bancshares, Inc. | Upper Sandusky, OH Welcome & Introductions Board of Directors Douglas A. Burgei , D.V.M. Veterinarian | Napoleon, OH John L. Bookmyer CEO Pain Management Group | Findlay, OH 3

Jean A. Hubbard Business Manager & Corporate Treasurer The Hubbard Company | Defiance, OH Welcome & Introductions Board of Directors Charles D. Niehaus Managing Partner Niehaus & Associates, Ltd. | Toledo, OH Barbara A. Mitzel Director of Public Affairs Consumers Energy | Adrian, MI 4

Thomas A. Reineke President & CEO Reineke Family Dealerships | Findlay, OH Welcome & Introductions Board of Directors Samuel S. Strausbaugh President, CEO & CFO JB & Company, Inc. | Tiffin, OH 5

Donald P. Hileman President & CEO Welcome & Introductions First Defiance Corporate Officers Kevin T. Thompson EVP | CFO Sharon L. Davis EVP | Director of Human Resources John R. Reisner EVP | Chief Risk Officer & Legal Counsel 6

Welcome & Introductions Executive Management Team Gregory R. Allen | EVP, Community Banking President Michael D. Mulford | EVP, Chief Credit Officer Dennis E. Rose, Jr. | EVP, Director of Strategy Management Amy L. Hackenberg | EVP, Southern Market Area President Timothy K. Harris | EVP, Eastern Market Area President James R. Williams III | EVP, Western Market Area President Marybeth Shunck | EVP, Northern Market Area President David D. Dygert | EVP, Columbus Executive Michael R. Klein | President & COO, First Insurance Group 7

Safe Harbor and Regulation FD Statement Statements contained in this presentation which are not historical facts are forward - looking statements as defined in the Private Securities Litigation Act of 1995. Such forward - looking statements are subject to risks and uncertainties which could cause actual results to differ materially from estimated results. Such risks and uncertainties are detailed in the company’s filings with the Securities and Exchange Commission. 8

Non - GAAP Financial Measures The slides in this presentation contain non - GAAP financial measures. For purposes of Regulation G, a non - GAAP financial measure is a numerical measure of the registrant's historical or future financial performance, financial position or cash flows that excludes amounts, or is subject to adjustments that have the effect of excluding amounts, that are included in the most directly comparable measure calculated and presented in accordance with GAAP in the statement of income, balance sheet or statement of cash flows (or equivalent statements ) of the registrant; or includes amounts, or is subject to adjustments that have the effect of including amounts, that are excluded from the most directly comparable measure so calculated and presented. In this regard, GAAP refers to generally accepted accounting principles in the United States . Pursuant to the requirements of Regulation G, First Defiance Financial Corp. has provided reconciliations within these slides, as necessary, of the non - GAAP financial measure to the most comparable GAAP financial measure. 9
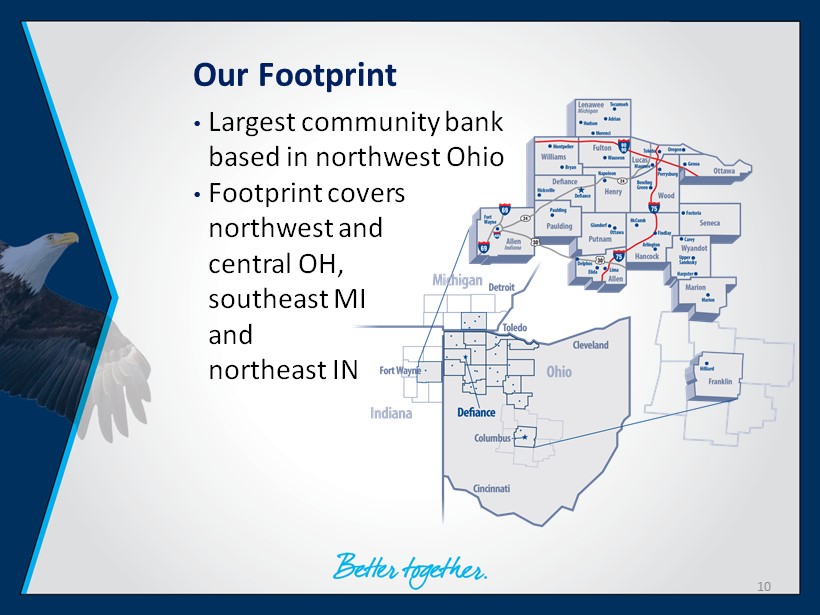
Our Footprint • Largest community bank based in northwest Ohio • Footprint covers northwest and c entral OH, southeast MI and northeast IN 10

Our Footprint – Local Economy • Fort to Port Growth Corridor • Fort Wayne, IN to Toledo, OH • Economic activity – expansion of transportation • Logistics projects linked to our transportation • Railroad • Regional distribution centers • Food processing and production • What we see 11
Our Mission & Vision As a high performing community bank, our engaged and valued employees provide smart solutions to our clients and communities. 12

Our Core Values We develop our Trusted Advisors to serve others by being: People Focused We build meaningful relationships and are committed to the success of those we serve. 13

People Focused • Relationship banking philosophy • 156 employees in the southern market area • 669 First Defiance employees • Leadership development programs • Continue performance management system with clear “line of sight” targets for all employees 14
Our Core Values We develop our Trusted Advisors to serve others by being: Performance Driven We deliver exceptional results to all stakeholders. 15
Performance Driven • Core fundamentals strong • Positioned to overcome economic and regulatory challenges • Basic, conservative business plan • Committed to employee development and accountability 16
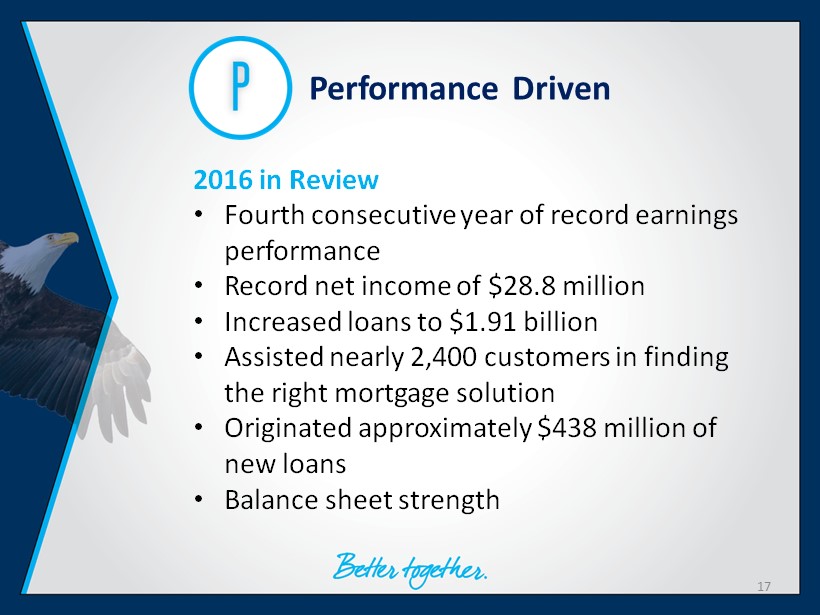
Performance Driven 2016 in Review • Fourth consecutive year of record earnings performance • Record net income of $28.8 million • Increased loans to $1.91 billion • Assisted nearly 2,400 customers in finding the right mortgage solution • Originated approximately $438 million of new loans • Balance sheet strength 17

Performance Driven Market Share • 1 st or 2 nd in mortgage origination in 2016 in 6 of the 14 counties we have offices • #1 seller to Freddie Mac in Hancock, Defiance, and Williams counties in Ohio; #2 in Wood and Allen Counties in Ohio • 1 st or 2 nd in total d eposits 2016 in 7 of the 14 counties we have offices 18

Year Ended December 31, 2016 2015 2014 Net Interest Income $78.9 $74.1 $ 69.7 Provisions for Loan Losses $0.3 $0.1 $1.1 Net Income available to Common Share $28.8 $26.4 $24.3 Diluted Net Income per Share $3.19 $2.82 $2.44 Return on Assets 1.20% 1.19% 1.12% Return on Equity 10.10% 9.52% 8.78% Performance Driven Financial Highlights Dollars in millions, except per share data 19

Performance Driven Capital Management • Strong capital levels exceeding all regulatory targets • Dividend increase of 14% over 2015, yield approximately 2.1% • 2016 FDEF Total Return: 37.3% • 2016 Banks $1 - $5 Billion: 43.8% • 2016 All Banks: 26.4% 20

Performance Driven *Refer to Appendix slides 34 - 37 for further information on non - GAAP measures and reconciliation of “as reported” results to “core” results. Quarter Ended March 31, As Reported Core* 2017 2016 2017 2016 Net Interest Income $21.6 $19.2 $21.6 $19.2 Provisions for Loan Losses $0.1 $0.4 $0.1 $0.4 Net Income $5.1 $7.2 $7.9 $7.1 Diluted Net Income per Share $0.54 $0.79 $0.83 $0.78 Return on Assets 0.79% 1.25% 1.22% 1.23% Return on Equity 6.63% 10.33% 10.19% 10.21% First Quarter Performance Dollars in millions, except per share data 21

Our Core Values We develop our Trusted Advisors to serve others by being: Community Minded We improve the communities in which we live, work and serve through the investment of people and resources. 22

Community Minded • Over $205,000 donated to charitable organizations in 2016 • Employees provided countless volunteer hours and participation in local events 23

Community Minded • Habitat for Humanity Women’s Build in Findlay • Financial education at Apollo C areer Center 24

Community Minded • 3 rd Annual Pay It Forward Event 25

Community Minded • Jeff Vereecke Community Impact Award to honor an employee for commitment to community • Development of the community volunteer program 26

Our Core Values We develop our Trusted Advisors to serve others by being: Innovative We provide creative solutions by continuously improving and moving forward with new perspectives. 27

Innovative • Alternative Delivery • Formation of Office of Strategy Management • Employee suggestion venue for process improvement and efficiency 28

Our Core Values We develop our Trusted Advisors to serve others by being: Trustworthy We honor our commitments and respect all stakeholders by acting honestly, responsibly and with integrity in all we do. 29

Trustworthy • FDEF one of 15 named to KBW Honor Roll • Winners are publicly traded banking institutions with more than $500 million in total assets meeting these 3 conditions: 1. No annual loss reported in net income per share before extraordinary items over the past 10 years 2. 2016 annual reported net income per share before extraordinary items equal to or greater than peak net income per share over the past 10 years 3. Consecutive increases in net income per share before extraordinary items since 2002 30

Our Focus Going Forward 31

Talent Development and Retention Mergers and Acquisitions Metro Market and Organic Growth The Client Experience Leveraging Technology for Efficiency and Growth 32
Thank you. 33

Appendix – Non - GAAP Reconciliations Non - GAAP Reconciliation of Net Income Three Months Ended March 31, 2017 2016 Unaudited Unaudited Net Income as reported $5,140 $7,169 Gain on sale of securities - (131) Merger expenses 3,582 - Tax effect (1,043) 46 Tax free enhancement gain on bank owned life insurance (1,500) - Income tax on surrender of bank owned life insurance 1,721 - Core Net Income $7,900 $7,084 Amounts in thousands, except per share data 34
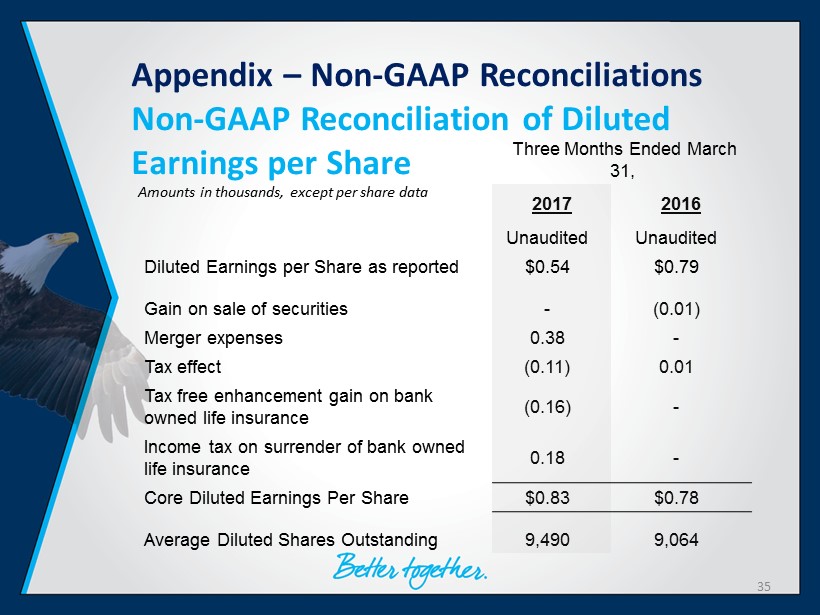
Appendix – Non - GAAP Reconciliations Non - GAAP Reconciliation of Diluted Earnings per Share Three Months Ended March 31, 2017 2016 Unaudited Unaudited Diluted Earnings per Share as reported $0.54 $0.79 Gain on sale of securities - (0.01) Merger expenses 0.38 - Tax effect (0.11) 0.01 Tax free enhancement gain on bank owned life insurance (0.16) - Income tax on surrender of bank owned life insurance 0.18 - Core Diluted Earnings Per Share $0.83 $0.78 Average Diluted Shares Outstanding 9,490 9,064 Amounts in thousands, except per share data 35

Appendix – Non - GAAP Reconciliations Non - GAAP Reconciliation of Return on Average Assets Three Months Ended March 31, 2017 2016 Unaudited Unaudited Return on Average Assets as reported 0.79% 1.25% Gain on sale of securities 0.00% - 0.02% Merger expenses 0.55% 0.00% Tax effect - 0.16% 0.01% Tax free enhancement gain on bank owned life insurance - 0.23% 0.00% Income tax on surrender of bank owned life insurance 0.27% 0.00% Core Return on Average Assets 1.22% 1.23% Average total assets 2,622,402 2,314,203 Amounts in thousands, except per share data 36
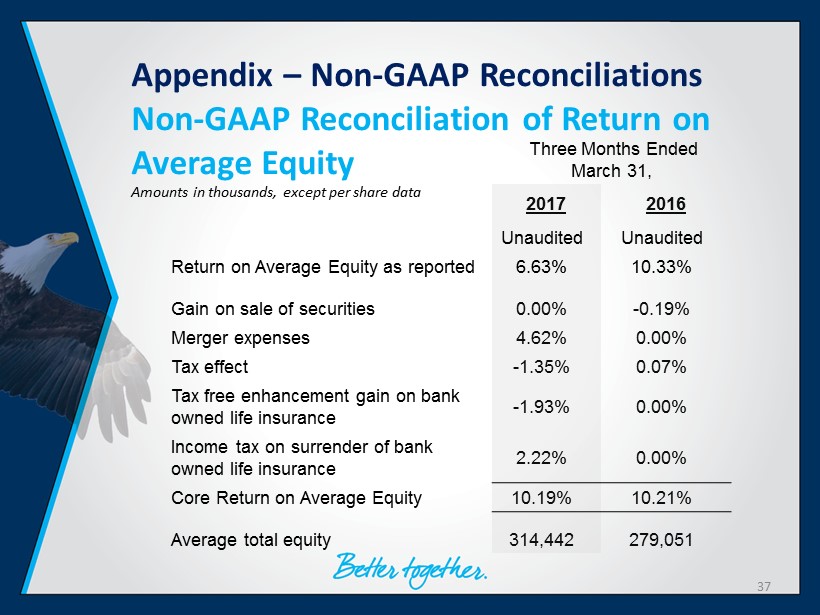
Appendix – Non - GAAP Reconciliations Non - GAAP Reconciliation of Return on Average Equity Three Months Ended March 31, 2017 2016 Unaudited Unaudited Return on Average Equity as reported 6.63% 10.33% Gain on sale of securities 0.00% - 0.19% Merger expenses 4.62% 0.00% Tax effect - 1.35% 0.07% Tax free enhancement gain on bank owned life insurance - 1.93% 0.00% Income tax on surrender of bank owned life insurance 2.22% 0.00% Core Return on Average Equity 10.19% 10.21% Average total equity 314,442 279,051 Amounts in thousands, except per share data 37