Attached files
| file | filename |
|---|---|
| EX-99.1 - EX-99.1 - LANDAUER INC | ldr-20170510xex99_1.htm |
| 8-K - 8-K - LANDAUER INC | ldr-20170510x8k.htm |
Exhibit 99.2
Investor Presentation
May 2017
Some of the information shared here (including, in particular, the section titled “Fiscal Year 2017 Outlook”) constitutes forward-looking statements that are based on assumptions and involve certain risks and uncertainties. These include the following, without limitation: assumptions, risks and uncertainties associated with the Company’s future performance, the Company’s development and introduction of new technologies in general; the ability to protect and utilize the Company’s intellectual property; events or circumstances which result in an impairment of assets, including but not limited to, goodwill and identifiable intangible assets; continued customer acceptance of the InLight technology; the adaptability of optically stimulated luminescence (OSL) technology to new platforms and formats; military and other government funding for the purchase of certain of the Company’s equipment and services; the impact on sales and pricing of certain customer group purchasing arrangements; changes in spending or reimbursement for medical products or services; the costs associated with the Company’s research and business development efforts; the usefulness of older technologies and related licenses and intellectual property; the effectiveness of and costs associated with the Company’s IT platform enhancements and investments in cyber security enhancements; the anticipated results of operations of the Company and its subsidiaries or joint ventures; valuation of the Company’s long-lived assets or reporting units relative to future cash flows; changes in pricing of services and products; changes in postal and delivery practices; the Company’s business plans; anticipated revenue and cost growth; the ability to integrate the operations of acquired businesses and to realize the expected benefits of acquisitions; the risks associated with conducting business internationally; costs incurred for potential acquisitions or similar transactions; other anticipated financial events; the effects of changing economic and competitive conditions, including instability in capital markets which could impact availability of short and long-term financing; the timing and extent of changes in interest rates; the level of borrowings; foreign exchange rates; government regulations; accreditation requirements; changes in the trading market that affect the costs of obligations under the Company’s benefit plans; and pending accounting pronouncements. These assumptions may not materialize to the extent assumed, and risks and uncertainties may cause actual results to be different from what is anticipated today. These risks and uncertainties also may result in changes to the Company’s business plans and prospects, and could create the need from time to time to write down the value of assets or otherwise cause the Company to incur unanticipated expenses. Additional information may be obtained by reviewing the information set forth in Item 1A “Risk Factors” and Item 7A “Quantitative and Qualitative Disclosures about Market Risk” and information contained in the Company's Annual Report on Form 10-K for the year ended September 30, 2016 and other reports filed by the Company, from time to time, with the Securities and Exchange Commission. The Company does not undertake, and expressly disclaims, any duty to update any forward-looking statement whether as a result of new information, future events or changes in the Company’s expectations, except as required by law.
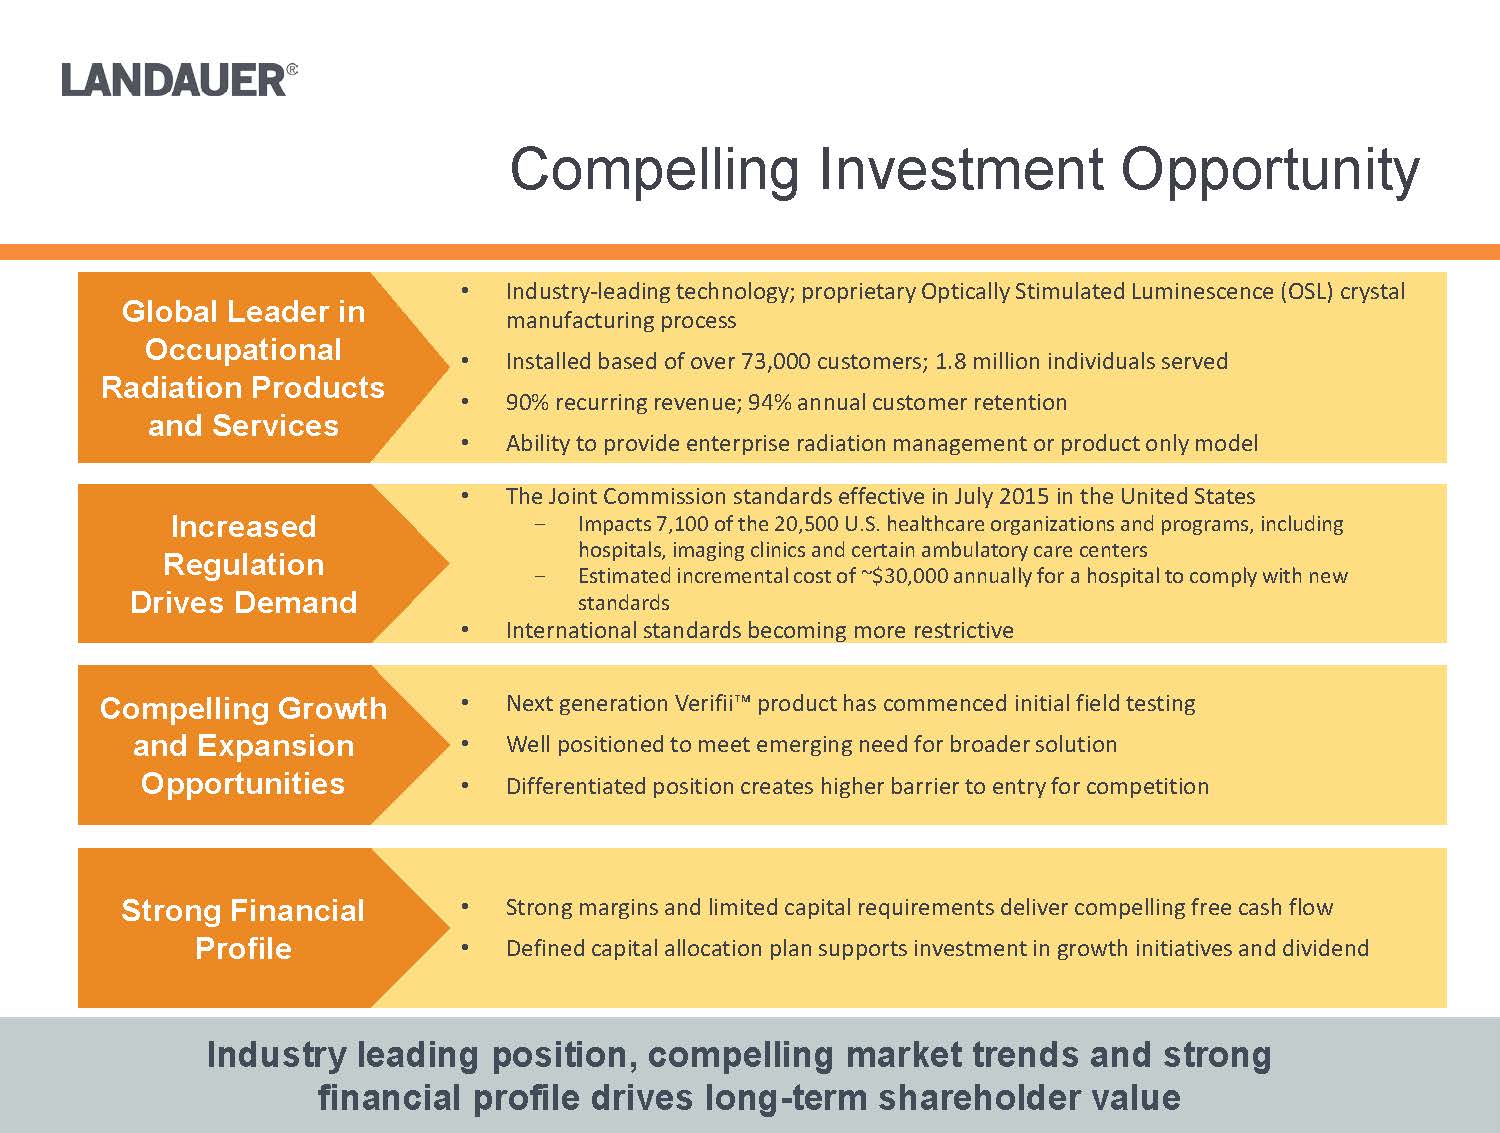
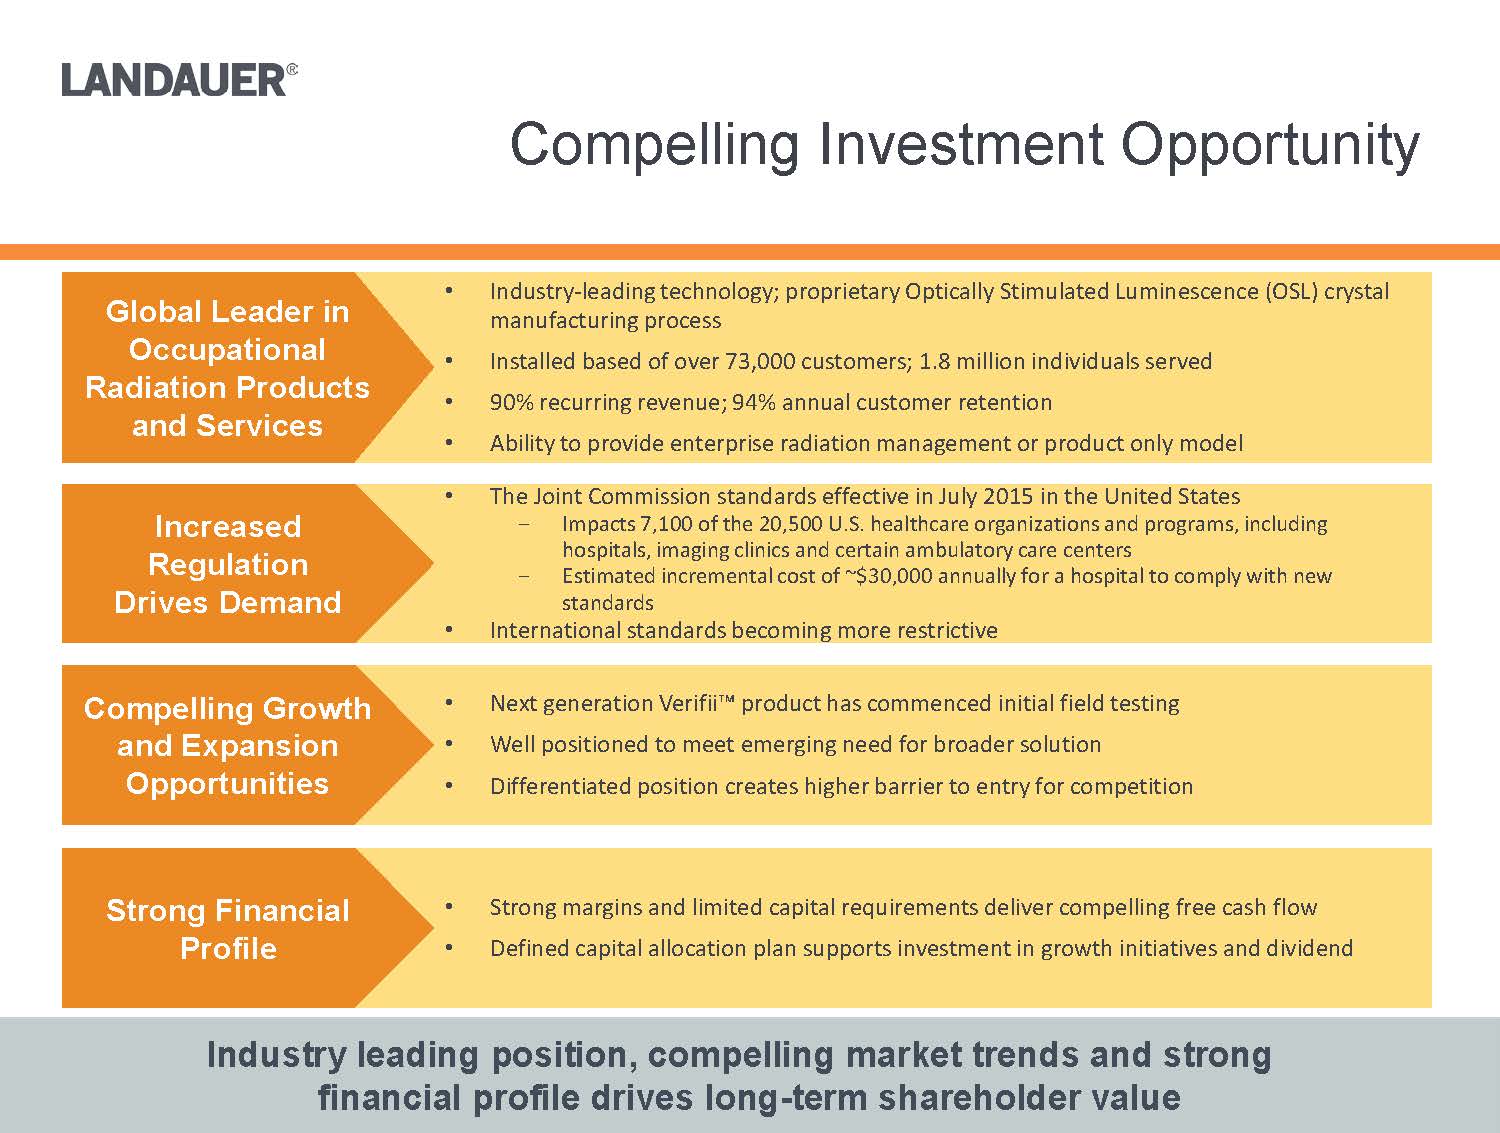
•The Joint Commission standards effective in July 2015 in the United States-Impacts 7,100 of the 20,500 U.S. healthcare organizations and programs, including hospitals, imaging clinics and certain ambulatory care centers-Estimated incremental cost of ~$30,000 annually for a hospital to comply with new standards
•International standards becoming more restrictive Industry leading position, compelling market trends and strong financial profile drives long-term shareholder value
•Next generation Verifii™ product has commenced initial field testing•Well positioned to meet emerging need for broader solution •Differentiated position creates higher barrier to entry for competition•Strong margins and limited capital requirements deliver compelling free cash flow•Defined capital allocation plan supports investment in growth initiatives and dividend•Industry-leading technology; proprietary Optically Stimulated Luminescence (OSL) crystal manufacturing process•Installed based of over 73,000 customers; 1.8 million individuals served•90% recurring revenue; 94% annual customer retention•Ability to provide enterprise radiation management or product only modelGlobal Leader in Occupational Radiation Products and ServicesIncreased Regulation Drives DemandCompelling Growth and Expansion OpportunitiesStrong Financial Profile
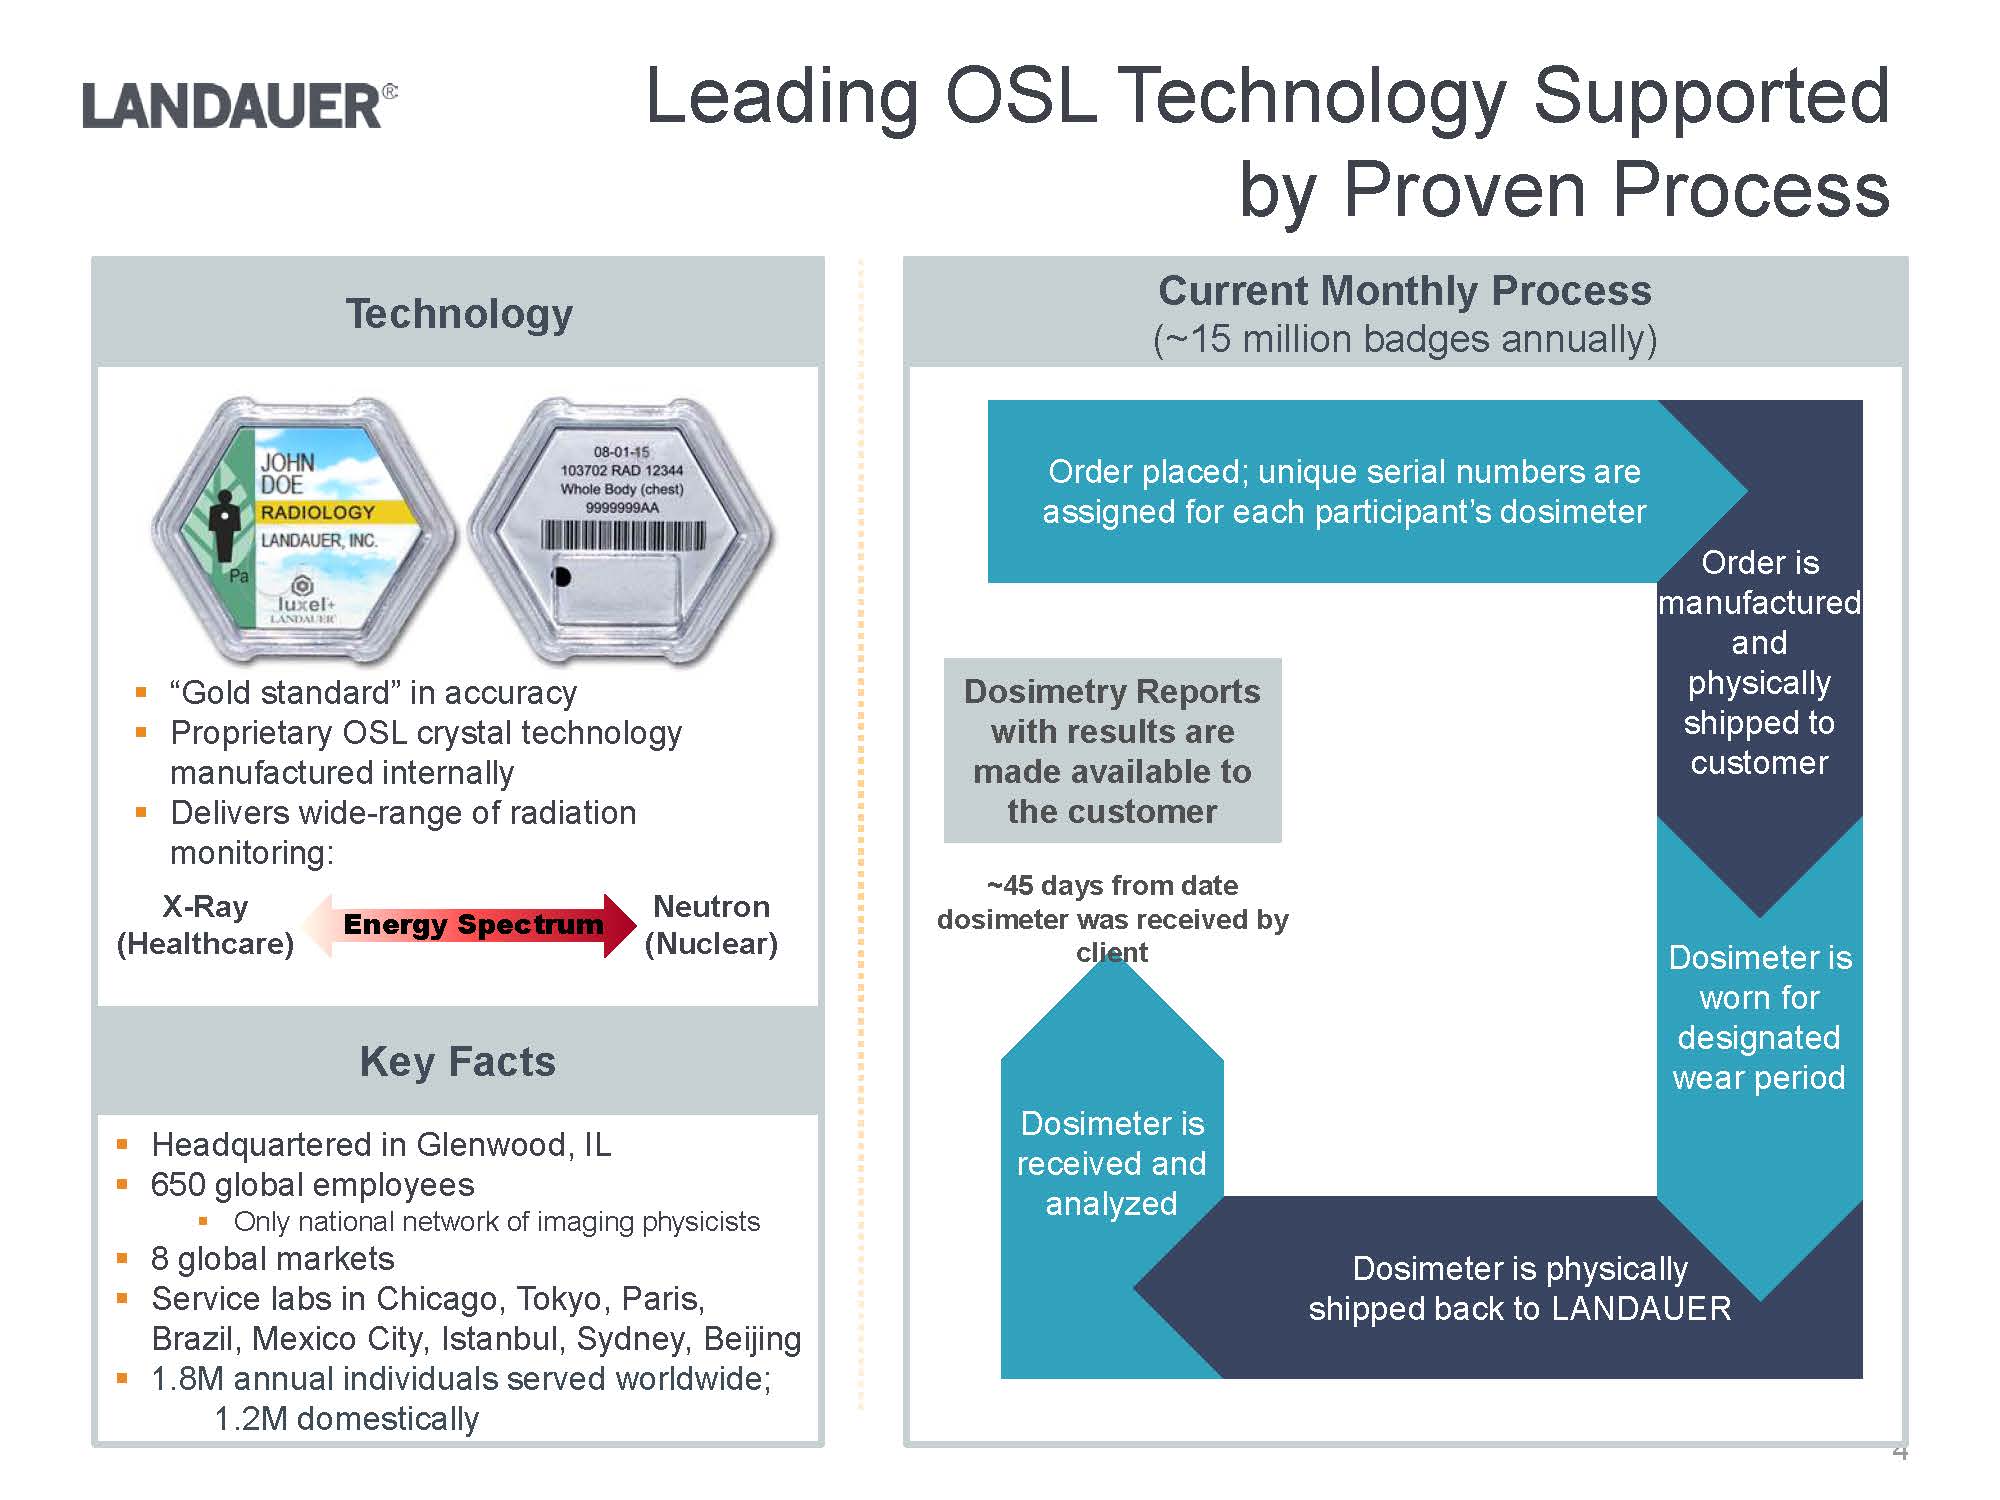
.“Gold standard” in accuracy.Proprietary OSL crystal technology manufactured internally.Delivers wide-range of radiation monitoring:Dosimetry Reports with results are made available to the customer.Headquartered in Glenwood, IL.650 global employees.Only national network of imaging physicists.8 global markets.Service labs in Chicago, Tokyo, Paris, Brazil, Mexico City, Istanbul, Sydney, Beijing .1.8M annual individuals served worldwide;1.2M domestically Dosimeter is received and analyzed Dosimeter is physically shipped back to LANDAUERDosimeter is worn for designated wear periodOrder is manufactured and physically shipped to customerOrder placed; unique serial numbers are assigned for each participant’s dosimeter~45 days from date dosimeter was received by clientNeutron(Nuclear)X-Ray(Healthcare)Current Monthly Process(~15 million badges annually)TechnologyKey FactsEnergy Spectrum
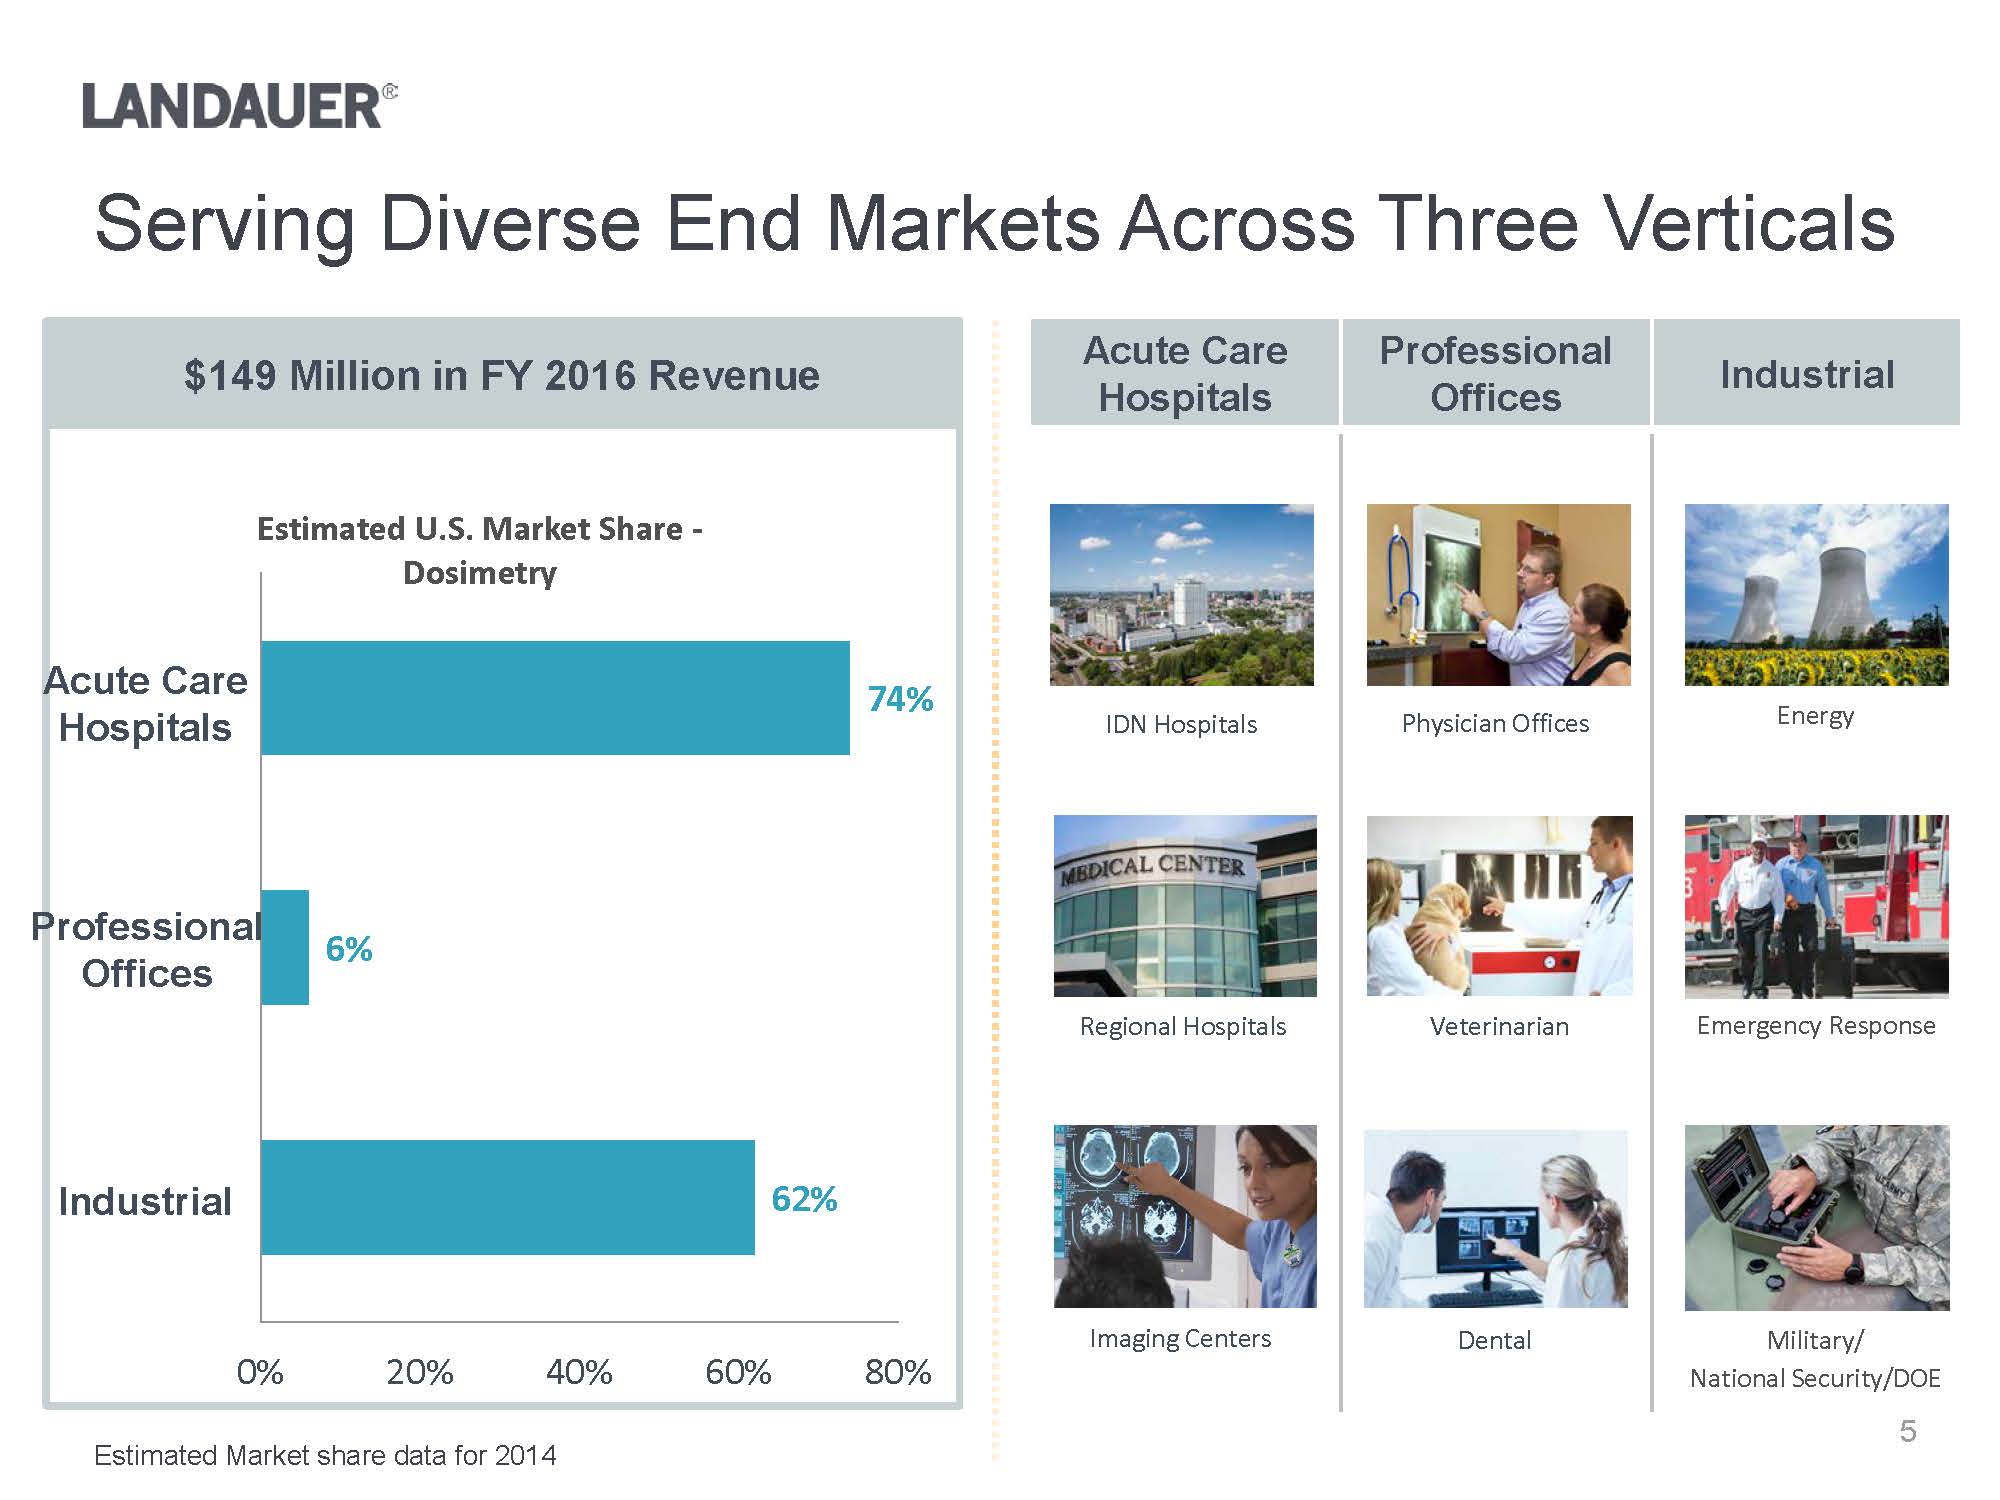
ProfessionalOfficesServing Diverse End Markets Across Three VerticalsAcute Care HospitalsProfessional OfficesIndustrialEnergyEmergency ResponseMilitary/National Security/DOEW:\Landauer\Investors\Investor deck\Images\73470968_5.jpgW:\Landauer\Investors\Investor deck\Images\L41513.2429.jpgPhysician OfficesIDN Hospitals
VeterinarianDentalRegional HospitalsImaging Centers$149 Million in FY 2016 Revenue62%6%74%0%20%40%60%80%Estimated U.S. Market Share -DosimetryIndustrialEstimated Market share data for 2014
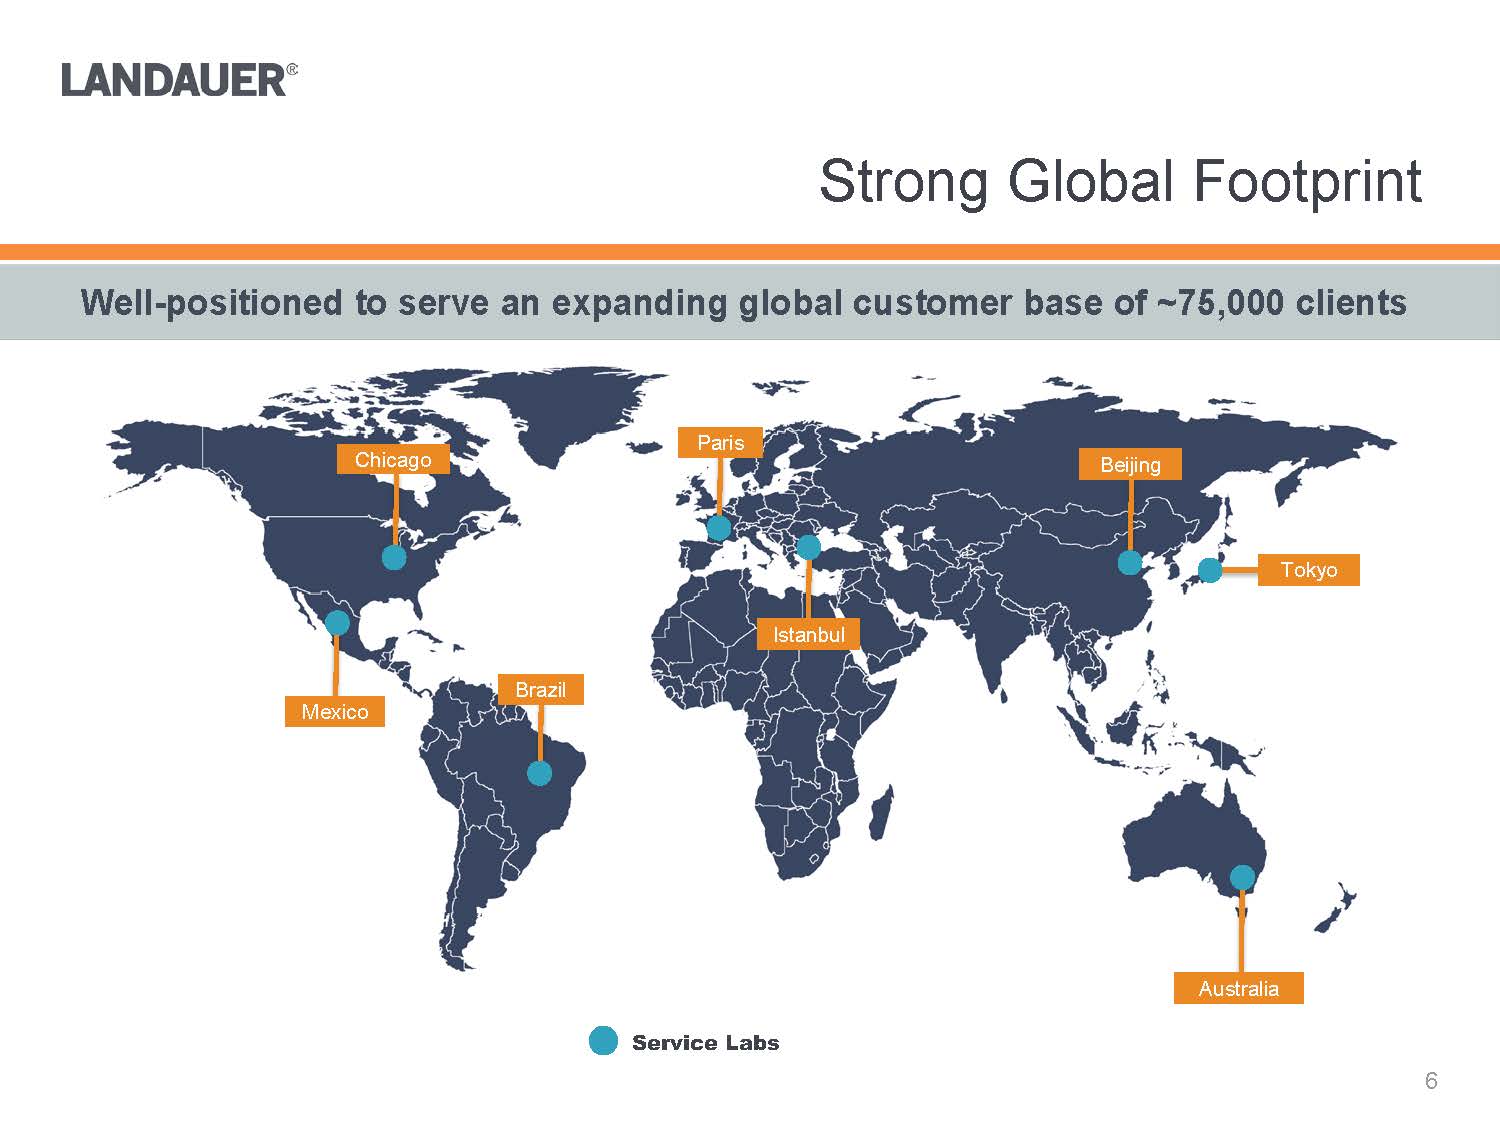
Service LabsWell-positioned to serve an expanding global customer base of ~75,000 clients
ChicagoMexicoBrazilParisIstanbulBeijingTokyoAustralia
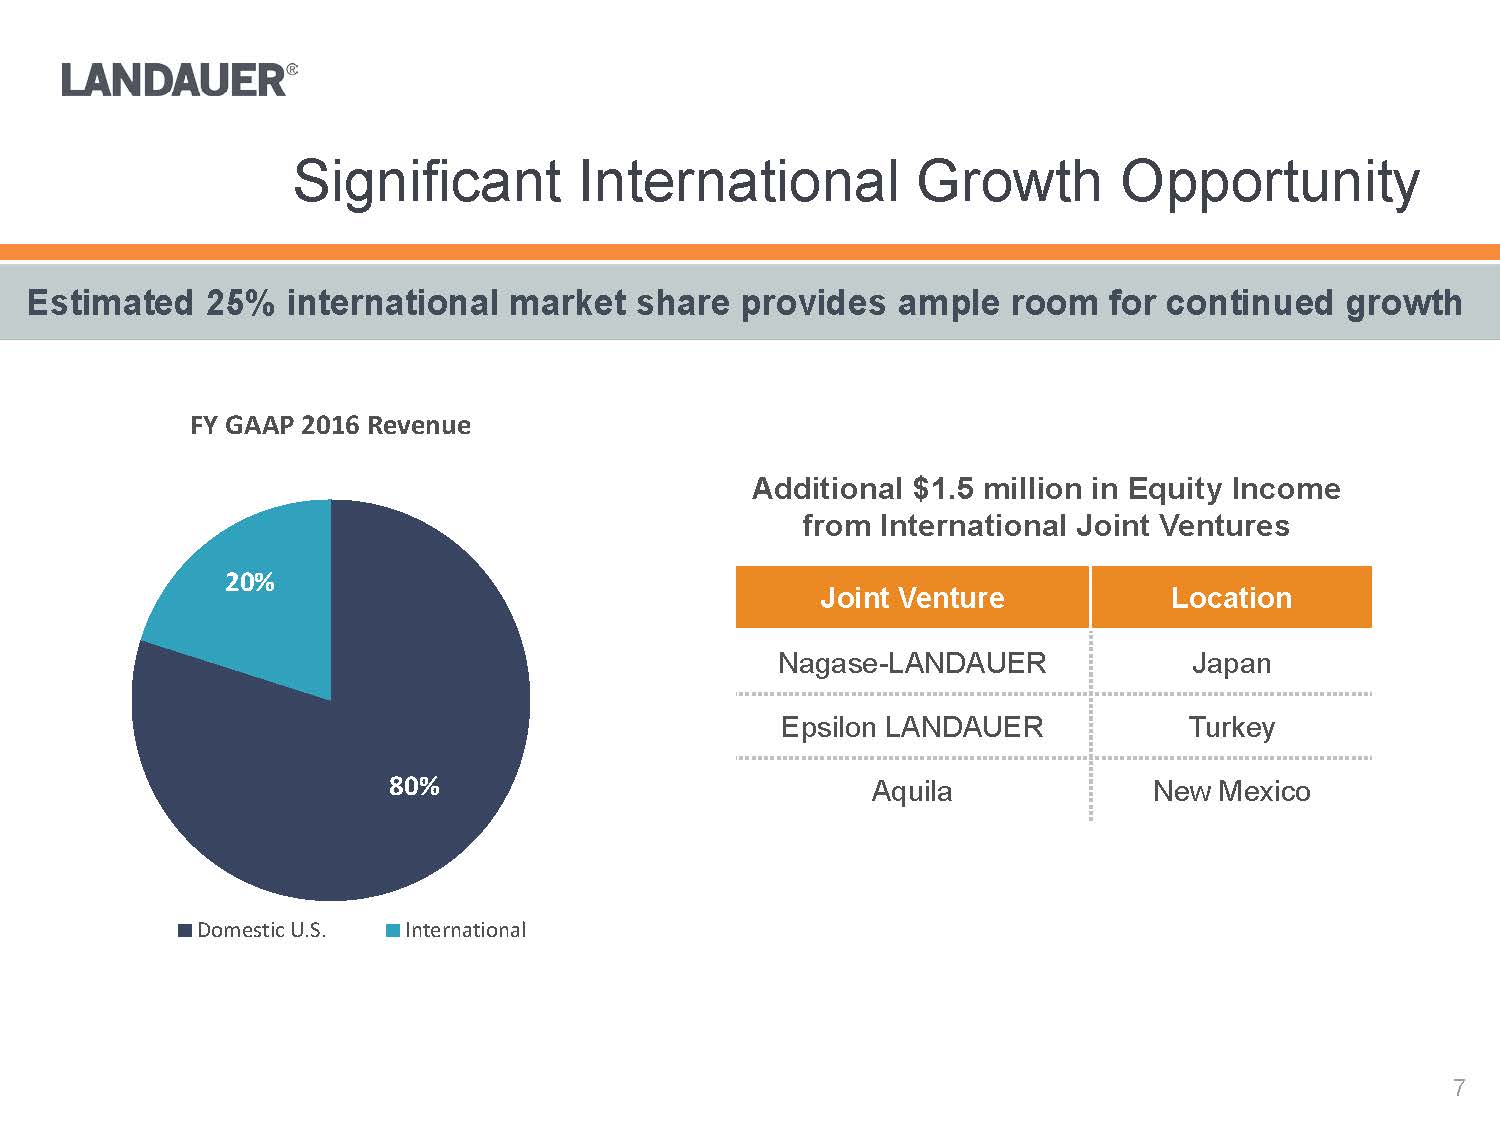
Additional $1.5 million in Equity Income from International Joint Ventures80%20%FY GAAP 2016 RevenueDomestic U.S.InternationalJoint VentureLocationNagase-LANDAUERJapanEpsilon LANDAUERTurkeyAquilaNew MexicoEstimated 25% international market share provides ample room for continued growth
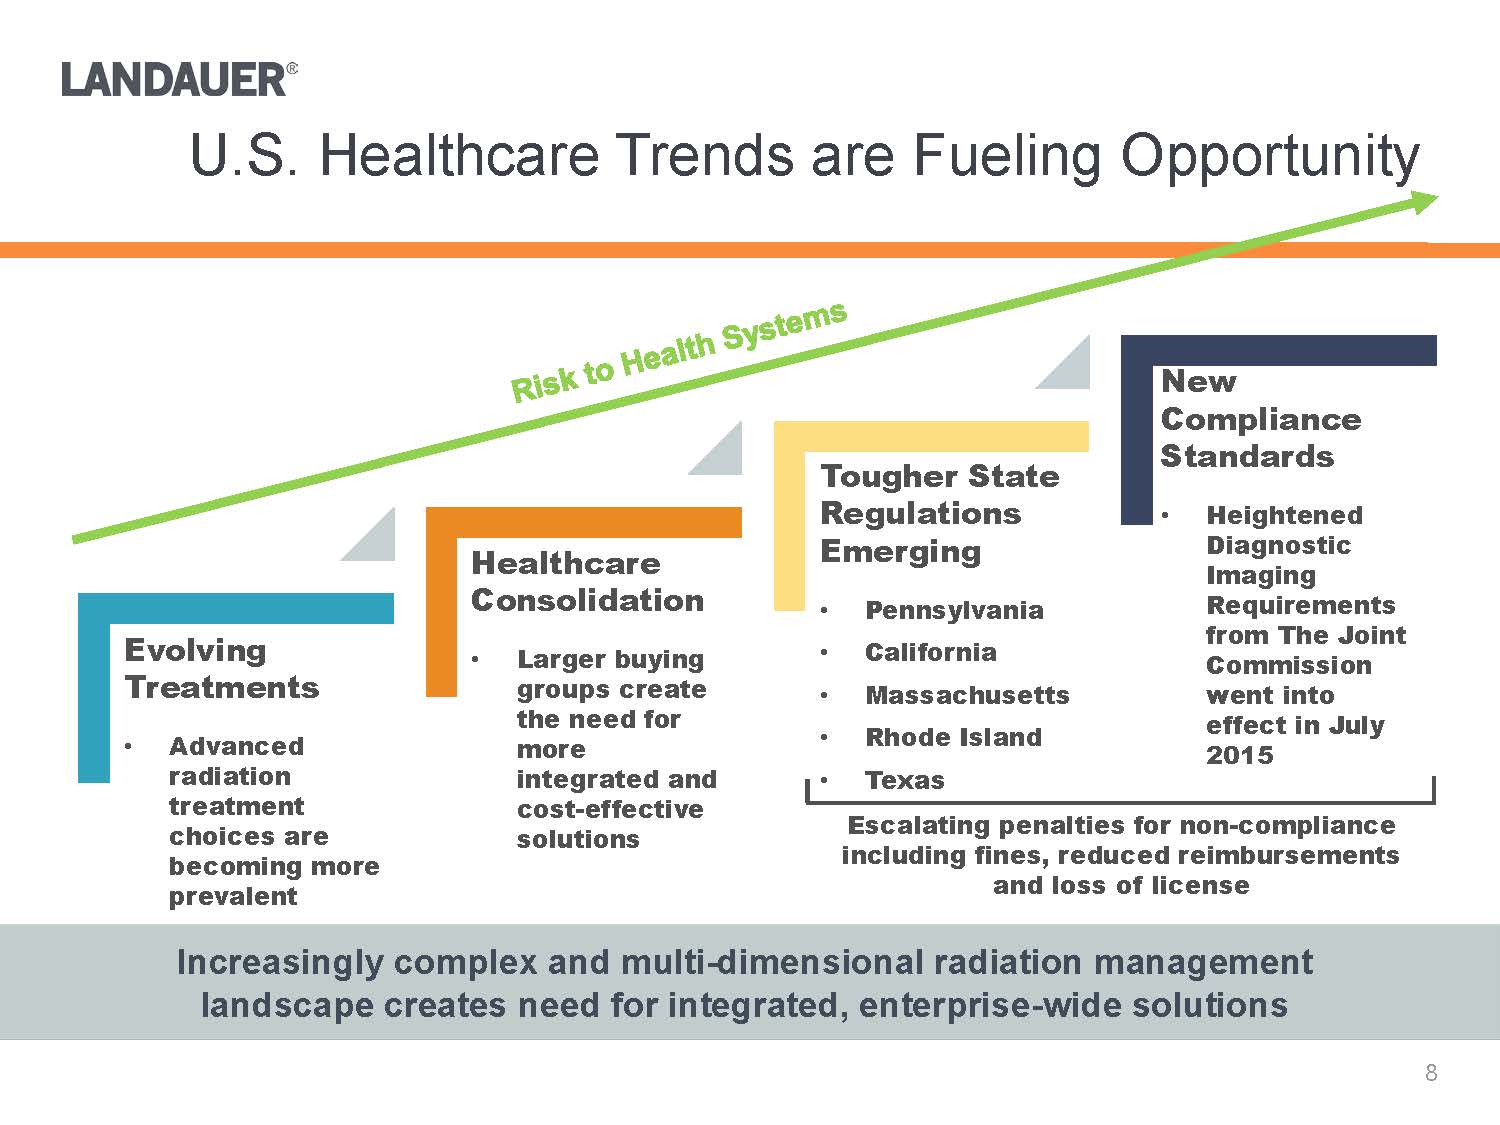
U.S. Healthcare Trends are Fueling OpportunityIncreasingly complex and multi-dimensional radiation management landscape creates need for integrated, enterprise-wide solutions Tougher State Regulations Emerging•Pennsylvania•California•Massachusetts•Rhode Island•TexasHealthcare Consolidation•Larger buying groups create the need for more integrated and cost-effective solutionsEvolving Treatments•Advanced radiation treatment choices are becoming more prevalentNew Compliance Standards•Heightened Diagnostic Imaging Requirements from The Joint Commission went into effect in July 2015Escalating penalties for non-compliance including fines, reduced reimbursements and loss of license
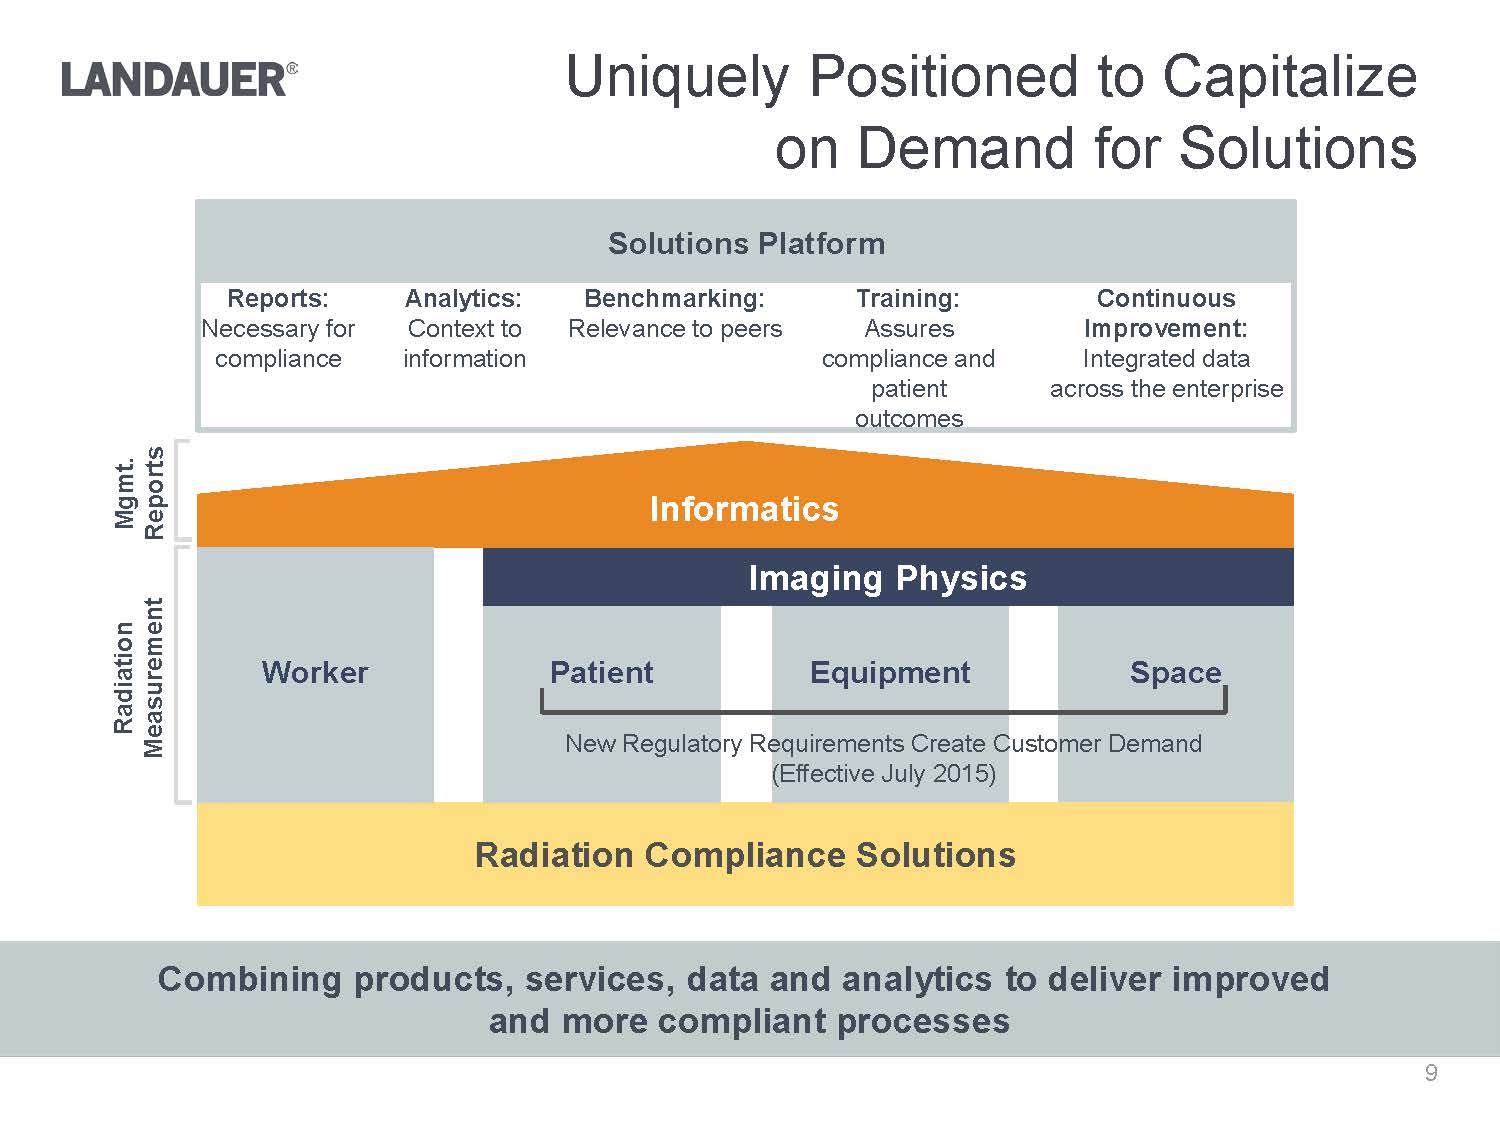
Reports:Necessary for complianceAnalytics:Context to informationBenchmarking:Relevance to peersTraining:Assures compliance and patient outcomesContinuous Improvement:Integrated data across the enterpriseUniquely Positioned to Capitalize on Demand for SolutionsCombining products, services, data and analytics to deliver improved and more compliant processesSpaceRadiation Compliance SolutionsInformaticsRadiation MeasurementEquipmentPatientWorkerImaging PhysicsNew Regulatory Requirements Create Customer Demand(Effective July 2015)Solutions Platform
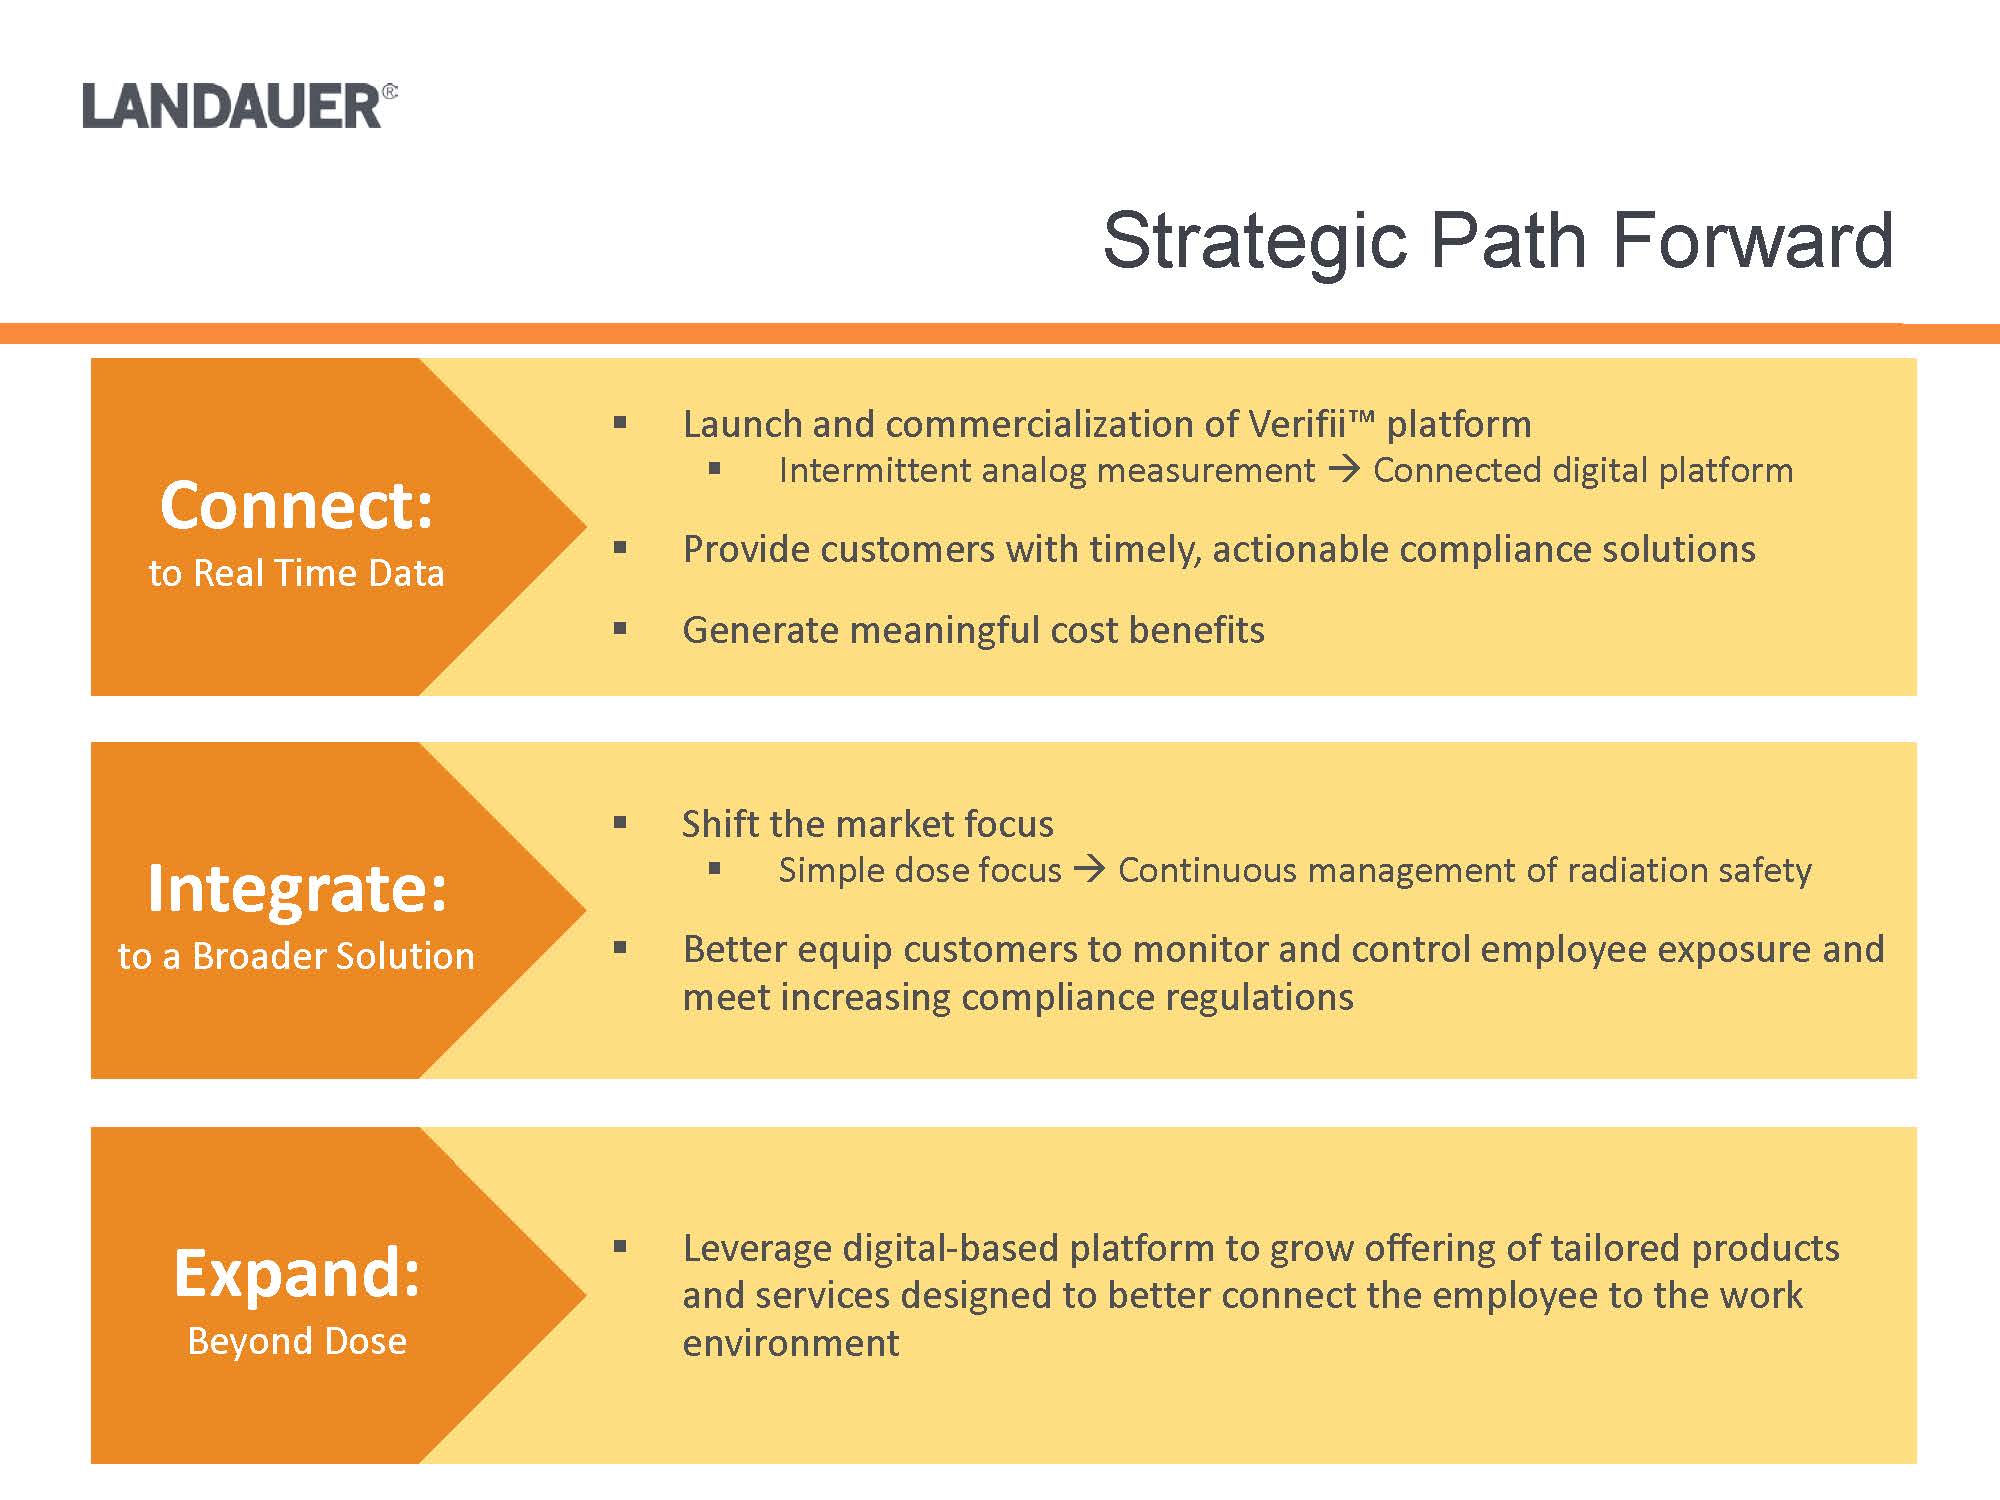
.Shift the market focus .Simple dose focus .Continuous management of radiation safety.Better equip customers to monitor and control employee exposure and meet increasing compliance regulations.Leverage digital-based platform to grow offering of tailored products and services designed to better connect the employee to the work environment.Launch and commercialization of Verifii™ platform.Intermittent analog measurement .Connected digital platform.Provide customers with timely, actionable compliance solutions.Generate meaningful cost benefitsConnect:to Real Time DataIntegrate:to a Broader SolutionExpand:Beyond Dose
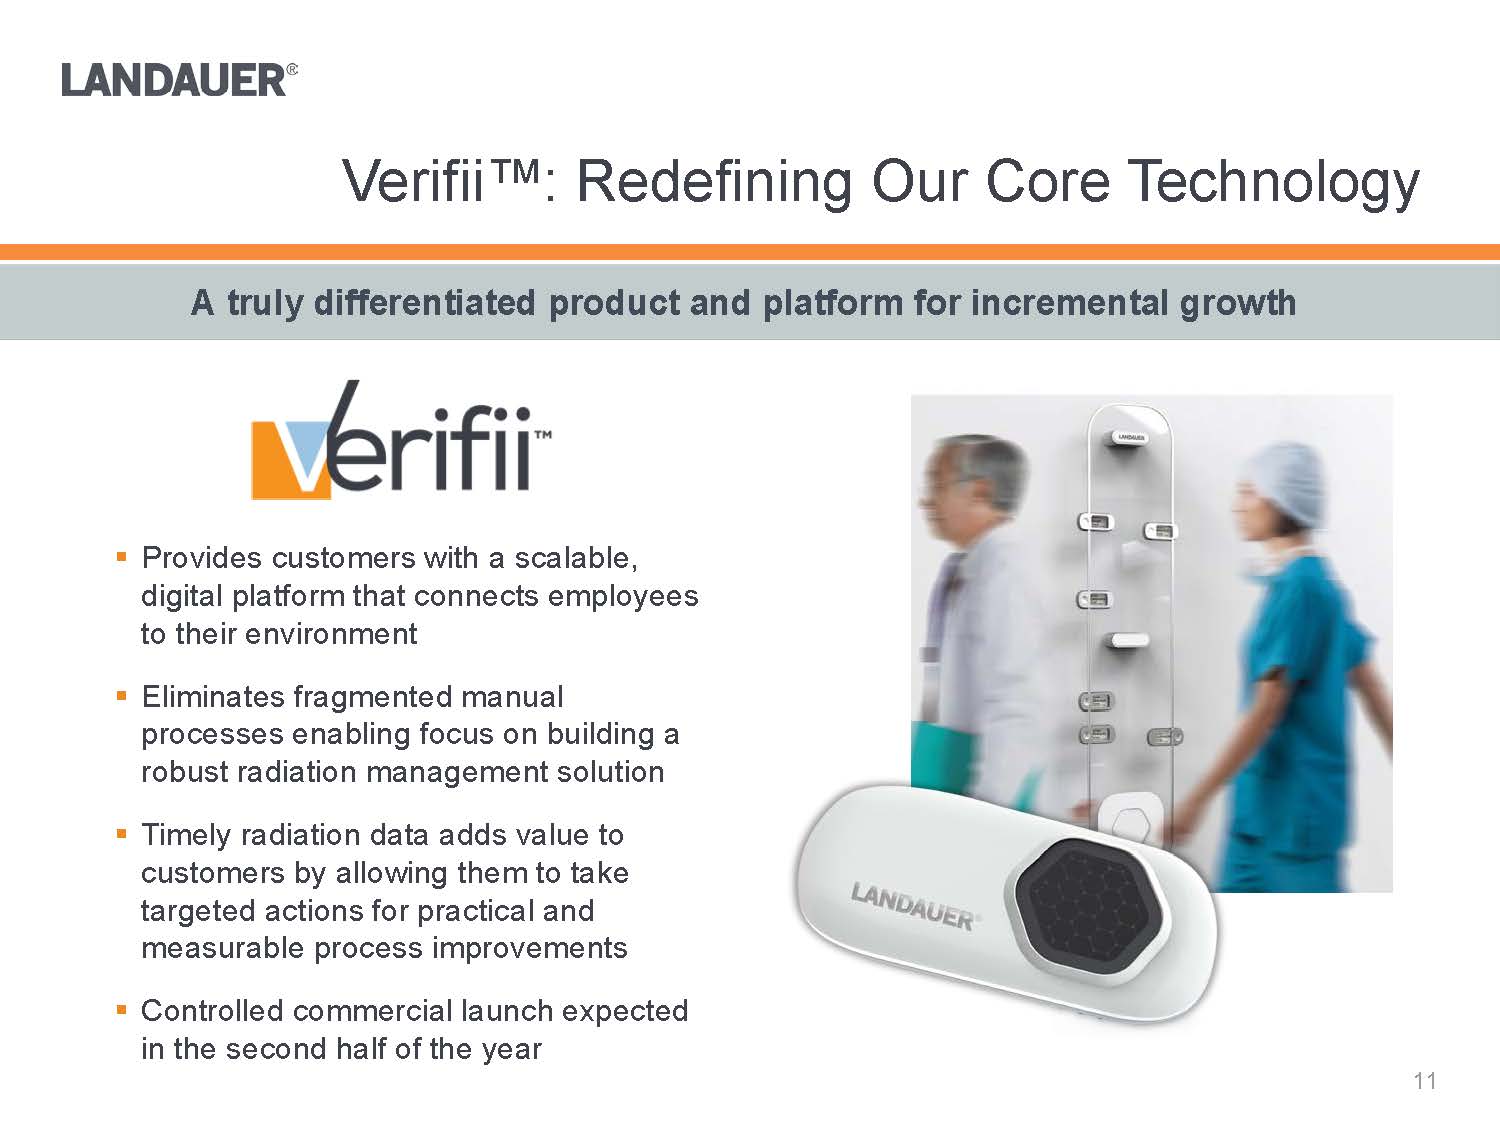
.Provides customers with a scalable, digital platform that connects employees to their environment .Eliminates fragmented manual processes enabling focus on building a robust radiation management solution.Timely radiation data adds value to customers by allowing them to take targeted actions for practical and measurable process improvements.Controlled commercial launch expected in the second half of the yearA truly differentiated product and platform for incremental growth C:\Users\mdegraff\AppData\Local\Microsoft\Windows\Temporary Internet Files\Content.Outlook\EQH1N7PW\Dosimeter.2.png
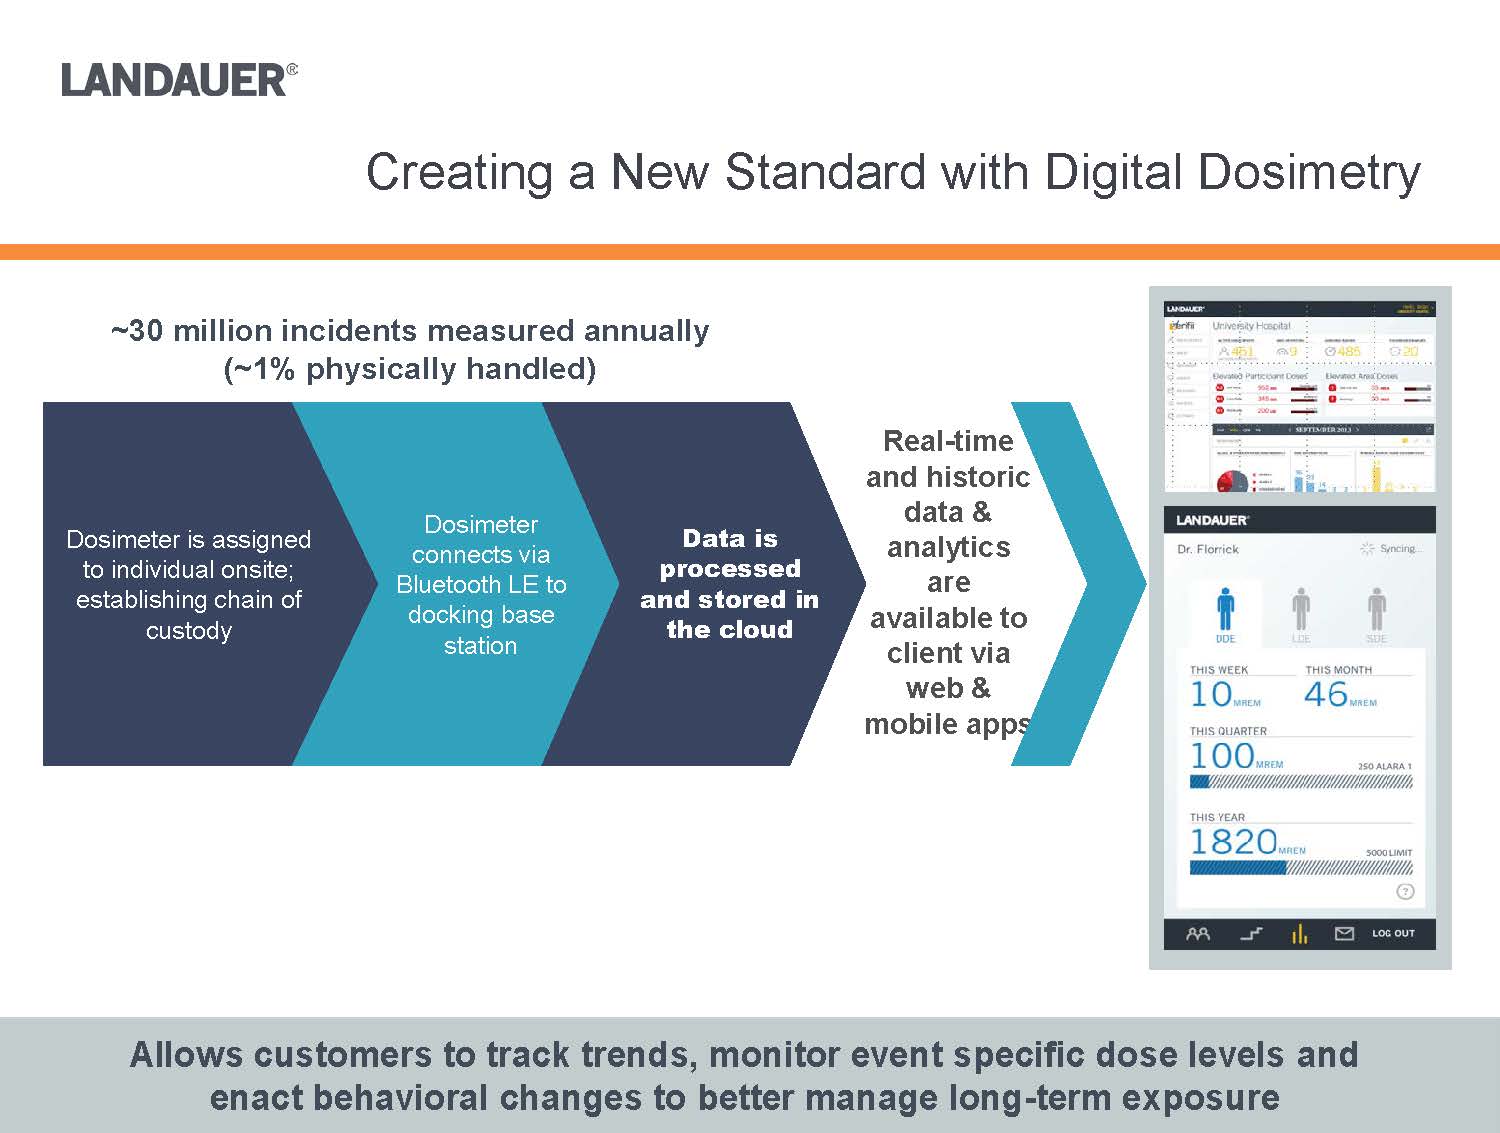
Real-time and historic data & analytics are available to client via web & mobile appsAllows customers to track trends, monitor event specific dose levels and enact behavioral changes to better manage long-term exposure Data is processed and stored in the cloudDosimeter connects via Bluetooth LE to docking base stationDosimeter is assigned to individual onsite; establishing chain of custody~30 million incidents measured annually(~1% physically handled)
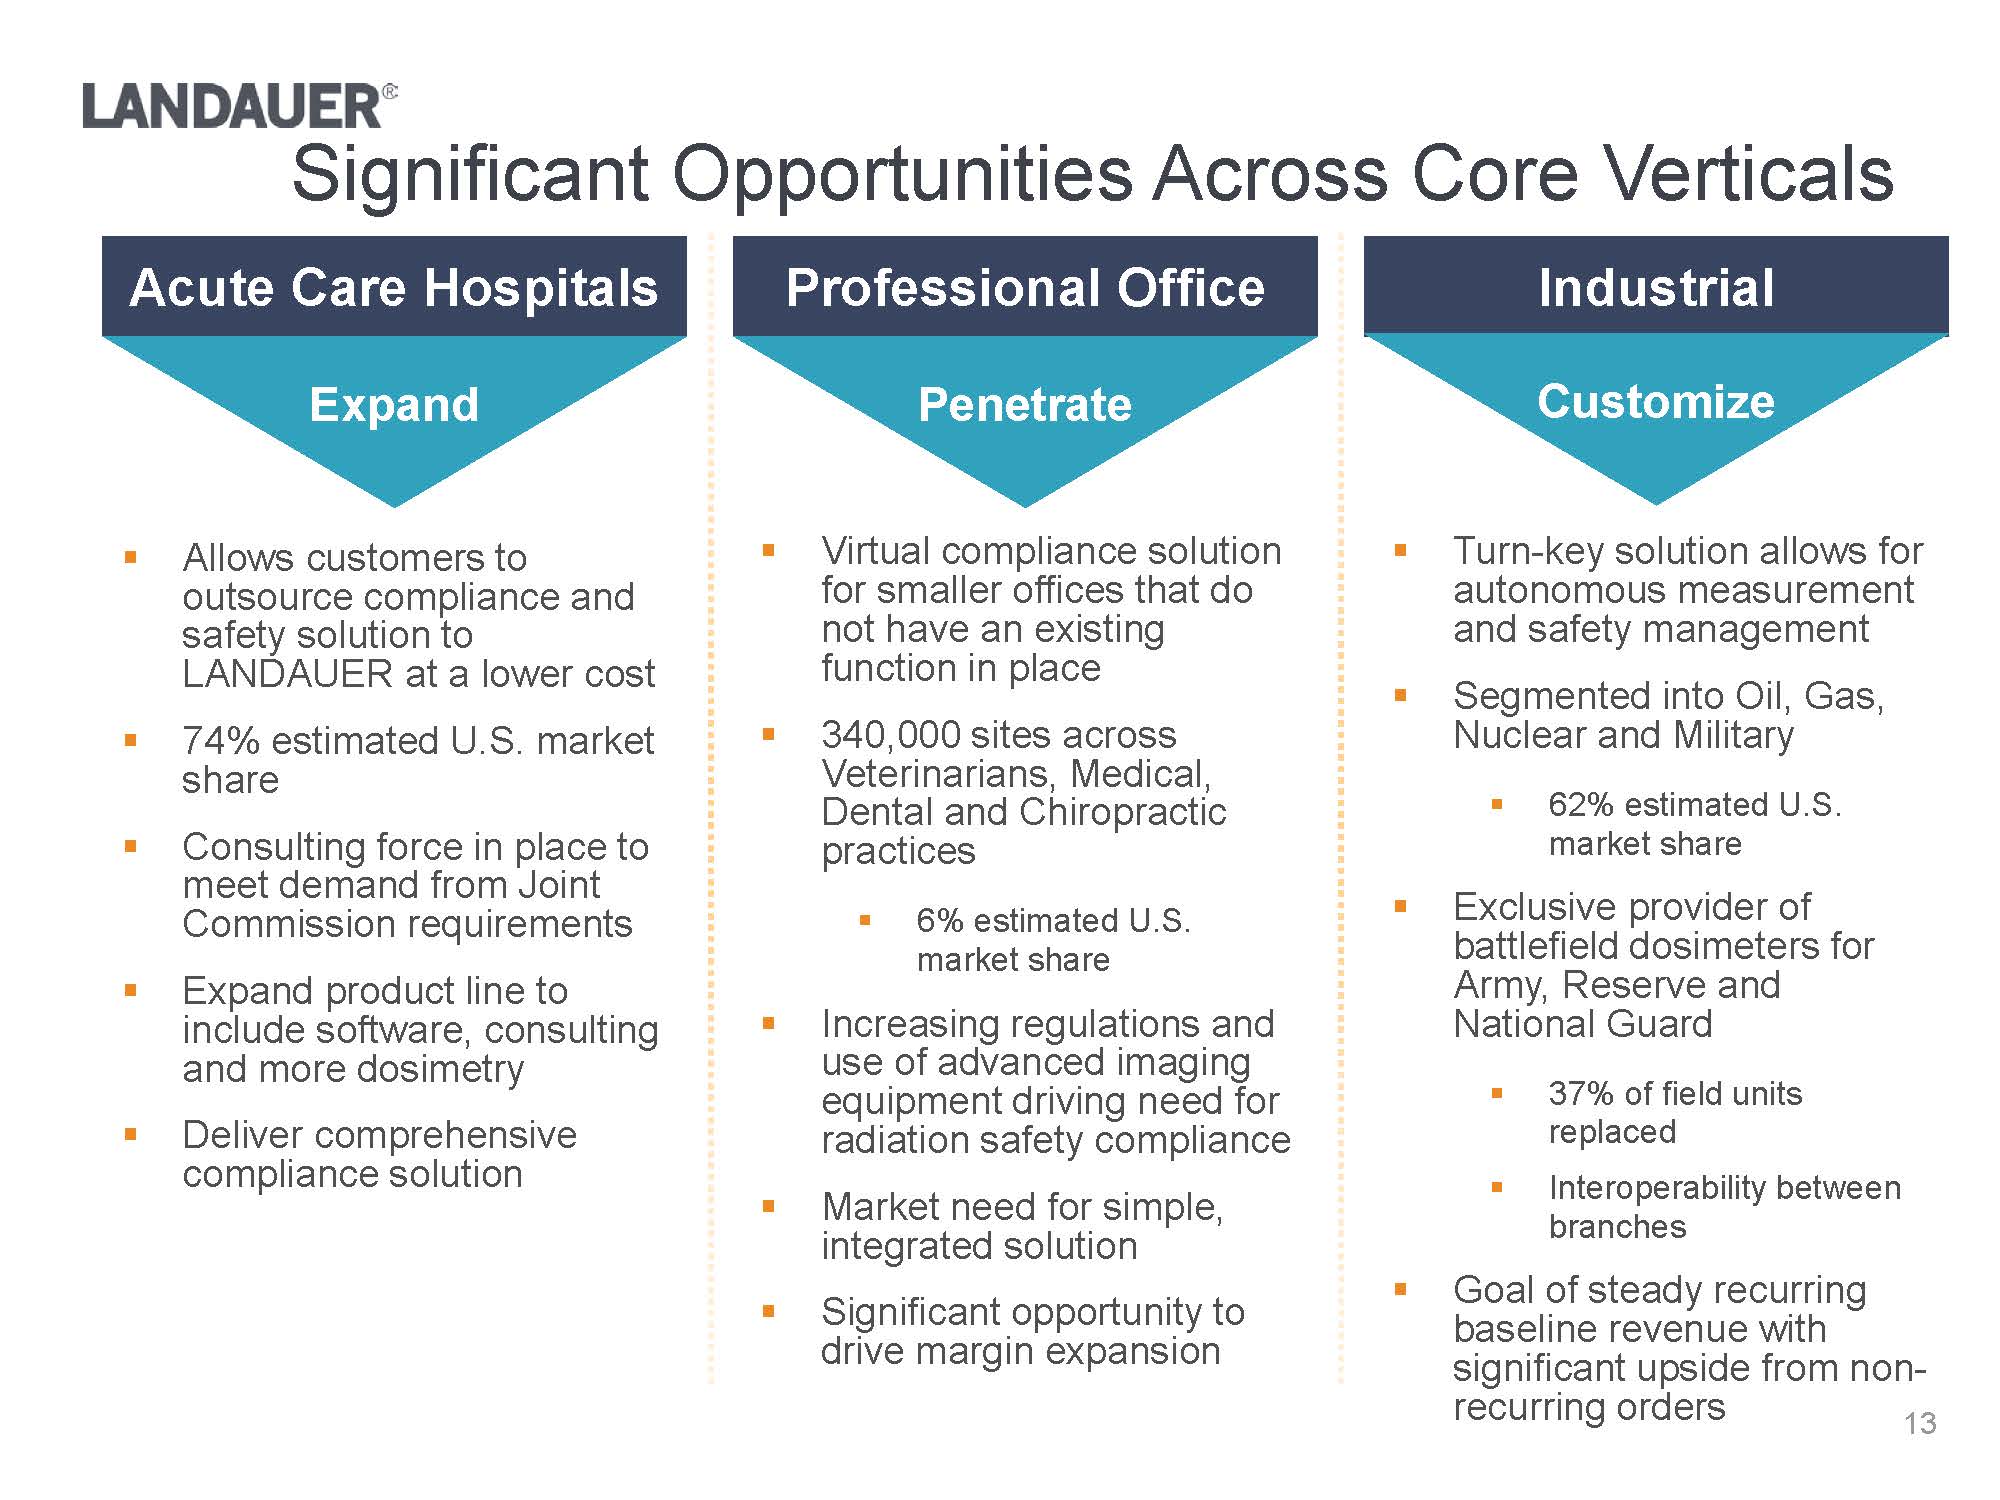
.Virtual compliance solution for smaller offices that do not have an existing function in place.340,000 sites across Veterinarians, Medical, Dental and Chiropractic practices.6% estimated U.S. market share.Increasing regulations and use of advanced imaging equipment driving need for radiation safety compliance.Market need for simple, integrated solution .Significant opportunity to drive margin expansionAcute Care HospitalsProfessional OfficeIndustrial.Allows customers to outsource compliance and safety solution to LANDAUER at a lower cost.74% estimated U.S. market share.Consulting force in place to meet demand from Joint Commission requirements .Expand product line to include software, consulting and more dosimetry.Deliver comprehensive compliance solution.Turn-key solution allows for autonomous measurement and safety management.Segmented into Oil, Gas, Nuclear and Military.62% estimated U.S. market share.Exclusive provider of battlefield dosimeters for Army, Reserve and National Guard.37% of field units replaced.Interoperability between branches.Goal of steady recurring baseline revenue with significant upside from non-recurring ordersExpandPenetrateCustomize
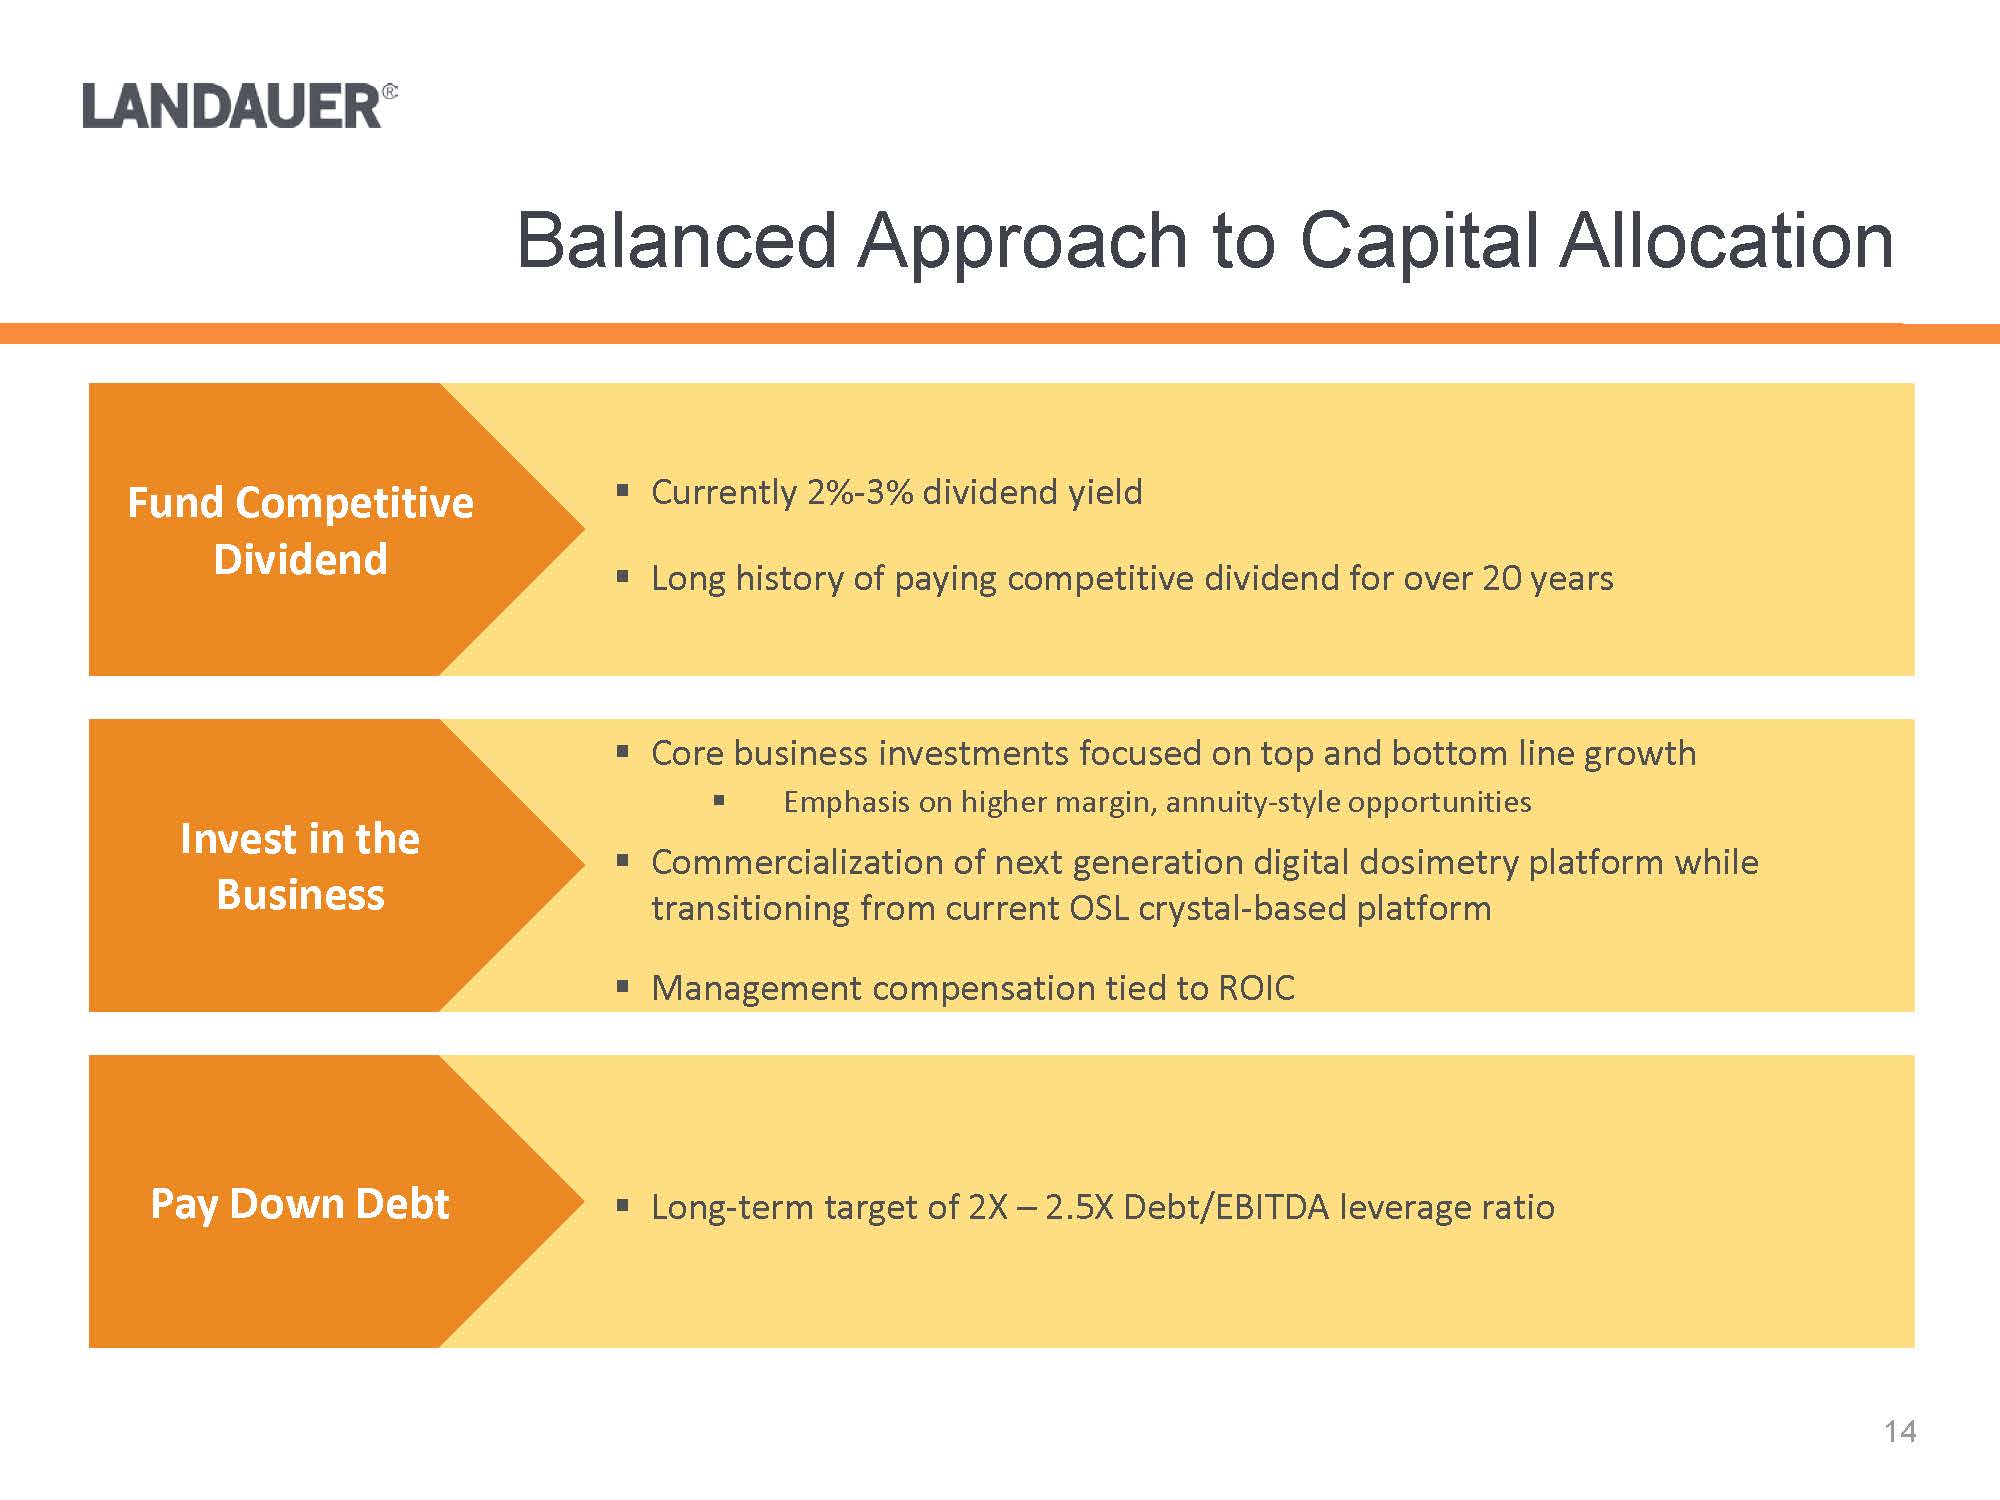
.Core business investments focused on top and bottom line growth.Emphasis on higher margin, annuity-style opportunities.Commercialization of next generation digital dosimetry platform while transitioning from current OSL crystal-based platform.Management compensation tied to ROIC.Long-term target of 2X –2.5X Debt/EBITDA leverage ratio .Currently 2%-3% dividend yield.Long history of paying competitive dividend for over 20 yearsFund Competitive DividendInvest in the BusinessPay Down Debt
•The Joint Commission standards effective in July 2015 in the United States -Impacts 7,100 of the 20,500 U.S. healthcare organizations and programs, including hospitals, imaging clinics and certain ambulatory care centers-Estimated incremental cost of ~$30,000 annually for a hospital to comply with new standards•International standards becoming more restrictiveIndustry leading position, compelling market trends and strong financial profile drives long-term shareholder value•Next generation Verifii™ product has commenced initial field testing•Well positioned to meet emerging need for broader solution •Differentiated position creates higher barrier to entry for competition•Strong margins and limited capital requirements deliver compelling free cash flow•Defined capital allocation plan supports investment in growth initiatives and dividend•Industry-leading technology; proprietary Optically Stimulated Luminescence (OSL) crystal manufacturing process•Installed based of over 73,000 customers; 1.8 million individuals served•90% recurring revenue; 94% annual customer retention•Ability to provide enterprise radiation management or product only modelGlobal Leader in Occupational Radiation Products and ServicesIncreased Regulation Drives Demand
Compelling Growth and Expansion OpportunitiesStrong Financial Profile
Financial Overview
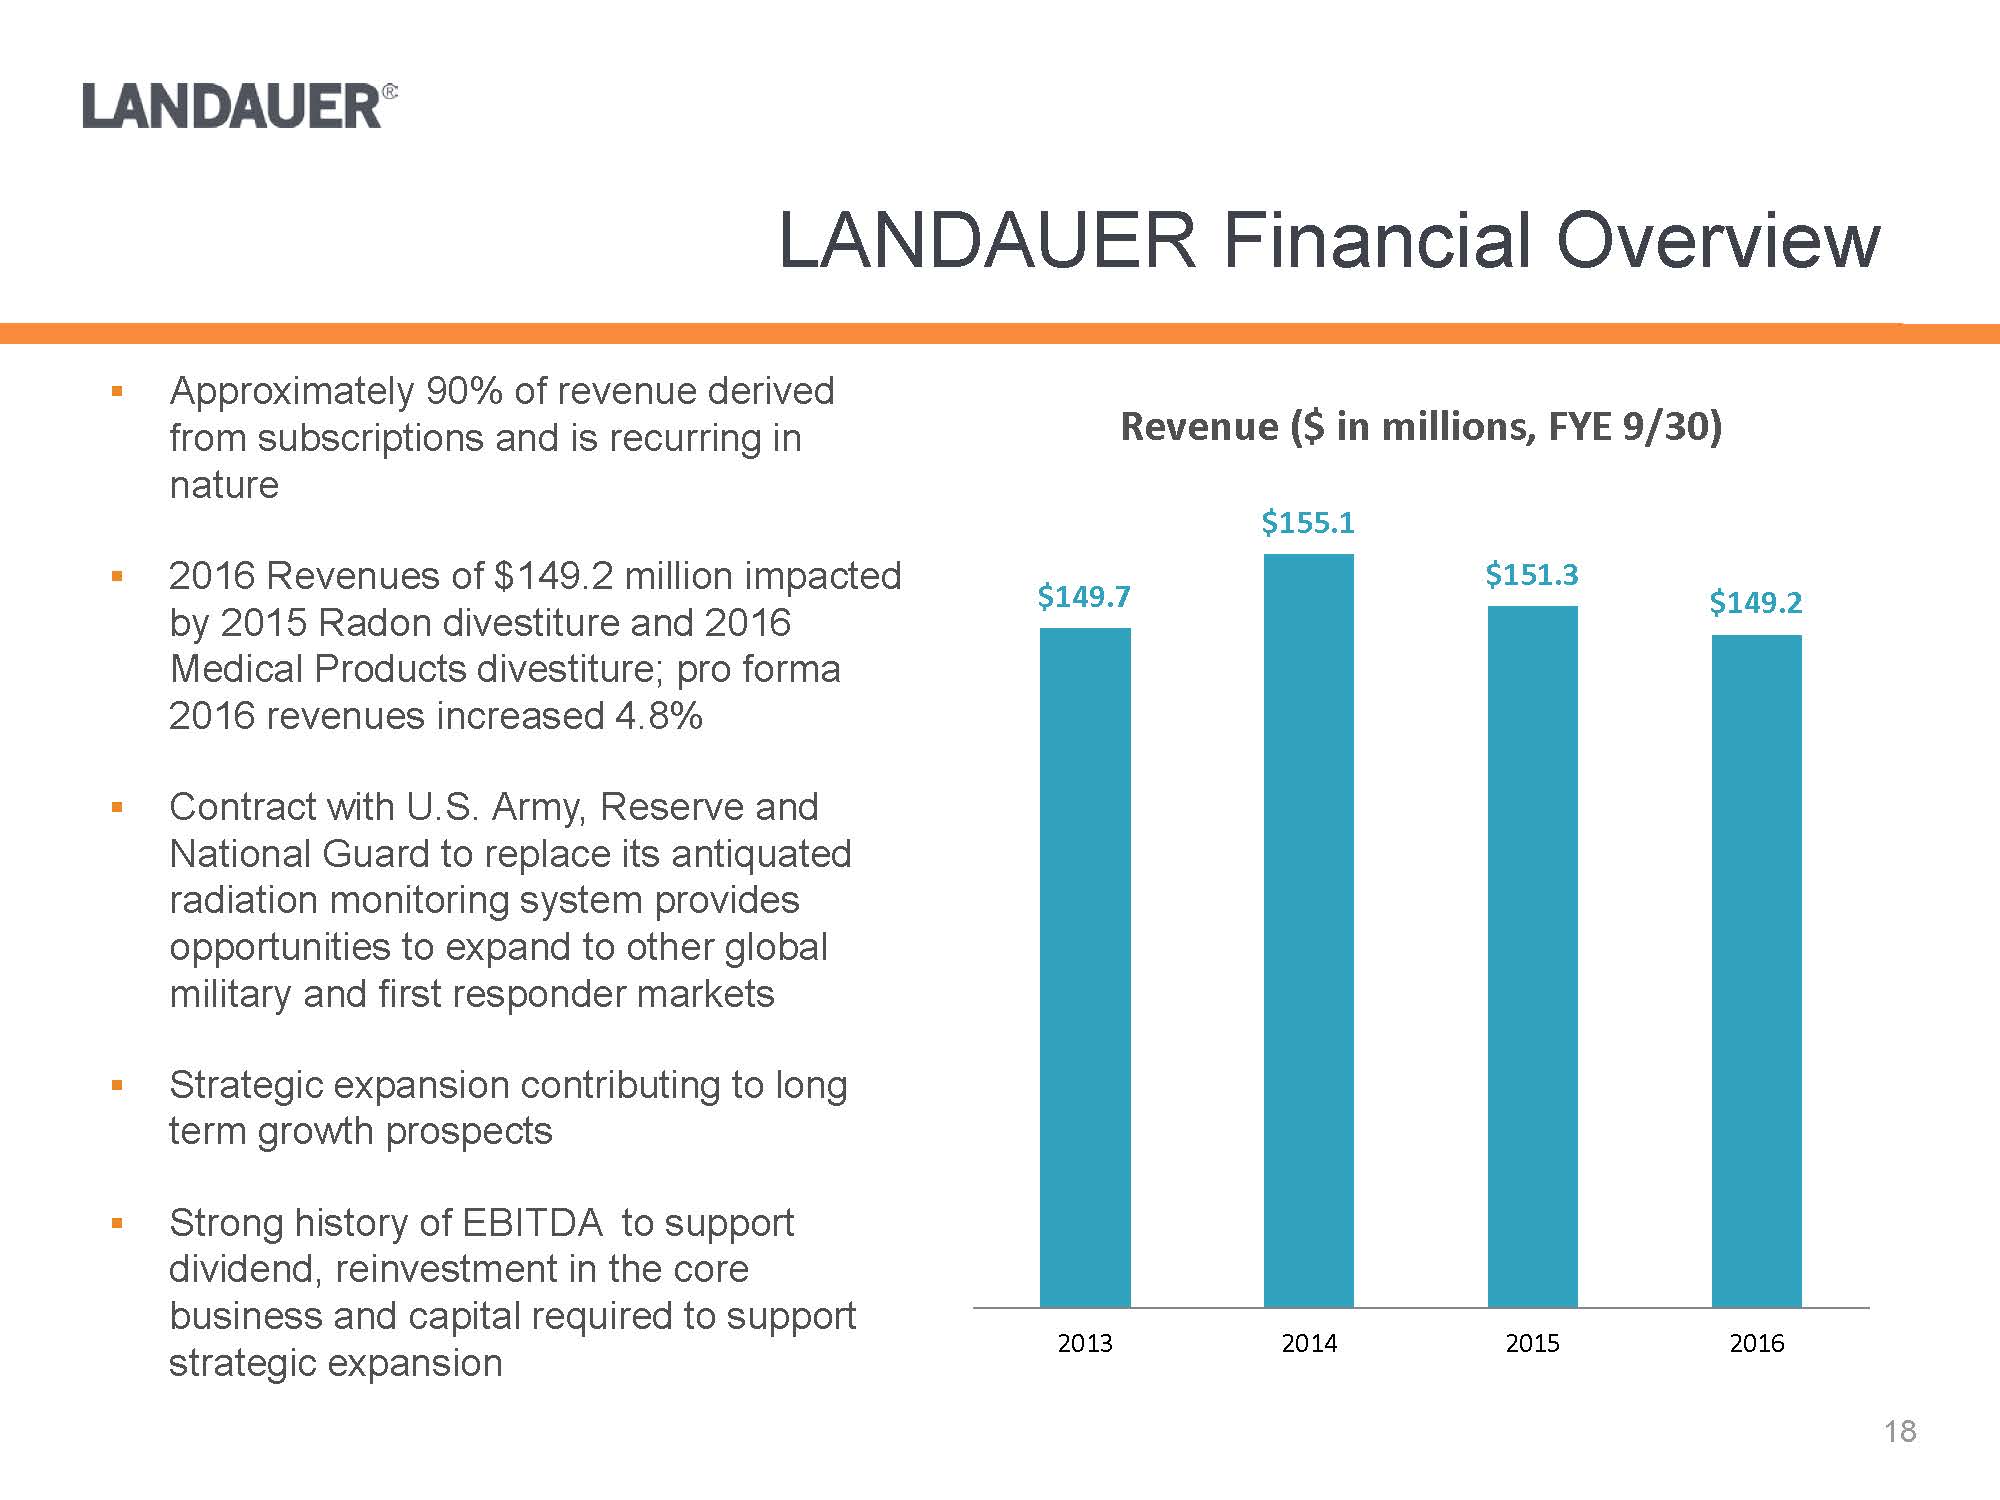
.Approximately 90% of revenue derived from subscriptions and is recurring in nature.2016 Revenues of $149.2 million impacted by 2015 Radon divestiture and 2016 Medical Products divestiture; pro forma 2016 revenues increased 4.8%.Contract with U.S. Army, Reserve and National Guard to replace its antiquated radiation monitoring system provides opportunities to expand to other global military and first responder markets.Strategic expansion contributing to long term growth prospects.Strong history of EBITDA to support dividend, reinvestment in the core business and capital required to support strategic expansion$149.7$155.1$151.3$149.22013201420152016Revenue ($ in millions, FYE 9/30)
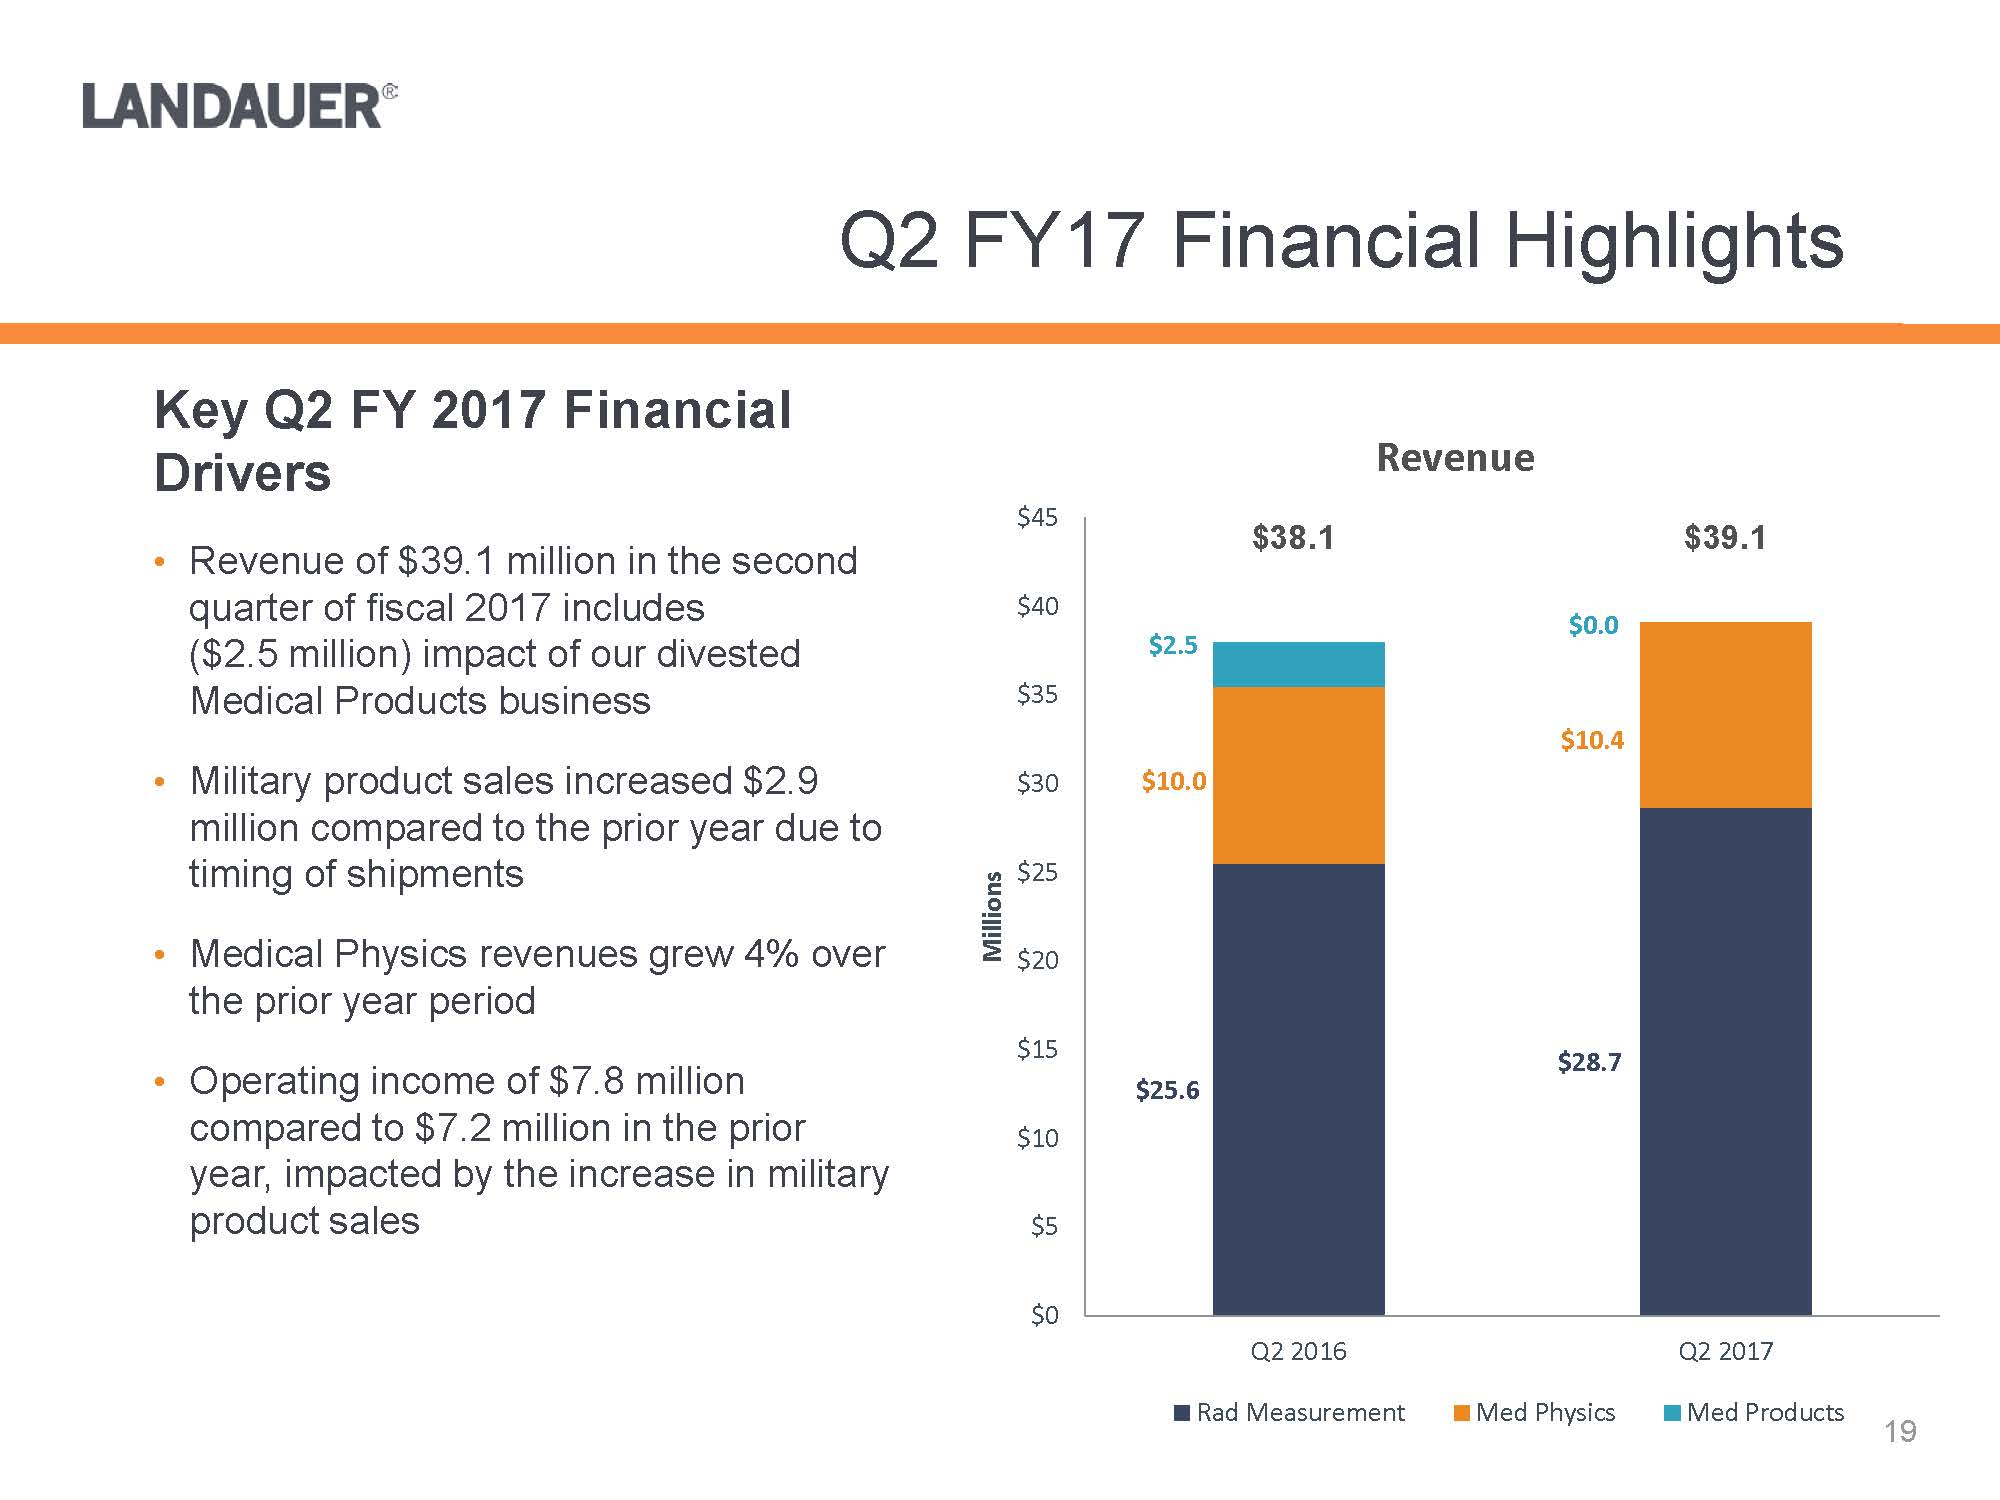
$38.1Key Q2 FY 2017 Financial Drivers•Revenue of $39.1 million in the second quarter of fiscal 2017 includes ($2.5 million) impact of our divested Medical Products business•Military product sales increased $2.9 million compared to the prior year due to timing of shipments•Medical Physics revenues grew 4% over the prior year period•Operating income of $7.8 million compared to $7.2 million in the prior year, impacted by the increase in military product sales$25.6$28.7$10.0$10.4$2.5$0.0$0$5$10$15$20$25$30$35$40$45Q2 2016Q2 2017MillionsRevenueRad MeasurementMed PhysicsMed Products$39.1
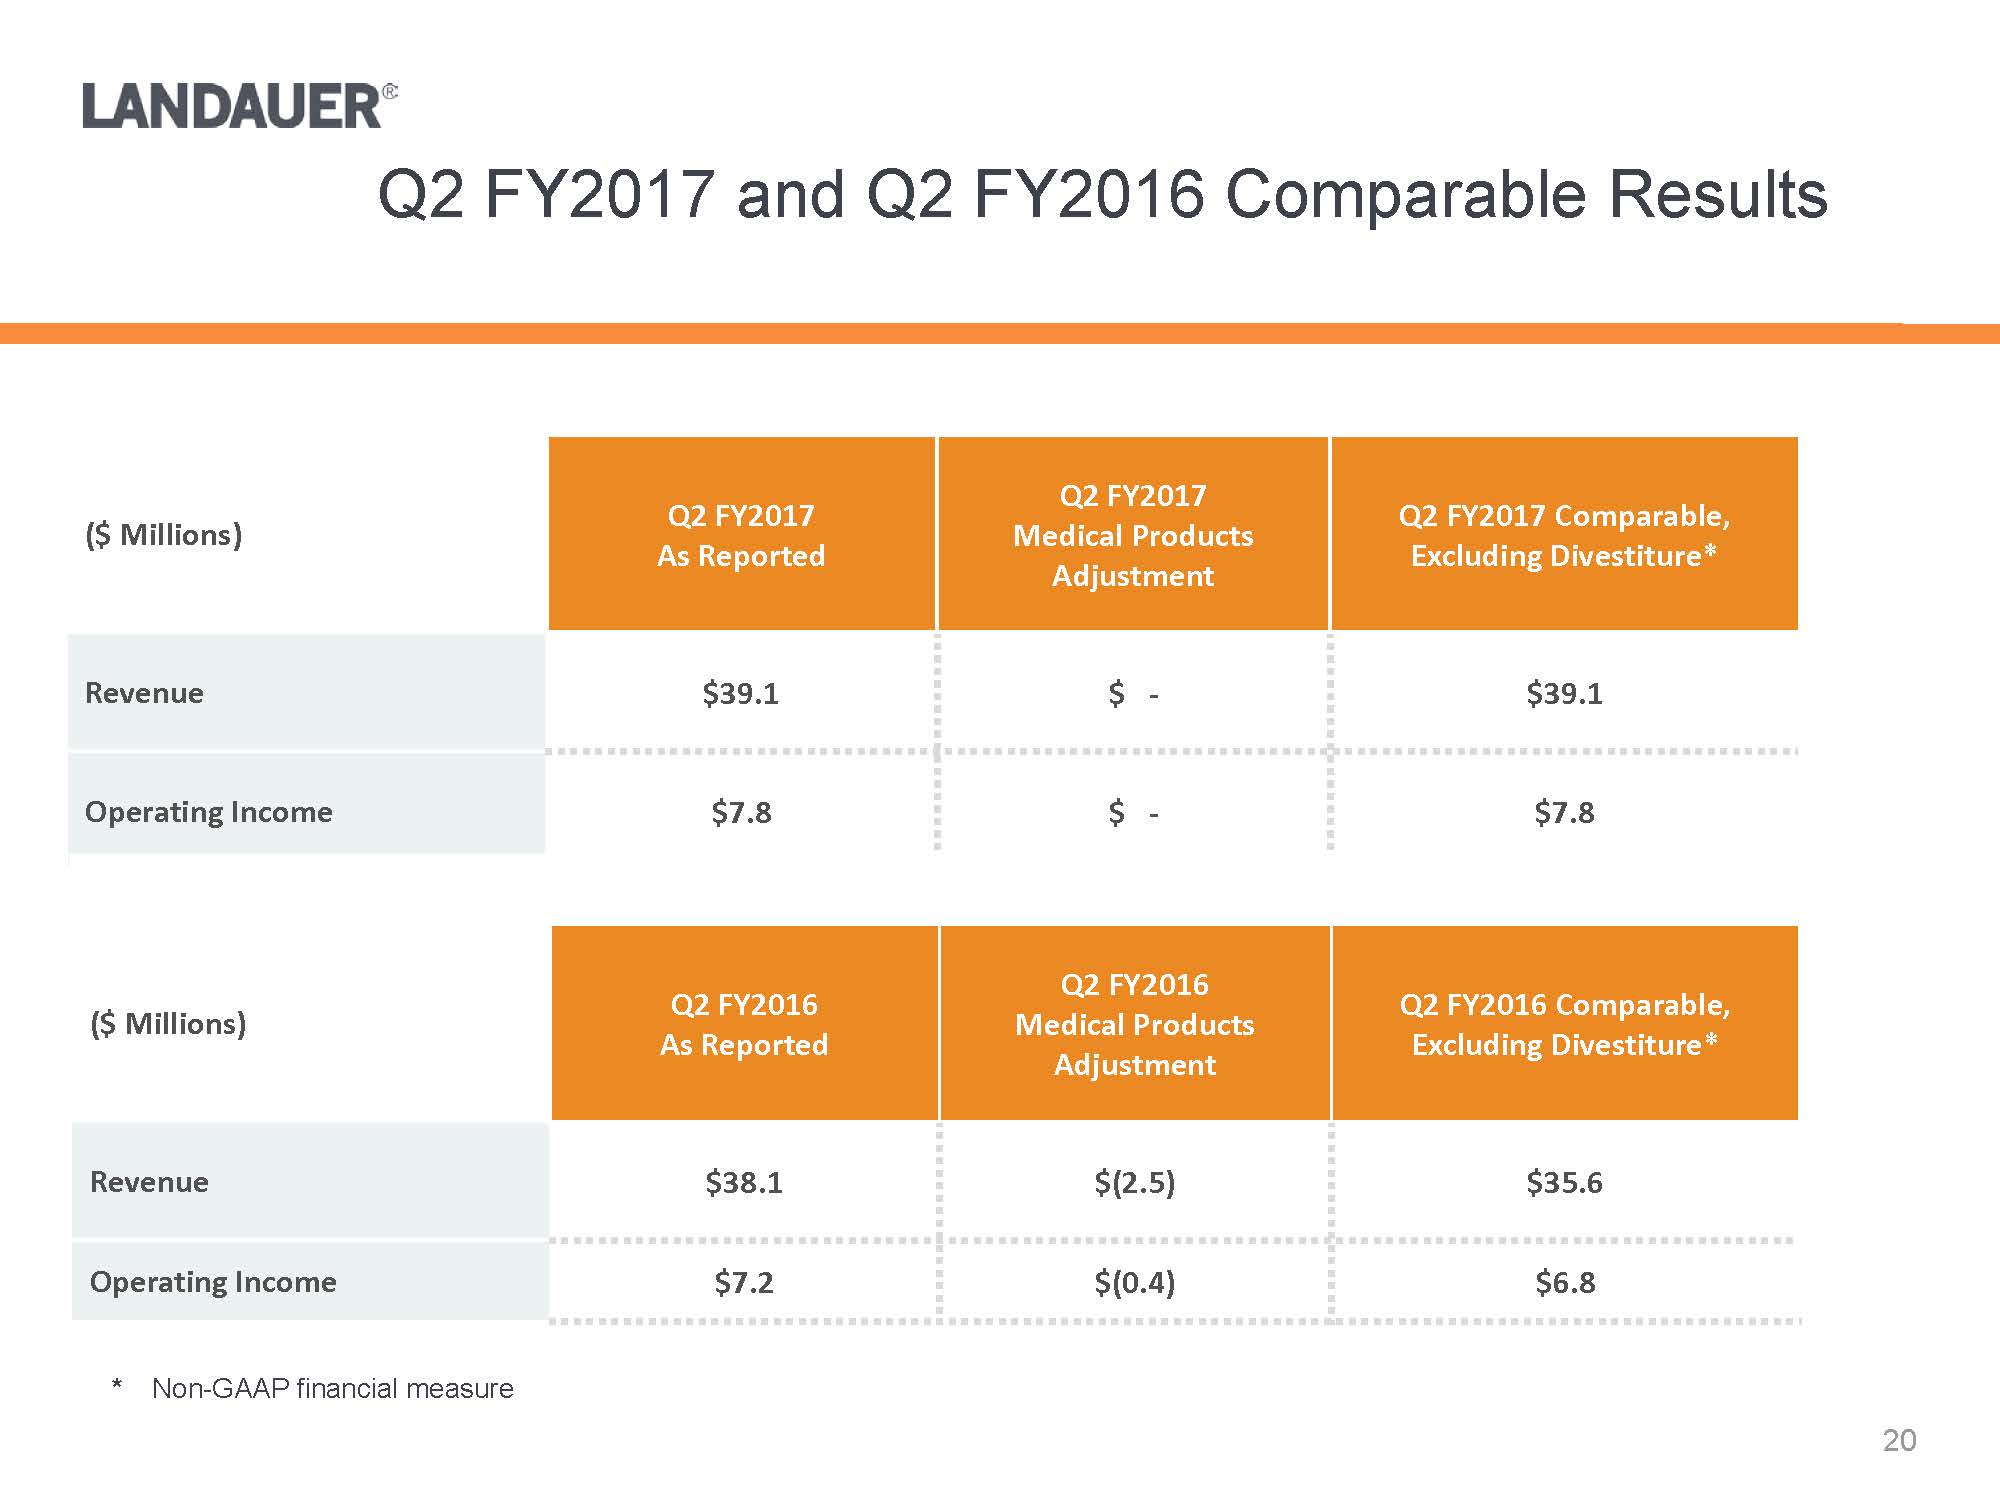
* Non-GAAP financial measure($ Millions)Q2 FY2017As ReportedQ2 FY2017 Medical Products AdjustmentQ2 FY2017 Comparable, Excluding Divestiture*Revenue$39.1$ -$39.1Operating Income$7.8$ -$7.8($ Millions)Q2 FY2016As ReportedQ2 FY2016 Medical Products AdjustmentQ2 FY2016 Comparable, Excluding Divestiture*Revenue$38.1$(2.5)$35.6Operating Income$7.2$(0.4)$6.8
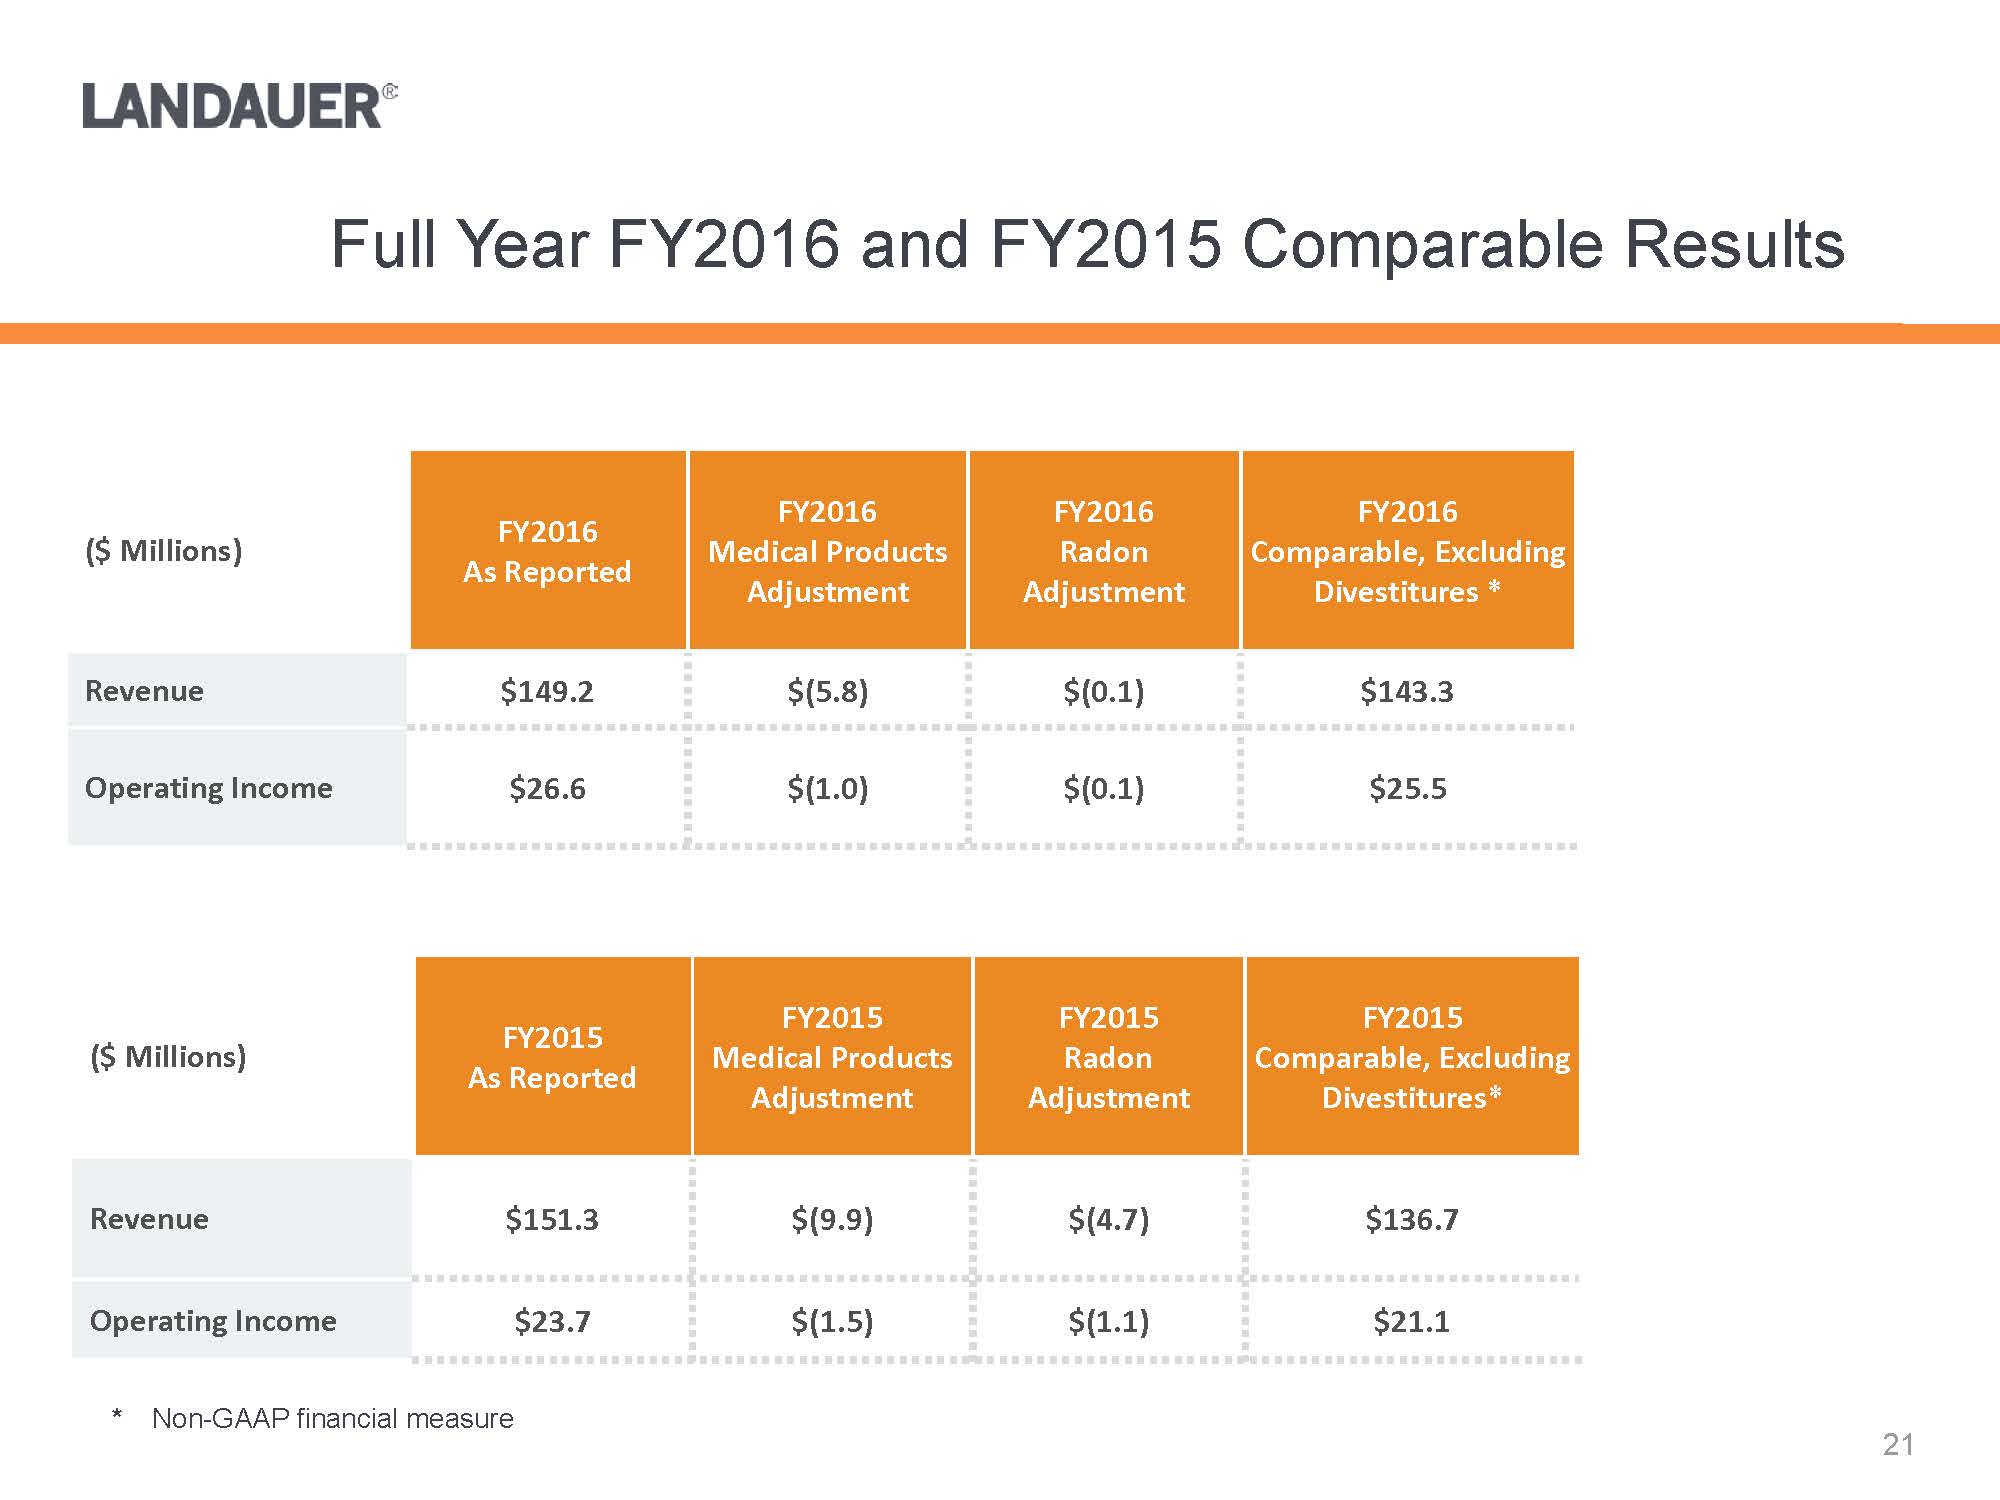
* Non-GAAP financial measure($ Millions)FY2016As ReportedFY2016 Medical Products AdjustmentFY2016 Radon AdjustmentFY2016 Comparable, Excluding Divestitures *Revenue$149.2$(5.8)$(0.1)$143.3Operating Income$26.6$(1.0)$(0.1)$25.5($ Millions)FY2015As ReportedFY2015 Medical Products AdjustmentFY2015 Radon AdjustmentFY2015 Comparable, Excluding Divestitures*Revenue$151.3$(9.9)$(4.7)$136.7Operating Income$23.7$(1.5)$(1.1)$21.1
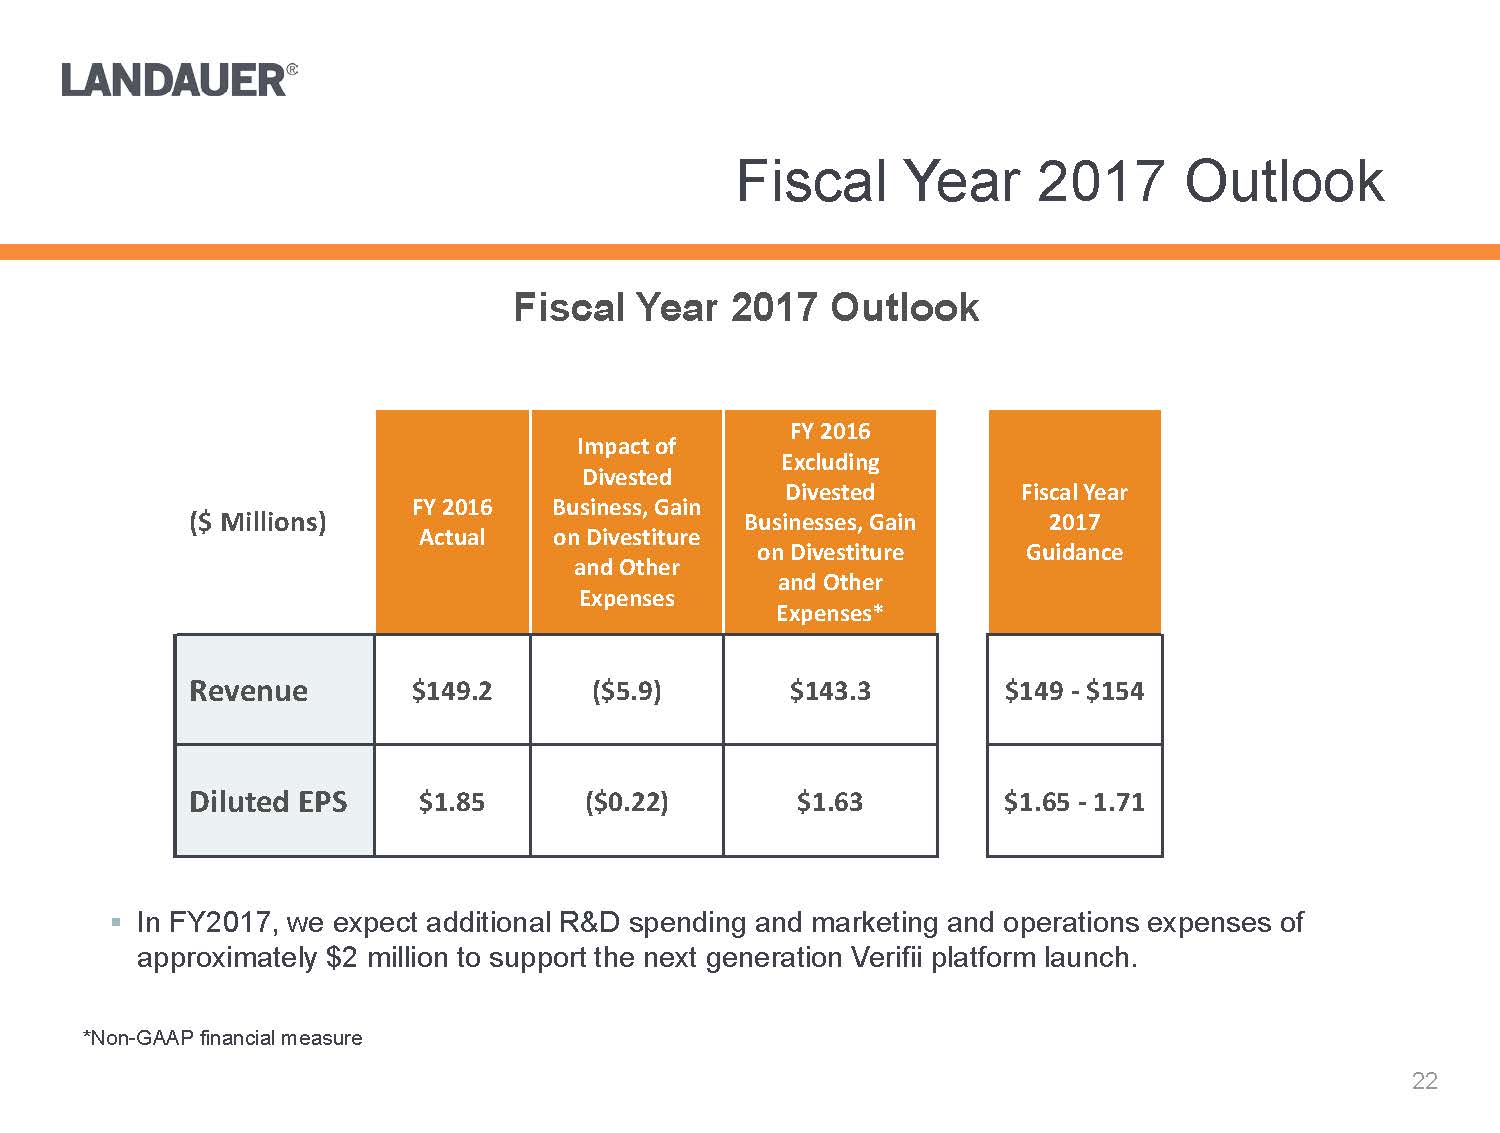
*Non-GAAP financial measure.In FY2017, we expect additional R&D spending and marketing and operations expenses of approximately $2 million to support the next generation Verifiiplatform launch.Fiscal Year 2017 Outlook($ Millions)FY 2016 ActualImpact of DivestedBusiness, Gain on Divestiture and Other ExpensesFY 2016Excluding Divested Businesses, Gain on Divestiture and Other Expenses*FiscalYear 2017 GuidanceRevenue$149.2($5.9) $143.3$149-$154Diluted EPS$1.85($0.22) $1.63$1.65 -1.71
Appendix
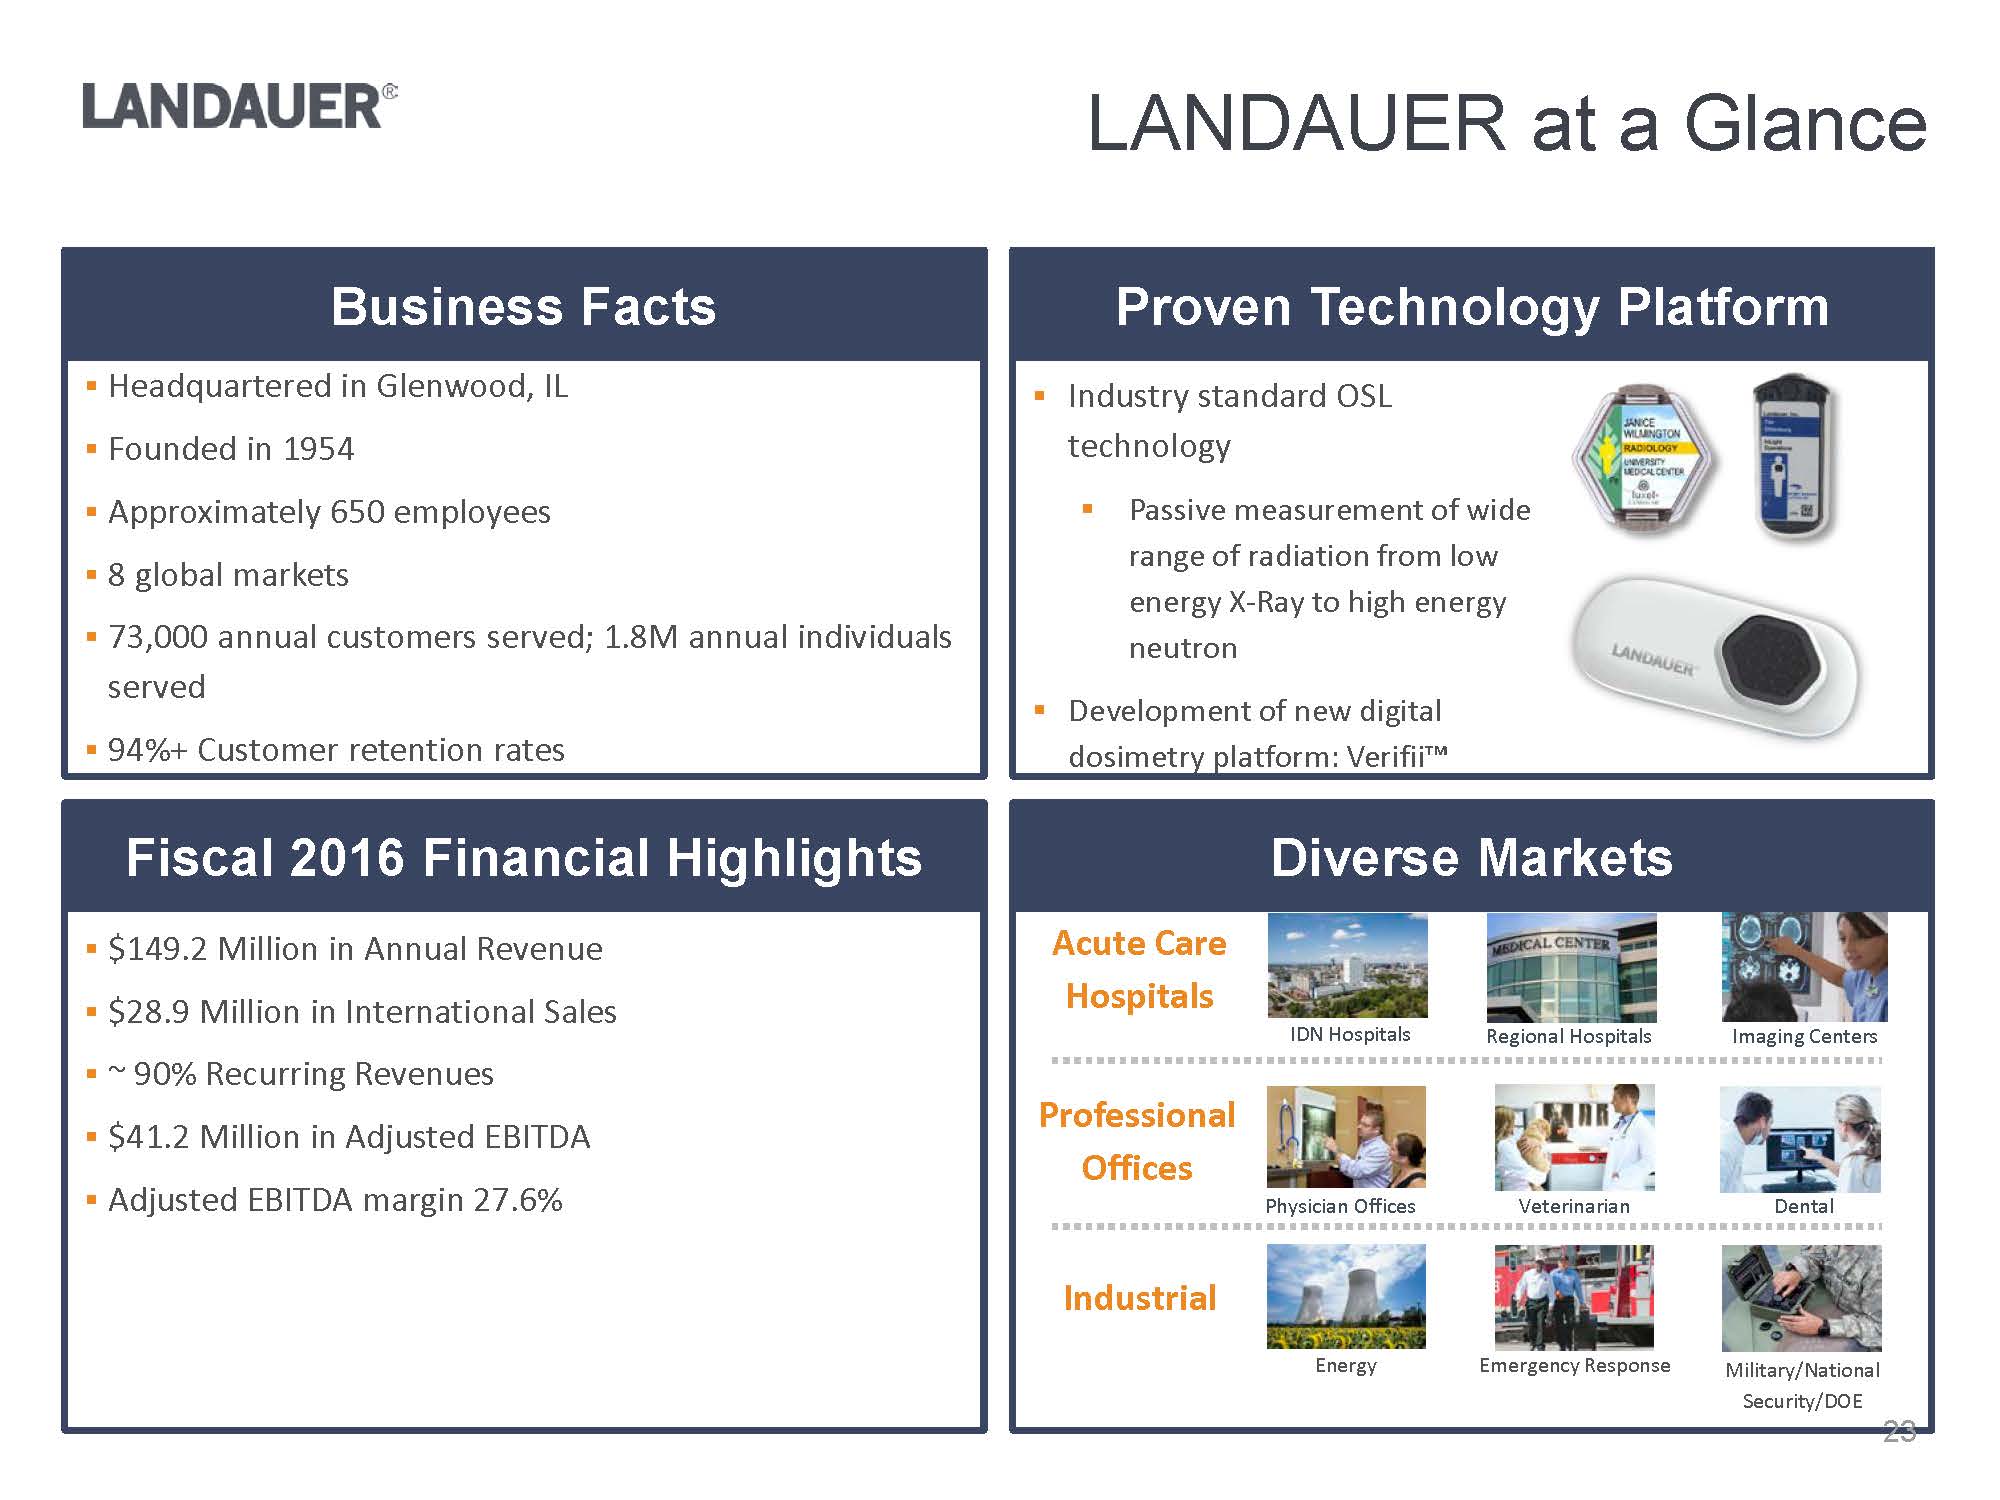
IDN HospitalsBusiness FactsProven Technology PlatformFiscal 2016 Financial HighlightsDiverse Markets.$149.2 Million in Annual Revenue .$28.9 Million in International Sales.~ 90% Recurring Revenues.$41.2 Million in Adjusted EBITDA .Adjusted EBITDA margin 27.6%.Headquartered in Glenwood, IL.Founded in 1954 .Approximately 650 employees.8 global markets.73,000 annual customers served; 1.8M annual individuals served.94%+ Customer retention ratesLuxel_Waist.pnginlight_clip_holder_front_L.png.Industry standard OSL technology.Passive measurement of wide range of radiation from low energy X-Ray to high energy neutron.Development of new digital dosimetry platform: Verifii™C:\Users\mdegraff\AppData\Local\Microsoft\Windows\Temporary Internet Files\Content.Outlook\EQH1N7PW\Dosimeter.2.pngImaging CentersRegional HospitalsPhysician OfficesVeterinarianDentalEnergyEmergency ResponseMilitary/National Security/DOEW:\Landauer\Investors\Investor deck\Images\73470968_5.jpgW:\Landauer\Investors\Investor deck\Images\L41513.2429.jpgAcute Care HospitalsProfessional OfficesIndustrial
Use of Non-GAAP Financial Measures
Management believes the disclosure of certain non-GAAP financial measures enhances investor understanding of our financial performance. Non-GAAP financial measures disclosed in this report include: Pro Forma Revenue and Pro Forma Operating Income.
The Pro Forma Revenue and Pro Forma Operating Income measures exclude the Medical Products business, which was divested in May 2016, and the Radon business, which was divested in September 2015.
These financial measures are not recognized measurements under GAAP and should not be considered as an alternative to the most directly comparable measures presented in accordance with GAAP. A reconciliation of these non-GAAP measures to the most directly comparable GAAP measures is included within this presentation.