Attached files
| file | filename |
|---|---|
| 8-K - 8-K - OPPENHEIMER HOLDINGS INC | a17-12746_18k.htm |
Exhibit 99.1
Investor Presentation Annual Stockholders’ Meeting Oppenheimer Holdings Inc. New York, NY May 8, 2017
2 WELCOME to Oppenheimer’s 2017 Annual Stockholders’ Meeting May 8, 2017
Safe Harbor Statement 3 This presentation and other written or oral statements made from time to time by representatives of Oppenheimer Holdings Inc. (the “company”) may contain “forward-looking statements” within the meaning of Section 27A of the Securities Act of 1933, as amended, and Section 21E of the Securities Exchange Act of 1934, as amended. These forward-looking statements may relate to such matters as anticipated financial performance, future revenues or earnings, business prospects, new products or services, anticipated market performance and similar matters. The Private Securities Litigation Reform Act of 1995 provides a safe harbor for forward-looking statements. The company cautions that a variety of factors could cause the company’s actual results to differ materially from the anticipated results or other expectations expressed in the company’s forwarding-looking statements. These risks and uncertainties include, but are not limited to, those risk factors discussed in Part I, “Item 1A. Risk Factors” of our Annual Report on Form 10-K for the fiscal year ended December 31, 2016 (the “2016 Annual Report”). In addition, important factors that could cause actual results to differ materially from those in the forward-looking statements include those factors discussed in Part II, “Item 7. Management’s Discussion & Analysis of Financial Condition and Results of Operations – Factors Affecting ‘Forward-Looking Statements’” of our 2016 Annual Report. Any forward-looking statements herein are qualified in their entirety by reference to all such factors discussed in the 2016 Annual Report and the company’s other SEC filings. There can be no assurance that the company has correctly or completely identified and assessed all of the factors affecting the company’s business. The company does not undertake any obligation to publicly update or revise any forward-looking statements.
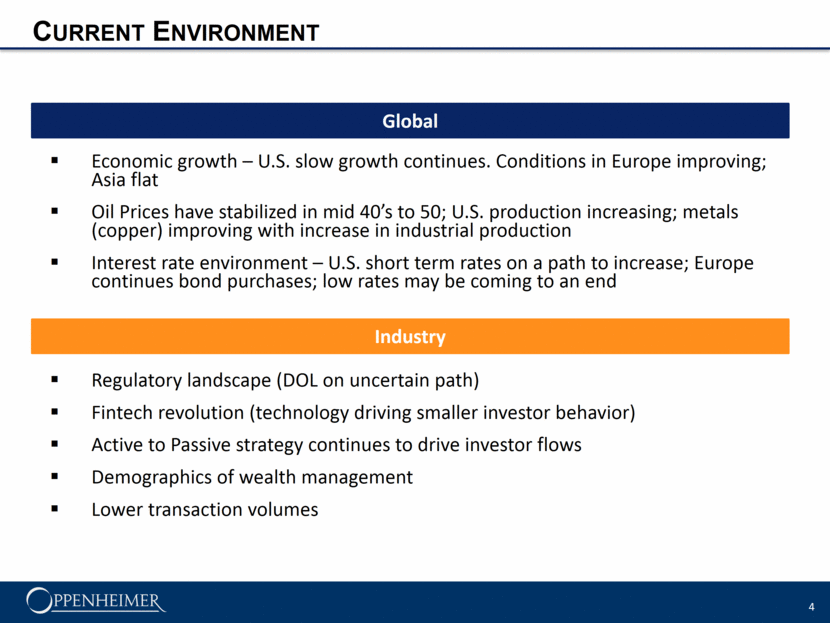
Current Environment 4 Economic growth – U.S. slow growth continues. Conditions in Europe improving; Asia flat Oil Prices have stabilized in mid 40’s to 50; U.S. production increasing; metals (copper) improving with increase in industrial production Interest rate environment – U.S. short term rates on a path to increase; Europe continues bond purchases; low rates may be coming to an end Regulatory landscape (DOL on uncertain path) Fintech revolution (technology driving smaller investor behavior) Active to Passive strategy continues to drive investor flows Demographics of wealth management Lower transaction volumes Global Industry
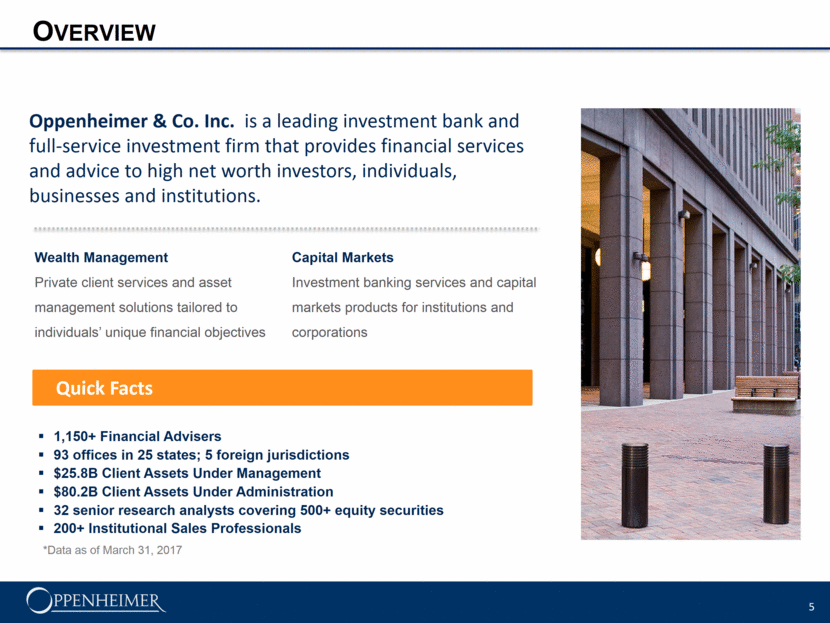
Overview 5 Oppenheimer & Co. Inc. is a leading investment bank and full-service investment firm that provides financial services and advice to high net worth investors, individuals, businesses and institutions. Quick Facts Wealth Management Private client services and asset management solutions tailored to individuals’ unique financial objectives Capital Markets Investment banking services and capital markets products for institutions and corporations 1,150+ Financial Advisers 93 offices in 25 states; 5 foreign jurisdictions $25.8B Client Assets Under Management $80.2B Client Assets Under Administration 32 senior research analysts covering 500+ equity securities 200+ Institutional Sales Professionals *Data as of March 31, 2017
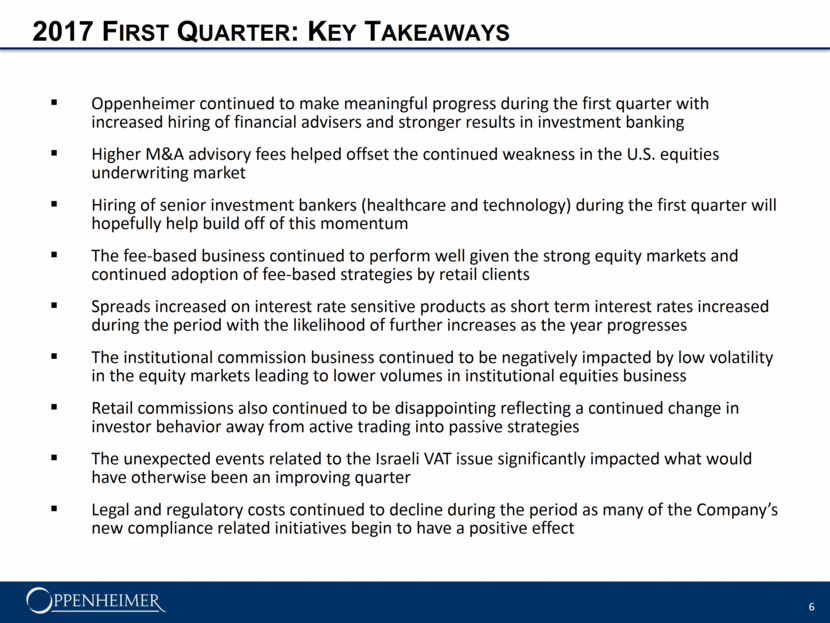
2017 First Quarter: Key Takeaways 6 Oppenheimer continued to make meaningful progress during the first quarter with increased hiring of financial advisers and stronger results in investment banking Higher M&A advisory fees helped offset the continued weakness in the U.S. equities underwriting market Hiring of senior investment bankers (healthcare and technology) during the first quarter will hopefully help build off of this momentum The fee-based business continued to perform well given the strong equity markets and continued adoption of fee-based strategies by retail clients Spreads increased on interest rate sensitive products as short term interest rates increased during the period with the likelihood of further increases as the year progresses The institutional commission business continued to be negatively impacted by low volatility in the equity markets leading to lower volumes in institutional equities business Retail commissions also continued to be disappointing reflecting a continued change in investor behavior away from active trading into passive strategies The unexpected events related to the Israeli VAT issue significantly impacted what would have otherwise been an improving quarter Legal and regulatory costs continued to decline during the period as many of the Company’s new compliance related initiatives begin to have a positive effect
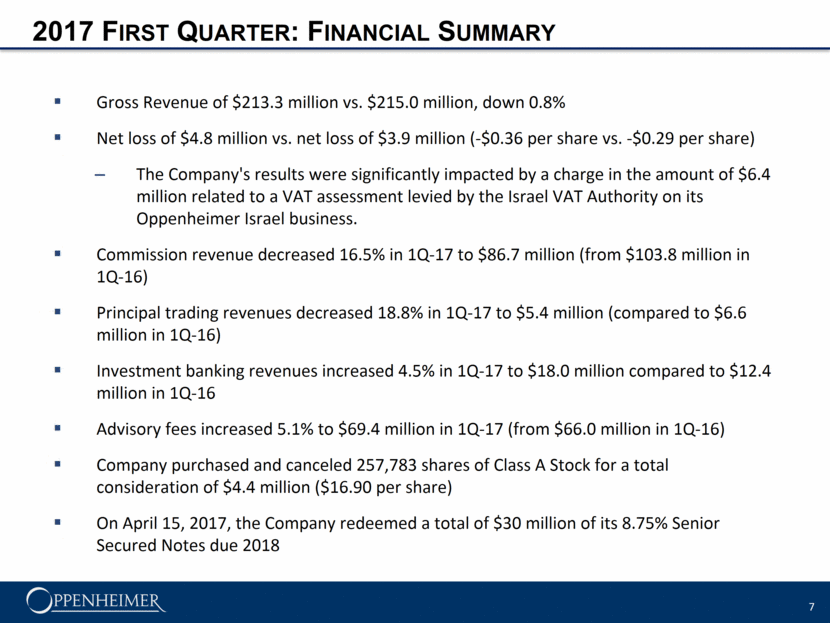
2017 First Quarter: Financial Summary 7 Gross Revenue of $213.3 million vs. $215.0 million, down 0.8% Net loss of $4.8 million vs. net loss of $3.9 million (-$0.36 per share vs. -$0.29 per share) The Company's results were significantly impacted by a charge in the amount of $6.4 million related to a VAT assessment levied by the Israel VAT Authority on its Oppenheimer Israel business. Commission revenue decreased 16.5% in 1Q-17 to $86.7 million (from $103.8 million in 1Q-16) Principal trading revenues decreased 18.8% in 1Q-17 to $5.4 million (compared to $6.6 million in 1Q-16) Investment banking revenues increased 4.5% in 1Q-17 to $18.0 million compared to $12.4 million in 1Q-16 Advisory fees increased 5.1% to $69.4 million in 1Q-17 (from $66.0 million in 1Q-16) Company purchased and canceled 257,783 shares of Class A Stock for a total consideration of $4.4 million ($16.90 per share) On April 15, 2017, the Company redeemed a total of $30 million of its 8.75% Senior Secured Notes due 2018
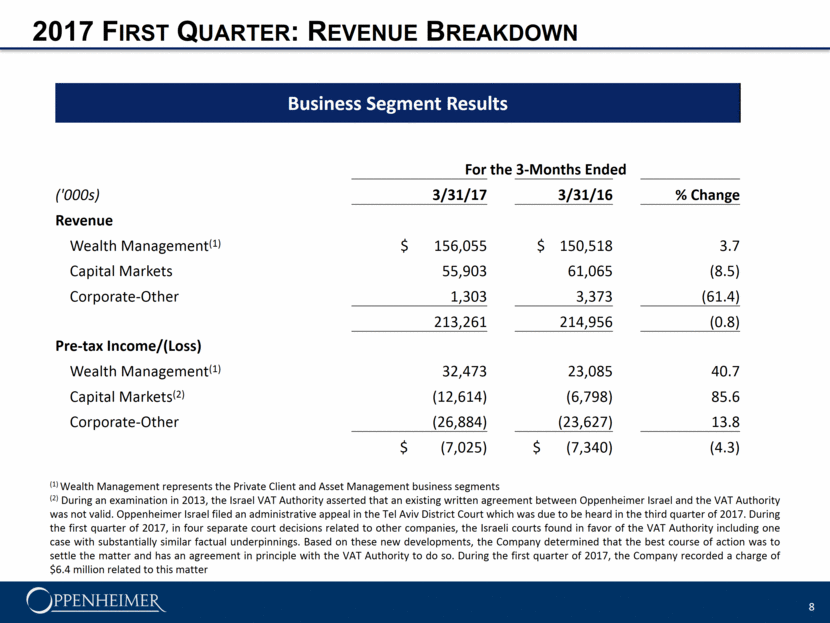
2017 First Quarter: Revenue Breakdown 8 Business Segment Results For the 3-Months Ended ('000s) 3/31/17 3/31/16 % Change Revenue Wealth Management(1) $ 156,055 $ 150,518 3.7 Capital Markets 55,903 61,065 (8.5) Corporate-Other 1,303 3,373 (61.4) 213,261 214,956 (0.8) Pre-tax Income/(Loss) Wealth Management(1) 32,473 23,085 40.7 Capital Markets(2) (12,614) (6,798) 85.6 Corporate-Other (26,884) (23,627) 13.8 $ (7,025) $ (7,340) (4.3) (1) Wealth Management represents the Private Client and Asset Management business segments (2) During an examination in 2013, the Israel VAT Authority asserted that an existing written agreement between Oppenheimer Israel and the VAT Authority was not valid. Oppenheimer Israel filed an administrative appeal in the Tel Aviv District Court which was due to be heard in the third quarter of 2017. During the first quarter of 2017, in four separate court decisions related to other companies, the Israeli courts found in favor of the VAT Authority including one case with substantially similar factual underpinnings. Based on these new developments, the Company determined that the best course of action was to settle the matter and has an agreement in principle with the VAT Authority to do so. During the first quarter of 2017, the Company recorded a charge of $6.4 million related to this matter
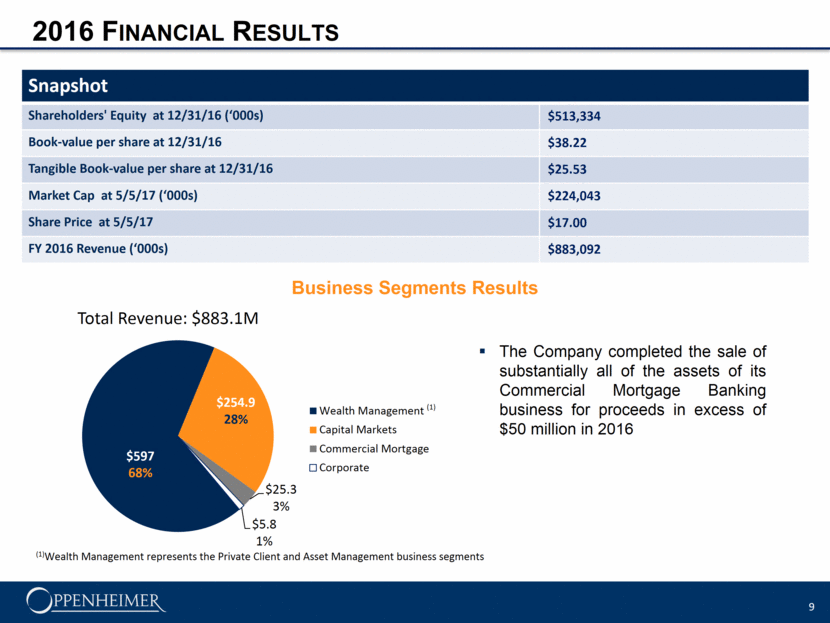
2016 Financial Results 9 Total Revenue: $883.1M (1)Wealth Management represents the Private Client and Asset Management business segments (1) Snapshot Shareholders' Equity at 12/31/16 (‘000s) $513,334 Book-value per share at 12/31/16 $38.22 Tangible Book-value per share at 12/31/16 $25.53 Market Cap at 5/5/17 (‘000s) $224,043 Share Price at 5/5/17 $17.00 FY 2016 Revenue (‘000s) $883,092 The Company completed the sale of substantially all of the assets of its Commercial Mortgage Banking business for proceeds in excess of $50 million in 2016 Business Segments Results (1) $254.9 28% $25.3 3 % $5.8 1% Wealth Management Capital Markets Commercial Mortgage Corporate $597 68%
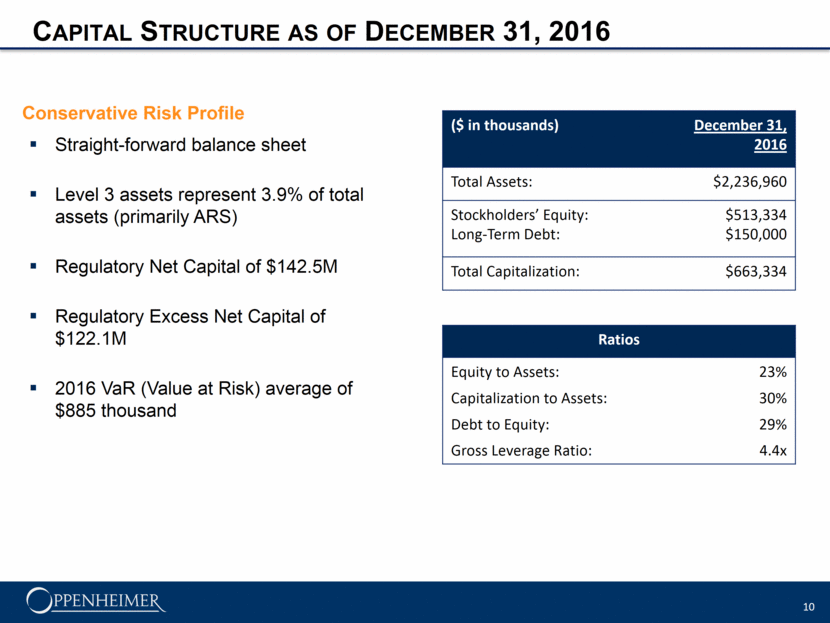
Capital Structure as of December 31, 2016 10 Conservative Risk Profile Straight-forward balance sheet Level 3 assets represent 3.9% of total assets (primarily ARS) Regulatory Net Capital of $142.5M Regulatory Excess Net Capital of $122.1M 2016 VaR (Value at Risk) average of $885 thousand ($ in thousands) December 31, 2016 Total Assets: $2,236,960 Stockholders’ Equity: Long-Term Debt: $513,334 $150,000 Total Capitalization: $663,334 Ratios Equity to Assets: Capitalization to Assets: Debt to Equity: Gross Leverage Ratio: 23% 30% 29% 4.4x
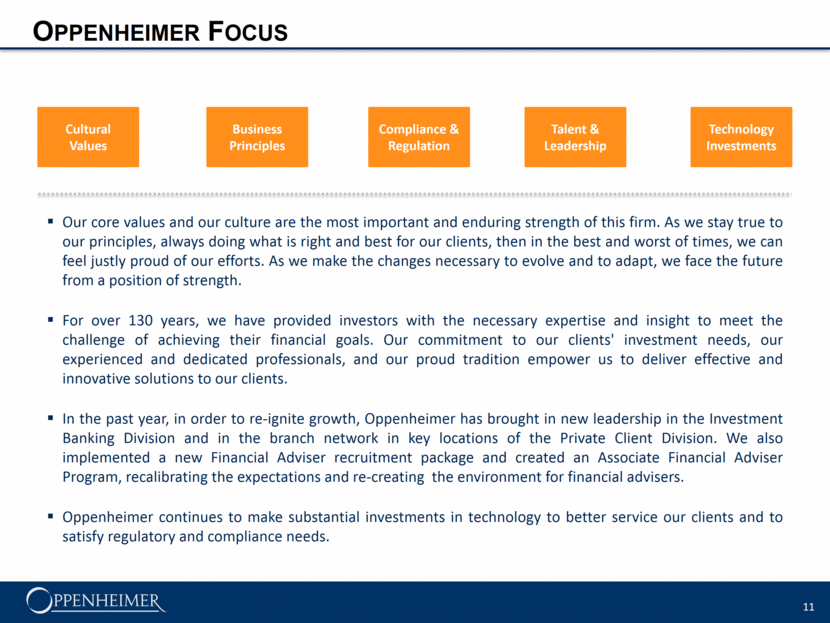
11 Oppenheimer Focus Our core values and our culture are the most important and enduring strength of this firm. As we stay true to our principles, always doing what is right and best for our clients, then in the best and worst of times, we can feel justly proud of our efforts. As we make the changes necessary to evolve and to adapt, we face the future from a position of strength. For over 130 years, we have provided investors with the necessary expertise and insight to meet the challenge of achieving their financial goals. Our commitment to our clients' investment needs, our experienced and dedicated professionals, and our proud tradition empower us to deliver effective and innovative solutions to our clients. In the past year, in order to re-ignite growth, Oppenheimer has brought in new leadership in the Investment Banking Division and in the branch network in key locations of the Private Client Division. We also implemented a new Financial Adviser recruitment package and created an Associate Financial Adviser Program, recalibrating the expectations and re-creating the environment for financial advisers. Oppenheimer continues to make substantial investments in technology to better service our clients and to satisfy regulatory and compliance needs. Cultural Values Business Principles Talent & Leadership Technology Investments Compliance & Regulation
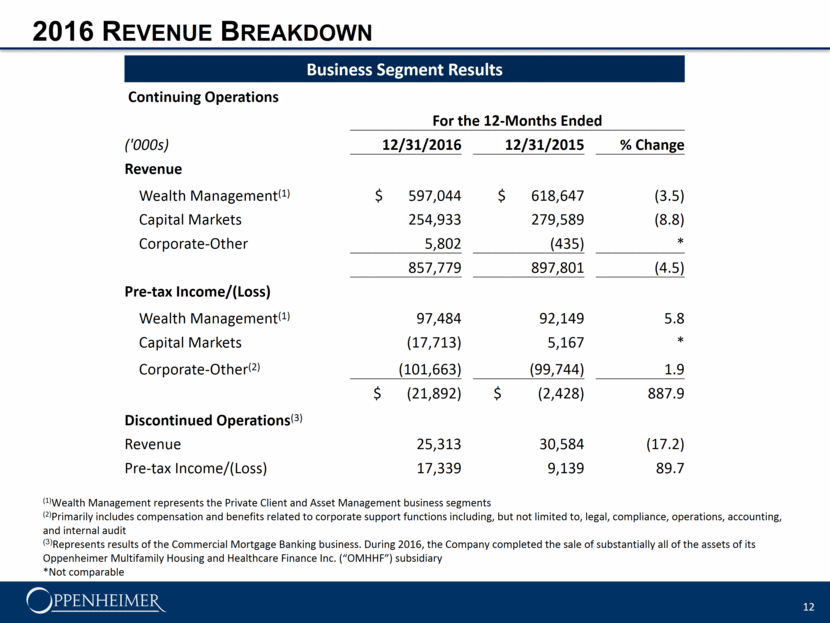
2016 Revenue Breakdown 12 (1)Wealth Management represents the Private Client and Asset Management business segments (2)Primarily includes compensation and benefits related to corporate support functions including, but not limited to, legal, compliance, operations, accounting, and internal audit (3)Represents results of the Commercial Mortgage Banking business. During 2016, the Company completed the sale of substantially all of the assets of its Oppenheimer Multifamily Housing and Healthcare Finance Inc. (“OMHHF”) subsidiary *Not comparable Business Segment Results Continuing Operations For the 12-Months Ended ('000s) 12/31/2016 12/31/2015 % Change Revenue Wealth Management(1) $ 597,044 $ 618,647 (3.5) Capital Markets 254,933 279,589 (8.8) Corporate-Other 5,802 (435) * 857,779 897,801 (4.5) Pre-tax Income/(Loss) Wealth Management(1) 97,484 92,149 5.8 Capital Markets (17,713) 5,167 * Corporate-Other(2) (101,663) (99,744) 1.9 $ (21,892) $ (2,428) 887.9 Discontinued Operations(3) Revenue 25,313 30,584 (17.2) Pre-tax Income/(Loss) 17,339 9,139 89.7
Wealth Management 13 Wealth Management represents the Private Client and Asset Management business segments Provide a full range of products and services to clients to meet their complex and evolving financial needs Position business for generational transfer of wealth Increased focus on regulatory compliance while emphasizing a “culture of compliance” Continue investing in technology to provide more information and easier access: New wealth management technology platform delivering cutting-edge account management tools New Financial Adviser dashboard Wealth Management Revenue* ($M) Wealth Management Operating Profit* ($M) *Segment revenue and operating profit as reported 635 702 682 619 597 500 550 600 650 700 750 2012 2013 2014 2015 2016 79 107 94 92 97 - 20 40 60 80 100 120 2012 2013 2014 2015 2016
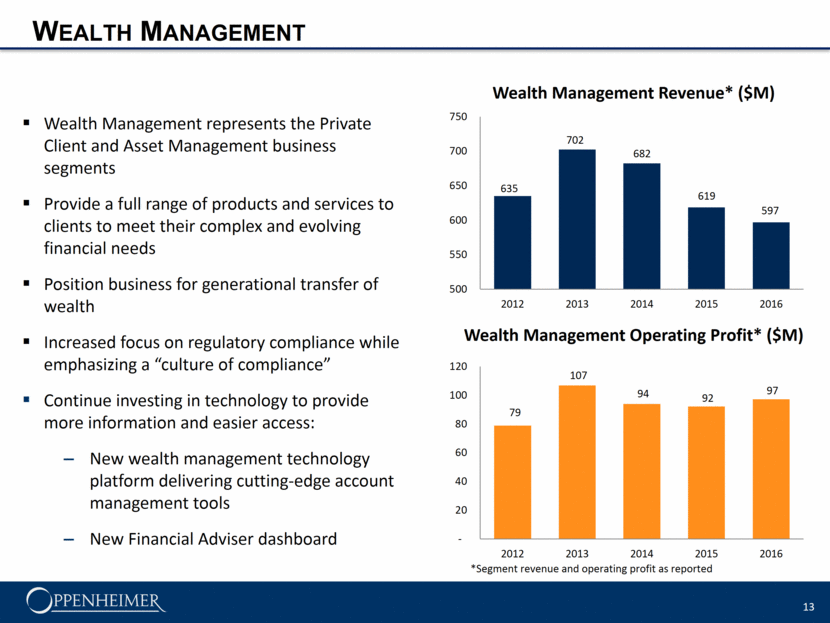
Wealth Management 14 Advisory Fees as a Percentage of Wealth Management Advisory Fees and Commissions Assets Under Administration ($B) Assets Under Management ($B) ($B) ($B) 80.3 84.6 87.3 78.7 77.2 50 55 60 65 70 75 80 85 90 2012 2013 2014 2015 2016 0% 10% 20% 30% 40% 50% 60% 70% 80% 90% 100% - 100 200 300 400 500 600 700 2012 2013 2014 2015 2016 ($M) Total Commissions Advisory Fees - Asset Management Advisory Fees % of Total 20.9 25.3 25.9 24.1 24.8 0.0 5.0 10.0 15.0 20.0 25.0 30.0 2012 2013 2014 2015 2016
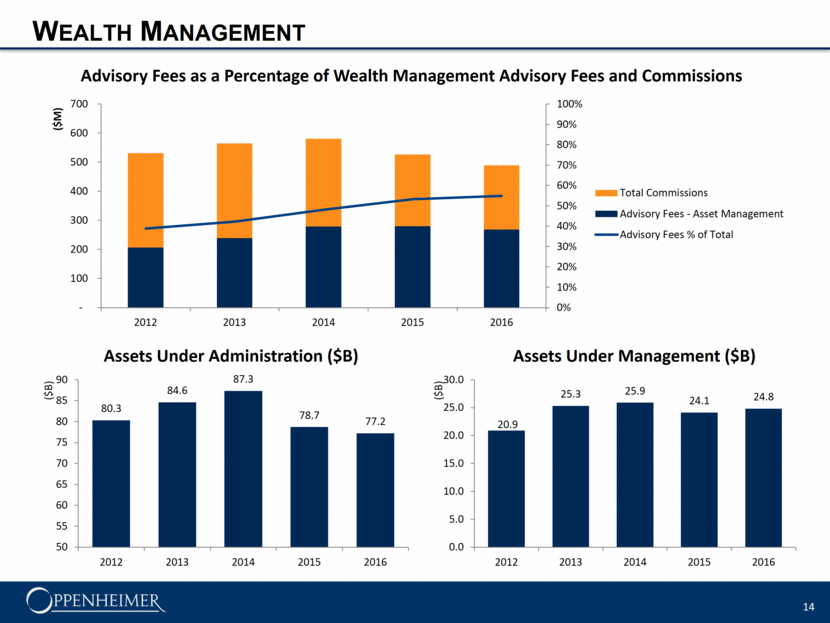
15 Wealth Management Interest and Fee Revenues ($M) Over the last several years low interest rates have had significant impact on interest and fee revenues Firm’s interest rate sensitive products: Cash sweep balances Margin lending Spread lending (Securities Lending and Repo’s) Firm investments (Auction Rate Securities) Federal Reserve raised the target for federal funds rates by 25 bps in December 2015, December 2016, and March 2017 FDIC Insured Bank Deposit program had balance of $7.4 billion as of March 31, 2017 Customer margin debits were $829 million as of March 31, 2017 $111.4 $89.7 $45.5 $37.7 $33.8 $35.1 $35.5 $37.3 $41.4 $62.8 $69.2 0.0% 0.5% 1.0% 1.5% 2.0% 2.5% 3.0% 3.5% 4.0% 4.5% $0 $20 $40 $60 $80 $100 $120 2007 2008 2009 2010 2011 2012 2013 2014 2015 2016 TTM 3- 31-17 FDIC Money Market Product Money Fund Sweep Program Margin Interest Fed Funds Target
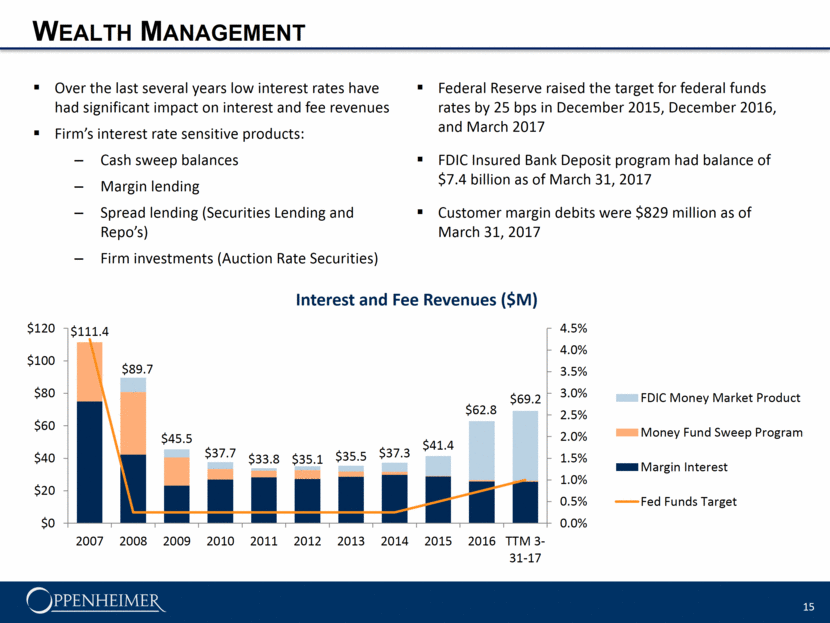
Total Revenue(1) ($M) Capital Markets 16 Institutional Equities Sales & Trading Equity Research Corporate Access Institutional Fixed Income Taxable Fixed Income Non-Taxable Fixed Income Investment Banking Public Finance Capital Markets Operating Profit(1,2) ($M) Capital Markets Revenue Breakdown FY 2016 $254.9M (1) Segment revenue and operating profit as reported (2) 2012 was negatively impacted by a $30M pre-tax charge related to an arbitration award levied against the firm in an ARS matter $126 49% $71 28% $41 16% $17 7% Institutional Equities Institutional Fixed Income Investment Banking Public Finance (15) 7 18 5 (18) (20) (15) (10) (5) - 5 10 15 20 2012 2013 2014 2015 2016 283 281 299 280 255 230 240 250 260 270 280 290 300 310 2012 2013 2014 2015 2016
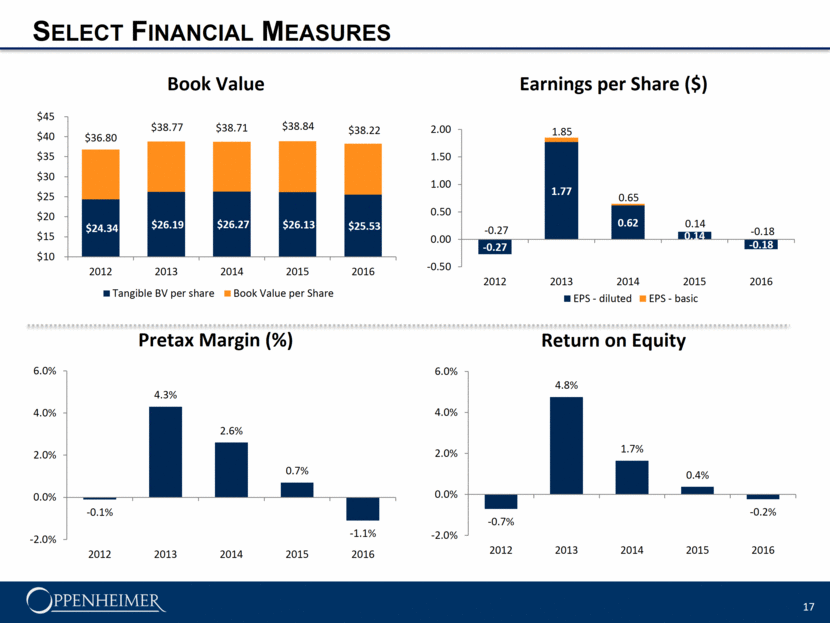
17 Select Financial Measures Book Value Earnings per Share ($) Return on Equity Pretax Margin (%) - 0.27 1.77 0.62 0.14 - 0.18 - 0.27 1.85 0.65 0.14 - 0.18 -0.50 0.00 0.50 1.00 1.50 2.00 2012 2013 2014 2015 2016 EPS - diluted EPS - basic $24.34 $26.19 $26.27 $26.13 $25.53 $36.80 $38.77 $38.71 $38.84 $38.22 $10 $15 $20 $25 $30 $35 $40 $45 2012 2013 2014 2015 2016 Tangible BV per share Book Value per Share - 0.1% 4.3% 2.6% 0.7% - 1.1% -2.0% 0.0% 2.0% 4.0% 6.0% 2012 2013 2014 2015 2016 - 0.7% 4.8% 1.7% 0.4% - 0.2% -2.0% 0.0% 2.0% 4.0% 6.0% 2012 2013 2014 2015 2016
Thank You Oppenheimer Holdings Inc.

