Attached files
| file | filename |
|---|---|
| EX-32.1 - EXHIBIT 32.1 - OPPENHEIMER HOLDINGS INC | opy10-kexx32112312015.htm |
| EX-12 - EXHIBIT 12 - OPPENHEIMER HOLDINGS INC | opy10-kexx1212312015.htm |
| EX-23.1 - EXHIBIT 23.1 - OPPENHEIMER HOLDINGS INC | opy10-kexx23112312015.htm |
| EX-31.1 - EXHIBIT 31.1 - OPPENHEIMER HOLDINGS INC | opy10-kexx31112312015.htm |
| EX-32.2 - EXHIBIT 32.2 - OPPENHEIMER HOLDINGS INC | opy10-kexx32212312015.htm |
| EX-31.2 - EXHIBIT 31.2 - OPPENHEIMER HOLDINGS INC | opy10-kexx31212312015.htm |
As filed with the U.S. Securities and Exchange Commission on March 4, 2016
UNITED STATES
SECURITIES AND EXCHANGE COMMISSION
Washington, D. C. 20549
FORM 10-K
(Mark One)
x | ANNUAL REPORT PURSUANT TO SECTION 13 OR 15(d) OF THE SECURITIES EXCHANGE ACT OF 1934 |
For the fiscal year ended December 31, 2015
OR
¨ | TRANSITION REPORT PURSUANT TO SECTION 13 OR 15(d) OF THE SECURITIES EXCHANGE ACT OF 1934 |
For the transition period from to
Commission file number 1-12043
OPPENHEIMER HOLDINGS INC.
(Exact name of registrant as specified in its charter)
Delaware | 98-0080034 |
(State or other jurisdiction of incorporation or organization) | (I.R.S. Employer Identification No.) |
85 Broad Street, New York, NY | 10004 |
(Address of principal executive offices) | (Zip Code) |
Registrant’s Telephone number, including area code: (212) 668-8000
Securities registered pursuant to Section 12(b) of the Act:
Title of each class | Name of each exchange on which registered |
Class A non-voting common stock | New York Stock Exchange |
Securities registered pursuant to Section 12(g) of the Act:
Not Applicable
(Title of class)
Indicate by check mark if the registrant is a well-known seasoned issuer, as defined in Rule 405 of the Securities Act. Yes ¨ No x
Indicate by check mark if the registrant is not required to file reports pursuant to Section 13 or 15(d) of the Act. Yes ¨ No x
Indicate by check mark whether the registrant (1) has filed all reports required to be filed by Section 13 or 15(d) of the Securities Exchange Act of 1934 during the preceding 12 months (or for such shorter period that the registrant was required to file such reports), and (2) has been subject to such filing requirements for the past 90 days. Yes x No ¨
Indicate by check mark whether the registrant has submitted electronically and posted on its corporate Web site, if any, every Interactive Data File required to be submitted and posted pursuant to Rule 405 of Regulation S-T (Section 232.405 of this chapter) during the preceding 12 months (or for such shorter period that the registrant was required to submit and post such files). Yes x No ¨
Indicate by check mark if disclosure of delinquent filers pursuant to Item 405 of Regulation S-K is not contained herein, and will not be contained, to the best of the registrant’s knowledge, in definitive proxy or information statements incorporated by reference in Part III of this Form 10-K or any amendment to this Form 10-K. x
Indicate by check mark whether the registrant is a large accelerated filer, an accelerated filer, a non-accelerated filer, or a smaller reporting company. See the definitions of “large accelerated filer”, “accelerated filer” and “smaller reporting company” in Rule 12b-2 of the Exchange Act. (Check one):
Large accelerated filer | ¨ | Accelerated filer | x |
Non-accelerated filer | ¨ | Smaller reporting company | ¨ |
(Do not check if a smaller reporting company)
Indicate by check mark whether the registrant is a shell company (as defined in Rule 12b-2 of the Act). Yes ¨ No x
The aggregate market value of the voting stock of the Company held by non-affiliates of the Company cannot be calculated in a meaningful way because there is only limited trading in the class of voting stock of the Company. The aggregate market value of the Class A non-voting common stock held by non-affiliates of the Company at June 30, 2015 was $358.7 million based on the per share closing price of the Class A non-voting common stock on the New York Stock Exchange on June 30, 2015 of $26.28.
The number of shares of the Company’s Class A non-voting common stock and Class B voting common stock (being the only classes of common stock of the Company) outstanding on February 29, 2016 was 13,307,414 and 99,680 shares, respectively.
DOCUMENTS INCORPORATED BY REFERENCE
The Company’s definitive Proxy Statement for the 2016 Annual Meeting of Stockholders to be filed by the Company pursuant to Regulation 14A is incorporated into Items 10, 11, 12, 13 and 14 of Part III of this Form 10-K.
TABLE OF CONTENTS
Item Number | Page | |
1 | ||
1A. | ||
1B. | ||
2 | ||
3 | ||
4 | ||
5 | ||
6 | ||
7 | ||
7A. | ||
8 | ||
9 | ||
9A. | ||
9B. | ||
10 | ||
11 | ||
12 | ||
13 | ||
14 | ||
15 | ||
Throughout this annual report, we refer to Oppenheimer Holdings Inc., collectively with its subsidiaries, as the “Company.” We refer to the directly and indirectly owned subsidiaries of Oppenheimer Holdings Inc. collectively as the “Operating Subsidiaries.”
PART I
Item 1. BUSINESS
OVERVIEW
Oppenheimer Holdings Inc., through its Operating Subsidiaries, is a leading middle-market investment bank and full service broker-dealer. With roots tracing back to 1881, the Company is engaged in a broad range of activities in the securities industry, including retail securities brokerage, institutional sales and trading, investment banking (both corporate and public finance), research, market-making, trust services and investment advisory and asset management services. The Company owns, directly or through subsidiaries, Oppenheimer & Co. Inc. ("Oppenheimer"), a New York-based securities broker-dealer, Oppenheimer Asset Management Inc. ("OAM"), a New York-based investment adviser, Freedom Investments, Inc. ("Freedom"), a discount securities broker-dealer based in New Jersey, Oppenheimer Trust Company ("Oppenheimer Trust"), a Delaware limited purpose bank, OPY Credit Corp., a New York corporation organized to trade and clear syndicated corporate loans, and Oppenheimer Multifamily Housing & Healthcare Finance, Inc. ("OMHHF"), a Federal Housing Administration ("FHA")-approved mortgage company based in Pennsylvania. The Company's international businesses are carried on through Oppenheimer Europe Ltd. (United Kingdom), Oppenheimer Investments Asia Limited (Hong Kong), and Oppenheimer Israel (OPCO) Ltd. (Israel).
Oppenheimer Holdings Inc. was originally incorporated under the laws of British Columbia. Pursuant to its Certificate and Articles of Incorporation, effective on May 11, 2005, the Company's legal existence was continued under the Canada Business Corporations Act. Effective May 11, 2009, the Company changed its jurisdiction of incorporation from the federal jurisdiction of Canada to the State of Delaware in the United States with the approval of its shareholders.
PRIVATE CLIENT
Through its Private Client Division, Oppenheimer provides a comprehensive array of financial services through a network of approximately 1,233 financial advisers in 85 offices located throughout the United States. Clients include high-net-worth individuals and families, corporate executives, and small and mid-sized businesses. Clients may choose a variety of ways to establish a relationship and conduct business including brokerage accounts with transaction-based pricing and/or investment advisory accounts with asset-based fee pricing. As of December 31, 2015, the Company held client assets under administration of approximately $78.7 billion. Oppenheimer provides the following private client services:
Full-Service Brokerage – Oppenheimer offers full-service brokerage covering a broad array of investment alternatives including exchange-traded and over-the-counter corporate equity and debt securities, money market instruments, exchange-traded options and futures contracts, municipal bonds, mutual funds, and unit investment trusts. A substantial portion of Oppenheimer's revenue is derived from commissions from private clients through accounts with transaction-based pricing. Brokerage commissions are charged on investment products in accordance with a schedule which Oppenheimer has formulated. Discounts are available to and can be negotiated with customers based on transaction size and volume as well as a number of other factors.
Wealth Planning – Oppenheimer also offers financial and wealth planning services which include asset management, individual and corporate retirement solutions, including insurance and annuity products, IRAs and 401(k) plans, U.S. stock plan services to corporate executives and businesses, education savings programs, and trust and fiduciary services to individual and corporate clients.
Margin Lending – Oppenheimer extends credit to its customers, collateralized by securities and cash in the customer's account, for a portion of the purchase price, and receives income from interest charged on such extensions of credit. The customer is charged for such margin financing at interest rates derived from Oppenheimer's rate.
2
ASSET MANAGEMENT
The Company offers a wide range of investment advisory, portfolio management and financial planning services to its retail and institutional clients through proprietary and third party distribution channels. Clients include high-net-worth individuals and families, foundations and endowments, insurance companies, and trust and pension funds. Investment management capabilities include equity, fixed income, balanced and alternative investments, which are offered through vehicles such as privately managed accounts, and retail and institutional separate accounts. At December 31, 2015, the Company had $24.1 billion of client assets under management ("AUM") in fee-based programs. The Company's asset management services include:
Separately Managed Accounts – The Company provides clients with three fee-based programs: (i) Investment Advisory Services through which clients may select among those managers reviewed and recommended by the Company; (ii) Strategic Asset Review dual contract program through which clients may select among those managers available; and (iii) Unified Managed Account which allows multiple investment managers, mutual funds and ETFs to be combined in a single custodial account.
Portfolio Advisory Services – The Company offers a fee-based mutual fund program, Portfolio Advisory Services, where clients may choose long-term strategic asset allocation programs among mutual funds approved by the Company.
Oppenheimer Investment Advisory Services – Oppenheimer Investment Advisers offers internal portfolio managers servicing high-net-worth individuals, retirement plans, endowments, foundations and trusts using both taxable and non-taxable fixed income strategies.
Discretionary Portfolio Management – Through its Omega and Fahnestock Asset Management programs, Oppenheimer offers discretionary fee-based investment programs managed by Oppenheimer advisers with a client-focused approach to money management, servicing high-net-worth individuals, families, endowments and foundations, and institutions. In addition, the Alpha programs offer similar services as a commission-based program.
Fee-Based Non-Discretionary Accounts – Under Oppenheimer's Preference Program, Oppenheimer provides non-discretionary investment advisory services to high-net-worth individuals and families who pay an advisory fee on a quarterly basis. The program includes features such as initial portfolio consultation, quarterly performance reporting and periodic consultation.
Institutional Investment Management – Oppenheimer Investment Management, LLC ("OIM") provides fixed income management and solutions to institutional investors including Taft-Hartley funds, public pension funds, corporate pension funds, insurance companies, and foundations and endowments.
Alternative Investments – The Company offers high-net-worth and institutional investors the opportunity to participate in a wide range of non-traditional investment strategies. Strategies include single manager hedge funds, fund of funds and private equity vehicles. For proprietary funds, the Company, through its subsidiaries, acts as general partner in these investments and typically earns 1% to 2% per year in management fees and 20% performance (or incentive) fees. The fees which the Company receives are shared in a pre-determined manner with the portfolio manager.
CAPITAL MARKETS
Investment Banking
Oppenheimer employs approximately 100 investment banking professionals throughout the United States and in the United Kingdom, Israel and Asia. Oppenheimer's investment banking division provides strategic advisory services and capital markets products to emerging growth and middle market businesses. The investment banking industry coverage groups focus on certain sectors including consumer and business services, energy, financial institutions and real estate, healthcare, industrial growth and services, and technology, media and communications. Oppenheimer's industry coverage teams partner with Oppenheimer's Mergers and Acquisitions practice as well as Equities, Leveraged Finance and Fixed Income platforms to provide its clients with tailored advice and recommendations. In addition, Oppenheimer has extensive experience working with financial sponsors and maintains a dedicated Financial Sponsor group.
Mergers and Acquisitions – Oppenheimer advises buyers and sellers on sales, divestitures, mergers, acquisitions, tender offers, privatizations, restructurings, spin-offs and joint ventures. Oppenheimer provides dedicated senior banker focus to clients throughout the financial advisory process, which combines our structuring and negotiating expertise with our industry knowledge, extensive relationships, and capital markets capabilities.
3
Equities – Oppenheimer provides capital raising solutions for corporate clients through initial public offerings, follow-on offerings, equity-linked offerings, private investments in public entities, and private placements. Oppenheimer focuses on emerging companies in growth industries, including consumer and business services, energy, financial institutions and real estate, healthcare, industrial growth and services, and technology, media and communications.
Leverage Finance and Fixed Income – Oppenheimer offers a full range of debt financing for emerging growth and middle market companies and financial sponsors. Oppenheimer focuses on structuring and distributing public and private debt in leveraged finance transactions, including leveraged buyouts, acquisitions, growth capital financings, recapitalizations and Chapter 11 exit financings. Oppenheimer also participates in high yield debt and fixed and floating-rate senior and subordinated debt offerings. In addition, Oppenheimer advises on bond financing alternatives for both sovereign and corporate emerging market issuers.
Equities Capital Markets
Institutional Equity Sales and Trading – Oppenheimer provides execution services and access to all major U.S. equity exchanges and alternative execution venues, in addition to capital markets/origination, various arbitrage strategies, portfolio and electronic trading. Oppenheimer offers a suite of quantitative and algorithmic trading solutions to access liquidity in global markets. Oppenheimer's clients include domestic and international investors such as investment advisers, banks, mutual funds, insurance companies, hedge funds, and pension and profit sharing plans, attracted by the insights and market intelligence provided by sales and trading staff as well as by the quality of execution (measured by volume, timing and price), and competitive negotiated commission rates.
Equity Research – Oppenheimer employs 40 senior analysts covering over 600 equity securities worldwide, and over 100 dedicated equity research sales professionals. Oppenheimer provides regular research reports, notes and earnings updates and also sponsors numerous research conferences where the management of covered companies can meet with investors in a group format as well as in one-on-one meetings. Oppenheimer also arranges for company managements to meet with interested investors through arranged meetings wherein management representatives travel to various sites to meet with Oppenheimer representatives and with investors. Oppenheimer's analysts use a variety of quantitative and qualitative tools, integrating field analysis, proprietary channel checks and ongoing dialogue with the managements of the companies they cover in order to produce reports and studies on individual companies and industry developments.
Equity, Debt and Index Options – Oppenheimer offers extensive equity and index options strategies for investors seeking to manage risk and optimize returns within the equities market. Oppenheimer's experienced professionals have expertise in many listed derivative products designed to serve the diverse needs of its institutional, corporate and private client base.
Convertible Bonds – Oppenheimer commits dedicated personnel to serve the convertible markets, offering expertise in the sales, trading and analysis of U.S. domestic convertible bonds, convertible preferred shares and warrants, with a focus on minimizing transaction costs and maximizing liquidity. In addition Oppenheimer offers hedged (typically long convertible bonds and short equities) positions to its clients on an integrated trade basis.
Event Driven Sales and Trading – Oppenheimer has a dedicated team focused on providing specialized advice and trade execution expertise to institutional clients with an interest in investment strategies such as: merger arbitrage; Dutch tender offers; splits and spin-offs; and recapitalizations, corporate reorganizations, and other event-driven trading strategies.
Debt Capital Markets
Fixed Income – Oppenheimer offers trading and a high degree of sales support in highly rated ("high grade") corporate bonds, mortgage-backed securities, government and agency bonds and the sovereign and corporate debt of industrialized and emerging market countries, which may be denominated in currencies other than U.S. dollars. Since June 2009, Oppenheimer has participated in auctions for U.S. government securities conducted by the Federal Reserve Bank of New York on behalf of the U.S. Treasury. Oppenheimer trades non-investment grade public and private debt securities, mortgage-backed securities, sovereign and corporate debt of industrialized and emerging market countries and distressed securities both for its own account as well as for institutional clients qualified to sustain the risks associated with such securities. Oppenheimer also publishes research with respect to a number of such securities. Risk of loss upon default by the borrower is significantly greater with respect to unrated or less than investment grade corporate debt securities than with other corporate debt securities. These securities are generally unsecured and are often subordinated to other creditors of the issuer. These issuers usually have high levels of indebtedness and are more sensitive to adverse economic conditions, such as recession or increasing interest rates, than are investment grade issuers. There is a limited market for some of these securities and market quotes are available only from a small number of dealers.
4
Fixed Income Research – Oppenheimer has a total of seven fixed income research professionals. There are three dedicated research analysts covering companies that have issued high yield bonds in the United States. Oppenheimer's high yield corporate bond research effort is designed to identify debt issues that provide a combination of high yield plus capital appreciation over the short to medium term. There is one mortgage backed securities analyst focused on the detailed analysis of individual agency and non-agency mortgage backed securities. There are two professionals covering emerging market fixed income issuers, including a publishing research analyst focused exclusively on sovereign bonds and a strategist providing commentary on emerging market corporate bond issuers. The Firm also has a municipal bond research analyst publishing reports on the tax-exempt municipal bond market.
Public Finance – Oppenheimer's public finance department advises and raises capital for state and local governments, public agencies, private developers and other borrowers. The group assists its clients by developing and executing capital financing plans that meet our clients' objectives and by maintaining strong national institutional and retail securities distribution capabilities. Public finance bankers have expertise in specific areas, including local governments and municipalities, primary and secondary schools, post-secondary and private schools, state and local transportation entities, health care institutions, senior-living facilities, public utility providers and project financing. In addition to underwriting longer-term municipal securities, Oppenheimer also provides advice to municipal issuers with respect to the timing and issuance of short-term municipal notes, which Oppenheimer then underwrites and distributes as well as short-term notes for bridge financing of real estate projects.
Municipal Trading – Oppenheimer has regionally based municipal bond trading desks serving retail financial advisers within their regions. These desks serve Oppenheimer's financial advisers in supporting their high-net-worth clients' needs for taxable and non-taxable municipal securities. The Firm also maintains a dedicated institutional municipal bond sales and trading effort focused on serving mid-tier and national institutional accounts. The Institutional desks assist in underwriting municipal securities originated by its Public Finance Department. These desks serve Oppenheimer's financial advisers in supporting their high-net-worth clients' needs for taxable and non-taxable municipal securities.
Proprietary Trading
In the regular course of its business, Oppenheimer takes securities positions as a market maker and/or principal to facilitate customer transactions and for investment purposes. In making markets and when trading for its own account, Oppenheimer exposes its own capital to the risk of fluctuations in market value. In 2010, Congress enacted the Dodd-Frank Wall Street Reform and Consumer Protection Act ("Dodd-Frank") that proposes to prohibit proprietary trading by certain financial institutions (the "Volcker Rule") except where facilitating customer trades. The Volcker Rule went into effect in July 2015 and does not impact the Company's business or operations as it applies to banks and other subsidiaries of bank holding companies only.
Equities – Oppenheimer acts as both principal and agent in the execution of its customers' orders. Oppenheimer buys, sells and maintains an inventory of a security in order to "make a market" in that security. In executing customer orders for securities in which it does not make a market, Oppenheimer generally charges a commission and acts as agent, or will act as principal by marking the security up or down in a riskless transaction. However, when an order is in a security in which Oppenheimer makes a market, Oppenheimer normally acts as principal and purchases from or sells to its brokerage customers at a price which is approximately equal to the current inter-dealer market price plus or minus a mark-up or mark-down. The stocks in which Oppenheimer makes a market may also include those of issuers which are followed by Oppenheimer's research department.
Fixed Income – Oppenheimer trades and holds positions in public and private debt securities, including non-investment grade and distressed corporate securities as well as municipal securities. There may be a limited market for some of these securities and market quotes may be available from only a small number of dealers or inter-dealer brokers. While Oppenheimer normally holds such securities for a short period of time in order to facilitate client transactions, there is a risk of loss upon default by the borrower or from a change in interest rates affecting the value of the security. These issuers may have high levels of indebtedness and be sensitive to adverse economic conditions, such as recession or increasing interest rates.
Through the use of securities sold under agreements to repurchase ("repurchase agreements") and securities purchased under agreements to resell ("reverse repurchase agreements"), the Company acts as an intermediary between borrowers and lenders of short-term funds and provides funding for various inventory positions.
5
Proprietary Trading and Investment Activities – Oppenheimer holds positions in its trading accounts in securities in which it does not make a market and may engage from time to time in other types of principal transactions in securities. Oppenheimer has several trading departments including a convertible bond department, a risk arbitrage department, a corporate bond department, a municipal bond department, a government/mortgage backed securities department, and a department that underwrites and trades U.S. government agency issues, taxable corporate bonds, preferred shares, unit investment trusts and short term debt instruments. These departments continually purchase and sell securities and make markets in order to make a profit on the inter-dealer spread or to profit from investment. Although Oppenheimer from time to time holds an inventory of securities, more typically, it seeks to match customer buy and sell orders. In addition, Oppenheimer and OAM hold proprietary positions in equity or fixed income securities in which it may not act as a dealer.
The size of its securities positions vary substantially based upon economic and market conditions, allocations of capital, underwriting commitments and trading volume. Also, the aggregate value of inventories of securities which Oppenheimer may carry is limited by the Net Capital Rule. See "Regulatory Capital Requirements," below and Item 7, "Management's Discussion and Analysis of Financial Condition and Results of Operations - Liquidity and Capital Resources."
The Company, through its subsidiaries, holds investments as general partner in a range of investment partnerships (hedge funds, fund of funds, private equity partnerships and real estate partnerships) which are offered to Oppenheimer hedge fund-qualified clients and on a limited basis to qualified clients of other broker-dealers.
Securities Lending
In connection with both its trading and brokerage activities, Oppenheimer borrows securities to cover short sales and to complete transactions in which customers have failed to deliver securities by the required settlement date and lends securities to other brokers and dealers for similar purposes. Oppenheimer earns interest on its cash collateral provided and pays interest on the cash collateral received less a rebate earned for lending securities.
CONSOLIDATED SUBSIDIARIES
Oppenheimer & Co. Inc.
Oppenheimer is a registered broker-dealer in securities under the Securities Exchange Act of 1934 and transacts business on various exchanges, including the New York Stock Exchange, Inc. Oppenheimer engages in a broad range of activities in the securities industry, including retail securities brokerage, institutional sales and trading, investment banking (both corporate and public finance), underwritings, research, market-making, and investment advisory and asset management services. Oppenheimer provides its services from offices located throughout the United States.
Oppenheimer Asset Management Inc.
OAM is registered as an investment adviser with the U.S. Securities and Exchange Commission (the "SEC") under the Investment Advisers Act of 1940, as amended (the "Advisers Act"). OAM's investment advisory business provides investment advice to clients through separate accounts and wrap fee programs.
OPY Credit Corp.
The Company reached an agreement with RBS Citizens, NA, now Citizens Bank, NA, including its broker-dealer affiliates ("Citizens"), that was announced in July 2012, whereby the Company, through OPY Credit Corp., will introduce lending opportunities to Citizens, which Citizens can elect to accept and in which the Company will participate in the fees earned from any related commitment by Citizens. The Company can also, in certain circumstances, assume a portion of Citizen's syndication and lending risk under such loans, and if it does so it shall be obligated to secure such obligations via a cash deposit determined through risk based formulas. Neither the Company nor Citizens is obligated to make any specific loan or to commit any minimum amount of lending capacity to the relationship. The agreement also calls for Citizens and the Company at their option to jointly participate in the arrangement of various loan syndications. At December 31, 2015, there were no outstanding loans in place.
Oppenheimer Trust Company of Delaware Inc.
Oppenheimer Trust offers a wide variety of trust services to clients of Oppenheimer. This includes custody services, advisory services and specialized servicing options for clients. At December 31, 2015, Oppenheimer Trust held custodial assets of approximately $457.4 million. See "Other Requirements," below.
6
Oppenheimer Multifamily Housing & Healthcare Finance, Inc.
OMHHF is engaged in the business of originating and servicing Federal Housing Administration ("FHA")-insured multifamily and healthcare facility loans and securitizing these loans into Ginnie Mae ("GNMA") mortgage backed securities. OMHHF also offers mortgage services to developers of commercial properties including apartments, elderly housing and nursing homes that satisfy FHA criteria. OMHHF maintains a mortgage servicing portfolio for which it provides a full array of services, including the collection of mortgage payments from mortgagors which are passed on to the mortgage holders and construction loan management.
ADMINISTRATION AND OPERATIONS
Administration and operations personnel are responsible for the processing of securities transactions; the receipt, identification and delivery of funds and securities; the maintenance of internal financial controls; accounting functions; custody of customers' securities; the handling of margin accounts for Oppenheimer and its correspondents; and general office services.
Oppenheimer executes its own and certain of its correspondents' securities transactions on all United States exchanges as well as many non-U.S. exchanges and in the over-the-counter market. Oppenheimer clears all of its securities transactions (i.e., it delivers securities that it has sold, receives securities that it has purchased and transfers related funds) through its own facilities and through memberships in various clearing corporations and custodian banks in the United States. The Company began clearing its non-U.S. international equities business carried on by Oppenheimer Europe Ltd. through BNP Paribas Securities Services and Oppenheimer through BNP Securities Corp. Oppenheimer has a multi-currency platform which enables it to facilitate client trades in securities denominated in foreign currencies. Oppenheimer operates as an Introducing Broker and introduces its client commodities transactions through a correspondent firm on a fully disclosed basis. Through this arrangement, Oppenheimer offers full commodity services on all exchanges.
EMPLOYEES
At December 31, 2015, the Company employed 3,290 employees (3,230 full-time and 60 part-time), of whom approximately 1,233 were financial advisers.
COMPETITION
Oppenheimer encounters intense competition in all aspects of the securities business and competes directly with other securities firms, a significant number of which have substantially greater resources and offer a wider range of financial services. In addition, there has been increasing competition from other sources, such as commercial banks, insurance companies, private equity and financial sponsors and certain major corporations that have entered the securities industry through acquisition, and from other entities. Additionally, foreign-based securities firms and commercial banks regularly offer their services in performing a variety of investment banking functions including mergers and acquisitions advice, leveraged buy-out financing, merchant banking, and bridge financing, all in direct competition with U.S. broker-dealers.
In recent years, several key market events drastically altered the landscape for financial institutions. Voluntary and involuntary consolidations as well as government assistance provided to U.S. financial institutions has led to a greater concentration of capital and market share among large financial institutions. This, coupled with the ability of these financial institutions to finance their securities businesses with capital from other businesses, such as commercial banking deposits, as well as such institutions deriving an aura of stability in the mind of the public ("too big to fail"), may put the Company at a significant competitive disadvantage.
The Company believes that the principal factors affecting competition in the securities and investment banking industries are the quality and ability of professional personnel and relative prices of services and products offered. In some instances, competition within the industry can be impacted by the credit ratings assigned to the firm offering services when potential clients are making a determination of acceptable counterparties. The ability of securities industry participants to offer credit facilities to potential investment banking clients may affect the assignment of individual transactions. The Company's ability to compete depends substantially on its ability to attract and retain qualified employees while managing compensation and other costs. Oppenheimer and its competitors employ advertising and direct solicitation of potential customers in order to increase business and furnish investment research publications in an effort to retain existing and attract potential clients. Many of Oppenheimer's competitors engage in these programs more extensively than Oppenheimer. Increasingly, securities firms are providing automated investment advisory services that employ algorithms to determine recommended portfolio allocations at a much lower price point. It is early and not yet clear whether this type of investment advisory service will provide meaningful competition to the full service investment model.
7
BUSINESS CONTINUITY PLAN
The Company has a business continuity plan in place which is designed to enable it to continue to operate and provide services to its clients under a variety of circumstances in which one or more events may make one or more firm operating locations unavailable due to a local, regional or national emergency, or due to the failure of one or more systems that the Company relies upon to provide the services that it routinely provides to its clients, employees and various business partners and counterparties. The plan covers all business areas of the Company and provides contingency plans for technology, staffing, equipment, and communication to employees, clients and counterparties. While the plan is intended to address many types of business continuity issues, there could be certain occurrences which, by their very nature are unpredictable, and can occur in a manner that is outside of our planning guidelines and could render the Company's estimates of timing for recovery inaccurate. Under all circumstances, it is the Company's intention to remain in business and to provide ongoing investment services as if no disruption had occurred.
Oppenheimer maintains its headquarters and principal operating locations in New York City. In order to provide continuity for these services, the Company operates a primary data center as well as maintains back-up facilities (information technology, operations and data processing) in sites with requisite communications back-up systems. These facilities are maintained in multiple locations and, in addition, the Company occupies significant office facilities in locations around the United States which could, in an emergency, house dislocated staff members for a short or intermediate time frame. Oppenheimer relies on public utilities for power and phone services, industry specific entities for ultimate custody of client securities and market operations, and various industry vendors for services that are significant and important to its business for the execution, clearance and custody of client holdings, for the pricing and valuing of client holdings, and for permitting our Company's employees to communicate on an efficient basis. The Company's headquarters and the primary location for its technology infrastructure are both supported by emergency electric generator back-up. All of these service providers have assured the Company that they have made plans for providing continued service in the case of an unexpected event that might disrupt their services.
The fourth quarter of 2012 was impacted by Superstorm Sandy which occurred on October 29th causing the Company to vacate its two principal offices in downtown Manhattan and displaced 800 of the Company's employees including substantially all of its capital markets, operations and headquarters staff for in excess of 30 days. During the displacement period, the Company successfully implemented its business continuity plan by relocating personnel from both of its downtown Manhattan locations into other branch offices and back-up facilities in the region. Other than the closure of the financial markets for two business days, the Company was able to successfully clear and settle open trades that took place prior to the storm and to get its trading, operations, technology, and other support functions mobilized to process business once the financial markets reopened. The Company was able to return to its headquarters facilities beginning in December 2012 and the locations returned to full utility power in March 2013.
CYBERSECURITY
Cybersecurity presents significant challenges to the business community in general, as well as to the financial services industry. Increasingly, actors, both domestically and internationally, attempt to steal personal data and/or interrupt the normal functioning of businesses through accessing individuals’ and company files and equipment connected to the internet. Recent incidents have reflected the increasing sophistication of intruders and their intent to steal information as well as funds and securities through instructions seemingly from authorized parties but in fact from parties intent on attempting to steal. Regulators are increasingly requiring companies to provide increased levels of sophisticated defenses. The Company maintains vigilance and ongoing planning and systems to prevent any such attack from disrupting its services to clients as well as to prevent any loss of data concerning our clients, their financial affairs, as well as Company privileged information. The Company has implemented new systems to detect and defend from such attacks and has appointed a Corporate Information Security Officer and put in place a department of dedicated staff to provide ongoing development and oversight of the Company's systems and defenses. See Item 1A under the caption "Risk Factors - The Company may be exposed to damage to its business or its reputation by Cybersecurity incidents."
8
REGULATION
Self-Regulatory Organization Membership - Oppenheimer is a member firm of the following self-regulatory organizations ("SROs"): the Financial Industry Regulatory Authority ("FINRA"), the Intercontinental Exchange, Inc., known as ICE Futures U.S., the Commodities Futures Trading Commission ("CFTC") and the National Futures Association ("NFA"). In addition, Oppenheimer has satisfied the requirements of the Municipal Securities Rulemaking Board ("MSRB") for effecting customer transactions in municipal securities. Freedom is also a member of FINRA. Oppenheimer Europe Ltd. is regulated by the Financial Conduct Authority ("FCA") in the United Kingdom and the Jersey Financial Services Commission ("JFSC") in the Isle of Jersey. Oppenheimer Investments Asia Limited is regulated by the Securities and Futures Commission ("SFC") in Hong Kong. Oppenheimer is also a member of the Securities Industry and Financial Markets Association ("SIFMA"), a non-profit organization that represents the shared interests of participants in the global financial markets. The Company has access to a number of regional and national markets and is required to adhere to their applicable rules and regulations.
Securities Regulation - The securities industry in the United States is subject to extensive regulation under both federal and state laws. The SEC is the Federal agency charged with administration of the Federal securities laws. Much of the regulation of broker-dealers has been delegated to SROs such as FINRA and the NFA. FINRA has been designated as the primary regulator of Oppenheimer and Freedom with respect to securities and option trading activities and the NFA has been designated as Oppenheimer's primary regulator with respect to commodities activities. SROs adopt rules (subject to approval by the SEC or the CFTC, as the case may be) governing the industry and conduct periodic examinations of Oppenheimer's and Freedom's operations. In recent years, the SEC has increased its programs for examinations of registrants, even where such examinations overlap with examinations conducted by other entities. Securities firms are also subject to regulation by state securities commissions in the states in which they do business. Oppenheimer and Freedom are each registered as a broker-dealer in the 50 states and the District of Columbia and Puerto Rico.
Broker-dealer Regulation - The regulations to which broker-dealers are subject cover all aspects of the securities business, including sales methods, trade practices among broker-dealers, the use and safekeeping of customers' funds and securities, capital structure of securities firms, record keeping and the conduct of directors, officers and employees. The SEC has adopted rules requiring underwriters to ensure that municipal securities issuers provide current financial information and imposing limitations on political contributions to municipal issuers by brokers, dealers and other municipal finance professionals. Additional legislation, changes in rules promulgated by the SEC, the CFTC and by SROs, or changes in the interpretation or enforcement of existing laws and rules may directly affect the method of operation and profitability of broker-dealers. The SEC, SROs (including FINRA) and state securities commissions may conduct administrative proceedings which can result in censure, fine, issuance of cease and desist orders or suspension or expulsion of a broker-dealer, its officers, or employees. These administrative proceedings, whether or not resulting in adverse findings, can require substantial expenditures of time and money and can have an adverse impact on the reputation of a broker-dealer. The principal purpose of regulating and disciplining broker-dealers is to protect customers and the securities markets rather than to protect creditors and shareholders.
Regulation NMS and Regulation SHO have substantially affected the trading of equity securities. These regulations were intended to increase transparency in the markets and have acted to further reduce spreads and, with competition from electronic marketplaces, to reduce commission rates paid by institutional investors. These rules have also reduced liquidity in some markets under some circumstances.
Oppenheimer and certain of its affiliates are also subject to regulation by the SEC and under certain state laws in connection with its business as an investment adviser. The SEC has announced its intention to place additional oversight and scrutiny over dual registrants such as the Company, where the registrant conducts business as a broker-dealer and investment adviser.
The SEC has passed a requirement for custodians of securities on behalf of investment advisers, such as the Company, to be subject to an annual "surprise" examination of custodian assets and to deliver a control report to its clients, issued by a qualified accounting firm, describing its processes and controls affecting custody operations, which report was issued by the Company for the first time on September 12, 2010. The Company's most recent report was timely filed on November 25, 2015.
Margin lending by Oppenheimer is subject to the margin rules of the Board of Governors of the Federal Reserve System and FINRA. Under such rules, Oppenheimer is limited in the amount it may lend in connection with certain purchases of securities and is also required to impose certain maintenance requirements on the amount of securities and cash held in margin accounts. In addition, Oppenheimer may (and currently does) impose more restrictive margin requirements than required by such rules.
9
The Sarbanes-Oxley Act of 2002 effected significant changes to corporate governance, auditing requirements and corporate reporting. This law generally applies to all companies, including the Company, with equity or debt securities registered under the Securities Exchange Act of 1934, as amended (the "Exchange Act"). The Company has taken numerous actions, and incurred substantial expenses, since the passage of the legislation to comply with the Sarbanes-Oxley Act, related regulations promulgated by the SEC and other corporate governance requirements of the NYSE. On May 14, 2013, the Committee of Sponsoring Organizations of the Treadway Commission (COSO) released an updated version of its Internal Control - Integrated Framework (the "2013 Framework"), which supersedes the original framework that was developed in 1992. The Company adopted the 2013 Framework on December 15, 2014 as a basis for their compliance with the Sarbanes-Oxley Act of 2002. Management has determined that the Company's internal control over financial reporting as of December 31, 2015 was effective. See Item 8 under the caption "Management's Report on Internal Control over Financial Reporting."
In July 2010, Congress enacted extensive legislation entitled the Dodd-Frank Wall Street Reform and Consumer Protection Act in which it mandated that the SEC and other regulators conduct comprehensive studies and issue new regulations based on their findings to control and monitor the activities of financial institutions in order to protect the financial system, the investing public and consumers from issues and failures that occurred in the 2008-9 financial crisis. All the relevant studies have been completed and they are widely expected to extensively impact the regulation and practices of financial institutions including the Company. The changes are likely to significantly reduce leverage available to financial institutions and to increase transparency to regulators and investors of risks taken by such institutions. It is impossible to presently predict the effect of such rulemaking, although proposals that have been implemented or are being considered in the U.S. and Europe include creating a new regulator for certain activities, regulating and/or prohibiting proprietary trading for certain deposit taking institutions, controlling the amount and timing of compensation to "highly paid" employees, creating new regulations around financial transactions with consumers requiring the adoption of a uniform fiduciary standard of care of broker-dealers and investment advisers providing personalized investment advice about securities to retail customers, increasing the disclosures provided to clients, and creating a tax on securities transactions. The Volcker Rule became effective on July 21, 2015. In December 2012, France began applying a .2% transaction tax on financial transactions in American Depository Receipts of French companies that trade on U.S. exchanges. Italy implemented its own transaction tax on financial transactions in early 2013. The European Markets are attempting to enact a transaction tax on financial transactions that would be imposed on all financial transactions originating in the Euro zone. If and when enacted, such regulations will likely increase compliance costs and reduce returns earned by financial service providers and intensify compliance overall.
The Department of Labor of the United States has proposed rules that would create fiduciary liability to providers of services to retirement plans including pension plans, 401(k) plans, IRAs and other plans regulated by the Department of Labor. The SEC is also considering rules to cover relationships between retirement plans and service providers. The SEC is also considering rules that would make broker-dealers fiduciaries in virtually all of their relationships with clients. The Department of Labor has received extensive adverse comments on its proposed rules including from committees of Congress. It appears, however, that new rules will be enacted in 2016. These rules will modify the current interaction between service providers and retirement plans. The impact of such rules is impossible to predict but it is likely to affect the pricing of services and produce increased liabilities to service providers.
In July 2014, the SEC adopted amendments to the rules that govern money market mutual funds. The amendments make structural and operational reforms to address risks of excessive withdrawals over relatively short time frames by investors from money market funds, while preserving the benefits of the funds. Oppenheimer does not sponsor any money market funds. Oppenheimer utilizes such funds to a small extent for its own investment purposes, and as a result of the new rules, has extensively limited the availability of money market funds to its clients. Instead the Company now recommends FDIC short-term bank deposits alternatives as a cash sweep investments.
Effective July 1, 2014, certain final rules issued by the SEC regarding the mandatory registration of municipal advisers became effective. These rules specify which activities will be covered by the fiduciary duty of a municipal adviser to its government client imposed by the Dodd-Frank Act, may result in the need for new written representations by issuers, and may limit the manner in which we, in our capacity as an underwriter or in our other professional roles, interact with municipal issuers. Oppenheimer registered as a municipal adviser and by virtue of such registration is now subject to additional regulation and oversight in respect of its municipal finance business. The SEC recently announced that it will undertake a two-year review of municipal advisers. Additionally, forthcoming rulemaking by the Municipal Securities Rulemaking Board may cause further changes to the manner in which a state or local government is able to interact with outside finance professionals. These new rules impact the nature of Oppenheimer's interactions with public finance clients, and may have a negative short-term impact on the volume of public finance transactions, while the industry adapts to the new rules.
10
It is difficult to predict the nature of the final regulations and their impact on the business of the Company. The impact of any of, or more than one of, the foregoing could have a material adverse effect on our business, financial condition and results of operations. Certain of the rule-making described above remains under consideration and has been subject to numerous changes and postponements in both the requirements of such rules and the implementation date(s).
Trust Company Regulation – Oppenheimer Trust is a limited purpose trust company organized under the laws of Delaware and is regulated by the Office of the State Banking Commissioner.
REGULATORY CAPITAL REQUIREMENTS
As registered broker-dealers and member firms regulated by FINRA, Oppenheimer and Freedom are subject to certain net capital requirements pursuant to Rule 15c3-1 (the "Net Capital Rule") promulgated under the Exchange Act. The Net Capital Rule, which specifies minimum net capital requirements for registered brokers and dealers, is designed to measure the general financial integrity and liquidity of a broker-dealer and requires that at least a minimum part of its assets be kept in liquid form.
Oppenheimer elects to compute net capital under the alternative method of calculation permitted by the Net Capital Rule. (Freedom computes net capital under the basic formula as provided by the Net Capital Rule.) Under the alternative method, Oppenheimer is required to maintain a minimum "net capital", as defined in the Net Capital Rule, at least equal to 2% of the amount of its "aggregate debit items" computed in accordance with the Formula for Determination of Reserve Requirements for Brokers and Dealers (Exhibit A to Rule 15c3-3 under the Exchange Act) or $1.5 million, whichever is greater. "Aggregate debit items" are assets that have as their source transactions with customers, primarily margin loans. Failure to maintain the required net capital may subject a firm to suspension or expulsion by FINRA, the SEC and other regulatory bodies and ultimately may require its liquidation. The Net Capital Rule also prohibits payments of dividends, redemption of stock and the prepayment of subordinated indebtedness if net capital thereafter would be less than 5% of aggregate debit items (or 7% of the funds required to be segregated pursuant to the Commodity Exchange Act and the regulations thereunder, if greater) and payments in respect of principal of subordinated indebtedness if net capital thereafter would be less than 5% of aggregate debit items (or 6% of the funds required to be segregated pursuant to the Commodity Exchange Act and the regulations thereunder, if greater). The Net Capital Rule also provides that the total outstanding principal amounts of a broker-dealer's indebtedness under certain subordination agreements (the proceeds of which are included in its net capital) may not exceed 70% of the sum of the outstanding principal amounts of all subordinated indebtedness included in net capital, par or stated value of capital stock, paid-in capital in excess of par, retained earnings and other capital accounts for a period in excess of 90 days.
Net capital is essentially defined in the Net Capital Rule as net worth (assets minus liabilities), plus qualifying subordinated borrowings minus certain mandatory deductions that result from excluding assets that are not readily convertible into cash and deductions for certain operating charges. The Net Capital Rule values certain other assets, such as a firm's positions in securities, conservatively. Among these deductions are adjustments (referred to as "haircuts") in the market value of securities to reflect the possibility of a market decline prior to disposition.
Compliance with the Net Capital Rule could limit those operations of the brokerage subsidiaries of the Company that require the intensive use of capital, such as underwriting and trading activities and the financing of customer account balances, and also could restrict the Company's ability to withdraw capital from its brokerage subsidiaries, which in turn could limit the Company's ability to pay dividends, repay debt and redeem or purchase shares of its outstanding capital stock. Under the Net Capital Rule, broker-dealers are required to maintain certain records and provide the SEC with quarterly reports with respect to, among other things, significant movements of capital, including transfers to a holding company parent or other affiliate. The SEC and/or SROs may in certain circumstances restrict the Company's brokerage subsidiaries' ability to withdraw excess net capital and transfer it to the Company or to other Operating Subsidiaries or to expand the Company's business.
Oppenheimer Europe Ltd. is authorized by the FCA of the United Kingdom to provide investment services under the Markets of Financial Instruments Directive ("MiFID"). New Basel III requirements being implemented in the European Union have changed how capital adequacy is reported under the Capital Requirements Directive ("CRD IV"), effective January 1, 2014, for Oppenheimer Europe Ltd. There are three capital ratios Oppenheimer Europe Ltd. must meet: 1) Common Equity Tier 1 ratio of 4.5%; 2) Tier 1 Capital ratio of 6.0%; and 3) Total Capital ratio of 8.0%.
Oppenheimer Investments Asia Limited was approved by the SFC to place securities of U.S. listed companies with institutional clients and to provide corporate finance advisory services to Hong Kong institutional clients. Oppenheimer Investments Asia Limited is required to maintain Required Liquid Capital of the greater of HKD 3.0 million or 5% of Adjusted Liabilities as defined by the Hong Kong Securities and Futures Financial Resources Rules.
11
OMHHF was approved to be a non-supervised HUD mortgagee under Title II of the U.S. Department of Housing and Urban Development ("HUD"). To maintain its status as an approved lender for HUD, OMHHF is required to meet and maintain various eligibility criteria established by HUD, such as minimum net worth, operational liquidity and collateral requirements. At December 31, 2015, OMHHF was required to maintain a minimum net worth of $2.5 million.
See Note 17 to the consolidated financial statements for the year ended December 31, 2015 appearing in Item 8 for further information on the Company's regulatory capital requirements.
OTHER REQUIREMENTS
Senior Secured Notes
On April 12, 2011, the Company completed the private placement of $200.0 million in aggregate principal amount of 8.75% Senior Secured Notes due April 15, 2018 (the "Notes") at par. The interest on the Notes is payable semi-annually on April 15th and October 15th. On April 15, 2014, the Company partially retired and redeemed the Notes and $150.0 million aggregate principal amount of the Notes remains outstanding.
The indenture for the Notes contains covenants which place restrictions on the incurrence of indebtedness, the payment of dividends, sale of assets, mergers and acquisitions and the granting of liens. The Notes provide for events of default including nonpayment, misrepresentation, breach of covenants and bankruptcy. The Company's obligations under the Notes are guaranteed, subject to certain limitations. These guarantees may be shared, on a senior basis, under certain circumstances, with newly incurred debt outstanding in the future. At December 31, 2015, the Company was in compliance with all of its covenants. On June 17, 2015, S&P affirmed the Company's and its Notes' "B" rating and affirmed its stable outlook on the Notes. On December 28, 2015, Moody's Corporation affirmed the Company's 'B2' Corporate Family rating and 'B2' rating on the Notes and revised its outlook from stable to positive.
Other debt
Through OMHHF, which is engaged in commercial mortgage origination and servicing, the Company utilizes an uncommitted warehouse facility line through PNC Bank ("PNC") under which OMHHF pledges FHA-guaranteed mortgages for a period averaging 15 business days and PNC table funds the principal payment to the mortgagee. The obligations of OMHHF under this facility are guaranteed by OMHHF’s parent, E.A. Viner International Co. OMHHF repays PNC upon the securitization of the mortgage by the GNMA and the delivery of the security to the counter-party for payment pursuant to a contemporaneous sale on the date the mortgage is securitized. The Company's ability to originate mortgage loans depends upon our ability to secure and maintain these types of short-term financings on acceptable terms.
Oppenheimer and Freedom are each members of the Securities Investor Protection Corporation ("SIPC"), which provides, in the event of the liquidation of a broker-dealer, protection for customers' accounts (including the customer accounts of other securities firms when it acts on their behalf as a clearing broker) held by the firm of up to $500,000 for each customer, subject to a limitation of $250,000 for claims for cash balances. SIPC is funded through assessments on registered broker-dealers. In addition, Oppenheimer has purchased additional "excess of SIPC" policy protection from certain underwriters at Lloyd's of London of an additional $99.5 million (and $900,000 for claims for cash balances) per customer. The "excess of SIPC" policy has an overall aggregate limit of liability of $400.0 million. The Company has entered into an indemnity agreement with Lloyd's of London pursuant to which the Company has agreed to indemnify Lloyd's of London for losses incurred by Lloyd's under the policy.
AVAILABLE INFORMATION
The Company's principal place of business is at 85 Broad Street, New York, NY 10004 and its telephone number is (212) 668-8000. The Company's internet address is http://www.opco.com. The Company makes available free of charge through its website its Annual Report on Form 10-K, Quarterly Reports on Form 10-Q, Current Reports on Form 8-K, proxy and information statements and other SEC filings and all amendments to those reports within 24 hours of such material being electronically filed with or furnished to the SEC.
You may read and copy this Annual Report on Form 10-K for the year ended December 31, 2015 at the SEC's Public Reference Room at 100 F Street, N.E., Washington, D.C. 20549. You may also obtain copies by mail from the Public Reference Room of the SEC at prescribed rates. To obtain information on the operation of the Public Reference Room, you can call the SEC at 1-800-SEC-0330. The SEC also maintains an internet website that contains reports, proxy and information statements and other information regarding issuers, including Oppenheimer Holdings Inc., that file electronically with the SEC. The address of the SEC's internet website is http://www.sec.gov.
12
Item 1A. RISK FACTORS
The Company's business and operations are subject to numerous risks. The material risks and uncertainties that management believes affect the Company are described below. The risks and uncertainties described below are not the only ones facing the Company. Additional risks and uncertainties that management is not aware of or focused on or that management currently deems immaterial may also impair the Company's business operations. If any of the following risks actually occur, the Company's financial condition and results of operations may be materially and adversely affected.
The Company may continue to be adversely affected by the failure of the Auction Rate Securities Market.
In February 2008, the market for auction rate securities ("ARS") began experiencing disruptions due to the failure of auctions for preferred stocks issued to leverage closed end funds, municipal bonds backed by tax exempt issuers, and student loans backed by pools of student loans guaranteed by U.S. government agencies. This failure followed an earlier failure of a smaller market of ARS that were backed by mortgage and other forms of derivatives in the summer of 2007. These auction failures developed as a result of auction managers or dealers, typically large commercial or investment banks, deciding not to commit their own capital when there was insufficient demand from bidders to meet the supply of sales from sellers. The failure of the ARS market has prevented clients of the Company from liquidating holdings in these positions or, in many cases, posting these securities as collateral for loans. The Company had operated in an agency capacity in this market and held and continues to hold ARS in its proprietary accounts and, as a result of this and the Company’s ongoing repurchases from customers discussed below, is exposed to these liquidity issues as well. The Company believes that, although issuer redemptions of ARS have occurred, approximately 10% of the overall ARS issued into the ARS market remained outstanding at December 31, 2015. There is no guarantee that further ARS issuer redemptions will occur and, if so, that the Company's clients' ARS will be redeemed.
Regulators have concluded, in many cases, firms that operate in the securities industry, initially those that underwrote and supported the auctions for ARS, should be compelled to purchase them from retail customers. Underwriters and broker-dealers in such securities have settled with various regulators and have purchased ARS from their retail clients. The Company may be at a competitive disadvantage to those of its competitors that have already completed purchases of ARS from their clients.
In February 2010, Oppenheimer finalized settlements with each of the New York Attorney General's office ("NYAG") and the Massachusetts Securities Division ("MSD" and, together with the NYAG, the "Regulators") concluding investigations and administrative proceedings concerning Oppenheimer's marketing and sale of ARS. Pursuant to the settlements with the Regulators, Oppenheimer agreed to extend offers to repurchase ARS from certain of its clients subject to certain terms and conditions. In addition to the settlements with the Regulators, Oppenheimer has also reached settlements of and received adverse awards in legal proceedings with various clients where the Company is obligated to purchase ARS. The ultimate amount of ARS to be repurchased by the Company under the settlements with the Regulators or legal settlements and awards cannot be predicted with any certainty and will be impacted by redemptions by issuers and legal and other actions by clients during the relevant period which cannot be predicted. See Item 7 under the caption "Management's Discussion and Analysis of Financial Condition and Results of Operations – Regulatory Environment – Other Regulatory Matters" and "Off-Balance Sheet Arrangements" for additional details.
If the ARS market remains frozen, the Company may likely be further subject to claims by its clients. There can be no guarantee that the Company will be successful in defending any future actions against it. Any such failure could have a material adverse effect on the results of operations and financial condition of the Company, including its cash position.
See "Legal Proceedings" and "Management's Discussion and Analysis of Financial Condition and Results of Operations – Regulatory and Legal Environment – Other Regulatory Matters and – Other Matters."
The Company's customers held at Oppenheimer approximately $101.6 million of ARS at December 31, 2015, exclusive of amounts that were owned by Qualified Institutional Buyers ("QIBs"), transferred to the Company or purchased by customers after February 2008, or transferred from the Company to other securities firms after February 2008. The Company does not presently have the capacity to purchase all of the ARS held by all of its former or current clients who purchased such securities prior to the market's failure in February 2008 over a short period of time. If the Company was to be required to purchase all of the ARS held by all former or current clients who purchased such securities prior to the market's failure in February 2008 over a short period of time, these purchases would have a material adverse effect on the Company's results of operations and financial condition including its cash position. Neither of the settlements with the Regulators requires the Company to do so. The Company does not currently believe that it is legally obligated to make any such purchases except for those purchases it has agreed with the Regulators to make as previously disclosed. If Oppenheimer defaults on either agreement with the Regulators, the Regulators may terminate their agreements and may reinstitute the previously pending administrative proceedings. In
13
addition, there can be no guarantee that other regulators won't seek to compel the Company to repurchase a greater amount of ARS than called for by the settlements with the Regulators. See "Legal Proceedings."
The Company has sought, with very limited success, financing from a number of sources to try to find a means for all its clients to find liquidity from their ARS holdings and will continue to do so. There can be no assurance that the Company will be successful in finding a liquidity solution for all its clients' ARS holdings.
Damage to our reputation could damage our businesses.
Maintaining our reputation is critical to our attracting and maintaining customers, investors and employees. If we fail to deal with, or appear to fail to deal with, various issues that may give rise to reputational risk, we could significantly harm our business prospects. These issues include, but are not limited to, any of the risks discussed in this Item 1A, appropriately dealing with potential conflicts of interest, legal and regulatory requirements, ethical issues, money-laundering, privacy, record keeping, sales and trading practices, failure to sell securities we have underwritten at the anticipated price levels, and the proper identification of the legal, reputational, credit, liquidity, and market risks inherent in our products. A failure to deliver appropriate standards of service and quality, or a failure or perceived failure to treat customers and clients fairly, can result in customer dissatisfaction, litigation and heightened regulatory scrutiny, all of which can lead to lost revenue, higher operating costs and harm to our reputation. Further, negative publicity regarding us, whether or not true, may also result in harm to our prospects. Increasingly, the internet, through investor blogs or other sites, is being used to publish information that is untrue, significantly skewed or in some cases slanderous about companies and individuals that are published anonymously and are all but impossible to refute. Such stories can negatively impact the reputation of companies that are the subject of such attacks. See "The precautions the Company takes to prevent and detect employee misconduct may not be effective and the Company could be exposed to unknown and unmanaged risks or losses."
Developments in market and economic conditions have adversely affected, and may in the future adversely affect, the Company's business and profitability.
Performance in the financial services industry is heavily influenced by the overall strength of economic conditions and financial market activity, which generally have a direct and material impact on the Company's results of operations and financial condition. These conditions are a product of many factors, which are mostly unpredictable and beyond the Company's control, and may affect the decisions made by financial market participants. Uncertain or unfavorable market or economic conditions could result in reduced transaction volumes, reduced revenue and reduced profitability in any or all of the Company's principal businesses. For example:
• | The Company's investment banking revenue, in the form of underwriting, placement and financial advisory fees, is directly related to the volume and value of transactions as well as the Company's role in these transactions. In an environment of uncertain or unfavorable market or economic conditions such as we have observed in recent years, the volume and size of capital-raising transactions and acquisitions and dispositions typically decrease, thereby reducing the demand for the Company's investment banking services and increasing price competition among financial services companies seeking such engagements. The completion of anticipated investment banking transactions in the Company's pipeline is uncertain and beyond its control, and its investment banking revenue is typically earned upon the successful completion of a transaction. In most cases, the Company receives little or no payment for investment banking engagements that do not result in the successful completion of a transaction. For example, a client's acquisition transaction may be delayed or terminated because of a failure to agree upon final terms with the counterparty, failure to obtain necessary regulatory consents or board or stockholder approvals, failure to secure necessary financing, adverse market conditions or unexpected financial or other problems in the client's or counterparty's business. If the parties fail to complete a transaction on which the Company is advising or an offering in which it is participating, the Company will earn little or no revenue from the transaction but may incur expenses including but not limited to legal fees. The Company may perform services subject to an engagement agreement and the client may refuse to pay fees due under such agreement, requiring the Company to re-negotiate fees or commence legal action for collection of such earned fees. Accordingly, the Company's business is highly dependent on market conditions, the decisions and actions of its clients and interested third parties. The number of engagements the Company has at any given time is subject to change and may not necessarily result in future revenues. |
• | A portion of the Company's revenues are derived from fees generated from its asset management business segment. Asset management fees often are primarily comprised of base management and performance (or incentive) fees. Management fees are primarily based on assets under management. Assets under management balances are impacted by net inflow/outflow of client assets and changes in market values. Poor investment performance by the Company's funds and portfolio managers could result in a loss of managed accounts and could |
14
result in reputational damage that might make it more difficult to attract new investors and thus further impact the Company's business and financial condition. If the Company experiences losses of managed accounts, fee revenue will decline. In addition, in periods of declining market values, the values under management may ultimately decline, which would negatively impact fee revenues.
• | A downturn in the financial markets may result in a decline in the volume and value of trading transactions and, therefore, may lead to a decline in the revenue the Company generates from commissions on the execution of trading transactions and, in respect of its market-making activities, a reduction in the value of its trading positions and commissions and spreads. A further downturn could negatively impact the Company's ability to generate revenue. |
• | Financial markets are susceptible to severe events such as dislocations which may lead to reduced liquidity. Under these extreme conditions, the Company's risk management strategies may not be as effective as they might otherwise be under normal market conditions. |
• | Liquidity is essential to the Company's businesses. The Company's liquidity could be negatively affected by an inability to obtain funding on a regular basis either in the short term market through bank borrowing or in the long term market through senior and subordinated borrowings. Such illiquidity could arise through a lowering of the Company's credit rating or through market disruptions unrelated to the Company. The availability of unsecured financing is largely dependent on our credit rating which is largely determined by factors such as the level and quality of our earnings, capital adequacy, risk management, asset quality and business mix. As noted above, the Company has purchased, and will continue to purchase, auction rate securities from its clients which will reduce liquidity available to the Company for other purposes. The failure to secure the liquidity necessary for the Company to operate and grow could have a material adverse effect on the Company's financial condition and results of operations. See "Management's Discussion and Analysis of Financial Condition and Results of Operations - Liquidity and Capital Resources," under Item 7. |
• | Changes in interest rates (especially if such changes are rapid), high interest rates or uncertainty regarding the future direction of interest rates, may create a less favorable environment for certain of the Company's businesses, particularly its fixed income business, resulting in reduced business volume and reduced revenue. |
• | The reduction of interest rates to all-time record lows has substantially reduced the interest profits available to the Company through its margin lending and has also reduced profit contributions from money fund products and sponsored FDIC-covered deposits. If interest rates remain at low levels, despite an initial move upward by the Federal Reserve, the Company's profitability will continue to be significantly negatively impacted. |
• | The Company expects to continue to commit its own capital to engage in proprietary trading, investing and similar activities, and uncertain or unfavorable market or economic conditions may reduce the value of its positions, resulting in reduced revenue. |
The cyclical nature of the economy and the financial services industry leads to volatility in the Company's operating margins, due to the fixed nature of a portion of compensation expenses and many non-compensation expenses, as well as the possibility that the Company will be unable to scale back other costs at an appropriate time to match any decreases in revenue relating to changes in market and economic conditions. As a result, the Company's financial performance may vary significantly from quarter to quarter and year to year.
Markets have experienced, and may continue to experience, periods of high volatility accompanied by reduced liquidity.
Financial markets are susceptible to severe events evidenced by rapid depreciation in asset values accompanied by a reduction in asset liquidity. Under these extreme conditions, hedging and other risk management strategies may not be effective. Severe market events have historically been difficult to predict, and significant losses could be realized in the wake of such events. The "Flash Crash" on May 6, 2010 was driven not by external economic events but by internal market dynamics and automated systems. Such events cannot be predicted nor can anyone, including the Company, predict the effectiveness of controls put in place to prevent such incidents. Increasingly, threats of terrorism and terrorist acts have disrupted markets and increased the perception of risk to the worldwide economy. Any such act or threat may impact markets, and consequently the Company's business, in an adverse manner.
15
The Company has experienced significant pricing pressure in areas of its business, which may impair its revenues and profitability.
In recent years the Company has experienced, and continues to experience, significant pricing pressures on trading margins and commissions in debt and equity trading. In the fixed income market, regulatory requirements have resulted in greater price transparency, leading to increased price competition and decreased trading margins. In the equity market, the Company has experienced increased pricing pressure from institutional clients to reduce commissions, and this pressure has been augmented by the increased use of electronic and direct market access trading, which has created additional downward pressure on trading margins. The trend toward using alternative trading systems is continuing to grow, which may result in decreased commission and trading revenue, reduce the Company's participation in the trading markets and its ability to access market information, and lead to the creation of new and stronger competitors. Institutional clients also have pressured financial services firms to alter "soft dollar" practices under which brokerage firms bundle the cost of trade execution with research products and services. Some institutions are entering into arrangements that separate (or "unbundle") payments for research products or services from sales commissions. These arrangements have increased the competitive pressures on sales commissions and have affected the value the Company's clients place on high-quality research. Moreover, the Company's inability to reach agreement regarding the terms of unbundling arrangements with institutional clients who are actively seeking such arrangements could result in the loss of those clients, which would likely reduce the level of institutional commissions. The Company believes that price competition and pricing pressures in these and other areas will continue as institutional investors continue to reduce the amounts they are willing to pay, including reducing the number of brokerage firms they use, and some of our competitors seek to obtain market share by reducing fees, commissions or margins. Additional pressure on sales and trading revenue may impair the profitability of the Company's business.
The ability to attract, develop and retain highly skilled and productive employees is critical to the success of the Company's business.
The Company faces intense competition for qualified employees from other businesses in the financial services industry, and the performance of its business may suffer to the extent it is unable to attract and retain employees effectively, particularly given the relatively small size of the Company and its employee base compared to some of its competitors. The primary sources of revenue in each of the Company's business lines are commissions and fees earned on advisory and underwriting transactions and customer accounts managed by its employees, who are regularly recruited by other firms and in certain cases are able to take their client relationships with them when they change firms. Experienced employees are regularly offered financial inducements by larger competitors to change employers, and thus competitors can de-stabilize the Company's relationship with valued employees. Some specialized areas of the Company's business are operated by a relatively small number of employees, the loss of any of whom could jeopardize the continuation of that business following the employee's departure.
The Company depends on its senior employees and the loss of their services could harm its business.
The Company's success is dependent in large part upon the services of its senior executives and employees. Any loss of service of the CEO may adversely affect the business and operations of the Company. The Company maintains key man insurance on the life of its CEO. If the Company's senior executives or employees terminate their employment and the Company is unable to find suitable replacements in relatively short periods of time, its operations may be materially and adversely affected.
Underwriting and market-making activities may place capital at risk.
The Company may incur losses and be subject to reputational harm to the extent that, for any reason, it is unable to sell securities it purchased as an underwriter at the anticipated price levels. As an underwriter, the Company is subject to heightened standards regarding liability for material misstatements or omissions in prospectuses and other offering documents relating to offerings it underwrites. Any such misstatement or omission could subject the Company to enforcement action by the SEC and claims of investors, either of which could have a material adverse impact on the Company's results of operations, financial condition and reputation. As a market maker, the Company may own large positions in specific securities, and these undiversified holdings concentrate the risk of market fluctuations and may result in greater losses than would be the case if the Company's holdings were more diversified.
16
Increases in capital commitments in our proprietary trading, investing and similar activities increase the potential for significant losses.
The Company's results of operations for a given period may be affected by the nature and scope of these activities and such activities will subject the Company to market fluctuations and volatility that may adversely affect the value of its positions, which could result in significant losses and reduce its revenues and profits. In addition, increased commitment of capital will expose the Company to the risk that a counter-party will be unable to meet its obligations, which could lead to financial losses that could adversely affect the Company's results of operations. These activities may lead to a greater concentration of risk, which may cause the Company to suffer losses even when business conditions are generally favorable for others in the industry.
If the Company is unable to repay its outstanding indebtedness when due, its operations would be materially adversely affected.
At December 31, 2015, the Company had liabilities of approximately $2.2 billion, a significant portion of which is collateralized by highly liquid and marketable government securities as well as marketable securities owned by customers. The Company cannot assure that its operations or the liquidation of collateral supporting such borrowings will generate funds sufficient to repay its existing debt obligations as they come due. The Company's failure to repay its indebtedness and make interest payments as required by its debt obligations would most likely have a material adverse effect on its results of operations and financial condition.
The Company may make strategic acquisitions of businesses, engage in joint ventures or divest or exit existing businesses, which could result in unforeseen expenses or disruptive effects on its business.
From time to time, the Company may consider acquisitions of other businesses or joint ventures with other businesses. For example, on January 14, 2008, the Company acquired certain businesses from CIBC World Markets Corp. Any acquisition or joint venture that the Company determines to pursue will be accompanied by a number of risks. After the announcement or completion of an acquisition or joint venture, the Company's share price could decline if investors view the transaction as too costly or unlikely to improve the Company's competitive position. Costs or difficulties relating to such a transaction, including integration of products, employees, offices, technology systems, accounting systems and management controls, may be difficult to predict accurately and be greater than expected causing the Company's estimates to differ from actual results. The Company may be unable to retain key personnel after the transaction, and the transaction may impair relationships with customers and business partners. In addition, the Company may be unable to achieve anticipated benefits and synergies from the transaction as fully as expected or within the expected time frame. Divestitures or elimination of existing businesses or products could have similar effects, including the loss of earnings of the divested business or operation. These difficulties could disrupt the Company's ongoing business, increase its expenses and adversely affect its operating results and financial condition.
The Company is subject to extensive securities regulation and the failure to comply with these regulations could subject it to penalties or sanctions.
The securities industry and the Company's business are subject to extensive regulation by the SEC, state securities regulators and other governmental regulatory authorities. The Company is also regulated by industry self-regulatory organizations, including FINRA, NFA, and the MSRB. The Company may be adversely affected by changes in the interpretation or enforcement of existing laws and rules by these governmental authorities and self-regulatory organizations. The regulatory environment is subject to change and the Company may be adversely affected as a result of new or revised legislation or regulations imposed by the SEC, other federal or state governmental regulatory authorities, or self-regulatory organizations. In response to the financial crisis of 2008-2009, the regulatory environment to which the Company is subjected is expected to further intensify as additional rules and regulations are adopted by the Company's regulators. These new regulations will likely increase costs related to compliance and may in other ways adversely affect the performance of the Company.
Oppenheimer is a broker-dealer and investment adviser registered with the SEC and is primarily regulated by FINRA. Broker-dealers are subject to regulations which cover all aspects of the securities business, including:
• | sales methods and supervision; |
• | trading practices among broker-dealers; |
• | emerging standards concerning fees and charges imposed on clients for fee-based programs; |
• | use and safekeeping of customers' funds and securities; |
• | anti-money laundering and Patriot Act compliance; |
• | capital structure of securities firms; |
17
• | cybersecurity; |
• | pricing of services; |
• | compliance with lending practices (Regulation T); |
• | record keeping; and |
• | the conduct of directors, officers and employees. |
Compliance with many of the regulations applicable to the Company involves a number of risks, particularly in areas where applicable regulations may be subject to varying interpretation. The requirements imposed by these regulations are designed to ensure the integrity of the financial markets and to protect customers and other third parties who deal with the Company. New regulations will result in enhanced standards of duty on broker dealers in their dealings with their clients (fiduciary standards). Consequently, these regulations often serve to limit the Company's activities, including through net capital, customer protection and market conduct requirements, including those relating to principal trading. Much of the regulation of broker-dealers has been delegated to self-regulatory organizations, principally FINRA, which is the Company's primary regulatory agency. FINRA adopts rules, subject to approval by the SEC, which govern its members and conducts periodic examinations of member firms' operations. However, recently the SEC has significantly increased its direct oversight of registrants in areas that directly overlap with FINRA thereby increasing the Company's costs of compliance and increasing the risks associated with compliance with emerging standards.
The SEC has passed a requirement for custodians of securities on behalf of investment advisers, such as the Company, to conduct an annual "surprise audit", in addition to the annual audit, and to issue an annual controls report to its clients, issued by a qualified accounting firm, describing its processes and controls affecting custody operations. A failure to conduct such an audit or issue the report with favorable findings could adversely affect a sizable portion of the Company's businesses.
If the Company is found to have violated any applicable regulations, formal administrative or judicial proceedings may be initiated against it that may result in:
• | censure; |
• | fine; |
• | civil penalties, including treble damages in the case of insider trading violations; |
• | the issuance of cease-and-desist orders; |
• | the deregistration or suspension of our broker-dealer activities; |
• | the suspension or disqualification of our officers or employees; or |
• | other adverse consequences. |
The imposition of any of these or other penalties could have a material adverse effect on our operating results and financial condition. For a more detailed description of the regulatory scheme under which the Company operates, see Item 1 under the caption "Regulation" and Item 7 under the caption "Management's Discussion and Analysis of Financial Condition and Results of Operations - Regulation."
Financial services firms have been subject to increased regulatory scrutiny over the last several years, increasing the risk of financial liability and reputational harm resulting from adverse regulatory actions.
Firms in the financial services industry have been operating in an onerous regulatory environment, which will become even more stringent in light of recent well-publicized fraud or "Ponzi" schemes. The industry has experienced increased scrutiny from a variety of regulators, including the SEC and FINRA and state attorneys general. Penalties and fines sought by regulatory authorities have increased substantially over the last several years. We may be adversely affected by changes in the interpretation or enforcement of existing laws and rules by these governmental authorities and SROs. Each of the regulatory bodies with jurisdiction over us has regulatory powers dealing with many different aspects of financial services, including, but not limited to, the authority to fine us and to grant, cancel, restrict or otherwise impose conditions on the right to continue operating particular businesses. For example, the failure to comply with the obligations imposed by the Exchange Act on broker-dealers and the Investment Advisers Act of 1940 on investment advisers, including recordkeeping, advertising and operating requirements, disclosure obligations and prohibitions on fraudulent activities, or by the Investment Company Act of 1940 (the "1940 Act"), could result in investigations, sanctions and reputational damage. We also may be adversely affected as a result of new or revised legislation or regulations imposed by the SEC, other U.S. or foreign governmental regulatory
18
authorities or SROs (e.g., FINRA) that supervise the financial markets. Substantial legal liability or significant regulatory action taken against us could have a material adverse effect on our business prospects including our cash position.
Changes in regulations resulting from either the Dodd-Frank Act or any new regulations or laws may affect our businesses.
The market and economic conditions over the past several years have directly led to a demand by the public for changes in the way the financial services industry is regulated, including a call for more stringent legislation and regulation in the United States and abroad. The Dodd-Frank Act enacted sweeping changes and an unprecedented increase in the supervision and regulation of the financial services industry (see Item 1 under the caption "Regulation" for a discussion of such changes, including the Volcker Rule). The ultimate impact that the Dodd-Frank Act will have on us, the financial industry and the economy at large cannot be specifically ascertained until all of the implementing regulations called for under the legislation have been finalized and fully implemented. Nevertheless, it is apparent that these legislative and regulatory changes could affect our revenue, limit our ability to pursue business opportunities, impact the value of our assets, require us to alter at least some of our business practices, impose additional costs, and otherwise adversely affect our businesses The Dodd-Frank Act impacts the manner in which we market our products and services, manage our business and operations, and interact with regulators, all of which could materially impact our results of operations, financial condition and liquidity. Certain provisions of the Dodd-Frank Act that have or may impact our businesses include: the establishment of a fiduciary standard for broker-dealers; regulatory oversight of incentive compensation; the imposition of capital requirements on financial holding companies and to a lesser extent, greater oversight over derivatives trading; and restrictions on proprietary trading. To the extent the Dodd-Frank Act impacts the operations, financial condition, liquidity and capital requirements of unaffiliated financial institutions with whom we transact business, those institutions may seek to pass on increased costs, reduce their capacity to transact, or otherwise present inefficiencies in their interactions with us.
Legislation has and may continue to result in changes to rules and regulations applicable to our business, which may negatively impact our business and financial results.
The U.S. Department of Labor ("DOL") continues to pursue regulations seeking to change the definition of who is an investment advice fiduciary under the Employee Retirement Income Security Act of 1974 (ERISA) and how such advice can be provided to account holders in retirement accounts such as pension plans, 401(k) plans and IRAs. In addition, the SEC is also pursuing their own rules around a uniform fiduciary standard which could conflict with the DOL's rulemaking. Additional rulemaking or legislative action could negatively impact the Company's business and financial results. As the DOL regulations are not yet in effect, it is difficult to determine what impact this will have on our compliance costs, business, operations and profitability.
Failure to comply with net capital requirements could subject the Company to suspension or revocation by the SEC or suspension or expulsion by FINRA, the FCA and the SFC.
Oppenheimer and Freedom are subject to the SEC's Net Capital Rule which requires the maintenance of minimum net capital. For a more detailed description of the regulatory scheme under which the Company operates, see Item 1 under the caption "Net Capital Requirements." Failure to comply with net capital requirements could subject the Company to suspension or revocation by the SEC or suspension or expulsion by FINRA.
In addition, Oppenheimer Europe Ltd. and Oppenheimer Investments Asia Limited are regulated by the FCA of the United Kingdom and the SFC in Hong Kong, respectively. Failure of these entities to comply with net capital requirements could subject those entities to suspension or expulsion by their respective regulators.
If the Company violates the securities laws, or is involved in litigation in connection with a violation, the Company's reputation and results of operations may be adversely affected.
Many aspects of the Company's business involve substantial risks of liability. An underwriter is exposed to substantial liability under federal and state securities laws, other federal and state laws, and court decisions, including decisions with respect to underwriters' liability and limitations on indemnification of underwriters by issuers. For example, a firm that acts as an underwriter may be held liable for material misstatements or omissions of fact in a prospectus used in connection with the securities being offered or for statements made by its securities analysts or other personnel. In recent years, there has been an increasing incidence of litigation involving the securities industry, including class actions that seek substantial damages. The Company's underwriting activities will usually involve offerings of the securities of smaller companies, which often involve a higher degree of risk and are more volatile than the securities of more established companies. In comparison with more established companies, smaller companies are also more likely to be the subject of securities class actions, to carry directors and officers liability insurance policies with lower limits or not at all, and to become insolvent. In addition, in market downturns,
19
claims tend to increase. Each of these factors increases the likelihood that an underwriter may be required to contribute to an adverse judgment or settlement of a securities lawsuit.
In the normal course of business, the Operating Subsidiaries have been and continue to be the subject of numerous civil actions and arbitrations arising out of customer complaints relating to our activities as a broker-dealer, as an employer and as a result of other business activities. In turbulent times such as in recent years, the volume of claims and amount of damages sought in litigation and regulatory proceedings against financial institutions have historically escalated. The Company has experienced an increase in such claims as a result of the recent worldwide credit disruptions, including the disruptions in the auction rate securities market in 2008. If the Company misjudged the amount of damages that may be assessed against it from pending or threatened claims, or if the Company is unable to adequately estimate the amount of damages that will be assessed against it from claims that arise in the future and reserve accordingly, its financial condition and results of operations may be materially adversely affected. See Item 1A under the caption "Risk Factors – The Company may continue to be adversely affected by the failure of the Auction Rate Securities Market," as well as Item 3 under the caption "Legal Proceedings" and Item 7 under the caption "Management's Discussion and Analysis of Financial Condition and Results of Operations – Regulatory Environment – Other Regulatory Matters."
The preparation of the consolidated financial statements requires the use of estimates that may vary from actual results.
If actual experience differs from management's estimates used in the preparation of financial statements, the Company's consolidated results of operations or financial condition could be adversely affected. The preparation of financial statements in conformity with accounting principles generally accepted in the United States requires the application of accounting policies that often involve a significant degree of judgment. Such estimates and assumptions may require management to make difficult, subjective and complex judgments about matters that are inherently uncertain. The Company's accounting policies that are most dependent on the application of estimates and assumptions, and therefore viewed by the Company as critical accounting estimates, are those described in Note 2 to the consolidated financial statements for the year ended December 31, 2015 appearing in Item 8. These accounting estimates require the use of assumptions, some of which are highly uncertain at the time of estimation. These estimates, by their nature, are based on judgment and current facts and circumstances. Accordingly, actual results could differ from these estimates, possibly in the near term, and could have a material adverse effect on the consolidated financial statements.
The value of the Company's goodwill and intangible assets may become impaired.
A substantial portion of the Company's assets arise from goodwill and intangibles recorded as a result of business acquisitions it has made. The Company is required to perform a test for impairment of such goodwill and intangible assets, at least annually. To the extent that there are continued declines in the markets and general economy, impairment may become more likely. If the test resulted in a write-down of goodwill and/or intangible assets, the Company would incur a significant loss. For further discussion of this risk, see Note 18 to the consolidated financial statements for the year ended December 31, 2015 appearing in Item 8.
The Company's risk management policies and procedures may leave it exposed to unidentified risks or an unanticipated level of risk.
The policies and procedures the Company employs to identify, monitor and manage risks may not be fully effective. Some methods of risk management are based on the use of observed historical market behavior. As a result, these methods may not predict future risk exposures, which could be significantly greater than historical measures indicate. Other risk management methods depend on evaluation of information regarding markets, clients or other matters that are publicly available or otherwise accessible. This information may not be accurate, complete or up-to-date or properly evaluated. Management of operational, legal and regulatory risk requires, among other things, policies and procedures to properly record and verify a large number of transactions and events. The Company cannot give assurances that its policies and procedures will effectively and accurately record and verify this information. See Item 7A, "Quantitative and Qualitative Disclosures About Market Risk."
The Company seeks to monitor and control its risk exposure through a variety of separate but complementary financial, credit, operational, compliance and legal reporting systems. The Company believes that it effectively evaluates and manages the market, credit and other risks to which it is exposed. Nonetheless, the effectiveness of the Company's ability to manage risk exposure can never be completely or accurately predicted or fully assured. For example, unexpectedly large or rapid movements or disruptions in one or more markets or other unforeseen developments can have a material adverse effect on the Company's financial condition and results of operations. The consequences of these developments can include losses due to adverse changes in securities values, decreases in the liquidity of trading positions, higher volatility in earnings, increases in the Company's credit risk to customers as well as to third parties and increases in general systemic risk. In addition, certain of the
20
Company’s risk management systems are subject to regulatory review and may be found to be insufficient by the Company’s regulators potentially leading to regulatory sanctions.
Credit risk may expose the Company to losses caused by the inability of borrowers or other third parties to satisfy their obligations.
The Company is exposed to the risk that third parties that owe it money, securities or other assets will not perform their obligations. These parties include:
• | trading counterparties; |
• | customers; |
• | clearing agents; |
• | exchanges; |
• | clearing houses; and |
• | other financial intermediaries as well as issuers whose securities we hold. |
These parties may default on their obligations owed to the Company due to bankruptcy, lack of liquidity, operational failure or other reasons. This default risk may arise, for example, from:
• | holding securities of third parties; |
• | executing securities trades that fail to settle at the required time due to non-delivery by the counterparty or systems failure by clearing agents, exchanges, clearing houses or other financial intermediaries; and |
• | extending credit to clients through bridge or margin loans or other arrangements. |
Significant failures by third parties to perform their obligations owed to the Company could adversely affect the Company's revenue and its ability to borrow in the credit markets.
Risks related to insurance programs.
The Company's operations and financial results are subject to risks and uncertainties related to the use of a combination of insurance, self-insured retention and self-insurance for a number of risks, including most significantly property and casualty, general liability, workers' compensation, and the portion of employee-related health care benefits plans funded by the Company, and certain errors and omissions liability, among others.
While the Company endeavors to purchase insurance coverage that is appropriate to its assessment of risk, it is unable to predict with certainty the frequency, nature or magnitude of claims for direct or consequential damages. The Company's business may be negatively affected if in the future its insurance proves to be inadequate or unavailable. In addition, insurance claims may divert management resources away from operating the business.
The precautions the Company takes to prevent and detect employee misconduct may not be effective and the Company could be exposed to unknown and unmanaged risks or losses.
The Company runs the risk that employee misconduct could occur. Misconduct by employees could include:
• | employees binding the Company to transactions that exceed authorized limits or present unacceptable risks to the Company (rogue trading); |
• | employee theft and improper use of Company or client property; |
• | employees conspiring with third parties to defraud the Company; |
• | employees hiding unauthorized or unsuccessful activities from the Company, including outside business activities that are undisclosed and may result in liability to the Company; |
• | the improper use of confidential information; or |
• | employee conduct outside of acceptable norms including harassment. |
These types of misconduct could result in unknown and unmanaged risks or losses to the Company including regulatory sanctions and serious harm to its reputation. The precautions the Company takes to prevent and detect these activities may not be effective. If employee misconduct does occur, the Company's business operations could be materially adversely affected.
21
There have been a number of highly-publicized cases involving fraud or other misconduct by employees in the financial services industry, and there is a risk that our employees could engage in misconduct that adversely affects our business. The Company has experienced employee misconduct which has led to regulatory sanctions and legal liability that has adversely affected our results. We remain subject to a number of obligations and standards arising from our asset management business and our authority over the assets managed by our asset management business. In addition, our financial advisors may act in a fiduciary capacity, providing financial planning, investment advice and discretionary asset management. The violation of these obligations and standards by any of our employees could adversely affect our clients and us. It is not always possible to deter employee misconduct, and the precautions we take to detect and prevent this activity may not be effective in all cases. If our employees engage in misconduct, our business could be materially adversely affected including our cash position.
Defaults by another large financial institution could adversely affect financial markets generally.
In the fourth quarter of 2008, Lehman Brothers filed for bankruptcy protection and financial institutions including the Federal National Mortgage Association, the Federal Home Loan Mortgage Corporation, Citigroup Inc., Bank of America Corporation, and American International Group, Inc. needed to accept substantial funding from the Federal government. In the fourth quarter of 2011, MF Global Holding Ltd. filed for bankruptcy protection. In August 2012, Peregrine Financial Group, Inc. was declared bankrupt and placed in receivership. The commercial soundness of many financial institutions may be closely interrelated as a result of credit, trading, clearing, or other relationships between these institutions. As a result, concerns about, or a default or threatened default by, one institution could lead to significant market-wide liquidity and credit problems, losses, or defaults by other institutions. This is sometimes referred to as "systemic risk" and may adversely affect financial intermediaries, such as clearing agencies, clearing houses, banks, securities firms and exchanges with which the Company interacts on a daily basis, and therefore could adversely affect the Company.
The failure of guarantors could adversely affect the pricing of securities and their trading markets.
Monoline insurance companies, commercial banks and other insurers regularly issue credit enhancements to issuers in order to permit them to receive higher credit ratings than would otherwise be available to them. As a result, the failure of any of these guarantors could and would suddenly and immediately result in the depreciation in the price of the securities that have been guaranteed or enhanced by such entity. This failure could adversely affect the markets in general and the liquidity of the securities that are so affected. This disruption could create losses for holders of affected securities including the Company. In addition, rating agency downgrades of the debt or deposit or claims-paying ability of these guarantors could result in a reduction in the prices of securities held by the Company which are guaranteed by such guarantors.
The Company's information systems may experience an interruption or breach in security.
The Company relies heavily on communications and information systems to conduct its business. Any failure, interruption or breach in security of these systems could result in failures or disruptions in the Company's customer relationship management, general ledger, and other systems. While the Company has policies and procedures designed to prevent or limit the effect of the failure, interruption or security breach of its information systems, there can be no assurance that any such failures, interruptions or security breaches will not occur or, if they do occur, that they will be adequately addressed. Recent disclosures of such incursions by foreign and domestic unauthorized agents aimed at large financial institutions reflect higher risks for all such institutions. The occurrence of any failures, interruptions or security breaches of the Company's information systems could damage the Company's reputation, result in a loss of customer business, subject the Company to additional regulatory scrutiny, or expose the Company to civil litigation and possible financial liability, any of which could have a material adverse effect on the Company's financial condition and results of operations.
Security breaches and other disruptions could compromise the Company's information and expose the Company to liability, which would cause its business and reputation to suffer.
In the ordinary course of business, the Company collects and stores sensitive data, including its proprietary business information and that of its customers, and personally identifiable information of its customers and employees, in its data centers and on its networks. The secure processing, maintenance and transmission of this information is critical to its operations. Despite its security measures, its information technology and infrastructure may be vulnerable to attacks by hackers or breached due to employee error, malfeasance or other disruptions. The recent increase in the number of security breaches at large retailers, credit card companies, movie studios and others reflect higher risk for all companies handling sensitive client data. Any such breach could compromise the Company's networks and the information stored there could be accessed, publicly disclosed, lost or stolen. Any such access, disclosure or other loss of information could result in legal claims or proceedings, liability under laws that protect the privacy of personal information, and regulatory penalties, disrupt its operations and the services the Company provides to customers, damage its reputation, and cause a loss of confidence in its products and services, which could adversely affect its business, revenues and competitive position.
22
The Company may be exposed to damage to its business or its reputation by Cybersecurity incidents.
As the world becomes more interconnected through the use of the internet and users rely more extensively on the internet for the transmission and storage of data, such information becomes more susceptible to incursion by hackers and other parties intent on stealing or destroying data on which the Company or our clients rely. These cybersecurity incidents have increased in number and severity and it is expected that these trends will continue. Should the Company be affected by such an incident, we would be exposed to legal liability, loss of reputation as well as increased costs related to protection of systems and providing relief to clients.
The Company has and continues to introduce systems and software to prevent any such incidents and increasingly reviews and increases its defenses to such issues through the use of various services, programs and outside vendors. It is impossible for the Company to know when or if such incidents may arise or the business impact of any such incident.
The Company continually encounters technological change.
The financial services industry is continually undergoing rapid technological change with frequent introductions of new technology-driven products and services. The effective use of technology increases efficiency and enables financial institutions to better serve customers and reduce costs. The Company's future success depends, in part, upon its ability to address the needs of its customers by using technology to provide products and services that will satisfy customer demands, as well as to create additional efficiencies in the Company's operations. Many of the Company's competitors have substantially greater resources to invest in technological improvements. The Company may not be able to effectively implement new technology-driven products and services or be successful in marketing these products and services to its customers. Failure to successfully keep pace with technological change affecting the financial services industry could have a material adverse impact on the Company's business and, in turn, the Company's financial condition and results of operations.
The business operations that are conducted outside of the United States subject the Company to unique risks and potential loss.
To the extent the Company conducts business outside the United States, it is subject to risks including, without limitation, the risk that it will be unable to provide effective operational support to these business activities, the risk of non-compliance with foreign laws and regulations, the general economic and political conditions in countries where it conducts business and currency fluctuations. The Company operates in Israel, the United Kingdom, the Isle of Jersey, Switzerland and Hong Kong. If the Company is unable to manage these risks relating to its foreign operations effectively, its reputation and results of operations could be harmed.
We may face exposure for environmental liabilities in British Columbia, Canada.
The Company has received notice from the current owner of rural mountainous properties in Canada that the Company may be liable for environmental claims with respect to such properties and that designate it a potentially responsible party in remedial activities for the cleanup of waste sites under applicable statutes. The Company is believed to have held title to various properties near Panorama, British Columbia, Canada from October 1942 through August 1969 and to have engaged in mining and milling operations for some part of that period. The Company was originally incorporated in British Columbia, Canada in 1933, under the name Sheep Creek Gold Mines Limited. The Company underwent a series of name changes and continuances, including from British Columbia to Ontario, from Ontario to Canadian federal jurisdiction and then, in May 2009, from Canada to Delaware.
The Company currently believes that future environmental claims, if any, that may be asserted will not be material and that its potential liability for known environmental matters is not material. However, environmental and related remediation costs are difficult to quantify. Applicable law may impose joint and several liability on each potentially responsible party for the cleanup.
Severe weather, natural disasters, acts of war or terrorism and other external events could significantly impact the Company's business.
Severe weather, natural disasters, acts of war or terrorism and other adverse external events could have a significant impact on the Company's ability to conduct business. Although management has established a disaster recovery plan, there is no guarantee that such plan will allow the Company to operate without disruption if such an event was to occur and the occurrence of any such event could have a material adverse effect on the Company's business, which, in turn, could have a material adverse effect on the Company's financial condition and results of operations. The Company maintains disaster recovery sites to aid it in reacting to circumstances such as those described above. The fourth quarter of 2012 was impacted by Superstorm Sandy which occurred on October 29th causing the Company to vacate its two principal offices in downtown Manhattan and displaced 800 of the Company's employees including substantially all of its capital markets, operations and headquarters staff for in excess of 30
23
days. During the displacement period the Company successfully implemented its business continuity plan by relocating personnel from both of its downtown Manhattan locations into other branch offices and back-up facilities in the region. Other than the closure of the financial markets for two business days, the Company was able to successfully clear and settle open trades that took place prior to the storm and to get its trading, operations, technology, and other support functions mobilized to process business once the financial markets reopened. The plans and preparations for such eventualities, including the sites themselves, may not be adequate or effective for their intended purpose.
The effect of climate changes on the Company cannot be predicted with certainty.
The Company is not directly affected by environmental legislation, regulation or international treaties. The Company is not involved in an industry which is significantly impacted by climate changes except as such changes may affect the general economy of the United States and the rest of the world. Severe weather conditions such as storms, snowfall, and other climatic events may affect one or more offices of the Company. In October 2012, Superstorm Sandy caused dislocation and disruption of the Company's operations. Any such event may materially impact the operations or finances of the Company. The Company maintains Disaster Recovery Plans and property insurance for such emergencies. A significant change in the climate of the world could affect the general growth in the economy, and population growth and create other issues which will over time affect returns on financial instruments and thus the financial markets in general. It is impossible to predict such effects on the Company's business and operations.
The downgrade of U.S. long term sovereign debt obligations and issues affecting the sovereign debt of European nations may adversely affect markets and other business.
On August 5, 2011, Standard & Poor's lowered its long term sovereign credit rating on the United States of America from AAA to AA+. Credit agencies have also reduced the credit ratings of various sovereign nations, including Greece, Italy and France. While the ultimate impact of such action is inherently unpredictable, these downgrades could have a material adverse impact on financial markets and economic conditions throughout the world, including, specifically, the United States. Moreover, the market's anticipation of these impacts could have a material adverse effect on our business, financial condition and liquidity. Various types of financial markets, including, but not limited to, money markets, long-term or short-term fixed income markets, foreign exchange markets, commodities markets and equity markets may be adversely affected by these impacts. In addition, the cost and availability of funding and certain impacts, such as increased spreads in money market and other short term rates, have been experienced already as the market anticipated the downgrade.
The negative impact that may result from this downgrade or any future downgrade could adversely affect our credit ratings, as well as those of our clients and/or counterparties, and could require us to post additional collateral on loans collateralized by U.S. Treasury securities. The unprecedented nature of this and any future negative credit rating actions with respect to U.S. government obligations will make any impact on our business, financial condition and liquidity unpredictable. In addition any such impact may not be immediately apparent.
In addition, global markets and economic conditions have been negatively impacted by the ability of certain European Union ("EU") member states to service their sovereign debt obligations. The continued uncertainty over the outcome of the EU governments' financial support programs and the possibility that other EU member states may experience similar financial troubles could further disrupt global markets and may negatively impact our business, financial condition and liquidity.
The Company's stock price can be volatile.
Stock price volatility may make it difficult for an investor to resell shares of the Company's Class A non-voting common stock (the "Class A Stock") at the times and at the prices desired. The price of the Class A Stock can fluctuate significantly in response to a variety of factors including, among other things:
• | actual or anticipated variations in quarterly results of operations; |
• | operating and stock price performance of other companies that investors deem comparable to the Company; |
• | news reports relating to trends, concerns and other issues in the financial services industry; |
• | perceptions in the marketplace regarding the Company and/or its competitors; |
• | new technology used, or services offered, by competitors; |
• | regulatory issues involving the Company or its competitors; |
• | significant acquisitions or business combinations, strategic partnerships, joint ventures or capital commitments by or involving the Company or its competitors; |
24
• | a downturn in the overall economy or the equity markets in particular; |
• | failure to effectively integrate acquisitions or realize anticipated benefits from acquisitions; and |
• | the occurrence of any of the other events described in these Risk Factors. |
General market fluctuations, industry factors and general economic and political conditions and events, such as economic slowdowns or recessions, interest rate changes or credit loss trends, could also cause the Company's stock price to decrease regardless of operating results.
The trading volume in the Company's Class A Stock is less than that of larger financial services companies.
Although the Company's Class A Stock is listed for trading on the NYSE, the trading volume in its Class A Stock is less than that of larger financial services companies. A public trading market having the desired characteristics of depth, liquidity and orderliness depends on the presence in the marketplace of willing buyers and sellers of the Company's Class A Stock at any given time. This presence depends on the individual decisions of investors and general economic and market conditions over which the Company has no control. Given the lower trading volume of the Company's Class A Stock, significant sales of shares of the Company's Class A Stock, or the expectation of these sales, could cause the Company's stock price to fall and increase the volatility of the Class A Stock generally.
The holders of Class A Stock do not have the ability to vote on most corporate matters which limits the influence that these holders have over the Company.
The Company issues two classes of shares, Class A Stock and Class B voting common stock (the "Class B Stock"). At December 31, 2015, there were 99,680 shares of Class B Stock outstanding compared to 13,238,486 shares of Class A Stock. The voting power associated with the Class B Stock allows holders of Class B Stock to effectively exercise control over all matters requiring stockholder approval, including the election of all directors and approval of significant corporate transactions, and other matters affecting the Company. Over 96% of the Class B voting shares are held by an entity controlled by Mr. Albert Lowenthal, the Chairman and CEO of the Company. Due to the lack of voting power, the Class A Stockholders have limited influence on corporate matters.
The Company's Chairman and CEO owns a significant portion of the Company's Class B voting stock and therefore can exercise significant control over the corporate governance and affairs of the Company, which may result in him taking actions with which other stockholders do not agree.
An entity controlled by the Company's Chairman and CEO, Mr. Albert Lowenthal, owns over 96% of the Class B voting stock. As a result, Mr. Lowenthal can exercise substantial influence over the outcome of most, if not of all corporate actions requiring approval of our stockholders, including the election of directors and approval of significant corporate transactions, which may result in corporate action with which other stockholders do not agree. This Class B voting power may have the effect of delaying or preventing a change in control of the Company or may result in the receipt of a "control premium" by the controlling stockholder which premium would not be received by the holders of the Class A Stock. The controlling stockholder may have potential conflicts of interest with other stockholders including the ability to determine the impact of "say on pay" provisions at the Company.
Possible additional issuances of the Company's stock will cause dilution.
At December 31, 2015, the Company had 13,238,486 shares of Class A Stock outstanding, outstanding employee stock options to purchase a total of 12,027 shares of Class A Stock, as well as outstanding unvested stock awards granted for an additional 1,257,558 shares of Class A Stock. The Company is further authorized to issue up to 882,401 shares of Class A Stock under share-based compensation plans for which stockholder approval has already been obtained. As the Company issues additional shares, stockholders' holdings will be diluted, perhaps significantly. The issuance of any additional shares of Class A Stock or securities convertible into or exchangeable for Class A Stock or that represent the right to receive Class A Stock, or the exercise of such securities, could be substantially dilutive to holders of our Class A Stock. Holders of our Class A Stock have no preemptive rights that entitle holders to purchase their pro rata share of any offering of shares of any class or series and, therefore, such sales or offerings could result in increased dilution to the Company's stockholders. The market price of the Company's Class A Stock could decline as a result of sales or issuance of shares of Class A Stock or securities convertible into or exchangeable for Class A Stock.
25
Item 1B. UNRESOLVED STAFF COMMENTS
None.
Item 2. PROPERTIES
The Company and Oppenheimer maintain offices at their headquarters at 85 Broad Street, New York, New York which houses their executive management team and many administrative functions for the firm as well as their research, trading, investment banking, and asset management divisions. Generally, the offices outside of 85 Broad Street serve as bases for sales representatives who process trades and provide other brokerage services in co-operation with Oppenheimer’s New York offices using the data processing facilities located there. The Company maintains an office in Troy, Michigan, which among other things, houses its payroll and human resources departments. OMHHF operates its business out of North Wales, Pennsylvania and Oppenheimer Trust is based in Wilmington, Delaware. Freedom conducts its business from its offices located in Edison, New Jersey. Management believes that its present facilities are adequate for the purposes for which they are used and have adequate capacity to provide for presently contemplated future uses. In addition, the Company has offices in London, England, St. Helier, Jersey, Geneva, Switzerland, Tel Aviv, Israel and Hong Kong, China.
The Company and its subsidiaries own no real property but, at December 31, 2015, occupied office space in 109 locations under standard commercial terms expiring between 2016 and 2028. If any leases are not renewed, the Company believes it could obtain comparable space elsewhere on commercially reasonable rental terms.
Item 3. LEGAL PROCEEDINGS
Many aspects of the Company's business involve substantial risks of liability. In the normal course of business, the Company has been the subject of customer complaints and has been named as a defendant or co-defendant in various lawsuits or arbitrations creating substantial exposure. The incidences of these types of claims have increased since the onset of the credit crisis in 2008 and the resulting market disruptions. The Company is also involved from time to time in certain governmental and self-regulatory agency investigations and proceedings. These proceedings arise primarily from securities brokerage, asset management and investment banking activities. There has been an increased incidence of regulatory investigations in the financial services industry in recent years, including customer claims, including investigations by multiple regulators of matters involving the same or similar underlying facts, which seek substantial penalties, fines or other monetary relief. The SEC, amongst other regulators, has announced its intention to bring more regulatory cases seeking substantial penalties in the future.
While the ultimate resolution of routine pending litigation, regulatory and other matters cannot be currently determined, in the opinion of management, after consultation with legal counsel, the Company does not believe that the resolution of these matters will have a material adverse effect on its consolidated financial condition and statement of cash flow. However, the Company's results of operations could be materially affected during any period if liabilities in that period differ from prior estimates.
Notwithstanding the foregoing, an adverse result in any of the matters set forth below or multiple adverse results in arbitrations, litigations or regulatory proceedings currently filed or to be filed against the Company, could have a material adverse effect on the Company's results of operations and financial condition, including its cash position.
The materiality of legal and regulatory matters to the Company's future operating results depends on the level of future results of operations as well as the timing and ultimate outcome of such legal and regulatory matters. See "Risk Factors – The Company may continue to be adversely affected by the failure of the Auction Rate Securities Market" in Item 1A as well as "Management's Discussion and Analysis of Financial Condition and Results of Operations – Regulatory and Legal Environment – Other Regulatory Matters " as well as "Factors Affecting 'Forward-Looking Statements'" in Item 7.
In accordance with applicable accounting guidance, the Company establishes reserves for litigation and regulatory matters when those matters present loss contingencies that are both probable and reasonably estimable. When loss contingencies are not both probable and reasonably estimable, the Company does not establish reserves. In some of the matters described below, loss contingencies are not probable and reasonably estimable in the view of management and, accordingly, reserves have not been established for those matters. For legal or regulatory proceedings where there is at least a reasonable possibility that a loss or an additional loss may be incurred, the Company estimates a range of aggregate loss in excess of amounts accrued of $0 to approximately $51.0 million. This estimated aggregate range is based upon currently available information for those legal proceedings in which the Company is involved, where an estimate for such losses can be made. For certain cases, the Company does not believe that an estimate can currently be made. The foregoing estimate is based on various factors, including the varying stages of the proceedings (including the fact that many are currently in preliminary stages), the numerous yet-unresolved issues in many of the proceedings and the attendant uncertainty of the various potential outcomes of such
26
proceedings. Accordingly, the Company's estimate will change from time to time, and actual losses may be more than the current estimate.
Auction Rate Securities Matters
For a number of years, the Company offered auction rate securities ("ARS") to its clients. A significant portion of the market in ARS ‘failed' in February 2008 due to credit market conditions, and dealers were no longer willing or able to purchase the imbalance between supply and demand for ARS. Oppenheimer offered ARS to its clients in the same manner as dozens of other "downstream" firms in the ARS marketplace – as an available cash management option for clients seeking to increase their yields on short-term investments similar to a money market fund. The Company believes that Oppenheimer's participation therefore differed dramatically from that of the larger broker-dealers who underwrote and provided supporting bids in the auctions, actions Oppenheimer never undertook. Oppenheimer played no role in any decision by the lead underwriters or broker-dealers to discontinue entering support bids and allowing auctions to fail. See "Risk Factors – The Company may continue to be adversely affected by the failure of the Auction Rate Securities Market" in Item 1A as well as "Management's Discussion and Analysis of Financial Condition and Results of Operations – Regulatory and Legal Environment – Other Regulatory Matters" in Item 7 for additional details.
As previously disclosed, Oppenheimer, without admitting or denying liability, entered into a Consent Order (the "Order") with the Massachusetts Securities Division (the "MSD") pursuant to the Massachusetts Uniform Securities Act on February 26, 2010 settling a pending administrative proceeding against the respondents related to Oppenheimer's sales of ARS to retail and other investors in the Commonwealth of Massachusetts.
As previously disclosed, on February 23, 2010, the New York Attorney General ("NYAG" and together with the MSD, the "Regulators") accepted Oppenheimer's offer of settlement and entered an Assurance of Discontinuance ("AOD") pursuant to New York State Executive Law Section 63(15) in connection with Oppenheimer's marketing and sale of ARS. Oppenheimer did not admit or deny any of the findings or allegations contained in the AOD and no fine was imposed.
Pursuant to the terms of the Order, Oppenheimer commenced and closed three offers to purchase Eligible ARS (as defined in the Order) from Customer Accounts (as defined in the Order) during 2010 and 2011 with the final offer closing on April 7, 2011. In addition, pursuant to the terms of the AOD, the Company has made eleven offers to purchase ARS from Eligible Investors between the periods May 21, 2010 and October 26, 2015. The Company's purchases of ARS from clients have continued and will, subject to the terms and conditions of the AOD, continue on a periodic basis. Accounts were, and will continue to be, aggregated on a "household" basis for purposes of these offers. As of December 31, 2015, the Company had purchased and holds (net of redemptions) approximately $92.0 million of ARS pursuant to the settlements with the Regulators and legal settlements and awards.
Oppenheimer has agreed with the NYAG that it will offer to purchase Eligible ARS from Eligible Investors who did not receive an initial purchase offer, periodically, as excess funds become available to Oppenheimer after giving effect to the financial and regulatory capital constraints applicable to Oppenheimer, until Oppenheimer has extended a purchase offer to all Eligible Investors. Such offers will remain open for a period of 75 days from the date on which each such offer to purchase is sent. The ultimate amount of ARS to be repurchased by the Company cannot be predicted with any certainty and will be impacted by redemptions by issuers and client actions during the period, which also cannot be predicted.
In addition, Oppenheimer has agreed to work with issuers and other interested parties, including regulatory and other authorities and industry participants, to provide liquidity solutions for other Massachusetts clients not covered by the offers to purchase. In that regard, on May 21, 2010, Oppenheimer offered such clients a margin loan against marginable collateral with respect to such account holders' holdings of Eligible ARS. As of December 31, 2015, Oppenheimer had extended margin loans to eight holders of Eligible ARS from Massachusetts.
Further, Oppenheimer has agreed to (1) no later than 75 days after Oppenheimer has completed extending a purchase offer to all Eligible Investors (as defined in the AOD), use its best efforts to identify any Eligible Investor who purchased Eligible ARS (as defined in the AOD) and subsequently sold those securities below par between February 13, 2008 and February 23, 2010 and pay the investor the difference between par and the price at which the Eligible Investor sold the Eligible ARS, plus reasonable interest thereon (the "ARS Losses"); (2) no later than 75 days after Oppenheimer has completed extending a Purchase Offer to all Eligible Investors, use its best efforts to identify Eligible Investors who took out loans from Oppenheimer after February 13, 2008 that were secured by Eligible ARS that were not successfully auctioning at the time the loan was taken out from Oppenheimer and who paid interest associated with the ARS-based portion of those loans in excess of the total interest and dividends received on the Eligible ARS during the duration of the loan (the "Loan Cost Excess") and reimburse such investors for the Loan Cost Excess plus reasonable interest thereon; (3) upon providing liquidity to all Eligible Investors,
27
participate in a special arbitration process for the exclusive purpose of arbitrating any Eligible Investor's claim for consequential damages against Oppenheimer related to the investor's inability to sell Eligible ARS; and (4) work with issuers and other interested parties, including regulatory and governmental entities, to expeditiously provide liquidity solutions for institutional investors not within the definition of Small Businesses and Institutions (as defined in the AOD) that held ARS in Oppenheimer brokerage accounts on February 13, 2008. Oppenheimer believes that because Items (1) through (3) above will occur only after it has provided liquidity to all Eligible Investors, it will take an extended period of time before the requirements of Items (1) through (3) will take effect.
Each of the AOD and the Order provides that in the event that Oppenheimer enters into another agreement that provides any form of benefit to any Oppenheimer ARS customer on terms more favorable than those set forth in the AOD or the Order, Oppenheimer will immediately extend the more favorable terms contained in such other agreement to all eligible investors. The AOD further provides that if Oppenheimer pays (or makes any pledge or commitment to pay) to any governmental entity or regulator pursuant to any other agreement costs or a fine or penalty or any other monetary amount, then an equivalent payment, pledge or commitment will become immediately owed to the State of New York for the benefit of New York residents.
If Oppenheimer fails to comply with any of the terms set forth in the Order, the MSD may institute an action to have the Order declared null and void and reinstitute the previously pending administrative proceedings. If Oppenheimer defaults on any obligation under the AOD, the NYAG may terminate the AOD, at his sole discretion, upon 10 days written notice to Oppenheimer.
Reference is made to the Order and the AOD, each as described in Item 3 of the Company's Annual Report on Form 10-K for the year ended December 31, 2009 and attached thereto as Exhibits 10.24 and 10.22 respectively, as well as the subsequent disclosures related thereto in the Company's Quarterly Reports on Form 10-Q for the quarters ended March 31, 2010 through September 30, 2015 and in the Company's Annual Reports on Form 10-K for the years ended December 31, 2010 through and including 2014, for additional details of the agreements with the MSD and NYAG. The Company is continuing to cooperate with investigating entities from states other than Massachusetts and New York.
As of December 31, 2015, eleven ARS matters were concluded in either court or arbitration with Oppenheimer prevailing in four of those matters and the claimants prevailing in seven of those matters. The Company has purchased approximately $7.6 million in ARS from the prevailing claimants in those seven actions. In addition, the Company has made cash payments of approximately $12.7 million as a result of legal settlements with clients. As of December 31, 2015, there are no pending ARS- related cases against Oppenheimer. It is possible, however, that other individuals or entities that purchased ARS from Oppenheimer may bring additional claims against Oppenheimer in the future for repurchase or rescission.
See "Risk Factors - The Company may continue to be adversely affected by the failure of the Auction Rate Securities Market" in Item 1A and "Management's Discussion and Analysis of Financial Condition and Results of Operations - Regulatory and Legal Environment - Other Regulatory Matters" and "Off-Balance Sheet Arrangements" in Item 7.
Other Pending Matters
On or about March 13, 2008, Oppenheimer was served in a matter pending in the United States Bankruptcy Court, Northern District of Georgia, captioned William Perkins, Trustee for International Management Associates v. Lehman Brothers, Oppenheimer & Co. Inc., JB Oxford & Co., Bank of America Securities LLC and TD Ameritrade Inc. The Trustee seeks to set aside as fraudulent transfers in excess of $25.0 million in funds embezzled by the sole portfolio manager for International Management Associates, a hedge fund. Said portfolio manager purportedly used the broker dealer defendants, including Oppenheimer, as conduits for his embezzlement. Oppenheimer filed its answer to the complaint on June 18, 2010. Oppenheimer filed a motion for summary judgment, which was argued on March 31, 2011. Immediately thereafter, the Bankruptcy Court dismissed all of the Trustee's claims against all defendants including Oppenheimer. In June 2011, the Trustee filed an appeal with the United States District Court for the Northern District of Georgia (U.S.N.D. GA). In addition, on June 10, 2011, the Trustee filed a petition for permission to appeal the dismissal to the United States Court of Appeals for the Eleventh Circuit. On July 27, 2011, the Court of Appeals for the Eleventh Circuit denied the Trustee's Petition. The Trustee then appealed to the U.S.N.D. GA. On March 30, 2012, the U.S.N.D. GA affirmed in part and reversed in part the ruling from the Bankruptcy Court and remanded the matter to the Bankruptcy Court. Discovery has closed and Oppenheimer filed a motion for summary judgment at the end of February 2014. Oppenheimer's summary judgment motion remains under consideration by the Bankruptcy Court. Oppenheimer believes that, as a result of previous court rulings in this matter, the claimed damages against Oppenheimer have been substantially reduced and that it has meritorious defenses to the remaining claims made against it and intends to defend itself vigorously.
28
On June 24, 2011, Oppenheimer was served with a petition in a matter pending in state court in Collin County, Texas captioned Jerry Lancaster, Providence Holdings, Inc., Falcon Holdings, LLC and Derek Lancaster v. Oppenheimer & Co., Inc., Oppenheimer Trust Company, Charles Antonuicci, Alan Reichman, John Carley, Park Avenue Insurance, LLC and Park Avenue Bank. The action requests unspecified damages, including exemplary damages, for Oppenheimer's alleged breach of fiduciary duty, negligent hiring, fraud, conversion, conspiracy, breach of contract, unjust enrichment and violation of the Texas Business and Commerce Code. The first amended petition alleges that Oppenheimer held itself out as having expertise in the insurance industry generally and managing insurance companies' investment portfolios but inappropriately allowed plaintiffs' bond portfolios to be used by Park Avenue Insurance Company to secure the sale of Providence Property and Casualty Insurance Company to Park Avenue Insurance Company. On July 22, 2011, defendants removed the case to the United States District Court for the Eastern District of Texas, Sherman Division, and subsequently, on October 3, 2012, Providence Holdings, Inc. filed a new action in the United States District Court for the Eastern Division of Texas against Oppenheimer, Oppenheimer Trust Company, and two individuals, re-asserting basically the same claims as above. On December 18, 2012, Oppenheimer and Oppenheimer Trust Company filed motions (i) to dismiss the new complaint and (ii) to stay the action pending resolution of all claims among the parties in the action pending in Oklahoma styled State of Oklahoma ex rel. Holland v. Providence Holdings, Inc. On March 18, 2013, the Texas court issued an order formally approving the parties' stipulation to stay the action. On April 15, 2011, in an action styled State of Oklahoma ex rel. Holland v. Providence Holdings, Inc., et al. in the Oklahoma County District Court, Providence Holdings, Inc. and Jerry Lancaster asserted cross-claims against Oppenheimer and Oppenheimer Trust Company Inc. related to the same facts at issue in the Texas litigation discussed above. These cross-claims included claims for breach of fiduciary duty, various theories of fraud, violation of Texas commercial statutes, breach of contract, interference with prospective business advantage, and loss of business opportunity and sought undisclosed damages. That case is in document discovery, pending the resolution of several privilege claims by cross-claim plaintiffs that implicate receivership proceedings pending before several courts in Oklahoma. Oppenheimer believes it has meritorious defenses to the claims raised and intends to defend against these claims vigorously including pursuing dismissal of the claims against it. Providence Holdings has filed a motion for summary judgment as to some but not all of Oppenheimer's cross-claims against it. Oppenheimer will oppose that motion in accordance with a schedule to be fixed by the Court.
On March 15, 2013, the Company filed in the Supreme Court of the State of New York, County of New York ("New York Court"), a breach of contract action against Canadian Imperial Bank of Commerce ("CIBC") in connection with the Company's acquisition of CIBC's U.S. capital markets businesses for an amount of damages to be proven at trial. On January 31, 2014, the Company filed an amended complaint. On March 13, 2014, CIBC filed a motion to dismiss portions of the Company's amended complaint. In October 2014, the motion to dismiss was granted in part and denied in part by the New York Court. Discovery in the case is proceeding.
In October 2013, JPMorgan Chase Clearing Corp. ("JPMCC"), a division of JPMorgan Chase, filed a FINRA arbitration claim against Oppenheimer ("JPMCC Arbitration") seeking a declaration from the panel ordering that Oppenheimer indemnify it for all damages and costs, including but not limited to attorneys' fees, for litigation in Germany that had begun in 2011 ("German Litigation"). Multiple investors in Germany sought redress from JPMCC for losses associated with a Swiss investment advisory firm, Salomon Investment AG, later renamed SAL Investment AG ("SAL"), that had solicited their business by phone and pooled their funds in an omnibus account at the German offices of Josephthal Lyon & Ross GmbH ("Josephthal GmbH"), and had invested those funds unsuitably and charged the investors excessive commissions and fees from about 1995 to 1998. Josephthal Lyon & Ross Inc. ("Josephthal") was acquired by what is now Oppenheimer in 2001. Bear Stearns, acquired by JPMorgan Chase in 2008, cleared trades for the aforementioned omnibus account. JPMCC based its indemnification claim on agreements with Josephthal executed in 1991 and 2000. No hearing dates have been set in the JPMCC Arbitration.
In August 2014, judgments ("Judgments") in favor of seven German plaintiffs grouped in three separate cases were finalized in the German court in Dusseldorf against JPMCC. The German court found that JPMCC was liable to the plaintiffs for damages in amounts totaling (including damages, interest and attorneys' fees) approximately €1.2 million (approximately U.S. $1.3 million). These judgments have been affirmed by an intermediate level appellate court, and JPMCC and Oppenheimer are appealing those decisions to Germany's highest appellate court. In addition, eighteen other plaintiffs have filed statements of claim against JPMCC in Dusseldorf with claimed aggregate damages (excluding claims for interest and attorneys' fees) of approximately €3.2 million (approximately U.S. $3.5 million). Oppenheimer believes it has meritorious defenses to the claims and intends to defend itself vigorously.
On May 15, 2015, plaintiffs IBEW Local No. 58 Annuity Fund and Electrical Workers Pension Trust Fund of IBEW Local No. 58, individually and on behalf of all others similarly situated, filed an Amended Class Action Complaint ("CAC") relating to EveryWare Global, Inc. ("EveryWare") in the United States District Court for the Southern District of Ohio. The CAC names as defendants certain current and former officers and directors of EveryWare, Monomoy Capital Partners, L.P. and certain of its affiliates, as well as Oppenheimer, CJS Securities, Inc., Telsey Advisory Group, LLC, Imperial Capital, LLC and BTIG, LLC (collectively, the "Underwriter Defendants"), Plaintiffs allege that, among other things, the Registration Statement issued in
29
connection with a secondary offering of EveryWare's stock on or about September 16, 2013 contained misrepresentations and omissions of material facts. In the secondary offering, the Underwriter Defendants sold 1,750,000 shares of EveryWare stock to the public at a price of $11.50 per share. The CAC alleges claims against the Underwriter Defendants for violations of Sections 11 and 12(a)(2) of the Securities Act of 1933. Plaintiffs purport to bring their action on behalf of a class comprising all persons or entities who purchased or otherwise acquired EveryWare securities between May 21, 2013 and May 16, 2014. The CAC seeks an award of unspecified compensatory damages, interest and attorneys' fees and costs. On August 14, 2015, the Underwriter Defendants filed a motion to dismiss the CAC. The Underwriter Defendants, including Oppenheimer, believe they have meritorious defenses to the CAC, and Oppenheimer intends to vigorously defend the matter.
See also "Management's Discussion and Analysis of Financial Condition and Results of Operations – Regulatory and Legal Environment – Other Regulatory Matters" in Item 7.
Item 4. MINE SAFETY DISCLOSURES
Not applicable.
30
PART II
Item 5. MARKET FOR THE REGISTRANT'S COMMON EQUITY, RELATED STOCKHOLDER MATTERS AND ISSUER PURCHASES OF EQUITY SECURITIES
(a) The Company's Class A Stock is listed and traded on the NYSE (trading symbol "OPY"). The Class B Stock is not traded on any stock exchange and, as a consequence, there is only limited trading in the Class B Stock. The Company does not presently contemplate listing the Class B Stock in the United States on any national or regional stock exchange or on NASDAQ.
The following tables set forth the high and low sales prices of the Class A Stock on the NYSE for the 2015 and 2014 fiscal years. Prices provided are based on data provided by the NYSE.
NYSE | ||||||||
Class A Stock | High | Low | ||||||
2015 | 1st Quarter | $ | 24.41 | $ | 19.04 | |||
2nd Quarter | $ | 27.99 | $ | 22.30 | ||||
3rd Quarter | $ | 26.80 | $ | 17.40 | ||||
4th Quarter | $ | 20.98 | $ | 15.60 | ||||
2014 | 1st Quarter | $ | 29.75 | $ | 22.26 | |||
2nd Quarter | $ | 28.86 | $ | 21.28 | ||||
3rd Quarter | $ | 24.80 | $ | 19.76 | ||||
4th Quarter | $ | 24.70 | $ | 19.97 | ||||
As at December 31, 2015, there were 1,269,585 shares of Class A Stock underlying outstanding options and restricted share awards. Class A Stock underlying all vested options, if exercised, and restricted shares could be sold pursuant to Rule 144 or effective registration statements on Form S-8.
(b) The following table sets forth information about the stockholders of the Company as at February 29, 2016 as set forth in the records of the Company's transfer agent and registrar:
Number of shares | Number of stockholders of record | ||||
Class A Stock | 13,307,414 | 95 | |||
Class B Stock | 99,680 | 45 | |||
31
(c) Dividends
The following table sets forth the frequency and amount of any cash dividends declared on the Company's Class A Stock and Class B Stock for the fiscal years ended December 31, 2014 and 2015 and the first quarter of 2016:
Type | Declaration date | Record date | Payment date | Amount per share | |||||
Quarterly | January 31, 2014 | February 14, 2014 | February 28, 2014 | $ | 0.11 | ||||
Quarterly | May 1, 2014 | May 15, 2014 | May 27, 2014 | $ | 0.11 | ||||
Quarterly | August 1, 2014 | August 15, 2014 | August 29, 2014 | $ | 0.11 | ||||
Quarterly | October 31, 2014 | November 14, 2014 | November 28, 2014 | $ | 0.11 | ||||
Quarterly | January 30, 2015 | February 13, 2015 | February 27, 2015 | $ | 0.11 | ||||
Quarterly | May 1, 2015 | May 15, 2015 | May 29, 2015 | $ | 0.11 | ||||
Quarterly | July 31, 2015 | August 14, 2015 | August 28, 2015 | $ | 0.11 | ||||
Quarterly | October 30, 2015 | November 13, 2015 | November 27, 2015 | $ | 0.11 | ||||
Quarterly | January 29, 2016 | February 12, 2016 | February 26, 2016 | $ | 0.11 | ||||
Future dividend policy will depend upon the earnings and financial condition of the Operating Subsidiaries, the Company's need for funds and other factors. Dividends may be paid to holders of Class A Stock and Class B Stock (pari passu), as and when declared by the Company's Board of Directors, from funds legally available therefore.
(d) Share-Based Compensation Plans
The Company has a 2006 Equity Incentive Plan, adopted December 11, 2006 and amended in December 2011, and had a 1996 Equity Incentive Plan, as amended March 10, 2005, which expired on April 18, 2006 (together "EIP"), under which the Compensation Committee of the Board of Directors of the Company has granted options to purchase Class A Stock, restricted Class A Stock awards and Class A Stock awards to officers and key employees of the Company and its subsidiaries. From 2011 through 2013, restricted Class A Stock awards were granted to the Company's non-employee directors as approved by a committee formed for that purpose. With the adoption of the OIP (as defined below), the amount and terms of such grants are determined by the Board of Directors of the Company.
Oppenheimer has an Employee Share Plan ("ESP") under which the Compensation Committee of the Board of Directors of the Company has granted stock awards and restricted stock awards to key management employees of the Company and its subsidiaries.
On February 26, 2014, the Company adopted the Oppenheimer Holdings Inc. 2014 Incentive Plan (the "OIP") which pursuant to its terms amends and restates each of the EIP and ESP and incorporates each of the EIP and ESP into the OIP.
The Company's share-based compensation plans are described in Note 15 to the Company's consolidated financial statements appearing in Item 8.
32
(e) Share Performance Graph
The following graph shows changes over the past five year period of U.S. $100 invested in (1) the Company's Class A Stock, (2) the Standard & Poor's 500 Index (S&P 500), and (3) the Standard & Poor's 500 Diversified Financial Index (S&P 500 / Diversified Financials – S5DIVF):
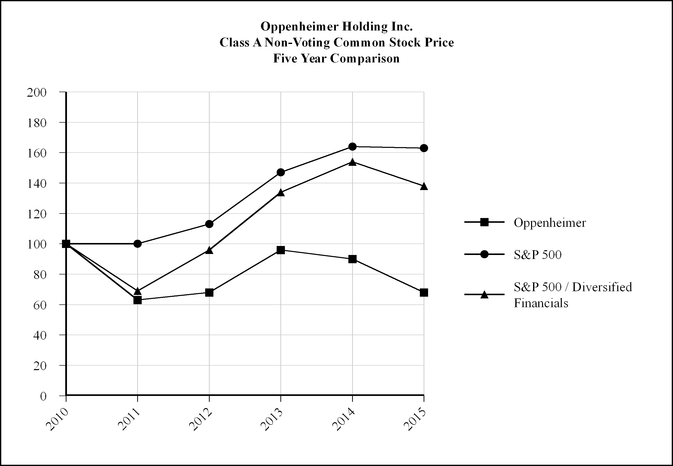
As at December 31, | 2010 | 2011 | 2012 | 2013 | 2014 | 2015 | |||||||||||
Oppenheimer Class A Stock | 100 | 63 | 68 | 96 | 90 | 68 | |||||||||||
S&P 500 | 100 | 100 | 113 | 147 | 164 | 163 | |||||||||||
S&P 500 / Diversified Financials | 100 | 69 | 96 | 134 | 154 | 138 | |||||||||||
Stock Buy-Back
On September 15, 2015, the Company announced that its board of directors approved a share repurchase program that authorizes the Company to purchase up to 665,000 shares of the Company's Class A Stock, representing approximately 5% of its 13,348,369 then issued and outstanding shares of Class A Stock ("New Program"). This authorization replaces the share repurchase program covering up to 675,000 shares of the Company's Class A Stock, which was announced on October 7, 2011 ("Previous Program"), pursuant to which 322,177 shares of the Company's Class A Stock were repurchased and canceled prior to December 31, 2014. During the nine months ended September 30, 2015, the Company purchased and canceled an additional 328,844 shares of Class A Stock for a total consideration of $6.6 million ($20.12 per share) under the Previous Program. The 23,979 remaining shares available under the Previous Program have been replaced by the shares available under the New Program.
During the three months ended December 31, 2015, the Company purchased and canceled an aggregate of 94,882 shares of Class A Stock for a total consideration of $1.6 million ($17.20 per share) under the New Program. As of December 31, 2015, 570,118 shares were available to be purchased under the New Program.
33
Any such share purchases will be made by the Company from time to time in the open market at the prevailing open market price using cash on hand, in compliance with the applicable rules and regulations of the New York Stock Exchange and federal and state securities laws and the terms of the Company's senior secured debt. All shares purchased will be canceled. The share repurchase program is expected to continue indefinitely. The timing and amounts of any purchases will be based on market conditions and other factors including price, regulatory requirements and capital availability. The share repurchase program does not obligate the Company to repurchase any dollar amount or number of Class A non-voting common shares. Depending on market conditions and other factors, these repurchases may be commenced or suspended from time to time without prior notice.
Item 6. SELECTED FINANCIAL DATA
The following table presents selected financial information derived from the audited consolidated financial statements of the Company for each of the five years in the period ended December 31, 2015:
(Expressed in thousands, except number of shares and per share amounts) | |||||||||||||||||||
2015 | 2014 | 2013 | 2012 | 2011 | |||||||||||||||
Revenue | $ | 928,385 | $ | 1,004,464 | $ | 1,019,714 | $ | 952,612 | $ | 958,992 | |||||||||
Net income (loss) attributable to the Company | $ | 1,962 | $ | 8,826 | $ | 25,061 | $ | (3,613 | ) | $ | 10,316 | ||||||||
Net income (loss) per share attributable to the Company (1) | |||||||||||||||||||
basic | $ | 0.14 | $ | 0.65 | $ | 1.85 | $ | (0.27 | ) | $ | 0.76 | ||||||||
diluted | $ | 0.14 | $ | 0.62 | $ | 1.77 | $ | (0.27 | ) | $ | 0.74 | ||||||||
Total assets | $ | 2,692,964 | $ | 2,787,455 | $ | 2,952,720 | $ | 2,678,020 | $ | 3,527,439 | |||||||||
Long term debt | $ | 150,000 | $ | 150,000 | $ | 195,000 | $ | 195,000 | $ | 195,000 | |||||||||
Total liabilities | $ | 2,167,882 | $ | 2,253,723 | $ | 2,424,849 | $ | 2,173,019 | $ | 3,014,036 | |||||||||
Cash dividends per share of Class A and Class B Stock | $ | 0.44 | $ | 0.44 | $ | 0.44 | $ | 0.44 | $ | 0.44 | |||||||||
Stockholders’ equity attributable to the Company | $ | 518,058 | $ | 527,644 | $ | 522,518 | $ | 500,740 | $ | 508,070 | |||||||||
Book value per share attributable to the Company (1) | $ | 38.84 | $ | 38.71 | $ | 38.77 | $ | 36.80 | $ | 37.16 | |||||||||
Number of shares of capital stock outstanding (1) | 13,338,166 | 13,630,368 | 13,477,647 | 13,607,998 | 13,671,945 | ||||||||||||||
(1) | The Class A Stock and Class B Stock are combined because they are of equal rank for purposes of dividends and in the event of a distribution of assets upon liquidation, dissolution or winding up. |
34
Item 7. MANAGEMENT'S DISCUSSION AND ANALYSIS OF FINANCIAL CONDITION AND RESULTS OF OPERATIONS
The Company's consolidated financial statements have been prepared in accordance with accounting principles generally accepted in the United States of America. The following discussion should be read in conjunction with the consolidated financial statements and notes thereto which appear elsewhere in this annual report.
The Company engages in a broad range of activities in the securities industry, including retail securities brokerage, institutional sales and trading, investment banking (both corporate and public finance), research, market-making, trust services and investment advisory and asset management services. Its principal subsidiaries are Oppenheimer & Co. Inc. ("Oppenheimer") and Oppenheimer Asset Management Inc. ("OAM"). As of December 31, 2015, the Company provided its services from 85 offices in 24 states located throughout the United States, offices in Tel Aviv, Israel, Hong Kong, China, London, England, St. Helier, Isle of Jersey and Geneva, Switzerland. Client assets administered by the Company as of December 31, 2015 totaled approximately $78.7 billion. The Company provides investment advisory services through OAM and Oppenheimer Investment Management LLC ("OIM") and Oppenheimer's Fahnestock Asset Management, Alpha and OMEGA Group divisions. At December 31, 2015, client assets under management totaled $24.1 billion. The Company provides trust services and products through Oppenheimer Trust Company of Delaware. The Company provides discount brokerage services through Freedom Investments, Inc. ("Freedom"). Through OPY Credit Corp., the Company offers syndication as well as trading of issued syndicated corporate loans. Oppenheimer Multifamily Housing & Healthcare Finance, Inc. ("OMHHF") is engaged in Federal Housing Administration ("FHA")-insured commercial mortgage origination and servicing. At December 31, 2015, the Company employed 3,290 employees (3,230 full-time and 60 part-time), of whom approximately 1,233 were financial advisers.
Critical Accounting Policies
The Company's accounting policies are essential to understanding and interpreting the financial results reported in the consolidated financial statements. The significant accounting policies used in the preparation of the Company's consolidated financial statements are summarized in Note 2 to those statements. Certain of those policies are considered to be particularly important to the presentation of the Company's financial results because they require management to make difficult, complex or subjective judgments, often as a result of matters that are inherently uncertain. The following is a discussion of these policies:
Fair Value Measurements
The accounting guidance for the fair value measurement of financial assets, which defines fair value, establishes a framework for measuring fair value, establishes a fair value measurement hierarchy, and expands fair value measurement disclosures. Fair value, as defined by the accounting guidance, is the price that would be received in the sale of an asset or paid to transfer a liability in an orderly transaction between market participants at the measurement date. The fair value hierarchy established by this accounting guidance prioritizes the inputs used in valuation techniques into the following three categories (highest to lowest priority):
Level 1: | Observable inputs that reflect quoted prices (unadjusted) for identical assets or liabilities in active markets; |
Level 2: | Inputs other than quoted prices included in Level 1 that are observable for the asset or liability either directly or indirectly; and |
Level 3: | Unobservable inputs that are significant to the overall fair value measurement. |
The Company's financial instruments that are recorded at fair value generally are classified within Level 1 or Level 2 within the fair value hierarchy using quoted market prices or quotes from market makers or broker-dealers. Financial instruments classified within Level 1 are valued based on quoted market prices in active markets and consist of U.S. government, federal agency, and sovereign government obligations, corporate equities, and certain money market instruments. Level 2 financial instruments primarily consist of investment grade and high-yield corporate debt, convertible bonds, mortgage and asset-backed securities, municipal obligations, and certain money market instruments. Financial instruments classified as Level 2 are valued based on quoted prices for similar assets and liabilities in active markets and quoted prices for identical or similar assets and liabilities in markets that are not active. Some financial instruments are classified within Level 3 within the fair value hierarchy as observable pricing inputs are not available due to limited market activity for the asset or liability. Such financial instruments include investments in hedge funds and private equity funds where the Company, through its subsidiaries, is general partner; less-liquid private label mortgage and asset-backed securities; certain distressed municipal securities; interest rate lock commitments where OMHHF enters into contractual commitments to originate (purchase) and sell multifamily mortgage loans at fixed prices with fixed expiration dates; and auction rate securities.
35
Legal and Regulatory Reserves
The Company records reserves related to legal and regulatory proceedings in accounts payable and other liabilities. The determination of the amounts of these reserves requires significant judgment on the part of management. In accordance with applicable accounting guidance, the Company establishes reserves for litigation and regulatory matters where available information indicates that it is probable a liability had been incurred at the date of the consolidated financial statements and the Company can reasonably estimate the amount of that loss. When loss contingencies are not probable and cannot be reasonably estimated, the Company does not establish reserves.
When determining whether to record a reserve, management considers many factors including, but not limited to, the amount of the claim; the stage and forum of the proceeding, the sophistication of the claimant, the amount of the loss, if any, in the client's account and the possibility of wrongdoing, if any, on the part of an employee of the Company; the basis and validity of the claim; previous results in similar cases; and applicable legal precedents and case law. Each legal and regulatory proceeding is reviewed with counsel in each accounting period and the reserve is adjusted as deemed appropriate by management. Any change in the reserve amount is recorded in the results of that period. The assumptions of management in determining the estimates of reserves may be incorrect and the actual disposition of a legal or regulatory proceeding could be greater or less than the reserve amount.
Goodwill
The Company defines a reporting unit as an operating segment. The Company's goodwill resides in its Private Client Division ("PCD") reporting unit. Goodwill of a reporting unit is subject to at least an annual test for impairment to determine if the estimated fair value of a reporting unit is less than its carrying amount. Goodwill of a reporting unit is required to be tested for impairment between annual tests if an event occurs or circumstances change that would more likely than not reduce the fair value of a reporting unit below its carrying amount. Due to the volatility in the financial services sector and equity markets in general, determining whether an impairment of goodwill has occurred is increasingly difficult and requires management to exercise significant judgment. The Company's goodwill impairment analysis performed at December 31, 2015 applied the same valuation methodologies with consistent inputs as that performed at December 31, 2014, as follows:
In estimating the fair value of the PCD, the Company uses traditional standard valuation methods, including the market comparable approach and income approach. The market comparable approach is based on comparisons of the subject company to public companies whose stocks are actively traded ("Price Multiples") or to similar companies engaged in an actual merger or acquisition ("Precedent Transactions"). As part of this process, multiples of value relative to financial variables, such as earnings or stockholders' equity, are developed and applied to the appropriate financial variables of the subject company to indicate its value. The income approach involves estimating the present value of the subject company's future cash flows by using projections of the cash flows that the business is expected to generate, and discounting these cash flows at a given rate of return ("Discounted Cash Flow" or "DCF"). Each of these standard valuation methodologies requires the use of management estimates and assumptions.
In its Price Multiples valuation analysis, the Company uses various operating metrics of comparable companies, including revenues, after-tax earnings, EBITDA as well as price-to-book value ratios at a point in time. The Company analyzes prices paid in Precedent Transactions that are comparable to the business conducted in the PCD. The DCF analysis includes the Company's assumptions regarding discount rate, growth rates of the PCD's revenues, expenses, EBITDA, and capital expenditures, adjusted for current economic conditions and expectations. The Company weighs each of the three valuation methods equally in its overall valuation. Given the subjectivity involved in selecting which valuation method to use, the corresponding weightings, and the input variables for use in the analyses, it is possible that a different valuation model and the selection of different input variables could produce a materially different estimate of the fair value of the PCD reporting unit.
At each annual goodwill impairment testing date, the PCD reporting unit had a fair value that was substantially in excess of its carrying value. See Note 18 to the consolidated financial statements appearing in Item 8 for further discussion.
Intangible Assets
Indefinite intangible assets are comprised of trademarks and trade names. Trademarks and trade names, carried at $31.7 million, which are not amortized, are subject to at least an annual test for impairment to determine if the estimated fair value is less than their carrying amount. See Note 18 to the consolidated financial statements appearing in Item 8 for further discussion.
36
Income Taxes
The Company accounts for income taxes under the asset and liability method, which requires the recognition of deferred tax assets and liabilities for the expected future tax consequences of events that have been included in the financial statements. Under this method, deferred tax assets and liabilities are determined on the basis of the differences between the financial statement and tax bases of assets and liabilities using enacted tax rates in effect for the year in which the differences are expected to reverse. The effect of a change in tax rates on deferred tax assets and liabilities is recognized in income in the period that includes the enactment date.
The Company recognizes deferred tax assets to the extent it believes these assets are more likely than not to be realized. In making such a determination, the Company considers all available positive and negative evidence, including future reversals of existing taxable temporary differences, projected future taxable income, tax planning strategies, and the results of recent operations.
The Company records uncertain tax positions in accordance with ASC 740 on the basis of a two-step process whereby it determines whether it is more likely than not that the tax positions will be sustained on the basis of the technical merits of the position and, for those tax positions that meet the more-likely-than-not recognition threshold, the Company recognizes the largest amount of tax benefit that is more than 50 percent likely to be realized upon ultimate settlement with the related tax authority.
The Company records interest and penalties accruing on unrecognized tax benefits in income (loss) before income tax provision (benefit) as interest expense and other expense, respectively, in its consolidated statement of income.
The Company permanently reinvests eligible earnings of its foreign subsidiaries and, accordingly, does not accrue any U.S. income taxes that would arise if such earnings were repatriated.
New Accounting Pronouncements
Recently adopted and recently issued accounting pronouncements are described in Note 2 to the consolidated financial statements appearing in Item 8.
Business Environment
The securities industry is directly affected by general economic and market conditions, including fluctuations in volume and price levels of securities and changes in interest rates, inflation, political events, investor confidence, investor participation levels, legal and regulatory, accounting, tax and compliance requirements and competition, all of which have an impact on commissions, firm trading, fees from accounts under investment management as well as fees for investment banking services, and investment and interest income as well as on liquidity. Substantial fluctuations can occur in revenue and net income due to these and other factors.
For a number of years, the Company offered auction rate securities ("ARS") to its clients. A significant portion of the market in ARS 'failed' because, in the tight credit market in and subsequent to 2008, dealers were no longer willing or able to purchase the imbalance between supply and demand for ARS. These securities have auctions scheduled on either a 7, 28 or 35 day cycle. Clients of the Company own ARS in their individual accounts. The absence of a liquid market for these securities presents a significant problem to clients continuing to own ARS and, as a result, to the Company. It should be noted that this is a failure of liquidity and not a default. These securities in almost all cases have not failed to pay interest or principal when due. These securities are fully collateralized for the most part and, for the most part, remain good credits. The Company did not act as an auction agent for ARS.
Interest rates on ARS typically reset through periodic auctions. Due to the auction mechanism and generally liquid markets, ARS historically were categorized as Level 1 in the fair value hierarchy. Beginning in February 2008, uncertainties in the credit markets resulted in substantially all of the ARS market experiencing failed auctions. Once the auctions failed, the ARS could no longer be valued using observable prices set in the auctions. The Company has used less observable determinants of the fair value of ARS, including the strength in the underlying credits, announced issuer redemptions, completed issuer redemptions, and announcements from issuers regarding their intentions with respect to their outstanding ARS. The Company has also developed an internal methodology to discount for the lack of liquidity and non-performance risk of the failed auctions. Due to liquidity problems associated with the ARS market, ARS that lack liquidity are setting their interest rates according to a maximum rate formula defined in their registration statements.
37
The Company has sought financing from a number of sources, with limited success, in order to try to find a means for all its clients to find liquidity from their ARS holdings. It seems likely that liquidity will ultimately come from issuer redemptions and tender offers which, to date, combined with purchases by the Company have reduced client holdings by approximately 94%. There can be no assurance that the Company will be successful in finding a liquidity solution for all its clients' ARS. See "Risk Factors – The Company may continue to be adversely affected by the failure of the Auction Rate Securities Market" appearing in Item 1A and "Factors Affecting 'Forward-Looking Statements'" herein.
Recent events have caused increased review and scrutiny of the methods utilized by financial service companies to finance their short term requirements for liquidity. The Company utilizes commercial bank loans, securities lending, and repurchase agreements to finance its short term liquidity needs (See "Liquidity"). All repurchase agreements and reverse repurchase agreements are collateralized by short term U.S. Government obligations and U.S. Government Agency obligations.
The Company is focused on growing its private client and asset management businesses through strategic additions of experienced financial advisers in its existing branch system and employment of experienced money management personnel in its asset management business. In addition, the Company is committed to the improvement of its technology capability to support client service and the expansion of its capital markets capabilities while addressing the issue of managing its expenses.
Regulatory and Legal Environment
The brokerage business is subject to regulation by, among others, the SEC, the CFTC, the NFA and the FINRA in the United States, the FCA in the United Kingdom, the JFSC in the Isle of Jersey, the SFC in Hong Kong, and various state securities regulators in the United States. In addition, Oppenheimer Israel (OPCO) Ltd. operates under the supervision of the Israeli Securities Authority. Past events surrounding corporate accounting and other activities leading to investor losses resulted in the enactment of the Sarbanes-Oxley Act and have caused increased regulation of public companies. The financial crisis of 2008-9 accelerated this trend. New regulations and new interpretations and enforcement of existing regulations have created increased costs of compliance and increased investment in systems and procedures to comply with these more complex and onerous requirements. The SEC and FINRA have increased their enforcement activities with an intent to bring more actions against firms and individuals with increased fines and sanctions for violations of existing rules as well as for conduct that stems from violations of new interpretations of existing rules. Certain legislators continue to publicly advocate that the SEC has not taken adequate enforcement action against firms and individuals. Various states are also imposing their own regulations that make compliance more difficult and more expensive to monitor.
In July 2010, Congress enacted extensive legislation entitled the Wall Street Reform and Consumer Protection Act ("Dodd Frank") in which it mandated that the SEC and other regulators conduct comprehensive studies and issue new regulations based on their findings to control the activities of financial institutions in order to protect the financial system, the investing public and consumers from issues and failures that occurred in the 2008-9 financial crisis. All relevant studies have not yet been completed, but they are widely expected to extensively impact the regulation and practices of financial institutions including the Company. The changes are likely to significantly reduce leverage available to financial institutions and to increase transparency to regulators and investors of risks taken by such institutions. It continues to be impossible to predict the nature and impact of such rulemaking. In addition, new rules have been adopted to regulate and/or prohibit proprietary trading for certain deposit taking institutions, control the amount and timing of compensation to "highly paid" employees, create new regulations around financial transactions with consumers requiring the adoption of a uniform fiduciary standard of care of broker-dealers and investment advisers providing personalized investment advice about securities to retail customers, increase the disclosures provided to clients, and create a tax on securities transactions. The Consumer Financial Protection Bureau has stated its intention to implement new rules affecting the interaction between financial institutions and consumers. In addition, the U.S. Department of Labor has proposed rules for financial institutions surrounding their fiduciary duty to retirement plans which could have significant negative implications for the industry's relationships with this broad group of clients including individuals participating in pension plans, 401(k) plans, and Individual Retirement Accounts ("IRAs"). The proposed rules contemplate a contract between plan owners and custodians and managers in which all elements of the relationship are described including all relevant conflicts of interest. It is likely that one or more rules of the Department of Labor will become effective in 2016. It is too early to tell if other rules will become final and the impact of these proposed rules on the Company. In December 2012, France began applying a 0.2% transaction tax on financial transactions in American Depository Receipts of French companies that trade on U.S. exchanges. Italy implemented its own financial transaction tax in March 2013. The imposition of financial transaction taxes are likely to impact the jurisdictions in which securities are traded and the "spreads" demanded by market participants in order to make up for the cost of any such tax. Such a tax may be implemented throughout the European Union. Recent publicity around "high speed trading" has created suggestions by legislators to create a financial transaction tax in the U.S. to inhibit such trading. If and when enacted, such regulations will likely increase compliance costs and reduce returns earned by financial service providers and intensify compliance overall. It is difficult to predict the nature of the final regulations and their impact on the business of the Company.
38
Prohibitions and Restrictions on Proprietary Trading and Certain Interests in, and Relationships with, Hedge Funds and Private Equity Funds (the "Volcker Rule") was published by the U.S. Federal Reserve Board as required by Dodd-Frank in 2011. The Volcker Rule is intended to restrict U.S. banks and other financial institutions that accept deposits from conducting proprietary trading activities, as well as investing in hedge funds and private equity funds for their own account. The intent of the Volcker Rule is to reduce risk to the capital of such institutions through reducing speculation and risk-taking with bank capital. The draft form of the proposed rule was exposed for comment until February 13, 2012 and became effective on July 21, 2015. There may be additional changes to the requirements of the Volcker Rule and it is impossible to determine the Volcker Rule's impact on market liquidity and on the liquidity of issued sovereign debt in Europe and Asia. Various committees of Congress are reviewing the impact of the Volcker Rule and are potentially moving to reduce its impact on smaller institutions. The Company believes that the Volcker Rule will not directly affect its operations, but indirect effects cannot be predicted with any certainty. Additionally, the Federal Reserve in conjunction with other U.S. regulatory organizations has analyzed the U.S. financial system and the impact that might result from the failure of one or more "Strategically Important Financial Institutions" ("SIFI"). To date, less than 50 such institutions have been identified and will be made subject to special regulations including the requirement to create a plan for their orderly demise in the event of a failure. Oppenheimer has not been identified as a SIFI. Recently one SIFI has proposed voluntarily discontinuing significant portions of its business to be relieved of the SIFI designation. There can be no assurance that this list will not grow to include more SIFI institutions. The identification process has not been completed and is subject to appeal by the affected institutions. The Company has no reason to believe that it will be identified as a SIFI. But, this requirement may have broader implications for the capital markets as capital becomes less available in various markets and markets become increasingly volatile.
Recent revelations concerning the potential manipulation of LIBOR ("London Interbank Offered Rate") during the period from 2008-2010 make it likely that more regulation surrounding the fixing of interest rates on commercial bank loans and reference rates on derivatives can be expected. Similar investigations are underway with respect to the setting of foreign exchange rates over a broad time period and there is no way to predict the outcome of these investigations although recently enforcement has been instituted against a number of international banks as well as employees of such banks with sizable fines being assessed.
The rules and requirements that were created by the passage of the Patriot Act and the anti-money laundering regulations (AML) in the U.S. and similar laws in other countries that are related, have created significant costs of compliance and can be expected to continue to do so. FinCEN ("Financial Crimes Enforcement Network") has heightened their review of activities of broker-dealers where heretofore their focus had been on commercial banks. This increased focus is likely to lead to significantly higher levels of enforcement and higher fines and penalties on broker-dealers. FinCEN has proposed new rules on customer due diligence that the Company expects will become effective in 2016. Regulators have expanded their views of the requirements of the Patriot Act, as well as their views of the enforcement of the provisions of the Bank Secrecy Act ("BSA") and the Foreign Corrupt Practices Act ("FCPA") with respect to the amount of diligence required by financial institutions of both their foreign and domestic clients and their activities. As a result, the Company has increased staffing, made additional investments in its due diligence systems, upgraded its monitoring systems and significantly revised its AML policies and procedures.
Pursuant to FINRA Rule 3130 (formerly NASD Rule 3013 and NYSE Rule 342), the chief executive officers ("CEOs") of regulated broker-dealers (including the CEO of Oppenheimer) are required to certify that their companies have processes in place to establish and test supervisory policies and procedures reasonably designed to achieve compliance with federal securities laws and regulations, including applicable regulations of self-regulatory organizations. The CEO of the Company is required to make such a certification on an annual basis and did so in March 2015.
On July 30, 2013, the SEC adopted final amendments to the financial responsibility rules ("FRRs") and reporting rules under SEC Rule 17a-5 ("Reporting Rule") for broker-dealers. The final amendments to the FRRs make changes to the rules related to proprietary accounts for broker-dealers, special reserve deposits with banks, bank sweep programs, deductions from net worth, solvency requirements, the SEC's ability to restrict withdrawals of capital, books and records requirements, and notifications to regulators. The rules became effective on March 3, 2014 except for the Reporting Rule which became effective on December 31, 2013.
The Reporting Rule requires all broker-dealers to file a new unaudited quarterly Form Custody report which provides information around custodial practices. In addition, the new Reporting Rule provides significant changes to annual reporting of broker-dealers by eliminating the internal control report referred to as the Material Inadequacy Letter, and providing for a new Compliance Report asserting the effectiveness of internal controls for compliance with net capital, customer reserve formula, quarterly security count, and customer account statements. Also, the Reporting Rule makes changes to the audit and attestation requirements for auditor reporting from American Institute of Certified Public Accountants ("AICPA") standards to Public
39
Company Accounting Oversight Board ("PCAOB") standards as well as provides the SEC with access to auditors and audit workpapers. These rules are effective for fiscal years ending on or after June 1, 2014.
On May 14, 2013, the Committee of Sponsoring Organizations of the Treadway Commission (COSO) released an updated version of its Internal Control – Integrated Framework (the "2013 Framework"), which supersedes the original framework that was developed in 1992. The Company adopted the 2013 Framework on December 15, 2014 as a basis for their compliance with the Sarbanes-Oxley Act of 2002.
In September 2015, FINRA released Regulatory Notice 15-33 which provides guidance on effective liquidity risk management strategies. Based on the guidelines, broker-dealers are expected to rigorously evaluate their liquidity needs related to both market wide stress and idiosyncratic stresses, devote sufficient resources to measuring risks applicable to its business and report the results of measurement to senior management. This would include a review for what those risks might be based on historical events that have affected the firm or other firms and stresses that could occur but have not yet been observed. Additionally, based on the guidelines, every broker-dealer needs to consider developing contingency plans for addressing those risks so that the firm will have sufficient liquidity to operate after the stress occurs while continuing to protect all customer assets, conduct stress tests and other reviews to evaluate the effectiveness of the contingency plans, have a training plan for its staff and have tested processes on which it intends to rely if such stresses occur. The Company is reviewing these guidelines and plans to assess them in the context of its current liquidity risk management strategies and will make any necessary enhancements to its procedures upon the conclusion of its review.
Other Regulatory Matters
On February 19, 2015, the Board of Directors of the Company (the "Board") formed a Special Committee of the Board (the "Special Committee") in order to engage an independent law or consulting firm to conduct a review of Oppenheimer and OAM’s broker-dealer and investment adviser compliance processes and related internal controls and governance processes and provide recommendations to the Special Committee on how to improve any of the foregoing. On February 19, 2015, the Special Committee agreed to engage an independent law firm to conduct the aforementioned review. On April 22, 2015, the Special Committee agreed to retain Kalorama Partners LLP to act as the independent law firm. In July 2015, the Company created a Compliance Committee made up of independent directors to oversee the Company’s compliance with applicable rules and regulations. As part of its engagement, the Company agreed that the recommendations of the independent law firm be shared with the SEC. Moreover, Oppenheimer and OAM have agreed to adopt recommendations made by the independent law firm. The Company has implemented a number of recommendations made by the independent law firm. However, as of December 31, 2015, the independent law firm was continuing its review.
For several quarters, Oppenheimer has been responding to information requests from FINRA regarding the sale of leveraged and inverse exchange traded funds ("ETFs"). A number of Oppenheimer employees have provided on-the-record testimony in connection with the FINRA inquiry. The Company believes that FINRA may file a complaint against the Company in connection with the investigation.
Since early 2014, Oppenheimer has been responding to information requests from FINRA regarding the supervision of one of its former financial advisers who was indicted by the United States Attorney's Office for the District of New Jersey in March 2014 on allegations of insider trading. In August 2014, Oppenheimer received information requests from the SEC regarding supervision of the same financial adviser. A number of Oppenheimer employees have provided on-the-record testimony in connection with the SEC inquiry. Oppenheimer is continuing to cooperate with both the FINRA and SEC inquiries.
Since January 2016, Oppenheimer has been responding to information requests from FINRA regarding the sale of Class A mutual fund shares to charitable organizations and certain qualified retirement plans. Oppenheimer is continuing to cooperate with FINRA in this inquiry.
In February 2010, Oppenheimer finalized settlements with the Regulators concluding investigations and administrative proceedings by the Regulators concerning Oppenheimer’s marketing and sale of ARS. Pursuant to the settlements with the Regulators, Oppenheimer agreed to extend offers to repurchase ARS from certain of its clients subject to certain terms and conditions. In addition to the settlements with the Regulators, Oppenheimer has also reached settlements of and received adverse awards in legal proceedings with various clients where the Company is obligated to purchase ARS. Pursuant to completed Purchase Offers (as defined) under the settlements with the Regulators and client related legal settlements and awards to purchase ARS, as of December 31, 2015, the Company purchased and holds (net of redemptions) approximately $92.0 million in ARS from its clients. As of December 31, 2015, the Company had $5.0 million of outstanding ARS purchase commitments related to the settlements with the Regulators. In addition, the Company is committed to purchase another $22.8 million from clients through 2020 under legal settlements and awards.
40
The ARS positions that the Company owns and are committed to purchase primarily represent auction rate preferred securities issued by closed-end funds and, to a lesser extent, municipal auction rate securities which are municipal bonds wrapped by municipal bond insurance and student loan auction rate securities which are asset-backed securities backed by student loans.
The Company's clients held at Oppenheimer approximately $101.6 million of ARS at December 31, 2015 exclusive of amounts that 1) were owned by Qualified Institutional Buyers ("QIBs"), 2) were transferred to the Company after February 2008, 3) were purchased by clients after February 2008, or 4) were transferred from the Company to other securities firms after February 2008. See "Off-Balance Sheet Arrangements" herein for additional details.
Other Matters
The Company operates in all state jurisdictions in the United States and is thus subject to regulation and enforcement under the laws and regulations of each of these jurisdictions. The Company has been and expects that it will continue to be subject to investigations and some or all of these may result in enforcement proceedings as a result of its business conducted in the various states.
As part of its ongoing business, the Company records reserves for legal expenses, judgments, fines and/or awards attributable to litigation and regulatory matters. In connection therewith, the Company has maintained its legal reserves at levels it believes will resolve outstanding matters, but may increase or decrease such reserves as matters warrant. In accordance with applicable accounting guidance, the Company establishes reserves for litigation and regulatory matters when those matters present loss contingencies that are both probable and reasonably estimable. When loss contingencies are not both probable and reasonably estimable, the Company does not establish reserves. See "Legal Proceedings" herein and Note 16 to the consolidated financial statements appearing in Item 8.
Business Continuity
The Company is committed to an on-going investment in its technology and communications infrastructure including extensive business continuity planning and investment. These costs are on-going and the Company believes that current and future costs will exceed historic levels due to business and regulatory requirements. The Company built a new data center in 2010 which is housed in a location different than its headquarters. The move to new headquarters in 2012 required additional outlays for business continuity purposes although considerable savings have begun to be realized by the availability of independent electric generating capacity for the entire building which will support the Company's infrastructure and occupancy.
The fourth quarter of 2012 was impacted by Superstorm Sandy which occurred on October 29, 2012 causing the Company to vacate its two principal offices in downtown Manhattan and displaced 800 of the Company's employees including substantially all of its capital markets, operations and headquarters staff for in excess of 30 days. The Company continues to review both internally and with its landlords and vendors the infrastructure necessary to withstand a similar event in light of the issues that arose in the fall of 2012.
Cybersecurity
The Company has been focused for many years on the issues of maintaining the security of its clients' data, access to its data processing environment, and its data processing facilities. Recent examples of vulnerabilities by other companies and the government which have resulted in loss of client data and fraudulent activities by both domestic and foreign entities have caused the Company to review its security policies and procedures and to take additional actions to protect its network and its information. Such threats are ongoing. Given the importance of protection of client data, there has developed increased regulatory oversight of cybersecurity planning and protections have been put in place by broker-dealers and other financial service providers. This planning is subject to oversight and examination on a periodic or targeted basis by the SEC and FINRA. The Company continues to adopt procedures to address the risks posed by the current environment. The Company has significantly increased the resources dedicated to this effort and believes that such increases will be required in the future.
41
Outlook
The Company recognizes the increased focus on compliance with the regulatory requirements of our industry, and we must continue to perform a rigorous and ongoing assessment of our compliance and risk management efforts, invest in people and programs, all while continuing to provide a platform with first class investment ideas and services. The Company's long-term growth plan is to continue to expand existing offices by hiring experienced professionals as well as expand through the purchase of operating branch offices from other broker dealers or the opening of new branch offices in attractive locations, thus maximizing the potential of each office and the development of existing trading, investment banking, investment advisory and other activities. Equally important is the search for viable acquisition candidates. As opportunities are presented, it is the long-term intention of the Company to pursue growth by acquisition where a comfortable match can be found in terms of corporate goals and personnel at a price that would provide the Company's stockholders with incremental value. The Company may review potential acquisition opportunities, and will continue to focus its attention on the management of its existing business and may, from time to time, dispose of businesses that are no longer strategic to its business operations or which have limited opportunities for growth. In addition, the Company is committed to improving its technology capabilities to ensure compliance with industry regulations, support client service and expand its capital markets capabilities.
Results of Operations
The Company reported net income attributable to Oppenheimer Holdings Inc. of $2.0 million or $0.14 basic earnings per share for the year ended December 31, 2015 compared with net income of $8.8 million or $0.65 basic earnings per share for the year ended December 31, 2014, a decrease of 77.8%. Income before income tax provision for the year ended December 31, 2015 was $6.7 million compared with income before income tax provision of $25.7 million for the year ended December 31, 2014, a decrease of 73.9%. Revenue for the year ended December 31, 2015 was $928.4 million, a decrease of 7.6% compared with revenue of $1.0 billion for the year ended December 31, 2014.
The following table sets forth the amount and percentage of the Company's revenue from each principal source for each of the following years ended December 31:
Expressed in thousands) | ||||||||||||||||||||
2015 | 2014 | 2013 | ||||||||||||||||||
Amount | Percentage | Amount | Percentage | Amount | Percentage | |||||||||||||||
Commissions | $ | 417,559 | 45 | % | $ | 469,829 | 47 | % | $ | 486,767 | 48 | % | ||||||||
Advisory fees | 280,247 | 30 | % | 281,680 | 28 | % | 274,178 | 27 | % | |||||||||||
Investment banking | 102,540 | 11 | % | 125,598 | 12 | % | 97,977 | 10 | % | |||||||||||
Interest | 51,031 | 6 | % | 49,244 | 5 | % | 53,216 | 5 | % | |||||||||||
Principal transactions, net | 20,503 | 2 | % | 29,699 | 3 | % | 43,768 | 4 | % | |||||||||||
Other | 56,505 | 6 | % | 48,414 | 5 | % | 63,808 | 6 | % | |||||||||||
Total revenue | $ | 928,385 | 100 | % | $ | 1,004,464 | 100 | % | $ | 1,019,714 | 100 | % | ||||||||
The Company derives most of its revenue from the operations of its principal subsidiaries, Oppenheimer and OAM. Although maintained as separate entities, the operations of the Company's brokerage subsidiaries both in the U.S. and other countries are closely related because Oppenheimer acts as clearing broker in transactions initiated by these subsidiaries. Except as expressly otherwise stated, the discussion below pertains to the operations of Oppenheimer.
42
The following table and discussion summarizes the changes in the major revenue and expense categories for the past two years:
(Expressed in thousands) | |||||||||||||
2015 versus 2014 | 2014 versus 2013 | ||||||||||||
Amount Change | % Change | Amount Change | % Change | ||||||||||
Revenue | |||||||||||||
Commissions | $ | (52,270 | ) | (11.1 | ) | $ | (16,938 | ) | (3.5 | ) | |||
Advisory fees | (1,433 | ) | (0.5 | ) | 7,502 | 2.7 | |||||||
Investment banking | (23,058 | ) | (18.4 | ) | 27,621 | 28.2 | |||||||
Interest | 1,787 | 3.6 | (3,972 | ) | (7.5 | ) | |||||||
Principal transactions, net | (9,196 | ) | (31.0 | ) | (14,069 | ) | (32.1 | ) | |||||
Other | 8,091 | 16.7 | (15,394 | ) | (24.1 | ) | |||||||
Total revenue | (76,079 | ) | (7.6 | ) | (15,250 | ) | (1.5 | ) | |||||
Expenses | |||||||||||||
Compensation and related expenses | (41,415 | ) | (6.2 | ) | (11,295 | ) | (1.7 | ) | |||||
Communications and technology | (260 | ) | (0.4 | ) | 1,353 | 2.1 | |||||||
Occupancy and equipment costs | 132 | 0.2 | (3,746 | ) | (5.6 | ) | |||||||
Clearing and exchange fees | 1,313 | 5.3 | 228 | 0.9 | |||||||||
Interest | (478 | ) | (2.7 | ) | (8,341 | ) | (31.9 | ) | |||||
Other | (16,346 | ) | (11.6 | ) | 24,724 | 21.2 | |||||||
Total expenses | (57,054 | ) | (5.8 | ) | 2,923 | 0.3 | |||||||
Income before income tax provision | (19,025 | ) | (73.9 | ) | (18,173 | ) | (41.4 | ) | |||||
Income tax provision | (12,362 | ) | (76.4 | ) | (1,581 | ) | (8.9 | ) | |||||
Net income for the year | (6,663 | ) | (69.7 | ) | (16,592 | ) | (63.4 | ) | |||||
Less net income attributable to noncontrolling interest | 201 | 27.3 | (357 | ) | (32.7 | ) | |||||||
Net income attributable to Oppenheimer Holdings Inc. | $ | (6,864 | ) | (77.8 | ) | $ | (16,235 | ) | (64.8 | ) | |||
Fiscal 2015 compared to Fiscal 2014
Revenue
Commission revenue was $417.6 million for the year ended December 31, 2015, a decrease of 11.1% compared with $469.8 million for the year ended December 31, 2014 due to a lower financial adviser headcount and reduced transaction volumes from retail investors during the 2015 year.
Advisory fees were $280.2 million for the year ended December 31, 2015, a decrease of 0.5% compared with $281.7 million for the year ended December 31, 2014.
Investment banking revenue was $102.5 million for the year ended December 31, 2015, a decrease of 18.4% compared with $125.6 million for the year ended December 31, 2014 due to decreases in equities underwriting fees and fees from mergers and acquisitions activity during the 2015 year.
Interest revenue was $51.0 million for the year ended December 31, 2015, an increase of 3.6% compared with $49.2 million in 2014.
Principal transactions revenue was $20.5 million for the year ended December 31, 2015, a decrease of 31.0% compared with $29.7 million for the year ended December 31, 2014 due to lower trading profits in equities and fixed income offset by higher profits from interest rate lock commitments in the Commercial Mortgage Banking business during the 2015 year.
Other revenue was $56.5 million for the year ended December 31, 2015, an increase of 16.7% compared to $48.4 million for the year ended December 31, 2014 primarily due to increases in interest earned on FDIC-insured bank deposits and in loan modifications of commercial mortgages offset by decreases in the cash surrender value of Company-owned life insurance during the 2015 year.
43
Expenses
Compensation and related expenses (including salaries, production and incentive compensation, share-based compensation, deferred compensation, and other benefit-related items) totaled $623.2 million during the year ended December 31, 2015, a decrease of 6.2% compared with the year ended December 31, 2014. The decrease was due to lower production, incentive, share-based, and deferred compensation expenses during the year ended December 31, 2015. Compensation and related expenses as a percentage of revenue was 67.1% during the year ended December 31, 2015 compared with 66.2% during the year ended December 31, 2014, reflecting the inelasticity of some forms of incentive compensation spread over a lower revenue base for the year ended December 31, 2015.
Non-compensation expenses were $298.4 million during the year ended December 31, 2015, a decrease of 5.0% compared with $314.1 million during for the year ended December 31, 2014 as lower legal and regulatory costs were offset by higher professional and consulting fees and clearing charges during the year ended December 31, 2015.
The effective income tax rate for the year ended December 31, 2015 was 56.8% compared with 62.8% for the year ended December 31, 2014. The effective income tax rate for the year ended December 31, 2015 was negatively impacted by increases in provisions related to positions taken on state income tax returns as well as income tax provision to tax return true-ups that were recorded during the year.
Fiscal 2014 compared to Fiscal 2013
Revenue
Commission revenue was $469.8 million for the year ended December 31, 2014, a decrease of 3.5% compared with $486.8 million in 2013 due to low transaction volumes from retail investors during the 2014 year.
Advisory fees were $281.7 million for the year ended December 31, 2014, an increase of 2.7% compared with $274.2 million in 2013 due to increases in advisory fees on traditional managed products offset by decreases in incentive fees earned from the Company's participation in hedge funds in its asset management business.
Investment banking revenue was $125.6 million for the year ended December 31, 2014, an increase of 28.2% compared with $98.0 million in 2013 due to increases in fees earned from mergers and acquisitions activity and offset by decreases in equities underwriting fees during the 2014 year.
Interest revenue was $49.2 million for the year ended December 31, 2014, a decrease of 7.5% compared with $53.2 million in 2013, primarily attributable to a decrease in interest from lower holdings of overnight reverse repurchase agreements and U.S. government and agency securities.
Principal transactions revenue was $29.7 million for the year ended December 31, 2014, a decrease of 32.1% compared with $43.8 million in 2013 due to lower trading profits in equities and fixed income and lower originations of commercial mortgages during the 2014 year.
Other revenue was $48.4 million for the year ended December 31, 2014, a decrease of 24.1% compared to $63.8 million in 2013 due to the decrease in the value of assets underlying the deferred compensation plan and lower fees earned due to a lower number of loan originations (36 loans originated in the year ended December 31, 2014 compared to 62 loans originated in the year ended December 31, 2013).
Expenses
Compensation and benefits (including salaries, production and incentive compensation, share-based compensation, deferred compensation, and other benefit-related items) totaled $664.6 million during the year ended December 31, 2014, a decrease of 1.7% over the year ended December 31, 2013. Increases in incentive compensation were offset by decreases in production-related compensation, share based and deferred compensation obligations during the year ended December 31, 2014. Compensation and related expenses as a percentage of revenue was 66.2% during the year ended December 31, 2014 compared to 66.3% for the year ended December 31, 2013.
Non-compensation expenses were $314.1 million during the year ended December 31, 2014, an increase of 4.7% compared to $299.9 million during the 2013 year due to higher legal and regulatory costs (including largely non-deductible payments to regulators in the amount of $20.0 million in the aggregate) partially offset by lower debt service costs as a result of the partial redemption of the Senior Secured Notes during the 2014 year.
44
The table below presents information about the reported revenue and income (loss) before income tax provision (benefit) of the Company's reportable business segments for the years ended December 31, 2015 and 2014:
(Expressed in thousands) | ||||||||||
For the Year Ended December 31, | ||||||||||
2015 | 2014 | % Change | ||||||||
Revenue | ||||||||||
Private Client | $ | 521,526 | $ | 582,364 | (10.4 | ) | ||||
Asset Management | 97,121 | 99,964 | (2.8 | ) | ||||||
Capital Markets | 279,589 | 298,597 | (6.4 | ) | ||||||
Commercial Mortgage Banking | 30,584 | 23,329 | 31.1 | |||||||
Corporate/Other | (435 | ) | 210 | * | ||||||
928,385 | 1,004,464 | (7.6 | ) | |||||||
Income (Loss) before income tax provision (benefit) | ||||||||||
Private Client | 59,016 | 60,116 | (1.8 | ) | ||||||
Asset Management | 33,133 | 33,707 | (1.7 | ) | ||||||
Capital Markets | 5,167 | 17,819 | (71.0 | ) | ||||||
Commercial Mortgage Banking | 9,139 | 8,546 | 6.9 | |||||||
Corporate/Other | (99,744 | ) | (94,452 | ) | 5.6 | |||||
$ | 6,711 | $ | 25,736 | (73.9 | ) | |||||
* Not comparable
Private Client
Private Client reported revenue of $521.5 million for the year ended December 31, 2015, 10.4% lower than the year ended December 31, 2014, due to lower levels of transaction-based business and a lower financial adviser headcount during the year ended December 31, 2015. Income before income tax provision was $59.0 million for the year ended December 31, 2015, a decrease of 1.8% compared with the year ended December 31, 2014, due to lower levels of activity, partially offset by decreases in legal and regulatory costs during the year ended December 31, 2015.
• | Retail commissions were $246.6 million for the year ended December 31, 2015, a decrease of 18.0% from the year ended December 31, 2014. |
• | Advisory fee revenue on traditional and alternative managed products was $188.6 million for the year ended December 31, 2015, an increase of 0.6% from the year ended December 31, 2014. |
◦ | Incentive fees from the participation in hedge funds were $870,000 for the year ended December 31, 2015 compared with $366,000 over the 2014 year, an increase of 137.7%. |
• | Interest earned on FDIC-insured bank deposits was $12.3 million for the year ended December 31, 2015 versus $5.6 million for the year ended December 31, 2014. Money market fee waivers totaled $6.3 million for the year ended December 31, 2015 compared with waivers of $31.0 million for the year ended December 31, 2014. |
Asset Management
Asset Management reported revenue of $97.1 million for the year ended December 31, 2015, 2.8% lower than the year ended December 31, 2014 due to decreases in advisory fees on traditional managed products. Income before income tax provision was $33.1 million for the year ended December 31, 2015, a decrease of 1.7% compared with the year ended December 31, 2014.
• | Advisory fee revenue on traditional and alternative managed products was $91.7 million for the year ended December 31, 2015, a decrease of 2.0% from the year ended December 31, 2014. |
◦ | Incentive fees from the participation in hedge funds were $691,000 for the year ended December 31, 2015 compared with $415,000 for the year ended December 31, 2014, an increase of 66.5%. |
45
The following table provides a breakdown of the change in assets under management for the year ended December 31, 2015:
(Expressed in millions) | |||||||||||||||||||
For the Year Ended December 31, 2015 | |||||||||||||||||||
Beginning Balance | Appreciation (Depreciation) | Ending Balance | |||||||||||||||||
Contributions | Redemptions | ||||||||||||||||||
Fund Type | |||||||||||||||||||
Traditional (1) | $ | 21,803 | $ | 2,276 | $ | (3,474 | ) | $ | (476 | ) | $ | 20,129 | |||||||
Institutional Fixed Income (2) | 1,195 | 52 | (142 | ) | 93 | 1,198 | |||||||||||||
Alternative Investments: | |||||||||||||||||||
Hedge funds (3) | 2,542 | 296 | (453 | ) | 130 | 2,515 | |||||||||||||
Private Equity Funds (4) | 344 | — | — | (76 | ) | 268 | |||||||||||||
$ | 25,884 | $ | 2,624 | $ | (4,069 | ) | $ | (329 | ) | $ | 24,110 | ||||||||
(1) | Traditional investments include third party advisory programs, Oppenheimer financial adviser managed and advisory programs, and Oppenheimer Asset Management taxable and tax-exempt portfolio management strategies. |
(2) | Institutional fixed income provides solutions to institutional investors including: Taft-Hartley Funds, Public Pension Funds, Corporate Pension Funds, and Foundations and Endowments. |
(3) | Hedge funds represent single manager hedge fund strategies in areas including hedged equity, technology and financial services, and multi-manager and multi-strategy fund of funds. |
(4) | Private equity funds represent private equity fund of funds including portfolios focused on natural resources and related assets. |
Capital Markets
Capital Markets reported revenue of $279.6 million for the year ended December 31, 2015, 6.4% lower than the year ended December 31, 2014, primarily due to lower advisory fees from mergers and acquisitions activity and equities underwriting fees. Income before income tax provision was $5.2 million for the year ended December 31, 2015, a decrease of 71.0% compared with income before income tax provision of $17.8 million for the year ended December 31, 2014.
• | Institutional equities commissions increased 0.4% to $115.9 million for the year ended December 31, 2015 compared with the year ended December 31, 2014. |
• | Advisory fees earned from investment banking activities decreased 22.6% to $41.8 million for the year ended December 31, 2015 compared with the year ended December 31, 2014 due to a decrease in mergers and acquisitions activity during the year ended December 31, 2015. |
• | Equities underwriting fees decreased 25.1% to $35.3 million for the year ended December 31, 2015 compared with the year ended December 31, 2014. |
• | Revenue from Taxable Fixed Income increased 0.5% to $65.3 million for the year ended December 31, 2015 compared with the year ended December 31, 2014. |
• | Public Finance and Municipal Trading revenue decreased 6.0% to $21.9 million for the year ended December 31, 2015 compared with the year ended December 31, 2014. |
Commercial Mortgage Banking
Commercial Mortgage Banking reported revenue of $30.6 million for the year ended December 31, 2015, 31.1% higher than the year ended December 31, 2014, primarily due to increases in loan modifications of commercial mortgages offset by lower loan originations during the year ended December 31, 2015. Income before income tax provision was $9.1 million for the year ended December 31, 2015, an increase of 6.9% compared with the year ended December 31, 2014.
• | Premium income earned from loan modifications was $30.5 million for the year ended December 31, 2015 compared with $9.9 million for the year ended December 31, 2014 as the Company modified 43 commercial loans (19 in the year ended December 31, 2014) with an aggregate principal loan balance of $363.4 million ($119.1 million in the year ended December 31, 2014). |
• | Loan origination fees for the year ended December 31, 2015 were $3.6 million, a decrease of 20.0% compared with the year ended December 31, 2014, as the Company originated 23 commercial loans (36 in the year ended December |
46
31, 2014) with an aggregate principal loan balance of $305.7 million ($285.4 million in the year ended December 31, 2014) due to lower loan origination rates charged during the year ended December 31, 2015.
• | Net servicing revenue for the year ended December 31, 2015 was $6.0 million compared with $5.6 million for the year ended December 31, 2014, an increase of 7.1%. |
Liquidity and Capital Resources
At December 31, 2015, total assets decreased by 3.4% from December 31, 2014. The Company satisfies its need for short-term funds from internally generated funds and collateralized and uncollateralized borrowings, consisting primarily of bank call loans, stock loans, uncommitted lines of credit, and warehouse facilities. The Company finances its trading in government securities through the use of repurchase agreements. The Company's longer-term capital needs are met through the issuance of the Notes (see "Refinancing" below). The amount of Oppenheimer's bank borrowings fluctuates in response to changes in the level of the Company's securities inventories and customer margin debt, changes in notes receivable from employees, investment in office facilities, and changes in stock loan balances and financing through repurchase agreements. Oppenheimer has arrangements with banks for borrowings on a fully-collateralized basis. At December 31, 2015, the Company had $100.2 million of such borrowings outstanding compared to outstanding borrowings of $59.4 million at December 31, 2014. The Company also has some availability of short-term bank financing on an unsecured basis.
Volatility in the financial markets and ongoing concerns about the speed and degree of economic recovery has had an adverse effect on the availability of credit through traditional sources. As a result of concerns around financial markets generally and the strength of counterparties specifically, lenders have reduced and, in some cases, ceased to provide funding on both a secured and unsecured basis to financial service providers.
The Company's overseas subsidiaries, Oppenheimer Europe Ltd. and Oppenheimer Investments Asia Limited, are subject to local regulatory capital requirements which restrict the Company's ability to utilize this capital for other purposes. The regulatory capital requirements for Oppenheimer Europe Ltd. and Oppenheimer Investments Asia Limited were $4.2 million and $387,000, respectively, at December 31, 2015. See Note 17 to the consolidated financial statements appearing in Item 8. The liquid assets at Oppenheimer Europe Ltd. are primarily comprised of cash deposits in bank accounts. The liquid assets at Oppenheimer Investments Asia Limited are primarily comprised of investments in U.S. Treasuries and cash deposits in bank accounts. Any restrictions on transfer of these liquid assets from Oppenheimer Europe Ltd. and Oppenheimer Investments Asia Limited to the Company or its other subsidiaries would be limited by the regulatory capital requirements.
The Company permanently reinvests eligible earnings of its foreign subsidiaries in such subsidiaries and, accordingly, does not accrue any U.S. income taxes that would arise if these earnings were repatriated. The unrecognized deferred tax liability associated with earnings of foreign subsidiaries, net of associated U.S. foreign tax credits, is estimated at $2.5 million for those subsidiaries with respect to which the Company would be subject to residual U.S. tax on cumulative earnings through 2015 were those earnings to be repatriated. See Note 14 to the consolidated financial statements appearing in Item 8. The Company intends to continue to permanently reinvest the excess earnings of Oppenheimer Israel (OPCO) Ltd. in its own business and in the businesses in Europe and Asia to support business initiatives in those regions.
In February 2010, Oppenheimer finalized settlements with the Regulators concluding investigations and administrative proceedings concerning Oppenheimer's marketing and sale of ARS. Pursuant to those settlements and legal settlements and awards, the Company has purchased and will, subject to the terms and conditions of the settlements, continue to purchase ARS on a periodic basis. The ultimate amount of ARS to be repurchased by the Company cannot be predicted with any certainty and will be impacted by redemptions by issuers and legal and other actions by clients during the relevant period which cannot be predicted. See "Risk Factors – The Company may continue to be adversely affected by the failure of the Auction Rate Securities Market," as well as Item 7 "Management's Discussion and Analysis of Financial Condition and Results of Operations – Business Environment – Other Regulatory Matters and – Other Matters" and "Off-Balance Sheet Arrangements" for additional details.
Additional settlements of regulatory matters could have an adverse effect on the Company's liquidity depending on the size and composition of any such settlement.
47
Refinancing
On April 12, 2011, the Company completed the private placement of $200.0 million in aggregate principal amount of 8.75% Senior Secured Notes due April 15, 2018 (the "Notes") at par. Interest on the Notes is payable semi-annually on April 15th and October 15th. On April 15, 2014, the Company retired early a total of $50.0 million (25%) of the Notes. Upon completion of the redemption and retirement on April 15, 2014, $150.0 million aggregate principal amount of the Notes remains outstanding. See Note 11 to the consolidated financial statements appearing in Item 8 for further discussion.
On June 17, 2015, S&P affirmed the Company's and its Notes' "B" rating and affirmed its stable outlook on the Notes. On December 28, 2015, Moody's Corporation affirmed the Company's 'B2' Corporate Family rating and 'B2' rating on the Notes and revised its outlook from stable to positive.
Liquidity
For the most part, the Company's assets consist of cash and cash equivalents and assets which can be readily converted into cash. Receivable from brokers, dealers and clearing organizations represents deposits for securities borrowed transactions, margin deposits or current transactions awaiting settlement. Receivable from customers represents margin balances and amounts due on transactions awaiting settlement. The Company's receivables are, for the most part, collateralized by marketable securities. The Company's collateral maintenance policies and procedures are designed to limit the Company's exposure to credit risk. Securities owned, with the exception of the ARS, are mainly comprised of actively trading, readily marketable securities. The Company advanced $13.8 million in forgivable notes to employees (which are inherently illiquid) for the year ended December 31, 2015 ($12.0 million for the year ended December 31, 2014) as upfront or backend inducements. The amount of funds allocated to such inducements will vary with hiring activity.
The Company satisfies its need for short-term liquidity from internally generated funds, collateralized and uncollateralized bank borrowings, stock loans and repurchase agreements and warehouse facilities. Bank borrowings are collateralized by firm and customer securities. In addition, letters of credit are issued in the normal course of business to satisfy certain collateral requirements in lieu of depositing cash or securities.
The Company does not repatriate the earnings of its foreign subsidiaries. Foreign earnings are permanently reinvested for the use of the foreign subsidiaries and therefore these foreign earnings are not available to satisfy the domestic liquidity requirements of the Company.
The Company obtains short-term borrowings primarily through bank call loans. Bank call loans are generally payable on demand and bear interest at various rates not exceeding the broker call rate. At December 31, 2015, bank call loans were $100.2 million ($59.4 million at December 31, 2014). The average daily bank loan outstanding for the year ended December 31, 2015 was $116.3 million ($108.2 million for the year ended December 31, 2014). The largest daily bank loan outstanding for the year ended December 31, 2015 was $246.9 million ($247.9 million for the year ended December 31, 2014). The average weighted interest rate on bank call loans applicable on December 31, 2015 was 1.56%.
At December 31, 2015, securities loan balances totaled $130.7 million ($137.9 million at December 31, 2014). The average daily securities loan balance for the year ended December 31, 2015 was $177.9 million ($195.6 million for the year ended December 31, 2014). The largest daily stock loan balance for the year ended December 31, 2015 was $244.2 million ($293.4 million for the year ended December 31, 2014).
The Company finances its government trading operations through the use of securities purchased under agreements to resell ("reverse repurchase agreements") and securities sold under agreements to repurchase ("repurchase agreements"). Except as described below, repurchase and reverse repurchase agreements, principally involving government and agency securities, are carried at amounts at which securities subsequently will be resold or reacquired as specified in the respective agreements and include accrued interest. Repurchase and reverse repurchase agreements are presented on a net-by-counterparty basis, when the repurchase and reverse repurchase agreements are executed with the same counterparty, have the same explicit settlement date, are executed in accordance with a master netting arrangement, the securities underlying the repurchase and reverse repurchase agreements exist in "book entry" form and certain other requirements are met.
48
Certain of the Company's repurchase agreements and reverse repurchase agreements are carried at fair value as a result of the Company's fair value option election. The Company elected the fair value option for those repurchase agreements and reverse repurchase agreements that do not settle overnight or have an open settlement date. The Company has elected the fair value option for these instruments to more accurately reflect market and economic events in its earnings and to mitigate a potential imbalance in earnings caused by using different measurement attributes (i.e. fair value versus carrying value) for certain assets and liabilities. At December 31, 2015, the fair value of the reverse repurchase agreements and repurchase agreements for which the fair value option was elected were $206.5 million and $nil, respectively.
At December 31, 2015, the gross balances of reverse repurchase agreements and repurchase agreements were $282.0 million and $727.0 million, respectively. The average daily balance of reverse repurchase agreements and repurchase agreements on a gross basis for the year ended December 31, 2015 was $373.5 million and $870.3 million, respectively ($430.8 billion and $949.1 million, respectively, for the year ended December 31, 2014). The largest daily amount of reverse repurchase agreements and repurchase agreements outstanding on a gross basis during the year ended December 31, 2015 was $836.5 million and $1.4 billion, respectively ($922.8 million and $1.4 billion, respectively, for the year ended December 31, 2014).
At December 31, 2015, the notional value of the repo-to-maturity was $nil. The average balance for the repo-to-maturity for the year ended December 31, 2015 was $nil. At December 31, 2015, the gross leverage ratio was 5.1.
OMHHF, which is engaged in commercial mortgage origination and servicing, has obtained an uncommitted warehouse facility line through PNC under which OMHHF pledges FHA-guaranteed mortgages for a period averaging 15 business days and PNC table funds the principal payment to the mortgagee. At December 31, 2015, OMHHF had $54.3 million outstanding under the warehouse facility line at a variable interest rate of 1 month LIBOR plus a spread.
Liquidity Management
The Company manages its need for liquidity on a daily basis to ensure compliance with regulatory requirements. The Company's liquidity needs may be affected by market conditions, increased inventory positions, business expansion and other unanticipated occurrences. In the event that existing financial resources do not satisfy the Company's needs, the Company may have to seek additional external financing. The availability of such additional external financing may depend on market factors outside the Company's control.
The Company regularly reviews its sources of liquidity and financing and conducts internal stress analysis to determine the impact on the Company of events that could remove sources of liquidity or financing and to plan actions the Company could take in the case of such an eventuality. The Company's reviews have resulted in plans that the Company believes would result in a reduction of assets through liquidation that would significantly reduce the Company's need for external financing.
Funding Risk
(Expressed in thousands) | |||||||
For the Year Ended December 31, | |||||||
2015 | 2014 | ||||||
Cash (used in) provided by operating activities | $ | (20,819 | ) | $ | 78,315 | ||
Cash used in investing activities | (5,889 | ) | (4,398 | ) | |||
Cash provided by (used in) financing activities | 26,265 | (108,404 | ) | ||||
Net decrease in cash and cash equivalents | $ | (443 | ) | $ | (34,487 | ) | |
Management believes that funds from operations, combined with the Company's capital base and available credit facilities, are sufficient for the Company's liquidity needs in the foreseeable future. Changes in capital requirements under international standards that will impact the costs and relative returns on loans may cause banks including those with whom the Company relies to back away from providing funding to the securities industry. Such a development might impact the Company's ability to finance its day to day activities or increase the costs to acquire funding. The Company may or may not be able to pass such increased funding costs on to its clients. (See "Factors Affecting 'Forward-Looking Statements'".)
49
Other Matters
During the fourth quarter of 2015, the Company purchased and canceled 94,882 shares of Class A Stock for a total consideration of $1.6 million.
On November 27, 2015, the Company paid cash dividends of $0.11 per share of Class A and Class B Stock totaling approximately $1.5 million from available cash on hand.
On February 26, 2016, the Company paid cash dividends of $0.11 per share of Class A and Class B Stock totaling approximately $1.5 million from available cash on hand.
The book value of the Company's Class A and Class B Stock was $38.84 at December 31, 2015 compared to $38.71 at December 31, 2014, based on total outstanding shares of 13,338,166 and 13,630,368, respectively.
The diluted weighted average number of shares of Class A and Class B Stock outstanding for the year ended December 31, 2015 was 14,291,534 compared to 14,250,663 outstanding on December 31, 2014.
Off-Balance Sheet Arrangements
In February 2010, Oppenheimer finalized settlements with the Regulators concluding investigations and administrative proceedings by the Regulators concerning Oppenheimer's marketing and sale of ARS. Pursuant to the settlements with the Regulators, Oppenheimer agreed to extend offers to repurchase ARS from certain of its clients subject to certain terms and conditions more fully described below. As of December 31, 2015, the Company had $5.0 million of outstanding ARS purchase commitments related to the settlements with the Regulators. In addition to the settlements with the Regulators, Oppenheimer has also reached settlements of and received adverse awards in legal proceedings with various clients where the Company is obligated to purchase ARS. Pursuant to completed Purchase Offers (as defined) under the settlements with the Regulators and client related legal settlements and awards to purchase ARS, as of December 31, 2015, the Company purchased and holds (net of redemptions) approximately $92.0 million in ARS from its clients. In addition, the Company is committed to purchase another $22.8 million in ARS from clients through 2020 under legal settlements and awards.
The Company's purchases of ARS from its clients holding ARS eligible for repurchase will, subject to the terms and conditions of the settlements with the Regulators, continue on a periodic basis. Pursuant to these terms and conditions, the Company is required to conduct a financial review every six months, until the Company has extended Purchase Offers to all Eligible Investors (as defined), to determine whether it has funds available, after giving effect to the financial and regulatory capital constraints applicable to the Company, to extend additional Purchase Offers. The financial review is based on the Company's operating results, regulatory net capital, liquidity, and other ARS purchase commitments outstanding under legal settlements and awards (described below). There are no predetermined quantitative thresholds or formulas used for determining the final agreed upon amount for the Purchase Offers. Upon completion of the financial review, the Company first meets with its primary regulator, FINRA, and then with representatives of the NYAG and other regulators to present the results of the review and to finalize the amount of the next Purchase Offer. Various offer scenarios are discussed in terms of which Eligible Investors should receive a Purchase Offer. The primary criteria to date in terms of determining which Eligible Investors should receive a Purchase Offer has been the amount of household account equity each Eligible Investor had with the Company in February 2008. Once various Purchase Offer scenarios have been discussed, the regulators, not the Company, make the final determination of which Purchase Offer scenario to implement. The terms of settlements provide that the amount of ARS to be purchased during any period shall not risk placing the Company in violation of regulatory requirements.
Outside of the settlements with the Regulators, the Company has also reached various legal settlements with clients and received unfavorable legal awards requiring it to purchase ARS. The terms and conditions including the ARS amounts committed to be purchased under legal settlements are based on the specific facts and circumstances of each legal proceeding. In most instances, the purchase commitments are in increments and extend over a period of time. At December 31, 2015, no ARS purchase commitments related to legal settlements extended past 2020. To the extent the Company receives an unfavorable award, the Company usually must purchase the ARS provided for by the award within 30 days of the rendering of the award. The ultimate amount of ARS to be repurchased by the Company under both the settlements with the Regulators and the legal settlements and awards cannot be predicted with any certainty and will be impacted by redemptions by issuers, the Company's financial and regulatory constraints, and legal and other actions by clients during the relevant period, which also cannot be predicted.
50
The ARS positions that the Company owns and are committed to purchase primarily represent auction rate preferred securities issued by closed-end funds and, to a lesser extent, municipal auction rate securities which are municipal bonds wrapped by municipal bond insurance and student loan auction rate securities which are asset-backed securities backed by student loans. At December 31, 2015, the amount of ARS held by the Company that was below investment grade was $3.8 million and the amount of ARS that was unrated was $25,000.
(Expressed in thousands) | |||||||||||
Auction Rate Securities Owned and Committed to Purchase at December 31, 2015 | |||||||||||
Valuation Adjustment | |||||||||||
Product | Principal | Fair Value | |||||||||
Auction Rate Securities ("ARS") Owned (1) | $ | 91,975 | $ | 5,173 | $ | 86,802 | |||||
ARS Commitments to Purchase Pursuant to: (2)(3) | |||||||||||
Settlements with the Regulators (4) | 5,000 | 266 | 4,734 | ||||||||
Legal Settlements and Awards (5) | 22,813 | 1,103 | 21,710 | ||||||||
Total | $ | 119,788 | $ | 6,542 | $ | 113,246 | |||||
(1) | Principal amount represents the par value of the ARS and is included in Securities Owned in the consolidated balance sheet at December 31, 2015. The valuation adjustment amount is included as a reduction to Securities Owned in the consolidated balance sheet at December 31, 2015. |
(2) | Principal amount represents the present value of the ARS par value that the Company is committed to purchase at a future date. This principal amount is presented as an off-balance sheet item. The Valuation Adjustment amount is included in Accounts payable and Other liabilities on the consolidated balance sheet at December 31, 2015. |
(3) | Specific ARS to be purchased under ARS Purchase Commitments are unknown until the beneficial owner selects the individual ARS to be purchased. |
(4) | Commitments to purchase under settlements with the Regulators at December 31, 2015. Eligible Investors for future buybacks under the settlements with the Regulators held approximately $57.0 million of ARS as of December 31, 2015. |
(5) | Commitments to purchase under various legal settlements and awards with clients through 2020. |
Per the above table, the Company has recorded a valuation adjustment on its ARS owned and ARS purchase commitments of $6.5 million as of December 31, 2015. The valuation adjustment is comprised of $5.2 million which represents the difference between the principal value and the fair value of the ARS the Company owns as of December 31, 2015 and $1.4 million which represents the difference between the principal value and the fair value of the ARS the Company is committed to purchase under the settlements with the Regulators and legal settlements and awards. At December 31, 2015, the Company had $5.0 million of outstanding ARS purchase commitments related to the settlements with the Regulators. Eligible Investors for future buybacks under the settlements with the Regulators held approximately $57.0 million of ARS as of December 31, 2015. Since the Company was not committed to purchase this amount as of December 31, 2015, there were no valuation adjustments booked to recognize the difference between the principal value and the fair value for this remaining amount.
Additional information concerning the Company's off-balance sheet arrangements is included in Note 5 to the consolidated financial statements appearing in Item 8. Such information is hereby incorporated by reference. Also, see "Risk Factors – The Company may continue to be adversely affected by the failure of the Auction Rate Securities Market," as well as Item 7 "Management's Discussion and Analysis of Financial Condition and Results of Operations – Business Environment – Other Regulatory Matters and – Other Matters" for additional details.
51
Contractual Obligations
The following table sets forth the Company's contractual obligations as at December 31, 2015:
(Expressed in millions) | |||||||||||||||||||
Less than 1 Year | More than 5 Years | ||||||||||||||||||
Total | 1-3 Years | 3-5 Years | |||||||||||||||||
Operating Lease Obligations (1) | $ | 277 | $ | 40 | $ | 72 | $ | 51 | $ | 114 | |||||||||
Committed Capital (1) | 5 | 5 | — | — | — | ||||||||||||||
Regulatory Settlements (1) | 10 | — | 10 | — | — | ||||||||||||||
Senior Secured Notes (2)(3) | 183 | 13 | 170 | — | — | ||||||||||||||
ARS Purchase Commitments (1) | 28 | 9 | 13 | 6 | — | ||||||||||||||
Total | $ | 503 | $ | 67 | $ | 265 | $ | 57 | $ | 114 | |||||||||
(1) | See Note 16 to the consolidated financial statements appearing in Item 8 for additional information. |
(2) | See Note 11 to the consolidated financial statements appearing in Item 8 for additional information. |
(3) | Includes interest payable of $32.8 million through maturity. |
Inflation
Because the assets of the Company's brokerage subsidiaries are highly liquid, and because securities inventories are carried at current market values, the impact of inflation generally is reflected in the financial statements. However, the rate of inflation affects the Company's costs relating to employee compensation, rent, communications and certain other operating costs, and such costs may not be recoverable in the level of commissions or fees charged. To the extent inflation results in rising interest rates and has other adverse effects upon the securities markets, it may adversely affect the Company's financial position and results of operations.
Factors Affecting "Forward-Looking Statements"
From time to time, the Company may publish "Forward-looking statements" within the meaning of Section 27A of the Securities Act and Section 21E of the Exchange Act or make oral statements that constitute forward-looking statements. These forward-looking statements may relate to such matters as anticipated financial performance, future revenues or earnings, business prospects, projected ventures, new products, anticipated market performance, and similar matters. The Private Securities Litigation Reform Act of 1995 provides a safe harbor for forward-looking statements. In order to comply with the terms of the safe harbor, the Company cautions readers that a variety of factors could cause the Company's actual results to differ materially from the anticipated results or other expectations expressed in the Company's forward-looking statements. These risks and uncertainties, many of which are beyond the Company's control, include, but are not limited to: (i) transaction volume in the securities markets, (ii) the volatility of the securities markets, (iii) fluctuations in interest rates, (iv) changes in regulatory requirements which could affect the cost and method of doing business and reduce returns, (v) fluctuations in currency rates, (vi) general economic conditions, both domestic and international, including declining oil prices, (vii) changes in the rate of inflation and the related impact on the securities markets, (viii) competition from existing financial institutions and other participants in the securities markets, (ix) legal developments affecting the litigation experience of the securities industry and the Company, including developments arising from the failure of the Auction Rate Securities markets, the trading of low-priced securities, stepped up enforcement efforts by the SEC, FinCEN and other regulators and the results of pending litigation and regulatory proceedings involving the Company, (x) changes in foreign, federal and state tax laws which could affect the popularity of products sold by the Company or impose taxes on securities transactions, (xi) the effectiveness of efforts to reduce costs and eliminate overlap, (xii) war and nuclear confrontation as well as political unrest and regime changes, health epidemics and economic crisis in foreign countries, (xiii) the Company's ability to achieve its business plan, (xiv) corporate governance issues, (xv) the impact of the credit crisis and tight credit markets on business operations, (xvi) the effect of bailout, financial reform and related legislation including, without limitation, the Dodd-Frank Act and the Volcker Rule and the rules and regulations thereunder, (xvii) the consolidation of the banking and financial services industry, (xviii) the effects of the economy on the Company's ability to find and maintain financing options and liquidity, (xix) credit, operations, legal and regulatory risks, (xx) risks related to foreign operations, (xxi) risks related to the downgrade of U.S. long-term sovereign debt obligations and the sovereign debt of European nations, (xxii) risks related to the manipulation of LIBOR and concerns over high speed trading, (xxiii) potential cyber security threats, (xxiv) risks related to the lowering by S&P of its rating on the Company and on the Notes, and (xxv) risks related to pending elections results, Congressional gridlock, government shutdowns and threats of default by the federal government. There can be no assurance that the Company has correctly or completely identified and assessed all of the factors affecting the Company's business. The Company does not undertake any obligation to publicly update or revise any forward-looking statements. See Item 1A – Risk Factors.
52
Item 7A. QUANTITATIVE AND QUALITATIVE DISCLOSURES ABOUT MARKET RISK
Risk Management
The Company's principal business activities by their nature involve significant market, credit and other risks. The Company's effectiveness in managing these risks is critical to its success and stability.
As part of its normal business operations, the Company engages in the trading of both fixed income and equity securities in both a proprietary and market-making capacity. The Company makes markets in over-the-counter equities in order to facilitate order flow and accommodate its institutional and retail customers. The Company also makes markets in municipal bonds, mortgage-backed securities, government bonds and high yield bonds and short term fixed income securities and loans issued by various corporations.
Market Risk. Market risk generally means the risk of loss that may result from the potential change in the value of a financial instrument as a result of fluctuations in interest and currency exchange rates and in equity and commodity prices. Market risk is inherent in all types of financial instruments, including both derivatives and non-derivatives. The Company's exposure to market risk arises from its role as a financial intermediary for its customers' transactions and from its proprietary trading and arbitrage activities.
Oppenheimer monitors market risks through daily profit and loss statements and position reports. Each trading department adheres to internal position limits determined by senior management and regularly reviews the age and composition of its proprietary accounts. Positions and profits and losses for each trading department are reported to senior management on a daily basis.
In its market-making activities, Oppenheimer must provide liquidity in the equities for which it makes markets. As a result of this, Oppenheimer has risk containment policies in place, which limit position size and monitor transactions on a minute-to-minute basis.
Credit Risk. Credit risk represents the loss that the Company would incur if a client, counterparty or issuer of securities or other instruments held by the Company fails to perform its contractual obligations. Given the recent issues in the credit markets, there has been an increased focus in the industry about credit risk. The Company follows industry practice to reduce credit risk related to various investing and financing activities by obtaining and maintaining collateral wherever possible. The Company adjusts margin requirements if it believes the risk exposure is not appropriate based on market conditions. When Oppenheimer advances funds or securities to a counterparty in a principal transaction or to a customer in a brokered transaction, it is subject to the risk that the counterparty or customer will not repay such advances. If the market price of the securities purchased or loaned has declined or increased, respectively, Oppenheimer may be unable to recover some or all of the value of the amount advanced. A similar risk is also present where a customer is unable to respond to a margin call and the market price of the collateral has dropped. In addition, Oppenheimer's securities positions are subject to fluctuations in market value and liquidity.
In addition to monitoring the credit-worthiness of its customers, Oppenheimer imposes more conservative margin requirements than those of the NYSE. Generally, Oppenheimer limits customer loans to an amount not greater than 65% of the value of the securities (or 50% if the securities in the account are concentrated in a limited number of issues). Particular attention and more restrictive requirements are placed on more highly volatile securities traded in the NASDAQ market. In comparison, the NYSE permits loans of up to 75% of the value of the equity securities in a customer's account. Further discussion of credit risk appears in Note 6 to the Company's consolidated financial statements appearing in Item 8.
Operational Risk. Operational risk generally refers to the risk of loss resulting from the Company's operations, including, but not limited to, improper or unauthorized execution and processing of transactions, deficiencies in its operating systems, business disruptions and inadequacies or breaches in its internal control processes. The Company operates in diverse markets and it is reliant on the ability of its employees and systems to process high numbers of transactions often within short time frames. In the event of a breakdown or improper operation of systems, human error or improper action by employees, the Company could suffer financial loss, regulatory sanctions or damage to its reputation. In order to mitigate and control operational risk, the Company has developed and continues to enhance policies and procedures (including the maintenance of disaster recovery facilities and procedures related thereto) that are designed to identify and manage operational risk at appropriate levels. With respect to its trading activities, the Company has procedures designed to ensure that all transactions are accurately recorded and properly reflected on the Company's books on a timely basis. With respect to client activities, the Company operates a system of internal controls designed to ensure that transactions and other account activity (new account solicitation, transaction authorization, transaction processing, billing and collection) are properly approved, processed, recorded
53
and reconciled. The Company has procedures designed to assess and monitor counterparty risk. For details of funding risk, see Item 7 under the caption "Liquidity and Capital Resources."
Legal and Regulatory Risk. Legal and regulatory risk includes the risk of non-compliance with applicable legal and regulatory requirements, client claims and the possibility of sizeable adverse legal judgments. The Company is subject to extensive regulation in the different jurisdictions in which it conducts its activities. Regulatory oversight of the securities industry has become increasingly intense over the past few years and the Company, as well as others in the industry, has been directly affected by this increased regulatory scrutiny. Timely and accurate compliance with the increased volume of regulatory requests has become increasingly problematic within the industry, and regulators have tended to bring enforcement proceedings in relation to such matters. See further discussion of these risks in Item 7 under the caption "Regulatory Environment."
The Company has comprehensive procedures for addressing issues such as regulatory capital requirements, sales and trading practices, use of and safekeeping of customer funds and securities, granting of credit, collection activities, money laundering, and record keeping. The Company has designated Anti-Money Laundering Compliance Officers who monitor compliance with regulations under the U.S. Patriot Act. See further discussion of the Company's reserve policy in Item 7, under the captions "Critical Accounting Policies," Item 3, "Legal Proceedings" and Item 1, "Regulation."
Off-Balance Sheet Arrangements. In certain limited instances, the Company utilizes off-balance sheet arrangements to manage risk. See further discussion in Note 5 to the consolidated financial statements appearing in Item 8.
Value-at-Risk. Value-at-risk is a statistical measure of the potential loss in the fair value of a portfolio due to adverse movements in underlying risk factors. In response to the SEC's market risk disclosure requirements, the Company has performed a value-at-risk analysis of its trading of financial instruments and derivatives. The value-at-risk calculation uses standard statistical techniques to measure the potential loss in fair value based upon a one-day holding period and a 95% confidence level. The calculation is based upon a variance-covariance methodology, which assumes a normal distribution of changes in portfolio value. The forecasts of variances and co-variances used to construct the model for the market factors relevant to the portfolio were generated from historical data. Although value-at-risk models are sophisticated tools, their use can be limited as historical data is not always an accurate predictor of future conditions. The Company attempts to manage its market exposure using other methods, including trading authorization limits and concentration limits.
At December 31, 2015 and 2014, the Company's value-at-risk for each component of market risk was as follows:
(Expressed in thousands) | |||||||||||||||||||||||
VAR for Fiscal 2015 | VAR for Fiscal 2014 | ||||||||||||||||||||||
High | Low | Average | High | Low | Average | ||||||||||||||||||
Equity price risk | $ | 320 | $ | 89 | $ | 210 | $ | 389 | $ | 247 | $ | 320 | |||||||||||
Interest rate risk | 1,725 | 1,053 | 1,524 | 2,378 | 1,259 | 1,694 | |||||||||||||||||
Commodity price risk | 139 | 104 | 123 | 143 | 76 | 93 | |||||||||||||||||
Diversification benefit | (1,321 | ) | (880 | ) | (1,149 | ) | (2,182 | ) | (1,003 | ) | (1,460 | ) | |||||||||||
Total | $ | 863 | $ | 366 | $ | 708 | $ | 728 | $ | 579 | $ | 647 | |||||||||||
(Expressed in thousands) | |||||||
VAR at December 31, | |||||||
2015 | 2014 | ||||||
Equity price risk | $ | 320 | $ | 389 | |||
Interest rate risk | 1,053 | 2,378 | |||||
Commodity price risk | 104 | 76 | |||||
Diversification benefit | (880 | ) | (2,182 | ) | |||
Total | $ | 597 | $ | 661 | |||
54
The potential future loss presented by the total value-at-risk generally falls within predetermined levels of loss that should not be material to the Company's results of operations, financial condition or cash flows. The changes in the value-at-risk amounts reported in 2015 from those reported in 2014 reflect changes in the size and composition of the Company's trading portfolio at December 31, 2015 compared to December 31, 2014. The Company's portfolio as at December 31, 2015 includes approximately $14.0 million ($15.7 million in 2014) in corporate equities, which are related to deferred compensation liabilities and which do not bear any value-at-risk to the Company. Further discussion of risk management appears in Item 7, "Management's Discussion and Analysis of Financial Condition and the Results of Operations" and Item 1A, "Risk Factors."
The value-at-risk estimate has limitations that should be considered in evaluating the Company's potential future losses based on the year-end portfolio positions. Recent market conditions, including increased volatility, may result in statistical relationships that result in higher value-at-risk than would be estimated from the same portfolio under different market conditions. Likewise, the converse may be true. Critical risk management strategy involves the active management of portfolio levels to reduce market risk. The Company's market risk exposure is continuously monitored as the portfolio risks and market conditions change.
55
Item 8. FINANCIAL STATEMENTS AND SUPPLEMENTARY DATA
INDEX TO CONSOLIDATED FINANCIAL STATEMENTS
56
MANAGEMENT’S REPORT ON INTERNAL CONTROL OVER FINANCIAL REPORTING
Management of Oppenheimer Holdings Inc. is responsible for establishing and maintaining adequate internal control over financial reporting. The Company’s internal control over financial reporting is a process designed under the supervision of the Company’s principal executive and principal financial officers to provide reasonable assurance regarding the reliability of financial reporting and the preparation of the Company’s financial statements for external reporting purposes in accordance with U.S. generally accepted accounting principles.
As of December 31, 2015, management conducted an assessment of the effectiveness of the Company’s internal control over financial reporting based on the framework established in Internal Control – Integrated Framework issued by the Committee of Sponsoring Organizations of the Treadway Commission (COSO) in 2013. Based on this assessment, management has concluded that the Company’s internal control over financial reporting as of December 31, 2015 was effective.
The Company’s internal control over financial reporting includes policies and procedures that pertain to the maintenance of records that, in reasonable detail, accurately and fairly reflect transactions and dispositions of assets and provide reasonable assurances that transactions are recorded as necessary to permit preparation of financial statements in accordance with U.S. generally accepted accounting principles, and that receipts and expenditures are being made only in accordance with authorizations of management and the directors of the Company; and provide reasonable assurance regarding prevention or timely detection of unauthorized acquisition, use or disposition of the Company’s assets that could have a material effect on the Company’s financial statements.
The Company’s internal control over financial reporting as of December 31, 2015 has been audited by Deloitte & Touche LLP, an independent registered public accounting firm, as stated in their report included herein, which expresses an unqualified opinion on the effectiveness of the Company’s internal control over financial reporting as of December 31, 2015.
57
REPORT OF INDEPENDENT REGISTERED PUBLIC ACCOUNTING FIRM
To the Board of Directors and Stockholders of Oppenheimer Holdings Inc.:
We have audited the internal control over financial reporting of Oppenheimer Holdings Inc. and subsidiaries (the "Company") as of December 31, 2015, based on criteria established in Internal Control - Integrated Framework (2013) issued by the Committee of Sponsoring Organizations of the Treadway Commission. The Company's management is responsible for maintaining effective internal control over financial reporting and for its assessment of the effectiveness of internal control over financial reporting, included in the accompanying Management's Report on Internal Control over Financial Reporting. Our responsibility is to express an opinion on the Company's internal control over financial reporting based on our audit.
We conducted our audit in accordance with the standards of the Public Company Accounting Oversight Board (United States). Those standards require that we plan and perform the audit to obtain reasonable assurance about whether effective internal control over financial reporting was maintained in all material respects. Our audit included obtaining an understanding of internal control over financial reporting, assessing the risk that a material weakness exists, testing and evaluating the design and operating effectiveness of internal control based on the assessed risk, and performing such other procedures as we considered necessary in the circumstances. We believe that our audit provides a reasonable basis for our opinion.
A company's internal control over financial reporting is a process designed by, or under the supervision of, the company's principal executive and principal financial officers, or persons performing similar functions, and effected by the company's board of directors, management, and other personnel to provide reasonable assurance regarding the reliability of financial reporting and the preparation of consolidated financial statements for external purposes in accordance with generally accepted accounting principles. A company's internal control over financial reporting includes those policies and procedures that (1) pertain to the maintenance of records that, in reasonable detail, accurately and fairly reflect the transactions and dispositions of the assets of the company; (2) provide reasonable assurance that transactions are recorded as necessary to permit preparation of consolidated financial statements in accordance with generally accepted accounting principles, and that receipts and expenditures of the company are being made only in accordance with authorizations of management and directors of the company; and (3) provide reasonable assurance regarding prevention or timely detection of unauthorized acquisition, use, or disposition of the company's assets that could have a material effect on the consolidated financial statements.
Because of the inherent limitations of internal control over financial reporting, including the possibility of collusion or improper management override of controls, material misstatements due to error or fraud may not be prevented or detected on a timely basis. Also, projections of any evaluation of the effectiveness of the internal control over financial reporting to future periods are subject to the risk that the controls may become inadequate because of changes in conditions, or that the degree of compliance with the policies or procedures may deteriorate.
In our opinion, the Company maintained, in all material respects, effective internal control over financial reporting as of December 31, 2015, based on the criteria established in Internal Control - Integrated Framework (2013) issued by the Committee of Sponsoring Organizations of the Treadway Commission.
We have also audited, in accordance with the standards of the Public Company Accounting Oversight Board (United States), the consolidated financial statements as of and for the year ended December 31, 2015 of the Company and our report dated March 4, 2016 expressed an unqualified opinion on those consolidated financial statements.
/s/ Deloitte & Touche LLP
New York, NY
March 4, 2016
58
REPORT OF INDEPENDENT REGISTERED PUBLIC ACCOUNTING FIRM
To the Board of Directors and Stockholders of Oppenheimer Holdings Inc.:
We have audited the accompanying consolidated balance sheets of Oppenheimer Holdings Inc. and subsidiaries (the "Company") as of December 31, 2015 and 2014, and the related consolidated statements of income, comprehensive income, changes in stockholders' equity and cash flows for each of the three years in the period ended December 31, 2015. These consolidated financial statements are the responsibility of the Company's management. Our responsibility is to express an opinion on these consolidated financial statements based on our audits.
We conducted our audits in accordance with the standards of the Public Company Accounting Oversight Board (United States). Those standards require that we plan and perform the audit to obtain reasonable assurance about whether the consolidated financial statements are free of material misstatement. An audit includes examining, on a test basis, evidence supporting the amounts and disclosures in the consolidated financial statements. An audit also includes assessing the accounting principles used and significant estimates made by management, as well as evaluating the overall consolidated financial statement presentation. We believe that our audits provide a reasonable basis for our opinion.
In our opinion, such consolidated financial statements present fairly, in all material respects, the financial position of Oppenheimer Holdings Inc. and subsidiaries at December 31, 2015 and 2014, and the results of their operations and their cash flows for each of the three years in the period ended December 31, 2015, in conformity with accounting principles generally accepted in the United States of America.
We have also audited, in accordance with the standards of the Public Company Accounting Oversight Board (United States), the Company's internal control over financial reporting as of December 31, 2015, based on the criteria established in Internal Control - Integrated Framework (2013) issued by the Committee of Sponsoring Organizations of the Treadway Commission and our report dated March 4, 2016 expressed an unqualified opinion on the Company's internal control over financial reporting.
/s/ Deloitte & Touche LLP
New York, NY
March 4, 2016
59
OPPENHEIMER HOLDINGS INC.
CONSOLIDATED BALANCE SHEETS
AS AT DECEMBER 31,
(Expressed in thousands, except share amounts) | 2015 | 2014 | |||||
ASSETS | |||||||
Cash and cash equivalents | $ | 63,364 | $ | 63,807 | |||
Cash and securities segregated for regulatory and other purposes | — | 18,594 | |||||
Deposits with clearing organizations | 49,490 | 36,510 | |||||
Receivable from brokers, dealers and clearing organizations | 360,913 | 314,475 | |||||
Receivable from customers, net of allowance for credit losses of $2,545 ($2,427 in 2014) | 840,355 | 864,189 | |||||
Income tax receivable | 10,937 | 4,240 | |||||
Securities purchased under agreements to resell | 206,499 | 251,606 | |||||
Securities owned, including amounts pledged of $546,334 ($518,123 in 2014), at fair value | 735,393 | 843,155 | |||||
Notes receivable, net of accumulated amortization and allowance for uncollectibles of $54,919 and $8,444, respectively ($42,211 and $8,606, respectively, in 2014) | 32,849 | 34,932 | |||||
Office facilities, net of accumulated depreciation of $104,961 ($103,547 in 2014) | 28,290 | 29,589 | |||||
Loans held for sale | 60,234 | 19,243 | |||||
Mortgage servicing rights | 28,168 | 30,140 | |||||
Intangible assets | 31,700 | 31,700 | |||||
Goodwill | 137,889 | 137,889 | |||||
Other assets | 106,883 | 107,386 | |||||
Total assets | $ | 2,692,964 | $ | 2,787,455 | |||
LIABILITIES AND STOCKHOLDERS’ EQUITY | |||||||
Liabilities | |||||||
Drafts payable | $ | 48,011 | $ | 35,373 | |||
Bank call loans | 100,200 | 59,400 | |||||
Payable to brokers, dealers and clearing organizations | 164,546 | 257,161 | |||||
Payable to customers | 594,833 | 652,256 | |||||
Securities sold under agreements to repurchase | 651,445 | 687,440 | |||||
Securities sold, but not yet purchased, at fair value | 126,493 | 92,510 | |||||
Accrued compensation | 150,898 | 165,134 | |||||
Accounts payable and other liabilities | 164,783 | 141,352 | |||||
Senior secured notes | 150,000 | 150,000 | |||||
Deferred tax liabilities, net of deferred tax assets of $63,481 ($68,622 in 2014) | 16,673 | 13,097 | |||||
Total liabilities | 2,167,882 | 2,253,723 | |||||
Commitments and contingencies (Note 16) | |||||||
Stockholders’ equity | |||||||
Share capital | |||||||
Class A non-voting common stock, par value $0.001 per share, 50,000,000 shares authorized, 13,238,486 and 13,530,688 shares issued and outstanding at December 31, 2015 and 2014, respectively | 57,387 | 62,264 | |||||
Class B voting common stock, par value $0.001 per share, 99,680 shares authorized, issued and outstanding | 133 | 133 | |||||
57,520 | 62,397 | ||||||
Contributed capital | 44,438 | 45,118 | |||||
Retained earnings | 417,001 | 421,047 | |||||
Accumulated other comprehensive loss | (901 | ) | (918 | ) | |||
Total Oppenheimer Holdings Inc. stockholders’ equity | 518,058 | 527,644 | |||||
Noncontrolling interest | 7,024 | 6,088 | |||||
Total stockholders’ equity | 525,082 | 533,732 | |||||
Total liabilities and stockholders’ equity | $ | 2,692,964 | $ | 2,787,455 | |||
The accompanying notes are an integral part of these consolidated financial statements.
60
OPPENHEIMER HOLDINGS INC.
CONSOLIDATED STATEMENTS OF INCOME
FOR THE YEAR ENDED DECEMBER 31,
(Expressed in thousands, except number of shares and per share amounts) | 2015 | 2014 | 2013 | ||||||||
REVENUE | |||||||||||
Commissions | $ | 417,559 | $ | 469,829 | $ | 486,767 | |||||
Advisory fees | 280,247 | 281,680 | 274,178 | ||||||||
Investment banking | 102,540 | 125,598 | 97,977 | ||||||||
Interest | 51,031 | 49,244 | 53,216 | ||||||||
Principal transactions, net | 20,503 | 29,699 | 43,768 | ||||||||
Other | 56,505 | 48,414 | 63,808 | ||||||||
Total revenue | 928,385 | 1,004,464 | 1,019,714 | ||||||||
EXPENSES | |||||||||||
Compensation and related expenses | 623,226 | 664,641 | 675,936 | ||||||||
Communications and technology | 66,910 | 67,170 | 65,817 | ||||||||
Occupancy and equipment costs | 63,144 | 63,012 | 66,758 | ||||||||
Clearing and exchange fees | 26,022 | 24,709 | 24,481 | ||||||||
Interest | 17,323 | 17,801 | 26,142 | ||||||||
Other | 125,049 | 141,395 | 116,671 | ||||||||
Total expenses | 921,674 | 978,728 | 975,805 | ||||||||
Income before income tax provision | 6,711 | 25,736 | 43,909 | ||||||||
Income tax provision | 3,813 | 16,175 | 17,756 | ||||||||
Net income for the year | 2,898 | 9,561 | 26,153 | ||||||||
Less net income attributable to noncontrolling interest | 936 | 735 | 1,092 | ||||||||
Net income attributable to Oppenheimer Holdings Inc. | $ | 1,962 | $ | 8,826 | $ | 25,061 | |||||
Earnings per share attributable to Oppenheimer Holdings Inc. | |||||||||||
Basic | $ | 0.14 | $ | 0.65 | $ | 1.85 | |||||
Diluted | $ | 0.14 | $ | 0.62 | $ | 1.77 | |||||
Weighted average shares | |||||||||||
Basic | 13,640,610 | 13,604,258 | 13,577,725 | ||||||||
Diluted | 14,291,534 | 14,250,663 | 14,124,060 | ||||||||
The accompanying notes are an integral part of these consolidated financial statements.
61
OPPENHEIMER HOLDINGS INC.
CONSOLIDATED STATEMENTS OF COMPREHENSIVE INCOME
FOR THE YEAR ENDED DECEMBER 31,
2015 | 2014 | 2013 | |||||||||
(Expressed in thousands) | |||||||||||
Net income for the year | $ | 2,898 | $ | 9,561 | $ | 26,153 | |||||
Other comprehensive income (loss), net of tax (1) | |||||||||||
Currency translation adjustment | 17 | (2,627 | ) | 1,502 | |||||||
Comprehensive income for the year | 2,915 | 6,934 | 27,655 | ||||||||
Net income attributable to noncontrolling interests | 936 | 735 | 1,092 | ||||||||
Comprehensive income attributable to Oppenheimer Holdings Inc. | $ | 1,979 | $ | 6,199 | $ | 26,563 | |||||
(1) | Total other comprehensive income (loss) is attributable to Oppenheimer Holdings Inc. No other comprehensive income (loss) is attributable to noncontrolling interests. |
The accompanying notes are an integral part of these consolidated financial statements.
62
OPPENHEIMER HOLDINGS INC.
CONSOLIDATED STATEMENTS OF CHANGES IN STOCKHOLDERS’ EQUITY
FOR THE YEAR ENDED DECEMBER 31,
(Expressed in thousands) | 2015 | 2014 | 2013 | ||||||||
Share capital | |||||||||||
Balance at beginning of year | $ | 62,397 | $ | 60,198 | $ | 62,181 | |||||
Issuance of Class A non-voting common stock | 3,373 | 2,199 | 1,642 | ||||||||
Repurchase of Class A non-voting common stock for cancellation | (8,250 | ) | — | (3,625 | ) | ||||||
Balance at end of year | 57,520 | 62,397 | 60,198 | ||||||||
Contributed capital | |||||||||||
Balance at beginning of year | 45,118 | 42,407 | 39,231 | ||||||||
Tax (deficiency) benefit from share-based awards | (277 | ) | 1,194 | (78 | ) | ||||||
Share-based expense | 4,653 | 5,694 | 5,145 | ||||||||
Vested employee share plan awards | (5,056 | ) | (4,177 | ) | (1,891 | ) | |||||
Balance at end of year | 44,438 | 45,118 | 42,407 | ||||||||
Retained earnings | |||||||||||
Balance at beginning of year | 421,047 | 418,204 | 399,121 | ||||||||
Net income for the year attributable to Oppenheimer Holdings Inc. | 1,962 | 8,826 | 25,061 | ||||||||
Dividends paid ($0.44 per share) | (6,008 | ) | (5,983 | ) | (5,978 | ) | |||||
Balance at end of year | 417,001 | 421,047 | 418,204 | ||||||||
Accumulated other comprehensive income (loss) | |||||||||||
Balance at beginning of year | (918 | ) | 1,709 | 207 | |||||||
Currency translation adjustment | 17 | (2,627 | ) | 1,502 | |||||||
Balance at end of year | (901 | ) | (918 | ) | 1,709 | ||||||
Total Oppenheimer Holdings Inc. stockholders’ equity | 518,058 | 527,644 | 522,518 | ||||||||
Noncontrolling interest | |||||||||||
Balance at beginning of year | 6,088 | 5,353 | 4,261 | ||||||||
Net income attributable to noncontrolling interest, net of tax | 936 | 735 | 1,092 | ||||||||
Balance at end of year | 7,024 | 6,088 | 5,353 | ||||||||
Total stockholders’ equity | $ | 525,082 | $ | 533,732 | $ | 527,871 | |||||
The accompanying notes are an integral part of these consolidated financial statements.
63
OPPENHEIMER HOLDINGS INC.
CONSOLIDATED STATEMENTS OF CASH FLOWS
FOR THE YEAR ENDED DECEMBER 31,
(Expressed in thousands) | 2015 | 2014 | 2013 | ||||||||
Cash flows from operating activities | |||||||||||
Net income for the year | $ | 2,898 | $ | 9,561 | $ | 26,153 | |||||
Adjustments to reconcile net income to net cash provided by operating activities | |||||||||||
Payment of taxes due for vested share-based awards related to amounts the Company withheld on behalf of its employees to meet minimum statutory tax withholding requirements | (1,683 | ) | (2,074 | ) | — | ||||||
Non-cash items included in net income: | |||||||||||
Depreciation and amortization of office facilities and leasehold improvements | 7,188 | 7,748 | 9,405 | ||||||||
Deferred income taxes | 4,538 | 6,001 | 23,436 | ||||||||
Amortization of notes receivable | 12,708 | 16,043 | 18,762 | ||||||||
Amortization of debt issuance costs | 485 | 530 | 639 | ||||||||
Write-off of debt issuance costs | — | 588 | — | ||||||||
Amortization of mortgage servicing rights | 727 | 2,819 | 1,881 | ||||||||
Provision for credit losses | 118 | 4 | 167 | ||||||||
Share-based compensation | 2,860 | 6,074 | 9,249 | ||||||||
Decrease (increase) in operating assets: | |||||||||||
Cash and securities segregated for regulatory and other purposes | 18,594 | 17,729 | (3,323 | ) | |||||||
Deposits with clearing organizations | (12,980 | ) | (12,831 | ) | 2,275 | ||||||
Receivable from brokers, dealers and clearing organizations | (46,438 | ) | 50,398 | 114,826 | |||||||
Receivable from customers | 23,716 | 4,676 | (51,095 | ) | |||||||
Income tax receivable | (6,697 | ) | 2,322 | (6,111 | ) | ||||||
Securities purchased under agreements to resell | 45,107 | (66,781 | ) | (184,825 | ) | ||||||
Securities owned | 107,762 | 12,933 | (96,346 | ) | |||||||
Notes receivable | (10,625 | ) | (10,224 | ) | (12,189 | ) | |||||
Loans held for sale | (40,991 | ) | 56,746 | (53,115 | ) | ||||||
Mortgage servicing rights | 1,245 | (4,080 | ) | (3,777 | ) | ||||||
Other assets | 35 | 53,929 | (49,772 | ) | |||||||
Increase (decrease) in operating liabilities: | |||||||||||
Drafts payable | 12,638 | (12,825 | ) | (8,388 | ) | ||||||
Payable to brokers, dealers and clearing organizations | (92,615 | ) | 33,846 | 19,097 | |||||||
Payable to customers | (57,423 | ) | 25,692 | (65,814 | ) | ||||||
Securities sold under agreements to repurchase | (35,995 | ) | (70,051 | ) | 365,100 | ||||||
Securities sold, but not yet purchased | 33,983 | 16,196 | (97,136 | ) | |||||||
Accrued compensation | (12,443 | ) | (15,365 | ) | 25,581 | ||||||
Accounts payable and other liabilities | 22,469 | (51,289 | ) | 11,891 | |||||||
Cash (used in) provided by operating activities | (20,819 | ) | 78,315 | (3,429 | ) | ||||||
Cash flows from investing activities | |||||||||||
Purchase of office facilities | (5,889 | ) | (4,398 | ) | (14,012 | ) | |||||
Cash used in investing activities | (5,889 | ) | (4,398 | ) | (14,012 | ) | |||||
Cash flows from financing activities | |||||||||||
Cash dividends paid on Class A non-voting and Class B voting common stock | (6,008 | ) | (5,983 | ) | (5,978 | ) | |||||
Issuance of Class A non-voting common stock | — | 185 | 150 | ||||||||
Repurchase of Class A non-voting common stock for cancellation | (8,250 | ) | — | (3,625 | ) | ||||||
Tax (deficiency) benefit from share-based awards | (277 | ) | 1,194 | (78 | ) | ||||||
Redemption of senior secured notes | — | (45,000 | ) | — | |||||||
Increase (decrease) in bank call loans, net | 40,800 | (58,800 | ) | (10,100 | ) | ||||||
Cash provided by (used in) financing activities | 26,265 | (108,404 | ) | (19,631 | ) | ||||||
Net decrease in cash and cash equivalents | (443 | ) | (34,487 | ) | (37,072 | ) | |||||
Cash and cash equivalents, beginning of year | 63,807 | 98,294 | 135,366 | ||||||||
Cash and cash equivalents, end of year | $ | 63,364 | $ | 63,807 | $ | 98,294 | |||||
Schedule of non-cash financing activities | |||||||||||
Employee share plan issuance | $ | 3,373 | $ | 2,014 | $ | 1,492 | |||||
Supplemental disclosure of cash flow information | |||||||||||
Cash paid during the year for interest | $ | 17,273 | $ | 18,784 | $ | 26,492 | |||||
Cash paid during the year for income taxes, net of refunds | $ | 6,088 | $ | 7,590 | $ | 4,509 | |||||
The accompanying notes are an integral part of these consolidated financial statements.
64
OPPENHEIMER HOLDINGS INC. Notes to Consolidated Financial Statements | ||
1. Organization
Oppenheimer Holdings Inc. ("OPY") is incorporated under the laws of the State of Delaware. The consolidated financial statements include the accounts of OPY and its subsidiaries (together, the "Company"). The Company engages in a broad range of activities in the financial services industry, including retail securities brokerage, institutional sales and trading, investment banking (both corporate and public finance), research, market-making, trust services, mortgage banking and investment advisory and asset management services.
The principal subsidiaries of OPY are Oppenheimer & Co. Inc. ("Oppenheimer"), a registered broker dealer in securities and investment adviser under the Investment Advisers Act of 1940, Oppenheimer Asset Management Inc. ("OAM") and its wholly-owned subsidiary, Oppenheimer Investment Management LLC ("OIM"), both registered investment advisers under the Investment Advisers Act of 1940, Oppenheimer Trust Company of Delaware ("Oppenheimer Trust"), a limited purpose trust company that provides fiduciary services such as trust and estate administration and investment management, Oppenheimer Multifamily Housing & Healthcare Finance, Inc. ("OMHHF"), which is engaged in commercial mortgage origination and servicing, OPY Credit Corp., which offers syndication as well as trading of issued corporate loans, Oppenheimer Europe Ltd., based in the United Kingdom, with offices in the Isle of Jersey and Switzerland, which provides institutional equities and fixed income brokerage and corporate financial services and is regulated by the Financial Conduct Authority, and Oppenheimer Investments Asia Limited, based in Hong Kong, China, which provides assistance in accessing the U.S. equities markets and limited mergers and acquisitions advisory services to Asia-based companies, as well as offering fixed income brokerage services to institutional investors, and is regulated by the Securities and Futures Commission.
Oppenheimer provides its services from 85 offices in 24 states located throughout the United States and in 6 foreign jurisdictions. Oppenheimer owns Freedom Investments, Inc. ("Freedom"), a registered broker dealer in securities, which provides discount brokerage services, and Oppenheimer Israel (OPCO) Ltd., which is engaged in offering investment services in the State of Israel. Oppenheimer holds a trading permit on the New York Stock Exchange and is a member of several other regional exchanges in the United States.
2. Summary of significant accounting policies
Basis of Presentation
The consolidated financial statements have been prepared in conformity with accounting principles generally accepted in the United States of America for purpose of inclusion in the Company's Annual Report on Form 10-K and in its annual report to stockholders. Intercompany transactions and balances have been eliminated in the preparation of the consolidated financial statements.
Accounting standards require the Company to present noncontrolling interests as a separate component of stockholders' equity on the Company's consolidated balance sheet. As of December 31, 2015, the Company owned 83.68% of OMHHF and the noncontrolling interest recorded in the consolidated balance sheet was $7.0 million.
Use of Estimates
The preparation of the consolidated financial statements in conformity with generally accepted accounting principles requires management to make estimates and assumptions that affect the reported amounts of assets and liabilities and disclosures of contingent assets and liabilities at the dates of the consolidated financial statements and the reported amounts of revenue and expenses during the reporting periods.
In presenting the consolidated financial statements, management makes estimates regarding valuations of financial instruments, loans and allowances for credit losses, the outcome of legal and regulatory matters, goodwill and other intangible assets, stock-based compensation plans, mortgage servicing rights, and income taxes. Estimates, by their nature, are based on judgment and available information. Therefore, actual results could be materially different from these estimates. A discussion of certain areas in which estimates are a significant component of the amounts reported in the consolidated financial statements follows.
65
OPPENHEIMER HOLDINGS INC. Notes to Consolidated Financial Statements | ||
Financial Instruments and Fair Value
Financial Instruments
Securities owned, securities sold but not yet purchased, investments and derivative contracts are carried at fair value with changes in fair value recognized in earnings each period.
Fair Value Measurements
The Company adopted the accounting guidance for the fair value measurement of financial assets, which defines fair value, establishes a framework for measuring fair value, establishes a fair value measurement hierarchy, and expands fair value measurement disclosures. Fair value, as defined by the accounting guidance, is the price that would be received in the sale of an asset or paid to transfer a liability in an orderly transaction between market participants at the measurement date. The fair value hierarchy established by this accounting guidance prioritizes the inputs used in valuation techniques into the following three categories (highest to lowest priority):
Level 1: | Observable inputs that reflect quoted prices (unadjusted) for identical assets or liabilities in active markets; |
Level 2: | Inputs other than quoted prices included in Level 1 that are observable for the asset or liability either directly or indirectly; and |
Level 3: | Unobservable inputs that are significant to the overall fair value measurement. |
The Company's financial instruments that are recorded at fair value generally are classified within Level 1 or Level 2 within the fair value hierarchy using quoted market prices or quotes from market makers or broker-dealers. Financial instruments classified within Level 1 are valued based on quoted market prices in active markets and consist of U.S. government, federal agency, and sovereign government obligations, corporate equities, and certain money market instruments. Level 2 financial instruments primarily consist of investment grade and high-yield corporate debt, convertible bonds, mortgage and asset-backed securities, municipal obligations, and certain money market instruments. Financial instruments classified as Level 2 are valued based on quoted prices for similar assets and liabilities in active markets and quoted prices for identical or similar assets and liabilities in markets that are not active. Some financial instruments are classified within Level 3 within the fair value hierarchy as observable pricing inputs are not available due to limited market activity for the asset or liability. Such financial instruments include investments in hedge funds and private equity funds where the Company, through its subsidiaries, is general partner; less-liquid private label mortgage and asset-backed securities; certain distressed municipal securities; interest rate lock commitments where OMHHF enters into contractual commitments to originate (purchase) and sell multifamily mortgage loans at fixed prices with fixed expiration dates; and auction rate securities ("ARS").
Fair Value Option
The Company has the option to measure certain financial assets and financial liabilities at fair value with changes in fair value recognized in earnings each period. The Company may make a fair value option election on an instrument-by-instrument basis at initial recognition of an asset or liability or upon an event that gives rise to a new basis of accounting for that instrument.
Consolidation
The Company consolidates all subsidiaries in which it has a controlling financial interest, as well as any variable interest entities ("VIEs") where the Company is deemed to be the primary beneficiary, when it has the power to make the decisions that most significantly affect the economic performance of the VIE and has the obligation to absorb significant losses or the right to receive benefits that could potentially be significant to the VIE. The Company reviews factors, including the rights of the equity holders and obligations of equity holders to absorb losses or receive expected residual returns, to determine if the investee is a VIE. In evaluating whether the Company is the primary beneficiary, the Company evaluates its economic interests in the entity held either directly or indirectly by the Company. Accounting Standards Update ("ASU") No. 2010-10, "Amendments for Certain Investment Funds," defers the application of the revised consolidation rules for a reporting entity's interest in an entity if certain conditions are met. ASU No. 2015-02, "Consolidation - Amendments to the Consolidation Analysis," eliminates the deferral of the application of the revised consolidation rules and make changes to both the variable interest model and the voting model. Under this ASU, a general partner will not consolidate a partnership or similar entity under the voting model. The ASU is effective for the annual reporting period in the fiscal year that began after December 15, 2015 and early adoption is permitted. The Company will not early adopt this ASU. The adoption of this ASU will impact the disclosure of VIEs and will not have a material impact on the Company's consolidated financial statements.
66
OPPENHEIMER HOLDINGS INC. Notes to Consolidated Financial Statements | ||
Financing Receivables
The Company's financing receivables include customer margin loans, reverse repurchase agreements, and securities borrowed transactions. The Company uses financing receivables to extend margin loans to customers, meet trade settlement requirements, and facilitate its matched-book arrangements and inventory requirements.
Allowance for Credit Losses
The Company's financing receivables are secured by collateral received from clients and counterparties. In many cases, the Company is permitted to sell or re-pledge securities held as collateral. These securities may be used to collateralize repurchase agreements, to enter into securities lending agreements, to cover short positions or fulfill the obligation of fails to deliver. The Company monitors the market value of the collateral received on a daily basis and may require clients and counterparties to deposit additional collateral or return collateral pledged, when appropriate.
Customer receivables, primarily consisting of customer margin loans collateralized by customer-owned securities, are stated net of allowance for credit losses. The Company reviews large customer accounts that do not comply with the Company's margin requirements on a case-by-case basis to determine the likelihood of collection and records an allowance for credit loss following that process. For small customer accounts that do not comply with the Company's margin requirements, the allowance for credit loss is generally recorded as the amount of unsecured or partially secured receivables.
The Company also makes loans to financial advisers as part of its hiring process. These loans are recorded as notes receivable on its consolidated balance sheet. Allowances are established on these loans if the financial adviser is no longer associated with the Company and the loan has not been promptly repaid.
Legal and Regulatory Reserves
The Company records reserves related to legal and regulatory proceedings in accounts payable and other liabilities. The determination of the amounts of these reserves requires significant judgment on the part of management. In accordance with applicable accounting guidance, the Company establishes reserves for litigation and regulatory matters where available information indicates that it is probable a liability had been incurred at the date of the consolidated financial statements and the Company can reasonably estimate the amount of that loss. When loss contingencies are not probable and cannot be reasonably estimated, the Company does not establish reserves.
When determining whether to record a reserve, management considers many factors including, but not limited to, the amount of the claim; the stage and forum of the proceeding, the sophistication of the claimant, the amount of the loss, if any, in the client's account and the possibility of wrongdoing, if any, on the part of an employee of the Company; the basis and validity of the claim; previous results in similar cases; and applicable legal precedents and case law. Each legal and regulatory proceeding is reviewed with counsel in each accounting period and the reserve is adjusted as deemed appropriate by management. Any change in the reserve amount is recorded in the results of that period. The assumptions of management in determining the estimates of reserves may be incorrect and the actual disposition of a legal or regulatory proceeding could be greater or less than the reserve amount.
Goodwill
The Company defines a reporting unit as an operating segment. The Company's goodwill resides in its Private Client Division ("PCD") reporting unit. Goodwill of a reporting unit is subject to at least an annual test for impairment to determine if the estimated fair value of a reporting unit is less than its carrying amount. Goodwill of a reporting unit is required to be tested for impairment between annual tests if an event occurs or circumstances change that would more likely than not reduce the fair value of a reporting unit below its carrying amount. Due to the volatility in the financial services sector and equity markets in general, determining whether an impairment of goodwill has occurred is increasingly difficult and requires management to exercise significant judgment. The Company's goodwill impairment analysis performed at December 31, 2015 applied the same valuation methodologies with consistent inputs as that performed at December 31, 2014, as follows:
67
OPPENHEIMER HOLDINGS INC. Notes to Consolidated Financial Statements | ||
In estimating the fair value of the PCD, the Company uses traditional standard valuation methods, including the market comparable approach and income approach. The market comparable approach is based on comparisons of the subject company to public companies whose stocks are actively traded ("Price Multiples") or to similar companies engaged in an actual merger or acquisition ("Precedent Transactions"). As part of this process, multiples of value relative to financial variables, such as earnings or stockholders' equity, are developed and applied to the appropriate financial variables of the subject company to indicate its value. The income approach involves estimating the present value of the subject company's future cash flows by using projections of the cash flows that the business is expected to generate, and discounting these cash flows at a given rate of return ("Discounted Cash Flow" or "DCF"). Each of these standard valuation methodologies requires the use of management estimates and assumptions.
In its Price Multiples valuation analysis, the Company uses various operating metrics of comparable companies, including revenues, after-tax earnings, EBITDA as well as price-to-book value ratios at a point in time. The Company analyzes prices paid in Precedent Transactions that are comparable to the business conducted in the PCD. The DCF analysis includes the Company's assumptions regarding discount rate, growth rates of the PCD's revenues, expenses, EBITDA, and capital expenditures, adjusted for current economic conditions and expectations. The Company weighs each of the three valuation methods equally in its overall valuation. Given the subjectivity involved in selecting which valuation method to use, the corresponding weightings, and the input variables for use in the analyses, it is possible that a different valuation model and the selection of different input variables could produce a materially different estimate of the fair value of the PCD reporting unit.
Intangible Assets
Indefinite intangible assets are comprised of trademarks and trade names. Trademarks and trade names, carried at $31.7 million, which are not amortized, are subject to at least an annual test for impairment to determine if the estimated fair value is less than their carrying amount.
Share-Based Compensation Plans
As part of the compensation to employees and directors, the Company uses stock-based compensation, consisting of restricted stock, stock options and stock appreciation rights. In accordance with ASC Topic 718, "Compensation - Stock Compensation," the Company classifies the stock options and restricted stock awards as equity awards, which requires the compensation cost to be recognized on the consolidated statements of income at grant date fair value. The fair value of restricted stock awards is determined based on the grant date closing price of the Company's Class A Stock adjusted for the present value of the dividend. The fair value of stock options is determined using the Black-Scholes model using a forfeiture rate based on historical results. Key assumptions used to estimate the fair value include the expected term and the expected volatility of the Company's Class A Stock over the term of the award, the risk-free interest rate over the expected term, and the Company's expected annual dividend yield. Compensation expense related to these awards is amortized over the service period of the award, net of estimated forfeitures.
The Company classifies stock appreciation rights ("OARs") as liability awards, which requires the fair value to be remeasured at each reporting period until the award vests. The fair value of OARs is determined using the Black-Scholes model at the end of each reporting period. The adjusted liability is amortized on a straight-line basis over the vesting period.
Mortgage Servicing Rights
The Company's Mortgage Servicing Rights ("MSRs") assets are initially measured and recorded at fair value based on the present value of future net servicing income adjusted for factors such as discount rate and prepayment speeds. After initial measurement, MSRs are amortized over a ten year period. The Company assesses the capitalized MSRs for impairment quarterly by comparing the aggregate carrying value of the MSR portfolio to the aggregate estimated fair value of the portfolio.
68
OPPENHEIMER HOLDINGS INC. Notes to Consolidated Financial Statements | ||
Revenue Recognition
Brokerage
Customers' securities and commodities transactions are reported on a settlement date basis, which is generally three business days after trade date for securities transactions and one day for commodities transactions. Related commission income and expense is recorded on a trade date basis.
Principal Transactions
Transactions in proprietary securities and related revenue and expenses are recorded on a trade date basis. Securities owned and securities sold, but not yet purchased, are reported at fair value generally based upon quoted prices. Realized and unrealized changes in fair value are recognized in principal transactions, net in the period in which the change occurs.
Investment Banking Fees
Underwriting revenues and advisory fees from mergers, acquisitions and restructuring transactions are recorded when services for the transactions are completed and income is reasonably determinable, generally as set forth under the terms of the engagement. Transaction-related expenses, primarily consisting of legal, travel and other costs directly associated with the transaction, are deferred and recognized in the same period as the related investment banking transaction revenue. Underwriting revenues are presented net of related expenses. Non-reimbursable expenses associated with advisory transactions are recorded within other expenses.
Interest
Interest revenue represents interest earned on margin debit balances, securities borrowed transactions, reverse repurchase agreements, fixed income securities, firm investments, and cash and cash equivalents. Interest revenue is recognized in the period earned based upon average or daily asset balances, contractual cash flows, and interest rates.
Asset Management
Asset management fees are generally recognized over the period the related service is provided based on the account value at the valuation date per the respective asset management agreements. In certain circumstances, OAM is entitled to receive performance (or incentive) fees when the return on assets under management ("AUM") exceeds certain benchmark returns or other performance targets. Performance fees are generally based on investment performance over a 12-month period and are not subject to adjustment once the measurement period ends. Such fees are computed as at the fund's year-end when the measurement period ends and generally are recorded as earned in the fourth quarter of the Company's fiscal year. Asset management fees and performance fees are included in advisory fees in the consolidated statements of income. Assets under management are not included as assets of the Company.
Cash Sweep Income
Cash sweep income consists of revenues earned from the Advantage Bank Deposit Program. Under this program, client funds are swept into deposit accounts at participating banks and are eligible for FDIC deposit insurance up to FDIC standard maximum deposit insurance amounts. The Company earns the net interest paid on these deposits after administrative fees are paid to the administrator of the program and a portion of interest is credited to clients. The net interest income earned in the period is recorded in other revenue.
69
OPPENHEIMER HOLDINGS INC. Notes to Consolidated Financial Statements | ||
Balance Sheet
Cash and Cash Equivalents
The Company defines cash equivalents as highly liquid investments with original maturities of less than 90 days that are not held for sale in the ordinary course of business.
Receivables from / Payables to Brokers, Dealers and Clearing Organizations
Securities borrowed and securities loaned are carried at the amounts of cash collateral advanced or received. Securities borrowed transactions require the Company to deposit cash or other collateral with the lender. The Company receives cash or collateral in an amount generally in excess of the market value of securities loaned. The Company monitors the market value of securities borrowed and loaned on a daily basis and may require counterparties to deposit additional collateral or return collateral pledged, when appropriate.
Securities failed to deliver and receive represent the contract value of securities which have not been received or delivered by settlement date.
Securities Purchased under Agreements to Resell and Securities Sold under Agreements to Repurchase
Reverse repurchase agreements and repurchase agreements are treated as collateralized financing transactions and are recorded at their contractual amounts plus accrued interest. The resulting interest income and expense for these arrangements are included in interest income and interest expense in the consolidated statements of income. The Company can present the reverse repurchase and repurchase transactions on a net-by-counterparty basis when the specific offsetting requirements are satisfied.
Notes Receivable
Notes receivable represent recruiting and retention payments generally in the form of upfront loans to financial advisers and key revenue producers as part of the Company's overall growth strategy. These notes are generally forgiven and amortized over a service period of 3 to 5 years from the initial date of the note or based on productivity levels of employees. All such notes are contingent on the employees' continued employment with the Company. The unforgiven portion of the notes becomes due on demand in the event the employee departs during the service period. Amortization of notes receivable is included in the consolidated statements of income in compensation and related expenses.
Office Facilities
Office facilities are stated at cost less accumulated depreciation. Depreciation of furniture, fixtures, and equipment is provided on a straight-line basis generally over 3-7 years. Leasehold improvements are amortized on a straight-line basis over the shorter of the life of the improvement or the remaining term of the lease. Leases with escalating rents are expensed on a straight-line basis over the life of the lease. Landlord incentives are recorded as deferred rent and amortized, as reductions to lease expense, on a straight-line basis over the life of the applicable lease. Deferred rent is included in accounts payable and other liabilities in the consolidated balance sheet.
Drafts Payable
Drafts payable represent amounts drawn by the Company against a bank.
Foreign Currency Translations
Foreign currency balances have been translated into U.S. dollars as follows: monetary assets and liabilities at exchange rates prevailing at period end; revenue and expenses at average rates for the period; and non-monetary assets and stockholders' equity at historical rates. The functional currency of the overseas operations is the local currency in each location except for Oppenheimer Europe Ltd. and Oppenheimer Investments Asia Limited which have the U.S. dollar as their functional currency.
70
OPPENHEIMER HOLDINGS INC. Notes to Consolidated Financial Statements | ||
Income Taxes
The Company accounts for income taxes under the asset and liability method, which requires the recognition of deferred tax assets and liabilities for the expected future tax consequences of events that have been included in the financial statements. Under this method, deferred tax assets and liabilities are determined on the basis of the differences between the financial statement and tax bases of assets and liabilities using enacted tax rates in effect for the year in which the differences are expected to reverse. The effect of a change in tax rates on deferred tax assets and liabilities is recognized in income in the period that includes the enactment date.
The Company recognizes deferred tax assets to the extent it believes these assets are more likely than not to be realized. In making such a determination, the Company considers all available positive and negative evidence, including future reversals of existing taxable temporary differences, projected future taxable income, tax planning strategies, and the results of recent operations.
The Company records uncertain tax positions in accordance with ASC 740 on the basis of a two-step process whereby it determines whether it is more likely than not that the tax positions will be sustained on the basis of the technical merits of the position and for those tax positions that meet the more-likely-than-not recognition threshold, the Company recognizes the largest amount of tax benefit that is more than 50 percent likely to be realized upon ultimate settlement with the related tax authority.
The Company records interest and penalties accruing on unrecognized tax benefits in income before income tax provision as interest expense and other expense, respectively, in its consolidated statement of income.
The Company permanently reinvests eligible earnings of its foreign subsidiaries and, accordingly, does not accrue any U.S. income taxes that would arise if such earnings were repatriated.
New Accounting Pronouncements
Recently Adopted
In April 2014, the FASB issued ASU No. 2014-08, "Reporting Discontinued Operations and Disclosures of Disposals of Components of an Entity." Under this ASU, a discontinued operation is defined as a disposal of a component or group of components that is disposed of and represents a strategic shift that has or will have a major effect on an entity's operation. The ASU also modified related disclosure requirements. The ASU became effective for the annual reporting period in the fiscal year that began after December 15, 2014. The adoption of this accounting guidance did not have a material impact on the Company's consolidated financial statements.
In June 2014, the FASB issued ASU No. 2014-11, "Transfers and Servicing – Repurchase-to-Maturity Transactions, Repurchase Financing, and Disclosures," which makes amendments to the guidance in Accounting Standards Codification 860 on accounting for certain repurchase agreements. The ASU is effective for the annual reporting period in the fiscal year that began December 15, 2015, except for the disclosures related to transactions accounted for as secured borrowings, which became effective for the period began on or after March 15, 2015. The adoption of this accounting guidance did not have a material impact on the Company's consolidated financial statements. See Note 6, Collateralized transactions, below.
In November 2014, the FASB issued ASU No. 2014-17 "Business Combination - Pushdown Accounting." The ASU gives the acquired entity the option of applying pushdown accounting in its stand-alone financial statements upon a change-in-control event. The ASU became effective upon issuance. The adoption of this accounting guidance did not have a material impact on the Company's consolidated financial statements.
71
OPPENHEIMER HOLDINGS INC. Notes to Consolidated Financial Statements | ||
Recently Issued
In May 2014, the FASB issued ASU No. 2014-09, "Revenue from Contracts with Customers." The ASU outlines a single comprehensive model for entities to use in accounting for revenue arising from contracts with customers. Additionally, the ASU expands the disclosure requirements for revenue recognition. The ASU was originally effective for the annual reporting period in the fiscal year that begins after December 15, 2016. In August 2015, the FASB issued ASU No. 2015-14, "Revenue from Contracts with Customers: Deferral of the Effective Date." which defers the effective date of the standard to the annual reporting period in the fiscal year that begins after December 15, 2017 and early adoption is permitted as of the original effective date. The Company is currently evaluating the impact, if any, that the ASU will have on its consolidated financial statements.
In June 2014, the FASB issued ASU No. 2014-12, "Compensation - Stock Compensation." The ASU clarifies that entities should treat performance targets that can be met after the requisite service period of a share-based award as performance conditions that affect vesting. The ASU is effective for the annual reporting period in the fiscal year that began December 15, 2015 and early adoption is permitted. The Company will not early adopt this ASU. The adoption of the ASU will not have a material impact on the Company's consolidated financial statements.
In August 2014, the FASB issued ASU No. 2014-15, "Disclosure of Uncertainties About an Entity's Ability to Continue as a Going Concern," which provides guidance on determining when and how reporting entities must disclose going-concern uncertainties in their financial statements. The ASU requires management of an entity to perform interim and annual assessments of an entity's ability to continue as a going concern within one year of the date of issuance of the entity's financial statements and also provide disclosures if there is "substantial doubt about the entity's ability to continue as a going concern." The ASU is effective for the annual reporting period in the fiscal year that begins after December 15, 2016 and early adoption is permitted. The Company will not early adopt this ASU. The Company is currently evaluating the impact on its disclosure.
In January 2015, the FASB issued ASU No. 2015-01, "Income Statement - Extraordinary and Unusual Items," to simplify income statement classification by removing the concept of extraordinary items. Under the existing guidance, an entity is required to separately disclose extraordinary items, net of tax, in the income statement after income from continuing operations if an event or transaction is of an unusual nature and occurs infrequently. This separate, net-of-tax presentation (and corresponding earnings per share impact) will no longer be allowed. However, the existing requirement to separately present items that are of an unusual nature or occur infrequently on a pre-tax basis within income from continuing operations has been retained. The ASU is effective for the annual reporting period in the fiscal year that began after December 15, 2015. Early adoption is permitted, but only as of the beginning of the fiscal year of adoption. Upon adoption, a reporting entity may elect prospective or retrospective application. If adopted prospectively, both the nature and amount of any subsequent adjustments to previously reported extraordinary items must be disclosed. The Company will not early adopt this ASU. The adoption of the ASU will not have a material impact on its consolidated financial statements.
In February 2015, the FASB issued ASU No. 2015-02, "Consolidation - Amendments to the Consolidation Analysis," to eliminate the deferral of the application of the revised consolidation rules and make changes to both the variable interest model and the voting model. Under this ASU, a general partner will not consolidate a partnership or similar entity under the voting model. The ASU is effective for the annual reporting period in the fiscal year that began after December 15, 2015 and early adoption is permitted. The Company will not early adopt this ASU. The adoption of the ASU will impact the disclosure of VIEs but will not have a material impact on the Company's consolidated financial statements.
In April 2015, the FASB issued ASU No. 2015-03, "Simplifying the Presentation of Debt Issuance Costs," which requires debt issuance costs to be presented in the balance sheet as a direct deduction from the carrying value of the associated debt liability. The ASU is effective for the annual reporting period in the fiscal year that began after December 15, 2015 and early adoption is permitted. The Company will not early adopt this ASU. The adoption of the ASU will not have a material impact on the Company's consolidated financial statements.
72
OPPENHEIMER HOLDINGS INC. Notes to Consolidated Financial Statements | ||
In May 2015, the FASB issued ASU No. 2015-07, "Disclosures for Investments in Certain Entities That Calculate Net Asset Value per Share (or Its Equivalent)," which removes the requirement to categorize within the fair value hierarchy all investments measured using the net asset value per share practical expedient and related disclosures. The ASU is effective for the annual reporting periods in the fiscal year that began after December 15, 2015 and early adoption is permitted. The Company will not early adopt this ASU. The adoption of the ASU will not have a material impact on the Company's consolidated financial statements.
3. Cash and securities segregated for regulatory and other purposes
There were no deposits held in special reserve bank accounts for the exclusive benefit of customers in accordance with regulatory requirements at December 31, 2015 ($17.7 million at December 31, 2014). To the extent permitted, these deposits are invested in interest bearing accounts collateralized by qualified securities.
4. Receivable from and payable to brokers, dealers and clearing organizations
(Expressed in thousands) | |||||||
As of December 31, | |||||||
2015 | 2014 | ||||||
Receivable from brokers, dealers and clearing organizations consist of: | |||||||
Securities borrowed | $ | 224,672 | $ | 242,172 | |||
Receivable from brokers | 49,458 | 38,149 | |||||
Securities failed to deliver | 7,799 | 11,055 | |||||
Clearing organizations | 25,030 | 21,106 | |||||
Other | 53,954 | 1,993 | |||||
Total | $ | 360,913 | $ | 314,475 | |||
Payable to brokers, dealers and clearing organizations consist of: | |||||||
Securities loaned | $ | 130,658 | $ | 137,892 | |||
Payable to brokers | 3,316 | 4,559 | |||||
Securities failed to receive | 21,513 | 23,573 | |||||
Other | 9,059 | 91,137 | |||||
Total | $ | 164,546 | $ | 257,161 | |||
73
OPPENHEIMER HOLDINGS INC. Notes to Consolidated Financial Statements | ||
5. Fair value measurements
Securities owned and securities sold but not yet purchased, investments and derivative contracts are carried at fair value with changes in fair value recognized in earnings each period.
Securities Owned and Securities Sold, But Not Yet Purchased at Fair Value
(Expressed in thousands) | ||||||||||||||||
As of December 31, | ||||||||||||||||
2015 | 2014 | |||||||||||||||
Owned | Sold | Owned | Sold | |||||||||||||
U.S. Government, agency and sovereign obligations | $ | 509,614 | $ | 77,485 | $ | 570,607 | $ | 30,615 | ||||||||
Corporate debt and other obligations | 16,138 | 1,652 | 19,795 | 2,646 | ||||||||||||
Mortgage and other asset-backed securities | 3,504 | 27 | 6,689 | 255 | ||||||||||||
Municipal obligations | 30,132 | — | 60,833 | 51 | ||||||||||||
Convertible bonds | 54,693 | 5,951 | 49,813 | 11,369 | ||||||||||||
Corporate equities | 34,475 | 41,378 | 42,751 | 47,574 | ||||||||||||
Money markets | 35 | — | 1,245 | — | ||||||||||||
Auction rate securities | 86,802 | — | 91,422 | — | ||||||||||||
Total | $ | 735,393 | $ | 126,493 | $ | 843,155 | $ | 92,510 | ||||||||
Securities owned and securities sold, but not yet purchased, consist of trading and investment securities at fair values. Included in securities owned at December 31, 2015 are corporate equities with estimated fair values of approximately $14.0 million ($15.7 million at December 31, 2014), which are related to deferred compensation liabilities to certain employees included in accrued compensation on the consolidated balance sheet.
Valuation Techniques
A description of the valuation techniques applied and inputs used in measuring the fair value of the Company's financial instruments is as follows:
U.S. Government Obligations
U.S. Treasury securities are valued using quoted market prices obtained from active market makers and inter-dealer brokers.
U.S. Agency Obligations
U.S. agency securities consist of agency issued debt securities and mortgage pass-through securities. Non-callable agency issued debt securities are generally valued using quoted market prices. Callable agency issued debt securities are valued by benchmarking model-derived prices to quoted market prices and trade data for identical or comparable securities. The fair value of mortgage pass-through securities are model driven with respect to spreads of the comparable To-be-announced ("TBA") security.
Sovereign Obligations
The fair value of sovereign obligations is determined based on quoted market prices when available or a valuation model that generally utilizes interest rate yield curves and credit spreads as inputs.
Corporate Debt and Other Obligations
The fair value of corporate bonds is estimated using recent transactions, broker quotations and bond spread information.
74
OPPENHEIMER HOLDINGS INC. Notes to Consolidated Financial Statements | ||
Mortgage and Other Asset-Backed Securities
The Company holds non-agency securities collateralized by home equity and various other types of collateral which are valued based on external pricing and spread data provided by independent pricing services. When specific external pricing is not observable, the valuation is based on yields and spreads for comparable bonds.
Municipal Obligations
The fair value of municipal obligations is estimated using recently executed transactions, broker quotations, and bond spread information.
Convertible Bonds
The fair value of convertible bonds is estimated using recently executed transactions and dollar-neutral price quotations, where observable. When observable price quotations are not available, fair value is determined based on cash flow models using yield curves and bond spreads as key inputs.
Corporate Equities
Equity securities and options are generally valued based on quoted prices from the exchange or market where traded. To the extent quoted prices are not available, fair values are generally derived using bid/ask spreads.
Loans Held for Sale
The Company elected the fair value option for loans held for sale and determines the fair value using both a discounted cash flow model (see key assumptions used in determining mortgage servicing rights below) and quoted observable prices from market participants.
Interest Rate Lock Commitments
OMHHF records an interest rate lock commitment upon the commitment to originate a loan with a borrower. This commitment, which can be an asset or liability, is recognized at fair value, which reflects the fair value of the contractual loan origination related fees and sale premiums, net of co-broker fees, and the estimated fair value of the expected net future cash flows associated with the servicing of the loan. The interest rate lock commitments are valued using a discounted cash flow model developed based on U.S. Treasury rate changes and other observable market data. The fair value is determined after considering the potential impact of collateralization.
To-Be-Announced ("TBA") sale contracts
TBA sale contracts of permanent loans originated or purchased at OMHHF are based on observable market prices of recently executed purchases of similar loans which are then used to derive a market implied spread, which in turn is used as the primary input in estimating the fair value of loans at the measurement date. TBA sale contracts of construction loans originated or purchased at OMHHF are based on observable market prices of recently executed purchases.
Mortgage Servicing Rights ("MSRs")
The Company's MSRs are measured at fair value on a nonrecurring basis. The MSRs are initially measured at fair value on the loan securitization date and subsequently measured on the amortized cost basis subject to quarterly impairment testing. MSRs do not trade in active open markets with readily observable pricing. Therefore the Company uses a discounted cash flow model to estimate the fair value of MSRs. The discounted cash flow model calculates the present value of estimated future net servicing income using inputs such as contractually specified servicing fees, prepayment assumptions, delinquency rates, late charges, other ancillary revenue, costs to service and other economic factors. The Company reassesses and periodically adjusts the underlying inputs and assumptions used in the model to reflect observable and unobservable market conditions and assumptions that a market participant would consider in valuing a MSR asset. MSRs are carried at the lower of amortized cost or estimated fair value.
75
OPPENHEIMER HOLDINGS INC. Notes to Consolidated Financial Statements | ||
The following key assumptions were used in determining the initial fair value of MSRs:
Discount Rate – The discount rate used for originated permanent and construction loans averaged approximately 12%.
Estimated Life – The estimated life of the MSRs is derived using a continuous prepayment rate ("CPR") assumption which estimates projected prepayments of the loan portfolio by considering factors such as note rates, lockouts, and prepayment penalties at the loan level. The CPR rates used are 0% until such time that a loan's prepayment penalty rate hits 4% of the unpaid principal balance of the loan with the vast majority of CPR speeds ranging from 10% to 15% thereafter, with an average of 12%.
Servicing Costs – The estimated future cost to service the loans on an annual basis per loan averages approximately $1,250 for a permanent loan, with a considerably higher cost to service during the construction phase.
The Company does not anticipate any credit losses on the commercial mortgages it services since all of the mortgages are insured for and guaranteed against credit losses by the Federal Housing Administration ("FHA") and the Government National Mortgage Association ("GNMA") and are thus guaranteed by the U.S. government.
Auction Rate Securities
In February 2010, Oppenheimer finalized settlements with each of the New York Attorney General's office ("NYAG") and the Massachusetts Securities Division ("MSD" and, together with the NYAG, the "Regulators") concluding investigations and administrative proceedings by the Regulators concerning Oppenheimer's marketing and sale of ARS. Pursuant to the settlements with the Regulators, Oppenheimer agreed to extend offers to repurchase ARS from certain of its clients subject to certain terms and conditions more fully described below. As of December 31, 2015, the Company had $5.0 million of outstanding ARS purchase commitments related to the settlements with the Regulators. In addition to the settlements with the Regulators, Oppenheimer has also reached settlements of and received adverse awards in legal proceedings with various clients where the Company is obligated to purchase ARS. Pursuant to completed Purchase Offers (as defined) under the settlements with the Regulators and client related legal settlements and awards to purchase ARS, as of December 31, 2015, the Company purchased and holds (net of redemptions) approximately $92.0 million in ARS from its clients. In addition, the Company is committed to purchase another $22.8 million in ARS from clients through 2020 under legal settlements and awards.
The ARS positions that the Company owns and is committed to purchase primarily represent auction rate preferred securities issued by closed-end funds and, to a lesser extent, municipal auction rate securities which are municipal bonds wrapped by municipal bond insurance and student loan auction rate securities which are asset-backed securities backed by student loans.
Interest rates on ARS typically reset through periodic auctions. Due to the auction mechanism and generally liquid markets, ARS have historically been categorized as Level 1 of the fair value hierarchy. Beginning in February 2008, uncertainties in the credit markets resulted in substantially all of the ARS market experiencing failed auctions. Once the auctions failed, the ARS could no longer be valued using observable prices set in the auctions. The Company has used less observable determinants of the fair value of ARS, including the strength in the underlying credits, announced issuer redemptions, completed issuer redemptions, and announcements from issuers regarding their intentions with respect to their outstanding ARS. The Company has also developed an internal methodology to discount for the lack of liquidity and non-performance risk of the failed auctions. Due to liquidity problems associated with the ARS market, ARS that lack liquidity are setting their interest rates according to a maximum rate formula. For example, an auction rate preferred security maximum rate may be set at 200% of a short-term index such as LIBOR or U.S. Treasury yield. For fair value purposes, the Company has determined that the maximum spread would be an adequate risk premium to account for illiquidity in the market. Accordingly, the Company applies a spread to the short-term index for each asset class to derive the discount rate. The Company uses short-term U.S. Treasury yields as its benchmark short-term index. The risk of non-performance is typically reflected in the prices of ARS positions where the fair value is derived from recent trades in the secondary market.
76
OPPENHEIMER HOLDINGS INC. Notes to Consolidated Financial Statements | ||
The ARS purchase commitment, or derivative liability, arises from both the settlements with the Regulators and legal settlements and awards. The ARS purchase commitment represents the difference between the principal value and the fair value of the ARS the Company is committed to purchase. The Company utilizes the same valuation methodology for the ARS purchase commitment as it does for the ARS it owns. Additionally, the present value of the future principal value of ARS purchase commitments under legal settlements and awards is used in the discounted valuation model to reflect the time value of money over the period of time that the commitments are outstanding. The amount of the ARS purchase commitment only becomes determinable once the Company has met with its primary regulator and the NYAG and agreed upon a buyback amount, commenced the ARS buyback offer to clients, and received notice from its clients which ARS they are tendering. As a result, it is not possible to observe the current yields actually paid on the ARS until all of these events have happened which is typically very close to the time that the Company actually purchases the ARS. For ARS purchase commitments pursuant to legal settlements and awards, the criteria for purchasing ARS from clients is based on the nature of the settlement or award which will stipulate a time period and amount for each repurchase. The Company will not know which ARS will be tendered by the client until the stipulated time for repurchase is reached. Therefore, the Company uses the current yields of ARS owned in its discounted valuation model to determine a fair value of ARS purchase commitments. The Company also uses these current yields by asset class (i.e., auction rate preferred securities, municipal auction rate securities, and student loan auction rate securities) in its discounted valuation model to determine the fair value of ARS purchase commitments. In addition, the Company uses the discount rate and duration of ARS owned, by asset class, as a proxy for the duration of ARS purchase commitments.
Additional information regarding the valuation technique and inputs for ARS used is as follows:
77
OPPENHEIMER HOLDINGS INC. Notes to Consolidated Financial Statements | ||
(Expressed in thousands) | ||||||||||||||||||||
Quantitative Information about Level 3 Fair Value Measurements at December 31, 2015 | ||||||||||||||||||||
Product | Principal | Valuation Adjustment | Fair Value | Valuation Technique | Unobservable Input | Range | Weighted Average | |||||||||||||
Auction Rate Securities ("ARS") Owned (1) | ||||||||||||||||||||
Auction Rate Preferred Securities | $ | 87,925 | $ | 4,550 | $ | 83,375 | Discounted Cash Flow | Discount Rate (2) | 1.70% to 2.32% | 2.00% | ||||||||||
Duration | 4.0 Years | 4.0 Years | ||||||||||||||||||
Current Yield (3) | 0.44% to 0.85% | 0.64% | ||||||||||||||||||
Municipal Auction Rate Securities | 25 | 2 | 23 | Discounted Cash Flow | Discount Rate (4) | 2.90% | 2.90% | |||||||||||||
Duration | 4.5 Years | 4.5 Years | ||||||||||||||||||
Current Yield (3) | 1.14% | 1.14% | ||||||||||||||||||
Student Loan Auction Rate Securities | 400 | 27 | 373 | Discounted Cash Flow | Discount Rate (5) | 3.30% | 3.30% | |||||||||||||
Duration | 7.0 Years | 7.0 Years | ||||||||||||||||||
Current Yield (3) | 2.19% | 2.19% | ||||||||||||||||||
Other (7) | 3,625 | 594 | 3,031 | Secondary Market Trading Activity | Observable trades in inactive market for in-portfolio securities | 83.62% of par | 83.62% of par | |||||||||||||
$ | 91,975 | $ | 5,173 | $ | 86,802 | |||||||||||||||
Auction Rate Securities Commitments to Purchase (6) | ||||||||||||||||||||
Auction Rate Preferred Securities | $ | 27,766 | $ | 1,366 | $ | 26,400 | Discounted Cash Flow | Discount Rate (2) | 1.70% to 2.32% | 2.00% | ||||||||||
Duration | 4.0 Years | 4.0 Years | ||||||||||||||||||
Current Yield (3) | 0.44% to 0.85% | 0.64% | ||||||||||||||||||
Municipal Auction Rate Securities | 2 | — | 2 | Discounted Cash Flow | Discount Rate (4) | 2.90% | 2.90% | |||||||||||||
Duration | 4.5 Years | 4.5 Years | ||||||||||||||||||
Current Yield (3) | 1.14% | 1.14% | ||||||||||||||||||
Student Loan Auction Rate Securities | 45 | 3 | 42 | Discounted Cash Flow | Discount Rate (5) | 3.30% | 3.30% | |||||||||||||
Duration | 7.0 Years | 7.0 Years | ||||||||||||||||||
Current Yield (3) | 2.19% | 2.19% | ||||||||||||||||||
$ | 27,813 | $ | 1,369 | $ | 26,444 | |||||||||||||||
Total | $ | 119,788 | $ | 6,542 | $ | 113,246 | ||||||||||||||
(1) | Principal amount represents the par value of the ARS and is included in securities owned in the consolidated balance sheet at December 31, 2015. The valuation adjustment amount is included as a reduction to securities owned in the consolidated balance sheet at December 31, 2015. |
(2) | Derived by applying a multiple to the spread between 110% to 150% to the U.S. Treasury rate of 1.54%. |
(3) | Based on current yields for ARS positions owned. |
(4) | Derived by applying a multiple to the spread of 175% to the U.S. Treasury rate of 1.66%. |
(5) | Derived by applying the sum of the spread of 1.20% to the U.S. Treasury rate of 2.10%. |
(6) | Principal amount represents the present value of the ARS par value that the Company is committed to purchase at a future date. This principal amount is presented as an off-balance sheet item. The Valuation Adjustment amount is included in accounts payable and other liabilities on the consolidated balance sheet at December 31, 2015. |
(7) | Represents ARS issued by a credit default obligation structure that the Company has purchased and is committed to purchase as a result of a legal settlement. |
78
OPPENHEIMER HOLDINGS INC. Notes to Consolidated Financial Statements | ||
The fair value of ARS and ARS purchase commitments is particularly sensitive to movements in interest rates. Increases in short-term interest rates would increase the discount rate input used in the ARS valuation and thus reduce the fair value of the ARS (increase the valuation adjustment). Conversely, decreases in short-term interest rates would decrease the discount rate and thus increase the fair value of ARS (decrease the valuation adjustment). However, an increase (decrease) in the discount rate input would be partially mitigated by an increase (decrease) in the current yield earned on the underlying ARS asset increasing the cash flows and thus the fair value. Furthermore, movements in short term interest rates would likely impact the ARS duration (i.e., sensitivity of the price to a change in interest rates), which would also have a mitigating effect on interest rate movements. For example, as interest rates increase, issuers of ARS have an incentive to redeem outstanding securities as servicing the interest payments gets prohibitively expensive which would lower the duration assumption thereby increasing the ARS fair value. Alternatively, ARS issuers are less likely to redeem ARS in a lower interest rate environment as it is a relatively inexpensive source of financing which would increase the duration assumption thereby decreasing the ARS fair value. For example, see the following sensitivities:
• | The impact of a 25 basis point increase in the discount rate at December 31, 2015 would result in a decrease in the fair value of $1.1 million (does not consider a corresponding reduction in duration as discussed above). |
• | The impact of a 50 basis point increase in the discount rate at December 31, 2015 would result in a decrease in the fair value of $2.1 million (does not consider a corresponding reduction in duration as discussed above). |
These sensitivities are hypothetical and are based on scenarios where they are "stressed" and should be used with caution. These estimates do not include all of the interplay among assumptions and are estimated as a portfolio rather than as individual assets.
Due to the less observable nature of these inputs, the Company categorizes ARS in Level 3 of the fair value hierarchy. As of December 31, 2015, the Company had a valuation adjustment (unrealized loss) of $5.2 million for ARS owned which is included as a reduction to securities owned on the consolidated balance sheet. As of December 31, 2015, the Company also had a valuation adjustment of $1.4 million on ARS purchase commitments from settlements with the Regulators and legal settlements and awards which is included in other liabilities on the consolidated balance sheet. The total valuation adjustment was $6.5 million as of December 31, 2015. The valuation adjustment represents the difference between the principal value and the fair value of the ARS owned and ARS purchase commitments.
Investments
In its role as general partner in certain hedge funds and private equity funds, the Company, through its subsidiaries, holds direct investments in such funds. The Company uses the net asset value of the underlying fund as a basis for estimating the fair value of its investment. Due to the illiquid nature of these investments and difficulties in obtaining observable inputs, these investments are included in Level 3 of the fair value hierarchy.
The following table provides information about the Company's investments in Company-sponsored funds at December 31, 2015:
(Expressed in thousands) | |||||||||||
Fair Value | Unfunded Commitments | Redemption Frequency | Redemption Notice Period | ||||||||
Hedge funds (1) | $ | 2,325 | $ | — | Quarterly - Annually | 30 - 120 Days | |||||
Private equity funds (2) | 5,302 | 1,251 | N/A | N/A | |||||||
$ | 7,627 | $ | 1,251 | ||||||||
(1) | Includes investments in hedge funds and hedge fund of funds that pursue long/short, event-driven, and activist strategies. Each hedge fund has various restrictions regarding redemption; no investment is locked-up for a period greater than one year. |
(2) | Includes private equity funds and private equity fund of funds with a focus on diversified portfolios, real estate and global natural resources. Due to the illiquid nature of these funds, investors are not permitted to make withdrawals without the consent of the general partner. The lock-up period of the private equity funds can extend to 10 years. |
79
OPPENHEIMER HOLDINGS INC. Notes to Consolidated Financial Statements | ||
Valuation Process
The Finance & Accounting ("F&A") group is responsible for the Company's fair value policies, processes and procedures. F&A is independent from the business units and trading desks and is headed by the Company's Chief Financial Officer ("CFO"), who has final authority over the valuation of the Company's financial instruments. The Finance Control Group ("FCG") within F&A is responsible for daily profit and loss reporting, front-end trading system position reconciliations, monthly profit and loss reporting, and independent price verification procedures.
For financial instruments categorized in Levels 1 and 2 of the fair value hierarchy, the FCG performs a monthly independent price verification to determine the reasonableness of the prices provided by the Company's independent pricing vendor. The FCG uses its third-party pricing vendor, executed transactions, and broker-dealer quotes for validating the fair values of financial instruments.
For financial instruments categorized in Level 3 of the fair value hierarchy measured on a recurring basis, primarily for ARS, a group comprised of the CFO, the Controller, and an Operations Director are responsible for the ARS valuation model and resulting fair valuations. Procedures performed include aggregating all ARS owned by type from firm inventory accounts and ARS purchase commitments from regulatory and legal settlements and awards provided by the Legal Department. Observable and unobservable inputs are aggregated from various sources and entered into the ARS valuation model. For unobservable inputs, the group reviews the appropriateness of the inputs to ensure consistency with how a market participant would arrive at the unobservable input. For example, for the duration assumption, the group would consider recent policy statements regarding short-term interest rates by the Federal Reserve and recent ARS issuer redemptions and announcements for future redemptions. The model output is reviewed for reasonableness and consistency. Where available, comparisons are performed between ARS owned or committed to purchase to ARS that are trading in the secondary market.
For financial instruments categorized in Level 3 of the fair value hierarchy measured on a non-recurring basis, primarily for MSRs, the OMHHF Valuation Committee, which is comprised of the OMHHF President & Chief Executive Officer, OMHHF CFO, OMHHF Chief Operating Officer, and OMHHF Asset Manager, is responsible for the MSR model and resulting fair valuations. The OMHHF Valuation Committee performs its review of the model and assumptions and its impairment analysis on a quarterly basis. On an annual basis, the Company utilizes an external valuation consultant to validate that the internal MSR model is functioning appropriately. The OMHHF Valuation Committee compares assumptions used for unobservable inputs, such as for discount rates, estimated life, and costs of servicing, to that used by the external valuation consultant for reasonableness. The model output and resulting valuation multiples are reviewed for reasonableness and consistency. Where available, comparisons are performed to recent MSR sales in the secondary market. The Company's management reviews the results of both the quarterly reviews and annual impairment analysis.
Assets and Liabilities Measured at Fair Value
The Company's assets and liabilities, recorded at fair value on a recurring basis as of December 31, 2015 and December 31, 2014, have been categorized based upon the above fair value hierarchy as follows:
80
OPPENHEIMER HOLDINGS INC. Notes to Consolidated Financial Statements | ||
Assets and liabilities measured at fair value on a recurring basis as of December 31, 2015
(Expressed in thousands) | |||||||||||||||
Fair Value Measurements at December 31, 2015 | |||||||||||||||
Level 1 | Level 2 | Level 3 | Total | ||||||||||||
Assets | |||||||||||||||
Cash equivalents | $ | 13,000 | $ | — | $ | — | $ | 13,000 | |||||||
Deposits with clearing organizations | 31,456 | — | — | 31,456 | |||||||||||
Securities owned: | |||||||||||||||
U.S. Treasury securities | 436,533 | — | — | 436,533 | |||||||||||
U.S. Agency securities | 25,240 | 46,176 | — | 71,416 | |||||||||||
Sovereign obligations | — | 1,665 | — | 1,665 | |||||||||||
Corporate debt and other obligations | — | 16,138 | — | 16,138 | |||||||||||
Mortgage and other asset-backed securities | — | 3,504 | — | 3,504 | |||||||||||
Municipal obligations | — | 30,051 | 81 | 30,132 | |||||||||||
Convertible bonds | — | 54,693 | — | 54,693 | |||||||||||
Corporate equities | 34,475 | — | — | 34,475 | |||||||||||
Money markets | 35 | — | — | 35 | |||||||||||
Auction rate securities | — | — | 86,802 | 86,802 | |||||||||||
Securities owned, at fair value | 496,283 | 152,227 | 86,883 | 735,393 | |||||||||||
Investments (1) | — | — | 8,263 | 8,263 | |||||||||||
Loans held for sale | — | 60,234 | — | 60,234 | |||||||||||
Securities purchased under agreements to resell (2) | — | 206,499 | — | 206,499 | |||||||||||
Derivative contracts: | |||||||||||||||
TBAs | — | 6,448 | — | 6,448 | |||||||||||
Interest rate lock commitments | — | — | 9,161 | 9,161 | |||||||||||
Derivative contracts, total | — | 6,448 | 9,161 | 15,609 | |||||||||||
Total | $ | 540,739 | $ | 425,408 | $ | 104,307 | $ | 1,070,454 | |||||||
Liabilities | |||||||||||||||
Securities sold, but not yet purchased: | |||||||||||||||
U.S. Treasury securities | $ | 75,653 | $ | — | $ | — | $ | 75,653 | |||||||
U.S. Agency securities | — | 15 | — | 15 | |||||||||||
Sovereign obligations | — | 1,817 | — | 1,817 | |||||||||||
Corporate debt and other obligations | — | 1,652 | — | 1,652 | |||||||||||
Mortgage and other asset-backed securities | — | 27 | — | 27 | |||||||||||
Convertible bonds | 5,951 | — | 5,951 | ||||||||||||
Corporate equities | 41,378 | — | — | 41,378 | |||||||||||
Securities sold, but not yet purchased at fair value | 117,031 | 9,462 | — | 126,493 | |||||||||||
Derivative contracts: | |||||||||||||||
Futures | 249 | — | — | 249 | |||||||||||
Foreign currency forward contracts | 2 | — | — | 2 | |||||||||||
TBAs | — | 11,619 | — | 11,619 | |||||||||||
Interest rate lock commitments | — | — | 923 | 923 | |||||||||||
ARS purchase commitments | — | — | 1,369 | 1,369 | |||||||||||
Derivative contracts, total | 251 | 11,619 | 2,292 | 14,162 | |||||||||||
Total | $ | 117,282 | $ | 21,081 | $ | 2,292 | $ | 140,655 | |||||||
(1) | Included in other assets on the consolidated balance sheet. |
(2) | Included in securities purchased under agreements to resell where the Company has elected fair value option treatment. |
81
OPPENHEIMER HOLDINGS INC. Notes to Consolidated Financial Statements | ||
Assets and liabilities measured at fair value on a recurring basis as of December 31, 2014
(Expressed in thousands) | |||||||||||||||
Fair Value Measurements at December 31, 2014 | |||||||||||||||
Level 1 | Level 2 | Level 3 | Total | ||||||||||||
Assets | |||||||||||||||
Cash equivalents | $ | 31,175 | $ | — | $ | — | $ | 31,175 | |||||||
Deposits with clearing organizations | 24,188 | — | — | 24,188 | |||||||||||
Securities owned: | |||||||||||||||
U.S. Treasury securities | 540,223 | — | — | 540,223 | |||||||||||
U.S. Agency securities | — | 26,261 | — | 26,261 | |||||||||||
Sovereign obligations | — | 4,123 | — | 4,123 | |||||||||||
Corporate debt and other obligations | — | 19,795 | — | 19,795 | |||||||||||
Mortgage and other asset-backed securities | — | 6,689 | — | 6,689 | |||||||||||
Municipal obligations | — | 60,669 | 164 | 60,833 | |||||||||||
Convertible bonds | — | 49,813 | — | 49,813 | |||||||||||
Corporate equities | 42,751 | — | — | 42,751 | |||||||||||
Money markets | 1,245 | — | — | 1,245 | |||||||||||
Auction rate securities | — | — | 91,422 | 91,422 | |||||||||||
Securities owned, at fair value | 584,219 | 167,350 | 91,586 | 843,155 | |||||||||||
Investments (1) | — | — | 9,508 | 9,508 | |||||||||||
Loans held for sale | — | 19,243 | — | 19,243 | |||||||||||
Securities purchased under agreements to resell (2) | — | 250,000 | — | 250,000 | |||||||||||
Derivative contracts: | |||||||||||||||
TBAs | — | 4,535 | — | 4,535 | |||||||||||
Interest lock commitments | — | — | 7,576 | 7,576 | |||||||||||
Derivative contracts, total | — | 4,535 | 7,576 | 12,111 | |||||||||||
Total | $ | 639,582 | $ | 441,128 | $ | 108,670 | $ | 1,189,380 | |||||||
Liabilities | |||||||||||||||
Securities sold, but not yet purchased: | |||||||||||||||
U.S. Treasury securities | $ | 30,581 | $ | — | $ | — | $ | 30,581 | |||||||
U.S. Agency securities | — | 34 | — | 34 | |||||||||||
Corporate debt and other obligations | — | 2,646 | — | 2,646 | |||||||||||
Mortgage and other asset-backed securities | — | 255 | — | 255 | |||||||||||
Municipal obligations | — | 51 | — | 51 | |||||||||||
Convertible bonds | — | 11,369 | — | 11,369 | |||||||||||
Corporate equities | 47,574 | — | — | 47,574 | |||||||||||
Securities sold, but not yet purchased at fair value | 78,155 | 14,355 | — | 92,510 | |||||||||||
Derivative contracts: | |||||||||||||||
Futures | 353 | — | — | 353 | |||||||||||
Foreign currency forward contracts | 10 | — | — | 10 | |||||||||||
TBAs | — | 1,018 | — | 1,018 | |||||||||||
Interest rate lock commitments | — | — | 1,222 | 1,222 | |||||||||||
ARS purchase commitments | — | — | 902 | 902 | |||||||||||
Derivative contracts, total | 363 | 1,018 | 2,124 | 3,505 | |||||||||||
Total | $ | 78,518 | $ | 15,373 | $ | 2,124 | $ | 96,015 | |||||||
(1) | Included in other assets on the consolidated balance sheet. |
(2) | Included in securities purchased under agreements to resell where the Company has elected fair value option treatment. |
82
OPPENHEIMER HOLDINGS INC. Notes to Consolidated Financial Statements | ||
There were no transfers between any of the levels in the years ended December 31, 2015 and 2014.
The following tables present changes in Level 3 assets and liabilities measured at fair value on a recurring basis for the years ended December 31, 2015 and 2014:
(Expressed in thousands) | |||||||||||||||||||||||
Level 3 Assets and Liabilities | |||||||||||||||||||||||
For the Year Ended December 31, 2015 | |||||||||||||||||||||||
Beginning Balance | Total Realized and Unrealized Gains (Losses) (5)(6) | Purchases and Issuances | Sales and Settlements | Transfers In (Out) | Ending Balance | ||||||||||||||||||
Assets | |||||||||||||||||||||||
Municipals | $ | 164 | $ | (63 | ) | $ | — | $ | (20 | ) | $ | — | $ | 81 | |||||||||
Auction rate securities (1)(7)(8) | 91,422 | 1,955 | 17,950 | (24,525 | ) | — | 86,802 | ||||||||||||||||
Interest rate lock commitments (2) | 7,576 | 1,585 | — | — | — | 9,161 | |||||||||||||||||
Investments (3) | 9,508 | (944 | ) | 437 | (738 | ) | — | 8,263 | |||||||||||||||
Liabilities | |||||||||||||||||||||||
Interest rate lock commitments (2) | 1,222 | 299 | — | — | — | 923 | |||||||||||||||||
ARS purchase commitments (4) | 902 | (467 | ) | — | — | — | 1,369 | ||||||||||||||||
(1) | Represents auction rate preferred securities, municipal auction rate securities and student loan auction rate securities that failed in the auction rate market. |
(2) | Interest rate lock commitment assets and liabilities are recorded upon the commitment to originate a loan with a borrower and sell the loan to an investor. The commitment assets and liabilities are recognized at fair value, which reflects the fair value of the contractual loan origination related fees and sale premiums, net of co-broker fees, and the estimated fair value of the expected net future cash flows associated with the servicing of the loan. |
(3) | Primarily represents general partner ownership and limited partner interests in hedge funds and private equity funds sponsored by the Company. |
(4) | Represents the difference in principal and fair value for auction rate securities purchase commitments outstanding at the end of the year. |
(5) | Included in principal transactions on the consolidated statement of income, except for investments which are included in other income on the consolidated statement of income. |
(6) | Unrealized gains (losses) are attributable to assets or liabilities that are still held at the reporting date. |
(7) | Purchases and issuances in connection with ARS purchase commitments represent instances in which the Company purchased ARS securities from clients during the period pursuant to regulatory and legal settlements and awards that satisfy the outstanding commitment to purchase obligation. This also includes instances where the ARS issuer has redeemed ARS where the Company had an outstanding purchase commitment prior to the Company purchasing those ARS. |
(8) | Sales and settlements for the ARS purchase commitments represent additional purchase commitments made during the year for regulatory and legal ARS settlements and awards. |
83
OPPENHEIMER HOLDINGS INC. Notes to Consolidated Financial Statements | ||
(Expressed in thousands) | |||||||||||||||||||||||
Level 3 Assets and Liabilities | |||||||||||||||||||||||
For the Year Ended December 31, 2014 | |||||||||||||||||||||||
Beginning Balance | Total Realized and Unrealized Gains (Losses) (5)(6) | Purchases and Issuances | Sales and Settlements | Transfers In (Out) | Ending Balance | ||||||||||||||||||
Assets | |||||||||||||||||||||||
Municipals | $ | 236 | $ | (72 | ) | $ | — | $ | — | $ | — | $ | 164 | ||||||||||
Auction rate securities (1)(7)(8) | 85,124 | (622 | ) | 20,625 | (13,705 | ) | — | 91,422 | |||||||||||||||
Interest rate lock commitments (2) | 2,375 | 5,201 | — | — | — | 7,576 | |||||||||||||||||
Investments (3) | 5,946 | 101 | 5,178 | (1,717 | ) | — | 9,508 | ||||||||||||||||
Liabilities | |||||||||||||||||||||||
Interest rate lock commitments (2) | 3,653 | 2,431 | — | — | — | 1,222 | |||||||||||||||||
ARS purchase commitments (4) | 2,600 | 1,698 | — | — | — | 902 | |||||||||||||||||
(1) | Represents auction rate preferred securities, municipal auction rate securities and student loan auction rate securities that failed in the auction rate market. |
(2) | Interest rate lock commitment assets and liabilities are recorded upon the commitment to originate a loan with a borrower and sell the loan to an investor. The commitment assets and liabilities are recognized at fair value, which reflects the fair value of the contractual loan origination related fees and sale premiums, net of co-broker fees, and the estimated fair value of the expected net future cash flows associated with the servicing of the loan. |
(3) | Primarily represents general partner ownership and limited partner interests in hedge funds and private equity funds sponsored by the Company. |
(4) | Represents the difference in principal and fair value for auction rate securities purchase commitments outstanding at the end of the year. |
(5) | Included in principal transactions on the consolidated statement of income, except for investments which are included in other income on the consolidated statement of income. |
(6) | Unrealized gains (losses) are attributable to assets or liabilities that are still held at the reporting date. |
(7) | Purchases and issuances in connection with ARS purchase commitments represent instances in which the Company purchased ARS securities from clients during the period pursuant to regulatory and legal settlements and awards that satisfy the outstanding commitment to purchase obligation. This also includes instances where the ARS issuer has redeemed ARS where the Company had an outstanding purchase commitment prior to the Company purchasing those ARS. |
(8) | Sales and settlements for the ARS purchase commitments represent additional purchase commitments made during the year for regulatory and legal ARS settlements and awards. |
Financial Instruments Not Measured at Fair Value
The table below presents the carrying value, fair value and fair value hierarchy category of certain financial instruments that are not measured at fair value in the consolidated balance sheets. The table below excludes non-financial assets and liabilities (e.g., office facilities and accrued compensation).
The carrying value of financial instruments not measured at fair value categorized in the fair value hierarchy as Level 1 or Level 2 (e.g., cash and receivables from customers) approximates fair value because of the relatively short period of time between their origination and expected maturity or settlement. The fair value of the Company's 8.75% Senior Secured Notes, categorized in Level 2 of the fair value hierarchy, is based on quoted prices from the market in which the Notes trade.
The fair value of MSRs is based on observable and unobservable inputs and thus categorized as Level 3 in the fair value hierarchy. See valuation techniques above for key assumptions used.
84
OPPENHEIMER HOLDINGS INC. Notes to Consolidated Financial Statements | ||
Assets and liabilities not measured at fair value as of December 31, 2015
(Expressed in thousands) | Fair Value Measurement: Assets | ||||||||||||||||||||||
As of December 31, 2015 | As of December 31, 2015 | ||||||||||||||||||||||
Carrying Value | Fair Value | Level 1 | Level 2 | Level 3 | Total | ||||||||||||||||||
Cash | $ | 50,364 | $ | 50,364 | $ | 50,364 | $ | — | $ | — | $ | 50,364 | |||||||||||
Deposits with clearing organization | 18,034 | 18,034 | 18,034 | — | — | 18,034 | |||||||||||||||||
Receivable from brokers, dealers and clearing organizations: | |||||||||||||||||||||||
Securities borrowed | 224,672 | 224,672 | — | 224,672 | — | 224,672 | |||||||||||||||||
Receivables from brokers | 49,458 | 49,458 | — | 49,458 | — | 49,458 | |||||||||||||||||
Securities failed to deliver | 7,799 | 7,799 | — | 7,799 | — | 7,799 | |||||||||||||||||
Clearing organizations | 25,030 | 25,030 | — | 25,030 | — | 25,030 | |||||||||||||||||
Other | 53,954 | 53,954 | — | 53,954 | — | 53,954 | |||||||||||||||||
360,913 | 360,913 | — | 360,913 | — | 360,913 | ||||||||||||||||||
Receivable from customers | 840,355 | 840,355 | — | 840,355 | — | 840,355 | |||||||||||||||||
Mortgage servicing rights | 28,168 | 41,838 | — | — | 41,838 | 41,838 | |||||||||||||||||
Investments (1) | 53,286 | 53,286 | — | 53,286 | — | 53,286 | |||||||||||||||||
(1) | Included in other assets on the consolidated balance sheet. |
(Expressed in thousands) | Fair Value Measurement: Liabilities | ||||||||||||||||||||||
As of December 31, 2015 | As of December 31, 2015 | ||||||||||||||||||||||
Carrying Value | Fair Value | Level 1 | Level 2 | Level 3 | Total | ||||||||||||||||||
Drafts payable | $ | 48,011 | $ | 48,011 | $ | 48,011 | $ | — | $ | — | $ | 48,011 | |||||||||||
Bank call loans | 100,200 | 100,200 | — | 100,200 | — | 100,200 | |||||||||||||||||
Payables to brokers, dealers and clearing organizations: | |||||||||||||||||||||||
Securities loaned | 130,658 | 130,658 | — | 130,658 | — | 130,658 | |||||||||||||||||
Payable to brokers | 3,316 | 3,316 | — | 3,316 | — | 3,316 | |||||||||||||||||
Securities failed to receive | 21,513 | 21,513 | — | 21,513 | — | 21,513 | |||||||||||||||||
Other | 9,059 | 9,059 | — | 9,059 | — | 9,059 | |||||||||||||||||
164,546 | 164,546 | — | 164,546 | — | 164,546 | ||||||||||||||||||
Payables to customers | 594,833 | 594,833 | — | 594,833 | — | 594,833 | |||||||||||||||||
Securities sold under agreements to repurchase | 651,445 | 651,445 | — | 651,445 | — | 651,445 | |||||||||||||||||
Warehouse payable | 54,341 | 54,341 | — | 54,341 | — | 54,341 | |||||||||||||||||
Senior secured notes | 150,000 | 154,568 | — | 154,568 | — | 154,568 | |||||||||||||||||
85
OPPENHEIMER HOLDINGS INC. Notes to Consolidated Financial Statements | ||
Assets and liabilities not measured at fair value as of December 31, 2014
(Expressed in thousands) | Fair Value Measurement: Assets | ||||||||||||||||||||||
As of December 31, 2014 | As of December 31, 2014 | ||||||||||||||||||||||
Carrying Value | Fair Value | Level 1 | Level 2 | Level 3 | Total | ||||||||||||||||||
Cash | $ | 32,632 | $ | 32,632 | $ | 32,632 | $ | — | $ | — | $ | 32,632 | |||||||||||
Cash segregated for regulatory and other purposes | 18,594 | 18,594 | 18,594 | — | — | 18,594 | |||||||||||||||||
Deposits with clearing organization | 12,322 | 12,322 | 12,322 | — | — | 12,322 | |||||||||||||||||
Receivable from brokers, dealers and clearing organizations: | |||||||||||||||||||||||
Securities borrowed | 242,172 | 242,172 | — | 242,172 | — | 242,172 | |||||||||||||||||
Receivables from brokers | 38,149 | 38,149 | — | 38,149 | — | 38,149 | |||||||||||||||||
Securities failed to deliver | 11,055 | 11,055 | — | 11,055 | — | 11,055 | |||||||||||||||||
Clearing organizations | 21,106 | 21,106 | — | 21,106 | — | 21,106 | |||||||||||||||||
Other | 1,993 | 1,993 | — | 1,993 | — | 1,993 | |||||||||||||||||
314,475 | 314,475 | — | 314,475 | — | 314,475 | ||||||||||||||||||
Receivable from customers | 864,189 | 864,189 | — | 864,189 | — | 864,189 | |||||||||||||||||
Securities purchased under agreements to resell | 1,606 | 1,606 | 1,606 | — | — | 1,606 | |||||||||||||||||
Mortgage servicing rights | 30,140 | 42,279 | — | — | 42,279 | 42,279 | |||||||||||||||||
Investments (1) | 51,246 | 51,246 | — | 51,246 | — | 51,246 | |||||||||||||||||
(1) | Included in other assets on the consolidated balance sheet. |
(Expressed in thousands) | Fair Value Measurement: Liabilities | ||||||||||||||||||||||
As of December 31, 2014 | As of December 31, 2014 | ||||||||||||||||||||||
Carrying Value | Fair Value | Level 1 | Level 2 | Level 3 | Total | ||||||||||||||||||
Drafts payable | $ | 35,373 | $ | 35,373 | $ | 35,373 | $ | — | $ | — | $ | 35,373 | |||||||||||
Bank call loans | 59,400 | 59,400 | — | 59,400 | — | 59,400 | |||||||||||||||||
Payables to brokers, dealers and clearing organizations: | |||||||||||||||||||||||
Securities loaned | 137,892 | 137,892 | — | 137,892 | — | 137,892 | |||||||||||||||||
Payable to brokers | 4,559 | 4,559 | — | 4,559 | — | 4,559 | |||||||||||||||||
Securities failed to receive | 23,573 | 23,573 | — | 23,573 | — | 23,573 | |||||||||||||||||
Other | 91,137 | 91,137 | — | 91,137 | — | 91,137 | |||||||||||||||||
257,161 | 257,161 | — | 257,161 | — | 257,161 | ||||||||||||||||||
Payables to customers | 652,256 | 652,256 | — | 652,256 | — | 652,256 | |||||||||||||||||
Securities sold under agreements to repurchase | 687,440 | 687,440 | — | 687,440 | — | 687,440 | |||||||||||||||||
Warehouse payable | 16,683 | 16,683 | — | 16,683 | — | 16,683 | |||||||||||||||||
Senior secured notes | 150,000 | 157,782 | — | 157,782 | — | 157,782 | |||||||||||||||||
86
OPPENHEIMER HOLDINGS INC. Notes to Consolidated Financial Statements | ||
Fair Value Option
The Company has elected to apply the fair value option to its loan trading portfolio which resides in OPY Credit Corp. and is included in other assets on the consolidated balance sheet. Management has elected this treatment as it is consistent with the manner in which the loan trading portfolio is managed as well as the way that financial instruments in other parts of the business are recorded. There were no loan positions held in the secondary loan trading portfolio at December 31, 2015 or 2014.
The Company elected the fair value option for repurchase agreements and reverse repurchase agreements that do not settle overnight or have an open settlement date. The Company has elected the fair value option for these instruments to more accurately reflect market and economic events in its earnings and to mitigate a potential mismatch in earnings caused by using different measurement attributes (i.e. fair value versus carrying value) for certain assets and liabilities. At December 31, 2015, the fair value of the reverse repurchase agreements and repurchase agreements for which the fair value option was elected were $206.5 million and $nil, respectively.
On October 1, 2013, the Company also elected the fair value option for loans held for sale which reside in OMHHF and are reported on the consolidated balance sheet. Loans held for sale represent originated loans that are generally transferred or sold within 60 days from the date that a mortgage loan is funded. Electing to use fair value allows a better offset of the change in fair value of the loan and the change in fair value of the derivative instruments used as economic hedges. During the period prior to its sale, interest income on a loan held for sale is calculated in accordance with the terms of the individual loan. At December 31, 2015, the Company did not carry any loans held for sale for a period longer than 90 days. At December 31, 2015, the book value and fair value of loans held for sale was $55.3 million and $60.2 million, respectively.
Derivative Instruments and Hedging Activities
The Company transacts, on a limited basis, in exchange traded and over-the-counter derivatives for both asset and liability management as well as for trading and investment purposes. Risks managed using derivative instruments include interest rate risk and, to a lesser extent, foreign exchange risk. All derivative instruments are measured at fair value and are recognized as either assets or liabilities on the consolidated balance sheet.
Cash flow hedges used for asset and liability management
For derivative instruments that were designated and qualify as a cash flow hedge, the effective portion of the gain or loss on the derivative was reported as a component of other comprehensive income and reclassified into earnings in the same period or periods during which the hedged transaction affects earnings. Gains or losses on the derivative representing either hedge ineffectiveness or hedge components excluded from the assessment of effectiveness are recognized in current earnings. For the years ended December 31, 2015 and 2014, there were no derivative instruments that were designated and qualified as a cash flow hedge.
Foreign exchange hedges
From time to time, the Company also utilizes forward and options contracts to hedge the foreign currency risk associated with compensation obligations to Oppenheimer Israel (OPCO) Ltd. employees denominated in New Israeli Shekel. Such hedges have not been designated as accounting hedges. Unrealized gains and losses on foreign exchange forward contracts are recorded in other assets in the consolidated balance sheet and other income in the consolidated statement of income.
Derivatives used for trading and investment purposes
Futures contracts represent commitments to purchase or sell securities or other commodities at a future date and at a specified price. Market risk exists with respect to these instruments. Notional or contractual amounts are used to express the volume of these transactions and do not represent the amounts potentially subject to market risk. The futures contracts the Company used include U.S. Treasury notes, Federal Funds, General collateral futures and Eurodollar contracts are used primarily as an economic hedge of interest rate risk associated with government trading activities. Unrealized gains and losses on futures contracts are recorded in the consolidated balance sheet in payable to brokers, dealers and clearing organizations and in the consolidated statement of income as principal transactions revenue, net.
87
OPPENHEIMER HOLDINGS INC. Notes to Consolidated Financial Statements | ||
Derivatives used for commercial mortgage banking
In the normal course of business, OMHHF enters into contractual commitments to originate (purchase) and sell multifamily mortgage loans at fixed prices with fixed expiration dates. The commitments become effective when the borrowers "lock-in" a specified interest rate within time frames established by OMHHF. All mortgagors are evaluated for credit worthiness prior to the extension of the commitment. Market risk arises if interest rates move adversely between the time of the "lock-in" of rates by the borrower and the sale date of the loan to an investor. To mitigate the effect of the interest rate risk inherent in providing rate lock commitments to borrowers, OMHHF's policy is to enter into a TBA sale contract with the investor simultaneously with the rate lock commitment with the borrower. The TBA sale contract with the investor locks in an interest rate and price for the sale of the loan. The terms of the contract with the investor and the rate lock with the borrower are matched in substantially all respects, with the objective of eliminating interest rate risk to the extent practical. TBA sale contracts with the investors have an expiration date that is longer than our related commitments to the borrower to allow, among other things, for the closing of the loan and processing of paperwork to deliver the loan into the sale commitment.
Both the rate lock commitments to borrowers and the TBA sale contracts to buyers are undesignated derivatives and, accordingly, are marked to fair value through earnings. Unrealized gains and losses on rate lock commitments are recorded in other assets in the consolidated balance sheet and other income in the consolidated statement of income. The fair value of the Company's rate lock commitments to borrowers and loans held for sale and the related input levels includes, as applicable:
• | the assumed gain/loss of the expected resultant loan sale to the buyer; |
• | the expected net future cash flows associated with servicing the loan; |
• | the effects of interest rate movements between the date of the rate lock and the balance sheet date; and |
• | the nonperformance risk of both the counterparty and the Company. |
The fair value of the Company's TBA sale contracts to investors considers effects of interest rate movements between the trade date and the balance sheet date. The market price changes are multiplied by the notional amount of the TBA sale contracts to measure the fair value.
The assumed gain/loss considers the amount that the Company has discounted the price to the borrower from par for competitive reasons, if at all, and the expected net cash flows from servicing to be received upon securitization of the loan. The fair value of the expected net future cash flows associated with servicing the loan is calculated pursuant to the valuation techniques described previously for MSRs.
To calculate the effects of interest rate movements, the Company uses applicable published U.S. Treasury prices, and multiplies the price movement between the rate lock date and the balance sheet date by the notional loan commitment amount.
The fair value of the Company's TBA sale contracts to investors considers the market price movement of the same type of security between the trade date and the balance sheet date. The market price changes are multiplied by the notional amount of the TBA sale contracts to measure the fair value.
The fair value of the Company's interest rate lock commitments and TBA sale contracts is adjusted to reflect the risk that the agreement will not be fulfilled. The Company's exposure to nonperformance in rate lock and TBA sale contracts is represented by the contractual amount of those instruments. Given the credit quality of our counterparties, the short duration of interest rate lock commitments and TBA sale contracts, and the Company's historical experience with the agreements, the risk of nonperformance by the Company's counterparties is not significant.
TBA Securities
The Company also transacts in pass-through mortgage-backed securities eligible to be sold in the TBA market as economic hedges against mortgage-backed securities that it owns or has sold but not yet purchased. TBAs provide for the forward or delayed delivery of the underlying instrument with settlement up to 180 days. The contractual or notional amounts related to these financial instruments reflect the volume of activity and do not reflect the amounts at risk. Unrealized gains and losses on TBAs are recorded in the consolidated balance sheet in receivable from brokers, dealers and clearing organizations and payable to brokers, dealers and clearing organizations, respectively, and in the consolidated statement of income as principal transactions revenue, net.
88
OPPENHEIMER HOLDINGS INC. Notes to Consolidated Financial Statements | ||
The notional amounts and fair values of the Company's derivatives at December 31, 2015 and 2014 by product were as follows:
(Expressed in thousands) | |||||||||
Fair Value of Derivative Instruments at December 31, 2015 | |||||||||
Description | Notional | Fair Value | |||||||
Assets: | |||||||||
Derivatives not designated as hedging instruments (1) | |||||||||
Other contracts | TBAs | $ | 35,650 | $ | 4 | ||||
TBA sale contracts | 83,810 | 6,444 | |||||||
Interest rate lock commitments | 203,648 | 9,161 | |||||||
$ | 323,108 | $ | 15,609 | ||||||
Liabilities: | |||||||||
Derivatives not designated as hedging instruments (1) | |||||||||
Commodity contracts | Futures | $ | 2,943,000 | $ | 249 | ||||
Other contracts | Foreign exchange forward contracts | 400 | 2 | ||||||
TBAs | 24,350 | 5 | |||||||
TBA sale contracts | 223,846 | 11,614 | |||||||
Interest rate lock commitments | 48,638 | 923 | |||||||
ARS purchase commitments | 27,813 | 1,369 | |||||||
$ | 3,268,047 | $ | 14,162 | ||||||
(1) | See "Derivative Instruments and Hedging Activities" above for description of derivative financial instruments. Such derivative instruments are not subject to master netting agreements, thus the related amounts are not offset. |
(Expressed in thousands) | |||||||||
Fair Value of Derivative Instruments at December 31, 2014 | |||||||||
Description | Notional | Fair Value | |||||||
Assets: | |||||||||
Derivatives not designated as hedging instruments (1) | |||||||||
Other contracts | TBAs | $ | 105,185 | $ | 1,026 | ||||
TBA sale contracts | 188,178 | 3,509 | |||||||
Interest rate lock commitments | 147,521 | 7,576 | |||||||
$ | 440,884 | $ | 12,111 | ||||||
Liabilities: | |||||||||
Derivatives not designated as hedging instruments (1) | |||||||||
Commodity contracts | Futures | $ | 3,835,600 | $ | 353 | ||||
Other contracts | Foreign exchange forward contracts | 400 | 10 | ||||||
TBAs | 105,186 | 1,018 | |||||||
Interest rate lock commitments | 22,269 | 1,222 | |||||||
Forward start repurchase agreements | 636,000 | — | |||||||
ARS purchase commitments | 12,249 | 902 | |||||||
$ | 4,611,704 | $ | 3,505 | ||||||
(1) | See "Derivative Instruments and Hedging Activities" above for description of derivative financial instruments. Such derivative instruments are not subject to master netting agreements, thus the related amounts are not offset. |
89
OPPENHEIMER HOLDINGS INC. Notes to Consolidated Financial Statements | ||
The following table presents the location and fair value amounts of the Company's derivative instruments and their effect on the consolidated statement of income for the years ended December 31, 2015 and 2014:
(Expressed in thousands) | |||||||
The Effect of Derivative Instruments on the Statement of Income | |||||||
For the Year Ended December 31, 2015 | |||||||
Recognized in Income on Derivatives (pre-tax) | |||||||
Types | Description | Location | Gain (Loss) | ||||
Commodity contracts | Futures | Principal transactions revenue | $ | (1,472 | ) | ||
Other contracts | Foreign exchange forward contracts | Other revenue | 25 | ||||
TBAs | Principal transactions revenue | (9 | ) | ||||
TBA sale contracts | Other revenue | 440 | |||||
Interest rate lock commitments | Other revenue | 1,884 | |||||
ARS purchase commitments | Principal transactions revenue | (467 | ) | ||||
$ | 401 | ||||||
(Expressed in thousands) | |||||||
The Effect of Derivative Instruments on the Statement of Income | |||||||
For the Year Ended December 31, 2014 | |||||||
Recognized in Income on Derivatives (pre-tax) | |||||||
Types | Description | Location | Gain (Loss) | ||||
Commodity contracts | Futures | Principal transactions revenue | $ | (2,109 | ) | ||
Other contracts | Foreign exchange forward contracts | Other revenue | 10 | ||||
TBAs | Principal transactions revenue | (17 | ) | ||||
TBA sale contracts | Other revenue | (5,530 | ) | ||||
Interest rate lock commitments | Other revenue | 7,632 | |||||
ARS purchase commitments | Principal transactions revenue | 1,698 | |||||
$ | 1,684 | ||||||
90
OPPENHEIMER HOLDINGS INC. Notes to Consolidated Financial Statements | ||
6. Collateralized transactions
The Company enters into collateralized borrowing and lending transactions in order to meet customers' needs and earn residual interest rate spreads, obtain securities for settlement and finance trading inventory positions. Under these transactions, the Company either receives or provides collateral, including U.S. government and agency, asset-backed, corporate debt, equity, and non-U.S. government and agency securities.
The Company obtains short-term borrowings primarily through bank call loans. Bank call loans are generally payable on demand and bear interest at various rates but not exceeding the broker call rate. At December 31, 2015, bank call loans were $100.2 million ($59.4 million at December 31, 2014). At December 31, 2015, such loans were collateralized by firm and customer securities with market values of approximately $142.0 million and $327.4 million, respectively, with commercial banks.
At December 31, 2015, the Company had approximately $1.4 billion of customer securities under customer margin loans that are available to be pledged, of which the Company has re-pledged approximately $88.5 million under securities loan agreements.
At December 31, 2015, the Company had pledged $416.0 million of customer securities directly with the Options Clearing Corporation to secure obligations and margin requirements under option contracts written by customers.
At December 31, 2015, the Company had no outstanding letters of credit.
The Company enters into reverse repurchase agreements, repurchase agreements, securities borrowed and securities loaned transactions to, among other things, acquire securities to cover short positions and settle other securities obligations, to accommodate customers' needs and to finance the Company's inventory positions. Except as described below, repurchase and reverse repurchase agreements, principally involving government and agency securities, are carried at amounts at which the securities subsequently will be resold or reacquired as specified in the respective agreements and include accrued interest. Repurchase and reverse repurchase agreements are presented on a net-by-counterparty basis, when the repurchase and reverse repurchase agreements are executed with the same counterparty, have the same explicit settlement date, are executed in accordance with a master netting arrangement, the securities underlying the repurchase and reverse repurchase agreements exist in "book entry" form and certain other requirements are met.
The following table presents a disaggregation of the gross obligation by the class of collateral pledged and the remaining contractual maturity of the repurchase agreements and securities loaned transactions as of December 31, 2015:
(Expressed in thousands) | |||||||||||
Overnight and Open | Up to 30 Days | Total | |||||||||
Repurchase agreements: | |||||||||||
U.S. Treasury and Agency securities | $ | 726,988 | $ | — | $ | 726,988 | |||||
Securities loaned: | |||||||||||
Equity securities | 130,658 | — | 130,658 | ||||||||
Gross amount of recognized liabilities for repurchase agreements and securities loaned | $ | 857,646 | $ | — | $ | 857,646 | |||||
91
OPPENHEIMER HOLDINGS INC. Notes to Consolidated Financial Statements | ||
The following tables present the gross amounts and the offsetting amounts of reverse repurchase agreements, repurchase agreements, securities borrowed and securities loaned transactions as of December 31, 2015 and 2014:
As of December 31, 2015 | |||||||||||||||||||||||
(Expressed in thousands) | |||||||||||||||||||||||
Gross Amounts Not Offset on the Balance Sheet | |||||||||||||||||||||||
Gross Amounts of Recognized Assets | Gross Amounts Offset on the Balance Sheet | Net Amounts of Assets Presented on the Balance Sheet | Financial Instruments | Cash Collateral Received | Net Amount | ||||||||||||||||||
Reverse repurchase agreements | $ | 282,042 | $ | (75,543 | ) | $ | 206,499 | $ | (203,266 | ) | $ | — | $ | 3,233 | |||||||||
Securities borrowed (1) | 224,672 | — | 224,672 | (219,099 | ) | — | 5,573 | ||||||||||||||||
Total | $ | 506,714 | $ | (75,543 | ) | $ | 431,171 | $ | (422,365 | ) | $ | — | $ | 8,806 | |||||||||
(1) | Included in receivable from brokers, dealers and clearing organizations on the consolidated balance sheet. |
Gross Amounts Not Offset on the Balance Sheet | |||||||||||||||||||||||
Gross Amounts of Recognized Liabilities | Gross Amounts Offset on the Balance Sheet | Net Amounts of Liabilities Presented on the Balance Sheet | Financial Instruments | Cash Collateral Pledged | Net Amount | ||||||||||||||||||
Repurchase agreements | $ | 726,988 | $ | (75,543 | ) | $ | 651,445 | $ | (645,498 | ) | $ | — | $ | 5,947 | |||||||||
Securities loaned (2) | 130,658 | — | 130,658 | (122,650 | ) | — | 8,008 | ||||||||||||||||
Total | $ | 857,646 | $ | (75,543 | ) | $ | 782,103 | $ | (768,148 | ) | $ | — | $ | 13,955 | |||||||||
(2) | Included in payable to brokers, dealers and clearing organizations on the consolidated balance sheet. |
As of December 31, 2014 | |||||||||||||||||||||||
(Expressed in thousands) | |||||||||||||||||||||||
Gross Amounts Not Offset on the Balance Sheet | |||||||||||||||||||||||
Gross Amounts of Recognized Assets | Gross Amounts Offset on the Balance Sheet | Net Amounts of Assets Presented on the Balance Sheet | Financial Instruments | Cash Collateral Received | Net Amount | ||||||||||||||||||
Reverse repurchase agreements | $ | 314,266 | $ | (62,660 | ) | $ | 251,606 | $ | (250,000 | ) | $ | — | $ | 1,606 | |||||||||
Securities borrowed (1) | 242,172 | — | 242,172 | (234,376 | ) | — | 7,796 | ||||||||||||||||
Total | $ | 556,438 | $ | (62,660 | ) | $ | 493,778 | $ | (484,376 | ) | $ | — | $ | 9,402 | |||||||||
(1) | Included in receivable from brokers, dealers and clearing organizations on the consolidated balance sheet. |
Gross Amounts Not Offset on the Balance Sheet | |||||||||||||||||||||||
Gross Amounts of Recognized Liabilities | Gross Amounts Offset on the Balance Sheet | Net Amounts of Liabilities Presented on the Balance Sheet | Financial Instruments | Cash Collateral Pledged | Net Amount | ||||||||||||||||||
Repurchase agreements | $ | 750,100 | $ | (62,660 | ) | $ | 687,440 | $ | (686,119 | ) | $ | — | $ | 1,321 | |||||||||
Securities loaned (2) | 137,892 | — | 137,892 | (132,258 | ) | — | 5,634 | ||||||||||||||||
Total | $ | 887,992 | $ | (62,660 | ) | $ | 825,332 | $ | (818,377 | ) | $ | — | $ | 6,955 | |||||||||
(2) | Included in payable to brokers, dealers and clearing organizations on the consolidated balance sheet. |
92
OPPENHEIMER HOLDINGS INC. Notes to Consolidated Financial Statements | ||
Certain of the Company's repurchase agreements and reverse repurchase agreements are carried at fair value as a result of the Company's fair value option election. The Company elected the fair value option for those repurchase agreements and reverse repurchase agreements that do not settle overnight or have an open settlement date. The Company has elected the fair value option for these instruments to more accurately reflect market and economic events in its earnings and to mitigate a potential imbalance in earnings caused by using different measurement attributes (i.e. fair value versus carrying value) for certain assets and liabilities. At December 31, 2015, the fair value of the reverse repurchase agreements and repurchase agreements for which the fair value option was elected were $206.5 million and $nil, respectively.
The Company receives collateral in connection with securities borrowed and reverse repurchase agreement transactions and customer margin loans. Under many agreements, the Company is permitted to sell or re-pledge the securities received (e.g., use the securities to enter into securities lending transactions, or deliver to counterparties to cover short positions). At December 31, 2015, the fair value of securities received as collateral under securities borrowed transactions and reverse repurchase agreements was $217.0 million ($235.1 million at December 31, 2014) and $278.8 million ($314.1 million at December 31, 2014), respectively, of which the Company has sold and re-pledged approximately $36.0 million ($4.4 million at December 31, 2014) under securities loaned transactions and $278.8 million under repurchase agreements ($312.6 million at December 31, 2014).
The Company pledges certain of its securities owned for securities lending and repurchase agreements and to collateralize bank call loan transactions. The carrying value of pledged securities owned that can be sold or re-pledged by the counterparty was $546.3 million, as presented on the face of the consolidated balance sheet at December 31, 2015 ($518.1 million at December 31, 2014). The carrying value of securities owned by the Company that have been loaned or pledged to counterparties where those counterparties do not have the right to sell or re-pledge the collateral was $142.7 million at December 31, 2015 ($149.1 million at December 31, 2014).
The Company manages credit exposure arising from repurchase and reverse repurchase agreements by, in appropriate circumstances, entering into master netting agreements and collateral arrangements with counterparties that provide the Company, in the event of a customer default, the right to liquidate and the right to offset a counterparty's rights and obligations. The Company manages market risk of repurchase agreements and securities loaned by monitoring the market value of collateral held and the market value of securities receivable from others. It is the Company's policy to request and obtain additional collateral when exposure to loss exists. In the event the counterparty is unable to meet its contractual obligation to return the securities, the Company may be exposed to off-balance sheet risk of acquiring securities at prevailing market prices.
As of December 31, 2011, the interest in securities formerly held by one of the Company's funds which utilized Lehman Brothers International (Europe) ("LBIE") as a prime broker was transferred to an investment trust. On September 26, 2013, a first interim distribution in the amount of $9.5 million was received by the trust and distributed to its members. During the first quarter of 2014, a second distribution in the amount of $600,000 was received by the trust and distributed to its members. During the second quarter of 2015, the trust received and distributed a third distribution in the amount of $437,000. LBIE expects that the third distribution will represent all the remaining value held in the pool of funds to be allocated to consenting beneficiaries, and so it is expected to be the final common terms distribution.
Credit Concentrations
Credit concentrations may arise from trading, investing, underwriting and financing activities and may be impacted by changes in economic, industry or political factors. In the normal course of business, the Company may be exposed to risk in the event customers, counterparties including other brokers and dealers, issuers, banks, depositories or clearing organizations are unable to fulfill their contractual obligations. The Company seeks to mitigate these risks by actively monitoring exposures and obtaining collateral as deemed appropriate. Included in receivable from brokers, dealers and clearing organizations as of December 31, 2015 are receivables from three major U.S. broker-dealers totaling approximately $129.9 million.
93
OPPENHEIMER HOLDINGS INC. Notes to Consolidated Financial Statements | ||
Warehouse Facilities
The Company reached an agreement with RBS Citizens, NA ("Citizens") that was announced in July 2012, whereby the Company, through OPY Credit Corp., will introduce lending opportunities to Citizens, which Citizens can elect to accept and in which the Company will participate in the fees earned from any related commitment by Citizens. The Company can also in certain circumstances assume a portion of Citizen's syndication and lending risk under such loans, and if it does so it shall be obligated to secure such obligations via a cash deposit determined through risk-based formulas. Neither the Company nor Citizens is obligated to make any specific loan or to commit any minimum amount of lending capacity to the relationship. The agreement also calls for Citizens and the Company at their option to jointly participate in the arrangement of various loan syndications. At December 31, 2015, there were no loans in place.
The Company is obligated to settle transactions with brokers and other financial institutions even if its clients fail to meet their obligations to the Company. Clients are required to complete their transactions on the settlement date, generally one to three business days after the trade date. If clients do not fulfill their contractual obligations, the Company may incur losses. The Company has clearing/participating arrangements with the National Securities Clearing Corporation ("NSCC"), the Fixed Income Clearing Corporation ("FICC"), R.J. O'Brien & Associates (commodities transactions), Mortgage-Backed Securities and Clearing Corporation and others. With respect to its business in reverse repurchase and repurchase agreements, substantially all open contracts at December 31, 2015 are with the FICC. In addition, the Company began clearing its non-U.S. international equities business carried on by Oppenheimer Europe Ltd. through BNP Paribas Securities Services and Oppenheimer through BNP Securities Corp. The clearing organizations have the right to charge the Company for losses that result from a client's failure to fulfill its contractual obligations. Accordingly, the Company has credit exposures with these clearing brokers. The clearing brokers can re-hypothecate the securities held on behalf of the Company. As the right to charge the Company has no maximum amount and applies to all trades executed through the clearing brokers, the Company believes there is no maximum amount assignable to this right. At December 31, 2015, the Company had recorded no liabilities with regard to this right. The Company's policy is to monitor the credit standing of the clearing brokers and banks with which it conducts business.
OMHHF, which is engaged in commercial mortgage origination and servicing, has obtained an uncommitted warehouse facility line through PNC Bank ("PNC") under which OMHHF pledges FHA-guaranteed mortgages for a period averaging 15 business days and PNC provides a facility that allows OMHHF to fund the loan at the closing table. Warehouse payable represents the warehouse line amount outstanding with PNC and is included in accounts payable and other liabilities on the consolidated balance sheet and cash flows from operating activities on the consolidated statement of cash flows. OMHHF repays PNC upon the securitization of the mortgage by GNMA and the delivery of the security to the counter-party for payment pursuant to a contemporaneous sale on the date the mortgage is securitized. At December 31, 2015, OMHHF had $54.3 million ($16.7 million at December 31, 2014) outstanding under the warehouse facility line at a variable interest rate of 1 month LIBOR plus a spread. The Company earns a spread between the interest earned on the loans originated by the Company and the interest incurred on amounts drawn from the warehouse facility. Interest expense for the year ended December 31, 2015 was $928,500 ($570,700 in 2014 and $764,500 in 2013). The Company's ability to originate mortgage loans depends upon our ability to secure and maintain these types of short-term financings on acceptable terms.
As discussed in Note 5, Fair value measurements, the Company enters into TBA sale contracts to offset exposures related to commitments to provide funding for FHA loans at OMHHF. In the normal course of business, the Company may be exposed to the risk that counterparties to these TBA sale contracts are unable to fulfill their contractual obligations.
7. Variable interest entities ("VIEs")
The Company's policy is to consolidate all subsidiaries in which it has a controlling financial interest, as well as any VIEs where the Company is deemed to be the primary beneficiary, when it has the power to make the decisions that most significantly affect the economic performance of the VIE and has the obligation to absorb significant losses or the right to receive benefits that could potentially be significant to the VIE.
94
OPPENHEIMER HOLDINGS INC. Notes to Consolidated Financial Statements | ||
For funds that the Company has concluded are not VIEs, the Company then evaluates whether the fund is a partnership or similar entity. If the fund is a partnership or similar entity, the Company evaluates the fund under the partnership consolidation guidance. Pursuant to that guidance, the Company consolidates funds in which it is the general partner, unless presumption of control by the Company can be overcome. This presumption is overcome only when unrelated investors in the fund have the substantive ability to liquidate the fund or otherwise remove the Company as the general partner without cause, based on a simple majority vote of unaffiliated investors, or have other substantive participating rights. If the presumption of control can be overcome, the Company accounts for its interest in the fund pursuant to the equity method of accounting.
The Company serves as general partner of hedge funds and private equity funds that were established for the purpose of providing investment alternatives to both its institutional and qualified retail clients. The Company holds variable interests in these funds as a result of its right to receive management and incentive fees. The Company's investment in and additional capital commitments to these hedge funds and private equity funds are also considered variable interests. The Company's additional capital commitments are subject to call at a later date and are limited in amount.
The Company assesses whether it is the primary beneficiary of the hedge funds and private equity funds in which it holds a variable interest in the form of general and limited partner interests. In each instance, the Company has determined that it is not the primary beneficiary and therefore need not consolidate the hedge funds or private equity funds. The subsidiaries' general and limited partnership interests, additional capital commitments, and management fees receivable represent its maximum exposure to loss. The subsidiaries' general partnership and limited partnership interests and management fees receivable are included in other assets on the consolidated balance sheet.
The following tables set forth the total VIE assets, the carrying value of the subsidiaries' variable interests, and the Company's maximum exposure to loss in Company-sponsored non-consolidated VIEs in which the Company holds variable interests and other non-consolidated VIEs in which the Company holds variable interests at December 31, 2015 and 2014:
(Expressed in thousands) | |||||||||||||||||||
At December 31, 2015 | |||||||||||||||||||
Total VIE Assets (1) | Carrying Value of the Company's Variable Interest | Capital Commitments | Maximum Exposure to Loss in Non-consolidated VIEs | ||||||||||||||||
Assets (2) | Liabilities | ||||||||||||||||||
Hedge funds | $ | 1,775,503 | $ | 1,354 | $ | — | $ | — | $ | 1,354 | |||||||||
Private equity funds | 54,800 | 27 | — | 2 | 29 | ||||||||||||||
Total | $ | 1,830,303 | $ | 1,381 | $ | — | $ | 2 | $ | 1,383 | |||||||||
(1) | Represents the total assets of the VIEs and does not represent the Company's interests in the VIEs. |
(2) | Represents the Company's interests in the VIEs and is included in other assets on the consolidated balance sheet. |
(Expressed in thousands) | |||||||||||||||||||
At December 31, 2014 | |||||||||||||||||||
Total VIE Assets (1) | Carrying Value of the Company's Variable Interest | Capital Commitments | Maximum Exposure to Loss in Non-consolidated VIEs | ||||||||||||||||
Assets (2) | Liabilities | ||||||||||||||||||
Hedge funds | $ | 1,955,515 | $ | 1,584 | $ | — | $ | — | $ | 1,584 | |||||||||
Private equity funds | 66,400 | 27 | — | 2 | 29 | ||||||||||||||
Total | $ | 2,021,915 | $ | 1,611 | $ | — | $ | 2 | $ | 1,613 | |||||||||
(1) | Represents the total assets of the VIEs and does not represent the Company's interests in the VIEs. |
(2) | Represents the Company's interests in the VIEs and is included in other assets on the consolidated balance sheet. |
95
OPPENHEIMER HOLDINGS INC. Notes to Consolidated Financial Statements | ||
8. Commercial mortgage banking
OMHHF is engaged in the business of originating and servicing FHA-insured multifamily and healthcare facility loans and securitizing these loans into GNMA mortgage backed securities. OMHHF also offers mortgage services to developers of commercial properties including apartments, elderly housing and nursing homes that satisfy FHA criteria. OMHHF maintains a mortgage servicing portfolio for which it provides a full array of services, including the collection of mortgage payments from mortgagors which are passed on to the mortgage holders, construction loan management and asset management.
The Company owns an 83.68% controlling interest in OMHHF. The 16.32% noncontrolling interest belongs to one related party who is the President and Chief Executive Officer of OMHHF.
Loan Origination Fees
OMHHF recognizes origination fees and other direct origination costs when it enters into a rate lock commitment with the borrower. The origination fees and other direct origination costs are recognized when OMHHF enters into a commitment to sell loans to third parties. In accordance with Housing and Urban Development ("HUD") guidelines, OMHHF will, with HUD's approval and for certain loan programs, apply the premium income towards the payment of prepayment costs that customers will incur on their prior mortgage. These costs are netted with revenues from premium income that are otherwise earned from these loan refinancings or modifications. Prepayment costs recorded as contra-revenue against premium income were $25.7 million for the year ended December 31, 2015 ($9.8 million in 2014 and $14.5 million in 2013).
Funding Commitments
OMHHF provides its clients with commitments to fund FHA-insured permanent or constructions loans. Upon providing these commitments to fund, OMHHF enters into TBA sale contracts directly or indirectly with counterparties to offset its exposures related to these funding commitments. See Note 5, Fair value measurements, for more information.
Loans Held For Sale
OMHHF advances funds from its own cash reserves in addition to obtaining financing through warehouse facilities in order to fund initial loan closing and subsequent construction loan draws. Prior to the GNMA securitization of a loan, a loan held for sale is recorded on the consolidated balance sheet. Loans held for sale are recorded at fair value through earnings.
Escrows Held in Trust
Custodial escrow accounts relating to loans serviced by OMHHF totaled $421.5 million at December 31, 2015 ($285.5 million at December 31, 2014). These amounts are not included on the consolidated balance sheet as such amounts are not OMHHF’s assets. Certain cash deposits at financial institutions exceeded the FDIC-insured limits or other institutionally provided insurance. The combined uninsured balance with relation to escrow accounts at December 31, 2015 was approximately $301.3 million. OMHHF places these deposits with major financial institutions where it believes the risk is minimal and that meet or exceed GNMA required credit ratings.
The total unpaid principal balance of loans the Company was servicing for various institutional investors as of December 31, 2015 and 2014 was as follows:
(Expressed in thousands) | |||||||
2015 | 2014 | ||||||
Unpaid principal balance of loans | $ | 3,974,292 | $ | 4,134,894 | |||
Mortgage Servicing Rights ("MSRs")
OMHHF purchases commitments or originates mortgage loans that are sold and securitized into GNMA mortgage backed securities. OMHHF retains the servicing responsibilities for the loans securitized and recognizes either a MSR asset or a MSR liability for that servicing contract. OMHHF receives monthly servicing fees equal to a percentage of the outstanding principal balance of the loans being serviced.
96
OPPENHEIMER HOLDINGS INC. Notes to Consolidated Financial Statements | ||
OMHHF estimates the initial fair value of the servicing rights based on the present value of future net servicing income, adjusted for factors such as discount rate and prepayment. OMHHF uses the amortization method for subsequent measurement, subject to annual impairment. See Note 5, Fair value measurements, for more information.
The fair value of the servicing rights on the loan portfolio was $41.8 million and $42.3 million at December 31, 2015 and 2014, respectively (carrying value of $28.2 million and $30.1 million at December 31, 2015 and 2014, respectively). The following tables summarize the changes in carrying value of MSRs for the years ended December 31, 2015 and 2014:
(Expressed in thousands) | |||||||
Year Ended December 31, | |||||||
2015 | 2014 | ||||||
Balance at beginning of year | $ | 30,140 | $ | 28,879 | |||
Originations (1) | 6,569 | 5,956 | |||||
Purchases | 799 | 345 | |||||
Disposals (1) | (8,613 | ) | (2,221 | ) | |||
Amortization expense | (727 | ) | (2,819 | ) | |||
Balance at end of year | $ | 28,168 | $ | 30,140 | |||
(1) | Includes refinancings. |
Servicing rights are amortized using the straight-line method over 10 years. Estimated amortization expense for the next five years and thereafter is as follows:
(Expressed in thousands) | |||||||||||
Originated MSRs | Purchased MSRs | Total MSRs | |||||||||
2016 | $ | 3,039 | $ | 1,084 | $ | 4,123 | |||||
2017 | 3,036 | 1,082 | 4,118 | ||||||||
2018 | 3,008 | 1,075 | 4,083 | ||||||||
2019 | 2,913 | 1,014 | 3,927 | ||||||||
2020 | 2,758 | 912 | 3,670 | ||||||||
Thereafter | 6,962 | 1,285 | 8,247 | ||||||||
$ | 21,716 | $ | 6,452 | $ | 28,168 | ||||||
The Company receives fees during the course of servicing the mortgage loans. The fees for the years ended December 31, 2015, 2014 and 2013 were as follows:
(Expressed in thousands) | |||||||||||
For the Year Ended December 31, | |||||||||||
2015 | 2014 | 2013 | |||||||||
Servicing fees | $ | 5,848 | $ | 5,552 | $ | 5,049 | |||||
Ancillary fees | 310 | 328 | 528 | ||||||||
Total MSR fees | $ | 6,158 | $ | 5,880 | $ | 5,577 | |||||
97
OPPENHEIMER HOLDINGS INC. Notes to Consolidated Financial Statements | ||
9. Office facilities
(Expressed in thousands) | |||||||
Year Ended December 31, | |||||||
2015 | 2014 | ||||||
Furniture, fixtures and equipment | $ | 75,858 | $ | 78,940 | |||
Leasehold improvements | 57,393 | 54,196 | |||||
Total | 133,251 | 133,136 | |||||
Less accumulated depreciation | (104,961 | ) | (103,547 | ) | |||
Total | $ | 28,290 | $ | 29,589 | |||
Depreciation and amortization expense, included in occupancy and equipment costs on the consolidated statement of income, was $7.2 million, $7.7 million and $9.4 million in the years ended December 31, 2015, 2014 and 2013, respectively.
10. Bank call loans
Bank call loans, primarily payable on demand, bear interest at various rates but not exceeding the broker call rate, which was 2.25% at December 31, 2015 (2.0% at December 31, 2014). Details of the bank call loans are as follows:
(Expressed in thousands, except percentages) | |||||||
2015 | 2014 | ||||||
Year-end balance | $ | 100,200 | $ | 59,400 | |||
Weighted interest rate (at end of year) | 1.56 | % | 1.22 | % | |||
Maximum balance (at any month-end) | 189,000 | 197,000 | |||||
Average amount outstanding (during the year) | 116,267 | 108,235 | |||||
Average interest rate (during the year) | 1.28 | % | 1.26 | % | |||
Interest expense for the year ended December 31, 2015 on bank call loans was $1.5 million ($1.4 million in 2014 and $2.2 million in 2013).
11. Long-term debt
(Expressed in thousands) | |||||||||
Issued | Maturity Date | December 31, 2015 | December 31, 2014 | ||||||
Senior Secured Notes | 4/15/2018 | $ | 150,000 | $ | 150,000 | ||||
On April 12, 2011, the Company completed the private placement of $200.0 million in aggregate principal amount of 8.75% Senior Secured Notes due April 15, 2018 (the "Notes") at par. The interest on the Notes is payable semi-annually on April 15th and October 15th.
The indenture for the Notes contains covenants which place restrictions on the incurrence of indebtedness, the payment of dividends, sale of assets, mergers and acquisitions and the granting of liens. The Notes provide for events of default including nonpayment, misrepresentation, breach of covenants and bankruptcy. The Company's obligations under the Notes are guaranteed, subject to certain limitations. These guarantees may be shared, on a senior basis, under certain circumstances, with newly incurred debt outstanding in the future. At December 31, 2015, the Company was in compliance with all of its covenants.
98
OPPENHEIMER HOLDINGS INC. Notes to Consolidated Financial Statements | ||
On April 15, 2014, the Company retired early a total of $50.0 million (25%) of the Notes. The Company redeemed $45.0 million aggregate principal amount of the outstanding Notes at a redemption price equal to 106.563% of the principal amount of the Notes, plus accrued and unpaid interest. In addition, the Company retired the $5.0 million aggregate principal amount of the Notes that it held. Upon completion of the redemption and retirement on April 15, 2014, $150.0 million aggregate principal amount of the Notes remained outstanding. The retirement of the Notes reduced the Company's interest costs by $3.9 million annually beginning in the second quarter of 2014.
Interest expense for the year ended December 31, 2015 on the Notes was $13.1 million ($14.3 million in 2014 and $17.1 million in 2013). Interest paid on the Notes for the year ended December 31, 2015 was $13.1 million ($15.1 million in 2014).
12. Share capital
The Company's authorized share capital consists of (a) 50,000,000 shares of Preferred Stock, par value $0.001 per share; (b) 50,000,000 shares of Class A non-voting common stock ("Class A Stock"), par value $0.001 per share; and (c) 99,680 shares of Class B voting common stock ("Class B Stock"), par value $0.001 per share. No Preferred Stock has been issued. 99,680 shares of Class B Stock have been issued and are outstanding.
The Class A Stock and the Class B Stock are equal in all respects except that the Class A Stock is non-voting.
The following table reflects changes in the number of shares of Class A Stock outstanding for the periods indicated:
2015 | 2014 | ||||
Class A Stock outstanding, beginning of year | 13,530,688 | 13,377,967 | |||
Issued pursuant to shared-based compensation plans (Note 15) | 131,524 | 152,721 | |||
Repurchased and canceled pursuant to the stock buy-back | (423,726 | ) | — | ||
Class A Stock outstanding, end of year | 13,238,486 | 13,530,688 | |||
Stock buy-back
On September 15, 2015, the Company announced that its board of directors approved a share repurchase program that authorizes the Company to purchase up to 665,000 shares of the Company's Class A Stock, representing approximately 5% of its 13,348,369 then issued and outstanding shares of Class A Stock ("New Program"). This authorization replaces the share repurchase program covering up to 675,000 shares of the Company's Class A Stock, which was announced on October 7, 2011 ("Previous Program"), pursuant to which 322,177 shares of the Company's Class A Stock were repurchased and canceled prior to December 31, 2014. During the nine months ended September 30, 2015, the Company purchased and canceled an additional 328,844 shares of Class A Stock for a total consideration of $6.6 million ($20.12 per share) under the Previous Program. The 23,979 remaining shares available under the Previous Program have been replaced by the shares available under the New Program.
During the three months ended December 31, 2015, the Company purchased and canceled an aggregate of 94,882 shares of Class A Stock for a total consideration of $1.6 million ($17.20 per share) under the New Program. As of December 31, 2015, 570,118 shares were available to be purchased under the New Program.
Any such share purchases will be made by the Company from time to time in the open market at the prevailing open market price using cash on hand, in compliance with the applicable rules and regulations of the New York Stock Exchange and federal and state securities laws and the terms of the Company's senior secured debt. All shares purchased will be canceled. The share repurchase program is expected to continue indefinitely. The timing and amounts of any purchases will be based on market conditions and other factors including price, regulatory requirements and capital availability. The share repurchase program does not obligate the Company to repurchase any dollar amount or number of Class A non-voting common shares. Depending on market conditions and other factors, these repurchases may be commenced or suspended from time to time without prior notice.
Dividends
The Company paid cash dividends of $0.44 per share to holders of Class A and Class B Stock in 2015, 2014 and 2013.
99
OPPENHEIMER HOLDINGS INC. Notes to Consolidated Financial Statements | ||
13. Earnings per share
Basic earnings per share is computed by dividing net income attributable to Oppenheimer Holdings Inc. by the weighted average number of shares of Class A Stock and Class B Stock outstanding. Diluted earnings per share includes the weighted average number of shares of Class A Stock and Class B Stock outstanding and options to purchase the Class A Stock and unvested restricted stock awards of Class A Stock using the treasury stock method.
Earnings per share has been calculated as follows:
(Expressed in thousands, except number of shares and per share amounts) | |||||||||||
For the Year Ended December 31, | |||||||||||
2015 | 2014 | 2013 | |||||||||
Basic weighted average number of shares outstanding | 13,640,610 | 13,604,258 | 13,577,725 | ||||||||
Net dilutive effect of share-based awards, treasury method (1) | 650,924 | 646,405 | 546,335 | ||||||||
Diluted weighted average number of shares outstanding | 14,291,534 | 14,250,663 | 14,124,060 | ||||||||
Net income for the year | $ | 2,898 | $ | 9,561 | $ | 26,153 | |||||
Net income attributable to noncontrolling interest, net of tax | 936 | 735 | 1,092 | ||||||||
Net income attributable to Oppenheimer Holdings Inc. | $ | 1,962 | $ | 8,826 | $ | 25,061 | |||||
Basic earnings per share | $ | 0.14 | $ | 0.65 | $ | 1.85 | |||||
Diluted earnings per share | $ | 0.14 | $ | 0.62 | $ | 1.77 | |||||
(1) | For the year ended December 31, 2015, the diluted earnings per share computation does not include the anti-dilutive effect of 5,309 shares of Class A Stock granted under share-based compensation arrangements (43,008 and 57,573 shares for the years ended December 31, 2014 and 2013, respectively). |
14. Income taxes
The income tax provision shown in the consolidated statements of income is reconciled to amounts of tax that would have been payable (recoverable) from the application of the federal tax rate to pre-tax profit, as follows:
(Expressed in thousands) | ||||||||||||||||||||
For the Year Ended December 31, | ||||||||||||||||||||
2015 | 2014 | 2013 | ||||||||||||||||||
Amount | Percentage | Amount | Percentage | Amount | Percentage | |||||||||||||||
U.S. federal statutory income tax rate | $ | 2,348 | 35.0 | % | $ | 9,008 | 35.0 | % | $ | 15,368 | 35.0 | % | ||||||||
U.S. state and local income taxes, net of U.S. federal income tax benefits | 373 | 5.5 | % | 2,033 | 7.9 | % | 2,131 | 4.9 | % | |||||||||||
Unrecognized tax benefit | 589 | 8.8 | % | 6 | — | % | 1,244 | 2.8 | % | |||||||||||
Tax exempt income, net of interest expense | (696 | ) | -10.4 | % | (528 | ) | -2.0 | % | (715 | ) | -1.6 | % | ||||||||
Non-deductible regulatory settlements | — | — | % | 5,298 | 20.6 | % | — | — | % | |||||||||||
Business promotion and other non-deductible expenses | 577 | 8.6 | % | 655 | 2.5 | % | 660 | 1.5 | % | |||||||||||
Insurance proceeds, non-taxable | — | — | % | (65 | ) | -0.3 | % | (597 | ) | -1.4 | % | |||||||||
Adjustment to reflect prior year tax return filings | 397 | 5.9 | % | 256 | 1.0 | % | (251 | ) | -0.6 | % | ||||||||||
Tax rate change on deferred income taxes | 116 | 1.7 | % | 241 | 0.9 | % | 208 | 0.5 | % | |||||||||||
Tax rate differential on foreign operations | 145 | 2.2 | % | (447 | ) | -1.7 | % | 185 | 0.4 | % | ||||||||||
Other | (36 | ) | -0.5 | % | (282 | ) | -1.1 | % | (477 | ) | -1.1 | % | ||||||||
Total income tax provision | $ | 3,813 | 56.8 | % | $ | 16,175 | 62.8 | % | $ | 17,756 | 40.4 | % | ||||||||
100
OPPENHEIMER HOLDINGS INC. Notes to Consolidated Financial Statements | ||
Income taxes included in the consolidated statements of income represent the following:
(Expressed in thousands) | |||||||||||
For the Year Ended December 31, | |||||||||||
2015 | 2014 | 2013 | |||||||||
Current: | |||||||||||
U.S. federal tax (benefit) | $ | (1,738 | ) | $ | 10,302 | $ | (2,984 | ) | |||
State and local tax | 832 | 1,520 | 1,885 | ||||||||
Non-U.S. operations | 181 | (264 | ) | 116 | |||||||
Total Current | (725 | ) | 11,558 | (983 | ) | ||||||
Deferred: | |||||||||||
U.S. federal tax | 3,173 | 1,273 | 16,658 | ||||||||
State and local tax | 1,145 | 2,057 | 2,482 | ||||||||
Non-U.S. operations | 220 | 1,287 | (401 | ) | |||||||
Total Deferred | 4,538 | 4,617 | 18,739 | ||||||||
Total | $ | 3,813 | $ | 16,175 | $ | 17,756 | |||||
Profit (loss) before income tax provision (benefit) with respect to foreign operations was $732,000, $4.3 million and $(1.3) million for the years ended December 31, 2015, 2014 and 2013, respectively.
Tax expense for 2015 was lower than in 2014 primarily because the Company earned less pretax income in 2015 than in 2014. The effective tax rate for 2015 was lower than the effective tax rate in 2014 mainly due to nondeductible penalties incurred in 2014 pursuant to regulatory settlements.
U.S. income and foreign withholding taxes have not been recognized on the excess of the amount for financial reporting over the tax basis of investments in foreign subsidiaries that is indefinitely reinvested outside the United States. This amount becomes taxable upon a repatriation of assets from the subsidiary or a sale or liquidation of the subsidiary. The amount of such taxable temporary differences totaled $20.5 million as of December 31, 2015. The unrecognized deferred tax liability associated with earnings of foreign subsidiaries, net of associated U.S. foreign tax credits, is $2.5 million for those subsidiaries with respect to which the Company would be subject to residual U.S. tax on cumulative earnings through 2015 were those earnings to be repatriated.
101
OPPENHEIMER HOLDINGS INC. Notes to Consolidated Financial Statements | ||
Deferred income taxes reflect the net tax effects of temporary differences between the financial reporting and tax bases of assets and liabilities and are measured using enacted tax rates and laws that will be in effect when such differences are expected to reverse. Significant components of the Company’s deferred tax assets and liabilities at December 31, 2015 and 2014 were as follows:
(Expressed in thousands) | |||||||
For the Year Ended December 31, | |||||||
2015 | 2014 | ||||||
Deferred tax assets: | |||||||
Employee deferred compensation plans | $ | 27,423 | $ | 30,969 | |||
Deferred rent | 10,582 | 10,024 | |||||
Lease incentive | 5,855 | 6,212 | |||||
Broker notes | 3,441 | 3,460 | |||||
Auction rate securities reserve | 2,666 | 3,229 | |||||
Net operating loss | 2,834 | 2,896 | |||||
Involuntary conversion | 2,245 | 2,033 | |||||
Reserve for litigation and legal fees | 3,350 | 5,808 | |||||
Allowance for doubtful accounts | 1,037 | 984 | |||||
State and local net operating loss/credit carryforward | 1,330 | 357 | |||||
Other | 2,718 | 2,650 | |||||
Total deferred tax assets | 63,481 | 68,622 | |||||
Valuation allowance | 126 | 113 | |||||
Deferred tax assets after valuation allowance | 63,355 | 68,509 | |||||
Deferred tax liabilities: | |||||||
Goodwill amortization (Section 197) | 53,364 | 48,025 | |||||
Partnership investments | 7,444 | 10,865 | |||||
Mortgage servicing rights | 10,571 | 12,173 | |||||
Company owned life insurance | 6,431 | 6,501 | |||||
Change in accounting method | 1,313 | 2,591 | |||||
Book versus tax depreciation differences | 657 | 982 | |||||
Other | 248 | 469 | |||||
Total deferred tax liabilities | 80,028 | 81,606 | |||||
Deferred tax liabilities, net | $ | (16,673 | ) | $ | (13,097 | ) | |
The Company has deferred tax assets at December 31, 2015 of $1.3 million, $1.0 million and $397,000 arising from net operating losses incurred by Oppenheimer Israel (OPCO) Ltd., Oppenheimer Investments Asia Limited, and Oppenheimer Europe Ltd., respectively. The Company believes that realization of the deferred tax assets is more likely than not based on expectations of future taxable income in Israel, Asia and Europe. These net operating losses carry forward indefinitely and are not subject to expiration, provided that these subsidiaries and their underlying businesses continue operating normally (as is anticipated).
Goodwill arising from the acquisitions of Josephthal Group Inc. and the Oppenheimer Divisions is being amortized for tax purposes on a straight-line basis over 15 years. The difference between book and tax is recorded as a deferred tax liability.
The Company or one or more of its subsidiaries file income tax returns in the U.S. federal jurisdiction and in various states and foreign jurisdictions. The Company has closed tax years through 2010 in the U.S. federal jurisdiction.
102
OPPENHEIMER HOLDINGS INC. Notes to Consolidated Financial Statements | ||
The Company is under examination in various states and overseas jurisdictions in which the Company has significant business operations. The Company has closed tax years through 2007 for New York State and is currently under exam for the period 2008 to 2011. The Company also has closed tax years through 2008 with New York City and is currently under exam for the 2009 to 2012 tax years. With few exceptions, the Company is no longer subject to U.S. federal, state and local, or non-U.S. income tax examinations for years before 2010. The Company is currently under examination for the 2013 federal tax return.
The Company has unrecognized tax benefits of $2.5 million, $1.6 million and $1.6 million as of December 31, 2015, 2014 and 2013, respectively (as shown on the table below). Included in the balance of unrecognized tax benefits as of December 31, 2015 and 2014 are $1.8 million and $1.3 million of tax benefits for either year that, if recognized, would affect the effective tax rate.
During the year ended December 31, 2013, the Company reclassified $4.9 million of unrecognized tax benefit to other tax accounts when the Internal Revenue Service approved the Company’s application for a tax accounting method change. A reconciliation of the beginning and ending amount of unrecognized tax benefit follows:
(Expressed in thousands) | |||||||||||
2015 | 2014 | 2013 | |||||||||
Balance at January 1, | $ | 1,583 | $ | 1,574 | $ | 5,236 | |||||
Additions for tax positions of prior years | 907 | — | 1,168 | ||||||||
Additions for tax positions of current year | — | 9 | 77 | ||||||||
Reclass to other tax accounts | — | — | (4,907 | ) | |||||||
Balance at December 31, | $ | 2,490 | $ | 1,583 | $ | 1,574 | |||||
On its consolidated statements of income, the Company records interest and penalties accruing on unrecognized tax benefits in income before tax provision as interest expense and other expense, respectively. For the years ended December 31, 2015 and 2014, the Company recorded tax-related interest expense of $23,000 and $22,000, respectively, in its consolidated statement of income. At December 31, 2015 and 2014, the Company had an income tax-related interest payable of $106,000 and $83,000, respectively, on its consolidated balance sheet.
15. Employee compensation plans
The Company maintains various employee compensation plans for the benefits of its employees. The two types of employee compensation are granted under share-based compensation and cash-based compensation plans.
Share-based Compensation
Equity Incentive Plan
Under the Company's 2006 Equity Incentive Plan, adopted December 11, 2006 and amended December 2011, and its 1996 Equity Incentive Plan, as amended March 10, 2005 (together "EIP"), the Compensation Committee of the Board of Directors of the Company could grant options to purchase Class A Stock, Class A Stock awards and restricted Class A Stock awards to officers and key employees of the Company and its subsidiaries. Options were generally granted for a five-year term and generally vest at the rate of 25% of the amount granted on the second anniversary of the grant, 25% on the third anniversary of the grant, 25% on the fourth anniversary of the grant and 25% 6 months before expiration. The EIP has been amended, restated and replaced by the OIP, discussed below.
Employee Share Plan
On March 10, 2005, the Company approved the Oppenheimer & Co. Inc. Employee Share Plan ("ESP") for employees of the Company and its subsidiaries to attract, retain and provide incentives to key management employees. The Compensation Committee of the Board of Directors of the Company could grant Class A Stock awards and restricted Class A Stock awards pursuant to the ESP. ESP awards were generally awarded for a three or five year term which fully vest at the end of the term. The ESP has been amended, restated and replaced by the OIP, discussed below.
103
OPPENHEIMER HOLDINGS INC. Notes to Consolidated Financial Statements | ||
Oppenheimer Holdings Inc. 2014 Incentive Plan
On February 26, 2014, the Company adopted the Oppenheimer Holdings Inc. 2014 Incentive Plan (the "OIP"). The OIP amends, restates and replaces two separate plans previously in place, the EIP and ESP (the "Prior Plans"), as described above.
The OIP permits the Company to grant options to purchase Class A Stock, Class A Stock awards and restricted Class A Stock to or for the benefit of employees and non-employee directors of the Company and its affiliates as part of their compensation. After February 26, 2014, no additional awards shall be made under the Prior Plans, although outstanding awards previously made under the Prior Plans shall continue to be governed by the terms of the applicable Prior Plan.
Oppenheimer Holdings Inc. Stock Appreciation Right Plan
Under the Oppenheimer Holdings Inc. Stock Appreciation Right Plan, the Company awards stock appreciation rights ("OARs") to certain employees as part of their compensation package based on a formula reflecting gross production and length of service. These awards are granted once per year in January with respect to the prior year's production. The OARs vest five years from grant date and settle in cash at vesting.
Restricted stock - The Company has granted restricted stock awards pursuant to the EIP, ESP and OIP. The following table summarizes the status of the Company's non-vested restricted Class A Stock awards under the EIP, ESP and OIP for the year ended December 31, 2015:
Number of Class A Shares Subject to Restricted Stock Awards | Weighted Average Fair Value | Remaining Contractual Life | |||||||
Nonvested at beginning of year | 1,239,346 | $ | 20.12 | 1.7 Years | |||||
Granted | 399,566 | 19.05 | 3.4 Years | ||||||
Vested | (210,516 | ) | 24.59 | — | |||||
Forfeited | (170,838 | ) | 18.27 | — | |||||
Nonvested at end of year | 1,257,558 | $ | 19.29 | 1.7 Years | |||||
At December 31, 2015, all outstanding restricted Class A Stock awards were non-vested. The aggregate intrinsic value of restricted Class A Stock awards outstanding as of December 31, 2015 was approximately $21.9 million. The aggregate intrinsic value of restricted Class A Stock awards that are expected to vest is $21.1 million as of December 31, 2015. During the year ended December 31, 2015, the Company included approximately $4.6 million ($5.6 million in 2014 and $5.0 million in 2013) of compensation expense in its consolidated statements of income relating to restricted Class A Stock awards.
As of December 31, 2015, there was approximately $9.5 million of total unrecognized compensation cost related to unvested restricted Class A Stock awards. The cost is expected to be recognized over a weighted average period of 1.7 years.
At December 31, 2015, the number of shares of Class A Stock available under the share-based compensation plans, but not yet awarded, was 882,401.
On January 28, 2016, the Company awarded 28,000 restricted shares of Class A Stock to its non-employee directors under the OIP. These shares of Class A Stock will vest as follows: 25% on July 27, 2016, July 27, 2017, July 27, 2018 and July 27, 2019.
On February 24, 2016, the Company awarded a total of 355,833 restricted shares of Class A Stock to current employees pursuant to the OIP. Of these restricted shares, 98,333 shares will cliff vest in three years and 257,500 shares will cliff vest in five years. These awards will be expensed over the applicable three or five year vesting period.
104
OPPENHEIMER HOLDINGS INC. Notes to Consolidated Financial Statements | ||
Stock options - The Company has granted stock options pursuant to the EIP and OIP. The fair value of each award of stock options was estimated on the grant date using the Black-Scholes model with the following assumptions:
Grant Date Assumptions | |||||||||||||||||||
2015 | 2014 | 2013 | 2012 | 2011 | |||||||||||||||
Expected term (1) | 5 years | 5 years | 5 years | 5 years | 5 years | ||||||||||||||
Expected volatility factor (2) | 55.43 | % | 56.31 | % | 53.82 | % | 54.95 | % | 52.52 | % | |||||||||
Risk-free interest rate (3) | 1.27 | % | 1.49 | % | 0.84 | % | 0.70 | % | 2.00 | % | |||||||||
Actual dividends (4) | $ | 0.44 | $ | 0.44 | $ | 0.44 | $ | 0.44 | $ | 0.44 | |||||||||
(1) | The expected term was determined based on actual awards. |
(2) | The volatility factor was measured using the weighted average of historical daily price changes of the Company's Class A Stock over a historical period commensurate to the expected term of the awards. |
(3) | The risk-free interest rate was based on periods equal to the expected term of the awards based on the U.S. Treasury yield curve in effect at the time of grant. |
(4) | Actual dividends were used to compute the expected annual dividend yield. |
Stock option activity under the OIP and EIP since January 1, 2014 is summarized as follows:
Year Ended December 31, | |||||||||||||||
2015 | 2014 | ||||||||||||||
Number of Options | Weighted Average Exercise Price | Number of Options | Weighted Average Exercise Price | ||||||||||||
Options outstanding at beginning of year | 45,549 | $ | 25.50 | 72,573 | $ | 24.46 | |||||||||
Options granted | 4,177 | 19.76 | 2,976 | 23.49 | |||||||||||
Options exercised | — | — | (15,000 | ) | 12.33 | ||||||||||
Options forfeited or expired | (37,699 | ) | 26.12 | (15,000 | ) | 33.22 | |||||||||
Options outstanding at end of year | 12,027 | $ | 21.57 | 45,549 | $ | 25.50 | |||||||||
Options vested at end of year | 3,366 | $ | 23.56 | 30,513 | $ | 25.99 | |||||||||
Weighted average fair value of options granted during the year | $ | 7.87 | $ | 9.94 | |||||||||||
The aggregate intrinsic value of options outstanding as of December 31, 2015 was $171. The aggregate intrinsic value of vested options as of December 31, 2015 was $43. The aggregate intrinsic value of options that are expected to vest is $163 as of December 31, 2015.
The following table summarizes stock options outstanding and exercisable as of December 31, 2015:
Range of Exercise Prices | Number of Options Outstanding | Weighted Average Remaining Contractual Life | Weighted Average Exercise Price of Outstanding Options | Number of Options Exercisable (Vested) | Weighted Average Exercise Price of Vested Options | ||||||||||
$17.20 - $20.00 | 6,718 | 3.08 Years | $ | 19.29 | 1,033 | $ | 18.82 | ||||||||
$20.01 - $25.66 | 5,309 | 1.76 Years | 24.44 | 2,333 | 25.66 | ||||||||||
$17.20 - $25.66 | 12,027 | 2.50 Years | $ | 21.57 | 3,366 | $ | 23.56 | ||||||||
105
OPPENHEIMER HOLDINGS INC. Notes to Consolidated Financial Statements | ||
The following table summarizes the status of the Company's non-vested options for the year ended December 31, 2015:
Number of Options | Weighted Average Fair Value | |||||
Nonvested at beginning of year | 15,036 | $ | 10.17 | |||
Granted | 4,177 | 7.87 | ||||
Vested | (10,552 | ) | 10.66 | |||
Nonvested at end of year | 8,661 | $ | 8.46 | |||
In the year ended December 31, 2015, the Company has included approximately $69,900 ($133,600 in 2014 and $158,200 in 2013) of compensation expense in its consolidated statement of income relating to the expensing of stock options.
As of December 31, 2015, there was approximately $44,500 of total unrecognized compensation cost related to unvested share-based compensation arrangements granted under the EIP. The cost is expected to be recognized over a weighted average period of 2.50 years.
On February 24, 2016, the Company awarded a total of 3,907 options to purchase Class A Stock to current employees pursuant to the OIP. These options will be expensed over 4.5 years (the vesting period).
OARs - The Company has awarded OARs pursuant to the Oppenheimer Holdings Inc. Stock Appreciation Right Plan. The following table summarized the status of the Company's outstanding OARs awards as of December 31, 2015:
Grant Date | Number of OARs Outstanding | Strike Price | Remaining Contractual Life | Fair Value at December 31, 2015 | ||||||||
January 13, 2011 | 289,320 | $ | 26.35 | 12 Days | $ | — | ||||||
January 19, 2012 | 324,710 | 18.94 | 1 Year | 1.52 | ||||||||
January 14, 2013 | 347,130 | 15.94 | 2 Years | 3.45 | ||||||||
January 14, 2014 | 442,790 | 23.48 | 3 Years | 1.78 | ||||||||
January 9, 2015 | 503,080 | 21.94 | 4 Years | 2.74 | ||||||||
1,907,030 | ||||||||||||
Total weighted average values | $ | 21.36 | 2.3 Years | $ | 2.02 | |||||||
At December 31, 2015, all outstanding OARs were unvested. At December 31, 2015, the aggregate intrinsic value of OARs outstanding and expected to vest was $499,900. In the year ended December 31, 2015, the Company included approximately a net credit of $1.8 million ($380,100 of expense in 2014 and $4.1 million of expense in 2013) in compensation expense in its consolidated statement of income relating to OARs awards. The liability related to the OARs was approximately $1.6 million as of December 31, 2015.
As of December 31, 2015, there was approximately $2.1 million of total unrecognized compensation cost related to unvested OARs. The cost is expected to be recognized over a weighted average period of 2.3 years.
On January 6, 2016, 491,160 OARs were awarded to Oppenheimer employees related to fiscal 2015 performance. These OARs will be expensed over 5 years (the vesting period).
106
OPPENHEIMER HOLDINGS INC. Notes to Consolidated Financial Statements | ||
Cash-based Compensation Plan
Defined Contribution Plan
The Company, through its subsidiaries, maintains a defined contribution plan covering substantially all full-time U.S. employees. The Oppenheimer & Co. Inc. 401(k) Plan provides that Oppenheimer may make discretionary contributions. Eligible Oppenheimer employees could make voluntary contributions which could not exceed $18,000, $17,500 and $17,500 per annum in 2015, 2014 and 2013, respectively. The Company made contributions to the 401(k) Plan of $1.6 million, $1.2 million and $1.3 million in 2015, 2014 and 2013, respectively.
Deferred Compensation Plans
The Company maintains an Executive Deferred Compensation Plan ("EDCP") and a Deferred Incentive Plan ("DIP") in order to offer certain qualified high-performing financial advisers a bonus based upon a formula reflecting years of service, production, net commissions and a valuation of their clients' assets. The bonus amounts resulted in deferrals in fiscal 2015 of approximately $8.3 million ($8.6 million in 2014 and $8.5 million in 2013). These deferrals normally vest after five years. The liability is being recognized on a straight-line basis over the vesting period. The EDCP also includes voluntary deferrals by senior executives that are not subject to vesting. The Company maintains a Company-owned life insurance policy, which is designed to offset approximately 60% of the EDCP liability. The EDCP liability is being tracked against the value of a benchmark investment portfolio held for this purpose. At December 31, 2015, the Company's liability with respect to the EDCP and DIP totaled $49.0 million and is included in accrued compensation on the consolidated balance sheet at December 31, 2015.
In addition, the Company is maintaining a deferred compensation plan on behalf of certain employees who were formerly employed by CIBC World Markets. The liability is being tracked against the value of an investment portfolio held by the Company for this purpose and, therefore, the liability fluctuates with the fair value of the underlying portfolio. At December 31, 2015, the Company's liability with respect to this plan totaled $14.3 million.
The total amount expensed in 2015 for the Company's deferred compensation plans was $8.6 million ($11.4 million in 2014 and $17.8 million in 2013).
16. Commitments and contingencies
Commitments
The Company and its subsidiaries have operating leases for office space, equipment and furniture and fixtures expiring at various dates through 2028. Future minimum rental commitments under such office and equipment leases as at December 31, 2015 are as follows:
(Expressed in thousands) | |||
2016 | $ | 40,577 | |
2017 | 36,989 | ||
2018 | 34,749 | ||
2019 | 29,105 | ||
2020 | 21,549 | ||
2021 and thereafter | 113,982 | ||
$ | 276,951 | ||
The above table includes operating leases which have been signed by the Company’s subsidiary, Viner Finance Inc., in
which the Company is responsible for rent charges associated with its occupancy.
Certain of the leases contain provisions for rent increases based on changes in costs incurred by the lessor.
107
OPPENHEIMER HOLDINGS INC. Notes to Consolidated Financial Statements | ||
The Company's rent expense for the year ended December 31, 2015 was $45.9 million ($45.6 million in 2014 and $46.4 million in 2013).
At December 31, 2015, the Company had capital commitments of approximately $5.1 million with respect to its obligations in its role as sponsor for certain private equity funds.
At December 31, 2015, the Company had no collateralized or uncollateralized letters of credit outstanding.
Contingencies
Many aspects of the Company's business involve substantial risks of liability. In the normal course of business, the Company has been named as defendant or co-defendant in various legal actions, including arbitrations, class actions, and other litigation, creating substantial exposure. Certain of the actual or threatened legal matters include claims for substantial compensatory and/or punitive damages or claims for indeterminate amounts of damages. These proceedings arise primarily from securities brokerage, asset management and investment banking activities. The Company is also involved, from time to time, in other reviews, investigations and proceedings (both formal and informal) by governmental and self-regulatory agencies regarding the Company's business which may result in adverse judgments, settlements, fines, penalties, injunctions or other relief. The investigations include, among other things, inquiries from the Securities and Exchange Commission (the "SEC"), the Financial Industry Regulatory Authority ("FINRA") and various state regulators.
The Company accrues for estimated loss contingencies related to legal and regulatory matters when available information indicates that it is probable a liability had been incurred at the date of the consolidated financial statements and the Company can reasonably estimate the amount of that loss. In many proceedings, however, it is inherently difficult to determine whether any loss is probable or even possible or to estimate the amount of any loss. In addition, even where loss is possible or an exposure to loss exists in excess of the liability already accrued with respect to a previously recognized loss contingency, it is often not possible to reasonably estimate the size of the possible loss or range of loss or possible additional losses or range of additional losses.
For certain legal and regulatory proceedings, the Company cannot reasonably estimate such losses, particularly for proceedings that are in their early stages of development or where plaintiffs seek substantial, indeterminate or special damages. Numerous issues may need to be reviewed, analyzed or resolved, including through potentially lengthy discovery and determination of important factual matters, and by addressing novel or unsettled legal questions relevant to the proceedings in question, before a loss or range of loss or additional loss can be reasonably estimated for any proceeding. Even after lengthy review and analysis, the Company, in many legal and regulatory proceedings, may not be able to reasonably estimate possible losses or range of loss.
For certain other legal and regulatory proceedings, the Company can estimate possible losses, or range of loss in excess of amounts accrued, but does not believe, based on current knowledge and after consultation with counsel, that such losses individually, or in the aggregate, will have a material adverse effect on the Company's consolidated financial statements as a whole.
For legal and regulatory proceedings where there is at least a reasonable possibility that a loss or an additional loss may be incurred, the Company estimates a range of aggregate loss in excess of amounts accrued of $0 to $51.0 million. This estimated aggregate range is based upon currently available information for those legal proceedings in which the Company is involved, where an estimate for such losses can be made. For certain cases, the Company does not believe that an estimate can currently be made. The foregoing estimate is based on various factors, including the varying stages of the proceedings (including the fact that many are currently in preliminary stages), the numerous yet-unresolved issues in many of the proceedings and the attendant uncertainty of the various potential outcomes of such proceedings. Accordingly, the Company's estimate will change from time to time, and actual losses may be more than the current estimate.
108
OPPENHEIMER HOLDINGS INC. Notes to Consolidated Financial Statements | ||
In February 2010, Oppenheimer finalized settlements with the Regulators concluding investigations and administrative proceedings by the Regulators concerning Oppenheimer's marketing and sale of ARS. Pursuant to the settlements with the Regulators, Oppenheimer agreed to extend offers to repurchase ARS from certain of its clients subject to certain terms and conditions more fully described below. As of December 31, 2015, the Company had $5.0 million of outstanding ARS purchase commitments related to the settlements with the Regulators. In addition to the settlements with the Regulators, Oppenheimer has also reached settlements of and received adverse awards in legal proceedings with various clients where the Company is obligated to purchase ARS. Pursuant to completed Purchase Offers (as defined) under the settlements with the Regulators and client related legal settlements and awards to purchase ARS, as of December 31, 2015, the Company purchased and holds (net of redemptions) approximately $92.0 million in ARS from its clients. In addition, the Company is committed to purchase another $22.8 million in ARS from clients through 2020 under legal settlements and awards.
The Company's purchases of ARS from its clients holding ARS eligible for repurchase will, subject to the terms and conditions of the settlements with the Regulators, continue on a periodic basis. Pursuant to these terms and conditions, the Company is required to conduct a financial review every six months, until the Company has extended Purchase Offers to all Eligible Investors (as defined), to determine whether it has funds available, after giving effect to the financial and regulatory capital constraints applicable to the Company, to extend additional Purchase Offers. The financial review is based on the Company's operating results, regulatory net capital, liquidity, and other ARS purchase commitments outstanding under legal settlements and awards (described below). There are no predetermined quantitative thresholds or formulas used for determining the final agreed upon amount for the Purchase Offers. Upon completion of the financial review, the Company first meets with its primary regulator, FINRA, and then with representatives of the NYAG and other regulators to present the results of the review and to finalize the amount of the next Purchase Offer. Various offer scenarios are discussed in terms of which Eligible Investors should receive a Purchase Offer. The primary criteria to date in terms of determining which Eligible Investors should receive a Purchase Offer has been the amount of household account equity each Eligible Investor had with the Company in February 2008. Once various Purchase Offer scenarios have been discussed, the regulators, not the Company, make the final determination of which Purchase Offer scenario to implement. The terms of settlements provide that the amount of ARS to be purchased during any period shall not risk placing the Company in violation of regulatory requirements.
Eligible Investors for future buybacks continued to hold approximately $57.0 million of ARS principal value as of December 31, 2015. It is reasonably possible that some ARS Purchase Offers will need to be extended to Eligible Investors holding ARS prior to redemptions (or tender offers) by issuers of the full amount that remains outstanding. The potential additional losses that may result from entering into ARS purchase commitments to Eligible Investors for future buybacks represents the estimated difference between the principal value and the fair value. It is possible that the Company could sustain a loss of all or substantially all of the principal value of ARS still held by Eligible Investors but such an outcome is highly unlikely. The amount of potential additional losses resulting from entering into these commitments cannot be reasonably estimated due to the uncertainties surrounding the amounts and timing of future buybacks that result from the six-month financial review and the amounts, scope, and timing of future issuer redemptions and tender offers of ARS held by Eligible Investors. The range of potential additional losses related to valuation adjustments is between $0 and the amount of the estimated differential between the principal value and the fair value of ARS held by Eligible Investors for future buybacks that were not yet purchased or committed to be purchased by the Company at any point in time. The range of potential additional losses described here is not included in the estimated range of aggregate loss in excess of amounts accrued for legal and regulatory proceedings described above.
Outside of the settlements with the Regulators, the Company has also reached various legal settlements with clients and received unfavorable legal awards requiring it to purchase ARS. The terms and conditions including the ARS amounts committed to be purchased under legal settlements and awards are based on the specific facts and circumstances of each legal proceeding. In most instances, the purchase commitments are in increments and extend over a period of time. At December 31, 2015, no ARS purchase commitments related to legal settlements extended past 2020.
The Company has sought, with limited success, financing from a number of sources to try to find a means for all its clients to find liquidity from their ARS holdings and will continue to do so. There can be no assurance that the Company will be successful in finding a liquidity solution for all its clients' ARS.
109
OPPENHEIMER HOLDINGS INC. Notes to Consolidated Financial Statements | ||
On January 27, 2015, the SEC approved an Offer of Settlement from Oppenheimer and issued an Order Instituting Administrative and Cease and Desist Proceedings (the "Order"). Pursuant to the Order, Oppenheimer was ordered to (i) cease and desist from committing or causing any violations of the relevant provisions of the federal securities laws; (ii) be censured; (iii) pay to the SEC $10.0 million comprised of $4.2 million in disgorgement, $753,500 in prejudgment interest and $5.1 million in civil penalties; and (iv) retain an independent consultant to review Oppenheimer's policies and procedures relating to anti-money laundering and Section 5 of the Securities Act.
Oppenheimer made a payment of $5.0 million to the SEC on February 17, 2015 and agreed to make a second payment of $5.0 million to the SEC before January 27, 2017. On the same date the Order was issued, a division of the United States Department of the Treasury ("FinCEN") issued a Civil Monetary Assessment (the "Assessment") against Oppenheimer relating to potential violations of the Bank Secrecy Act and the regulations promulgated thereunder related primarily to, in the Company's view, the SEC matter discussed immediately above. Pursuant to the terms of the Assessment, Oppenheimer admitted that it violated the Bank Secrecy Act and consented to the payment of a civil money penalty, which, as a result of the payments to the SEC described above, obligates Oppenheimer to make an aggregate payment of $10.0 million to FinCEN. On February 9, 2015, Oppenheimer made a payment of $5.0 million to FinCEN and has agreed to make a second payment of $5.0 million before January 27, 2017. As of December 31, 2015, the Company was fully reserved for the remaining $10 million related to the aforementioned matters.
As a result of the resolution of the SEC action, Oppenheimer consented to be enjoined, in order to avoid a disqualification that
would have negatively impacted the Company's business and its results of operations. The Company sought and on January 27,
2015, received a waiver from the disqualification that would have prohibited the sale of certain privately-placed securities,
including third party alternative investments. Oppenheimer believes that any disqualification resulting from the issuance of the
Order for which Oppenheimer has not received a waiver or similar relief is not material to the business of Oppenheimer or its
affiliates.
Since early 2014, Oppenheimer has been responding to information requests from FINRA regarding the supervision of one of its former financial advisers who was indicted by the United States Attorney's Office for the District of New Jersey in March 2014 on allegations of insider trading. In August 2014, Oppenheimer received information requests from the SEC regarding supervision of the same financial adviser. A number of Oppenheimer employees have provided on-the-record testimony in connection with the SEC inquiry. Oppenheimer is continuing to cooperate with both the FINRA and SEC inquiries.
17. | Regulatory requirements |
The Company's U.S. broker dealer subsidiaries, Oppenheimer and Freedom, are subject to the uniform net capital requirements of the SEC under Rule 15c3-1 (the "Rule") promulgated under Securities Exchange Act. Oppenheimer computes its net capital requirements under the alternative method provided for in the Rule which requires that Oppenheimer maintain net capital equal to two percent of aggregate customer-related debit items, as defined in SEC Rule 15c3-3. At December 31, 2015, the net capital of Oppenheimer as calculated under the Rule was $144.8 million or 12.34% of Oppenheimer's aggregate debit items. This was $121.4 million in excess of the minimum required net capital at that date. Freedom computes its net capital requirement under the basic method provided for in the Rule, which requires that Freedom maintain net capital equal to the greater of $100,000 or 6-2/3% of aggregate indebtedness, as defined. At December 31, 2015, Freedom had net capital of $5.8 million, which was $5.7 million in excess of the $100,000 required to be maintained at that date.
New Basel III requirements being implemented in the European Union have changed how capital adequacy is reported under the Capital Requirements Directive (CRD IV), effective January 1, 2014, for Oppenheimer Europe Ltd. At December 31, 2015, the capital required and held under CRD IV was as follows:
• | Common Equity Tier 1 ratio 12.32% (required 4.5%); |
• | Tier 1 Capital ratio 12.32% (required 6.0%); and |
• | Total Capital ratio 13.75% (required 8.0%). |
At December 31, 2015, the regulatory capital of Oppenheimer Investments Asia Limited was $2.5 million, which was $2.1 million in excess of the $387,000 required to be maintained on that date. Oppenheimer Investments Asia Limited computes its regulatory capital pursuant to the requirements of the Securities and Futures Commission in Hong Kong.
110
OPPENHEIMER HOLDINGS INC. Notes to Consolidated Financial Statements | ||
18. Goodwill and intangibles
Goodwill
The Company's goodwill of $137.9 million resides in its PCD reporting unit. The Company performed its annual test for goodwill impairment as of December 31, 2015 and 2014, which did not result in any impairment charges. At each annual goodwill impairment testing date, the PCD reporting unit had a fair value that was substantially in excess of its carrying value.
Intangible Assets
Indefinite intangible assets are comprised of trademarks and trade names. Trademarks and trade names, carried at $31.7 million, which are not amortized, are subject to at least an annual test for impairment to determine if the estimated fair value is less than their carrying amount. Trademarks and trade names recorded at December 31, 2015 and 2014 have been tested for impairment and it has been determined that no impairment has occurred.
19. Segment information
The Company has determined its reportable segments based on the Company's method of internal reporting, which disaggregates its retail business by branch and its proprietary and investment banking businesses by product. The Company evaluates the performance of its segments and allocates resources to them based upon profitability.
The Company's reportable segments are:
Private Client - includes commissions and a proportionate amount of fee income earned on AUM, net interest earnings on client margin loans and cash balances, fees from money market funds, net contributions from stock loan activities and financing activities, and direct expenses associated with this segment;
Asset Management - includes a proportionate amount of fee income earned on AUM from investment management services of Oppenheimer Asset Management Inc. Oppenheimer's asset management divisions employ various programs to professionally manage client assets either in individual accounts or in funds, and includes direct expenses associated with this segment;
Capital Markets - includes investment banking, institutional equities sales, trading, and research, taxable fixed income sales, trading, and research, public finance and municipal trading, as well as the Company's operations in the United Kingdom, Hong Kong and Israel, and direct expenses associated with this segment;
Commercial Mortgage Banking - includes loan origination and servicing fees from the Company's subsidiary, OMHHF; and
Corporate/Other - the Company does not allocate costs associated with certain infrastructure support groups that are centrally managed for its reportable segments. These areas include, but are not limited to, legal, compliance, operations, accounting, and internal audit. Costs associated with these groups are separately reported in a Corporate/Other category and primarily include compensation and benefits.
The table below presents information about the reported revenue and net income (loss) before taxes of the Company for the years ended December 31, 2015, 2014 and 2013. Asset information by reportable segment is not reported, since the Company does not produce such information for internal use by the chief operating decision maker.
111
OPPENHEIMER HOLDINGS INC. Notes to Consolidated Financial Statements | ||
(Expressed in thousands) | |||||||||||
For the Year Ended December 31, | |||||||||||
2015 | 2014 | 2013 | |||||||||
Revenue | |||||||||||
Private client (1) | $ | 521,526 | $ | 582,364 | $ | 600,071 | |||||
Asset management (1) | 97,121 | 99,964 | 102,214 | ||||||||
Capital markets | 279,589 | 298,597 | 281,377 | ||||||||
Commercial mortgage banking | 30,584 | 23,329 | 34,144 | ||||||||
Corporate/Other | (435 | ) | 210 | 1,908 | |||||||
Total | $ | 928,385 | $ | 1,004,464 | $ | 1,019,714 | |||||
Income (loss) before income tax provision (benefit) | |||||||||||
Private client (1) | $ | 59,016 | $ | 60,116 | $ | 65,924 | |||||
Asset management (1) | 33,133 | 33,707 | 40,951 | ||||||||
Capital markets | 5,167 | 17,819 | 6,968 | ||||||||
Commercial mortgage banking | 9,139 | 8,546 | 11,413 | ||||||||
Corporate/Other | (99,744 | ) | (94,452 | ) | (81,347 | ) | |||||
Total | $ | 6,711 | $ | 25,736 | $ | 43,909 | |||||
(1) | Asset management fees are allocated 22.5% to the Asset Management and 77.5% to the Private Client segments. |
Revenue, classified by the major geographic areas in which it was earned for the years ended December 31, 2015, 2014 and 2013 was as follows:
(Expressed in thousands) | |||||||||||
Year Ended December 31, | |||||||||||
2015 | 2014 | 2013 | |||||||||
Americas | $ | 883,805 | $ | 955,361 | $ | 978,249 | |||||
Europe/Middle East | 40,603 | 43,087 | 36,516 | ||||||||
Asia | 3,977 | 6,016 | 4,949 | ||||||||
Total | $ | 928,385 | $ | 1,004,464 | $ | 1,019,714 | |||||
20. Subsequent events
On January 29, 2016, the Company announced a quarterly dividend in the amount of $0.11 per share, paid on February 26, 2016 to holders of Class A Stock and Class B Stock of record on February 12, 2016.
112
OPPENHEIMER HOLDINGS INC. Notes to Consolidated Financial Statements | ||
21. Quarterly information (unaudited)
(Expressed in thousands, except per share amounts) | |||||||||||||||||||
Fiscal Quarters | |||||||||||||||||||
For the Year Ended December 31, 2015 | Fourth | Third | Second | First | Year | ||||||||||||||
Revenue | $ | 230,360 | $ | 213,536 | $ | 238,928 | $ | 245,561 | $ | 928,385 | |||||||||
Income (loss) before income tax provision (benefit) | (4,243 | ) | (1,527 | ) | 2,630 | 9,851 | 6,711 | ||||||||||||
Net income (loss) attributable to Oppenheimer Holdings Inc. | (3,144 | ) | (908 | ) | 295 | 5,719 | 1,962 | ||||||||||||
Earnings (loss) per share attributable to Oppenheimer Holdings Inc. | |||||||||||||||||||
Basic | (0.23 | ) | (0.07 | ) | 0.02 | 0.42 | 0.14 | ||||||||||||
Diluted | (0.23 | ) | (0.07 | ) | 0.02 | 0.40 | 0.14 | ||||||||||||
Dividends per share | 0.11 | 0.11 | 0.11 | 0.11 | 0.44 | ||||||||||||||
Market price of Class A Stock (1) | |||||||||||||||||||
High | 20.98 | 26.80 | 27.99 | 24.41 | 27.99 | ||||||||||||||
Low | 15.60 | 17.40 | 22.30 | 19.04 | 15.60 | ||||||||||||||
(1) | The price quotations above were obtained from the New York Stock Exchange website. |
(Expressed in thousands, except per share amounts) | |||||||||||||||||||
Fiscal Quarters | |||||||||||||||||||
For the Year Ended December 31, 2014 | Fourth | Third | Second | First | Year | ||||||||||||||
Revenue | $ | 254,928 | $ | 244,679 | $ | 249,689 | $ | 255,168 | $ | 1,004,464 | |||||||||
Income before income tax provision | 9,595 | 10,896 | 136 | 5,109 | 25,736 | ||||||||||||||
Net income (loss) attributable to Oppenheimer Holdings Inc. | 2,686 | 4,470 | (1,554 | ) | 3,224 | 8,826 | |||||||||||||
Earnings (loss) per share attributable to Oppenheimer Holdings Inc. | |||||||||||||||||||
Basic | 0.20 | 0.33 | (0.11 | ) | 0.24 | 0.65 | |||||||||||||
Diluted | 0.19 | 0.31 | (0.11 | ) | 0.23 | 0.62 | |||||||||||||
Dividends per share | 0.11 | 0.11 | 0.11 | 0.11 | 0.44 | ||||||||||||||
Market price of Class A Stock (1) | |||||||||||||||||||
High | 24.70 | 24.80 | 28.86 | 29.75 | 29.75 | ||||||||||||||
Low | 19.97 | 19.76 | 21.28 | 22.26 | 19.76 | ||||||||||||||
(1) | The price quotations above were obtained from the New York Stock Exchange website. |
113
OPPENHEIMER HOLDINGS INC. Notes to Consolidated Financial Statements | ||
22. Condensed consolidating financial information
The Company's Notes are jointly and severally and fully and unconditionally guaranteed on a senior basis by E.A. Viner International Co. and Viner Finance Inc. (together, the "Guarantors"), unless released as described below. Each of the Guarantors is 100% owned by the Company. The indenture for the Notes contains covenants with restrictions which are discussed in Note 11. The following condensed consolidating financial information presents the financial position, results of operations and cash flows of the Company (referred to as "Parent" for purposes of this Note only), the Guarantor subsidiaries, the Non-Guarantor subsidiaries and elimination entries necessary to consolidate the Company.
Each Guarantor will be automatically and unconditionally released and discharged upon: the sale, exchange or transfer of the capital stock of a Guarantor and the Guarantor ceasing to be a direct or indirect subsidiary of the Company if such sale does not constitute an asset sale under the indenture for the Notes or does not constitute an asset sale effected in compliance with the asset sale and merger covenants of the indenture for the Notes; a Guarantor being dissolved or liquidated; a Guarantor being designated unrestricted in compliance with the applicable provisions of the Notes; or the exercise by the Company of its legal defeasance option or covenant defeasance option or the discharge of the Company's obligations under the indenture for the Notes in accordance with the terms of such indenture.
114
OPPENHEIMER HOLDINGS INC. Notes to Consolidated Financial Statements | ||
OPPENHEIMER HOLDINGS INC.
CONDENSED CONSOLIDATING BALANCE SHEET
AS OF DECEMBER 31, 2015
(Expressed in thousands) | Parent | Guarantor subsidiaries | Non-guarantor Subsidiaries | Eliminations | Consolidated | ||||||||||||||
ASSETS | |||||||||||||||||||
Cash and cash equivalents | $ | 907 | $ | 2,586 | $ | 59,871 | $ | — | $ | 63,364 | |||||||||
Deposits with clearing organizations | — | — | 49,490 | — | 49,490 | ||||||||||||||
Receivable from brokers, dealers and clearing organizations | — | — | 360,913 | — | 360,913 | ||||||||||||||
Receivable from customers, net of allowance for credit losses of $2,545 | — | — | 840,355 | — | 840,355 | ||||||||||||||
Income tax receivable | 33,801 | 27,536 | — | (50,400 | ) | 10,937 | |||||||||||||
Securities purchased under agreements to resell | — | — | 206,499 | — | 206,499 | ||||||||||||||
Securities owned, including amounts pledged of $546,334 at fair value | — | 1,183 | 734,210 | — | 735,393 | ||||||||||||||
Notes receivable, net of accumulated amortization and allowance for uncollectibles of $54,919 and $8,444, respectively | — | — | 32,849 | — | 32,849 | ||||||||||||||
Office facilities, net of accumulated depreciation of $104,961 | — | 20,793 | 7,497 | — | 28,290 | ||||||||||||||
Loans held for sale, at fair value | — | — | 60,234 | — | 60,234 | ||||||||||||||
Mortgage servicing rights | — | — | 28,168 | — | 28,168 | ||||||||||||||
Subordinated loan receivable | — | 112,558 | — | (112,558 | ) | — | |||||||||||||
Intangible assets | — | — | 31,700 | — | 31,700 | ||||||||||||||
Goodwill | — | — | 137,889 | — | 137,889 | ||||||||||||||
Other assets | 1,201 | 3,224 | 102,458 | — | 106,883 | ||||||||||||||
Deferred tax assets | 317 | 330 | 29,900 | (30,547 | ) | — | |||||||||||||
Investment in subsidiaries | 577,320 | 532,651 | — | (1,109,971 | ) | — | |||||||||||||
Intercompany receivables | 60,187 | 13,185 | — | (73,372 | ) | — | |||||||||||||
Total assets | $ | 673,733 | $ | 714,046 | $ | 2,682,033 | $ | (1,376,848 | ) | $ | 2,692,964 | ||||||||
LIABILITIES AND STOCKHOLDERS' EQUITY | |||||||||||||||||||
Liabilities | |||||||||||||||||||
Drafts payable | $ | — | $ | — | $ | 48,011 | $ | — | $ | 48,011 | |||||||||
Bank call loans | — | — | 100,200 | — | 100,200 | ||||||||||||||
Payable to brokers, dealers and clearing organizations | — | — | 164,546 | — | 164,546 | ||||||||||||||
Payable to customers | — | — | 594,833 | — | 594,833 | ||||||||||||||
Securities sold under agreements to repurchase | — | — | 651,445 | — | 651,445 | ||||||||||||||
Securities sold, but not yet purchased, at fair value | — | — | 126,493 | — | 126,493 | ||||||||||||||
Accrued compensation | — | — | 150,898 | — | 150,898 | ||||||||||||||
Accounts payable and other liabilities | 3,235 | 35,812 | 125,736 | — | 164,783 | ||||||||||||||
Income tax payable | 2,440 | 22,189 | 25,771 | (50,400 | ) | — | |||||||||||||
Senior secured notes | 150,000 | — | — | — | 150,000 | ||||||||||||||
Subordinated indebtedness | — | — | 112,558 | (112,558 | ) | — | |||||||||||||
Deferred tax liabilities | — | — | 47,220 | (30,547 | ) | 16,673 | |||||||||||||
Intercompany payables | — | 62,204 | 11,168 | (73,372 | ) | — | |||||||||||||
Total liabilities | 155,675 | 120,205 | 2,158,879 | (266,877 | ) | 2,167,882 | |||||||||||||
Stockholders' equity | |||||||||||||||||||
Stockholders' equity attributable to Oppenheimer Holdings Inc. | 518,058 | 593,841 | 516,130 | (1,109,971 | ) | 518,058 | |||||||||||||
Noncontrolling interest | — | — | 7,024 | — | 7,024 | ||||||||||||||
Total stockholders' equity | 518,058 | 593,841 | 523,154 | (1,109,971 | ) | 525,082 | |||||||||||||
Total liabilities and stockholders' equity | $ | 673,733 | $ | 714,046 | $ | 2,682,033 | $ | (1,376,848 | ) | $ | 2,692,964 | ||||||||
115
OPPENHEIMER HOLDINGS INC. Notes to Consolidated Financial Statements | ||
OPPENHEIMER HOLDINGS INC.
CONDENSED CONSOLIDATING BALANCE SHEET
AS OF DECEMBER 31, 2014
(Expressed in thousands) | Parent | Guarantor subsidiaries | Non-guarantor Subsidiaries | Eliminations | Consolidated | ||||||||||||||
ASSETS | |||||||||||||||||||
Cash and cash equivalents | $ | 439 | $ | 1,557 | $ | 61,811 | $ | — | $ | 63,807 | |||||||||
Cash and securities segregated for regulatory and other purposes | — | — | 18,594 | — | 18,594 | ||||||||||||||
Deposits with clearing organizations | — | — | 36,510 | — | 36,510 | ||||||||||||||
Receivable from brokers, dealers and clearing organizations | — | — | 314,475 | — | 314,475 | ||||||||||||||
Receivable from customers, net of allowance for credit losses of $2,427 | — | — | 864,189 | — | 864,189 | ||||||||||||||
Income tax receivable | 28,070 | 27,304 | — | (51,134 | ) | 4,240 | |||||||||||||
Securities purchased under agreements to resell | — | — | 251,606 | — | 251,606 | ||||||||||||||
Securities owned, including amounts pledged of $518,123, at fair value | — | 5,806 | 837,349 | — | 843,155 | ||||||||||||||
Notes receivable, net of accumulated amortization and allowance for uncollectibles of $42,211 and $8,606, respectively | — | — | 34,932 | — | 34,932 | ||||||||||||||
Office facilities, net of accumulated depreciation of $103,547 | — | 20,181 | 9,408 | — | 29,589 | ||||||||||||||
Loans held for sale, at fair value | — | — | 19,243 | — | 19,243 | ||||||||||||||
Mortgage servicing rights | — | — | 30,140 | — | 30,140 | ||||||||||||||
Subordinated loan receivable | — | 112,558 | — | (112,558 | ) | — | |||||||||||||
Intangible assets | — | — | 31,700 | — | 31,700 | ||||||||||||||
Goodwill | — | — | 137,889 | — | 137,889 | ||||||||||||||
Other assets | 1,686 | 3,803 | 101,897 | — | 107,386 | ||||||||||||||
Deferred tax assets | 18 | 309 | 27,973 | (28,300 | ) | — | |||||||||||||
Investment in subsidiaries | 565,257 | 544,576 | — | (1,109,833 | ) | — | |||||||||||||
Intercompany receivables | 87,442 | — | — | (87,442 | ) | — | |||||||||||||
Total assets | $ | 682,912 | $ | 716,094 | $ | 2,777,716 | $ | (1,389,267 | ) | $ | 2,787,455 | ||||||||
LIABILITIES AND STOCKHOLDERS' EQUITY | |||||||||||||||||||
Liabilities | |||||||||||||||||||
Drafts payable | $ | — | $ | — | $ | 35,373 | $ | — | $ | 35,373 | |||||||||
Bank call loans | — | — | 59,400 | — | 59,400 | ||||||||||||||
Payable to brokers, dealers and clearing organizations | — | — | 257,161 | — | 257,161 | ||||||||||||||
Payable to customers | — | — | 652,256 | — | 652,256 | ||||||||||||||
Securities sold under agreements to repurchase | — | — | 687,440 | — | 687,440 | ||||||||||||||
Securities sold, but not yet purchased, at fair value | — | — | 92,510 | — | 92,510 | ||||||||||||||
Accrued compensation | — | — | 165,134 | — | 165,134 | ||||||||||||||
Accounts payable and other liabilities | 2,828 | 35,800 | 102,724 | — | 141,352 | ||||||||||||||
Income tax payable | 2,440 | 22,189 | 26,505 | (51,134 | ) | — | |||||||||||||
Senior secured notes | 150,000 | — | — | — | 150,000 | ||||||||||||||
Subordinated indebtedness | — | — | 112,558 | (112,558 | ) | — | |||||||||||||
Deferred tax liabilities | — | 88 | 41,309 | (28,300 | ) | 13,097 | |||||||||||||
Intercompany payables | — | 76,492 | 10,950 | (87,442 | ) | — | |||||||||||||
Total liabilities | 155,268 | 134,569 | 2,243,320 | (279,434 | ) | 2,253,723 | |||||||||||||
Stockholders' equity | |||||||||||||||||||
Stockholders' equity attributable to Oppenheimer Holdings Inc. | 527,644 | 581,525 | 528,308 | (1,109,833 | ) | 527,644 | |||||||||||||
Noncontrolling interest | — | — | 6,088 | — | 6,088 | ||||||||||||||
Total stockholders' equity | 527,644 | 581,525 | 534,396 | (1,109,833 | ) | 533,732 | |||||||||||||
Total liabilities and stockholders' equity | $ | 682,912 | $ | 716,094 | $ | 2,777,716 | $ | (1,389,267 | ) | $ | 2,787,455 | ||||||||
116
OPPENHEIMER HOLDINGS INC. Notes to Consolidated Financial Statements | ||
OPPENHEIMER HOLDINGS INC.
CONDENSED CONSOLIDATING STATEMENT OF OPERATIONS
FOR THE YEAR ENDED DECEMBER 31, 2015
(Expressed in thousands) | Parent | Guarantor subsidiaries | Non-guarantor Subsidiaries | Eliminations | Consolidated | ||||||||||||||
REVENUES | |||||||||||||||||||
Commissions | $ | — | $ | — | $ | 417,559 | $ | — | $ | 417,559 | |||||||||
Advisory fees | — | 1,296 | 282,633 | (3,682 | ) | 280,247 | |||||||||||||
Investment banking | — | — | 102,540 | — | 102,540 | ||||||||||||||
Interest | — | 10,237 | 51,055 | (10,261 | ) | 51,031 | |||||||||||||
Principal transactions, net | — | — | 20,567 | (64 | ) | 20,503 | |||||||||||||
Other | — | 370 | 56,435 | (300 | ) | 56,505 | |||||||||||||
Total revenue | — | 11,903 | 930,789 | (14,307 | ) | 928,385 | |||||||||||||
EXPENSES | |||||||||||||||||||
Compensation and related expenses | 1,185 | — | 622,041 | — | 623,226 | ||||||||||||||
Communications and technology | 142 | — | 66,768 | — | 66,910 | ||||||||||||||
Occupancy and equipment costs | — | — | 63,444 | (300 | ) | 63,144 | |||||||||||||
Clearing and exchange fees | — | — | 26,022 | — | 26,022 | ||||||||||||||
Interest | 13,125 | — | 14,459 | (10,261 | ) | 17,323 | |||||||||||||
Other | 1,663 | 892 | 126,240 | (3,746 | ) | 125,049 | |||||||||||||
Total expenses | 16,115 | 892 | 918,974 | (14,307 | ) | 921,674 | |||||||||||||
Income (loss) before income tax provision (benefit) | (16,115 | ) | 11,011 | 11,815 | — | 6,711 | |||||||||||||
Income tax provision (benefit) | (6,030 | ) | 5,553 | 4,290 | — | 3,813 | |||||||||||||
Equity in earnings of subsidiaries | 12,047 | 6,589 | — | (18,636 | ) | — | |||||||||||||
Net income for the year | 1,962 | 12,047 | 7,525 | (18,636 | ) | 2,898 | |||||||||||||
Less net income attributable to noncontrolling interest, net of tax | — | — | 936 | — | 936 | ||||||||||||||
Net income attributable to Oppenheimer Holdings Inc. | 1,962 | 12,047 | 6,589 | (18,636 | ) | 1,962 | |||||||||||||
Other comprehensive income | — | — | 17 | — | 17 | ||||||||||||||
Total comprehensive income | $ | 1,962 | $ | 12,047 | $ | 6,606 | $ | (18,636 | ) | $ | 1,979 | ||||||||
117
OPPENHEIMER HOLDINGS INC. Notes to Consolidated Financial Statements | ||
OPPENHEIMER HOLDINGS INC.
CONDENSED CONSOLIDATING STATEMENT OF OPERATIONS
FOR THE YEAR ENDED DECEMBER 31, 2014
(Expressed in thousands) | Parent | Guarantor subsidiaries | Non-guarantor Subsidiaries | Eliminations | Consolidated | ||||||||||||||
REVENUES | |||||||||||||||||||
Commissions | $ | — | $ | — | $ | 469,829 | $ | — | $ | 469,829 | |||||||||
Advisory fees | — | 1,139 | 283,785 | (3,244 | ) | 281,680 | |||||||||||||
Investment banking | — | — | 125,598 | — | 125,598 | ||||||||||||||
Interest | — | 10,482 | 49,193 | (10,431 | ) | 49,244 | |||||||||||||
Principal transactions, net | — | 164 | 29,535 | — | 29,699 | ||||||||||||||
Other | — | 477 | 48,362 | (425 | ) | 48,414 | |||||||||||||
Total revenue | — | 12,262 | 1,006,302 | (14,100 | ) | 1,004,464 | |||||||||||||
EXPENSES | |||||||||||||||||||
Compensation and related expenses | 1,047 | — | 663,594 | — | 664,641 | ||||||||||||||
Communications and technology | 145 | — | 67,025 | — | 67,170 | ||||||||||||||
Occupancy and equipment costs | — | — | 63,437 | (425 | ) | 63,012 | |||||||||||||
Clearing and exchange fees | — | — | 24,709 | — | 24,709 | ||||||||||||||
Interest | 14,401 | — | 13,831 | (10,431 | ) | 17,801 | |||||||||||||
Other | 4,626 | 733 | 139,280 | (3,244 | ) | 141,395 | |||||||||||||
Total expenses | 20,219 | 733 | 971,876 | (14,100 | ) | 978,728 | |||||||||||||
Income (loss) before income tax provision (benefit) | (20,219 | ) | 11,529 | 34,426 | — | 25,736 | |||||||||||||
Income tax provision (benefit) | (7,917 | ) | 3,971 | 20,121 | — | 16,175 | |||||||||||||
Equity in earnings of subsidiaries | 21,128 | 13,570 | — | (34,698 | ) | — | |||||||||||||
Net income for the year | 8,826 | 21,128 | 14,305 | (34,698 | ) | 9,561 | |||||||||||||
Less net income attributable to noncontrolling interest, net of tax | — | — | 735 | — | 735 | ||||||||||||||
Net income attributable to Oppenheimer Holdings Inc. | 8,826 | 21,128 | 13,570 | (34,698 | ) | 8,826 | |||||||||||||
Other comprehensive loss | — | — | (2,627 | ) | — | (2,627 | ) | ||||||||||||
Total comprehensive income | $ | 8,826 | $ | 21,128 | $ | 10,943 | $ | (34,698 | ) | $ | 6,199 | ||||||||
118
OPPENHEIMER HOLDINGS INC. Notes to Consolidated Financial Statements | ||
OPPENHEIMER HOLDINGS INC.
CONDENSED CONSOLIDATING STATEMENT OF OPERATIONS
FOR THE YEAR ENDED DECEMBER 31, 2013
(Expressed in thousands) | Parent | Guarantor subsidiaries | Non-guarantor Subsidiaries | Eliminations | Consolidated | ||||||||||||||
REVENUES | |||||||||||||||||||
Commissions | $ | — | $ | — | $ | 486,767 | $ | — | $ | 486,767 | |||||||||
Advisory fees | — | 825 | 276,913 | (3,560 | ) | 274,178 | |||||||||||||
Investment banking | — | — | 97,977 | — | 97,977 | ||||||||||||||
Interest | 5 | 11,128 | 53,401 | (11,318 | ) | 53,216 | |||||||||||||
Principal transactions, net | — | 79 | 43,689 | — | 43,768 | ||||||||||||||
Other | — | 180 | 63,808 | (180 | ) | 63,808 | |||||||||||||
Total revenue | 5 | 12,212 | 1,022,555 | (15,058 | ) | 1,019,714 | |||||||||||||
EXPENSES | |||||||||||||||||||
Compensation and related expenses | 1,124 | — | 674,812 | — | 675,936 | ||||||||||||||
Communications and technology | 119 | — | 65,698 | — | 65,817 | ||||||||||||||
Occupancy and equipment costs | — | — | 66,938 | (180 | ) | 66,758 | |||||||||||||
Clearing and exchange fees | — | — | 24,481 | — | 24,481 | ||||||||||||||
Interest | 17,500 | — | 19,960 | (11,318 | ) | 26,142 | |||||||||||||
Other | 1,309 | 522 | 118,400 | (3,560 | ) | 116,671 | |||||||||||||
Total expenses | 20,052 | 522 | 970,289 | (15,058 | ) | 975,805 | |||||||||||||
Income (loss) before income tax provision (benefit) | (20,047 | ) | 11,690 | 52,266 | — | 43,909 | |||||||||||||
Income tax provision (benefit) | (7,110 | ) | 5,638 | 19,228 | — | 17,756 | |||||||||||||
Equity in earnings of subsidiaries | 37,998 | 31,946 | — | (69,944 | ) | — | |||||||||||||
Net income for the year | 25,061 | 37,998 | 33,038 | (69,944 | ) | 26,153 | |||||||||||||
Less net income attributable to noncontrolling interest, net of tax | — | — | 1,092 | — | 1,092 | ||||||||||||||
Net income attributable to Oppenheimer Holdings Inc. | 25,061 | 37,998 | 31,946 | (69,944 | ) | 25,061 | |||||||||||||
Other comprehensive income (loss) | (3 | ) | — | 1,505 | — | 1,502 | |||||||||||||
Total comprehensive income | $ | 25,058 | $ | 37,998 | $ | 33,451 | $ | (69,944 | ) | $ | 26,563 | ||||||||
119
OPPENHEIMER HOLDINGS INC. Notes to Consolidated Financial Statements | ||
OPPENHEIMER HOLDINGS INC.
CONDENSED CONSOLIDATING STATEMENT OF CASH FLOWS
FOR THE YEAR ENDED DECEMBER 31, 2015
(Expressed in thousands) | Parent | Guarantor subsidiaries | Non-Guarantor Subsidiaries | Eliminations | Consolidated | ||||||||||||||
Cash flows from operating activities: | |||||||||||||||||||
Cash provided by (used in) operating activities | $ | 15,003 | $ | 1,029 | $ | (36,851 | ) | $ | — | $ | (20,819 | ) | |||||||
Cash flows from investing activities: | |||||||||||||||||||
Purchase of office facilities | — | — | (5,889 | ) | — | (5,889 | ) | ||||||||||||
Cash used in investing activities | — | — | (5,889 | ) | — | (5,889 | ) | ||||||||||||
Cash flows from financing activities: | |||||||||||||||||||
Cash dividends paid on Class A non-voting and Class B voting common stock | (6,008 | ) | — | — | — | (6,008 | ) | ||||||||||||
Repurchase of Class A non-voting common stock for cancellation | (8,250 | ) | — | — | — | (8,250 | ) | ||||||||||||
Tax deficiency from share-based awards | (277 | ) | — | — | — | (277 | ) | ||||||||||||
Increase in bank call loans, net | — | 40,800 | — | 40,800 | |||||||||||||||
Cash flow provided by (used in) in financing activities | (14,535 | ) | — | 40,800 | — | 26,265 | |||||||||||||
Net increase (decrease) in cash and cash equivalents | 468 | 1,029 | (1,940 | ) | — | (443 | ) | ||||||||||||
Cash and cash equivalents, beginning of the year | 439 | 1,557 | 61,811 | — | $ | 63,807 | |||||||||||||
Cash and cash equivalents, end of the year | $ | 907 | $ | 2,586 | $ | 59,871 | $ | — | $ | 63,364 | |||||||||
120
OPPENHEIMER HOLDINGS INC. Notes to Consolidated Financial Statements | ||
OPPENHEIMER HOLDINGS INC.
CONDENSED CONSOLIDATING STATEMENT OF CASH FLOWS
FOR THE YEAR ENDED DECEMBER 31, 2014
(Expressed in thousands) | Parent | Guarantor subsidiaries | Non-Guarantor Subsidiaries | Eliminations | Consolidated | ||||||||||||||
Cash flows from operating activities: | |||||||||||||||||||
Cash provided by (used in) operating activities | $ | 49,595 | $ | (29,344 | ) | $ | 58,064 | $ | — | $ | 78,315 | ||||||||
Cash flows from investing activities: | |||||||||||||||||||
Purchase of office facilities | — | — | (4,398 | ) | — | (4,398 | ) | ||||||||||||
Cash used in investing activities | — | — | (4,398 | ) | — | (4,398 | ) | ||||||||||||
Cash flows from financing activities: | |||||||||||||||||||
Cash dividends paid on Class A non-voting and Class B voting common stock | (5,983 | ) | — | — | — | (5,983 | ) | ||||||||||||
Issuance of Class A non-voting common stock | 185 | — | — | — | 185 | ||||||||||||||
Tax benefit from share-based awards | 1,194 | — | — | — | 1,194 | ||||||||||||||
Redemption of senior secured notes | (45,000 | ) | — | — | — | (45,000 | ) | ||||||||||||
Decrease in bank call loans, net | — | — | (58,800 | ) | — | (58,800 | ) | ||||||||||||
Cash flow used in financing activities | (49,604 | ) | — | (58,800 | ) | — | (108,404 | ) | |||||||||||
Net decrease in cash and cash equivalents | (9 | ) | (29,344 | ) | (5,134 | ) | — | (34,487 | ) | ||||||||||
Cash and cash equivalents, beginning of the year | 448 | 30,901 | 66,945 | — | 98,294 | ||||||||||||||
Cash and cash equivalents, end of the year | $ | 439 | $ | 1,557 | $ | 61,811 | $ | — | $ | 63,807 | |||||||||
121
OPPENHEIMER HOLDINGS INC. Notes to Consolidated Financial Statements | ||
OPPENHEIMER HOLDINGS INC.
CONDENSED CONSOLIDATING STATEMENT OF CASH FLOWS
FOR THE YEAR ENDED DECEMBER 31, 2013
(Expressed in thousands) | Parent | Guarantor subsidiaries | Non-Guarantor Subsidiaries | Eliminations | Consolidated | ||||||||||||||
Cash flows from operating activities: | |||||||||||||||||||
Cash provided by (used in) operating activities | $ | 9,944 | $ | (9,757 | ) | $ | (3,616 | ) | $ | — | $ | (3,429 | ) | ||||||
Cash flows from investing activities: | |||||||||||||||||||
Purchase of office facilities | — | — | (14,012 | ) | — | (14,012 | ) | ||||||||||||
Cash used in investing activities | — | — | (14,012 | ) | — | (14,012 | ) | ||||||||||||
Cash flows from financing activities: | |||||||||||||||||||
Cash dividends paid on Class A non-voting and Class B voting common stock | (5,978 | ) | — | — | — | (5,978 | ) | ||||||||||||
Issuance of Class A non-voting common stock | 150 | — | — | — | 150 | ||||||||||||||
Repurchase of Class A non-voting common stock for cancellation | (3,625 | ) | — | — | — | (3,625 | ) | ||||||||||||
Tax deficiency from share-based awards | (78 | ) | — | — | — | (78 | ) | ||||||||||||
Decrease in bank call loans, net | — | — | (10,100 | ) | — | (10,100 | ) | ||||||||||||
Cash flow used in financing activities | (9,531 | ) | — | (10,100 | ) | — | (19,631 | ) | |||||||||||
Net increase (decrease) in cash and cash equivalents | 413 | (9,757 | ) | (27,728 | ) | — | (37,072 | ) | |||||||||||
Cash and cash equivalents, beginning of the year | 35 | 40,658 | 94,673 | — | 135,366 | ||||||||||||||
Cash and cash equivalents, end of the year | $ | 448 | $ | 30,901 | $ | 66,945 | $ | — | $ | 98,294 | |||||||||
122
Item 9. CHANGES IN AND DISAGREEMENTS WITH ACCOUNTANTS ON ACCOUNTING AND FINANCIAL DISCLOSURE
None.
Item 9A. CONTROLS AND PROCEDURES
The Company carried out an evaluation, under the supervision and with the participation of management, including the Chief Executive Officer and Chief Financial Officer, of the effectiveness of the design and operation of its disclosure controls and procedures pursuant to Rule 13a–15(e) of the Exchange Act. Based on this evaluation, the Company's Chief Executive Officer and Chief Financial Officer concluded that the Company's disclosure controls and procedures were effective as of the end of the period covered by this report.
Management, including the Chief Executive Officer and Chief Financial Officer, does not expect that the Company's disclosure controls and procedures or its internal controls will prevent all error and all fraud. A control system, no matter how well conceived and operated, can provide only reasonable, not absolute, assurance that the objectives of the control system are met. Further, the design of a control system must reflect the fact that there are resource constraints and the benefits of controls must be considered relative to their costs. Because of the inherent limitations in all control systems, no evaluation of controls can provide absolute assurance that all control issues and instances of fraud, if any, within the Company have been detected. These inherent limitations include, but are not limited to, the realities that judgments in decision–making can be faulty and that break-downs can occur because of a simple error or omission. Additionally, controls can be circumvented by the individual acts of some persons, by collusion of two or more people, or by management override of the control. The design of any system of controls also is based, in part, upon certain assumptions about the likelihood of future events and there can be no assurance that any design will succeed in achieving its stated goals under all potential future conditions; over time, controls may become inadequate because of changes in conditions, or the degree of compliance with the policies or procedures may deteriorate. Because of the inherent limitations in a cost–effective control system, misstatements due to error or fraud may occur and not be detected.
The Company confirms that its management, including its Chief Executive Officer and its Chief Financial Officer, concluded that the Company's disclosure controls and procedures are effective to ensure that the information required to be disclosed by the Company in its reports filed under the Exchange Act is recorded, processed, summarized and reported within the time periods specified in the rules and forms of the SEC.
Changes in Internal Control over Financial Reporting
No changes in the Company's internal controls over financial reporting (as defined in Rule 13a-15(f) of the Exchange Act) that have materially affected, or are reasonably likely to materially affect, the Company's internal controls over financial reporting, occurred during the quarter ended December 31, 2015.
Management's Report on Internal Control over Financial Reporting and the Report of Independent Registered Public Accounting Firm are set forth in Part II, Item 8 of this Annual Report on Form 10-K.
Section 303A.12(a) CEO Certification
The Company submitted a Section 12(a) CEO Certification to the New York Stock Exchange on June 9, 2015 with respect to fiscal 2014.
Sarbanes-Oxley Act Section 302 CEO and CFO Certifications
The Company submitted the CEO and CFO Certifications required under Section 302 of the Sarbanes-Oxley Act as exhibits to its Annual Report on Form 10-K for the year ended December 31, 2014.
Item 9B. OTHER INFORMATION
None.
123
PART III
Item 10. DIRECTORS, EXECUTIVE OFFICERS AND CORPORATE GOVERNANCE
The information required by this item will be contained under the caption "Election of Directors" in our definitive Proxy Statement for the 2016 Annual Meeting of Stockholders. Information about compliance with Section 16(a) of the Securities Exchange Act of 1934 required by this form will be contained under the caption "Executive Compensation and Related Information - Section 16(a) Beneficial Ownership Reporting Compliance" in that proxy statement. That information is incorporated herein by reference.
STATEMENT OF CORPORATE GOVERNACE PRACTICES, WHISTLEBLOWER POLICY AND COMMITTEE CHARTERS
A copy of the Company’s Statement of Corporate Governance Practices and its Whistleblower Policy, as well as copies of the Charters of the Audit Committee, Compensation Committee, Compliance Committee and Nominating/Corporate Governance Committee, are posted on the Company’s website at www.opco.com. These documents are available at no charge and can be requested by writing to the Company at its head office or by making an email request to info@opco.com.
CODE OF ETHICS
The Company has adopted a Code of Conduct and Business Ethics for Directors, Officers and Employees, which can be found on its website at www.opco.com. This document is available at no charge and can be requested by writing to the Company at its head office or by making an email request to info@opco.com.
Item 11. EXECUTIVE COMPENSATION
The information required by this item will be contained under the caption "Executive Compensation and Related Information" in our definitive Proxy Statement for the 2016 Annual Meeting of Stockholders and is incorporated herein by reference.
Item 12. SECURITY OWNERSHIP OF CERTAIN BENEFICIAL OWNERS AND MANAGEMENT AND RELATED STOCKHOLDER MATTERS
The information required by this item will be contained under the caption "Executive Compensation and Related Information - Security Ownership of Certain Beneficial Owners and Management" in our definitive Proxy Statement for the 2016 Annual Meeting of Stockholders and is incorporated herein by reference.
Item 13. CERTAIN RELATIONSHIPS AND RELATED TRANSACTIONS, AND DIRECTOR INDEPENDENCE
The information required by this item will be contained under the caption "Executive Compensation and Related Information - Certain Relationships and Related Party Transactions" under the sub-heading "Indebtedness of Directors and Executive Officers under (1) Securities Purchase and (2) Other Programs" in our definitive Proxy Statement for the 2016 Annual Meeting of Stockholders and is incorporated herein by reference.
Item 14. PRINCIPAL ACCOUNTANT FEES AND SERVICES
The information required by this item will be contained under the caption "Appointment of Independent Registered Public Accounting Firm – Principal Accounting Fees and Services" in our definitive Proxy Statement for the 2016 Annual Meeting of Stockholders and is incorporated herein by reference.
124
PART IV
Item 15. EXHIBITS AND FINANCIAL STATEMENT SCHEDULES
(a) | (i) Financial Statements |
See Item 8 (pages 56 to 122)
(ii)Financial Statement Schedules
Not Applicable.
(iii)Listing of Exhibits
The exhibits which are filed with this Form 10-K or are incorporated herein by reference are set forth in the Exhibit Index (pages 127 to 130)
(b) | Exhibits |
See the Exhibit Index included hereinafter on pages 127 to 130
(c) | Financial Statement Schedules excluded from the annual report to stockholders |
None
125
SIGNATURES
Pursuant to the requirements of Section 13 or 15(d) of the Securities Exchange Act of 1934, the registrant has duly caused this report to be signed on its behalf by the undersigned, thereunto duly authorized, in the City of New York, State of New York, on the 4th day of March, 2016.
OPPENHEIMER HOLDINGS INC. |
BY: /s/ Jeffrey J. Alfano |
Jeffrey J. Alfano, Chief Financial Officer |
(on behalf of the Registrant) |
Pursuant to the requirements of the Securities Exchange Act of 1934, this report has been signed below by the following persons on behalf of the registrant and in the capacities and on the dates indicated.
Signature | Title | Date | ||
/s/ Jeffrey J. Alfano | Chief Financial Officer (Principal Financial and Accounting Officer) | March 4, 2016 | ||
Jeffrey J. Alfano | ||||
/s/ R. Crystal | Director | March 4, 2016 | ||
R. Crystal | ||||
/s/ W. Ehrhardt | Director | March 4, 2016 | ||
W. Ehrhardt | ||||
/s/ P. Friedman | Director | March 4, 2016 | ||
P. Friedman | ||||
/s/ M.A.M. Keehner | Director | March 4, 2016 | ||
M.A.M. Keehner | ||||
/s/ A.G.Lowenthal | Chairman, Chief Executive Officer (Principal Executive Officer), Director | March 4, 2016 | ||
A.G. Lowenthal | ||||
/s/ R.S. Lowenthal | Director | March 4, 2016 | ||
R.S. Lowenthal | ||||
/s/ K.W. McArthur | Director | March 4, 2016 | ||
K.W. McArthur | ||||
/s/ A.W. Oughtred | Director | March 4, 2016 | ||
A.W. Oughtred | ||||
/s/ E.K. Roberts | Director | March 4, 2016 | ||
E.K. Roberts | ||||
EXHIBIT INDEX
Unless designated by an asterisk indicating that such document has been filed herewith, the Exhibits listed below have been heretofore filed by the Company pursuant to Section 13 or 15(d) of the Exchange Act and are hereby incorporated herein by reference to the pertinent prior filing.
Number | Description | Page | |
2.1 | Asset Purchase Agreement dated as of December 9, 2002 and Amendment No. 1 to the Asset Purchase Agreement dated as of January 2, 2003, by and among Fahnestock Viner Holdings Inc., Viner Finance Inc., Canadian Imperial Bank of Commerce and CIBC World Markets Corp. (previously filed as exhibits to Form 8-K dated January 17, 2003). | ||
2.2 | Asset Management Acquisition Agreement dated as of January 2, 2003, by and among Fahnestock Viner Holdings Inc., Fahnestock & Co. Inc., Canadian Imperial Bank of Commerce and CIBC World Markets Corp. (previously filed as an exhibit to Form 8-K dated January 17, 2003). | ||
2.3 | Amended and Restated Asset Purchase Agreement dated as of January 14, 2008, by and among Oppenheimer Holdings Inc., Oppenheimer & Co. Inc., Canadian Imperial Bank of Commerce, CIBC World Markets Corp. and Certain Other Affiliates of Canadian Imperial Bank of Commerce and Oppenheimer Holdings Inc. (previously filed as an exhibit to Form 10-K for the year ended December 31, 2007). | ||
3.1 | Certificate of Incorporation of Oppenheimer Holdings Inc., a Delaware corporation (previously filed as an exhibit to Form 10-Q for the quarterly period ended June 30, 2009). | ||
3.2 | By-Laws of Oppenheimer Holdings Inc., a Delaware corporation (previously filed as an exhibit to Form 10-Q for the quarterly period ended June 30, 2009). | ||
3.3 | Certificate of Corporate Domestication of Oppenheimer Holdings Inc., a Canadian corporation, as filed with the Secretary of State of the State of Delaware on May 11, 2009 (previously filed as an exhibit to Form 10-Q for the quarterly period ended June 30, 2009). | ||
3.4 | Certificate of Discontinuance of Oppenheimer Holdings Inc., a Canadian corporation, as filed with Corporations Canada on May 11, 2009 (previously filed as an exhibit to Form 10-Q for the quarterly period ended June 30, 2009). | ||
3.5 | Certificate of Continuance of Oppenheimer Holdings Inc. dated May 11, 2005 (previously filed as an exhibit to Form 10-Q for the quarterly period ended June 30, 2005). | ||
3.6 | Bylaws of Oppenheimer Holdings Inc. (previously filed as an exhibit to Form 10-Q for the quarterly period ended June 30, 2005). | ||
4.1 | Exchangeable Debenture dated January 6, 2003, issued by E. A. Viner International Co. to Canadian Imperial Bank of Commerce (previously filed as an exhibit to Form 8-K dated January 17, 2003). | ||
4.2 | Interim Exchangeable Debenture dated January 6, 2003, issued by E. A. Viner International Co. to Canadian Imperial Bank of Commerce (previously filed as an exhibit to Form 8-K dated January 17, 2003). | ||
4.3 | Exchangeable Debenture dated May 17, 2003, issued by E. A. Viner International Co. to Canadian Imperial Bank of Commerce (previously filed as an exhibit to Form 10-K for the year ended December 31, 2003). | ||
4.4 | Variable Rate Exchangeable Debenture, dated July 31, 2006, issued by E. A. Viner International Co. to Canadian Imperial Bank of Commerce. (previously filed as an Exhibit to Form 8-K dated August 3, 2006). | ||
4.5 | Amended and Restated Promissory Note dated January 15, 2003, made by Viner Finance Inc. for the benefit of CIBC World Markets Corp. (previously filed as an exhibit to Form 8-K dated January 17, 2003). | ||
4.6 | Warrant dated January 14, 2008 No. W-A1 (previously filed as an exhibit to Form 10-K for the year ended December 31, 2007). | ||
4.7 | Registration Rights Agreement dated as of January 14, 2008, between Oppenheimer Holdings Inc. and Canadian Imperial Bank of Commerce (previously filed as an exhibit to Form 10-K for the year ended December 31, 2007). | ||
10.1 | Fahnestock Viner Holdings Inc. 1996 Equity Incentive Plan, Amended and Restated as at May 17, 1999 (previously filed as an exhibit to Form S-8 dated May 15, 2000). | ||
127
10.2 | Fahnestock Viner Holdings Inc. 1996 Equity Incentive Plan Amendment No. 1 dated February 29, 2000 (previously filed as an exhibit to Form 10-K for the year ended December 31, 1999). | ||
10.3 | Fahnestock Viner Holdings Inc. 1996 Equity Incentive Plan Amendment No. 2 dated May 19, 2001 (previously filed as an exhibit to Form 10-K for the year ended December 31, 2001). | ||
10.4 | Fahnestock Viner Holdings Inc. 1996 Equity Incentive Plan Amendment No. 3 dated February 28, 2002 (previously filed as an exhibit to Form S-8 dated December 17, 2002). | ||
10.5 | Oppenheimer Holdings Inc. 1996 Equity Incentive Plan Amendment No. 4 dated February 26, 2004 (previously filed as an exhibit to Form S-8 dated July 28, 2004). | ||
10.6 | Oppenheimer Holdings Inc. 1996 Equity Incentive Plan Amendment No. 5 dated March 10, 2005 (previously filed as an exhibit to Form 10-Q for the quarterly period ended June 30, 2005). | ||
10.7 | Employee Share Plan dated January 1, 2005 (previously filed as an exhibit filed to Form 10-Q for the quarterly period ended June 30, 2005). | ||
10.8 | Performance-Based Compensation Agreement between Oppenheimer Holdings Inc. and Albert G. Lowenthal dated March 15, 2005 (previously filed as an exhibit filed to Form 10-Q for the quarterly period ended June 30, 2005). | ||
10.9 | Oppenheimer Holdings Inc. 2006 Equity Incentive Plan effective December 11, 2006 (previously filed as an exhibit to Form S-8 dated October 29, 2007). | ||
10.10 | Clearing Agreement dated January 14, 2008 between CIBC World Markets Corp. and Oppenheimer & Co. Inc. (previously filed as an exhibit to Form 10-K for the year ended December 31, 2007). | ||
10.11 | Secured Credit Arrangement (Loan Trading Platform) dated as of January 14, 2008 by and among OPY Credit Corp., CIBC Inc., and Canadian Imperial Bank of Commerce (previously filed as an exhibit to Form 10-K for the year ended December 31, 2007). | ||
10.12 | Subordinated Credit Agreement dated as of January 14, 2008 by and among E.A. Viner International Co., Canadian Imperial Bank of Commerce and CIBC World Markets Corp. (previously filed as an exhibit to Form 10-K for the year ended December 31, 2007). | ||
10.13 | Warehouse Facility Agreement dated as of January 14, 2008 by and among OPY Credit Corp. and Canadian Imperial Bank of Commerce (previously filed as an exhibit to Form 10-K for the year ended December 31, 2007). | ||
10.14 | Service Agreement dated as of January 14, 2008, by and between CIBC Delaware Holdings Inc. and Oppenheimer & Co. Inc. together with Relocation from 300 Madison Avenue letter dated January 14, 2008 (previously filed as an exhibit to Form 10-K for the year ended December 31, 2007). | ||
10.15 | Securities Purchase Agreement, dated as of July 31, 2006, by and among Oppenheimer Holdings Inc., E. A. Viner International Co. and Canadian Imperial Bank of Commerce. (previously filed as an Exhibit to Form 8-K dated August 3, 2006). | ||
10.16 | Senior Secured Credit Agreement, dated as of July 31, 2006, by and among E. A. Viner International Co., as borrower, and the other credit parties thereto from time to time, as guarantors, and the lenders party thereto from time to time, and Morgan Stanley Senior Funding, Inc., as administrative agent and syndication agent, and Morgan Stanley & Co. Incorporated, as collateral agent. (previously filed as an Exhibit to Form 8-K dated August 3, 2006). | ||
10.17 | Amendment No. 1 to Senior Secured Credit Agreement dated as of July 24, 2006 by and among E.A. Viner International Co., Oppenheimer Holdings Inc., Viner Finance Inc., and Morgan Stanley Senior Funding, Inc. (previously filed as an exhibit to Form 10-K for the year ended December 31, 2007). | ||
10.18 | Amendment No. 2 to Senior Secured Credit Agreement dated as of December 12, 2007, by and among E.A. Viner International Co., Oppenheimer Holdings Inc., Viner Finance Inc., and Morgan Stanley Senior Funding, Inc. (previously filed as an exhibit to Form 10-K for the year ended December 31, 2007). | ||
10.19 | Pledge and Security Agreement, dated as of July 31, 2006, by and among E. A. Viner International Co., as borrower, and the other credit parties thereto from time to time, as guarantors, and Morgan Stanley & Co. Incorporated, as collateral agent. (previously filed as an Exhibit to Form 8-K dated August 3, 2006). | ||
10.20 | Third Amendment to Senior Secured Credit Agreement dated as of December 16, 2008, by and among E.A. Viner International Co., Oppenheimer Holdings Inc., Viner Finance Inc., each of the lenders party to the Existing Credit Agreement and Morgan Stanley Senior Funding, Inc., as administrative agent (previously filed as an Exhibit to Form 8-K dated December 16, 2008). | ||
128
10.21 | Agreement on Certain Outstanding Items, dated November 21, 2008, by and among Canadian Imperial Bank of Commerce, Oppenheimer Holdings Inc., Oppenheimer & Co. Inc. and E.A. Viner International Co. (previously filed as an Exhibit to Form 10-K for the year ended December 31, 2008). | ||
10.22 | Assurance of Discontinuance, dated February 23, 2010, between the Attorney General of the State of New York and Oppenheimer & Co. Inc. (previously filed as an Exhibit to Form 8-K filed February 26, 2010). | ||
10.23 | Offer of Settlement, dated February 22, 2010, between the Commonwealth of Massachusetts Division of Securities and Oppenheimer & Co. Inc., Albert Lowenthal, Robert Lowenthal and Greg White (previously filed as an Exhibit to Form 8-K filed February 26, 2010). | ||
10.24 | Consent Order from the Commonwealth of Massachusetts Division of Securities dated February 26, 2010 (previously filed as an exhibit to Form 10-K for the year ended December 31, 2009). | ||
10.25 | Amended and Restated Performance-Based Compensation Agreement between Oppenheimer Holdings Inc. and Albert G. Lowenthal effective as of January 1, 2010 (previously filed as an exhibit to Form 10-K for the year ended December 31, 2010). | ||
10.26 | Indenture dated as of April 12, 2011 among Oppenheimer Holdings Inc., the subsidiary guarantors, The Bank of New York Mellon Trust Company, N.A., as Trustee and The Bank of New York Mellon Trust Company, as Collateral Agent (previously filed as an exhibit to Form 10-Q for the quarterly period ended March 31, 2011). | ||
10.27 | Registration Rights Agreement dated April 12, 2011 by and among Oppenheimer Holdings Inc., a Delaware corporation, E.A. Viner International Co., a Delaware corporation, Viner Finance Inc., a Delaware corporation and Morgan Stanley & Co. Incorporated, as representative of the several Initial Purchasers (previously filed as an exhibit to Form 10-Q for the quarterly period ended March 31, 2011). | ||
10.28 | Security Agreement by and among Oppenheimer Holdings Inc., as grantor, and each other grantor from time to time party thereto and the Bank of New York Mellon Trust Company, N.A., as Collateral Agent dated as of April 12, 2011 (previously filed as an exhibit to Form 10-Q for the quarterly period ended March 31, 2011). | ||
10.29 | Lease dated July 15, 2011 between 85 Broad Street LLC, Landlord and Viner Finance Inc., Tenant for premises at 85 Broad Street, New York, NY (previously filed as an exhibit to Form 10-Q for the quarterly period ended June 30, 2010). | ||
10.30 | First Amendment to Agreement of Lease dated January 29, 2013 between 85 Broad Street LLC, Landlord and Viner Finance Inc., Tenant for premises at 85 Broad Street, New York, NY (previously filed as an exhibit to Form 10-K for the year ended December 31, 2012). | ||
10.31 | Form of Indemnification Agreement between Oppenheimer Holdings Inc. and the directors of Oppenheimer Holdings Inc., as the Indemnified Party, dated as of October 25, 2012. (previously filed as an exhibit to Form 10-K for the year ended December 31, 2012). | ||
10.32 | Form of Indemnification Agreement between Oppenheimer Holdings Inc. and the officers of Oppenheimer Holdings Inc., as the Indemnified Party, dated as of October 25, 2012. (previously filed as an exhibit to Form 10-K for the year ended December 31, 2012). | ||
10.33 | Oppenheimer & Co. Inc. Executive Deferred Compensation Plan (As Amended and Restated Effective January 1, 2005) (As Further Amended and Restated with respect to Specific Elective Accounts Effective as of March 1, 2013) (previously filed as an exhibit to Form 10-K for the year ended December 31, 2012). | ||
10.34 | Oppenheimer Holdings Inc. 2014 Incentive Plan (previously filed as an exhibit to Form 10-K for the year ended December 31, 2013). | ||
10.35 | SEC Order Instituting Administrative Cease and Desist Proceedings dated January 27, 2015. | ||
10.36 | FinCEN Civil Monetary Assessment dated January 27, 2015. | ||
12 | Oppenheimer Holdings Inc. Computation of Ratio of Earnings to Fixed Charges (filed herewith). | ||
14 | Oppenheimer Holdings Inc. and Oppenheimer & Co. Inc. Code of Conduct and Business Ethics for Directors, Officers and Employees (previously filed as an exhibit to Form 10-Q for the quarterly period ended March 31, 2011). | ||
23.1 | Consent of independent accountants (filed herewith). | ||
31.1 | Certification signed by A.G. Lowenthal (filed herewith). | ||
129
31.2 | Certification signed by Jeffrey J. Alfano (filed herewith). | ||
32.1 | Certification pursuant to 18 U.S.C. Section 1350 signed by A.G. Lowenthal (filed herewith). | ||
32.2 | Certification pursuant to 18 U.S.C. Section 1350 signed by Jeffrey J. Alfano (filed herewith). | ||
101 | Interactive data files pursuant to Rule 405 of Regulation S-T: (i) the Consolidated Balance Sheets as of December 31, 2015 and December 31, 2014, (ii) the Consolidated Statements of Income for the three years ended December 31, 2015, 2014 and 2013, (iii) the Consolidated Statements of Comprehensive Income for the three years ended December 31, 2015, 2014 and 2013, (iv) the Consolidated Statements of Changes in Stockholders’ Equity for the three years ended December 31, 2015, 2014 and 2013, (v) the Consolidated Statements of Cash Flows for the three years ended December 31, 2015, 2014 and 2013, and (vi) the notes to the Consolidated Financial Statements.* | ||
* | This information is furnished and not filed for purposes of Sections 11 and 12 of the Securities Act of 1933 and Section 18 of the Securities Exchange Act of 1934. |
130