Attached files
| file | filename |
|---|---|
| EX-99.1 - EXHIBIT 99.1 - Natera, Inc. | v466471_ex99-1.htm |
| 8-K - 8-K - Natera, Inc. | v466471_8k.htm |
Exhibit 99.2

May 2017 Natera, Inc. Q1 2017 Earnings Call
Not for further reproduction or use Safe Harbor This presentation contains forward - looking statements. All statements other than statements of historical facts contained in thi s presentation, including statements regarding the market opportunity, products, commercial partners, user experience, clinical trials, financial performance, strategies, anticipated fut ure performance and general business conditions of Natera, Inc. (“ Natera ”, the “Company”, “we” or “us”), are forward - looking statements. These forward - looking statements are subject to known and unkno wn risks and uncertainties that may cause actual results to differ materially, including: we face numerous uncertainties and challenges in achieving the financia l g uidance provided; we may be unable to further increase the use and adoption of Panorama, through our direct sales efforts or through our laboratory partners, or to develop and succ ess fully commercialize new products, including our cancer products; we have incurred losses since our inception and we anticipate that we will continue to incur losses for the foresee abl e future; our quarterly results may fluctuate significantly; our estimates of market opportunity and forecasts of market growth may prove to be inaccurate, and even if the market in whic h w e compete achieves the forecasted growth, our business could fail to grow at similar rates; we may be unable to compete successfully with either existing or future prenata l t esting products or other test methods; we may not be successful in commercializing our cloud - based distribution model; our products may not perform as expected; the results of our c linical studies may not support the use of our tests, particularly in the average - risk pregnancy population or for microdeletions screening, or may not be able to be replicated in la ter studies required for regulatory approvals or clearances; if our sole CLIA - certified laboratory facility becomes inoperable, we will be unable to perform our tests and our business will be harmed; we rely on a limited number of suppliers or, in some cases, single suppliers, for some of our laboratory instruments and materials and may not be able to find replacements o r i mmediately transition to alternative suppliers; our cord blood and tissue banking activities are subject to regulations that may impose significant costs and restrictions on us; the mar keting, sale, and use of Panorama and our other products could result in substantial damages arising from product liability or professional liability claims that exceed our resources ; w e may be unable to expand third - party payer coverage and reimbursement for Panorama and our other tests, and we may be required to refund reimbursements already received; third - party pa yers may withdraw coverage or provide lower levels of reimbursement due to changing policies, billing complexities or other factors; if the FDA were to begin actively re gul ating our tests, we could incur substantial costs and delays associated with trying to obtain premarket clearance or approval and incur costs associated with complying with post - market cont rols; we could be subject to third party claims of intellectual property infringement, which could result in litigation or other proceedings and could limit our ability to comm erc ialize our products or services; and any failure to obtain, maintain, and enforce our intellectual property rights could impair our ability to protect our proprietary technology and our br and. We discuss these and other risks and uncertainties in greater detail in the sections entitled “Risk Factors” and "Management's Discussion and Analysis of Financial Condition and R esu lts of Operations" in our Form 10 - Q for the quarter ended March 31, 2017. Further information on potential risks that could affect actual results will be included in other filin gs we make with the SEC from time to time. Given these uncertainties, you should not place undue reliance on the forward - looking statements. Moreover, we operate in a very competitiv e and rapidly changing environment. New risks emerge from time to time. It is not possible for our management to predict all risks, nor can we assess the impact of all fac tor s on its business or the extent to which any factor, or combination of factors, may cause actual results to differ materially from those contained in any forward - looking statement. In light of these risks, uncertainties and assumptions, the forward - looking events and circumstances discussed in this presentation may not occur and actual results could differ materially and adversely from those anticipated or implied. Except as required by law, neither we nor any other person assumes responsibility for the accuracy and completeness of the fo rwa rd - looking statements. We undertake no obligation to update publicly any forward - looking statements for any reason after the date of this presentation to conform these statements to actual results or to changes in our expectations. We file reports, proxy statements, and other information with the SEC. Such reports, proxy statements, and other information con cer ning us can be read and copied at the SEC’s Public Reference Room at 100 F Street, N.E., Room 1580, Washington, D.C. 20549 or on the Internet at http://www.sec.gov . Please call the SEC at 1 - 800 - SEC - 0330 for further information on the Public Reference Room. Our common stock is listed on the NASDAQ Global Select Market, and these reports, proxy statements an d other information are also available for inspection at the offices of the NASDAQ Stock Market, Inc. located at 1735 K Street, NW, Washington, D.C. 20006. We will prov ide without charge upon written or oral request a copy of any or all of the documents that are incorporated by reference into this prospectus, other than exhibits which are specifi cal ly incorporated by reference into such documents. Requests should be directed to our Investor Relations department at Natera, Inc., 201 Industrial Road, Suite 410, San Carlos, Ca lifornia 94070. Our telephone number is (650) 249 - 9090. 2 May 2017
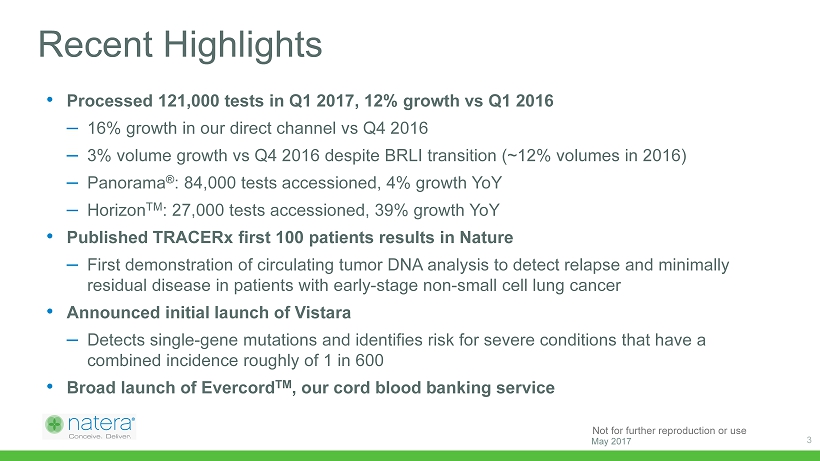
Not for further reproduction or use Recent Highlights 3 • Processed 121,000 tests in Q1 2017, 12% growth vs Q1 2016 – 16% growth in our direct channel vs Q4 2016 – 3% volume growth vs Q4 2016 despite BRLI transition (~12% volumes in 2016) – Panorama ® : 84,000 tests accessioned, 4% growth YoY – Horizon TM : 27,000 tests accessioned, 39% growth YoY • Published TRACERx first 100 patients results in Nature – First demonstration of circulating tumor DNA analysis to detect relapse and minimally residual disease in patients with early - stage non - small cell lung cancer • Announced initial launch of Vistara – Detects single - gene mutations and identifies risk for severe conditions that have a combined incidence roughly of 1 in 600 • Broad launch of Evercord TM , our cord blood banking service May 2017
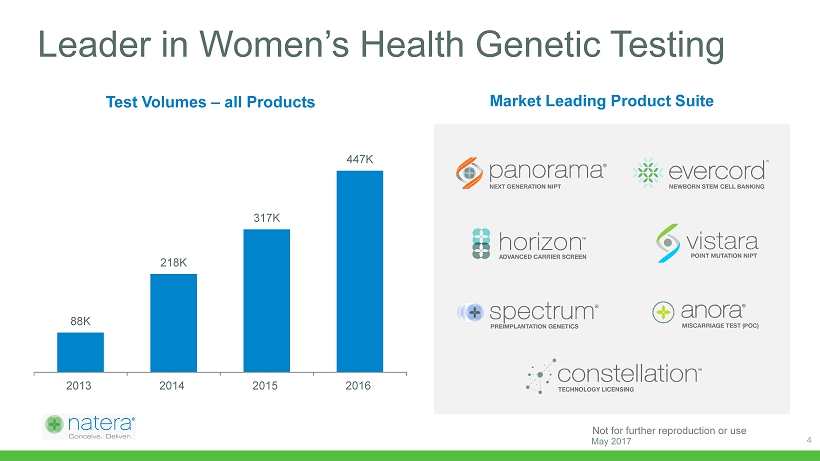
Not for further reproduction or use 88K 218K 317K 447K 2013 2014 2015 2016 Leader in Women’s Health Genetic Testing 4 Test Volumes – all Products Market Leading Product Suite May 2017
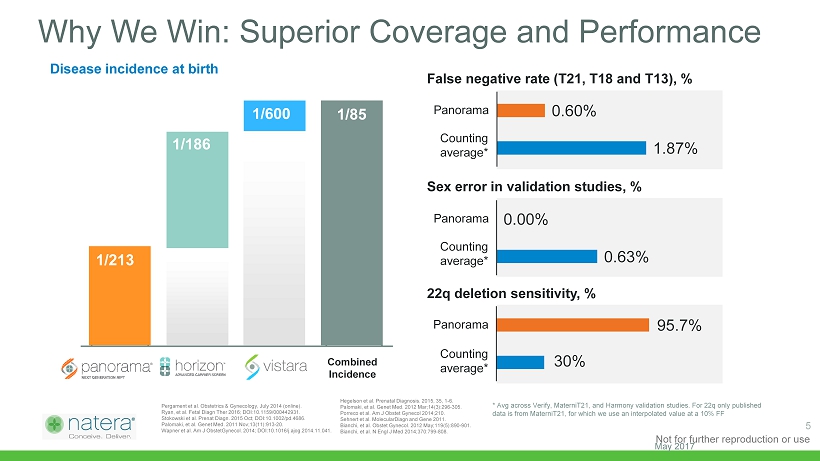
Not for further reproduction or use Disease incidence at birth 1.87% 0.60% False negative rate (T21, T18 and T13), % Panorama Counting average* 0.63% 0.00% Sex error in validation studies, % Panorama Counting average* 30% 95.7% 22q deletion sensitivity, % Panorama Counting average* 3 Nicolaides, et al. Prenatal Diagnosis 2013; DOI:10.1002/pd.4103. Pergament et al. Obstetrics & Gynecology, July 2014 (online). Ryan, et al. Fetal Diagn Ther 2016; DOI:10.1159/000442931. Stokowski et al. Prenat Diagn . 2015 Oct; DOI:10.1002/pd.4686. Palomaki , et al. Genet Med. 2011 Nov;13(11):913 - 20. Wapner et al. Am J ObstetGynecol . 2014; DOI:10.1016/j.ajog.2014.11.041. Hegelson et al. Prenatal Diagnosis. 2015, 35, 1 - 6. Palomaki , et al. Genet Med. 2012 Mar;14(3):296 - 305. Porreco et al. Am J Obstet Gynecol 2014;210. Sehnert et al. MolecularDiagn and Gene 2011. Bianchi, et al. Obstet Gynecol. 2012 May;119(5):890 - 901. Bianchi, et al. N Engl J Med 2014;370:799 - 808. * Avg across Verify, MaterniT21, and Harmony validation studies. For 22q only published data is from MaterniT21, for which we use an interpolated value at a 10% FF Why We Win: Superior Coverage and Performance Panorama Horizon Vistara Total 1/213 1/600 1/85 Combined Incidence 1/186 5 May 2017
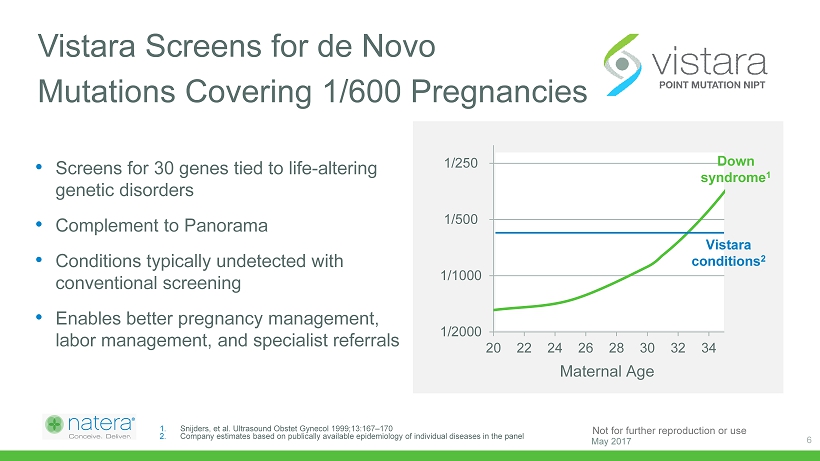
Not for further reproduction or use Vistara Screens for de Novo Mutations Covering 1/600 Pregnancies 6 • Screens for 30 genes tied to life - altering genetic disorders • Complement to Panorama • Conditions typically undetected with conventional screening • Enables better pregnancy management, labor management, and specialist referrals 1. Snijders, et al. Ultrasound Obstet Gynecol 1999;13:167 – 170 2. Company estimates based on publically available epidemiology of individual diseases in the panel 1/2000 1/1000 1/500 1/250 20 22 24 26 28 30 32 34 Vistara conditions 2 Down syndrome 1 Maternal Age May 2017
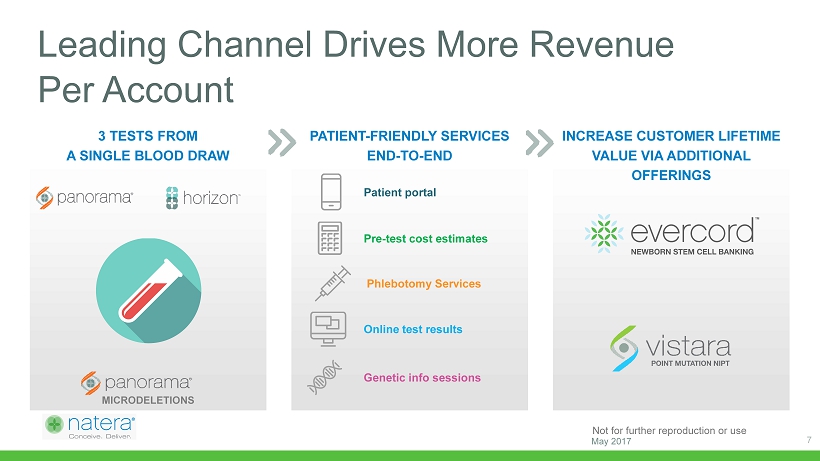
Not for further reproduction or use Leading Channel Drives More Revenue Per Account 7 Genetic info sessions Online test results Phlebotomy Services Pre - test cost estimates Patient portal 3 TESTS FROM A SINGLE BLOOD DRAW PATIENT - FRIENDLY SERVICES END - TO - END INCREASE CUSTOMER LIFETIME VALUE VIA ADDITIONAL OFFERINGS MICRODELETIONS May 2017
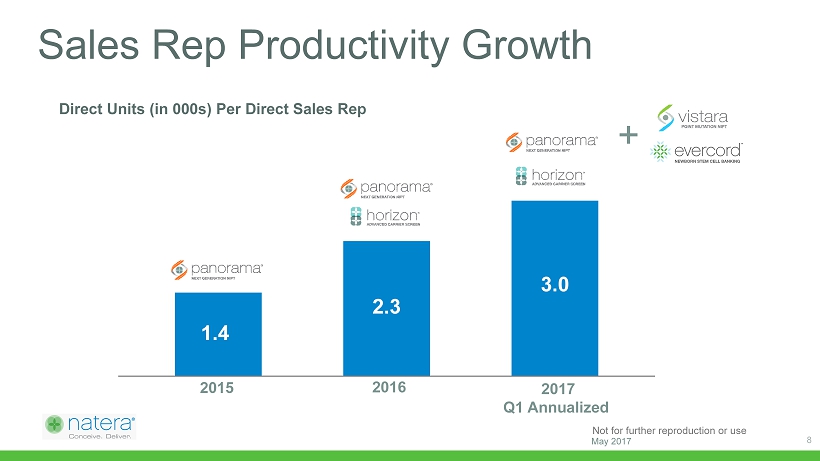
Not for further reproduction or use 1.4 2.3 3.0 0.0 0.5 1.0 1.5 2.0 2.5 3.0 3.5 2015 2016 2017 Q1 Annualized Direct Units (in 000s) Per Direct Sales Rep + Sales Rep Productivity Growth 8 May 2017
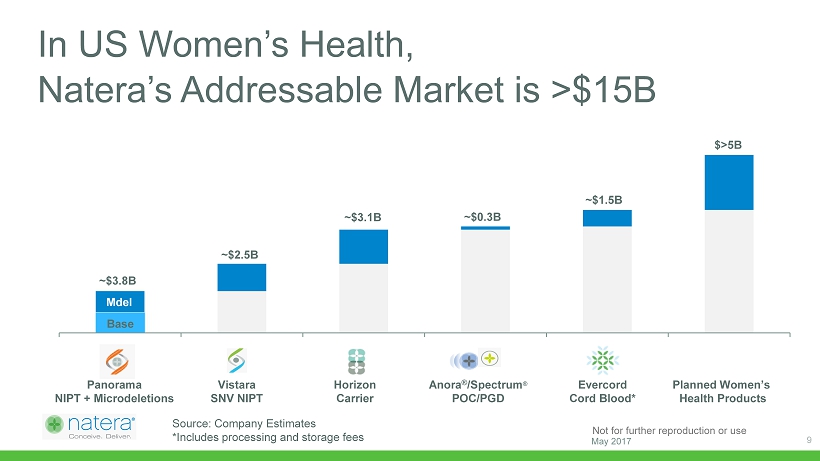
Not for further reproduction or use In US Women’s Health, Natera’s Addressable Market is >$15B Source: Company Estimates *Includes processing and storage fees Panorama Vistara Horizon Spectrum/Anora Cord Blood Upcominig WH Base ~$2.5B ~$3.8B ~$1.5B ~$3.1B ~$0.3B $>5B Mdel Panorama NIPT + Microdeletions Vistara SNV NIPT Horizon Carrier Anora ® /Spectrum ® POC/PGD Evercord Cord Blood* Planned Women’s Health Products 9 May 2017
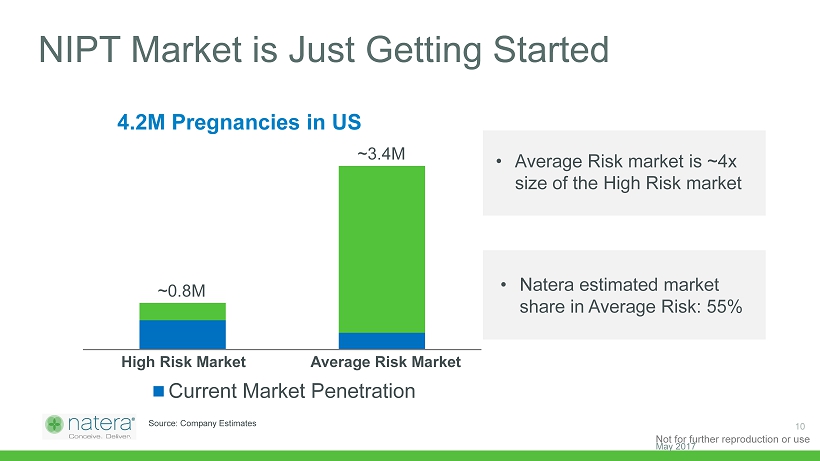
Not for further reproduction or use NIPT Market is Just Getting Started 0 1 1 2 2 3 3 4 4 5 Current Market Penetration High Risk Market Average Risk Market ~0.8M ~3.4M • Average Risk market is ~4x size of the High Risk market 4.2M Pregnancies in US Source: Company Estimates • Natera estimated market share in Average Risk: 55% May 2017 10
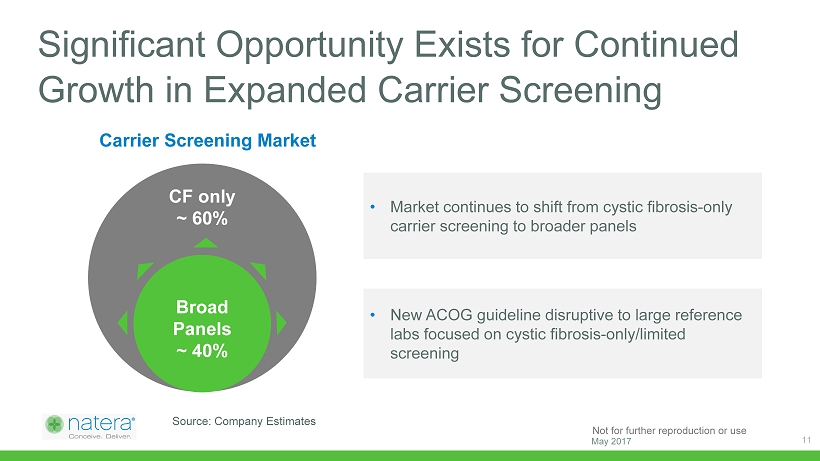
Not for further reproduction or use Significant Opportunity Exists for Continued Growth in Expanded Carrier Screening Source: Company Estimates • Market continues to shift from cystic fibrosis - only carrier screening to broader panels CF only ~ 60% Broad Panels ~ 40% • New ACOG guideline disruptive to large reference labs focused on cystic fibrosis - only/limited screening 11 Carrier Screening Market May 2017
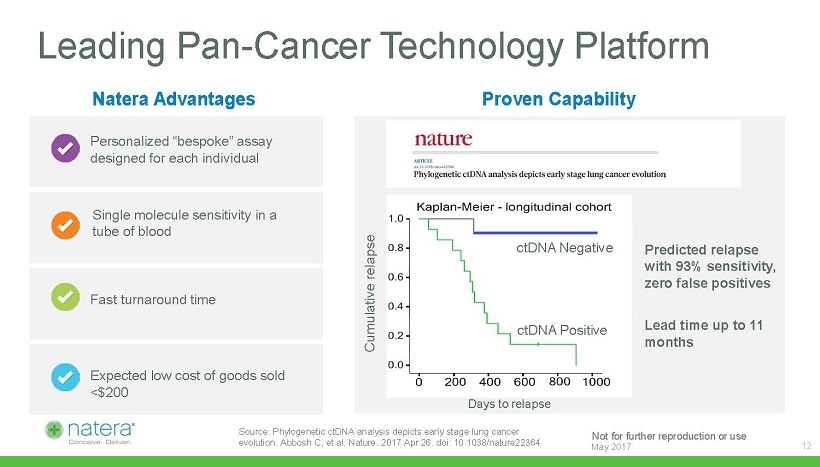
Not for further reproduction or use x Leading Pan - Cancer Technology Platform Single molecule sensitivity in a tube of blood Personalized “bespoke” assay designed for each individual Fast turnaround time Expected low cost of goods sold <$200 • Predicted relapse with 93% sensitivity, zero false positives • Lead time up to 11 months Cumulative relapse ctDNA Positive ctDNA Negative Source: Phylogenetic ctDNA analysis depicts early stage lung cancer evolution . Abbosh C, et al. Nature. 2017 Apr 26. doi : 10.1038/nature22364 12 Natera Advantages Proven Capability Days to relapse May 2017
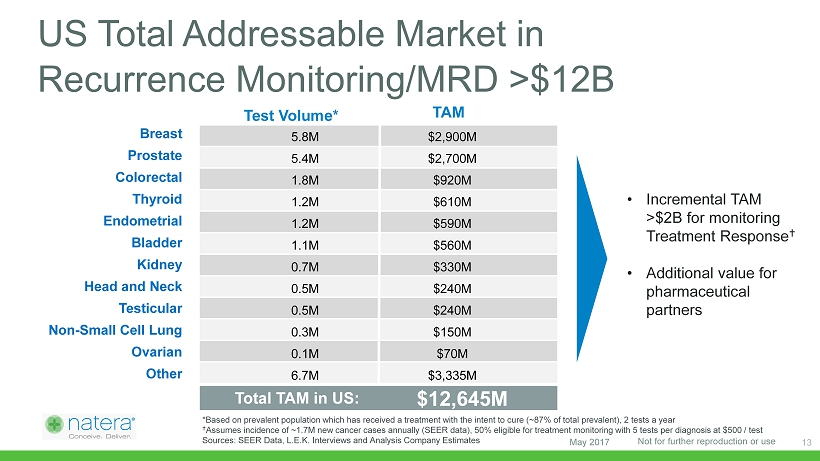
Not for further reproduction or use Prostate Colorectal Thyroid Endometrial Bladder Kidney Head and Neck Testicular Non - Small Cell Lung Ovarian Other Total TAM in US : $12,645M M Breast Test Volume* TAM 5.8M $2,900M 5.4M $2,700M 1.8M $920M 1.2M $610M 1.2M $590M 1.1M $560M 0.7M $330M 0.5M $240M 0.5M $240M 0.3M $150M 0.1M $70M 6.7M $3,335M • Incremental TAM >$2B for monitoring Treatment Response • Additional value for pharmaceutical partners US Total Addressable Market in Recurrence Monitoring/MRD >$12B *Based on prevalent population which has received a treatment with the intent to cure (~87% of total prevalent), 2 tests a year Assumes incidence of ~1.7M new cancer cases annually (SEER data), 50% eligible for treatment monitoring with 5 tests per diag nos is at $500 / test Sources: SEER Data, L.E.K. Interviews and Analysis Company Estimates 13 Not for further reproduction or use May 2017
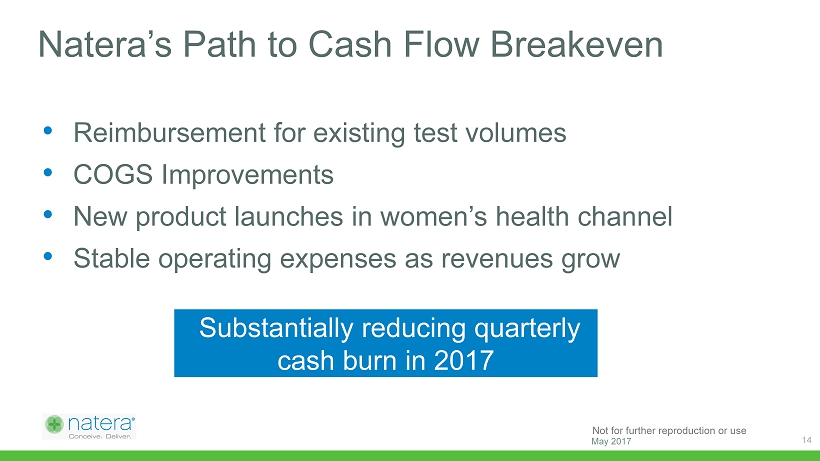
Not for further reproduction or use Natera’s Path to Cash Flow Breakeven • Reimbursement for existing test volumes • COGS Improvements • New product launches in women’s health channel • Stable operating expenses as revenues grow Substantially reducing quarterly cash burn in 2017 14 May 2017
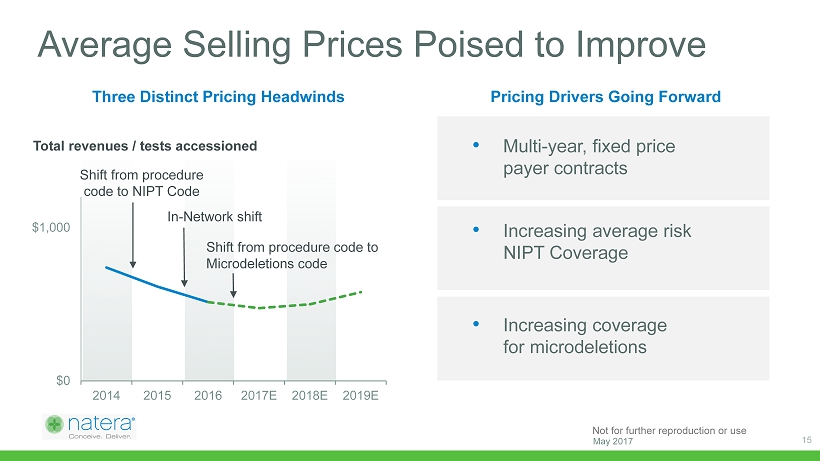
Not for further reproduction or use $0 $1,000 2014 2015 2016 2017E 2018E 2019E Average Selling Prices Poised to Improve • Multi - year, fixed price payer contracts • Increasing average risk NIPT Coverage • Increasing coverage for microdeletions Shift from procedure code to NIPT Code In - Network shift Shift from procedure code to Microdeletions code Total revenues / tests accessioned 15 Three Distinct Pricing Headwinds Pricing Drivers Going Forward May 2017
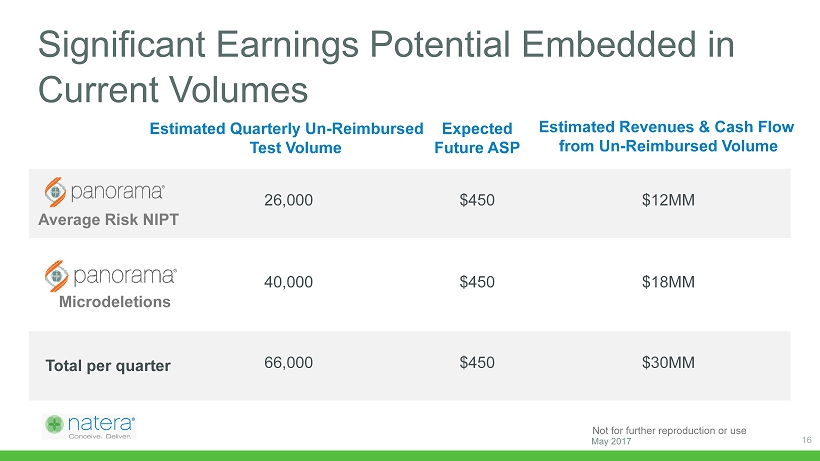
Not for further reproduction or use Significant Earnings Potential Embedded in Current Volumes Estimated Quarterly Un - Reimbursed Test Volume Expected Future ASP Estimated Revenues & Cash Flow from Un - Reimbursed Volume Average Risk NIPT 26,000 $450 $12MM Microdeletions 40,000 $450 $18MM Total per quarter 66,000 $450 $30MM 16 May 2017
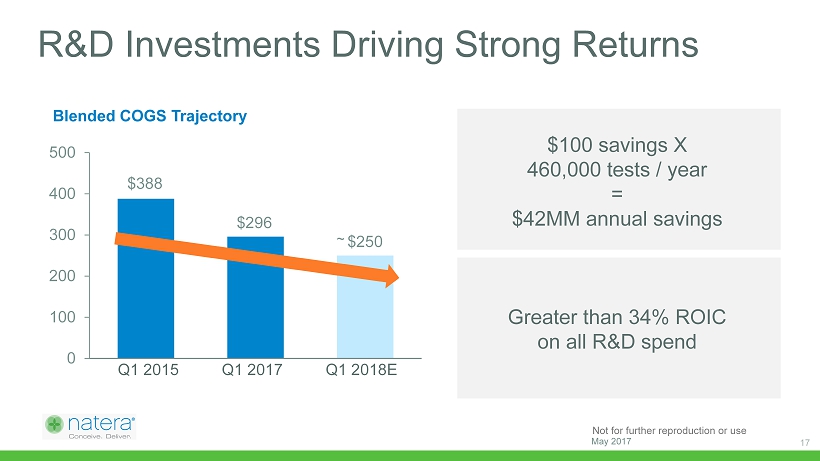
Not for further reproduction or use $388 $296 $250 0 100 200 300 400 500 Q1 2015 Q1 2017 R&D Investments Driving Strong Returns 17 Q1 2018E ~ Blended COGS Trajectory $100 savings X 460,000 tests / year = $42MM annual savings Greater than 34% ROIC on all R&D spend May 2017
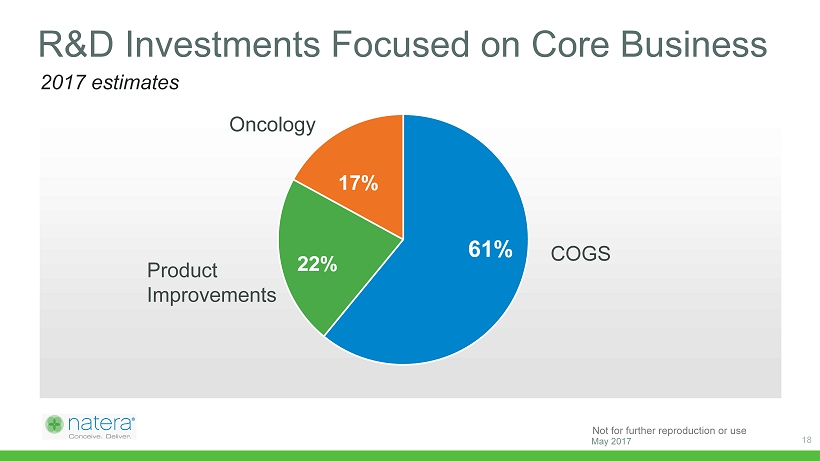
Not for further reproduction or use R&D Investments Focused on Core Business 18 61% 22% 17% COGS Oncology Product Improvements May 2017 2017 estimates
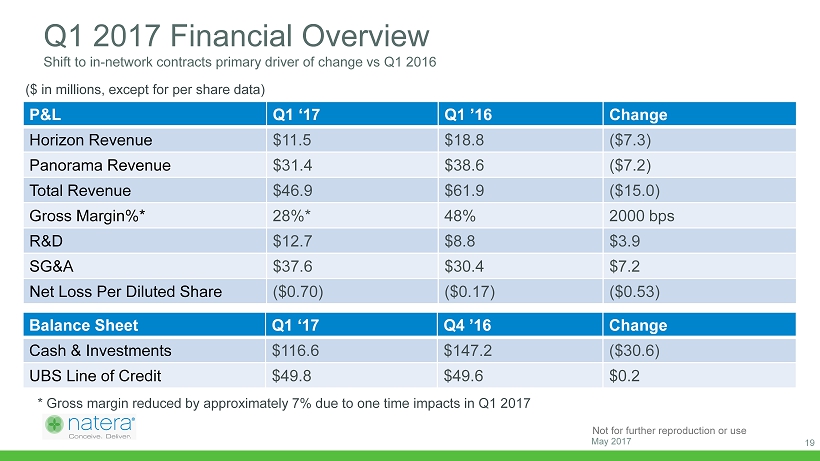
Not for further reproduction or use Q1 2017 Financial Overview Shift to in - network contracts primary driver of change vs Q1 2016 P&L Q1 ‘17 Q1 ’16 Change Horizon Revenue $11.5 $18.8 ($7.3) Panorama Revenue $31.4 $38.6 ($7.2) Total Revenue $46.9 $61.9 ($15.0) Gross Margin%* 28%* 48% 2000 bps R&D $12.7 $8.8 $3.9 SG&A $37.6 $30.4 $7.2 Net Loss Per Diluted Share ($0.70) ($0.17) ($0.53) Balance Sheet Q1 ‘17 Q4 ’16 Change Cash & Investments $116.6 $147.2 ($30.6) UBS Line of Credit $49.8 $49.6 $0.2 * Gross margin reduced by approximately 7% due to one time impacts in Q1 2017 ($ in millions, except for per share data) May 2017 19
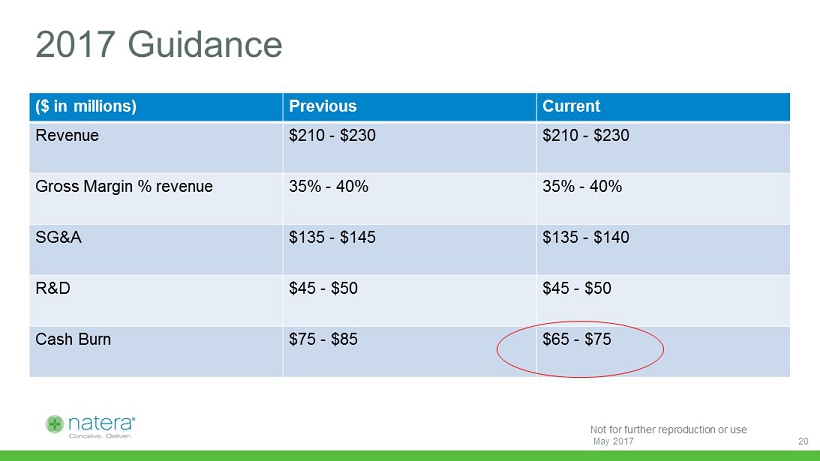
Not for further reproduction or use 2017 Guidance ($ in millons ) Previous Current Revenue $210 - $230 $210 - $230 Gross Margin % revenue 35% - 40% 35% - 40% SG&A $135 - $145 $135 - $145 R&D $45 - $50 $45 - $50 Cash Burn $75 - $85 $65 - $75 May 2017 20