Attached files
| file | filename |
|---|---|
| EX-99.2 - EXHIBIT 99.2 - FIRST KEYSTONE CORP | v466284_ex99-2.htm |
| 8-K - FORM 8-K - FIRST KEYSTONE CORP | v466284_8k.htm |
Exhibit 99.1

First Keystone Corporation Annual Stockholders’ Meeting May 4, 2017

Matthew Prosseda President and CEO This presentation contains certain forward - looking statements, which are included pursuant to the “safe harbor” provisions of the Private Securities Litigation Reform Act of 1995 , and reflect management’s beliefs and expectations based on information currently available . These forward - looking statements are inherently subject to significant risks and uncertainties, including changes in general economic and financial market conditions, the Corporation’s ability to effectively carry out its business plans and changes in regulatory or legislative requirements . Other factors that could cause or contribute to such differences are changes in competitive conditions, and pending or threatened litigation . Although management believes the expectations reflected in such forward - looking statements are reasonable, actual results may differ materially . Welcome

First Keystone Community Bank Nescopeck Branch Vault

First Keystone Community Bank Nescopeck Branch Vault

Jeff Wozniak VP, Information Security Officer, IT Manager Securing our Future

Cybercriminals – AKA: Hackers Any individual or group that uses technology for the purpose of committing a crime…

Type of Social Engineering - The use of e - mails that appear to originate from a trusted source to trick a user into entering valid credentials at a fake website. Phishing People are the biggest vulnerability!

1 in 14 computer users are clicking on phishing emails! Phishing Average Identity Theft Loss is approximately $8,000.


2016 Statistics: ( Source: 2016 Data breach Investigations Report) - 42,000 reported Cybersecurity incidents. - 1,935 reported breaches - #1 target? How bad is it?

.Bank

Speakin g of Email…

EMV – ( Europay , Mastercard , and Visa )

Tokenization


Security vs. Agility

- Email: 1) Look at the sender address. Spelling mistakes? jwozniak@fkc.bank.com jwzniak@fkbank.net 2) Do you know the sender? 3) Is it to good to be true? 4) Is the email marked “urgent”? 5) Hover over the link – Does the domain match? 6) When in doubt? Skip the link! Top Recommendations to Stay Safe:

- Patch your computer. - Windows, Java, Adobe - Use antivirus. - Beware of popups. Top Recommendations to Stay Safe:

Matthew Prosseda President and CEO

$ Amounts in thousands

$812,980 $838,560 $900,952 $954,593 $985,089 $747,579 $765,696 $825,683 $881,892 $910,637 $725,000 $775,000 $825,000 $875,000 $925,000 $975,000 $1,025,000 2012 2013 2014 2015 2016 Average Total Assets Average Earning Assets Average Total and Earning Assets (amounts in thousands)

$423,580 $436,040 $468,470 $509,605 $518,145 $321,208 $321,627 $356,043 $370,061 $389,176 $280,000 $330,000 $380,000 $430,000 $480,000 $530,000 $580,000 2012 2013 2014 2015 2016 Loans Investments Average Loan and Investment Balances (amounts in thousands)

5.45% 4.83% 4.51% 4.35% 4.33% 4.58% 3.85% 3.28% 3.14% 2.97% 2.50% 3.00% 3.50% 4.00% 4.50% 5.00% 5.50% 6.00% 2012 2013 2014 2015 2016 Loan Yields Investment Yields Loan and Investment Yields (tax equivalent)

$23,103 $21,081 $21,127 $22,143 $22,420 $14,493 $12,252 $11,663 $11,638 $11,564 $10,000 $15,000 $20,000 $25,000 2012 2013 2014 2015 2016 Loan Income Investment Income Loan and Investment Income (tax equivalent) (amounts in thousands)
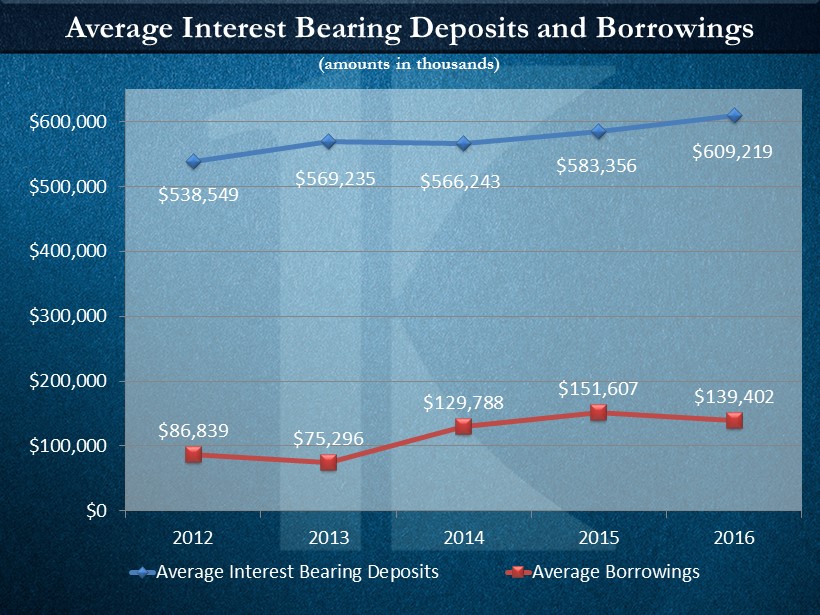
$538,549 $569,235 $566,243 $583,356 $609,219 $86,839 $75,296 $129,788 $151,607 $139,402 $0 $100,000 $200,000 $300,000 $400,000 $500,000 $600,000 2012 2013 2014 2015 2016 Average Interest Bearing Deposits Average Borrowings Average Interest Bearing Deposits and Borrowings (amounts in thousands)

0.85% 0.64% 0.52% 0.54% 0.56% 2.25% 1.77% 1.15% 1.19% 1.33% 0.00% 1.00% 2.00% 3.00% 2012 2013 2014 2015 2016 Deposits Borrowings Liability Costs | Deposit and Borrowing Costs

$4,556 $3,623 $2,954 $3,159 $3,425 $1,958 $1,331 $1,498 $1,807 $1,857 $0 $1,000 $2,000 $3,000 $4,000 $5,000 2012 2013 2014 2015 2016 Deposit Interest Borrowing Interest Interest Expense | Deposit and Borrowing Expense (amounts in thousands)

4.24% 3.79% 3.45% 3.30% 3.18% 3.62% 3.54% 3.43% 3.36% 3.26% 3.00% 3.30% 3.60% 3.90% 4.20% 2012 2013 2014 2015 2016 First Keystone Community Bank Peer Banks Net Interest Margin – Source: FFIEC UBPR
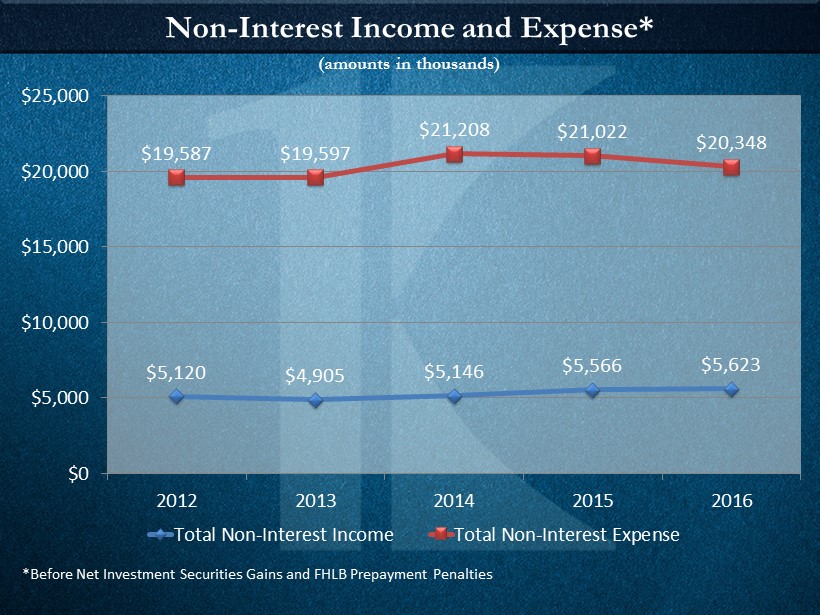
$5,120 $4,905 $5,146 $5,566 $5,623 $19,587 $19,597 $21,208 $21,022 $20,348 $0 $5,000 $10,000 $15,000 $20,000 $25,000 2012 2013 2014 2015 2016 Total Non-Interest Income Total Non-Interest Expense *Before Net Investment Securities Gains and FHLB Prepayment Penalties Non - Interest Income and Expense* (amounts in thousands)

$10,170 $10,273 $10,211 $9,172 $9,472 $9,000 $9,250 $9,500 $9,750 $10,000 $10,250 $10,500 2012 2013 2014 2015 2016 Net Income After Taxes (amounts in thousands)

1.25% 1.23% 1.13% 0.97% 0.94% 1.16% 1.06% 1.02% 0.93% 0.92% 0.85% 0.95% 1.05% 1.15% 1.25% 2012 2013 2014 2015 2016 First Keystone Community Bank Peer Banks Return on Assets – Source: FFIEC UBPR

10.07% 10.46% 10.40% 9.07% 8.77% 11.09% 10.06% 9.13% 8.33% 8.30% 7.50% 8.50% 9.50% 10.50% 11.50% 2012 2013 2014 2015 2016 First Keystone Community Bank Peer Banks Return on Equity – Source: FFIEC UBPR

$1.86 $1.87 $1.84 $1.64 $1.68 $1.01 $1.04 $1.05 $1.08 $1.08 $0.80 $1.00 $1.20 $1.40 $1.60 $1.80 $2.00 2012 2013 2014 2015 2016 Earnings Dividends Earnings and Dividends per Share

Income Statement Net Interest Income +Non - Interest Income =Operating Revenue - Loan Loss Provision =Pre - Tax Income - Income Tax Expense =Net Income Earnings Per Share 3 Months Ended March 31, 2017 3 Months Ended March 31, 2016 %Change $6,478 1,538 $8,016 83 5,263 $2,670 384 $2,286 (2.7) 18.3 0.7 (70.7) 2.4 5.3 6.7 5.1 - Non - Interest Expense $0.40 2.6 $ 6,659 1,300 $7,959 283 5,140 $2,536 360 $ 2,176 $ 0.39 Unaudited (amounts in thousands, except per share data)

Balance Sheet Cash & Cash Equivalents Investment Securities Net Loans Premises & Equip., Net Other Assets Total Assets Non - Interest Bearing Deposits Interest Bearing Deposits Total Deposits Borrowings Other Liabilities Stockholders’ Equity Liabilities and Stockholders’ Equity $ 11,436 400,011 517,528 18,959 54,451 $1,002,385 16.6 3.4 0.9 (4.4) 5.7 2.2 March 31, 2017 March 31, 2016 % Change $ 130,637 601,949 $732,586 150,010 8,214 111,575 $1,002,385 12.3 (1.3) 0.9 10.3 52.3 (1.8) 2.2 $ 9,811 386,834 512,848 19,827 51,506 $ 980,826 $ 116,349 609,550 $725,899 135,953 5,393 113,581 $ 980,826 Unaudited (amounts in thousands)

40 90 140 190 240 12/31/06 12/31/07 12/31/08 12/31/09 12/31/10 12/31/11 12/31/12 12/31/13 12/31/14 12/31/15 12/31/16 First Keystone Corporation NASDAQ Composite SNL Bank $500M-$1B First Keystone Corporation – 10 year Total Return Performance

THANK YOU FOR ATTENDING! Our Key To a great bank is you!

Robert E. Bull Chairman