Attached files
| file | filename |
|---|---|
| EX-99.2 - EXHIBIT 99.2 - MUTUALFIRST FINANCIAL INC | v466239_ex99-2.htm |
| 8-K - FORM 8-K - MUTUALFIRST FINANCIAL INC | v466239_8-k.htm |
Exhibit 99.1

2017 Annual Meeting

Forward Looking Statement This presentation contains statements which constitute forward looking statements within the meaning of the Private Securities Litigation Reform Act of 1995. These statements may appear in a number of places in this presentation and include statements regarding the intent, belief, outlook, estimate or expectations of the company, its directors or its officers primarily with respect to future events and the future financial performance of the company, including but not limited to preliminary estimated ProForma combined financial information. Readers of this presentation are cautioned that any such forward looking statements are not guarantees of future events or performance and involve risk and uncertainties, and that actual results may differ materially from those in the forward looking statements as a result of various factors. These factors include, but are not limited to, the loss of deposits and loan demand to competitors; substantial changes in financial markets; changes in real estate values and the real estate market; regulatory changes; or other risk factors discussed in the latest SEC form 10 - k. The Company does not undertake – and specifically disclaims any obligation – to publicly release the result of any revisions which may be made to any forward - looking statements to reflect events or circumstances after the date of such statements or to reflect the occurrence of anticipated or unanticipated events.

Record Setting Year

Because of talented staff

Stock price momentum

…Amidst a circus
Expectations • Tax R elief • Regulatory Relief • Higher Interest R ates • Continued Loan D emand

Uncertain roads ahead

Focusing on what we can control
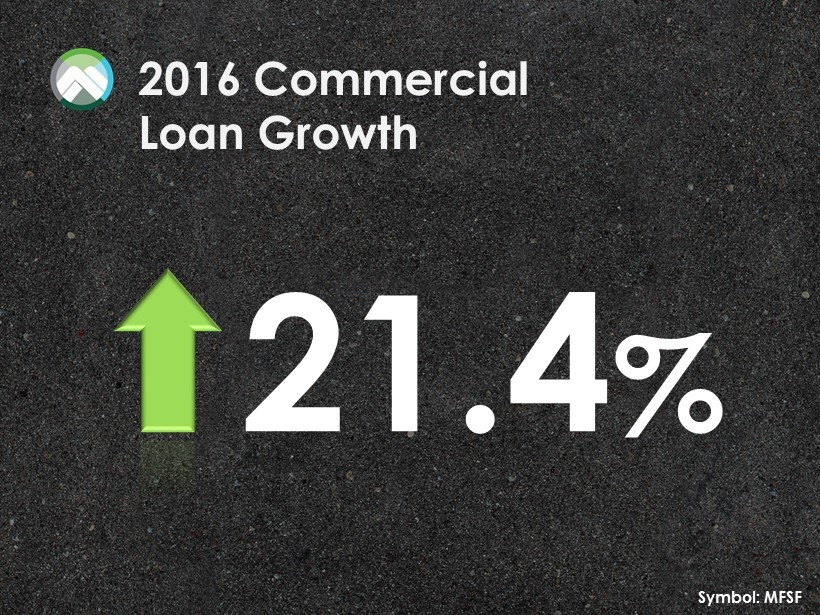
2016 Commercial Loan Growth 21.4 % Symbol: MFSF
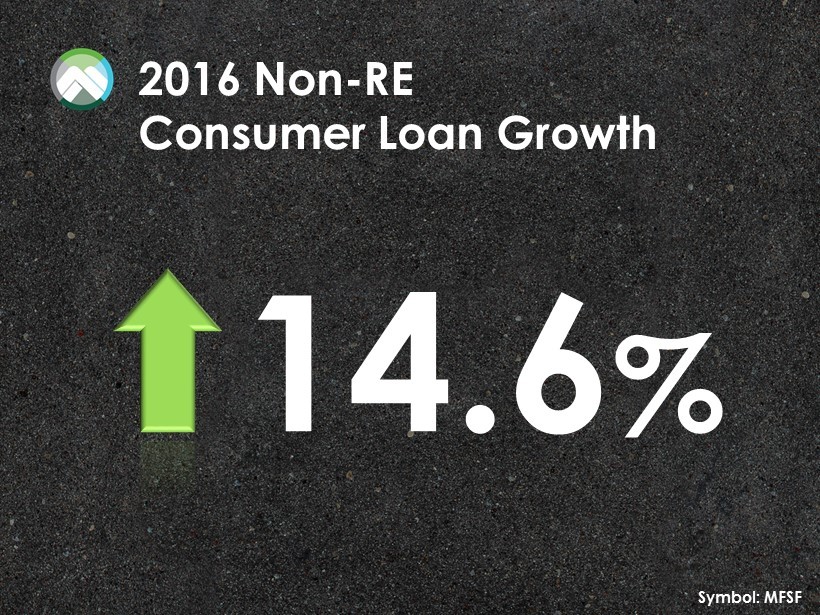
2016 Non - RE Consumer Loan Growth 14.6 % Symbol: MFSF
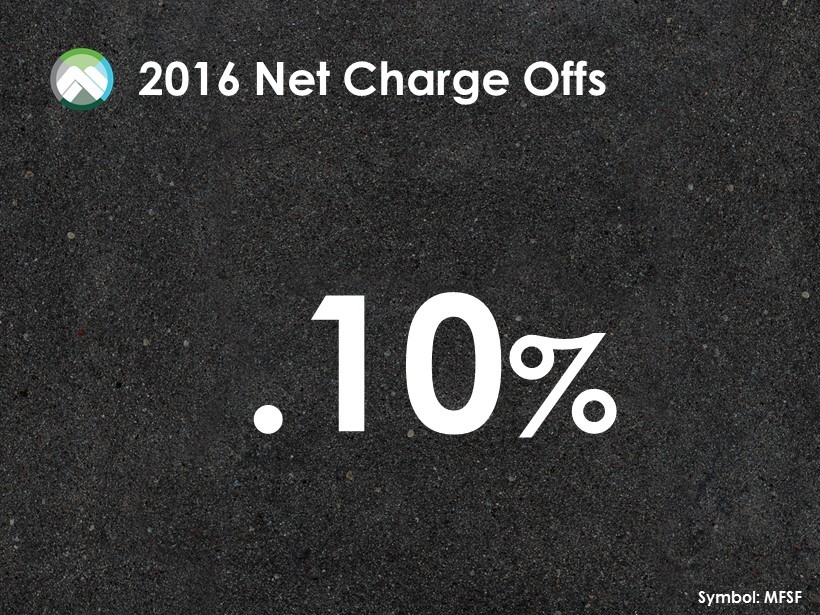
2016 Net Charge Offs .10 % Symbol: MFSF

2016 Tangible Book Value $0.71 to $18.82 per share Symbol: MFSF
2016 Common Stock Dividend 20.8 % Symbol: MFSF

Symbol: MFSF Momentum
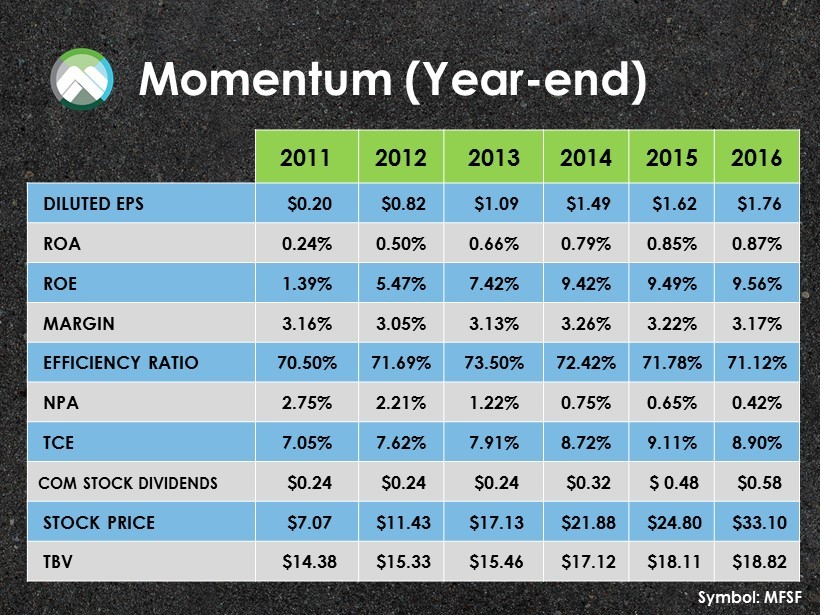
Momentum (Year - end) 2011 2012 2013 2014 2015 2016 DILUTED EPS $0.20 $0.82 $1.09 $1.49 $1.62 $1.76 ROA 0.24% 0.50% 0.66% 0.79% 0.85% 0.87% ROE 1.39% 5.47% 7.42% 9.42% 9.49% 9.56% MARGIN 3.16% 3.05% 3.13% 3.26% 3.22% 3.17% EFFICIENCY RATIO 70.50% 71.69% 73.50% 72.42% 71.78% 71.12% NPA 2.75% 2.21% 1.22% 0.75% 0.65% 0.42% TCE 7.05% 7.62% 7.91% 8.72% 9.11% 8.90% COM STOCK DIVIDENDS $0.24 $0.24 $0.24 $0.32 $ 0.48 $0.58 STOCK PRICE $7.07 $11.43 $17.13 $21.88 $24.80 $33.10 TBV $14.38 $15.33 $15.46 $17.12 $18.11 $18.82 Symbol: MFSF
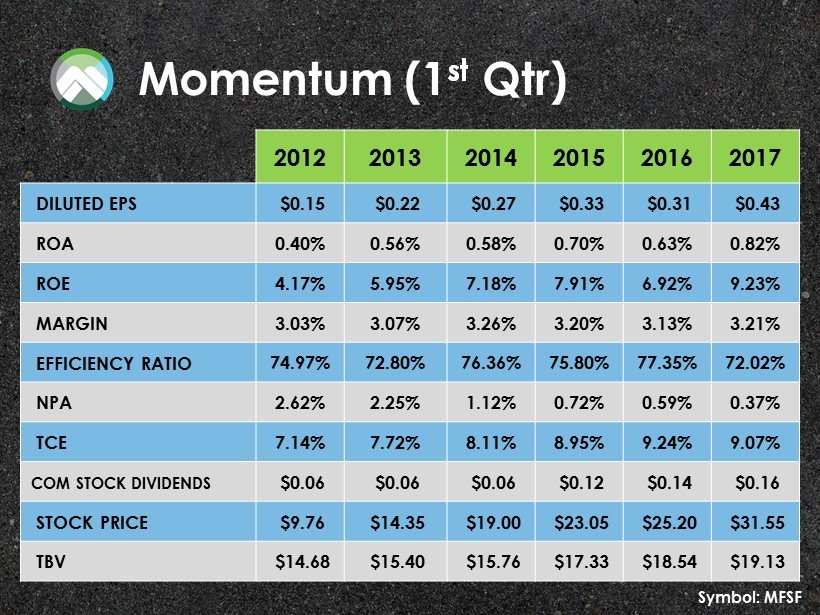
Momentum (1 st Qtr ) 2012 2013 2014 2015 2016 2017 DILUTED EPS $0.15 $0.22 $0.27 $0.33 $0.31 $0.43 ROA 0.40% 0.56% 0.58% 0.70% 0.63% 0.82% ROE 4.17% 5.95% 7.18% 7.91% 6.92% 9.23% MARGIN 3.03% 3.07% 3.26% 3.20% 3.13% 3.21% EFFICIENCY RATIO 74.97% 72.80% 76.36% 75.80% 77.35% 72.02% NPA 2.62% 2.25% 1.12% 0.72% 0.59% 0.37% TCE 7.14% 7.72% 8.11% 8.95% 9.24% 9.07% COM STOCK DIVIDENDS $0.06 $0.06 $0.06 $0.12 $0.14 $0.16 STOCK PRICE $9.76 $14.35 $19.00 $23.05 $25.20 $31.55 TBV $14.68 $15.40 $15.76 $17.33 $18.54 $19.13 Symbol: MFSF
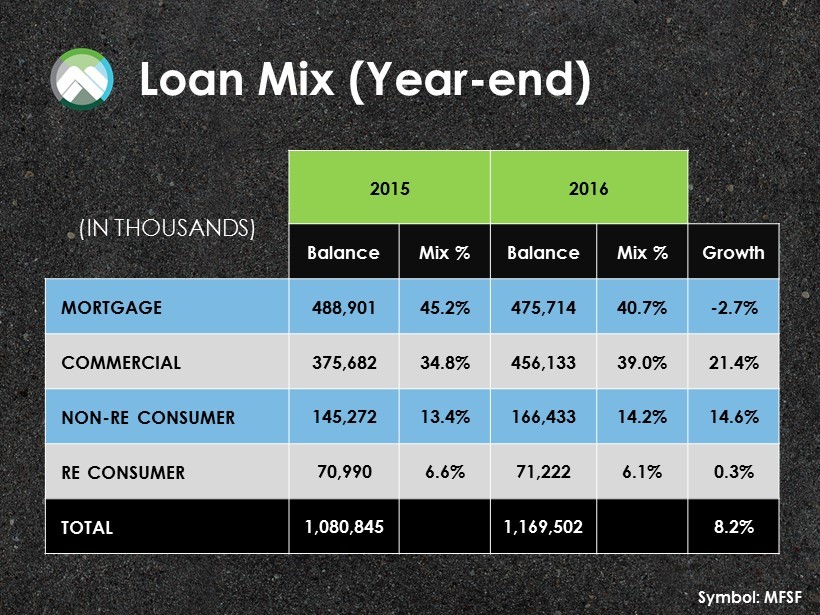
Loan Mix (Year - end) (IN THOUSANDS) 2015 2016 Balance Mix % Balance Mix % Growth MORTGAGE 488,901 45.2% 475,714 40.7% - 2.7% COMMERCIAL 375,682 34.8% 456,133 39.0% 21.4% NON - RE CONSUMER 145,272 13.4% 166,433 14.2% 14.6% RE CONSUMER 70,990 6.6% 71,222 6.1% 0.3% TOTAL 1,080,845 1,169,502 8.2% Symbol: MFSF
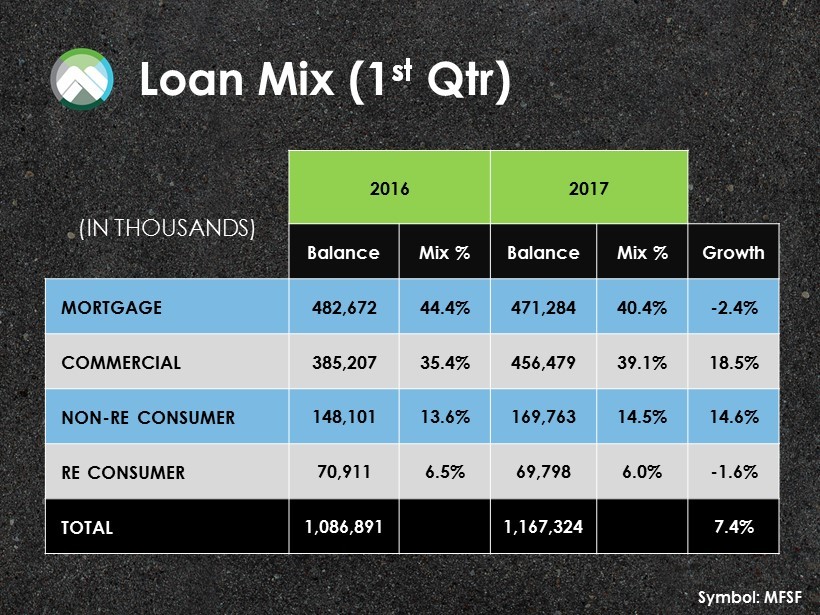
Loan Mix (1 st Qtr ) (IN THOUSANDS) 2016 2017 Balance Mix % Balance Mix % Growth MORTGAGE 482,672 44.4% 471,284 40.4% - 2.4% COMMERCIAL 385,207 35.4% 456,479 39.1% 18.5% NON - RE CONSUMER 148,101 13.6% 169,763 14.5% 14.6% RE CONSUMER 70,911 6.5% 69,798 6.0% - 1.6% TOTAL 1,086,891 1,167,324 7.4% Symbol: MFSF
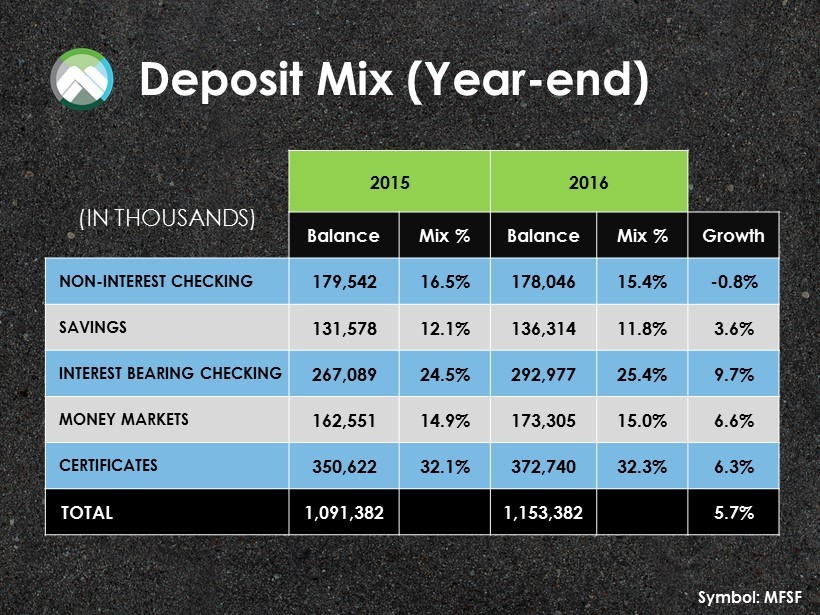
Deposit Mix (Year - end) (IN THOUSANDS) 2015 2016 Balance Mix % Balance Mix % Growth NON - INTEREST CHECKING 179,542 16.5% 178,046 15.4% - 0.8% SAVINGS 131,578 12.1% 136,314 11.8% 3.6% INTEREST BEARING CHECKING 267,089 24.5% 292,977 25.4% 9.7% MONEY MARKETS 162,551 14.9% 173,305 15.0% 6.6% CERTIFICATES 350,622 32.1% 372,740 32.3% 6.3% TOTAL 1,091,382 1,153,382 5.7% Symbol: MFSF
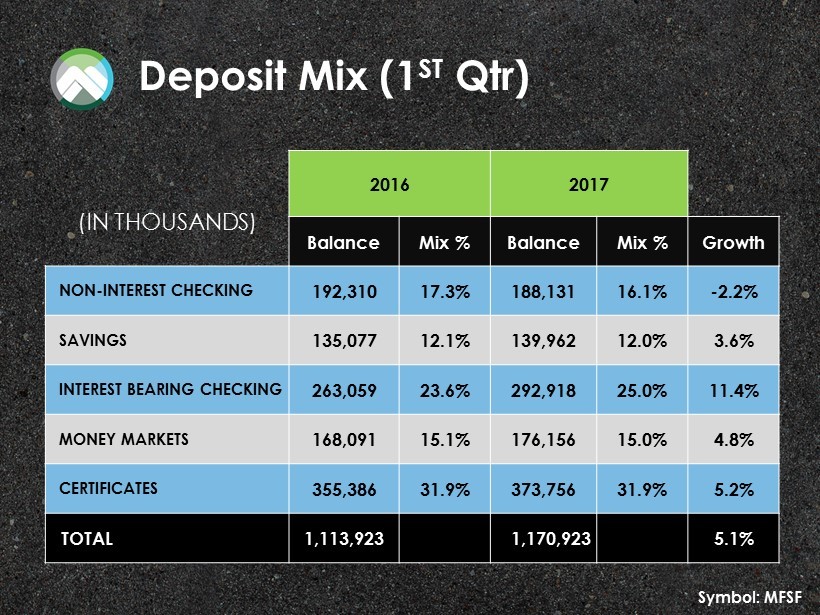
Deposit Mix (1 ST Qtr ) (IN THOUSANDS) 2016 2017 Balance Mix % Balance Mix % Growth NON - INTEREST CHECKING 192,310 17.3% 188,131 16.1% - 2.2% SAVINGS 135,077 12.1% 139,962 12.0% 3.6% INTEREST BEARING CHECKING 263,059 23.6% 292,918 25.0% 11.4% MONEY MARKETS 168,091 15.1% 176,156 15.0% 4.8% CERTIFICATES 355,386 31.9% 373,756 31.9% 5.2% TOTAL 1,113,923 1,170,923 5.1% Symbol: MFSF

YEAR TWO RESULTS Symbol: MFSF

COMMERCIAL & BUSINESS BANKING Symbol: MFSF
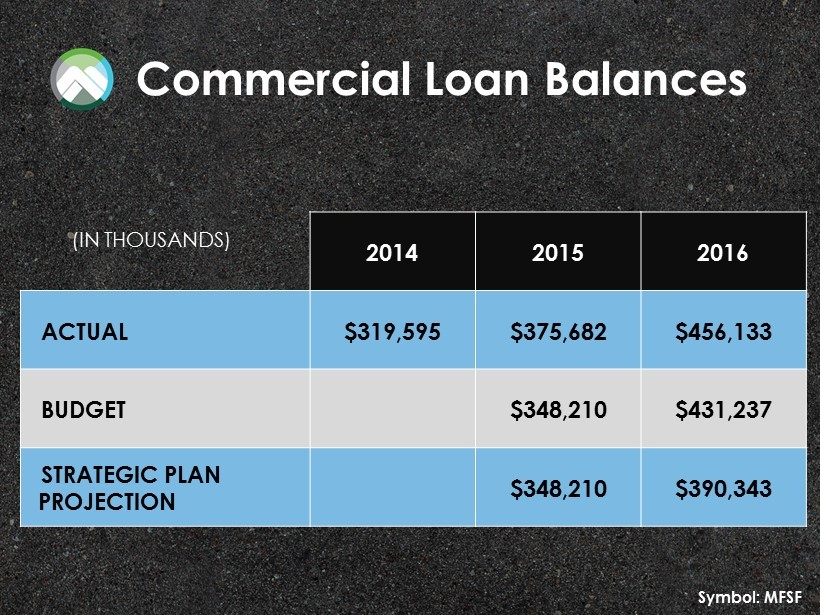
Commercial Loan Balances Symbol: MFSF 2014 2015 2016 ACTUAL $319,595 $375,682 $456,133 BUDGET $348,210 $431,237 STRATEGIC PLAN PROJECTION $348,210 $390,343 (IN THOUSANDS)
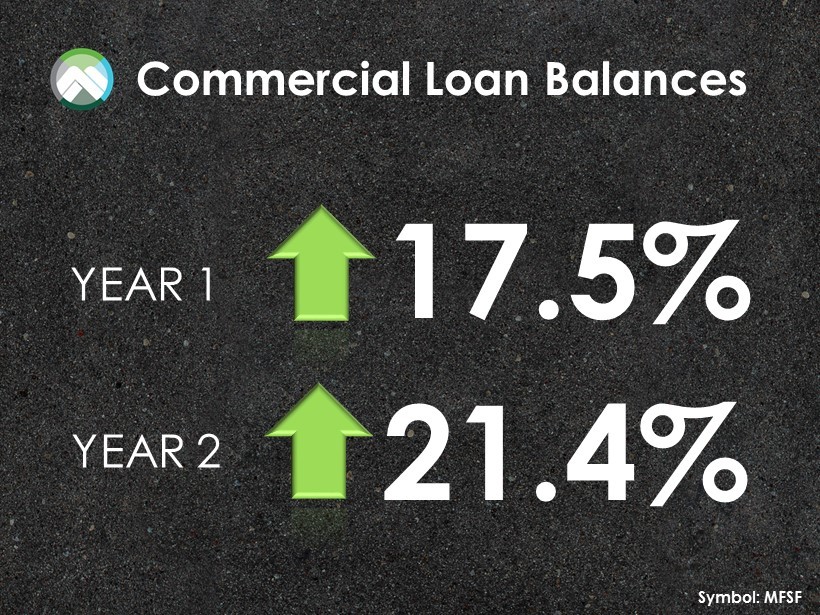
Commercial Loan Balances Symbol: MFSF 17.5% 21.4 % YEAR 1 YEAR 2

PERSONAL BANKING Symbol: MFSF

Consumer Loan Balances Symbol: MFSF 2014 2015 2016 ACTUAL $185,730 $216,262 $237,655 BUDGET $205,730 $246,262 STRATEGIC PLAN PROJECTION $205,730 $225,730 (IN THOUSANDS)
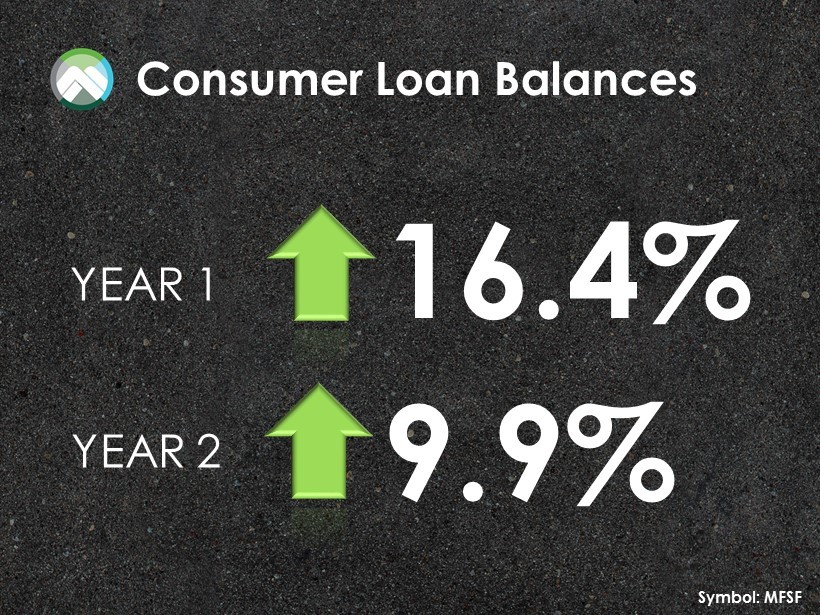
Consumer Loan Balances Symbol: MFSF 16.4% 9.9% YEAR 1 YEAR 2

Mortgage Market Share Symbol: MFSF 2013 2014 2015 ALLEN 4.76% 5.03% 4.34% DELAWARE 13.27% 14.53% 14.07% ELKHART 2.26% 1.69% 1.92% GRANT 13.92% 12.74% 12.31% KOSCIUSKO 5.86% 5.82% 6.25% RANDOLPH 10.66% 8.26% 8.51% ST. JOSEPH 4.53% 3.17% 3.46% WABASH 2.43% 1.47% 3.53%
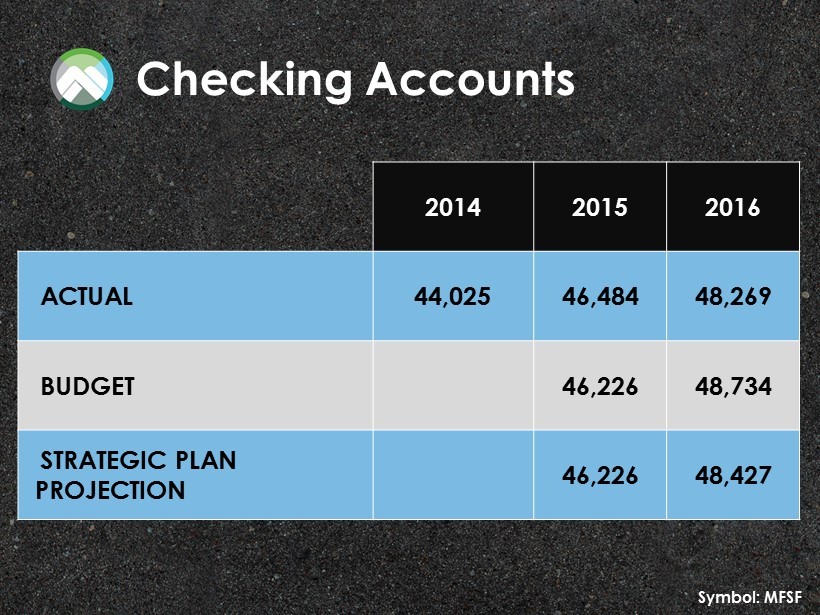
Checking Accounts Symbol: MFSF 2014 2015 2016 ACTUAL 44,025 46,484 48,269 BUDGET 46,226 48,734 STRATEGIC PLAN PROJECTION 46,226 48,427
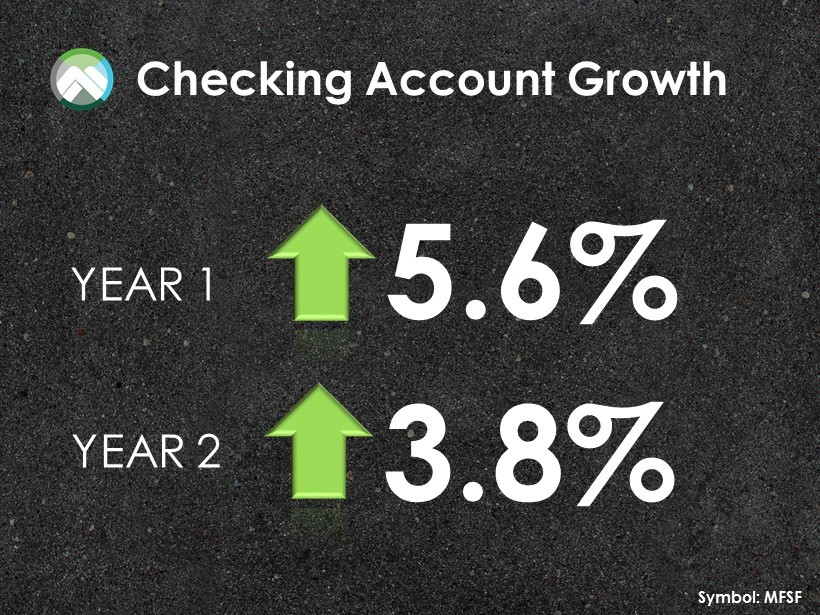
Checking Account Growth Symbol: MFSF 5.6% 3.8% YEAR 1 YEAR 2
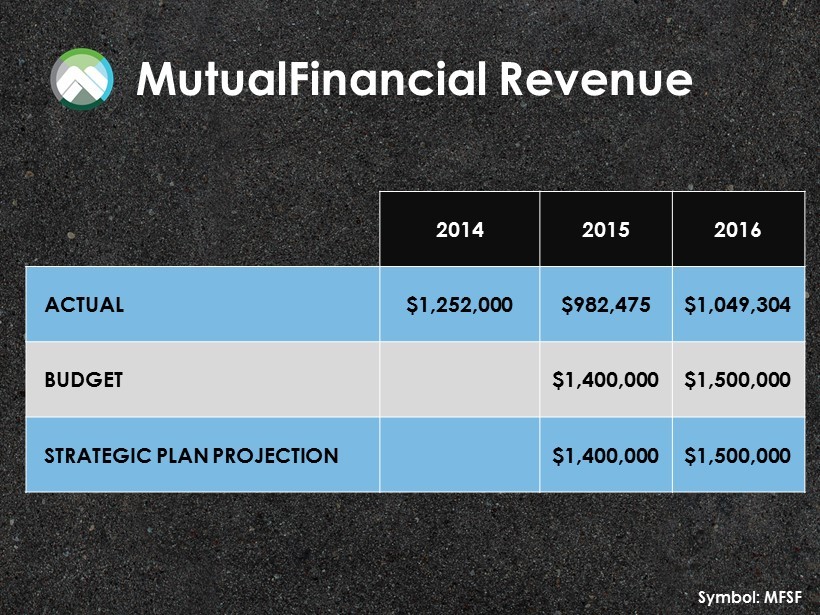
MutualFinancial Revenue Symbol: MFSF 2014 2015 2016 ACTUAL $1,252,000 $982,475 $1,049,304 BUDGET $1,400,000 $1,500,000 STRATEGIC PLAN PROJECTION $1,400,000 $1,500,000

WEALTH MANAGEMENT Symbol: MFSF
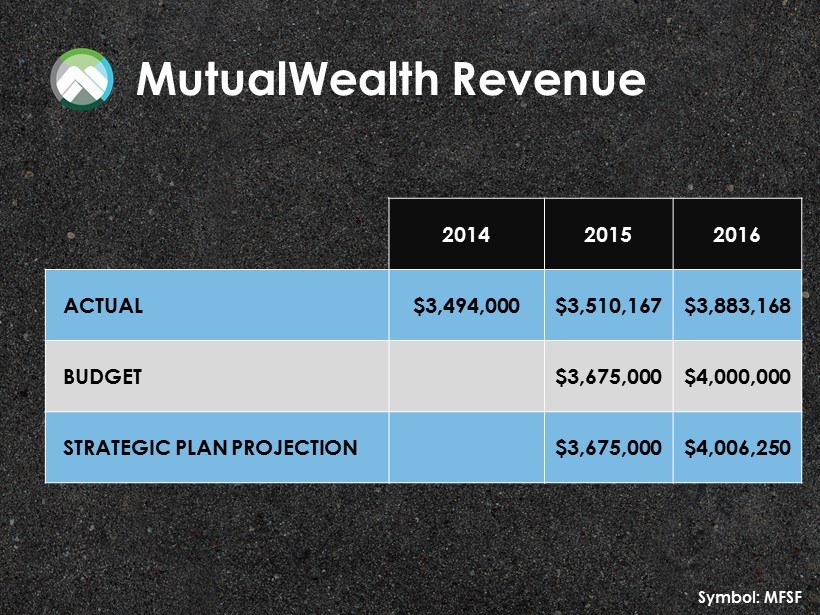
MutualWealth Revenue Symbol: MFSF 2014 2015 2016 ACTUAL $3,494,000 $3,510,167 $3,883,168 BUDGET $3,675,000 $4,000,000 STRATEGIC PLAN PROJECTION $3,675,000 $4,006,250

MutualWealth Revenue Symbol: MFSF .46% 10.6% YEAR 1 YEAR 2
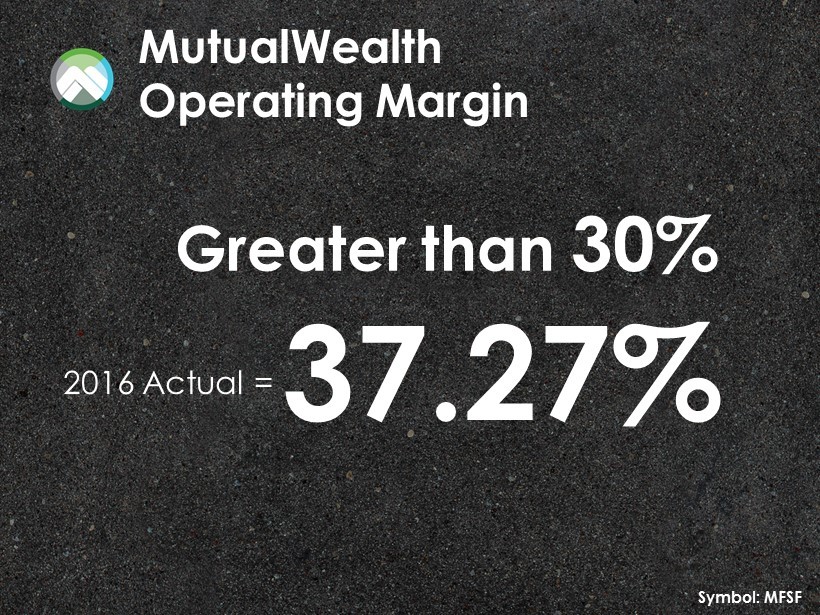
MutualWealth Operating Margin 37.27% 2016 Actual = Symbol: MFSF Greater than 30%

EARNINGS PER SHARE Symbol: MFSF
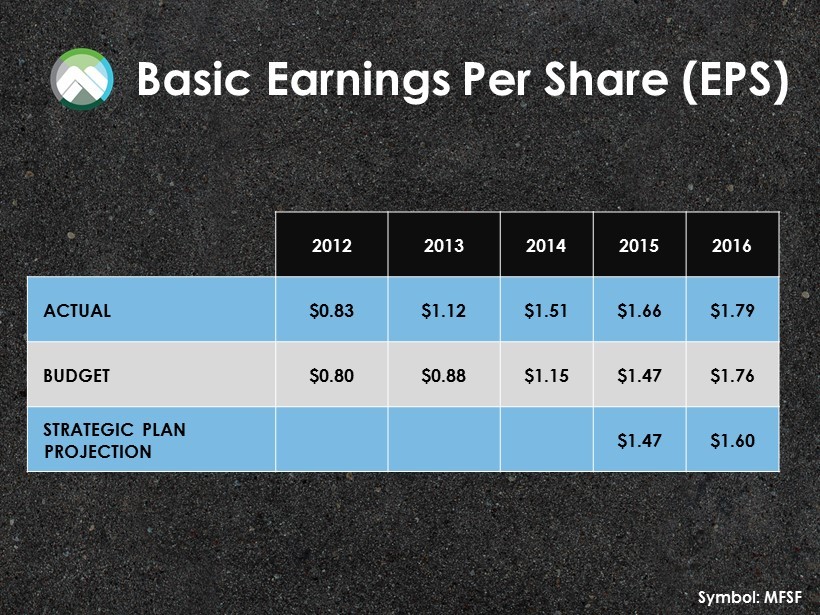
Basic Earnings Per Share (EPS) Symbol: MFSF 2012 2013 2014 2015 2016 ACTUAL $0.83 $1.12 $1.51 $1.66 $1.79 BUDGET $0.80 $0.88 $1.15 $1.47 $1.76 STRATEGIC PLAN PROJECTION $1.47 $1.60

Who knows what’s down the road…

Thank You!