Attached files
| file | filename |
|---|---|
| EX-32 - EXHIBIT 32 - INTERNATIONAL PAPER CO /NEW/ | ip-20170331exhibit32certif.htm |
| EX-31.2 - EXHIBIT 31.2 - INTERNATIONAL PAPER CO /NEW/ | ip-20170331exhibit312certi.htm |
| EX-31.1 - EXHIBIT 31.1 - INTERNATIONAL PAPER CO /NEW/ | ip-20170331exhibit311certi.htm |
| EX-12 - EXHIBIT 12 - INTERNATIONAL PAPER CO /NEW/ | ip-20170331exhibit12comput.htm |
| EX-11 - EXHIBIT 11 - INTERNATIONAL PAPER CO /NEW/ | ip-20170331exhibit11statem.htm |
UNITED STATES
SECURITIES AND EXCHANGE COMMISSION
WASHINGTON, D.C. 20549
FORM 10-Q
ý QUARTERLY REPORT PURSUANT TO SECTION 13 OR 15(d) OF THE SECURITIES EXCHANGE ACT OF 1934
For the Quarterly Period Ended March 31, 2017
¨ TRANSITION REPORT PURSUANT TO SECTION 13 OR 15(d) OF THE SECURITIES EXCHANGE ACT OF 1934
For the Transition Period From to
_________________________________________
Commission File Number 1-3157
INTERNATIONAL PAPER COMPANY
(Exact name of registrant as specified in its charter)
New York | 13-0872805 |
(State or other jurisdiction of | (I.R.S. Employer |
incorporation of organization) | Identification No.) |
6400 Poplar Avenue, Memphis, TN | 38197 |
(Address of principal executive offices) | (Zip Code) |
Registrant’s telephone number, including area code: (901) 419-7000
Indicate by check mark whether the registrant (1) has filed all reports required to be filed by Section 13 or 15(d) of the Securities Exchange Act of 1934 during the preceding 12 months (or for such shorter period that the registrant was required to file such reports), and (2) has been subject to such filing requirements for the past 90 days. Yes ý No ¨
Indicate by check mark whether the registrant has submitted electronically and posted on its corporate Web site, if any, every Interactive Data File required to be submitted and posted pursuant to Rule 405 of Regulation S-T (paragraph 232.405 of this chapter) during the preceding 12 months (or for such shorter period that the registrant was required to submit and post such files). Yes ý No ¨
Indicate by check mark whether the registrant is a large accelerated filer, an accelerated filer, a non-accelerated filer or a smaller reporting company. See the definitions of “large accelerated filer,” “accelerated filer,” “smaller reporting company,” and "emerging growth company" in Rule 12b-2 of the Exchange Act.
Large accelerated filer | ý | Accelerated filer | ¨ |
Non-accelerated filer | ¨ | Smaller reporting company | ¨ |
Emerging growth company | ¨ | ||
If an emerging growth company, indicate by check mark if the registrant has elected not to use the extended transition period for complying with any new or revised financial accounting standards provided pursuant to Section 13 (a) of the Exchange
Act. ¨
Indicate by check mark whether the registrant is a shell company (as defined in Rule 12b-2 of the Exchange Act). Yes ¨ No ý
The number of shares outstanding of the registrant’s common stock, par value $1.00 per share, as of April 28, 2017 was 412,899,011.
INDEX
PAGE NO. | ||
Condensed Consolidated Statement of Operations - Three Months Ended March 31, 2017 and 2016 | ||
Condensed Consolidated Statement of Comprehensive Income - Three Months Ended March 31, 2017 and 2016 | ||
Condensed Consolidated Balance Sheet - March 31, 2017 and December 31, 2016 | ||
Condensed Consolidated Statement of Cash Flows - Three Months Ended March 31, 2017 and 2016 | ||
PART I. FINANCIAL INFORMATION
ITEM 1. | FINANCIAL STATEMENTS |
INTERNATIONAL PAPER COMPANY
Condensed Consolidated Statement of Operations
(Unaudited)
(In millions, except per share amounts)
Three Months Ended March 31, | |||||||
2017 | 2016 | ||||||
Net Sales | $ | 5,511 | $ | 5,110 | |||
Costs and Expenses | |||||||
Cost of products sold | 3,940 | 3,611 | |||||
Selling and administrative expenses | 422 | 376 | |||||
Depreciation, amortization and cost of timber harvested | 345 | 284 | |||||
Distribution expenses | 379 | 320 | |||||
Taxes other than payroll and income taxes | 45 | 41 | |||||
Restructuring and other charges | — | 1 | |||||
Net (gains) losses on sales and impairments of businesses | — | 37 | |||||
Net bargain purchase gain on acquisition of business | (6 | ) | — | ||||
Interest expense, net | 142 | 123 | |||||
Earnings (Loss) From Continuing Operations Before Income Taxes and Equity Earnings | 244 | 317 | |||||
Income tax provision (benefit) | 83 | 41 | |||||
Equity earnings (loss), net of taxes | 48 | 63 | |||||
Earnings (Loss) From Continuing Operations | 209 | 339 | |||||
Discontinued operations, net of taxes | — | (5 | ) | ||||
Net Earnings (Loss) | 209 | 334 | |||||
Less: Net earnings (loss) attributable to noncontrolling interests | — | — | |||||
Net Earnings (Loss) Attributable to International Paper Company | $ | 209 | $ | 334 | |||
Basic Earnings (Loss) Per Share Attributable to International Paper Company Common Shareholders | |||||||
Earnings (loss) from continuing operations | $ | 0.51 | $ | 0.82 | |||
Discontinued operations, net of taxes | — | (0.01 | ) | ||||
Net earnings (loss) | $ | 0.51 | $ | 0.81 | |||
Diluted Earnings (Loss) Per Share Attributable to International Paper Company Common Shareholders | |||||||
Earnings (loss) from continuing operations | $ | 0.50 | $ | 0.82 | |||
Discontinued operations, net of taxes | — | (0.01 | ) | ||||
Net earnings (loss) | $ | 0.50 | $ | 0.81 | |||
Average Shares of Common Stock Outstanding – assuming dilution | 416.0 | 414.0 | |||||
Cash Dividends Per Common Share | $ | 0.4625 | $ | 0.4400 | |||
Amounts Attributable to International Paper Company Common Shareholders | |||||||
Earnings (loss) from continuing operations | $ | 209 | $ | 339 | |||
Discontinued operations, net of taxes | — | (5 | ) | ||||
Net earnings (loss) | $ | 209 | $ | 334 | |||
The accompanying notes are an integral part of these consolidated financial statements.
1
INTERNATIONAL PAPER COMPANY
Condensed Consolidated Statement of Comprehensive Income
(Unaudited)
(In millions)
Three Months Ended March 31, | |||||||
2017 | 2016 | ||||||
Net Earnings (Loss) | $ | 209 | $ | 334 | |||
Other Comprehensive Income (Loss), Net of Tax: | |||||||
Amortization of pension and post-retirement prior service costs and net loss: | |||||||
U.S. plans | 57 | 64 | |||||
Pension and postretirement liability adjustments: | |||||||
Non-U.S. plans | (1 | ) | 17 | ||||
Change in cumulative foreign currency translation adjustment | 148 | 236 | |||||
Net gains/losses on cash flow hedging derivatives: | |||||||
Net gains (losses) arising during the period | 9 | 4 | |||||
Reclassification adjustment for (gains) losses included in net earnings (loss) | (2 | ) | (1 | ) | |||
Total Other Comprehensive Income (Loss), Net of Tax | 211 | 320 | |||||
Comprehensive Income (Loss) | 420 | 654 | |||||
Net (earnings) loss attributable to noncontrolling interests | — | — | |||||
Other comprehensive (income) loss attributable to noncontrolling interests | (1 | ) | (1 | ) | |||
Comprehensive Income (Loss) Attributable to International Paper Company | $ | 419 | $ | 653 | |||
The accompanying notes are an integral part of these consolidated financial statements.
2
INTERNATIONAL PAPER COMPANY
Condensed Consolidated Balance Sheet
(In millions)
March 31, 2017 | December 31, 2016 | ||||||
(unaudited) | |||||||
Assets | |||||||
Current Assets | |||||||
Cash and temporary investments | $ | 998 | $ | 1,033 | |||
Accounts and notes receivable, net | 3,078 | 3,001 | |||||
Inventories | 2,394 | 2,438 | |||||
Other current assets | 251 | 198 | |||||
Total Current Assets | 6,721 | 6,670 | |||||
Plants, Properties and Equipment, net | 14,049 | 13,990 | |||||
Forestlands | 471 | 456 | |||||
Investments | 311 | 360 | |||||
Financial Assets of Special Purpose Entities (Note 13) | 7,037 | 7,033 | |||||
Goodwill | 3,402 | 3,364 | |||||
Deferred Charges and Other Assets | 1,310 | 1,220 | |||||
Total Assets | $ | 33,301 | $ | 33,093 | |||
Liabilities and Equity | |||||||
Current Liabilities | |||||||
Notes payable and current maturities of long-term debt | $ | 454 | $ | 239 | |||
Accounts payable | 2,380 | 2,309 | |||||
Accrued payroll and benefits | 359 | 430 | |||||
Other accrued liabilities | 1,074 | 1,091 | |||||
Total Current Liabilities | 4,267 | 4,069 | |||||
Long-Term Debt | 10,823 | 11,075 | |||||
Nonrecourse Financial Liabilities of Special Purpose Entities (Note 13) | 6,286 | 6,284 | |||||
Deferred Income Taxes | 3,185 | 3,127 | |||||
Pension Benefit Obligation | 3,375 | 3,400 | |||||
Postretirement and Postemployment Benefit Obligation | 325 | 330 | |||||
Other Liabilities | 446 | 449 | |||||
Equity | |||||||
Common stock, $1 par value, 2017 – 448.9 shares and 2016 – 448.9 shares | 449 | 449 | |||||
Paid-in capital | 6,128 | 6,189 | |||||
Retained earnings | 4,832 | 4,818 | |||||
Accumulated other comprehensive loss | (5,152 | ) | (5,362 | ) | |||
6,257 | 6,094 | ||||||
Less: Common stock held in treasury, at cost, 2017 – 36.022 shares and 2016 – 37.671 shares | 1,682 | 1,753 | |||||
Total Shareholders’ Equity | 4,575 | 4,341 | |||||
Noncontrolling interests | 19 | 18 | |||||
Total Equity | 4,594 | 4,359 | |||||
Total Liabilities and Equity | $ | 33,301 | $ | 33,093 | |||
The accompanying notes are an integral part of these consolidated financial statements.
3
INTERNATIONAL PAPER COMPANY
Condensed Consolidated Statement of Cash Flows
(Unaudited)
(In millions)
Three Months Ended March 31, | |||||||
2017 | 2016 | ||||||
Operating Activities | |||||||
Net earnings (loss) | $ | 209 | $ | 334 | |||
Depreciation, amortization and cost of timber harvested | 345 | 284 | |||||
Deferred income tax provision (benefit), net | 7 | (37 | ) | ||||
Restructuring and other charges | — | 1 | |||||
Net bargain purchase gain on acquisition of business | (6 | ) | — | ||||
Net (gains) losses on sales and impairments of businesses | — | 37 | |||||
Ilim dividends received | 127 | — | |||||
Equity (earnings) loss, net | (48 | ) | (63 | ) | |||
Periodic pension expense, net | 78 | 91 | |||||
Other, net | 45 | 27 | |||||
Changes in current assets and liabilities | |||||||
Accounts and notes receivable | (57 | ) | (7 | ) | |||
Inventories | (15 | ) | (9 | ) | |||
Accounts payable and accrued liabilities | 22 | (26 | ) | ||||
Interest payable | (18 | ) | 32 | ||||
Other | (56 | ) | (44 | ) | |||
Cash Provided By (Used For) Operations | 633 | 620 | |||||
Investment Activities | |||||||
Invested in capital projects | (374 | ) | (309 | ) | |||
Proceeds from sale of fixed assets | 1 | 8 | |||||
Other | (27 | ) | (63 | ) | |||
Cash Provided By (Used For) Investment Activities | (400 | ) | (364 | ) | |||
Financing Activities | |||||||
Repurchases of common stock and payments of restricted stock tax withholding | (46 | ) | (131 | ) | |||
Issuance of debt | 186 | 467 | |||||
Reduction of debt | (227 | ) | (322 | ) | |||
Change in book overdrafts | (6 | ) | 3 | ||||
Dividends paid | (191 | ) | (181 | ) | |||
Cash Provided By (Used For) Financing Activities | (284 | ) | (164 | ) | |||
Cash Included in Assets Held for Sale | — | (12 | ) | ||||
Effect of Exchange Rate Changes on Cash | 16 | 25 | |||||
Change in Cash and Temporary Investments | (35 | ) | 105 | ||||
Cash and Temporary Investments | |||||||
Beginning of period | 1,033 | 1,050 | |||||
End of period | $ | 998 | $ | 1,155 | |||
The accompanying notes are an integral part of these consolidated financial statements.
4
INTERNATIONAL PAPER COMPANY
Condensed Notes to Consolidated Financial Statements
(Unaudited)
NOTE 1 - BASIS OF PRESENTATION
The accompanying unaudited condensed consolidated financial statements have been prepared in conformity with accounting principles generally accepted in the United States and in accordance with the instructions to Form 10-Q and, in the opinion of management, include all adjustments that are necessary for the fair presentation of International Paper Company’s (International Paper’s, the Company’s or our) financial position, results of operations, and cash flows for the interim periods presented. Except as disclosed herein, such adjustments are of a normal, recurring nature. Results for the first three months of the year may not necessarily be indicative of full year results. It is suggested that these financial statements be read in conjunction with the audited financial statements and the notes thereto included in the Company’s Annual Report on Form 10-K for the year ended December 31, 2016 which have previously been filed with the Securities and Exchange Commission.
During the fourth quarter of 2016, the Company finalized the purchase of Weyerhaeuser's pulp business (see Note 7). Subsequent to the acquisition, the Company began reporting Global Cellulose Fibers as a separate reportable business segment in the fourth quarter of 2016 due to the increased materiality of the results of this business. This segment includes the Company's legacy pulp business and the newly acquired pulp business. As such, amounts related to the legacy pulp business have been reclassified out of the Printing Papers' segment and included in the new Global Cellulose Fibers business segment for all prior periods to conform with current year presentation. In addition, during the first quarter of 2017, as a result of an internal reorganization, the net sales and operating profits for the Asian Distribution operations are included in the results of the businesses that manufacture the products, and prior year amounts have been reclassified to conform with current year presentation.
Also in the first quarter of 2017, the Company adopted the required guidance in ASU 2015-17, "Income Taxes (Topic 740): "Balance Classification of Deferred Taxes," which resulted in the reclassification of $48 million and $251 million as of December 31, 2016, being reclassified to"Deferred Charges and Other Assets" and "Deferred Income Taxes" in long-term liabilities, respectively, from the "Deferred income tax asset" line item in short-term assets.
NOTE 2 - RECENT ACCOUNTING DEVELOPMENTS
Retirement Benefits
In March 2017, the FASB issued ASU 2017-07, "Compensation - Retirement Benefits (Topic 715): Improving the Presentation of Net Periodic Pension Cost and Net Periodic Postretirement Benefit Cost." Under this new guidance, employers will present the service costs component of the net periodic benefit cost in the same income statement line item(s) as other employee compensation costs arising from services rendered during the period. In addition, only the service cost component will be eligible for capitalization in assets. Employers will present the other components separately from the line items(s) that includes the service cost and outside of any subtotal of operating income. In addition, disclosure of the line(s) used to present the other components of net periodic benefit cost will be required if the components are not presented separately in the income statement. This guidance is effective for annual reporting periods beginning after December 15, 2017, and interim periods within those years. Early adoption is permitted as of the beginning of an annual period for which financial statements (interim or annual) have not been issued or made available for issuance. The Company is currently evaluating the provisions of this guidance; however, we expect the adoption of ASU 2017-07 to result in a change in our adjusted operating profit, which will be offset by a corresponding change in non-operating pension expense to reflect the impact of presenting the amortization of the prior service cost component of net periodic pension expense outside of operating income. We expect to adopt the provisions of this guidance on January 1, 2018 using the retrospective method and do not anticipate a material change to our 2017 adjusted operating profit or non-operating pension expense when they are recast to reflect the standard. We also do not expect ASU 2017-07 to have a material impact on our consolidated statements of financial position or cash flows.
Intangibles
In January 2017, the FASB issued ASU 2017-04, "Intangibles - Goodwill and Other (Topic 350): Simplifying the Test for Goodwill Impairment." This guidance eliminates the requirement to calculate the implied fair value of goodwill under Step 2 of today's goodwill impairment test to measure a goodwill impairment charge. Instead, entities will record an impairment charge based on the excess of a reporting unit's carrying amount over its fair value. This guidance should be applied prospectively and is effective for annual reporting periods beginning after December 15, 2019, for any impairment test performed in 2020. Early adoption is permitted for annual and interim goodwill impairment testing dates after January 1, 2017. The Company is currently evaluating the provisions of this guidance.
5
Accounting Changes
In January 2017, the FASB issued ASU 2017-03, "Accounting Changes and Error Corrections (Topic 250) and Investments - Equity Method and Joint Ventures (Topic 323): Amendments to SEC Paragraphs Pursuant to Staff Announcements at the September 22, 2016 and November 17, 2016 EITF Meetings." This guidance addresses the additional qualitative disclosures that a registrant is expected to provide when it cannot reasonably estimate the impact that ASUs 2014-09, 2016-02 and 2016-13 will have in applying SAB Topic 11.M. The Company is currently evaluating the provisions of this guidance.
Business Combinations
In January 2017, the FASB issued ASU 2017-01, "Business Combinations (Topic 805): Clarifying the Definition of a Business." Under the new guidance, an entity must first determine whether substantially all of the fair value of the gross assets acquired is concentrated in a single identifiable asset or a group of similar identifiable assets. If this threshold is met, the set of transferred assets and activities is not a business. If this threshold is not met, the entity then evaluates whether the set meets the requirement that a business include, at a minimum, an input and a substantive process that together significantly contribute to the ability to create outputs. This guidance is effective for annual reporting periods beginning after December 15, 2017, and interim periods within those years. Early adoption is permitted. The Company is currently evaluating the provisions of this guidance.
Variable Interest Entities
In October 2016, the FASB issued ASU 2016-17, "Consolidation (Topic 810): Interests Held through Related Parties That Are under Common Control." Under consolidation guidance in ASU 2015-02 issued by the FASB in 2015, a single decision maker was required to consider an indirect interest held by a related party under common control in its entirety. Under the new guidance, the single decision maker will consider that indirect interest on a proportionate basis. This guidance is effective for annual reporting periods beginning after December 15, 2016, and interim periods within those years. This guidance should be applied retrospectively to all relevant prior periods beginning with the fiscal years in which ASU 2015-02 was initially applied. Early adoption is permitted. The Company adopted this ASU in the first quarter of 2017 with no material impact on the consolidated financial statements.
Income Taxes
In October 2016, the FASB issued ASU 2016-16, "Income Taxes (Topic 740): Intra-Entity Transfers of Assets Other Than Inventory." This ASU requires companies to recognize the income tax effects of intercompany sales and transfers of assets other than inventory in the period in which the transfer occurs rather than defer the income tax effects which is current practice. This new guidance is effective for annual reporting periods beginning after December 15, 2017, and interim periods within those years. The guidance requires companies to apply a modified retrospective approach with a cumulative catch-up adjustment to opening retained earnings in the period of adoption. Early adoption is permitted. The Company is currently evaluating the provisions of this guidance.
Stock Compensation
In March 2016, the FASB issued ASU 2016-09, Compensation - Stock Compensation (Topic 718): "Improvements to Employee Share-Based Payment Accounting." Under this new guidance, all excess tax benefits and tax deficiencies will be recognized in the income statement as they occur and will therefore impact the Company's effective tax rate. This guidance replaces current guidance which requires tax benefits that exceed compensation costs (windfalls) to be recognized in equity. The new guidance will also change the cash flow presentation of excess tax benefits, classifying them as operating inflows rather than financing activities as they are currently classified. In addition, the new guidance will allow companies to provide net settlement of stock-based compensation to cover tax withholding as long as the net settlement doesn't exceed the maximum individual statutory tax rate in the employee's tax jurisdiction. Amendments related to the timing of when excess tax benefits are recognized, minimum statutory withholding requirements, forfeitures, and intrinsic value should be applied using a modified retrospective transition method by means of a cumulative-effect adjustment to equity as of the beginning of the period in which the guidance is adopted. Amendments related to the presentation of employee taxes paid on the statement of cash flows when an employer withholds shares to meet the minimum statutory withholding requirement should be applied retrospectively. Amendments requiring recognition of excess tax benefits and tax deficiencies in the income statement and the practical expedient for estimating expected term should be applied prospectively. An entity may elect to apply the amendments related to the presentation of excess tax benefits on the statement of cash flows using either a prospective transition method or a retrospective transition method. This ASU is effective for annual reporting periods beginning after December 15, 2016, and interim periods with those years. The Company adopted the provisions of this ASU in the first quarter of 2017 10-Q with no material impact on the consolidated financial statements.
Leases
In February 2016, the FASB issued ASU 2016-02, Leases Topic (842): "Leases." This ASU will require most leases to be recognized on the balance sheet which will increase reported assets and liabilities. Lessor accounting will remain substantially similar to current U.S. GAAP. This ASU is effective for annual reporting periods beginning after December 15, 2018, and interim periods within those years, and mandates a modified retrospective transition method for all entities. The Company expects to adopt this guidance using a modified retrospective transition approach for leases existing at, or entered into after, the beginning of the earliest comparative period presented in the financial statements. We expect to recognize a liability and corresponding asset associated
6
with in-scope operating and finance leases but are still in the process of determining those amounts and the processes required to account for leasing activity on an ongoing basis.
Revenue Recognition
In May 2014, the FASB issued ASU 2014-09, "Revenue from Contracts with Customers." This guidance replaces most existing revenue recognition guidance and provides that an entity should recognize revenue to depict the transfer of promised goods or services to customers in an amount that reflects the consideration to which the entity expects to be entitled in exchange for those goods and services. This ASU was effective for annual reporting periods beginning after December 15, 2016, and interim periods within those years and permits the use of either the retrospective or cumulative effect transition method; however, in August 2015, the FASB issued ASU 2015-14 which defers the effective date by one year making the guidance effective for annual reporting periods beginning after December 15, 2017. The FASB has continued to clarify this guidance in various updates during 2015 and 2016, all of which, have the same effective date as the original guidance.
We are currently evaluating the impact of ASU 2014-09 and all related ASU's on our consolidated financial statements. We plan to adopt the new revenue guidance effective January 1, 2018 using the full retrospective transition method. The Company does not expect the impact on its consolidated financial statements to be material and we anticipate the primary impact to be the additional required disclosures around revenue recognition in the notes to the consolidated financial statements.
NOTE 3 - EQUITY
A summary of the changes in equity for the three months ended March 31, 2017 and 2016 is provided below:
Three Months Ended March 31, | |||||||||||||||||||||||
2017 | 2016 | ||||||||||||||||||||||
In millions, except per share amounts | Total International Paper Shareholders’ Equity | Noncontrolling Interests | Total Equity | Total International Paper Shareholders’ Equity | Noncontrolling Interests | Total Equity | |||||||||||||||||
Balance, January 1 | $ | 4,341 | $ | 18 | $ | 4,359 | $ | 3,884 | $ | 25 | $ | 3,909 | |||||||||||
Issuance of stock for various plans, net | 54 | — | 54 | (6 | ) | — | (6 | ) | |||||||||||||||
Repurchase of stock | (46 | ) | — | (46 | ) | (131 | ) | — | (131 | ) | |||||||||||||
Common stock dividends ($.4625 per share in 2017 and $.4400 per share in 2016) | (195 | ) | — | (195 | ) | (183 | ) | — | (183 | ) | |||||||||||||
Transactions of equity method investees | 2 | — | 2 | 17 | — | 17 | |||||||||||||||||
Comprehensive income (loss) | 419 | 1 | 420 | 653 | 1 | 654 | |||||||||||||||||
Ending Balance, March 31 | $ | 4,575 | $ | 19 | $ | 4,594 | $ | 4,234 | $ | 26 | $ | 4,260 | |||||||||||
NOTE 4 - OTHER COMPREHENSIVE INCOME
The following table presents changes in AOCI for the three-month period ended March 31, 2017:
In millions | Defined Benefit Pension and Postretirement Items (a) | Change in Cumulative Foreign Currency Translation Adjustments (a) | Net Gains and Losses on Cash Flow Hedging Derivatives (a) | Total (a) | ||||||||||||
Balance, January 1, 2017 | $ | (3,072 | ) | $ | (2,287 | ) | $ | (3 | ) | $ | (5,362 | ) | ||||
Other comprehensive income (loss) before reclassifications | (1 | ) | 148 | 9 | 156 | |||||||||||
Amounts reclassified from accumulated other comprehensive income | 57 | — | (2 | ) | 55 | |||||||||||
Net Current Period Other Comprehensive Income (Loss) | 56 | 148 | 7 | 211 | ||||||||||||
Other Comprehensive Income (Loss) Attributable to Noncontrolling Interest | — | (1 | ) | — | (1 | ) | ||||||||||
Balance, March 31, 2017 | $ | (3,016 | ) | $ | (2,140 | ) | $ | 4 | $ | (5,152 | ) | |||||
(a) | All amounts are net of tax. Amounts in parentheses indicate debits to AOCI. |
7
The following table presents changes in AOCI for the three-month period ended March 31, 2016:
In millions | Defined Benefit Pension and Postretirement Items (a) | Change in Cumulative Foreign Currency Translation Adjustments (a) | Net Gains and Losses on Cash Flow Hedging Derivatives (a) | Total (a) | ||||||||||||
Balance, January 1, 2016 | $ | (3,169 | ) | $ | (2,549 | ) | $ | 10 | $ | (5,708 | ) | |||||
Other comprehensive income (loss) before reclassifications | 17 | 236 | 4 | 257 | ||||||||||||
Amounts reclassified from accumulated other comprehensive income | 64 | — | (1 | ) | 63 | |||||||||||
Net Current Period Other Comprehensive Income (Loss) | 81 | 236 | 3 | 320 | ||||||||||||
Other Comprehensive Income (Loss) Attributable to Noncontrolling Interest | — | (1 | ) | — | (1 | ) | ||||||||||
Balance, March 31, 2016 | $ | (3,088 | ) | $ | (2,314 | ) | $ | 13 | $ | (5,389 | ) | |||||
(a) | All amounts are net of tax. Amounts in parentheses indicate debits to AOCI. |
The following table presents details of the reclassifications out of AOCI for the three-month periods ended March 31, 2017 and 2016:
Details About Accumulated Other Comprehensive Income Components | Amounts Reclassified from Accumulated Other Comprehensive Income (a) | Location of Amount Reclassified from AOCI | |||||||||
Three Months Ended March 31, | |||||||||||
2017 | 2016 | ||||||||||
In millions: | |||||||||||
Defined benefit pension and postretirement items: | |||||||||||
Prior-service costs | $ | (6 | ) | $ | (9 | ) | (b) | Cost of products sold | |||
Actuarial gains (losses) | (87 | ) | (95 | ) | (b) | Cost of products sold | |||||
Total pre-tax amount | (93 | ) | (104 | ) | |||||||
Tax (expense) benefit | 36 | 40 | |||||||||
Net of tax | (57 | ) | (64 | ) | |||||||
Net gains and losses on cash flow hedging derivatives: | |||||||||||
Foreign exchange contracts | 3 | 1 | (c) | Cost of products sold | |||||||
Total pre-tax amount | 3 | 1 | |||||||||
Tax (expense)/benefit | (1 | ) | — | ||||||||
Net of tax | 2 | 1 | |||||||||
Total reclassifications for the period | $ | (55 | ) | $ | (63 | ) | |||||
(a) | Amounts in parentheses indicate debits to earnings/loss. |
(b) | These accumulated other comprehensive income components are included in the computation of net periodic pension cost (see Note 16 for additional details). |
(c) | This accumulated other comprehensive income component is included in our derivatives and hedging activities (see Note 15 for additional details). |
8
NOTE 5 - EARNINGS PER SHARE ATTRIBUTABLE TO INTERNATIONAL PAPER COMPANY COMMON SHAREHOLDERS
Basic earnings per common share are computed by dividing earnings by the weighted average number of common shares outstanding. Diluted earnings per common share are computed assuming that all potentially dilutive securities were converted into common shares. A reconciliation of the amounts included in the computation of earnings (loss) per common share, and diluted earnings (loss) per common share is as follows:
Three Months Ended March 31, | |||||||
In millions, except per share amounts | 2017 | 2016 | |||||
Earnings (loss) from continuing operations | $ | 209 | $ | 339 | |||
Effect of dilutive securities | — | — | |||||
Earnings (loss) from continuing operations – assuming dilution | $ | 209 | $ | 339 | |||
Average common shares outstanding | 412.1 | 410.8 | |||||
Effect of dilutive securities | |||||||
Restricted stock performance share plan | 3.9 | 3.2 | |||||
Average common shares outstanding – assuming dilution | 416.0 | 414.0 | |||||
Basic earnings (loss) from continuing operations per common share | $ | 0.51 | $ | 0.82 | |||
Diluted earnings (loss) from continuing operations per common share | $ | 0.50 | $ | 0.82 | |||
NOTE 6 - RESTRUCTURING AND OTHER CHARGES
2017: There were no restructuring and other charges recorded during the first quarter of 2017.
2016: During the three months ended March 31, 2016, restructuring and other charges totaling $1 million before taxes were recorded. Details of these charges were as follows:
In millions | Three Months Ended March 31, 2016 | ||
Gain on sale of investment in Arizona Chemical | $ | (8 | ) |
Riegelwood mill conversion costs | 9 | ||
Total | $ | 1 | |
NOTE 7 - ACQUISITIONS
Weyerhaeuser Pulp Business
On December 1, 2016, the Company finalized the purchase of Weyerhaeuser Company's pulp business for approximately $2.2 billion in cash, subject to post-closing adjustments. Under the terms of the agreement, International Paper acquired four fluff pulp mills, one Northern bleached softwood kraft mill and two converting facilities of modified fiber, located in the United States, Canada and Poland.
The Company is accounting for the acquisition under ASC 805, "Business Combinations" and the newly acquired pulp business's results of operations have been included in International Paper's consolidated financial statements beginning with the date of acquisition.
9
The following table summarizes the preliminary allocation of the purchase price to the fair value of assets and liabilities acquired as of December 1, 2016.
In millions | |||
Cash and temporary investments | $ | 12 | |
Accounts and notes receivable | 195 | ||
Inventory | 238 | ||
Other current assets | 11 | ||
Plants, properties and equipment | 1,711 | ||
Goodwill | 47 | ||
Other intangible assets | 212 | ||
Deferred charges and other assets | 6 | ||
Total assets acquired | 2,432 | ||
Accounts payable and accrued liabilities | 111 | ||
Long-term debt | 104 | ||
Other long-term liabilities | 26 | ||
Total liabilities assumed | 241 | ||
Net assets acquired | $ | 2,191 | |
Due to the timing of the completion of the acquisition, the purchase price allocation is preliminary and could be revised as a result of additional information obtained regarding assets acquired and liabilities assumed, and revisions of provisional estimates of fair values, including, but not limited to, the completion of independent appraisals and valuations related to inventory, property, plant and equipment and intangible assets. These changes to the purchase price allocation could be significant. The purchase price allocation will be finalized within the measurement period of up to one year from the acquisition date.
In connection with the purchase price allocation, inventories were written up by $33 million to their estimated fair value. During the first quarter of 2017, $14 million before taxes ($8 million after taxes) were expensed to Cost of products sold as the related inventory was sold.
The identifiable intangible assets acquired in connection with the acquisition of the Weyerhaeuser pulp business included the following:
In millions | Estimated Fair Value | Average Remaining Useful Life | |||
Asset Class: | (at acquisition date) | ||||
Customer relationships and lists | $ | 95 | 24 years | ||
Trade names, patents, trademarks and developed technology | 113 | 8 years | |||
Other | 4 | 10 years | |||
Total | $ | 212 | |||
Holmen Paper Newsprint Mill
On June 30, 2016, the Company completed the acquisition of Holmen Paper's newsprint mill in Madrid, Spain. Under the terms of the acquisition agreement, International Paper purchased the Madrid newsprint mill, as well as associated recycling operations and a 50% ownership interest in a cogeneration facility. The Company intends to convert the mill during the second half of 2017 to produce recycled containerboard with an expected capacity of 419,000 tons. Once completed, the converted mill will support the Company's corrugated packaging business in EMEA.
The Company's aggregate purchase price for the mill, recycling operations and 50% ownership of the cogeneration facility was €53 million (approximately $59 million using June 30, 2016 exchange rate). The purchase price allocation was completed in the first quarter of 2017. Approximately $60 million of the purchase price was allocated to property, plant and equipment, $14 million to current assets (primarily cash and accounts receivable), $14 million to equity method investments, $5 million to long-term assets, $9 million to short-term liabilities and $16 million to long-term liabilities related to a supply contract entered into with the seller. The final purchase price allocation indicated that the sum of the cash consideration paid is less than the fair value of the underlying assets by $9 million, resulting in a bargain purchase gain being recorded on this transaction.
10
Additionally, the supply contract estimated losses were increased by $3 million in the first quarter of 2017 based on actual operating results since acquisition. The resulting net $6 million gain was recorded to Net bargain purchase gain on acquisition of business in the accompanying consolidated statement of operations.
NOTE 8 - DIVESTITURES / SPINOFF
Other Divestitures and Impairments
2016: On March 14, 2016, the Company announced that it had entered into a definitive agreement to sell its corrugated packaging business in China and Southeast Asia to Xiamen Bridge Hexing Equity Investment Partnership Enterprise. The sale of this business was completed on June 30, 2016. Under the terms of the transaction and after post-closing adjustments, International Paper received a total of approximately RMB 957 million (approximately $144 million at the June 30, 2016 exchange rate), which included the buyer's assumption of the liability for outstanding loans of approximately $55 million which are payable up to three years from the closing of the sale. In the first quarter of 2017, a $5 million payment was received on the remaining outstanding loans and as of March 31, 2017, the remaining payments to be received related to the assumed loans totaled $9 million.
Subsequent to the announced agreement in March 2016, a determination was made that the current book value of the asset group exceeded its estimated fair value of $155 million which was the agreed upon selling price, less costs incurred to sell. As a result, a pre-tax charge of $37 million was recorded during the first quarter of 2016 in the Company's Industrial Packaging segment to write down the long-lived assets of this business to their estimated fair value.
The amount of pre-tax losses related to the IP Asia Packaging business included in the Company's consolidated statement of operations were $41 million for the three months ended March 31, 2016.
NOTE 9 - SUPPLEMENTAL FINANCIAL STATEMENT INFORMATION
Temporary Investments
Temporary investments with an original maturity of three months or less are treated as cash equivalents and are stated at cost. Temporary investments totaled $727 million and $757 million at March 31, 2017 and December 31, 2016, respectively.
Accounts and Notes Receivable
In millions | March 31, 2017 | December 31, 2016 | |||||
Accounts and notes receivable, net: | |||||||
Trade | $ | 2,832 | $ | 2,759 | |||
Other | 246 | 242 | |||||
Total | $ | 3,078 | $ | 3,001 | |||
The allowance for doubtful accounts was $72 million and $70 million at March 31, 2017 and December 31, 2016, respectively.
Inventories
In millions | March 31, 2017 | December 31, 2016 | |||||
Raw materials | $ | 293 | $ | 296 | |||
Finished pulp, paper and packaging | 1,382 | 1,381 | |||||
Operating supplies | 623 | 661 | |||||
Other | 96 | 100 | |||||
Total | $ | 2,394 | $ | 2,438 | |||
Depreciation
Accumulated depreciation was $22.0 billion and $21.6 billion at March 31, 2017 and December 31, 2016. Depreciation expense was $324 million and $267 million for the three months ended March 31, 2017 and 2016, respectively.
Interest
Interest payments made during the three months ended March 31, 2017 and 2016 were $212 million and $136 million, respectively.
11
Amounts related to interest were as follows:
Three Months Ended March 31, | |||||||
In millions | 2017 | 2016 | |||||
Interest expense | $ | 187 | $ | 160 | |||
Interest income | 45 | 37 | |||||
Capitalized interest costs | 6 | 7 | |||||
NOTE 10 - GOODWILL AND OTHER INTANGIBLES
Goodwill
The following table presents changes in goodwill balances as allocated to each business segment for the three-month period ended March 31, 2017:
In millions | Industrial Packaging | Global Cellulose Fibers | Printing Papers | Consumer Packaging | Total | ||||||||||||||
Balance as of January 1, 2017 | |||||||||||||||||||
Goodwill | $ | 3,316 | $ | 19 | $ | 2,143 | $ | 1,664 | $ | 7,142 | |||||||||
Accumulated impairment losses (a) | (237 | ) | — | (1,877 | ) | (1,664 | ) | (3,778 | ) | ||||||||||
3,079 | 19 | 266 | — | 3,364 | |||||||||||||||
Reclassifications and other (b) | 2 | — | 9 | — | 11 | ||||||||||||||
Additions/reductions | — | 28 | (c) | (1 | ) | (d) | — | 27 | |||||||||||
Balance as of March 31, 2017 | |||||||||||||||||||
Goodwill | 3,318 | 47 | 2,151 | 1,664 | 7,180 | ||||||||||||||
Accumulated impairment losses (a) | (237 | ) | — | (1,877 | ) | (1,664 | ) | (3,778 | ) | ||||||||||
Total | $ | 3,081 | $ | 47 | $ | 274 | $ | — | $ | 3,402 | |||||||||
(a) | Represents accumulated goodwill impairment charges since the adoption of ASC 350, “Intangibles – Goodwill and Other” in 2002. |
(b) | Represents the effects of foreign currency translations and reclassifications. |
(c) | Represents purchase price adjustments related to the the newly acquired pulp business. |
(d) | Reflects a reduction from tax benefits generated by the deduction of goodwill amortization for tax purposes in Brazil. |
Other Intangibles
Identifiable intangible assets comprised the following:
March 31, 2017 | December 31, 2016 | ||||||||||||||
In millions | Gross Carrying Amount | Accumulated Amortization | Gross Carrying Amount | Accumulated Amortization | |||||||||||
Customer relationships and lists | $ | 610 | $ | 223 | $ | 605 | $ | 211 | |||||||
Non-compete agreements | 72 | 68 | 69 | 64 | |||||||||||
Tradenames, patents and trademarks, and developed technology | 173 | 61 | 173 | 56 | |||||||||||
Land and water rights | 10 | 2 | 10 | 2 | |||||||||||
Software | 22 | 21 | 21 | 20 | |||||||||||
Other | 49 | 26 | 48 | 26 | |||||||||||
Total | $ | 936 | $ | 401 | $ | 926 | $ | 379 | |||||||
The Company recognized the following amounts as amortization expense related to intangible assets:
Three Months Ended March 31, | |||||||
In millions | 2017 | 2016 | |||||
Amortization expense related to intangible assets | $ | 16 | $ | 12 | |||
12
NOTE 11 - INCOME TAXES
International Paper made income tax payments, net of refunds, of $29 million and $6 million for the three months ended March 31, 2017 and 2016, respectively.
The following table presents a rollforward of unrecognized tax benefits and related accrued estimated interest and penalties for the three months ended March 31, 2017:
In millions | Unrecognized Tax Benefits | Accrued Estimated Interest and Tax Penalties | |||||
Balance at December 31, 2016 | $ | (98 | ) | $ | (22 | ) | |
Activity for three months ended March 31, 2017 | (2 | ) | 2 | ||||
Balance at March 31, 2017 | $ | (100 | ) | $ | (20 | ) | |
The Company currently estimates, that as a result of ongoing discussions, pending tax settlements and expirations of statutes of limitations, the amount of unrecognized tax benefits could be reduced by approximately $5 million during the next 12 months.
Included in the Company’s income tax provisions for the three months ended March 31, 2017 and 2016, are $7 million and $74 million of income tax benefits, respectively, related to special items. The components of the net provision related to special items were as follows:
Three Months Ended March 31, | |||||||
In millions | 2017 | 2016 | |||||
Special items | $ | 8 | $ | (3 | ) | ||
Tax-related adjustments: | |||||||
International investment restructurings | (15 | ) | (57 | ) | |||
2010-2012 IRS audit closure | — | (14 | ) | ||||
Income tax provision (benefit) related to special items | $ | (7 | ) | $ | (74 | ) | |
NOTE 12 - COMMITMENTS AND CONTINGENCIES
Environmental
International Paper has been named as a potentially responsible party (PRP) in environmental remediation actions under various federal and state laws, including the Comprehensive Environmental Response, Compensation and Liability Act (CERCLA). Many of these proceedings involve the cleanup of hazardous substances at large commercial landfills that received waste from many different sources. While joint and several liability is authorized under CERCLA and equivalent state laws, as a practical matter, liability for CERCLA cleanups is typically allocated among the many PRPs. There are other remediation costs typically associated with the cleanup of hazardous substances at the Company’s current, closed or formerly-owned facilities, and recorded as liabilities in the balance sheet. Remediation costs are recorded in the consolidated financial statements when they become probable and reasonably estimable. International Paper has estimated the probable liability associated with these matters to be approximately $134 million in the aggregate at March 31, 2017. Other than as described above, completion of required remedial actions is not expected to have a material effect on our consolidated financial statements.
Cass Lake: One of the matters included above arises out of a closed wood-treating facility located in Cass Lake, Minnesota. In June 2011, the United States Environmental Protection Agency (EPA) selected and published a proposed soil remedy at the site with an estimated cost of $46 million. The overall remediation reserve for the site is currently $49 million to address the selection of an alternative for the soil remediation component of the overall site remedy which includes the ongoing groundwater remedy. In October 2011, the EPA released a public statement indicating that the final soil remedy decision would be delayed. In March 2016, the EPA issued a proposed plan concerning clean-up standards at a portion of the site, the estimated cost of which is included within the $49 million reserve referenced above. In October 2012, the Natural Resource Trustees for this site provided notice to International Paper and other potentially responsible parties of their intent to perform a Natural Resource Damage Assessment. It is premature to predict the outcome of the assessment or to estimate a loss or range of loss, if any, which may be incurred.
Kalamazoo River: The Company is a PRP with respect to the Allied Paper, Inc./Portage Creek/Kalamazoo River Superfund Site in Michigan. The EPA asserts that the site is contaminated by polychlorinated biphenyls (PCBs) primarily as a result of
13
discharges from various paper mills located along the Kalamazoo River, including a paper mill (the Allied Paper Mill) formerly owned by St. Regis Paper Company (St. Regis). The Company is a successor in interest to St. Regis.
• | In March 2016, the Company and other PRPs received a special notice letter from the EPA (i) inviting participation in implementing a remedy for a portion of the site, and (ii) demanding reimbursement of EPA past costs related to this portion of the site totaling $37 million, including $19 million in past costs previously demanded by the EPA. The Company responded to the special notice letter. In December 2016, the EPA issued a unilateral administrative order to the Company and other PRPs to perform the remedy for this portion of the site. The Company responded to the unilateral administrative order agreeing to comply with the order subject to its sufficient cause defenses. |
• | In April 2016, the EPA issued a separate unilateral administrative order to the Company and certain other PRPs for a time-critical removal action (TCRA) of PCB-contaminated sediments from a different portion of the site. The Company responded to the unilateral administrative order and agreeing to comply with the order subject to its sufficient cause defenses. |
• | In October 2016, the Company and another PRP received a special notice letter from the EPA inviting participation in the remedial design component of the landfill remedy for the Allied Paper Mill. The record of decision establishing the final landfill remedy for the Allied Paper Mill was issued by the EPA in September 2016. The Company responded to the Allied Paper Mill special notice letter in late December 2016. In February 2017, the EPA informed the Company that it would make other arrangements for the performance of the remedial design. |
The Company’s CERCLA liability has not been finally determined with respect to these or any other portions of the site, and except as noted above, the Company has declined to perform any work or reimburse the EPA at this time. As noted below, the Company is involved in allocation/apportionment litigation with regard to the site. Accordingly, it is premature to predict the outcome or estimate our maximum reasonably possible loss with respect to this site. However, we do not believe that any material loss is probable.
The Company was named as a defendant by Georgia-Pacific Consumer Products LP, Fort James Corporation and Georgia Pacific LLC in a contribution and cost recovery action for alleged pollution at the site. The suit seeks contribution under CERCLA for costs purportedly expended by plaintiffs ($79 million as of the filing of the complaint) and for future remediation costs. The suit alleges that a mill, during the time it was allegedly owned and operated by St. Regis, discharged PCB contaminated solids and paper residuals resulting from paper de-inking and recycling. NCR Corporation and Weyerhaeuser Company are also named as defendants in the suit. In mid-2011, the suit was transferred from the District Court for the Eastern District of Wisconsin to the District Court for the Western District of Michigan. The trial of the initial liability phase took place in February 2013. Weyerhaeuser conceded prior to trial that it was a liable party with respect to the site. In September 2013, an opinion and order was issued in the suit. The order concluded that the Company (as the successor to St. Regis) was not an “operator,” but was an “owner,” of the mill at issue during a portion of the relevant period and is therefore liable under CERCLA. The order also determined that NCR is a liable party as an "arranger for disposal" of PCBs in waste paper that was de-inked and recycled by mills along the Kalamazoo River. The order did not address the Company's responsibility, if any, for past or future costs. The parties’ responsibility, including that of the Company, was the subject of a second trial, which was concluded in late 2015. A decision has not been rendered and it is unclear to what extent the Court will address responsibility for future costs in that decision. We are unable to predict the outcome or estimate our maximum reasonably possible loss. However, we do not believe that any material loss is probable.
Harris County: International Paper and McGinnis Industrial Maintenance Corporation (MIMC), a subsidiary of Waste Management, Inc., are PRPs at the San Jacinto River Waste Pits Superfund Site (the San Jacinto River Superfund Site) in Harris County, Texas. The PRPs have been actively participating in the activities at the site. In September 2016, the EPA issued a proposed remedial action plan (PRAP) for the site, which identifies the preferred remedy as the removal of the contaminated material currently protected by an armored cap. In addition, the EPA selected a preferred remedy for the separate southern impoundment that requires offsite disposal. In January 2017, the PRPs submitted comments on the PRAP. At this stage, it is premature to predict the outcome or estimate our maximum reasonably possible loss with respect to this site. However, we do not believe that any material loss is probable.
The Company is also defending an additional lawsuit related to the San Jacinto River Superfund Site brought by approximately 400 individuals who allege property damage and personal injury. Because this case is still in the discovery phase, it is premature to predict the outcome or to estimate a loss or range of loss, if any, which may be incurred.
14
Antitrust
Containerboard: In September 2010, eight containerboard producers, including International Paper and Temple-Inland, were named as defendants in a purported class action complaint that alleged a civil violation of Section 1 of the Sherman Act. The suit is captioned Kleen Products LLC v. International Paper Co. (N.D. Ill.). The complaint alleges that the defendants, beginning in February 2004 through November 2010, conspired to limit the supply and thereby increase prices of containerboard products. The class is all persons who purchased containerboard products directly from any defendant for use or delivery in the United States during the period February 2004 to November 2010. The complaint seeks to recover unspecified treble damages and attorneys' fees on behalf of the purported class. Four similar complaints were filed and have been consolidated in the Northern District of Illinois. In March 2015, the District Court certified a class of direct purchasers of containerboard products; in June 2015, the United States Court of Appeals for the Seventh Circuit granted the defendants' petition to appeal, and in August 2016, affirmed the District Court's decision on all counts. In April 2017, the United States Supreme Court denied the Company’s petition for discretionary review (petition for writ of certiorari) of the class certification decision. The Kleen Products litigation continues to progress, and briefing of the parties' dispositive motions and expert challenges is well underway and expected to be completed by the end of the second quarter of 2017.
In June 2016, a lawsuit captioned Ashley Furniture Indus., Inc. v. Packaging Corporation of America (W.D. Wis.), was filed in federal court in Wisconsin. The Ashley Furniture lawsuit closely tracks the allegations found in the Kleen Products complaint but also asserts Wisconsin state antitrust claims. Moreover, in January 2011, International Paper was named as a defendant in a lawsuit filed in state court in Cocke County, Tennessee alleging that International Paper violated Tennessee law by conspiring to limit the supply and fix the prices of containerboard from mid-2005 to the present. Plaintiffs in the state court action seek certification of a class of Tennessee indirect purchasers of containerboard products, damages and costs, including attorneys' fees. No class certification materials have been filed to date in the Tennessee action.
The Company continues to dispute the allegations made in these lawsuits and vigorously defend each action consistent with the best long-term interest of our shareowners. It is reasonably possible that potential loss in these actions could be material. At this time, however, because the Kleen Products action is in the pretrial motions stage and the Tennessee and Ashley Furniture actions are in a preliminary stage, we are unable to predict an outcome or estimate a range of reasonably possible loss.
Tax
On October 16, 2015, the Company was notified of a $115 million tax assessment issued by the state of Sao Paulo, Brazil (State) for tax years 2011 through 2013. The assessment pertains to invoices issued by the Company related to the sale of paper to the editorial segment, which is exempt from the payment of ICMS value-added tax. This assessment is in the preliminary stage. The Company does not believe that a material loss is probable. During the second quarter of 2016, the Company received a favorable first instance judgment vacating the State's assessment. The Company anticipates that the State will appeal the judgment.
General
The Company is involved in various other inquiries, administrative proceedings and litigation relating to environmental and safety matters, personal injury, labor and employment, contracts, sales of property, intellectual property and other matters, some of which allege substantial monetary damages. While any proceeding or litigation has the element of uncertainty, the Company believes that the outcome of any of these lawsuits or claims that are pending or threatened or all of them combined (other than those that cannot be assessed due to their preliminary nature) will not have a material effect on its consolidated financial statements.
15
NOTE 13 - VARIABLE INTEREST ENTITIES AND PREFERRED SECURITIES OF SUBSIDIARIES
Variable Interest Entities
As of March 31, 2017, the fair value of the Timber Notes and Extension Loans is $4.74 billion and $4.29 billion, respectively, for the 2015 Financing Entites. The Timber Notes and Extension Loans are classified as Level 2 within the fair value hierarchy, which is further defined in Note 14 in the Company’s Annual Report on Form 10-K for the year ended December 31, 2016.
Activity between the Company and the 2015 Financing Entities was as follows:
Three Months Ended March 31, | |||||||
In millions | 2017 | 2016 | |||||
Revenue (a) | $ | 24 | $ | 24 | |||
Expense (a) | 32 | 32 | |||||
Cash receipts (b) | 47 | 29 | |||||
Cash payments (c) | 64 | 34 | |||||
(a) | The revenue and expense are included in Interest expense, net in the accompanying consolidated statement of operations. |
(b) | The cash receipts are interest received on the Financial assets of special purpose entities. |
(c) | The cash payments represent interest paid on Nonrecourse financial liabilities of special purpose entities. |
As of March 31, 2017, the fair value of the Timber Notes and Extension Loans is $2.20 billion and $2.06 billion, respectively, for the 2007 Financing Entities. The Timber Notes and Extension Loans are classified as Level 2 within the fair value hierarchy, which is further defined in Note 14 in the Company’s Annual Report on Form 10-K for the year ended December 31, 2016.
Activity between the Company and the 2007 Financing Entities was as follows:
Three Months Ended March 31, | |||||||
In millions | 2017 | 2016 | |||||
Revenue (a) | $ | 13 | $ | 8 | |||
Expense (b) | 15 | 7 | |||||
Cash receipts (c) | 6 | 2 | |||||
Cash payments (d) | 9 | 6 | |||||
(a) | The revenue is included in Interest expense, net in the accompanying consolidated statement of operations and includes approximately $5 million for each of the three months ended March 31, 2017 and 2016, respectively, of accretion income for the amortization of the purchase accounting adjustment on the Financial assets of special purpose entities. |
(b) | The expense is included in Interest expense, net in the accompanying consolidated statement of operations and includes approximately $2 million for each of the three months ended March 31, 2017 and 2016, respectively, of accretion expense for the amortization of the purchase accounting adjustment on the Nonrecourse financial liabilities of special purpose entities. |
(c) | The cash receipts are interest received on the Financial assets of special purpose entities. |
(d) | The cash payments are interest paid on Nonrecourse financial liabilities of special purpose entities. |
NOTE 14 - DEBT
In June 2016, International Paper entered into a commercial paper program with a borrowing capacity of $750 million. Under the terms of the program, individual maturities may vary, but not exceed one year from the date of issue. Interest bearing notes may be issued either as fixed or floating rate notes. As of March 31, 2017, the company had $310 million of borrowings outstanding under the program.
At March 31, 2017, the fair value of International Paper’s $11.3 billion of debt was approximately $12.0 billion. The fair value of the Company’s long-term debt is estimated based on the quoted market prices for the same or similar issues. International Paper’s long-term debt is classified as Level 2 within the fair value hierarchy, which is further defined in Note 14 in the Company’s Annual Report on Form 10-K for the year ended December 31, 2016.
Maintaining an investment-grade credit rating is an important element of International Paper’s financing strategy. At March 31, 2017, the Company held long-term credit ratings of BBB (stable outlook) and Baa2 (stable outlook) by S&P and Moody’s, respectively.
16
NOTE 15 - DERIVATIVES AND HEDGING ACTIVITIES
As a multinational company we are exposed to market risks, such as changes in interest rates, currency exchanges rates and commodity prices.
For detailed information regarding the Company’s hedging activities and related accounting, refer to Note 14 in the Company’s Annual Report on Form 10-K for the fiscal year ended December 31, 2016.
The notional amounts of qualifying and non-qualifying financial instruments used in hedging transactions were as follows:
In millions | March 31, 2017 | December 31, 2016 | ||||||
Derivatives in Cash Flow Hedging Relationships: | ||||||||
Foreign exchange contracts (a) | $ | 260 | $ | 275 | ||||
Derivatives Not Designated as Hedging Instruments: | ||||||||
Electricity contract | — | 6 | ||||||
Foreign exchange contracts | 18 | 24 | ||||||
(a) | These contracts had maturities of two years or less as of March 31, 2017. |
The following table shows gains or losses recognized in AOCI, net of tax, related to derivative instruments:
Gain (Loss) Recognized in AOCI on Derivatives (Effective Portion) | |||||||
Three Months Ended March 31, | |||||||
In millions | 2017 | 2016 | |||||
Foreign exchange contracts | $ | 9 | $ | 4 | |||
Total | $ | 9 | $ | 4 | |||
During the next 12 months, the amount of the March 31, 2017 AOCI balance, after tax, that is expected to be reclassified to earnings is a gain of $4 million.
The amounts of gains and losses recognized in the consolidated statement of operations on qualifying and non-qualifying financial instruments used in hedging transactions were as follows:
Gain (Loss) Reclassified from AOCI (Effective Portion) | Location of Gain (Loss) Reclassified from AOCI (Effective Portion) | |||||||
Three Months Ended March 31, | ||||||||
In millions | 2017 | 2016 | ||||||
Derivatives in Cash Flow Hedging Relationships: | ||||||||
Foreign exchange contracts | $ | 2 | $ | 1 | Cost of products sold | |||
Total | $ | 2 | $ | 1 | ||||
Gain (Loss) Recognized | Location of Gain (Loss) In Consolidated Statement of Operations | ||||||||
Three Months Ended March 31, | |||||||||
In millions | 2017 | 2016 | |||||||
Derivatives Not Designated as Hedging Instruments: | |||||||||
Electricity contract | $ | (1 | ) | $ | (2 | ) | Cost of products sold | ||
Interest rate contracts | — | 2 | Interest expense, net | ||||||
Total | $ | (1 | ) | $ | — | ||||
17
The following activity is related to fully effective interest rate swaps designated as fair value hedges:
2017 | 2016 | ||||||||||||||||||||||
In millions | Issued | Terminated | Undesignated | Issued | Terminated | Undesignated | |||||||||||||||||
First Quarter | $ | — | $ | — | $ | — | $ | — | $ | 55 | $ | — | |||||||||||
Total | $ | — | $ | — | $ | — | $ | — | $ | 55 | $ | — | |||||||||||
Fair Value Measurements
For a discussion of the Company’s fair value measurement policies under the fair value hierarchy, refer to Note 14 in the Company’s Annual Report on Form 10-K for the fiscal year ended December 31, 2016.
The Company has not changed its valuation techniques for measuring the fair value of any financial assets or liabilities during the year. Transfers between levels, if any, are recognized at the end of the reporting period.
The following table provides a summary of the impact of our derivative instruments in the consolidated balance sheet:
Fair Value Measurements
Level 2 – Significant Other Observable Inputs
Assets | Liabilities | |||||||||||||||
In millions | March 31, 2017 | December 31, 2016 | March 31, 2017 | December 31, 2016 | ||||||||||||
Derivatives designated as hedging instruments | ||||||||||||||||
Foreign exchange contracts – cash flow | $ | 9 | (a) | $ | 3 | (a) | $ | 1 | (b) | $ | 4 | (b) | ||||
Total derivatives designated as hedging instruments | 9 | 3 | 1 | 4 | ||||||||||||
Derivatives not designated as hedging instruments | ||||||||||||||||
Electricity contract | — | — | 3 | (b) | 2 | (b) | ||||||||||
Total derivatives not designated as hedging instruments | — | — | 3 | 2 | ||||||||||||
Total derivatives | $ | 9 | $ | 3 | $ | 4 | $ | 6 | ||||||||
(a) | Included in Other current assets in the accompanying consolidated balance sheet. |
(b) | Included in Other accrued liabilities in the accompanying consolidated balance sheet. |
The above contracts are subject to enforceable master netting arrangements that provide rights of offset with each counterparty when amounts are payable on the same date in the same currency or in the case of certain specified defaults. Management has made an accounting policy election to not offset the fair value of recognized derivative assets and derivative liabilities in the consolidated balance sheet. The amounts owed to the counterparties and owed to the Company are considered immaterial with respect to each counterparty and in the aggregate with all counterparties.
Credit-Risk-Related Contingent Features
Certain of the Company’s financial instruments used in hedging transactions are governed by standard credit support arrangements with counterparties. If the lower of the Company’s credit rating by Moody’s or S&P were to drop below investment grade, the Company would be required to post collateral for all of its derivatives in a net liability position, although no derivatives would terminate. The fair values of derivative instruments containing credit risk-related contingent features in a net liability position were $1 million and $3 million as of March 31, 2017 and December 31, 2016, respectively. The Company was not required to post any collateral as of March 31, 2017 or December 31, 2016. For more information on credit-risk-related contingent features, refer to Note 14 in the Company’s Annual Report on Form 10-K for the fiscal year ended December 31, 2016.
NOTE 16 - RETIREMENT PLANS
International Paper sponsors and maintains the Retirement Plan of International Paper Company (the Pension Plan), a tax-qualified defined benefit pension plan that provides retirement benefits to substantially all U.S. salaried employees and hourly employees (receiving salaried benefits) hired prior to July 1, 2004, and substantially all other U.S. hourly and union employees who work at a participating business unit regardless of hire date. These employees generally are eligible to participate in the Pension Plan upon attaining 21 years of age and completing one year of eligibility service. U.S. salaried employees and hourly employees (receiving salaried benefits) hired after June 30, 2004, are not eligible for the Pension Plan, but receive a company contribution to their individual savings plan accounts; however, salaried employees hired by Temple Inland prior to March 1, 2007 or Weyerhaeuser Company's Cellulose Fibers division prior to December 1, 2011 also participate in the Pension Plan.
18
The Pension Plan provides defined pension benefits based on years of credited service and either final average earnings (salaried employees and hourly employees receiving salaried benefits), hourly job rates or specified benefit rates (hourly and union employees). A detailed discussion of these plans is presented in Note 16 to the consolidated financial statements included in the Company’s Annual Report on Form 10-K for the fiscal year ended December 31, 2016.
The Company will freeze participation, including credited service and compensation, for salaried employees under the Pension Plan, the Pension Restoration Plan and the two SERP plans for all service on or after January 1, 2019. This change will not affect benefits accrued through December 31, 2018.
Net periodic pension expense for our qualified and nonqualified U.S. defined benefit plans comprised the following:
Three Months Ended March 31, | |||||||
In millions | 2017 | 2016 | |||||
Service cost | $ | 40 | $ | 37 | |||
Interest cost | 138 | 156 | |||||
Expected return on plan assets | (192 | ) | (206 | ) | |||
Actuarial loss | 85 | 94 | |||||
Amortization of prior service cost | 7 | 10 | |||||
Net periodic pension expense | $ | 78 | $ | 91 | |||
The Company’s funding policy for our pension plans is to contribute amounts sufficient to meet legal funding requirements, plus any additional amounts that the Company may determine to be appropriate considering the funded status of the plan, tax deductibility, the cash flows generated by the Company, and other factors. No cash contributions were made to the qualified pension plan in the first three months of 2017 or 2016. The nonqualified defined benefit plans are funded to the extent of benefit payments, which totaled $5 million for the three months ended March 31, 2017.
NOTE 17 - STOCK-BASED COMPENSATION
International Paper has an Incentive Compensation Plan (ICP) which is administered by the Management Development and Compensation Committee of the Board of Directors (the Committee). The ICP authorizes the grants of restricted stock, restricted or deferred stock units, performance awards payable in cash or stock upon the attainment of specified performance goals, dividend equivalents, stock options, stock appreciation rights, other stock-based awards and cash-based awards at the discretion of the Committee. A detailed discussion of the ICP, including the now discontinued stock option program and executive continuity award program that provided for tandem grants of restricted stock and stock options, is presented in Note 18 to the consolidated financial statements included in the Company’s Annual Report on Form 10-K for the fiscal year ended December 31, 2016. As of March 31, 2017, 13.0 million shares were available for grant under the ICP.
Stock-based compensation expense and related income tax benefits were as follows:
Three Months Ended March 31, | |||||||
In millions | 2017 | 2016 | |||||
Total stock-based compensation expense (selling and administrative) | $ | 43 | $ | 26 | |||
Income tax benefits related to stock-based compensation | 48 | 33 | |||||
At March 31, 2017, $171 million, net of estimated forfeitures, of compensation cost related to unvested restricted performance shares, executive continuity awards and restricted stock attributable to future service had not yet been recognized. This amount will be recognized in expense over a weighted-average period of 2.1 years.
Performance Share Plan
During the first three months of 2017, the Company granted 2.2 million performance units at an average grant date fair value of $51.78.
19
NOTE 18 - BUSINESS SEGMENT INFORMATION
International Paper’s business segments, Industrial Packaging, Global Cellulose Fibers, Printing Papers, and Consumer Packaging are consistent with the internal structure used to manage these businesses. All segments are differentiated on a common product, common customer basis consistent with the business segmentation generally used in the Forest Products industry. Subsequent to the acquisition of the Weyerhaeuser pulp business in December 2016, the Company began reporting the Global Cellulose Fibers business as a separate business segment due to the increased materiality of the results of this business. This segment includes the Company's legacy pulp business and the newly acquired pulp business. As such, amounts related to the legacy pulp business have been reclassified out of the Printing Papers business segment and into the new Global Cellulose Fibers business segment for all prior periods. In addition, during the first quarter of 2017, as a result of an internal reorganization, the net sales and operating profits for the Asian Distribution operations are included in the results of the businesses that manufacture the products and prior year amounts have been reclassified to conform with current year presentation.
Business segment operating profits are used by International Paper's management to measure the earnings performance of its businesses. Management believes that this measure allows a better understanding of trends in costs, operating efficiencies, prices and volumes. Business segment operating profits are defined as earnings (loss) from continuing operations before income taxes and equity earnings, but included the impact of equity earnings and noncontrolling interests, excluding corporate items and corporate special items.
The Company also has a 50% equity interest in Ilim Holding S.A. (Ilim) in Russia that is a separate reportable business segment. The Company recorded equity earnings (losses), net of taxes, of $50 million and $62 million for the three months ended March 31, 2017 and 2016, respectively, for Ilim. The Company received cash dividends from the joint venture of $127 million during the first quarter of 2017. At March 31, 2017 and December 31, 2016, the Company's investment in Ilim was $247 million and $302 million, respectively, which was $159 million and $164 million, respectively, more than the Company's proportionate share of the joint venture's underlying net assets. The differences primarily relate to purchase price fair value adjustments and currency translation adjustments. The Company is party to a joint marketing agreement with Ilim, under which the Company purchases, markets and sells paper produced by Ilim. Purchases under this agreement were $47 million and $39 million for the three months ended March 31, 2017 and 2016, respectively.
Sales by business segment for the three months ended March 31, 2017 and 2016 were as follows:
Three Months Ended March 31, | ||||||||
In millions | 2017 | 2016 | ||||||
Industrial Packaging | $ | 3,499 | $ | 3,411 | ||||
Global Cellulose Fibers | 564 | 212 | ||||||
Printing Papers | 995 | 972 | ||||||
Consumer Packaging | 466 | 495 | ||||||
Corporate and Intersegment Sales | (13 | ) | 20 | |||||
Net Sales | $ | 5,511 | $ | 5,110 | ||||
20
Operating profit by business segment for the three months ended March 31, 2017 and 2016 were as follows:
Three Months Ended March 31, | ||||||||
In millions | 2017 | 2016 | ||||||
Industrial Packaging | $ | 365 | (a) | $ | 396 | (c) | ||
Global Cellulose Fibers | (70 | ) | (b) | (50 | ) | |||
Printing Papers | 100 | 135 | ||||||
Consumer Packaging | 33 | 16 | (d) | |||||
Business Segment Operating Profit | 428 | 497 | ||||||
Earnings (loss) from continuing operations before income taxes and equity earnings | 244 | 317 | ||||||
Interest expense, net | 142 | 123 | ||||||
Noncontrolling interests/equity earnings adjustment (e) | — | — | ||||||
Corporate items, net | 11 | 21 | ||||||
Restructuring and other charges | — | (8 | ) | |||||
Non-operating pension expense | 31 | 44 | ||||||
Adjusted Operating Profit | $ | 428 | $ | 497 | ||||
Equity earnings (loss), net of taxes – Ilim | $ | 50 | $ | 62 | ||||
(a) | Includes a gain of $6 million for the three months ended March 31, 2017 for a net bargain purchase gain on the June 2016 acquisition of the Holmen Paper newsprint mill in Madrid, Spain and a charge of $1 million for the three months ended March 31, 2017 for other items. |
(b) | Includes a charge of $14 million for the three months ended March 31, 2017 for the amortization of the inventory fair value step-up for the pulp business acquired in December 2016, a charge of $4 million for the three months ended March 31, 2017 for costs associated with the acquisition of that business and a charge of $1 million for the three months ended March 31, 2017 for other items. |
(c) | Includes a charge of $37 million for the three months ended March 31, 2016 for the impairment of the assets of our Asia corrugated packaging business and costs associated with the sale of the business. |
(d) | Includes a charge of $9 million for the three months ended March 31, 2016 for costs associated with the Riegelwood mill conversion to 100% pulp production. |
(e) | Operating profits for business segments include each segment's percentage share of the profits of subsidiaries included in that segment that are less than wholly owned. The pre-tax noncontrolling interest and equity earnings for these subsidiaries are adjusted here to present consolidated earnings before income taxes and equity earnings. |
21
ITEM 2. | MANAGEMENT’S DISCUSSION AND ANALYSIS OF FINANCIAL CONDITION AND RESULTS OF OPERATIONS |
EXECUTIVE SUMMARY
Diluted earnings (loss) attributable to International Paper common shareholders were $209 million ($0.50 per share) in the first quarter of 2017, compared with $218 million ($0.53 per share) in the fourth quarter of 2016 and $334 million ($0.81 per share) in the first quarter of 2016. Adjusted Operating Earnings is a non-GAAP measure and is defined as net earnings from continuing operations (a GAAP measure) excluding special items and non-operating pension expense. International Paper generated Adjusted Operating Earnings Attributable to International Paper Common Shareholders of $249 million ($0.60 per share) in the first quarter of 2017, compared with 2016 fourth-quarter earnings of $303 million ($0.73 per share) and 2016 first-quarter earnings of $330 million ($0.80 per share).
International Paper delivered solid results in what was a transitional quarter for the Company. During the first quarter, the Company realized benefits from previously announced price increases and several additional price increase announcements were made as well across our businesses. The Company was able to effectively manage through the Pensacola mill digester incident with the successful start-up of the mill in early April. The integration of the newly acquired pulp business continues to progress well with first quarter synergies in line with our expectations.
The Company saw a meaningful uplift in price in the 2017 first quarter, primarily driven by the implementation of the price increases announced in October 2016 in our North American Industrial Packaging business, as well as some benefit from price increases announced in the 2017 first quarter in the Global Cellulose Fibers business. Volumes were seasonally lower than the 2016 fourth quarter, as expected, in our North American Industrial Packaging, EMEA and Brazilian Printing Papers businesses Input costs were significantly higher, driven by rapidly escalating prices for recycled fiber. Maintenance outages were higher compared to the 2016 fourth quarter, including a significant outage at the Global Cellulose Fibers Port Wentworth mill in connection with an energy reduction project. Our Ilim joint venture experienced seasonally lower volume and higher input costs offset by the positive impact from foreign currency movements, primarily driven by Ilim’s U.S. dollar denominated debt. In addition, International Paper received cash dividends from Ilim totaling $127 million in the 2017 first quarter.
Looking ahead to the 2017 second quarter, we anticipate that it will be another transitional quarter for the Company. In our North American Industrial Packaging business, we expect to see the initial benefits of price increases announced in March and the continued realization of price increases on export containerboard. We also expect to see benefits from the implementation of previously announced price increases in our Global Cellulose Fibers business, along with the realization of additional integration synergies. Volumes should be seasonally higher in our North American Industrial Packaging and Consumer Packaging businesses. Maintenance outage expenses are expected to be significantly higher in the second quarter. Input costs, in particular recycled fiber, are expected to remain stable relative to the elevated levels of the 2017 first quarter. Operating costs are expected to benefit from significantly less costs at the Pensacola mill along with the non-repeat of the post maintenance outage start-up issue at our Port Wentworth mill. For our Ilim joint venture, seasonally stronger sales volumes are expected to be partially offset by a heavy maintenance outage quarter.
Adjusted Operating Earnings and Adjusted Operating Earnings Per Share are non-GAAP measures. Diluted earnings (loss) and Diluted earnings (loss) per share attributable to common shareholders are the most direct comparable GAAP measures. The Company calculates Adjusted Operating Earnings by excluding the after-tax effect of items considered by management to be unusual from the earnings reported under GAAP, non-operating pension expense (includes all U.S. pension costs, excluding service costs and prior service costs), and discontinued operations. Adjusted Operating Earnings Per Share is calculated by dividing Adjusted Operating Earnings by diluted average shares of common stock outstanding. Management uses this measure to focus on on-going operations, and believes that it is useful to investors because it enables them to perform meaningful comparisons of past and present operating results. The Company believes that using this information, along with the most direct comparable GAAP measure, provides for a more complete analysis of the results of operations.
22
The following are reconciliations of Diluted earnings (loss) attributable to common shareholders to Adjusted Operating Earnings attributable to common shareholders.
Three Months Ended March 31, | Three Months Ended December 31, | ||||||||||
2017 | 2016 | 2016 | |||||||||
Diluted Earnings (Loss) Attributable to Shareholders | $ | 209 | $ | 334 | $ | 218 | |||||
Add back - Discontinued operations (gain) loss | — | 5 | — | ||||||||
Diluted Earnings (Loss) from Continuing Operations | 209 | 339 | 218 | ||||||||
Add Back - Non-operating pension (income) expense | 31 | 44 | 37 | ||||||||
Add Back - Net special items expense (income) | 14 | 38 | 45 | ||||||||
Income tax effect - Non-operating pension and special items expense | (5 | ) | (91 | ) | 3 | ||||||
Adjusted Operating Earnings (Loss) Attributable to Shareholders | $ | 249 | $ | 330 | $ | 303 | |||||
Three Months Ended March 31, | Three Months Ended December 31, | ||||||||||
2017 | 2016 | 2016 | |||||||||
Diluted Earnings (Loss) Per Share Attributable to Shareholders | $ | 0.50 | $ | 0.81 | $ | 0.53 | |||||
Add Back - Discontinued operations (gain) loss per share | — | 0.01 | — | ||||||||
Diluted Earnings (Loss) Per Share from Continuing Operations | 0.50 | 0.82 | 0.53 | ||||||||
Add Back - Non-operating pension (income) expense per share | 0.07 | 0.11 | 0.09 | ||||||||
Add Back - Net special items expense (income) per share | 0.03 | 0.09 | 0.11 | ||||||||
Income tax effect per share - Non-operating pension and special items expense | — | (0.22 | ) | — | |||||||
Adjusted Operating Earnings (Loss) Per Share Attributable to Shareholders | $ | 0.60 | $ | 0.80 | $ | 0.73 | |||||
RESULTS OF OPERATIONS
For the first quarter of 2017, International Paper Company reported net sales of $5.5 billion, compared with $5.4 billion in the fourth quarter of 2016 and $5.1 billion in the first quarter of 2016.
Net earnings attributable to International Paper totaled $209 million, or $0.50 per share, in the 2017 first quarter. This compared with $334 million, or $0.81 per share, in the first quarter of 2016 and $218 million or $0.53 per share, in the fourth quarter of 2016.
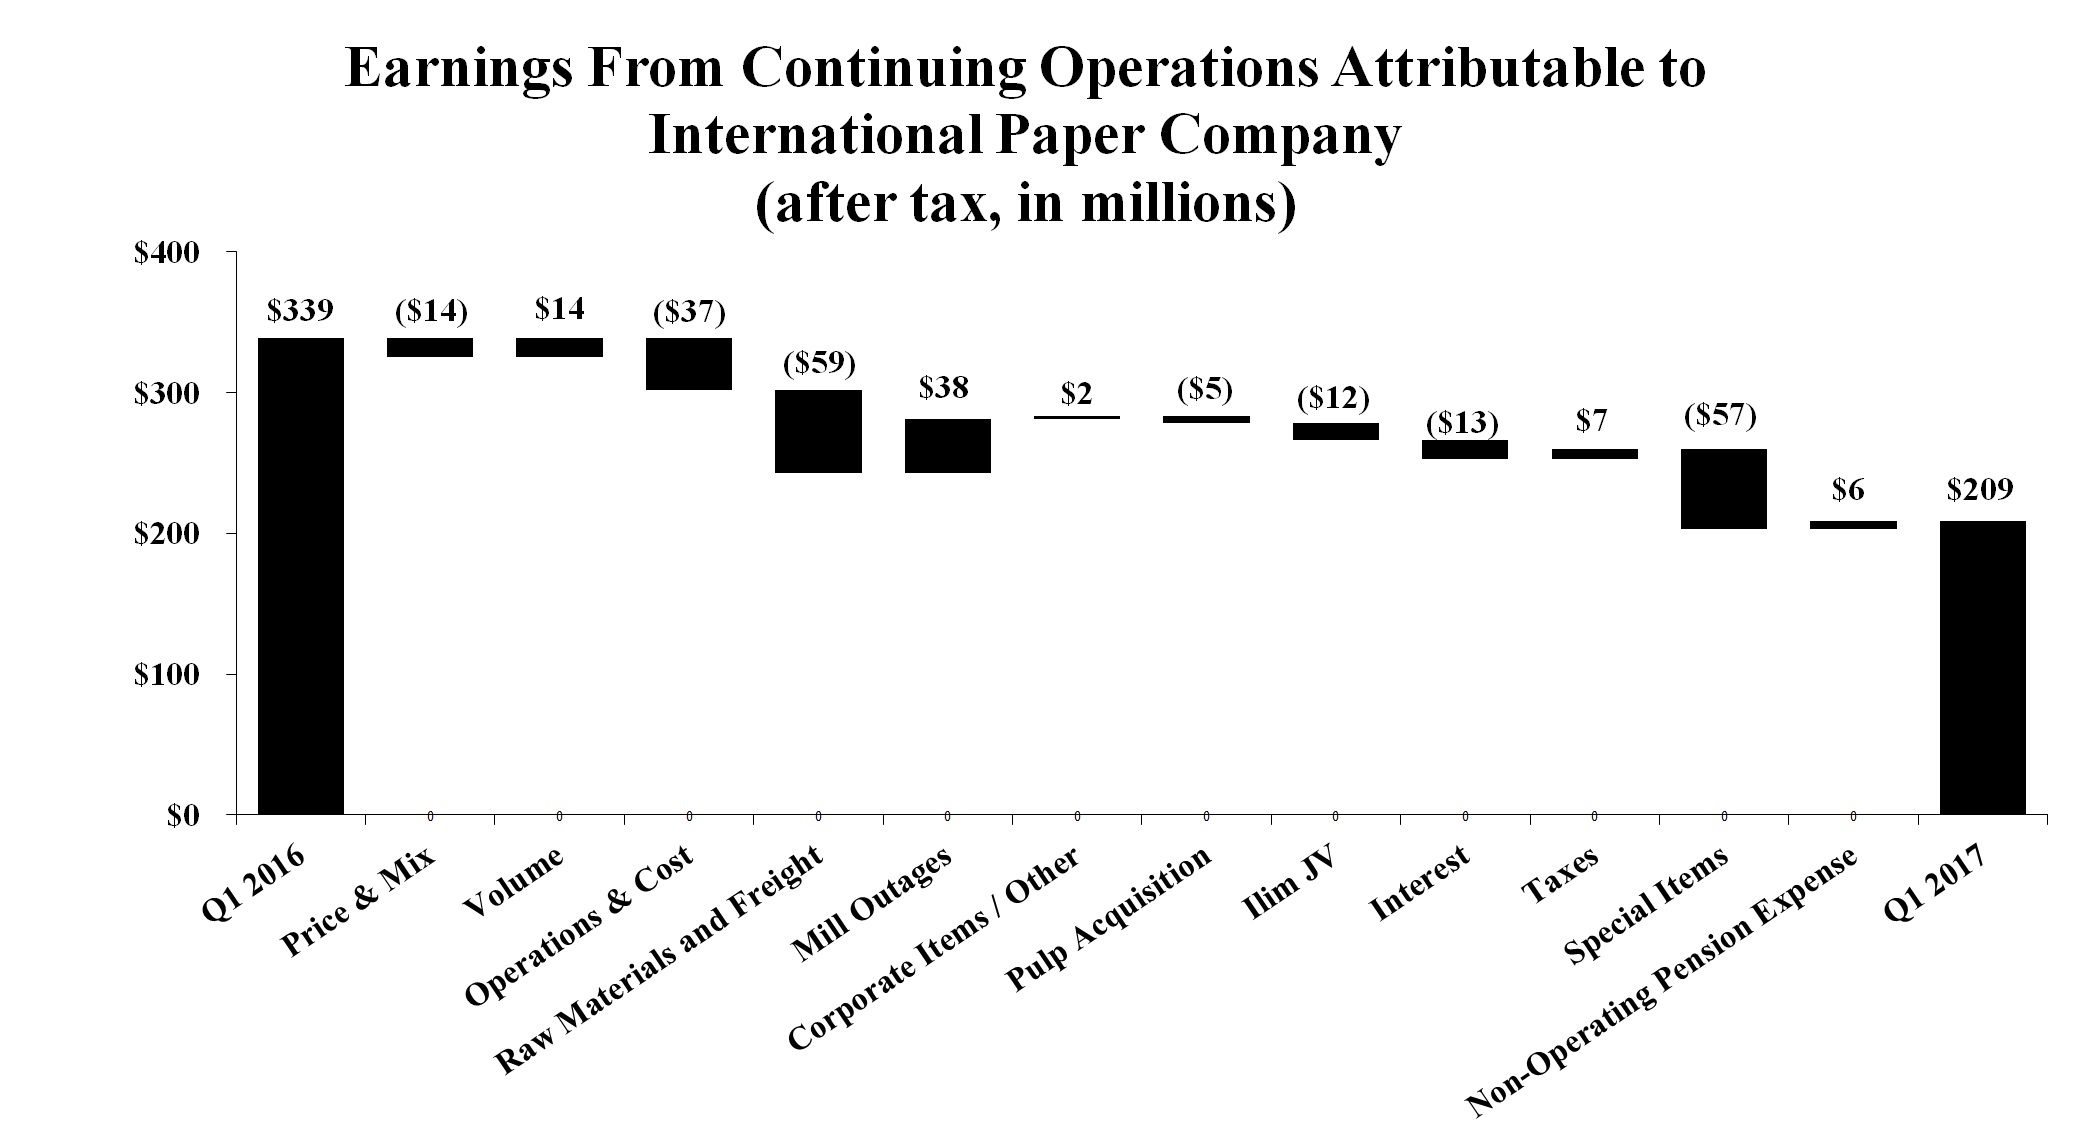
23
Earnings from continuing operations attributable to International Paper Company were $209 million in the first quarter of 2017 compared with $339 million in the first quarter of 2016 and $218 million in the fourth quarter of 2016. Compared with the first quarter of 2016, the 2017 first quarter reflects higher sales volumes ($14 million), lower mill maintenance outage costs ($38 million), lower corporate and other costs ($2 million), lower tax expense ($7 million) reflecting a lower estimated tax rate and lower non-operating pension expense ($6 million). These benefits were offset by lower average sales price realizations and an unfavorable mix ($14 million), higher operating costs ($37 million), higher raw material and freight costs ($59 million), the operating results for the recently acquired pulp business which was not included in the prior year ($5 million) and higher net interest expense ($13 million). Equity earnings, net of taxes, relating to International Paper’s investment in Ilim Holding S.A. were $12 million lower in the 2017 first quarter than in the 2016 first quarter. Net special items in the 2017 first quarter were a loss of $21 million compared with a gain of $36 million in the 2016 first quarter.
Compared with the fourth quarter of 2016, earnings benefited from higher average sales price realizations net of an unfavorable mix ($41 million), lower operating costs ($4 million) and lower non-operating pension expense ($4 million). These benefits were offset by lower sales volumes ($18 million), higher raw material and freight costs ($38 million), higher mill maintenance outage costs ($18 million), higher corporate and other items ($3 million), a less favorable quarter for the recently acquired pulp business largely due to planned maintenance downtime costs ($18 million), higher net interest expense ($5 million) and higher tax expense ($4 million) reflecting a higher estimated tax rate. Equity earnings, net of taxes, for Ilim Holding, S.A. were $5 million higher than in the 2016 fourth quarter. Net special items in the 2017 first quarter were a loss of $21 million compared with a loss of $62 million in the 2016 fourth quarter.
Business Segment Operating Profits are used by International Paper's management to measure the earnings performance of its businesses. Management believes that this measure allows a better understanding of trends in costs, operating efficiencies, prices and volumes. Business Segment Operating Profits are defined as earnings (loss) from continuing operations before income taxes and equity earnings, but including the impact of equity earnings and noncontrolling interests, excluding corporate items and corporate special items. Business Segment Operating Profits are defined by the Securities and Exchange Commission as a non-GAAP financial measure, and are not GAAP alternatives to net income or any other operating measure prescribed by accounting principles generally accepted in the United States.
International Paper operates in four segments: Industrial Packaging, Global Cellulose Fibers, Printing Papers and Consumer Packaging.
The following table presents a reconciliation of net earnings attributable to International Paper Company to its total Business Segment Operating Profit:
Three Months Ended | |||||||||||
March 31 | December 31, | ||||||||||
In millions | 2017 | 2016 | 2016 | ||||||||
Earnings (Loss) From Continuing Operations Attributable to International Paper Company | $ | 209 | $ | 339 | $ | 218 | |||||
Add back (deduct): | |||||||||||
Income tax provision (benefit) | 83 | 41 | 108 | ||||||||
Equity (earnings) loss, net of taxes | (48 | ) | (63 | ) | (47 | ) | |||||
Noncontrolling interests, net of taxes | — | — | 1 | ||||||||
Earnings (Loss) From Continuing Operations Before Income Taxes and Equity Earnings | 244 | 317 | 280 | ||||||||
Interest expense, net | 142 | 123 | 136 | ||||||||
Noncontrolling interests / equity earnings included in operations | — | — | — | ||||||||
Corporate items | 11 | 21 | 11 | ||||||||
Special items (income) expense | — | (8 | ) | — | |||||||
Non-operating pension expense | 31 | 44 | 37 | ||||||||
Adjusted Operating Profit | $ | 428 | $ | 497 | $ | 464 | |||||
Business Segment Operating Profit: | |||||||||||
Industrial Packaging | $ | 365 | $ | 396 | $ | 372 | |||||
Global Cellulose Fibers | (70 | ) | (50 | ) | (70 | ) | |||||
Printing Papers | 100 | 135 | 121 | ||||||||
Consumer Packaging | 33 | 16 | 41 | ||||||||
Total Business Segment Operating Profit | $ | 428 | $ | 497 | $ | 464 | |||||
24
Business Segment Operating Profit
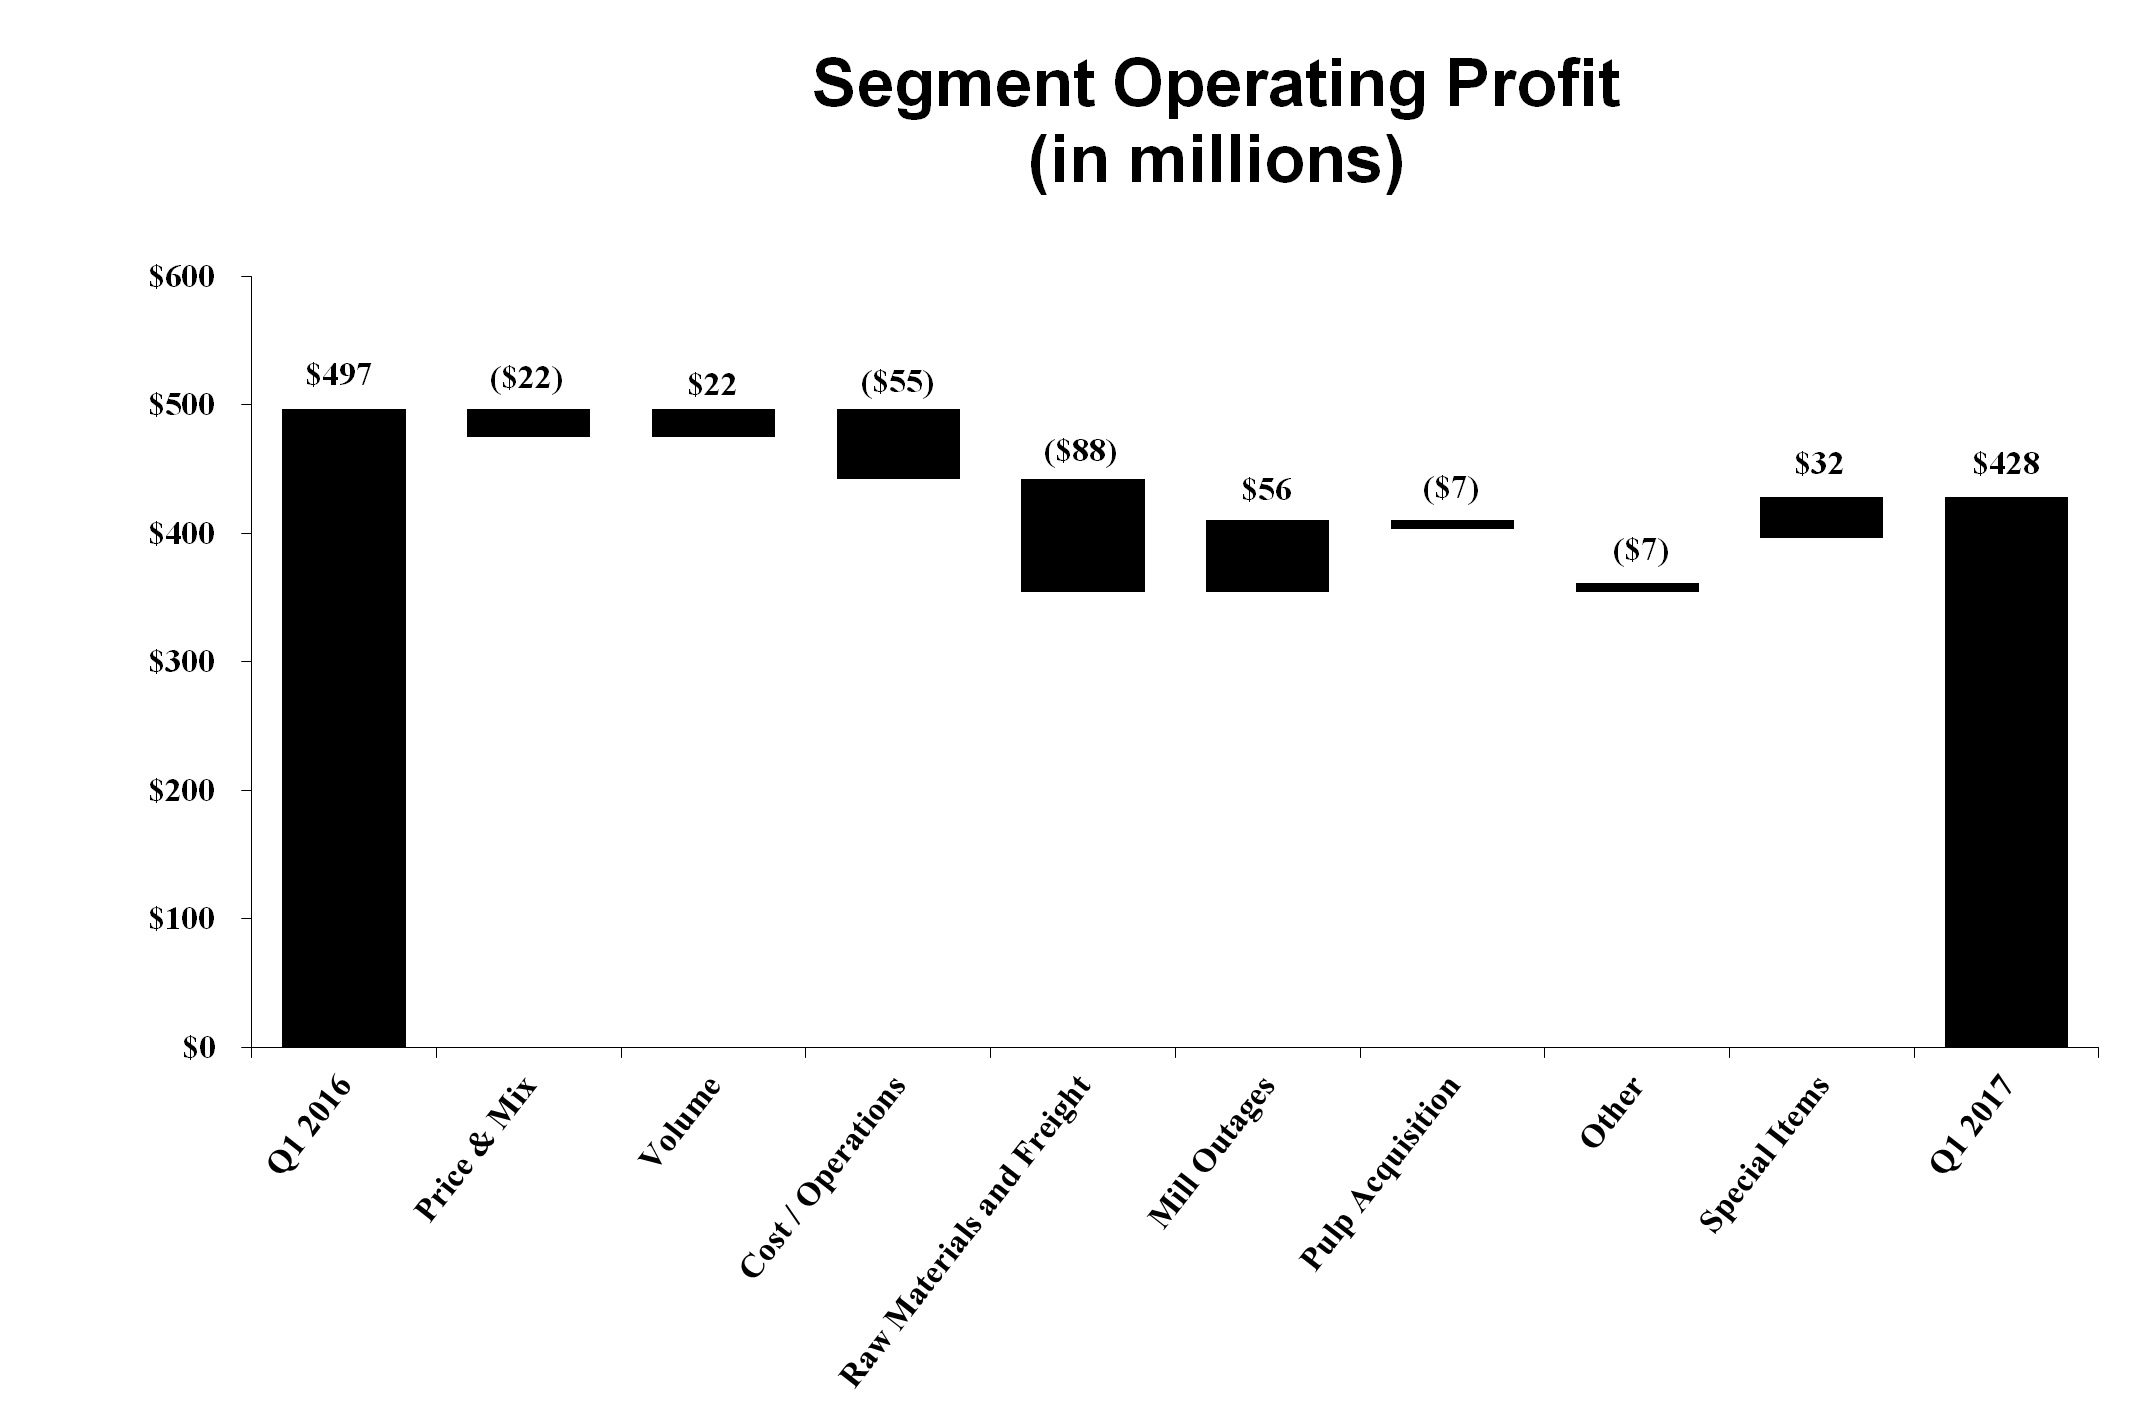
Total business segment operating profits of $428 million in the 2017 first quarter were lower than the $497 million in the 2016 first quarter and the $464 million in the 2016 fourth quarter. Compared with the first quarter of 2016, operating profits in the current quarter benefited from higher sales volumes ($22 million) and lower mill outage costs ($56 million). These benefits were offset by lower net average sales price realizations and an unfavorable mix ($22 million), higher operating costs ($55 million), higher raw material and freight costs ($88 million), the operating results for the recently acquired pulp business which is not included in the prior year ($7 million) and higher other costs ($7 million). Special items were a loss of $14 million in the 2017 first quarter compared with a loss of $46 million in the 2016 first quarter.
Compared with the fourth quarter of 2016, operating profits benefited from higher average sales price realizations net of an unfavorable mix ($57 million) and lower operating costs ($6 million). These benefits were offset by lower sales volumes ($25 million), higher raw material and freight costs ($54 million), higher mill outage costs ($25 million), a less favorable quarter for the recently acquired pulp business largely due to planned maintenance downtime costs ($25 million) and higher other items ($1 million). Special items were a loss of $14 million in the 2017 first quarter compared with a loss of $45 million in the 2016 fourth quarter.
During the 2017 first quarter, International Paper took approximately 229,000 tons of downtime of which approximately 35,000 tons were economic-related compared with approximately 516,000 tons of downtime, which included about 212,000 tons that were economic-related, in the 2016 first quarter. During the 2016 fourth quarter, International Paper took approximately 210,000 tons of downtime of which approximately 44,000 tons were economic-related. Economic downtime is taken to balance internal supply with our customer demand, while maintenance downtime is taken periodically during the year.
25
Sales Volumes by Product (a)
Sales volumes of major products for the three months ended March 31, 2017 and 2016 were as follows:
Three Months Ended March 31, | |||||
In thousands of short tons (except as noted) | 2017 | 2016 | |||
Industrial Packaging | |||||
North American Corrugated Packaging (c) | 2,537 | 2,519 | |||
North American Containerboard | 813 | 740 | |||
North American Recycling | 950 | 928 | |||
North American Saturated Kraft | 46 | 47 | |||
North American Gypsum/Release Kraft | 53 | 46 | |||
North American Bleached Kraft | 7 | 6 | |||
EMEA Industrial Packaging (c) (d) | 374 | 374 | |||
Asian Box (c) (e) | — | 103 | |||
Brazilian Packaging (c) | 86 | 77 | |||
Industrial Packaging | 4,866 | 4,840 | |||
Cellulose Fibers (in thousands of metric tons) (b) | 877 | 367 | |||
Printing Papers | |||||
North American Uncoated Papers | 489 | 475 | |||
EMEA and Russian Uncoated Papers | 359 | 373 | |||
Brazilian Uncoated Papers | 264 | 254 | |||
Indian Uncoated Papers | 61 | 63 | |||
Uncoated Papers | 1,173 | 1,165 | |||
Consumer Packaging | |||||
North American Consumer Packaging | 291 | 308 | |||
EMEA Coated Paperboard | 99 | 94 | |||
Consumer Packaging | 390 | 402 | |||
(a) | Sales volumes include third party and inter-segment sales and exclude sales of equity investees. |
(b) | Includes North American, European and Brazilian volumes and internal sales to mills. |
(c) | Volumes for corrugated box sales reflect consumed tons sold (CTS). Board sales for these businesses reflect invoiced tons. |
(d) | Excludes newsprint sales volumes at the Madrid, Spain mill. |
(e) | Includes sales volumes through the date of sale on June 30, 2016. |
Income Taxes
An income tax provision of $83 million was recorded for the 2017 first quarter and the reported effective income tax rate for continuing operations was 34%. Excluding an expense of $7 million related to the tax effects of special items and a benefit of $12 million related to the tax effects of non-operating pension expense, the effective income tax rate for continuing operations was 30.5% for the quarter.
An income tax provision of $108 million was recorded for the 2016 fourth quarter and the reported effective income tax rate for continuing operations was 38.6%. Excluding an expense of $17 million related to the tax effects of special items and a benefit of $14 million related to the tax effects of non-operating pension expense, the effective income tax rate for continuing operations was 29% for the quarter.
An income tax provision of $41 million was recorded for the 2016 first quarter and the reported effective income tax rate for continuing operations was 13%. Excluding a benefit of $74 million related to the tax effects of special items and a benefit of $17 million related to the tax effects of non-operating pension expense, the effective income tax rate for continuing operations was 33% for the quarter.
Interest Expense and Noncontrolling Interest
Net interest expense for the 2017 first quarter was $142 million compared with $136 million in the 2016 fourth quarter and $123 million in the 2016 first quarter.
26
Effects of Special Items
Details of special items are as follows:
Three Months Ended | ||||||||||||||||||||||||
March 31 | December 31 | |||||||||||||||||||||||
2017 | 2016 | 2016 | ||||||||||||||||||||||
In millions | Before Tax | After Tax | Before Tax | After Tax | Before Tax | After Tax | ||||||||||||||||||
Business Segments | ||||||||||||||||||||||||
Pulp business acquisition inventory fair value step-up amortization | $ | 14 | $ | 8 | $ | — | $ | — | $ | 19 | $ | 11 | ||||||||||||
Pulp business acquisition costs | 4 | 2 | — | — | 19 | 14 | ||||||||||||||||||
Holmen mill net bargain purchase gain | (6 | ) | (6 | ) | — | — | — | — | ||||||||||||||||
Riegelwood mill conversion costs | — | — | 9 | 6 | — | — | ||||||||||||||||||
Asia Packaging restructuring and impairment | — | — | 37 | 34 | — | — | ||||||||||||||||||
Turkey mill closure | — | — | — | — | 7 | 6 | ||||||||||||||||||
Other | 2 | 2 | — | — | — | — | ||||||||||||||||||
Business Segments Total | 14 | 6 | 46 | 40 | 45 | 31 | ||||||||||||||||||
Corporate | ||||||||||||||||||||||||
Gain on sale of investment in Arizona Chemical | — | — | (8 | ) | (5 | ) | — | — | ||||||||||||||||
Corporate Total | — | — | (8 | ) | (5 | ) | — | — | ||||||||||||||||
Total special items | 14 | 6 | 38 | 35 | 45 | 31 | ||||||||||||||||||
Non-operating pension expense | 31 | 19 | 44 | 27 | 37 | 23 | ||||||||||||||||||
Total | $ | 45 | $ | 25 | $ | 82 | $ | 62 | $ | 82 | $ | 54 | ||||||||||||
Includes the following tax expenses (benefits):
Three Months Ended | ||||||||||||
March 31 | December 31 | |||||||||||
In millions | 2017 | 2016 | 2016 | |||||||||
International investment restructuring | $ | 15 | $ | — | $ | — | ||||||
Luxembourg tax rate change | — | — | 31 | |||||||||
International legal entity restructuring | — | — | (6 | ) | ||||||||
Brazil goodwill | — | (57 | ) | — | ||||||||
U.S. federal audit | — | (14 | ) | — | ||||||||
Other | — | — | 6 | |||||||||
Total | $ | 15 | $ | (71 | ) | $ | 31 | |||||
BUSINESS SEGMENT OPERATING RESULTS
The following tables present net sales and operating profit (loss) which is the Company's measure of segment profitability. The tables include a detail of special items in each year, where applicable, in order to show operating profit before special items. The Company calculates Operating Profit Before Special Items (non-GAAP) by excluding the pre-tax effect of items considered by management to be unusual from the earnings reported under U.S. generally accepted accounting principles (“GAAP”). Management uses this measure to focus on on-going operations, and believes that it is useful to investors because it enables them to perform meaningful comparisons of past and present operating results. International Paper believes that using this information, along with net earnings, provides for a more complete analysis of the results of operations by quarter. Net earnings attributable to International Paper is the most directly comparable GAAP measure. See Note 18 - Business Segment Information in the Condensed Notes to the Consolidated Financial Statements for the GAAP reconciliation of segment operating profit.
During the first quarter of 2017, as a result of an internal reorganization, the net sales and operating profits for the Asian Distribution operations are included in the results of the businesses that manufacture the products. Prior year amounts have been reclassified to conform with current year presentation.
27
Industrial Packaging
Total Industrial Packaging | 2017 | 2016 | |||||||||
In millions | 1st Quarter | 1st Quarter | 4th Quarter | ||||||||
Sales | $ | 3,499 | $ | 3,411 | $ | 3,477 | |||||
Operating Profit | $ | 365 | $ | 396 | $ | 371 | |||||
Asia Packaging restructuring and impairment | — | 37 | — | ||||||||
Turkey mill closure | — | — | 7 | ||||||||
Holmen mill net bargain purchase gain | (6 | ) | — | — | |||||||
Other | 1 | — | — | ||||||||
Operating Profit Before Special Items | $ | 360 | $ | 433 | $ | 378 | |||||
Industrial Packaging net sales for the first quarter of 2017 were 1% higher than in the fourth quarter of 2016, but were 3% higher than in the first quarter of 2016. Operating profit before special items (as shown in the table above) were 5% lower in the first quarter of 2017 than in the fourth quarter of 2016 and 17% lower than in the first quarter of 2016.
North American Industrial Packaging | 2017 | 2016 | |||||||||
In millions | 1st Quarter | 1st Quarter | 4th Quarter | ||||||||
Sales (a) | $ | 3,155 | $ | 3,055 | 3,106 | ||||||
Operating Profit | $ | 361 | $ | 438 | $ | 384 | |||||
Other | 1 | — | — | ||||||||
Operating Profit Before Special Items | $ | 362 | $ | 438 | $ | 384 | |||||
(a) | Includes intra-segment sales of $32 million and $45 million for the three months ended March, 31 2017 and 2016, respectively, and $31 million for the three months ended December 31, 2016. |
North American Industrial Packaging sales volumes for boxes in the first quarter of 2017 were lower than in the fourth quarter of 2016 despite four additional shipping days, reflecting seasonally weaker market demand. Containerboard shipments to both domestic and export markets were higher. Total maintenance and economic downtime decreased 30,000 tons from 158,000 tons to 128,000 tons which reflects a decrease of 24,000 tons for maintenance downtime and a decrease of 6,000 tons for economic downtime. Average sales margins for boxes were higher due to the realization of box sales price increases. Average sales price realizations for domestic containerboard also increased due to the implementation of the sales price increase announced in the fourth quarter of 2016. Export containerboard sales prices were also higher reflecting favorable market conditions. Input costs were significantly higher for recycled fiber while costs for energy and wood also increased. Planned maintenance downtime costs were $33 million higher in the 2017 first quarter compared with the 2016 fourth quarter. Operating costs, including costs associated with the January Pensacola mill digester incident, were higher.
Compared with the first quarter of 2016, sales volumes for boxes were higher in the first quarter of 2017 which included one additional shipping day. Sales volumes for containerboard increased in export markets, but were partially offset by lower domestic shipments. Total maintenance and economic downtime was 225,000 tons lower in the first quarter of 2017 which comprises a decrease of 48,000 tons for maintenance downtime and a decrease of 177,000 tons for economic downtime. Average sales margins for boxes increased due to higher average sales price realizations. Average domestic sales price realizations for containerboard were higher, but average export sales price realizations were lower. Input costs increased significantly for recycled fiber and energy, but were partially offset by lower wood costs. Planned maintenance downtime costs were $5 million lower in the first quarter of 2017 compared with the first quarter of 2016. Operating costs were negatively impacted by the Pensacola mill digester incident.
Entering the second quarter of 2017, sales volumes for boxes are expected to be seasonally higher. Export shipments of containerboard are also expected to increase. Input costs for recycled fiber are expected to remain high, but should be more than offset by lower wood, energy and chemical costs. Planned maintenance downtime costs should be $35 million higher. We expect favorable pricing in the North American Industrial Packaging business associated with the realization of the containerboard domestic price increase communicated to customers in the first quarter of 2017 and rising export prices.
28
EMEA Industrial Packaging | 2017 | 2016 | |||||||||
In millions | 1st Quarter | 1st Quarter | 4th Quarter | ||||||||
Sales | $ | 317 | $ | 294 | $ | 325 | |||||
Operating Profit | $ | 14 | $ | 7 | $ | 2 | |||||
Turkey mill closure | — | — | 7 | ||||||||
Holmen mill net bargain purchase gain | (6 | ) | — | — | |||||||
Operating Profit Before Special Items | $ | 8 | $ | 7 | $ | 9 | |||||
EMEA Industrial Packaging sales volumes for boxes in the first quarter of 2017 were lower than in the fourth quarter of 2016 due to the negative impact of unfavorable weather conditions on market demand for fruit and vegetable boxes. Average sales margins increased, primarily in Turkey. Input costs for energy were slightly higher and distribution costs increased due to higher export shipments. Operating costs were lower.
Compared with the first quarter of 2016, sales volumes in the first quarter of 2017 were flat. Average sales margins were significantly higher due to material cost decreases, mix improvements in Morocco and sales price increases in Turkey. Operating costs and distribution costs increased.
Looking ahead to the second quarter of 2017, sales volumes are expected to be seasonally higher in the Euro-zone, but partially offset by seasonally lower volumes in Morocco. Average sales margins are expected to be compressed due to material cost increases. Energy, distribution and operating costs are expected to be lower.
Brazilian Industrial Packaging | 2017 | 2016 | |||||||||
In millions | 1st Quarter | 1st Quarter | 4th Quarter | ||||||||
Sales | $ | 59 | $ | 42 | $ | 77 | |||||
Operating Profit | $ | (10 | ) | $ | (8 | ) | $ | (14 | ) | ||
Brazilian Industrial Packaging sales volumes in the first quarter of 2017 were slightly lower than in the fourth quarter of 2016. Average sales margins were impacted by higher sales prices and a more favorable customer mix. Planned maintenance downtime costs in the first quarter of 2017, which included an outage at the Nova Campina mill, were $1 million higher than in the fourth quarter of 2016. Input costs were lower for recycled fiber.
Compared with the first quarter of 2016, sales volumes in the first quarter of 2017 were higher for boxes, sheets and containerboard. Average sales price realizations for boxes increased, while input costs, primarily for recycled fiber, were higher. Operating costs increased and planned maintenance downtime costs were $2 million higher.
Looking ahead to the second quarter of 2017, sales volumes are expected to be seasonally higher for boxes. Average sales price realizations are also expected to improve. Input costs should be lower, primarily for recycled fiber, and maintenance downtime costs should be $2 million lower with no outages scheduled in the second quarter.
Asian Industrial Packaging | 2017 | 2016 | |||||||||
In millions | 1st Quarter | 1st Quarter | 4th Quarter | ||||||||
Sales | $ | — | $ | 65 | $ | — | |||||
Operating Profit | $ | — | $ | (41 | ) | $ | (1 | ) | |||
Asia Packaging Restructuring and Impairment | — | 37 | — | ||||||||
Operating Profit Before Special Items | $ | — | $ | (4 | ) | $ | (1 | ) | |||
Asian Industrial Packaging
On June 30, 2016, the Company completed the sale of its corrugated packaging business in China and Southeast Asia to Xiamen Bridge Hexing Equity Investment Partnership Enterprise. See Note 8 - Divestitures / Spinoff in the Condensed Notes to the Consolidated Financial Statements for further discussion of the sale of this business.
29
Global Cellulose Fibers
Total Global Cellulose Fibers | 2017 | 2016 | |||||||||
In millions | 1st Quarter | 1st Quarter | 4th Quarter | ||||||||
Sales | $ | 564 | $ | 212 | $ | 379 | |||||
Operating Profit | $ | (70 | ) | $ | (50 | ) | $ | (70 | ) | ||
Acquisition costs | 4 | — | 19 | ||||||||
Inventory fair value step-up amortization | 14 | — | 19 | ||||||||
Other | 1 | — | — | ||||||||
Operating Profit Before Special Items | $ | (51 | ) | $ | (50 | ) | $ | (32 | ) | ||
Global Cellulose Fibers includes the results of the pulp business acquired from Weyerhaeuser beginning in December 2016. See Note 7 - Acquisitions in the Condensed Notes to Consolidated Financial Statements for further discussion of this acquisition. Net sales were 49% higher in the first quarter of 2017 than in the fourth quarter of 2016 and higher than in the first quarter of 2016. Operating profits before special items (as shown in the table above) were 59% lower in the first quarter of 2017 than in the fourth quarter of 2016 and 2% lower than in the first quarter of 2016.
Operating earnings for the legacy business in the first quarter of 2017 compared with the fourth quarter of 2016 reflect increased sales volumes as a result of the ramp-up of production at the Riegelwood mill. Average sales price realizations were flat, but average sales margins were impacted by a favorable product mix. In Europe and Russia, sales volumes were lower, but average sales price realizations were slightly favorable. Operating costs were higher due to operational issues at two mills and the impact of the Pensacola mill digester incident in January. Input costs were flat. Planned maintenance downtime costs in the first quarter of 2017 included an outage at the Georgetown mill and were $6 million higher than in the fourth quarter of 2016 which included an outage at the Riegelwood mill. In the first quarter of 2017 operating earnings for the recently acquired pulp business included $41 million of planned maintenance downtime costs for outages at the Flint River mill and for a major energy optimization project at the Port Wentworth mill.
Compared with the first quarter of 2016, sales volumes for the legacy business in the first quarter of 2017 were slightly higher. Average sales price realizations were lower for fluff pulp and softwood pulp. In Europe average sales price realizations decreased while in Russia average sales margins were favorably impacted by mix. Input costs were flat, but operating costs were higher. Planned maintenance downtime costs were $41 million lower in the first quarter of 2017 than in the first quarter of 2016 which included significant outage costs associated with the Riegelwood mill conversion.
Entering the second quarter of 2017, sales volumes for the combined business are expected to be stable. Average sales price realizations are expected to reflect the continuing realization of previously announced sales price increases. Average sales margins will also benefit from a more favorable product mix. Average sales price realizations are expected to increase in both Europe and Russia, but sales volumes are expected to decrease in Russia. Input costs are expected to be stable. Planned maintenance downtime costs should be $5 million lower in the second quarter of 2017.
Printing Papers
Total Printing Papers | 2017 | 2016 | |||||||||
In millions | 1st Quarter | 1st Quarter | 4th Quarter | ||||||||
Sales | $ | 995 | $ | 972 | $ | 1,055 | |||||
Operating Profit | $ | 100 | $ | 135 | $ | 121 | |||||
Printing Papers net sales for the first quarter of 2017 were 6% lower than in the fourth quarter of 2016, but were 2% higher than in the first quarter of 2016. Operating profits in the first quarter of 2017 were 17% lower than in the fourth quarter of 2016 and 26% lower than in the first quarter of 2016.
North American Papers | 2017 | 2016 | |||||||||
In millions | 1st Quarter | 1st Quarter | 4th Quarter | ||||||||
Sales | $ | 468 | $ | 482 | $ | 465 | |||||
Operating Profit | $ | 33 | $ | 61 | $ | 43 | |||||
North American Papers sales volumes in the first quarter of 2017 were higher than in the fourth quarter of 2016 primarily due to higher market demand. Average sales margins for uncoated freesheet paper decreased reflecting lower average sales price realizations. Input costs increased for energy and chemicals, while wood costs were flat. Operating costs were lower. Planned maintenance downtime costs were $10 million higher in the first quarter of 2017 compared with the fourth quarter of 2016.
Compared with the first quarter of 2016, sales volumes in the first quarter of 2017 were higher primarily due to increased shipments of uncoated freesheet paper to export markets. Average sales price realizations were lower for cutsize paper and
30
rolls. Average sales margins were also impacted by unfavorable product and mill sourcing mix. Higher input costs for energy and chemicals were partially offset by lower wood costs. Planned maintenance downtime costs in the first quarter of 2017 were $7 million higher than in the first quarter of 2016.
Entering the second quarter of 2017, sales volumes are expected to be slightly higher, while average sales price realizations are expected to be stable. Input costs should be slightly lower for energy and chemicals. Planned maintenance downtime costs should be $13 million higher with scheduled outages in the second quarter. Operating costs are expected to be seasonally lower.
European Papers | 2017 | 2016 | |||||||||
In millions | 1st Quarter | 1st Quarter | 4th Quarter | ||||||||
Sales | $ | 274 | 259 | $ | 284 | ||||||
Operating Profit | $ | 29 | $ | 40 | $ | 28 | |||||
European Papers sales volumes for uncoated freesheet paper in the first quarter of 2017 compared with the fourth quarter of 2016 were higher in Europe, but seasonally lower in Russia. Average sales price realizations for uncoated freesheet paper increased in Europe and were flat in Russia. Input costs were higher, primarily for chemicals and energy in Europe and for wood in Russia. Planned maintenance downtime costs in the first quarter of 2017 which included no outages were $11 million lower than in the fourth quarter of 2016 which included an outage at the Saillat mill. Manufacturing operating costs were lower.
Sales volumes for uncoated freesheet paper in the first quarter of 2017 compared with the first quarter of 2016, were higher in Europe and increased slightly in Russia. Average sales price realizations decreased for uncoated freesheet paper in Europe and Russia. Input costs were higher, primarily for energy in Europe and for wood in Russia. There were no planned maintenance downtime costs in either period.
Looking forward to the second quarter of 2017, sales volumes for uncoated freesheet paper are expected to increase in Russia and be slightly lower in Europe. Average sales price realizations are expected to increase in Europe following announced price increases and be stable in Russia. Input costs are expected to be flat in Europe, but increase slightly for wood in Russia. Planned maintenance downtime costs should be $7 million higher in the second quarter of 2017.
Brazilian Papers | 2017 | 2016 | |||||||||
In millions | 1st Quarter | 1st Quarter | 4th Quarter | ||||||||
Sales (a) | $ | 214 | $ | 189 | $ | 260 | |||||
Operating Profit | $ | 39 | $ | 35 | $ | 50 | |||||
(a) | Includes intra-segment sales of $9 million and $1 million for the three months ended March, 31 2017 and 2016, respectively, and $1 million for the three months ended December 31, 2016. |
Brazilian Papers sales volumes in the first quarter of 2017 decreased compared with the fourth quarter of 2016 reflecting seasonally weaker demand for uncoated freesheet paper in both the domestic and other Latin American markets. Average sales price realizations increased in the domestic market reflecting the partial realization of an announced price increase. Input costs were lower, primarily for virgin fiber. Planned maintenance downtime costs were flat.
Compared with the first quarter of 2016, sales volumes for uncoated freesheet paper in the first quarter of 2017 increased in other Latin American markets, but were lower in the domestic market. Average sales price realizations were higher in the domestic market reflecting the impact of price increases in 2016 and the first quarter of 2017. Average sales price realizations in Latin American export markets decreased. Sales margins were also negatively impacted by an unfavorable geographic mix. Input costs were lower, primarily for purchased pulp.
Entering the second quarter of 2017, sales volumes are expected to be slightly higher for uncoated freesheet paper. Average sales price realizations are expected to continue to improve in the domestic market reflecting the continued realization of the first quarter price increase. Average sales margins should also benefit from a more favorable geographic mix. Input costs are expected to be higher, particularly for virgin fiber. Planned maintenance outage costs should be $3 million higher in the second quarter.
Indian Papers | 2017 | 2016 | |||||||||
In millions | 1st Quarter | 1st Quarter | 4th Quarter | ||||||||
Sales | $ | 48 | $ | 43 | $ | 47 | |||||
Operating Profit | $ | (1 | ) | $ | (1 | ) | $ | — | |||
Indian Papers sales volumes in the first quarter of 2017 compared with the fourth quarter of 2016 were slightly lower. Average sales price realizations increased. Input costs were lower, primarily for wood, while operating costs were flat. Compared with the first quarter of 2016, sales volumes in the first quarter of 2017 were higher. Average sales price realizations increased. Both operating costs and input costs were flat.
31
Looking ahead to the second quarter of 2017, sales volumes are expected to be lower, partially due to reduced production associated with a planned maintenance outage. Average sales margins should be favorably impacted by the realization of an announced sales price increase.
Consumer Packaging
Total Consumer Packaging | 2017 | 2016 | |||||||||
In millions | 1st Quarter | 1st Quarter | 4th Quarter | ||||||||
Sales | $ | 466 | $ | 495 | $ | 464 | |||||
Operating Profit | $ | 33 | $ | 16 | $ | 41 | |||||
Riegelwood mill conversion costs | — | 9 | — | ||||||||
Operating Profit Before Special Items | $ | 33 | $ | 25 | $ | 41 | |||||
Consumer Packaging net sales in the first quarter of 2017 were even with the fourth quarter of 2016 and 6% lower than in the first quarter of 2016. Operating profits before special items (as shown in the table above) were 20% lower in the first quarter of 2017 than in the fourth quarter of 2016, but 32% higher than in the first quarter of 2016.
North American Consumer Packaging | 2017 | 2016 | |||||||||
In millions | 1st Quarter | 1st Quarter | 4th Quarter | ||||||||
Sales | $ | 388 | $ | 418 | $ | 386 | |||||
Operating Profit | $ | 14 | $ | (10 | ) | $ | 21 | ||||
Riegelwood mill conversion costs | — | 9 | — | ||||||||
Operating Profit Before Special Items | $ | 14 | $ | (1 | ) | $ | 21 | ||||
North American Consumer Packaging Coated paperboard sales volumes in the first quarter of 2017 were seasonally higher than in the fourth quarter of 2016. Average sales price realizations were slightly lower due to continued price erosion and competitive pressure. Average sales margins were further impacted by a less favorable mix. Planned maintenance downtime costs were $11 million lower in the first quarter of 2017 compared with the fourth quarter of 2016 which included an outage at the Texarkana mill. Operating costs were seasonally higher and input costs, primarily for natural gas, were also higher.
Compared with the first quarter of 2016, sales volumes in the first quarter of 2017 were lower largely due to the absence of the coated bristols product line. Average sales price realizations were lower for folding carton board and cupstock. Average sales margins were also negatively affected by an unfavorable mix. Input costs decreased for wood, but were partially offset by higher natural gas costs. Planned maintenance downtime costs were $19 million lower.
Foodservice sales volumes in the first quarter of 2017 were seasonally lower than in the fourth quarter of 2016. Average sales prices were flat, but average sales margins were negatively impacted by higher polystyrene costs and an unfavorable product mix. Compared with the first quarter of 2016, sales volumes in the first quarter of 2017 decreased slightly, reflecting weaker market demand. Average sales margins were lower due to higher polystyrene costs partially mitigated by a more favorable product mix. Freight costs decreased reflecting the impact of supply chain initiatives, but were offset by inflation and higher operating costs.
Looking forward to the second quarter of 2017, coated paperboard sales volumes are expected to be seasonally higher. Average sales price realizations are expected to be slightly higher reflecting the implementation of an announced price increase in both the domestic and export markets. Input costs are expected to be higher for chemicals. Planned maintenance downtime costs should be $28 million higher with scheduled outages in the second quarter. For Foodservice, sales volumes are expected to be seasonally higher while average sales margins will be impacted by higher board and resin costs.
European Consumer Packaging | 2017 | 2016 | |||||||||
In millions | 1st Quarter | 1st Quarter | 4th Quarter | ||||||||
Sales | $ | 78 | $ | 77 | $ | 78 | |||||
Operating Profit | $ | 19 | $ | 26 | $ | 20 | |||||
European Consumer Packaging sales volumes in the first quarter of 2017 compared with the fourth quarter of 2016 were higher in Europe, but lower in Russia. Average sales margins increased reflecting higher sales price realizations and a favorable mix. Input costs were higher in both Europe and Russia. Planned maintenance downtime costs were flat.
Compared with the first quarter of 2016, sales volumes increased in Europe, but decreased in Russia. Average sales price realizations were flat in Russia, but decreased in Europe although margins reflected a more favorable mix. Input costs for energy increased in both Europe and Russia as well as for wood in Russia, but purchased pulp costs were lower in Europe.
32
Entering the second quarter of 2017, higher sales volumes in Russia are expected to be more than offset by seasonally lower sales volumes in Europe. Average sales margins are expected to decrease reflecting lower average sales price realizations in both Europe and Russia and an unfavorable mix in Russia. Planned maintenance downtime costs are expected to be $3 million higher with scheduled outages in the second quarter. Input costs are expected to be slightly higher.
Equity Earnings, Net of Taxes – Ilim
Since October 2007, International Paper and Ilim Holding S.A. (Ilim) have operated a 50:50 joint venture in Russia. Ilim is a separate reportable business segment. The Company recorded equity earnings, net of taxes, of $50 million in the first quarter of 2017, compared with $45 million in the fourth quarter of 2016 and $62 million in the first quarter of 2016. In the first quarter of 2017, the after-tax foreign exchange impact primarily on the remeasurement of U.S. dollar-denominated net debt was a gain of $23 million compared with a gain of $6 million in the fourth quarter of 2016. Compared with the fourth quarter of 2016, sales volumes in the first quarter of 2017 were seasonally lower across all products, but primarily for sales of softwood pulp in China and other export markets and sales of containerboard in export and domestic markets. Average sales price realizations increased, primarily for sales of hardwood and softwood pulp in China, export and domestic markets and for containerboard in domestic markets, partially offset by cut-size paper sales in export markets. Distribution costs increased, while operating costs were relatively flat. The Company received cash dividends from the joint venture of $127 million during the first quarter of 2017.
Compared with the first quarter of 2016, sales volumes in the first quarter of 2017 decreased across all product lines but primarily for sales of softwood and hardwood pulp to China, export and domestic markets. Average sales price realizations were higher, primarily for sales of softwood pulp in domestic markets. Input costs for wood, fuel and distribution increased. Operating costs increased. An after-tax foreign exchange gain of $11 million primarily on the remeasurement of U.S. dollar-denominated net debt was recorded in the first quarter of 2016.
Looking forward to the second quarter of 2017, sales volumes are expected to increase. Average sales price realizations are expected to increase compared with the first quarter of 2017 primarily for export sales of softwood and hardwood pulp partially offset by lower domestic prices. Input costs are expected to be seasonally higher for wood partially offset by lower distribution costs. Planned maintenance downtime costs will be incurred in the second quarter of 2017 with outages scheduled.
LIQUIDITY AND CAPITAL RESOURCES
Cash provided by operations totaled $633 million for the first three months of 2017, compared with $620 million for the comparable 2016 three-month period. Cash used for working capital components totaled $124 million for the first three months of 2017 compared to $54 million for the comparable 2016 three-month period.
The Company generated free cash flow of approximately $259 million and $311 million in the first three months of 2017 and 2016, respectively. Free cash flow is a non-GAAP measure and the most directly comparable GAAP measure is cash provided by operations. Management believes that free cash flow is useful to investors as a liquidity measure because it measures the amount of cash generated that is available, after reinvesting in the business, to maintain a strong balance sheet, pay dividends, repurchase stock, service debt and make investments for future growth. It should not be inferred that the entire free cash flow amount is available for discretionary expenditures. By adjusting for certain items that are not indicative of the Company's ongoing performance, free cash flow also enables investors to perform meaningful comparisons between past and present periods.
The following is a reconciliation of cash provided by operations to free cash flow:
Three Months Ended March 31, | |||||||
In millions | 2017 | 2016 | |||||
Cash provided by operations | $ | 633 | $ | 620 | |||
Adjustments: | |||||||
Cash invested in capital projects | (374 | ) | (309 | ) | |||
Free Cash Flow | $ | 259 | $ | 311 | |||
Investments in capital projects totaled $374 million in the first three months of 2017 compared to $309 million in the first three months of 2016. Full-year 2017 capital spending is currently expected to be approximately $1.5 billion, or about 107% of depreciation and amortization expense for our current businesses.
Financing activities for the first three months of 2017 included a $41 million net decrease in debt versus a $145 million net increase in debt during the comparable 2016 three-month period.
33
At March 31, 2017, contractual obligations for future payments of debt maturities by calendar year were as follows: $349 million in 2017; $539 million in 2018; $423 million in 2019; $160 million in 2020; $629 million in 2021; $927 million in 2022; and $8.2 billion thereafter.
Maintaining an investment-grade credit rating is an important element of International Paper’s financing strategy. At March 31, 2017, the Company held long-term credit ratings of BBB (stable outlook) and Baa2 (stable outlook) by S&P and Moody’s, respectively. In addition, the Company held short-term credit ratings of A2 and P2 by S&P and Moody's, respectively, for borrowings during the current quarter under the Company's commercial paper program.
At March 31, 2017, International Paper’s credit agreements totaled $2.1 billion, which management believes are adequate to cover expected operating cash flow variability during the current economic cycle. The credit agreements generally provide for interest rates at a floating rate index plus a pre-determined margin dependent upon International Paper’s credit rating. The liquidity facilities include a $1.5 billion contractually committed bank credit agreement that expires in December 2021 and has a facility fee of 0.15% per annum payable quarterly. The liquidity facilities also include up to $600 million of uncommitted financings based on eligible receivable balances ($600 million available at March 31, 2017) under a receivables securitization program that expires in December 2017.
In June 2016, International Paper entered into a commercial paper program with a borrowing capacity of $750 million. Under the terms of the program, individual maturities on borrowings may vary, but not exceed one year from the date of issue. Interest bearing notes may be issued either as fixed notes or floating rate notes. As of March 31, 2017, the Company had $310 million of borrowings outstanding under this program.
During the first three months of 2017, International Paper used 2.5 million shares of treasury stock for various incentive plans. International Paper also acquired 0.9 million shares of treasury stock, including shares for the payment of restricted stock tax withholding. Repurchases of common stock and payments of restricted stock withholding taxes totaled $46 million. In September 2013, the Company announced a share repurchase program to acquire up to $1.5 billion of the Company's common stock over the next two to three years in open market repurchase transactions. In addition, in July 2014, the Company announced that it would acquire up to $1.5 billion of additional shares of the Company's common stock to supplement the $1.5 billion share repurchase program authorized in September 2013 and intends to continue to repurchase such shares in open market repurchase transactions. Under the current repurchase program, the Company has repurchased 44.6 million shares at an average price of $46.40, for a total of approximately $2.1 billion, as of March 31, 2017.
During the first three months of 2016, International Paper used approximately 2.7 million shares of treasury stock for various incentive plans. International Paper also acquired 3.6 million shares of treasury stock, including restricted stock tax withholding. Repurchases of common stock and payments of restricted stock withholding taxes totaled $131 million, including $100 million related to shares repurchased under the Company's share repurchase program. Cash dividend payments related to common stock totaled $191 million and $181 million for the first three months of 2017 and 2016, respectively. Dividends were $0.4625 per share and $0.4400 per share for the first three months in 2017 and 2016, respectively.
International Paper expects to be able to meet projected capital expenditures, service existing debt and meet working capital and dividend requirements during 2017 with current cash balances and cash from operations, supplemented as required by its existing credit facilities. The Company will continue to rely on debt and capital markets for the majority of any necessary long-term funding not provided by operating cash flows. Funding decisions will be guided by our capital structure planning objectives. The primary goals of the Company’s capital structure planning are to maximize financial flexibility and preserve liquidity while reducing interest expense. The majority of International Paper’s debt is accessed through global public capital markets where we have a wide base of investors.
Acquisitions
See discussion in Note 7 - Acquisitions in the Condensed Notes to the Consolidated Financial Statements.
Ilim Holding S.A. Shareholders’ Agreement
In October 2007, in connection with the formation of the Ilim Holding S.A. joint venture, International Paper entered into a shareholder’s agreement that includes provisions relating to the reconciliation of disputes among the partners. This agreement provides that at any time, either the Company or its partners may commence procedures specified under the deadlock agreement. If these or any other deadlock procedures under the shareholder's agreement are commenced, although it is not obligated to do so, the Company may in certain situations choose to purchase its partners' 50% interest in Ilim. Any such transaction would be subject to review and approval by Russian and other relevant anti-trust authorities. Based on the provisions of the agreement, the Company estimates that the current purchase price for its partners' 50% interests would be approximately $1.3 billion, which could be satisfied by payment of cash or International Paper common stock, or some combination of the two, at the Company's option. The purchase by the Company of its partners’ 50% interest in Ilim would result in the consolidation of Ilim's financial position and results of operations in all subsequent periods. The parties have
34
informed each other that they have no current intention to commence procedures specified under the deadlock provisions of the shareholder’s agreement.
CRITICAL ACCOUNTING POLICIES AND SIGNIFICANT ACCOUNTING ESTIMATES
The preparation of financial statements in conformity with accounting principles generally accepted in the United States requires International Paper to establish accounting policies and to make estimates that affect both the amounts and timing of the recording of assets, liabilities, revenues and expenses. Some of these estimates require judgments about matters that are inherently uncertain.
Accounting policies whose application may have a significant effect on the reported results of operations and financial position of International Paper, and that can require judgments by management that affect their application, include accounting for contingencies, impairment or disposal of long-lived assets, goodwill and other intangible assets, pensions, postretirement benefits other than pensions,income taxes and business combinations.
The Company has included in its 2016 Form 10-K a discussion of these critical accounting policies, which are important to the portrayal of the Company’s financial condition and results of operations and require management’s judgments. The Company has not made any changes in these critical accounting policies during the first three months of 2017.
Pension Accounting
Net pension expense totaled approximately $78 million for International Paper’s U.S. plans for the three months ended March 31, 2017, or about $13 million less than the pension expense for the first three months of 2016. The decrease in U.S. plan expense was due to lower amortization of unrecognized actuarial losses and prior service cost. Net pension expense for non-U.S. plans was about $1 million for the first three months of 2017 and 2016, respectively.
After consultation with our actuaries, International Paper determines key actuarial assumptions on December 31 of each year that are used to calculate liability information as of that date and pension expense for the following year. Key assumptions affecting pension expense include the discount rate, the expected long-term rate of return on plan assets, the projected rate of future compensation increases, and various demographic assumptions including expected mortality. The discount rate assumption is determined based on approximately 500 Aa-rated bonds appropriate to provide the projected benefit payments of the plan. A bond portfolio is selected and a single rate is determined that equates the market value of the bonds purchased to the discounted value of the plan’s benefit payments. The expected long-term rate of return on plan assets is based on projected rates of return for current and planned asset classes in the plan’s investment portfolio. At March 31, 2017, the market value of plan assets for International Paper’s U.S. plans totaled approximately $10.7 billion, consisting of approximately 51% equity securities, 28% fixed income securities, and 21% real estate and other assets. Plan assets did not include International Paper common stock.
The Company’s funding policy for our pension plans is to contribute amounts sufficient to meet legal funding requirements, plus any additional amounts that the Company may determine to be appropriate considering the funded status of the plan, tax deductibility, the cash flows generated by the Company, and other factors. The U.S. nonqualified plans are only funded to the extent of benefits paid, which are expected to be $40 million in 2017.
FORWARD-LOOKING STATEMENTS
Certain statements in this Quarterly Report on Form 10-Q that are not historical in nature may be considered “forward-looking” statements within the meaning of the Private Securities Litigation Reform Act of 1995. These statements are often identified by the words, “will,” “may,” “should,” “continue,” “anticipate,” “believe,” “expect,” “plan,” “appear,” “project,” “estimate,” “intend,” and words of a similar nature. These statements are not guarantees of future performance and reflect management’s current views with respect to future events, which are subject to risks and uncertainties that could cause actual results to differ materially from those expressed or implied in these statements. Factors which could cause actual results to differ include but are not limited to: (i) the level of our indebtedness and changes in interest rates; (ii) industry conditions, including but not limited to changes in the cost or availability of raw materials, energy and transportation costs, competition we face, cyclicality and changes in consumer preferences, demand and pricing for our products; (iii) global economic conditions and political changes, including but not limited to the impairment of financial institutions, changes in currency exchange rates, credit ratings issued by recognized credit rating organizations, the amount of our future pension funding obligation, changes in tax laws and pension and health care costs; (iv) unanticipated expenditures related to the cost of compliance with existing and new environmental and other governmental regulations and to actual or potential litigation; (v) changes in our estimates for the costs and insurance coverage associated with the January 2017 incident at our Pensacola, Florida mill; (vi) whether we experience a material disruption at one of our other manufacturing facilities; (vii) risks inherent in conducting business through a joint venture; (viii) the failure to realize the expected synergies and cost-savings from our purchase of the pulp business of Weyerhaeuser Company or delay in realization thereof; (ix) our ability to achieve the benefits we expect from all other strategic acquisitions, divestitures and restructurings; and (x) other factors you can find in our press releases and filings with the Securities and Exchange Commission, including the risk factors identified in Item 1A of Part I of the Company’s Annual
35
Report on Form 10-K for the fiscal year ended December 31, 2016 ("Risk Factors"). We undertake no obligation to publicly update any forward-looking statements, whether as a result of new information, future events or otherwise.
36
ITEM 3. | QUANTITATIVE AND QUALITATIVE DISCLOSURES ABOUT MARKET RISK |
Information relating to quantitative and qualitative disclosures about market risk is shown on page 38 of International Paper’s 2016 Form 10-K, which information is incorporated herein by reference. There have been no material changes in the Company’s exposure to market risk since December 31, 2016.
ITEM 4. | CONTROLS AND PROCEDURES |
Evaluation of Disclosure Controls and Procedures:
Disclosure controls and procedures are controls and other procedures that are designed to ensure that information required to be disclosed in our reports filed or submitted under the Securities Exchange Act of 1934, as amended (Exchange Act), is recorded, processed, summarized and reported (and accumulated and communicated to management, including our Chief Executive Officer and Chief Financial Officer, to allow timely decisions regarding required disclosure) within the time periods specified in the Securities and Exchange Commission’s rules and forms. As of the end of the period covered by this report, we conducted an evaluation, under the supervision and with the participation of our management, including the Chief Executive Officer and Chief Financial Officer, of the effectiveness of our disclosure controls and procedures pursuant to Rules 13a-15 and 15d-15 of the Exchange Act. Based upon that evaluation, our Chief Executive Officer and Chief Financial Officer concluded that the Company’s disclosure controls and procedures were effective as of March 31, 2017 (the end of the period covered by this report).
Changes in Internal Control over Financial Reporting:
There have been no changes in our internal control over financial reporting during the quarter ended March 31, 2017 that have materially affected, or are reasonably likely to materially affect, our internal control over financial reporting.
37
PART II. OTHER INFORMATION
ITEM 1. | LEGAL PROCEEDINGS |
A discussion of material developments in the Company’s litigation matters occurring in the period covered by this report is found in Note 12 to the financial statements in this Form 10-Q.
ITEM 1A. | RISK FACTORS |
There have been no material changes from the risk factors disclosed in our Annual Report on Form 10-K for the fiscal year ended December 31, 2016 (Part I, Item 1A).
ITEM 2. | UNREGISTERED SALES OF EQUITY SECURITIES AND USE OF PROCEEDS |
PURCHASES OF EQUITY SECURITIES BY THE ISSUER AND AFFILIATED PURCHASERS.
Period | Total Number of Shares Purchased (a) | Average Price Paid per Share | Total Number of Shares Purchased as Part of a Publicly Announced Plan or Program | Maximum Number (or Approximate Dollar Value) of Shares that May Yet Be Purchased Under the Plans or Programs (in millions) | |||||
January 1, 2017 - January 31, 2017 | 2,129 | $ | 53.06 | — | $0.933 | ||||
February 1, 2017 - February 28, 2017 | 859,840 | 52.89 | — | 0.933 | |||||
March 1, 2017 - March 31, 2017 | 2,043 | 51.14 | — | 0.933 | |||||
Total | 864,012 | ||||||||
(a) 864,012 shares were acquired from employees from share withholdings to pay income taxes under the Company's restricted stock programs.
38
ITEM 6. | EXHIBITS |
11 | Statement of Computation of Per Share Earnings. | |
12 | Computation of Ratio of Earnings to Fixed Charges and Preferred Stock Dividends. | |
31.1 | Certification of principal executive officer pursuant to Section 302 of the Sarbanes-Oxley Act of 2002. | |
31.2 | Certification of principal financial officer pursuant to Section 302 of the Sarbanes-Oxley Act of 2002. | |
32 | Certification pursuant to 18 U.S.C. Section 1350, as adopted pursuant to Section 906 of the Sarbanes-Oxley Act of 2002. | |
101.INS | XBRL Instance Document. | |
101.SCH | XBRL Taxonomy Extension Schema. | |
101.CAL | XBRL Taxonomy Extension Calculation Linkbase. | |
101.DEF | XBRL Taxonomy Extension Definition Linkbase. | |
101.LAB | XBRL Taxonomy Extension Label Linkbase. | |
101.PRE | XBRL Extension Presentation Linkbase. | |
39
SIGNATURES
Pursuant to the requirements of the Securities Exchange Act of 1934, the registrant has duly caused this report to be signed on its behalf by the undersigned thereunto duly authorized.
INTERNATIONAL PAPER COMPANY (Registrant) | ||
May 5, 2017 | By | /s/ Glenn R. Landau |
Glenn R. Landau | ||
Senior Vice President and Chief Financial Officer | ||
May 5, 2017 | By | /s/ Vincent P. Bonnot |
Vincent P. Bonnot | ||
Vice President – Finance and Controller | ||
40