Attached files
| file | filename |
|---|---|
| EX-99.1 - EXHIBIT 99.1 - TELEFLEX INC | exhibit991to5-4x20178xkxq1.htm |
| 8-K - 8-K - TELEFLEX INC | a5-4x20178xkreq12017earnin.htm |

1
Teleflex Incorporated
First Quarter 2017
Earnings Conference Call
2
Conference Call Logistics
The release, accompanying slides, and replay webcast are available online at
www.teleflex.com (click on “Investors”)
Telephone replay available by dialing 855-859-2056 or for international calls, 404-
537-3406, pass code number 12639722

3
Introductions
Benson Smith
Chairman and CEO
Liam Kelly
President and COO
Thomas Powell
Executive Vice President and CFO
Jake Elguicze
Treasurer and Vice President of Investor Relations
4
Note on Forward-Looking Statements
This presentation and our discussion contain forward-looking information and statements including, but not limited
to, forecasted 2017 GAAP and constant currency revenue growth, GAAP and adjusted gross and operating margins
and adjusted earnings per share and the items that are expected to impact each of those forecasted results;
estimated pre-tax charges we expect to incur and annualized pre-tax savings we expect to realize in connection with
our restructuring programs; our expectations with respect to when we will begin to realize savings from our
restructuring programs and when those programs will be substantially completed; our expectation with respect to
estimated annual increases in our revenue related to improved pricing with respect to certain of our kits; and other
matters which inherently involve risks and uncertainties which could cause actual results to differ from those
projected or implied in the forward–looking statements. These risks and uncertainties are addressed in our SEC
filings, including our most recent Form 10-K.
Note on Non-GAAP Financial Measures
This presentation refers to certain non-GAAP financial measures, including, but not limited to, constant currency
revenue growth, adjusted diluted earnings per share, adjusted gross and operating margins and adjusted tax rate.
These non-GAAP financial measures should not be considered replacements for, and should be read together with,
the most comparable GAAP financial measures. Tables reconciling these non-GAAP financial measures to the most
comparable GAAP financial measures are contained within the appendices to this presentation.
Additional Notes
Unless otherwise noted, the following slides reflect continuing operations.

5
Executive Summary
First quarter 2017 revenue of $487.9 million
• Up 14.8% vs. prior year period on an as-reported basis
• Up 16.0% vs. prior year period on a constant currency basis
• Q1’17 results include a partial quarter of contribution from Vascular Solutions which
added approximately 5% towards revenue growth during the quarter
First quarter 2017 Earnings Per Share
• GAAP EPS of $0.87, down 17.1% vs. prior year period
• Adjusted EPS of $1.80, up 18.4% vs. prior year period
2017 Full Year Financial Guidance
• Reaffirmed GAAP revenue growth range of 10.0% - 11.5%
• Reaffirmed constant currency revenue growth range of 12.5% - 14.0%
• Raised GAAP EPS range from $5.04 - $5.08 to $5.59 - $5.66
• Raised adjusted EPS range from $8.00 - $8.15 to $8.05 to $8.23
Note: See appendices for reconciliations of non-GAAP information
6
First Quarter Highlights
First quarter 2017 constant currency revenue growth of 16.0%
• Sales volume of existing products contributed 7.8% of constant currency growth,
including impact of five additional selling days in the quarter which contributed
approximately 6%
• Acquisitions contributed 5.8% of constant currency revenue growth, including
Vascular Solutions which contributed 5.1% and Cartika which contributed 0.7%
• Sales volume of new products contributed 1.8% of constant currency growth
• Pricing increases contributed 0.6% of constant currency growth
Note: See appendices for reconciliations of non-GAAP information

7
Segment Revenue Review
Q1’17 Q1’16
Constant Currency Revenue Commentary
Vascular N.A.: $93.8 million, up 14.8% Anesthesia N.A.: $48.2 million, up 4.7%
Surgical N.A.: $46.0 million, up 17.7% EMEA: $130.7 million, up 10.9%
Asia: $49.0 million, down 0.4% OEM: $43.3 million, up 28.4%
All Other: $76.9 million, up 45.0%
Note: Increases and decreases in revenue referred to above are as compared to results for the first quarter of 2016. See
appendices for reconciliations of non-GAAP information.
19%
9%
10%
27%
10%
9%
16%
Vascular North America Surgical North America
Anesthesia North America EMEA
Asia OEM
All Other
19%
9%
11%
29%
12%
8%
12%
Vascular North America Surgical North America
Anesthesia North America EMEA
Asia OEM
All Other
8
Group Purchasing Organization and IDN Review
Track record of expansion of contractual agreements continues in Q1’17
Group Purchasing Organization Update
• 9 renewed agreements
• 1 new agreement
• 1 existing agreement not renewed
IDN Update
• 7 renewed agreements
• 13 new agreements

9
Product Introductions and Regulatory Approvals
Spectre™ Guidewire
PRODUCT DESCRIPTION
Recently received FDA 510(k) clearance and
initiated U.S. commercial launch of the Spectre™
Guidewire, which is designed for premium
performance in coronary and peripheral
interventions with enhanced trackability and
torque control.
The Spectre™ Guidewire is engineered with a
smooth stainless steel-to-nitinol dual-core
transition that balances strength and agility.
The Spectre™ is a 0.014” guidewire available in
190 cm and 300 cm lengths with a distal
hydrophilic coating and a proximal PTFE coating.
Approximately 70% of guidewires used in
percutaneous coronary interventions (PCI) are
considered workhorse wires and are used to
deliver catheters, balloons, stents, and other
diagnostic and therapeutic devices. As a
workhorse wire, the Spectre™ Guidewire was
designed to be applicable to the majority of PCIs.
10
Product Introductions and Regulatory Approvals
Twin-Pass® Torque Dual Access Catheter
PRODUCT DESCRIPTION
Recently received FDA 510(k) clearance and
initiated both U.S. and international
commercial launch of the Twin-Pass® Torque
Dual Access Catheter.
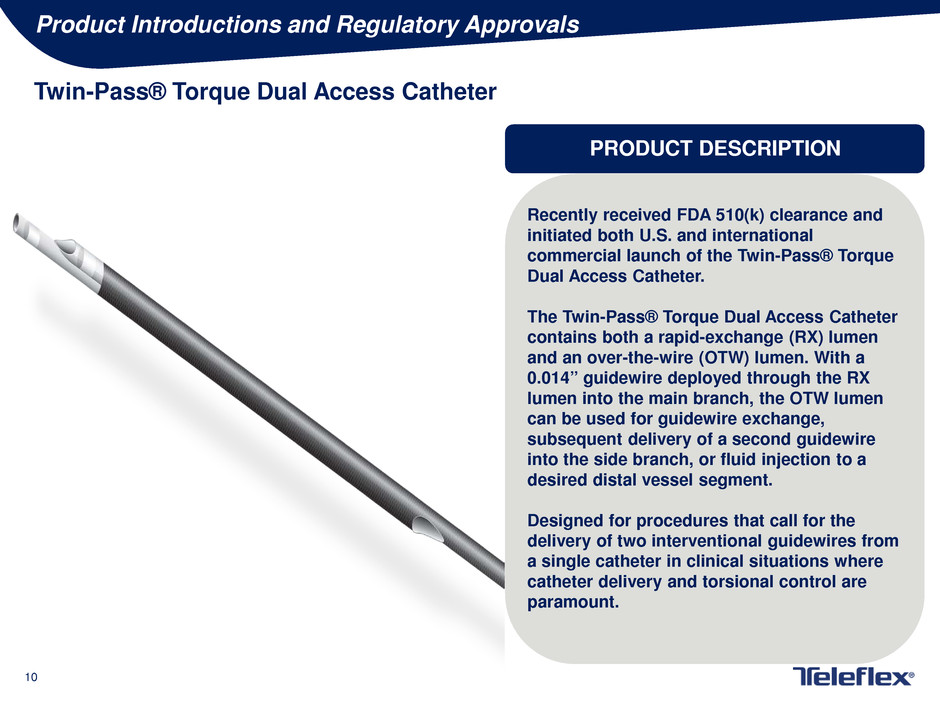
The Twin-Pass® Torque Dual Access Catheter
contains both a rapid-exchange (RX) lumen
and an over-the-wire (OTW) lumen. With a
0.014” guidewire deployed through the RX
lumen into the main branch, the OTW lumen
can be used for guidewire exchange,
subsequent delivery of a second guidewire
into the side branch, or fluid injection to a
desired distal vessel segment.
Designed for procedures that call for the
delivery of two interventional guidewires from
a single catheter in clinical situations where
catheter delivery and torsional control are
paramount.

11
Product Introductions and Regulatory Approvals
TrapLiner™ Catheter
PRODUCT DESCRIPTION
Recently received FDA 510(k) clearance and
initiated U.S. commercial launch of the
TrapLiner™ Catheter.
The TrapLiner™ Catheter is similar in design
to Vascular Solutions’ popular GuideLiner
Guide Extension Catheter, with the added
feature of an integrated balloon for trapping a
standard 0.014” guidewire within a guide
catheter.
The TrapLiner™ Catheter can be used as an
alternative method to the trapping technique
that requires the use of a PTCA balloon to
exchange an existing over-the-wire catheter
while maintaining guidewire position. The
technique of guidewire trapping for catheter
exchange is most commonly performed in
complex interventional procedures.
12
Product Introductions and Regulatory Approvals
Arrow® AC3 Optimus™ Intra-Aortic Balloon Pump
PRODUCT DESCRIPTION
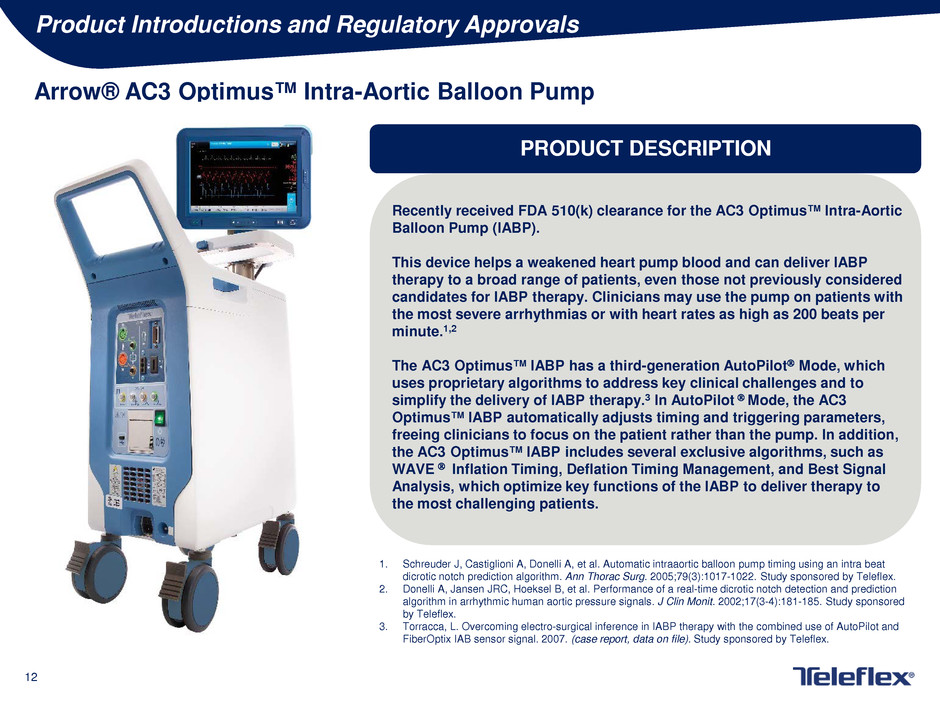
Recently received FDA 510(k) clearance for the AC3 Optimus™ Intra-Aortic
Balloon Pump (IABP).
This device helps a weakened heart pump blood and can deliver IABP
therapy to a broad range of patients, even those not previously considered
candidates for IABP therapy. Clinicians may use the pump on patients with
the most severe arrhythmias or with heart rates as high as 200 beats per
minute.1,2
The AC3 Optimus™ IABP has a third-generation AutoPilot Mode, which
uses proprietary algorithms to address key clinical challenges and to
simplify the delivery of IABP therapy.3 In AutoPilot Mode, the AC3
Optimus™ IABP automatically adjusts timing and triggering parameters,
freeing clinicians to focus on the patient rather than the pump. In addition,
the AC3 Optimus™ IABP includes several exclusive algorithms, such as
WAVE Inflation Timing, Deflation Timing Management, and Best Signal
Analysis, which optimize key functions of the IABP to deliver therapy to
the most challenging patients.
1. Schreuder J, Castiglioni A, Donelli A, et al. Automatic intraaortic balloon pump timing using an intra beat
dicrotic notch prediction algorithm. Ann Thorac Surg. 2005;79(3):1017-1022. Study sponsored by Teleflex.
2. Donelli A, Jansen JRC, Hoeksel B, et al. Performance of a real-time dicrotic notch detection and prediction
algorithm in arrhythmic human aortic pressure signals. J Clin Monit. 2002;17(3-4):181-185. Study sponsored
by Teleflex.
3. Torracca, L. Overcoming electro-surgical inference in IABP therapy with the combined use of AutoPilot and
FiberOptix IAB sensor signal. 2007. (case report, data on file). Study sponsored by Teleflex.
13
Acquisition Update
Completed acquisition of Pyng Medical
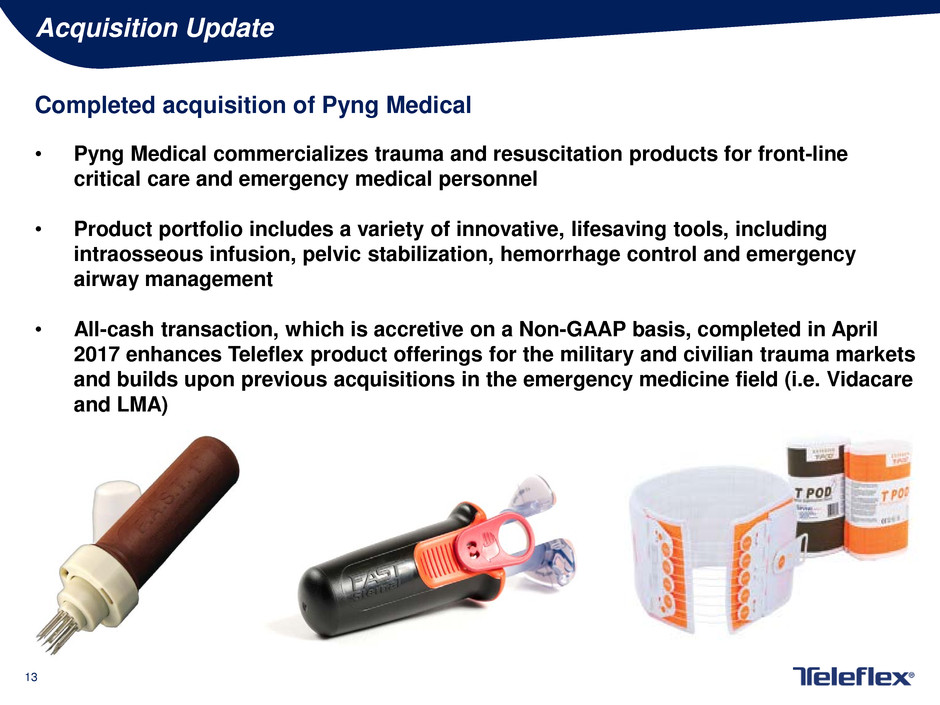
• Pyng Medical commercializes trauma and resuscitation products for front-line
critical care and emergency medical personnel
• Product portfolio includes a variety of innovative, lifesaving tools, including
intraosseous infusion, pelvic stabilization, hemorrhage control and emergency
airway management
• All-cash transaction, which is accretive on a Non-GAAP basis, completed in April
2017 enhances Teleflex product offerings for the military and civilian trauma markets
and builds upon previous acquisitions in the emergency medicine field (i.e. Vidacare
and LMA)

14
Restructuring Update
2017 Vascular Solutions Integration Program
During the first quarter 2017, we committed to a restructuring program related to the integration of Vascular
Solutions' operations with our operations. We initiated the program in the first quarter 2017 and expect the
program to be substantially completed by the end of the second quarter 2018. We estimate that we will
record aggregate pretax restructuring charges of $6.0 million to $7.5 million related to this program, of which
$4.5 million to $5.3 million will constitute termination benefits, and $1.5 million to $2.2 million will relate to
other exit costs, including employee relocation and outplacement costs. Additionally, we expect to incur
$2.5 million to $3.0 million of restructuring related charges consisting primarily of retention bonuses offered
to certain employees expected to remain with the Company after completion of the program. All of these
charges will result in future cash outlays.
We began realizing program-related synergies in the first quarter 2017 and expect to achieve annualized pre-
tax synergies of $20 million to $25 million once the program is fully implemented.
2017 EMEA Restructuring Program
During the first quarter 2017, we committed to a restructuring program to centralize certain administrative
functions in Europe. The program will commence in the second quarter 2017 and is expected to be
substantially completed by the end of 2018. We estimate that we will record aggregate pre-tax restructuring
charges of $7.1 million to $8.5 million related to this program, almost all of which constitute termination
benefits, and all of which will result in future cash outlays.
We expect to achieve annualized pre-tax savings of $2.7 million to $3.3 million once the program is fully
implemented and expect to begin realizing plan related savings in the first quarter 2018.

15
Restructuring Update
In addition to the restructuring programs initiated during the first quarter 2017, we have other ongoing
restructuring programs related to the consolidation of our manufacturing operations (referred to as
our 2016 and 2014 footprint realignment plans) as well as restructuring programs designed to
improve operating efficiencies and reduce costs. With respect to our restructuring plans and
programs, the following table summarizes (1) the estimated total cost and estimated annual pre-tax
savings once the programs are completed; (2) the costs incurred and estimated pre-tax savings
realized through December 31, 2016; and (3) the costs expected to be incurred and estimated
incremental pre-tax savings estimated to be realized for these programs from January 1, 2017 through
the anticipated completion dates:
Dollars
in Millions
Estimated
Total
Through
December 31, 2016
Estimated remaining from
January 1, 2017 through
December 31, 2021 2
Restructuring charges $51 to $60 $33 $18 to $27
Restructuring related charges 1 $53 to $65 $30 $23 to $35
Total charges $104 to $125 $63 $41 to $62
Pre-tax savings 3 $60 to $71 $31 $29 to $40
Vascular Solutions integration
program - synergies
$20 to $25 ̶ $20 to $25
1. Restructuring related charges principally constitute accelerated depreciation and other costs primarily related to the transfer of manufacturing operations to new locations and are expected to be recognized
primarily in cost of goods sold.
2. We expect to incur substantially all of the costs prior to the end of 2018, and to have realized substantially all of the estimated annual pre-tax savings and synergies by the year ended December 31, 2019.
3. Approximately 65% of the savings is expected to result in reductions to cost of goods sold. During 2016, in connection with our execution of the 2014 footprint realignment plan, we implemented changes to
medication delivery devices included in certain of our kits, which are expected to result in increased product costs (and therefore reduce the annual savings that were estimated at the inception of the program).
However, we also expect to achieve improved pricing on these kits to offset the cost, which is expected to result in estimated annual increased revenues of $5 million to $6 million. We expect to begin realizing
the benefits of this incremental pricing in 2017. Savings generated from restructuring programs are difficult to estimate, given the nature and timing of the restructuring activities and the possibility that
unanticipated expenditures may be required as the program progresses. Moreover, predictions of revenues related to increased pricing are particularly uncertain and can be affected by a number of factors,
including customer resistance to price increases and competition.
16
First Quarter Financial Review
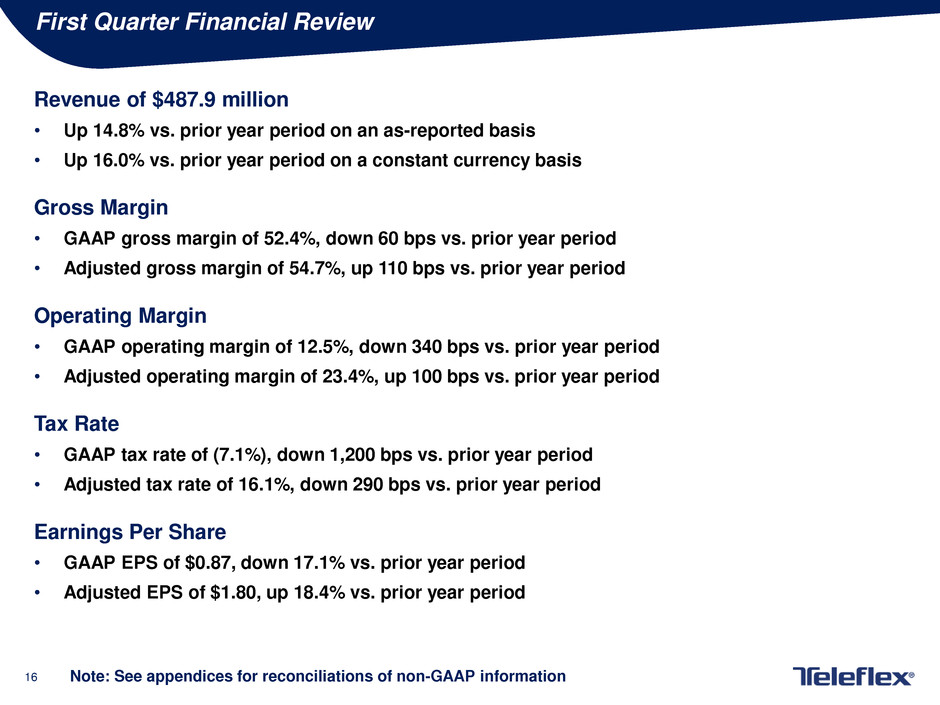
Revenue of $487.9 million
• Up 14.8% vs. prior year period on an as-reported basis
• Up 16.0% vs. prior year period on a constant currency basis
Gross Margin
• GAAP gross margin of 52.4%, down 60 bps vs. prior year period
• Adjusted gross margin of 54.7%, up 110 bps vs. prior year period
Operating Margin
• GAAP operating margin of 12.5%, down 340 bps vs. prior year period
• Adjusted operating margin of 23.4%, up 100 bps vs. prior year period
Tax Rate
• GAAP tax rate of (7.1%), down 1,200 bps vs. prior year period
• Adjusted tax rate of 16.1%, down 290 bps vs. prior year period
Earnings Per Share
• GAAP EPS of $0.87, down 17.1% vs. prior year period
• Adjusted EPS of $1.80, up 18.4% vs. prior year period
Note: See appendices for reconciliations of non-GAAP information
17
2017 Financial Outlook Assumptions
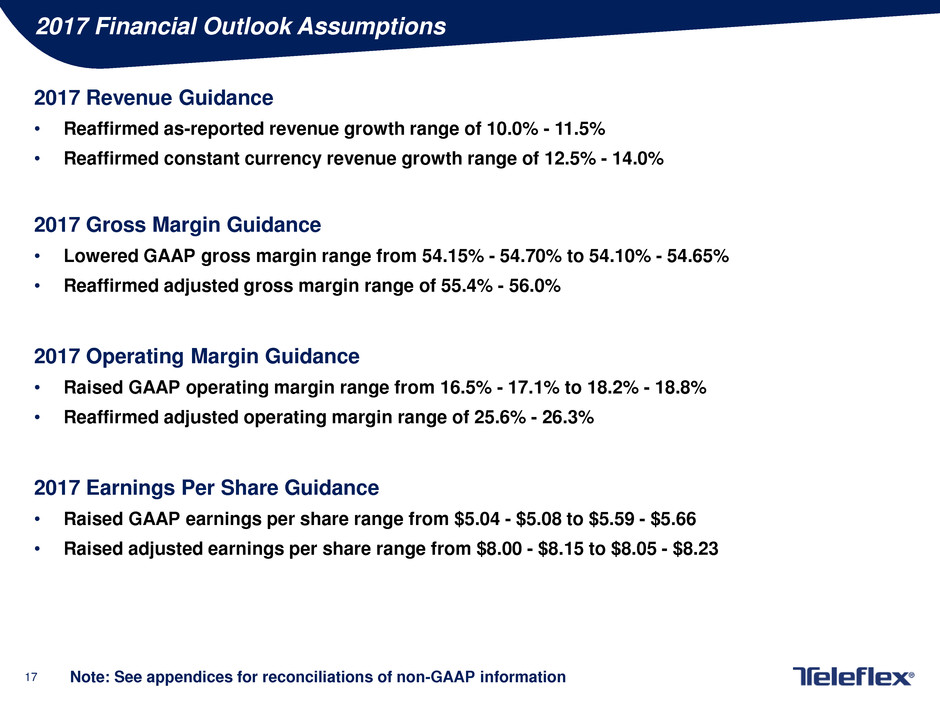
2017 Revenue Guidance
• Reaffirmed as-reported revenue growth range of 10.0% - 11.5%
• Reaffirmed constant currency revenue growth range of 12.5% - 14.0%
2017 Gross Margin Guidance
• Lowered GAAP gross margin range from 54.15% - 54.70% to 54.10% - 54.65%
• Reaffirmed adjusted gross margin range of 55.4% - 56.0%
2017 Operating Margin Guidance
• Raised GAAP operating margin range from 16.5% - 17.1% to 18.2% - 18.8%
• Reaffirmed adjusted operating margin range of 25.6% - 26.3%
2017 Earnings Per Share Guidance
• Raised GAAP earnings per share range from $5.04 - $5.08 to $5.59 - $5.66
• Raised adjusted earnings per share range from $8.00 - $8.15 to $8.05 - $8.23
Note: See appendices for reconciliations of non-GAAP information

18
Any Questions?

19
Thank You

20
Appendices
21
Non-GAAP Financial Measures
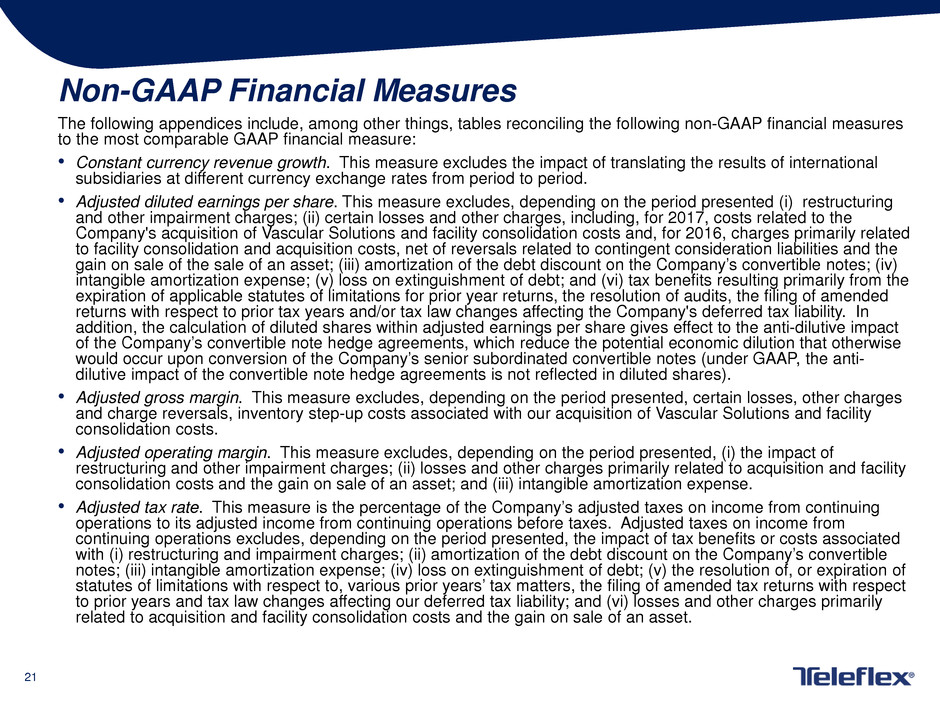
The following appendices include, among other things, tables reconciling the following non-GAAP financial measures
to the most comparable GAAP financial measure:
• Constant currency revenue growth. This measure excludes the impact of translating the results of international
subsidiaries at different currency exchange rates from period to period.
• Adjusted diluted earnings per share. This measure excludes, depending on the period presented (i) restructuring
and other impairment charges; (ii) certain losses and other charges, including, for 2017, costs related to the
Company's acquisition of Vascular Solutions and facility consolidation costs and, for 2016, charges primarily related
to facility consolidation and acquisition costs, net of reversals related to contingent consideration liabilities and the
gain on sale of the sale of an asset; (iii) amortization of the debt discount on the Company’s convertible notes; (iv)
intangible amortization expense; (v) loss on extinguishment of debt; and (vi) tax benefits resulting primarily from the
expiration of applicable statutes of limitations for prior year returns, the resolution of audits, the filing of amended
returns with respect to prior tax years and/or tax law changes affecting the Company's deferred tax liability. In
addition, the calculation of diluted shares within adjusted earnings per share gives effect to the anti-dilutive impact
of the Company’s convertible note hedge agreements, which reduce the potential economic dilution that otherwise
would occur upon conversion of the Company’s senior subordinated convertible notes (under GAAP, the anti-
dilutive impact of the convertible note hedge agreements is not reflected in diluted shares).
• Adjusted gross margin. This measure excludes, depending on the period presented, certain losses, other charges
and charge reversals, inventory step-up costs associated with our acquisition of Vascular Solutions and facility
consolidation costs.
• Adjusted operating margin. This measure excludes, depending on the period presented, (i) the impact of
restructuring and other impairment charges; (ii) losses and other charges primarily related to acquisition and facility
consolidation costs and the gain on sale of an asset; and (iii) intangible amortization expense.
• Adjusted tax rate. This measure is the percentage of the Company’s adjusted taxes on income from continuing
operations to its adjusted income from continuing operations before taxes. Adjusted taxes on income from
continuing operations excludes, depending on the period presented, the impact of tax benefits or costs associated
with (i) restructuring and impairment charges; (ii) amortization of the debt discount on the Company’s convertible
notes; (iii) intangible amortization expense; (iv) loss on extinguishment of debt; (v) the resolution of, or expiration of
statutes of limitations with respect to, various prior years’ tax matters, the filing of amended tax returns with respect
to prior years and tax law changes affecting our deferred tax liability; and (vi) losses and other charges primarily
related to acquisition and facility consolidation costs and the gain on sale of an asset.

22
APPENDIX A –
RECONCILIATION OF CONSTANT CURRENCY REVENUE GROWTH
DOLLARS IN MILLIONS
April 2, 2017 March 27, 2016 Constant Currency Currency Total
Vascular North America 93.8$ 81.5$ 14.8% 0.2% 15.0%
Anesthesia North America 48.2 46.0 4.7% 0.2% 4.9%
Surgical North America 46.0 38.9 17.7% 0.3% 18.0%
EMEA 130.7 122.1 10.9% (3.8%) 7.1%
Asia 49.0 49.2 (0.4%) 0.0% (0.4%)
OEM 43.3 34.0 28.4% (0.8%) 27.6%
All Other 76.9 53.2 45.0% (0.5%) 44.5%
Net Revenues 487.9$ 424.9$ 16.0% (1.2%) 14.8%
Three Months Ended % Increase / (Decrease)
23
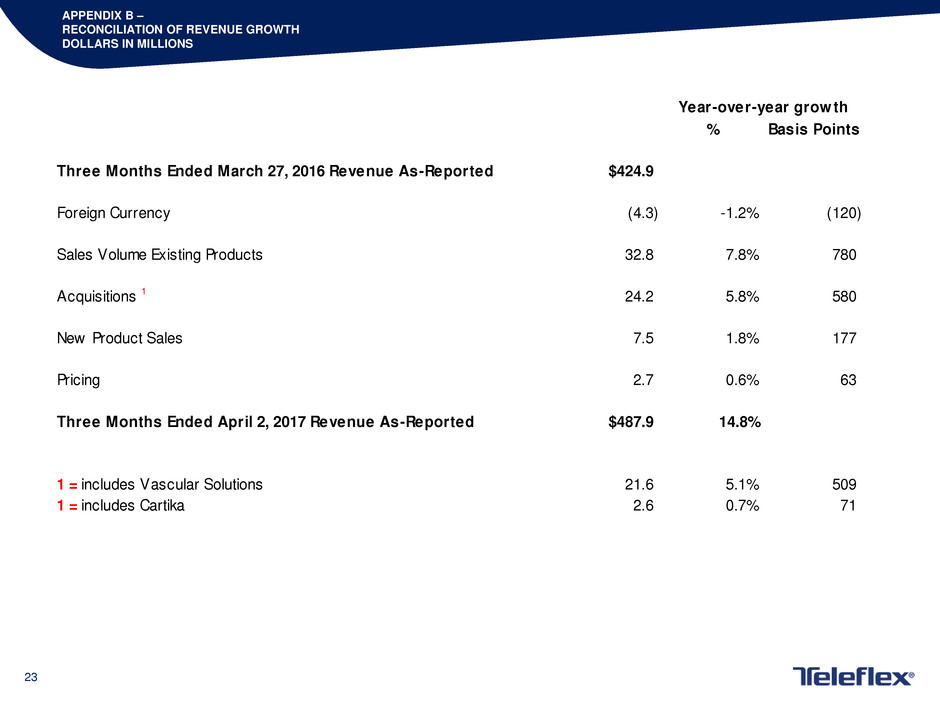
APPENDIX B –
RECONCILIATION OF REVENUE GROWTH
DOLLARS IN MILLIONS
% Basis Points
Three Months Ended March 27, 2016 Revenue As-Reported $424.9
Foreign Currency (4.3) -1.2% (120)
Sales Volume Existing Products 32.8 7.8% 780
Acquisitions 1 24.2 5.8% 580
New Product Sales 7.5 1.8% 177
Pricing 2.7 0.6% 63
Three Months Ended April 2, 2017 Revenue As-Reported $487.9 14.8%
1 = includes Vascular Solutions 21.6 5.1% 509
1 = includes Cartika 2.6 0.7% 71
Year-over-year growth
24
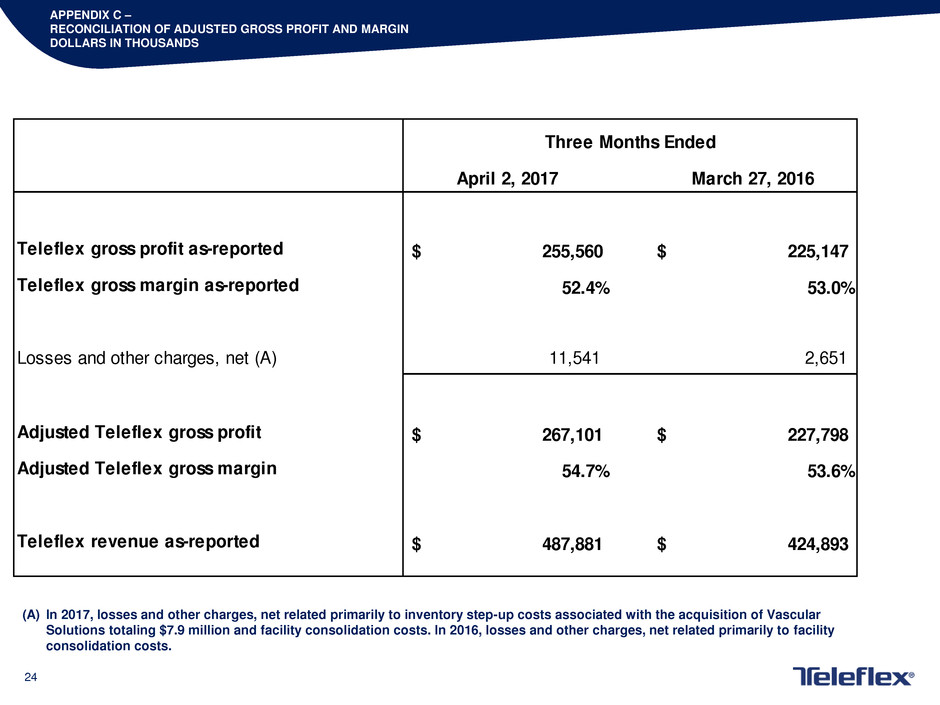
APPENDIX C –
RECONCILIATION OF ADJUSTED GROSS PROFIT AND MARGIN
DOLLARS IN THOUSANDS
April 2, 2017 March 27, 2016
Teleflex gross profit as-reported 255,560$ 225,147$
Teleflex gross margin as-reported 52.4% 53.0%
Losses and other charges, net (A) 11,541 2,651
Adjusted Teleflex gross profit 267,101$ 227,798$
Adjusted Teleflex gross margin 54.7% 53.6%
Teleflex revenue as-reported 487,881$ 424,893$
Three Months Ended
(A) In 2017, losses and other charges, net related primarily to inventory step-up costs associated with the acquisition of Vascular
Solutions totaling $7.9 million and facility consolidation costs. In 2016, losses and other charges, net related primarily to facility
consolidation costs.

25
APPENDIX D –
RECONCILIATION OF ADJUSTED OPERATING PROFIT AND MARGIN
DOLLARS IN THOUSANDS
(A) In 2017, losses and other charges, net related primarily to costs associated with the acquisition of Vascular Solutions and facility consolidation
costs. In 2016, losses and other charges, net related primarily to facility consolidation costs and the gain on sale of an asset.
April 2, 2017 March 27, 2016
Teleflex income from continuing operations before interest and taxes 60,819$ 67,497$
Teleflex income from continuing operations before interest and taxes margin 12.5% 15.9%
Restructuring and other impairment charges 12,945 9,968
Losses and other charges, net (A) 21,377 2,271
Intangible amortization expense 18,785 15,357
Adjusted Teleflex income from continuing operations before interest, taxes and
intangible amortization expense 113,926$ 95,093$
Adjusted Teleflex income from continuing operations before interest, taxes and
intangible amortization expense margin 23.4% 22.4%
Teleflex revenue as-reported 487,881$ 424,893$
Three Months Ended
26
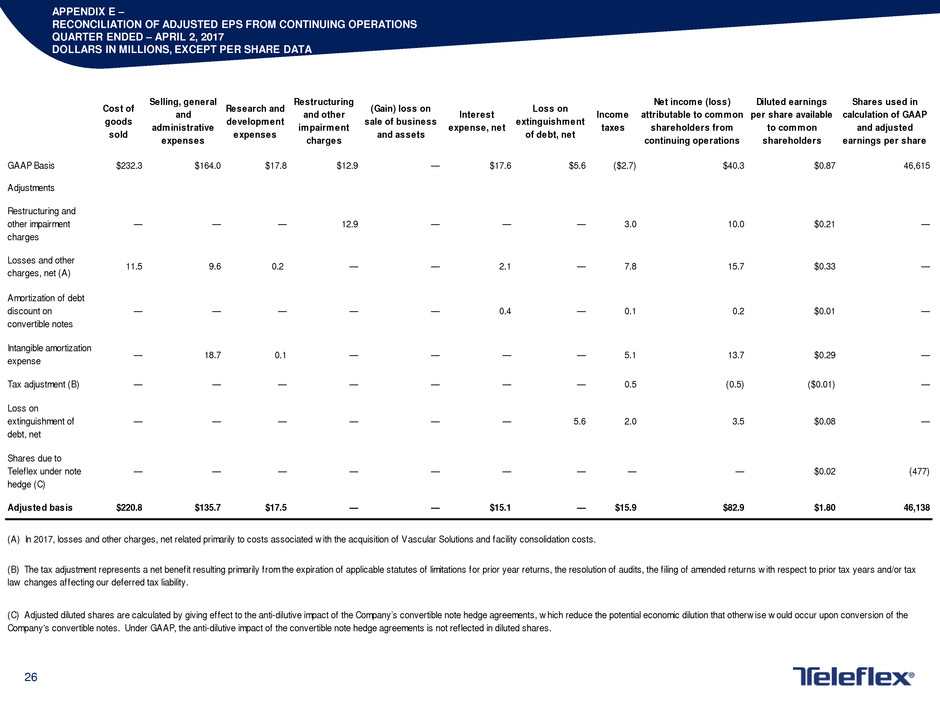
APPENDIX E –
RECONCILIATION OF ADJUSTED EPS FROM CONTINUING OPERATIONS
QUARTER ENDED – APRIL 2, 2017
DOLLARS IN MILLIONS, EXCEPT PER SHARE DATA
Cost of
goods
sold
Selling, general
and
administrative
expenses
Research and
development
expenses
Restructuring
and other
impairment
charges
(Gain) loss on
sale of business
and assets
Interest
expense, net
Loss on
extinguishment
of debt, net
Income
taxes
Net income (loss)
attributable to common
shareholders from
continuing operations
Diluted earnings
per share available
to common
shareholders
Shares used in
calculation of GAAP
and adjusted
earnings per share
GAAP Basis $232.3 $164.0 $17.8 $12.9 — $17.6 $5.6 ($2.7) $40.3 $0.87 46,615
Adjustments
Restructuring and
other impairment
charges
— — — 12.9 — — — 3.0 10.0 $0.21 —
Losses and other
charges, net (A)
11.5 9.6 0.2 — — 2.1 — 7.8 15.7 $0.33 —
Amortization of debt
discount on
convertible notes
— — — — — 0.4 — 0.1 0.2 $0.01 —
Intangible amortization
expense
— 18.7 0.1 — — — — 5.1 13.7 $0.29 —
Tax adjustment (B) — — — — — — — 0.5 (0.5) ($0.01) —
Loss on
extinguishment of
debt, net
— — — — — — 5.6 2.0 3.5 $0.08 —
Shares due to
Teleflex under note
hedge (C)
— — — — — — — — — $0.02 (477)
Adjusted basis $220.8 $135.7 $17.5 — — $15.1 — $15.9 $82.9 $1.80 46,138
(A) In 2017, losses and other charges, net related primarily to costs associated w ith the acquisition of Vascular Solutions and facility consolidation costs.
(B) The tax adjustment represents a net benefit resulting primarily from the expiration of applicable statutes of limitations for prior year returns, the resolution of audits, the f iling of amended returns w ith respect to prior tax years and/or tax
law changes affecting our deferred tax liability.
(C) Adjusted diluted shares are calculated by giving effect to the anti-dilutive impact of the Company’s convertible note hedge agreements, w hich reduce the potential economic dilution that otherw ise w ould occur upon conversion of the
Company's convertible notes. Under GAAP, the anti-dilutive impact of the convertible note hedge agreements is not reflected in diluted shares.
27
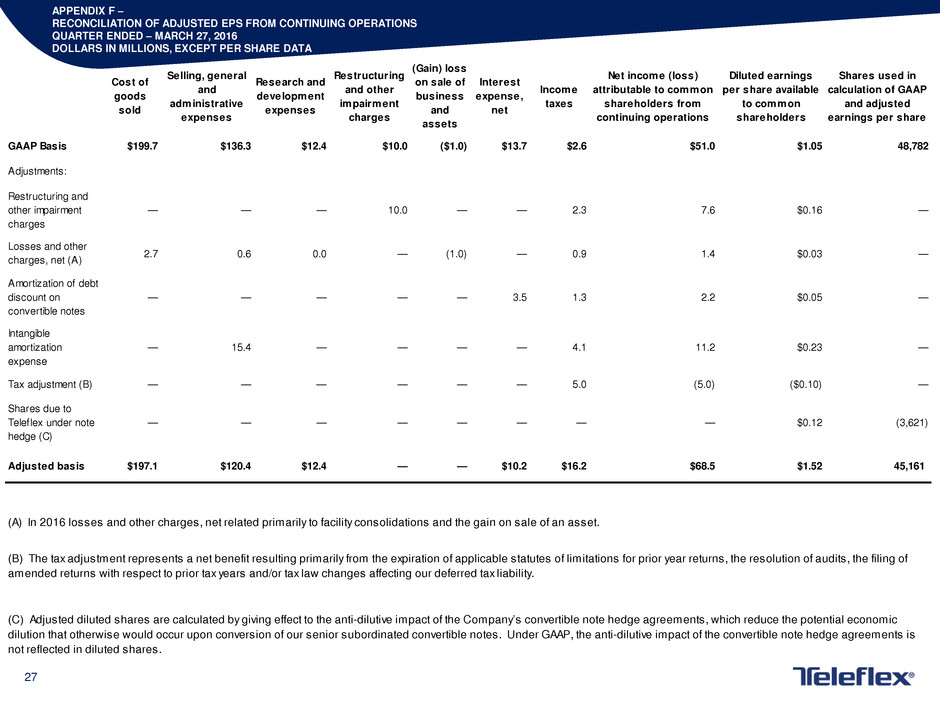
APPENDIX F –
RECONCILIATION OF ADJUSTED EPS FROM CONTINUING OPERATIONS
QUARTER ENDED – MARCH 27, 2016
DOLLARS IN MILLIONS, EXCEPT PER SHARE DATA
Cost of
goods
sold
Selling, general
and
administrative
expenses
Research and
development
expenses
Restructuring
and other
impairment
charges
(Gain) loss
on sale of
business
and
assets
Interest
expense,
net
Income
taxes
Net income (loss)
attributable to common
shareholders from
continuing operations
Diluted earnings
per share available
to common
shareholders
Shares used in
calculation of GAAP
and adjusted
earnings per share
GAAP Basis $199.7 $136.3 $12.4 $10.0 ($1.0) $13.7 $2.6 $51.0 $1.05 48,782
Adjustments:
Restructuring and
other impairment
charges
— — — 10.0 — — 2.3 7.6 $0.16 —
Losses and other
charges, net (A)
2.7 0.6 0.0 — (1.0) — 0.9 1.4 $0.03 —
Amortization of debt
discount on
convertible notes
— — — — — 3.5 1.3 2.2 $0.05 —
Intangible
amortization
expense
— 15.4 — — — — 4.1 11.2 $0.23 —
Tax adjustment (B) — — — — — — 5.0 (5.0) ($0.10) —
Shares due to
Teleflex under note
hedge (C)
— — — — — — — — $0.12 (3,621)
Adjusted basis $197.1 $120.4 $12.4 — — $10.2 $16.2 $68.5 $1.52 45,161
(A) In 2016 losses and other charges, net related primarily to facility consolidations and the gain on sale of an asset.
(B) The tax adjustment represents a net benefit resulting primarily from the expiration of applicable statutes of limitations for prior year returns, the resolution of audits, the filing of
amended returns with respect to prior tax years and/or tax law changes affecting our deferred tax liability.
(C) Adjusted diluted shares are calculated by giving effect to the anti-dilutive impact of the Company’s convertible note hedge agreements, which reduce the potential economic
dilution that otherwise would occur upon conversion of our senior subordinated convertible notes. Under GAAP, the anti-dilutive impact of the convertible note hedge agreements is
not reflected in diluted shares.
28
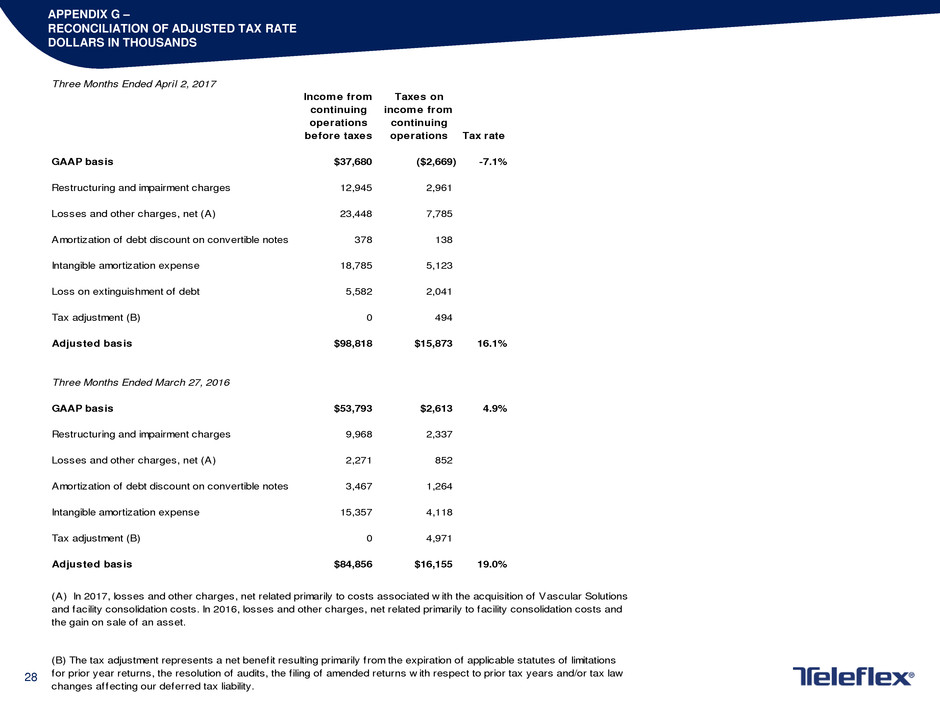
APPENDIX G –
RECONCILIATION OF ADJUSTED TAX RATE
DOLLARS IN THOUSANDS
Three Months Ended April 2, 2017
Income from
continuing
operations
before taxes
Taxes on
income from
continuing
operations Tax rate
GAAP basis $37,680 ($2,669) -7.1%
Restructuring and impairment charges 12,945 2,961
Losses and other charges, net (A) 23,448 7,785
Amortization of debt discount on convertible notes 378 138
Intangible amortization expense 18,785 5,123
Loss on extinguishment of debt 5,582 2,041
Tax adjustment (B) 0 494
Adjusted basis $98,818 $15,873 16.1%
Three Months Ended March 27, 2016
GAAP basis $53,793 $2,613 4.9%
Restructuring and impairment charges 9,968 2,337
Losses and other charges, net (A) 2,271 852
Amortization of debt discount on convertible notes 3,467 1,264
Intangible amortization expense 15,357 4,118
Tax adjustment (B) 0 4,971
Adjusted basis $84,856 $16,155 19.0%
(B) The tax adjustment represents a net benefit resulting primarily from the expiration of applicable statutes of limitations
for prior year returns, the resolution of audits, the f iling of amended returns w ith respect to prior tax years and/or tax law
changes affecting our deferred tax liability.
(A) In 2017, losses and other charges, net related primarily to costs associated w ith the acquisition of Vascular Solutions
and facility consolidation costs. In 2016, losses and other charges, net related primarily to facility consolidation costs and
the gain on sale of an asset.

29
APPENDIX H –
RECONCILIATION OF 2017 CONSTANT CURRENCY REVENUE GROWTH GUIDANCE
Low High
Forecasted GAAP Revenue Growth 10.0% 11.5%
Estimated Impact of Foreign Currency Exchange Rate Fluctuations 2.5% 2.5%
Forecasted Constant Currency Revenue Growth 12.5% 14.0%
30
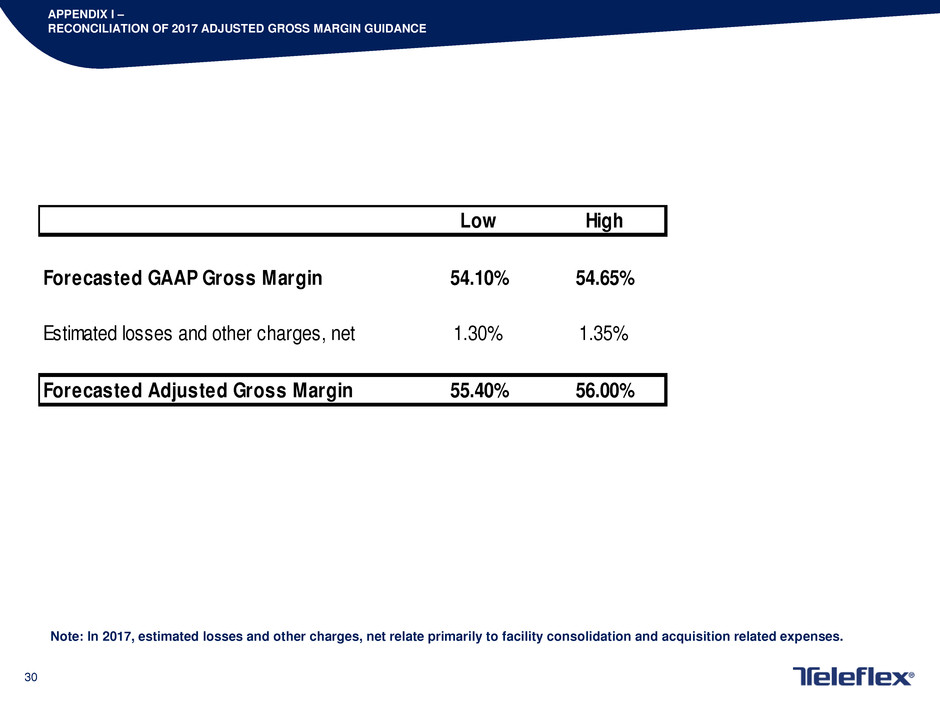
APPENDIX I –
RECONCILIATION OF 2017 ADJUSTED GROSS MARGIN GUIDANCE
Note: In 2017, estimated losses and other charges, net relate primarily to facility consolidation and acquisition related expenses.
Low High
Forecasted GAAP Gross Margin 54.10% 54.65%
Estimated losses and other charges, net 1.30% 1.35%
Forecasted Adjusted Gross Margin 55.40% 56.00%
31
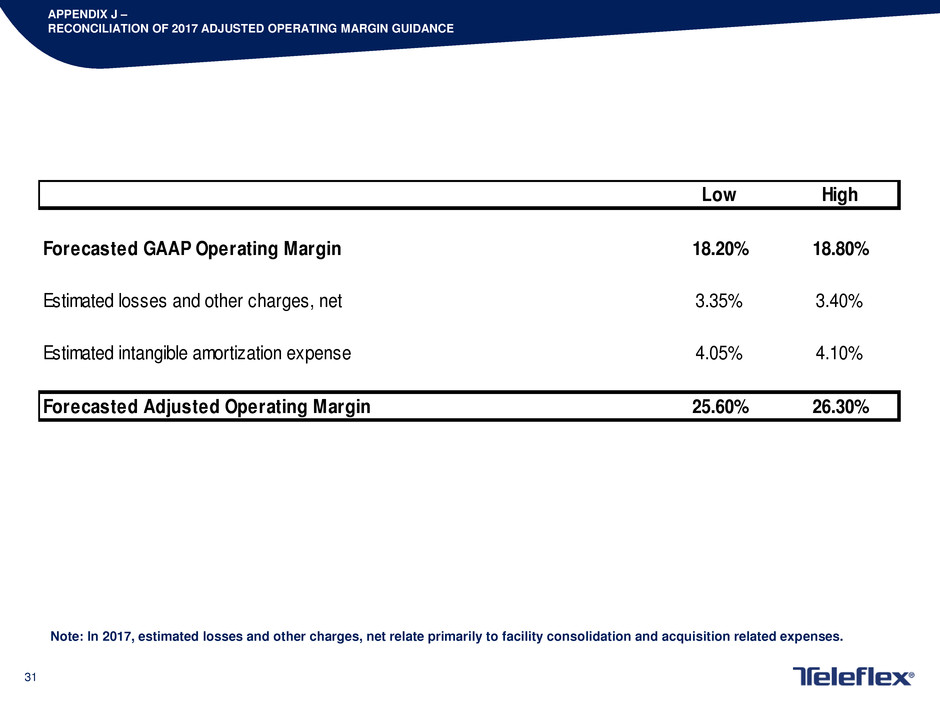
APPENDIX J –
RECONCILIATION OF 2017 ADJUSTED OPERATING MARGIN GUIDANCE
Note: In 2017, estimated losses and other charges, net relate primarily to facility consolidation and acquisition related expenses.
Low High
Forecasted GAAP Operating Margin 18.20% 18.80%
Estimated losses and other charges, net 3.35% 3.40%
Estimated intangible amortization expense 4.05% 4.10%
Forecasted Adjusted Operating Margin 25.60% 26.30%

32
APPENDIX K –
RECONCILIATION OF 2017 ADJUSTED EARNINGS PER SHARE GUIDANCE
Low High
Forecasted diluted earnings per share attributable to common shareholders $5.59 $5.66
Restructuring, impairment charges and special items, net of tax $1.15 $1.20
Intangible amortization expense, net of tax $1.30 $1.35
Amortization of debt discount on convertible notes, net of tax $0.01 $0.02
Forecasted adjusted diluted earnings per share $8.05 $8.23
