Attached files
| file | filename |
|---|---|
| 8-K - 8-K - SHENANDOAH TELECOMMUNICATIONS CO/VA/ | form8k.htm |

May 4, 2017 1Q 2017Earnings Conference Call Exhibit 99.1
Safe Harbor Statement This presentation includes “forward-looking statements” within the meaning of Section 27A of the Securities Act and Section 21E of the Securities Exchange Act of 1934, as amended, regarding, among other things, our business strategy, our prospects and our financial position. These statements can be identified by the use of forward-looking terminology such as “believes,” “estimates,” “expects,” “intends,” “may,” “will,” “should,” “could,” or “anticipates” or the negative or other variation of these similar words, or by discussions of strategy or risks and uncertainties. These statements are based on current expectations of future events. If underlying assumptions prove inaccurate or unknown risks or uncertainties materialize, actual results could vary materially from the Company’s expectations and projections. Important factors that could cause actual results to differ materially from such forward-looking statements include, without limitation, risks related to the following: Increasing competition in the communications industry; andA complex and uncertain regulatory environment.A further list and description of these risks, uncertainties and other factors can be found in the Company’s SEC filings which are available online at www.sec.gov, www.shentel.com or on request from the Company. The Company does not undertake to update any forward-looking statements as a result of new information or future events or developments.

Use of Non-GAAP Financial Measures Included in this presentation are certain non-GAAP financial measures that are not determined in accordance with US generally accepted accounting principles. These financial performance measures are not indicative of cash provided or used by operating activities and exclude the effects of certain operating, capital and financing costs and may differ from comparable information provided by other companies, and they should not be considered in isolation, as an alternative to, or more meaningful than measures of financial performance determined in accordance with US generally accepted accounting principles. These financial performance measures are commonly used in the industry and are presented because Shentel believes they provide relevant and useful information to investors. Shentel utilizes these financial performance measures to assess its ability to meet future capital expenditure and working capital requirements, to incur indebtedness if necessary, return investment to shareholders and to fund continued growth. Shentel also uses these financial performance measures to evaluate the performance of its businesses and for budget planning purposes.
Chris FrenchPresident and CEO

First Quarter 2017 Highlights (Q1’17 v. Q1’16) Net Income in Q1’17Net income of $2.3 million in Q1’17, down from $13.9 million in Q1’16Adjusted OIBDA Growth Increased 82.0% to $73.5 millionRevenue Growth Increased 66.2% to $153.9 millionCustomer Growth 3/31/16 3/31/17 ChangeWireless 457,770 960,707 +502,937Cable (RGUs) 131,527 132,846 +1,319
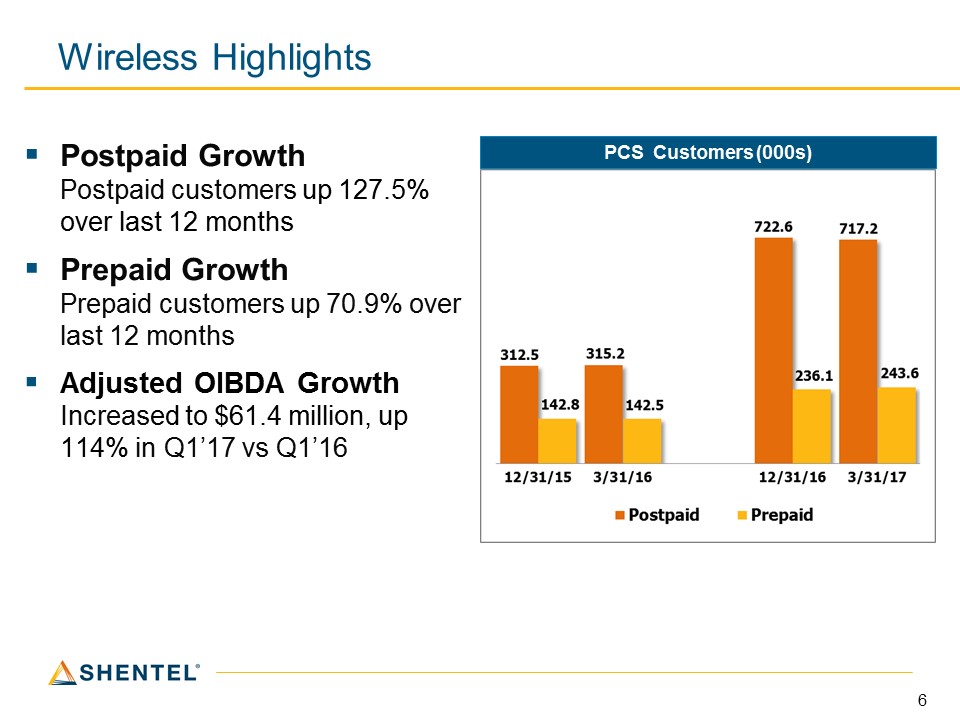
Wireless Highlights PCS Customers (000s) Postpaid Growth Postpaid customers up 127.5% over last 12 monthsPrepaid GrowthPrepaid customers up 70.9% over last 12 monthsAdjusted OIBDA GrowthIncreased to $61.4 million, up 114% in Q1’17 vs Q1’16

Cable Highlights Revenue GrowthOperating revenues $29.0 million, growth of 9.7% over Q1’16Q1’17 Adjusted OIBDA $9.3 million, up 31.7% from Q1’16132,846 RGUs at Q1’17, up 1.0% over Q1’16 Cable Adjusted OIBDA (in millions) Cable RGUs
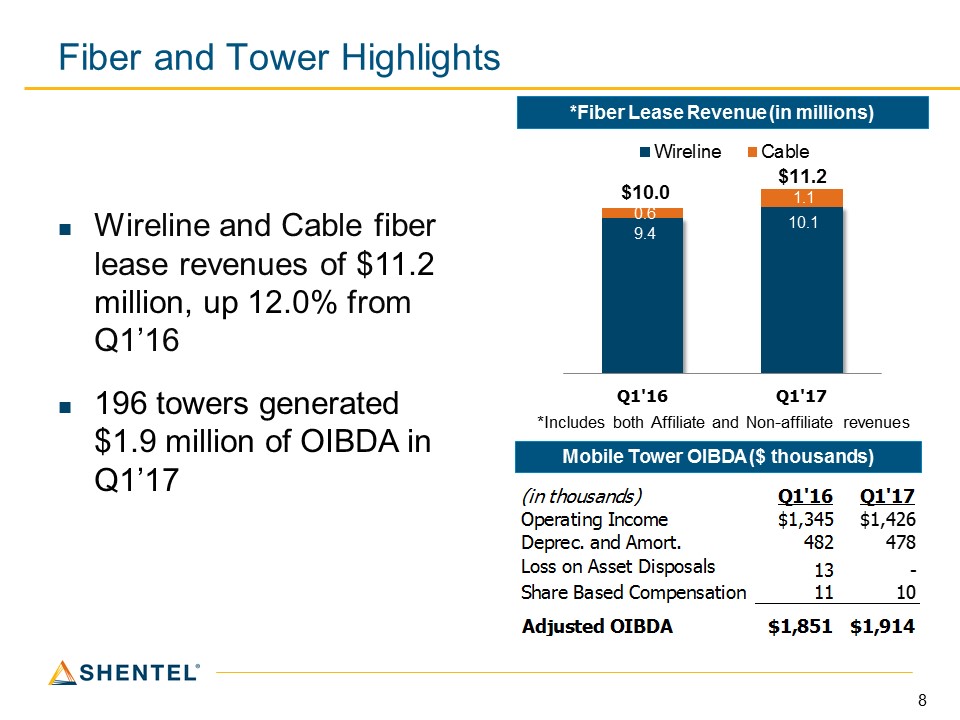
Fiber and Tower Highlights Wireline and Cable fiber lease revenues of $11.2 million, up 12.0% from Q1’16196 towers generated $1.9 million of OIBDA in Q1’17 *Fiber Lease Revenue (in millions) Mobile Tower OIBDA ($ thousands) *Includes both Affiliate and Non-affiliate revenues

Adele SkolitsVP of Finance and CFO
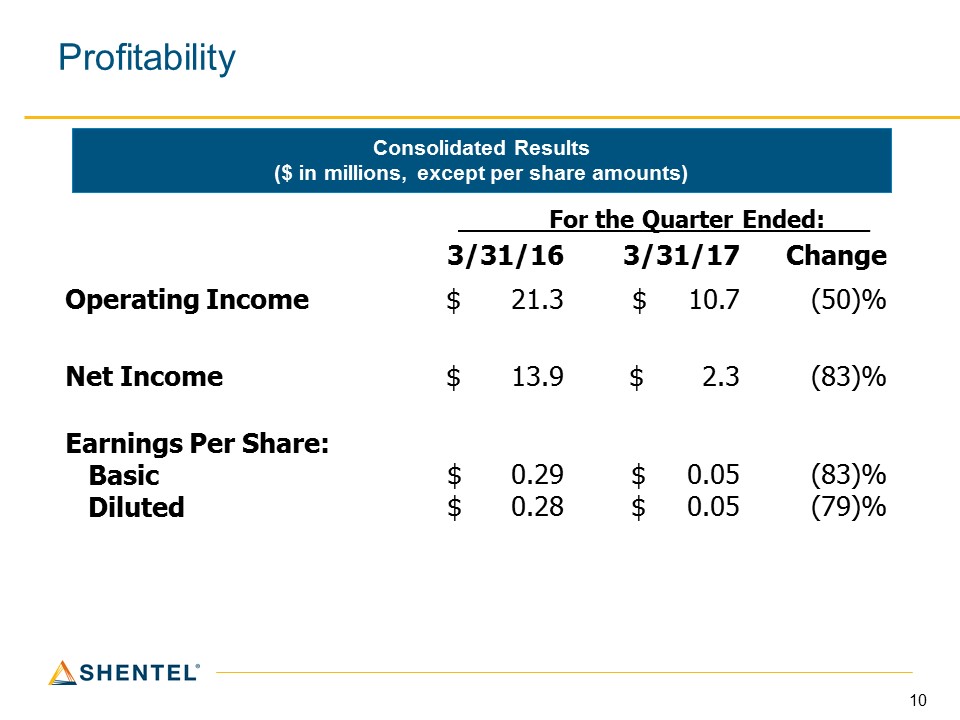
Profitability Consolidated Results($ in millions, except per share amounts) 3/31/16 3/31/17 Change Operating Income $ 21.3 $ 10.7 (50)% Net Income $ 13.9 $ 2.3 (83)% Earnings Per Share: Basic Diluted $ 0.29$ 0.28 $ 0.05 $ 0.05 (83)%(79)% For the Quarter Ended:___
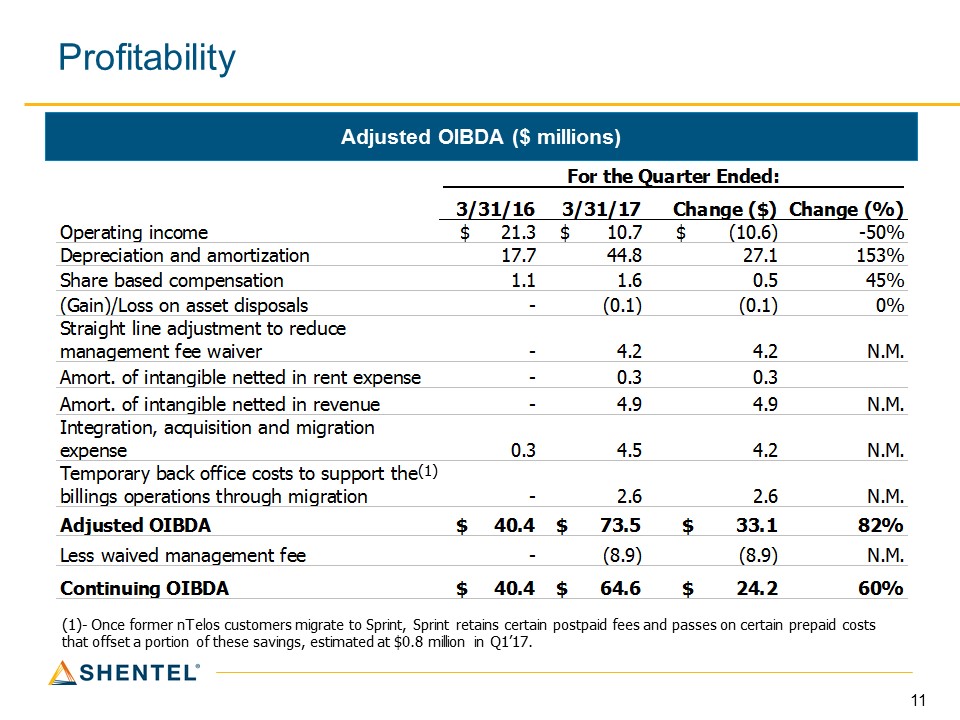
Profitability Adjusted OIBDA ($ millions) (1)- Once former nTelos customers migrate to Sprint, Sprint retains certain postpaid fees and passes on certain prepaid costs that offset a portion of these savings, estimated at $0.8 million in Q1’17. (1)

Adjusted OIBDA by Segment ($ millions)

Wireless Segment – Change in Adjusted OIBDA Q1’17 vs. Q1’16 ($ millions) Postpaid Revenue Prepaid Revenue Waived Mgt Fee Travel Revenue Other Prepaid Costs Postpaid Acquisition Costs Prepaid AcquisitionCosts Network Costs Total
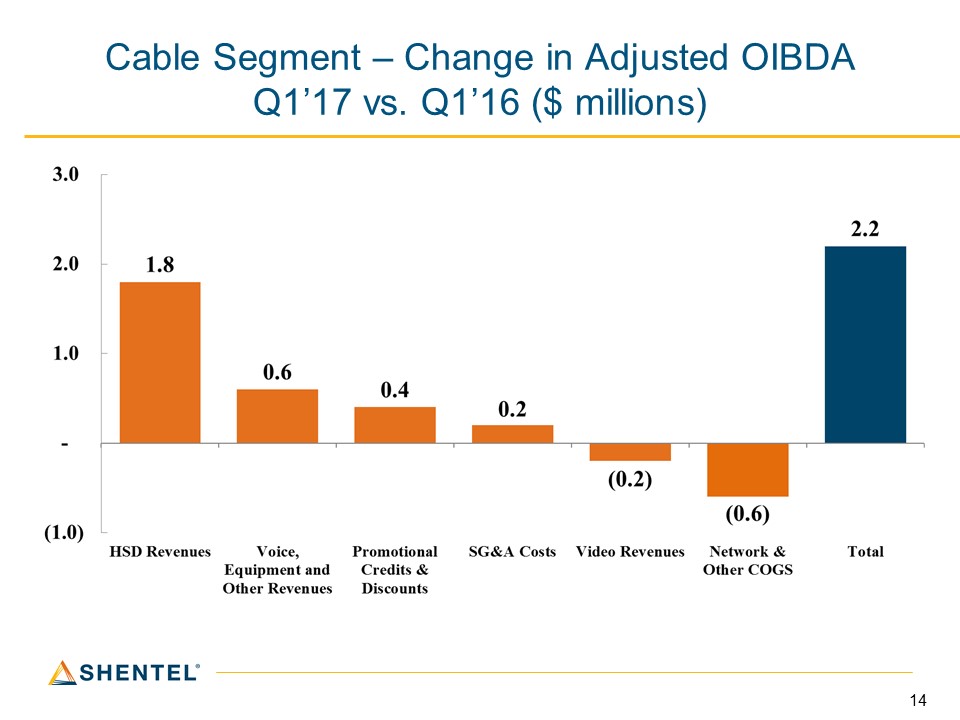
Cable Segment – Change in Adjusted OIBDA Q1’17 vs. Q1’16 ($ millions)

Earle MacKenzieEVP and COO
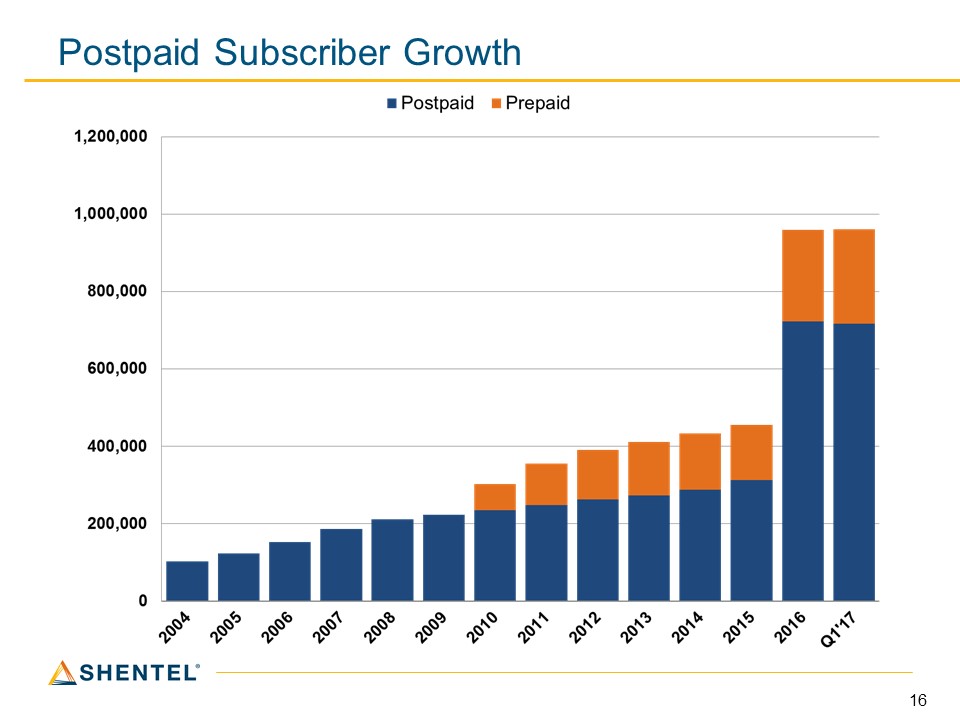
Postpaid Subscriber Growth
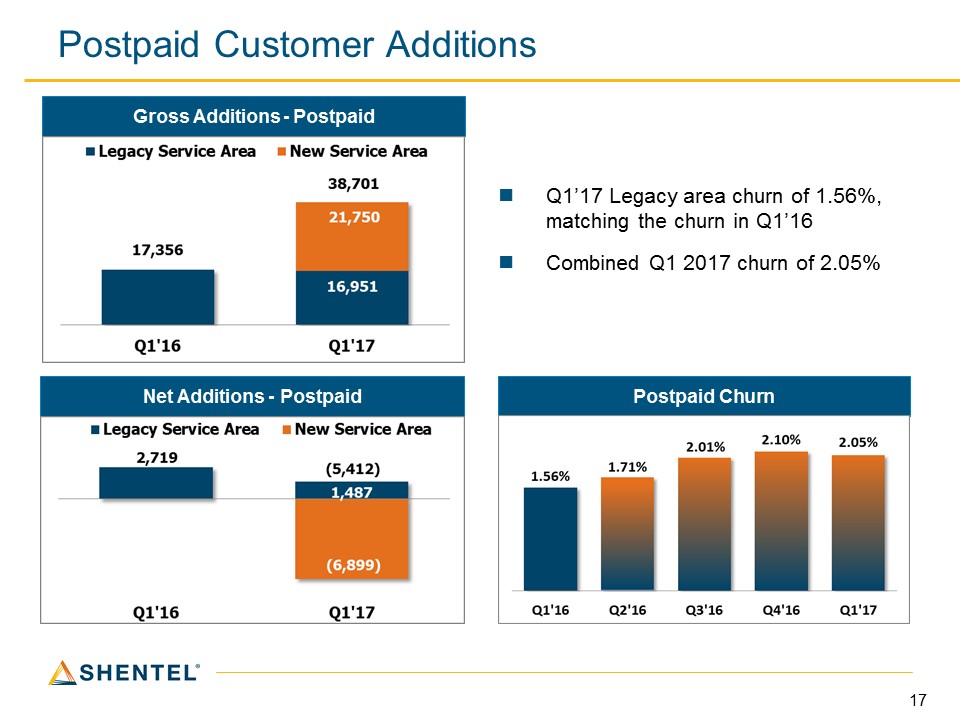
Postpaid Customer Additions Net Additions - Postpaid Gross Additions - Postpaid Q1’17 Legacy area churn of 1.56%, matching the churn in Q1’16Combined Q1 2017 churn of 2.05% Postpaid Churn

Billed Revenue per Customer Stabilizing Gross Billed Service Revenue per Postpaid User – Data & Voice (1) 1 – Before Service credits, bad debt, Sprint fees.2 – Legacy markets only (2)
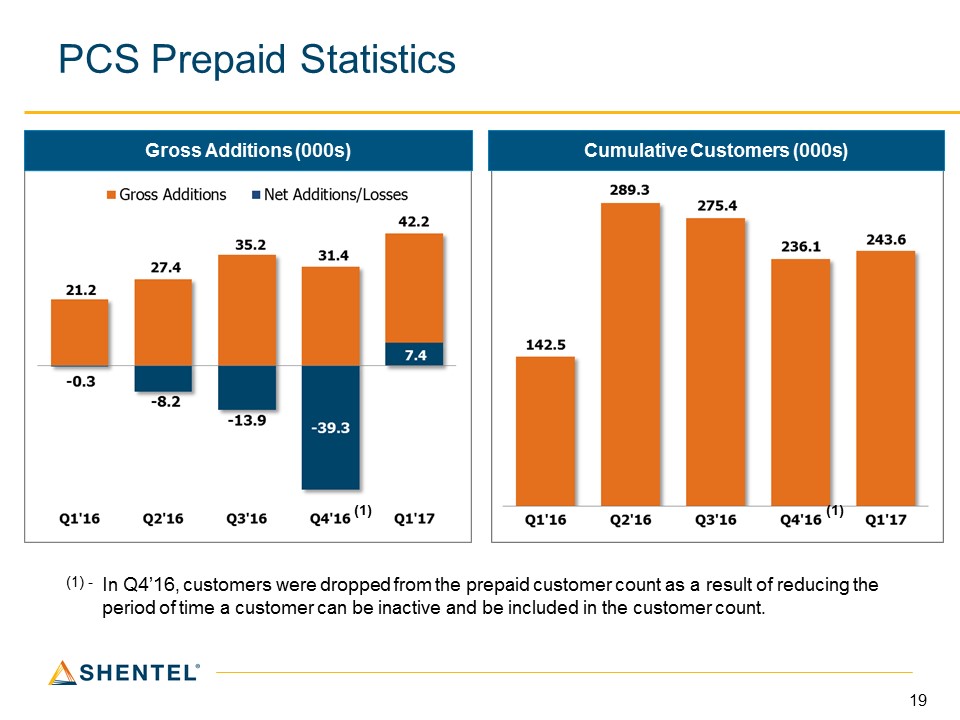
PCS Prepaid Statistics Gross Additions (000s) Cumulative Customers (000s) In Q4’16, customers were dropped from the prepaid customer count as a result of reducing the period of time a customer can be inactive and be included in the customer count. (1) - (1) (1)
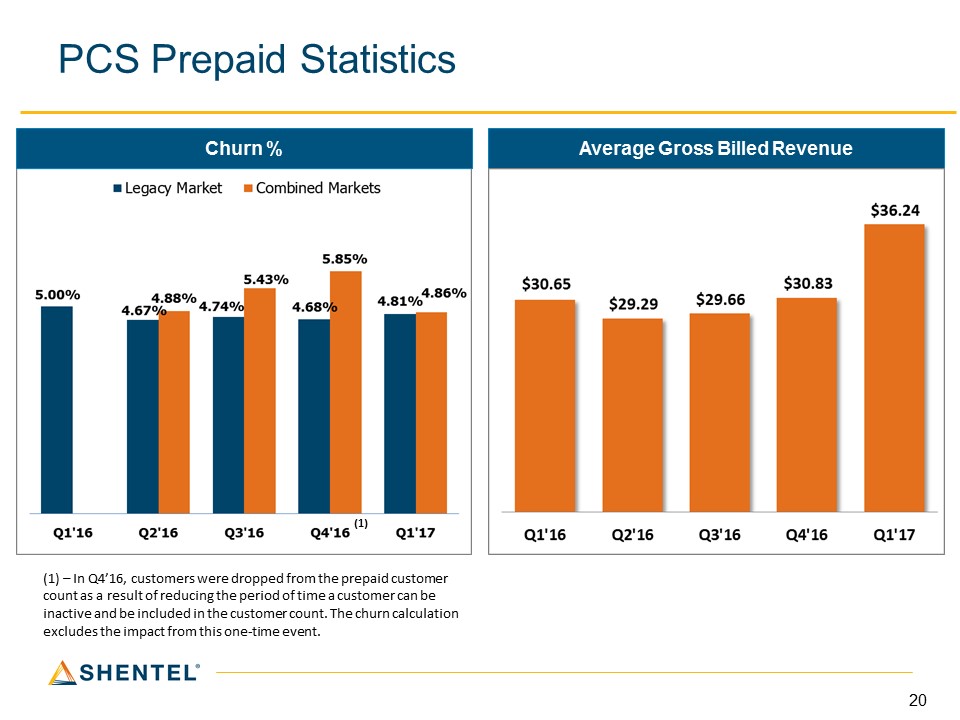
PCS Prepaid Statistics Churn % Average Gross Billed Revenue (1) – In Q4’16, customers were dropped from the prepaid customer count as a result of reducing the period of time a customer can be inactive and be included in the customer count. The churn calculation excludes the impact from this one-time event. (1)

Status of Network Enhancements – nTelos Footprint 100 186 220 363 Enhancement # of cell sites

Network Statistics at 3/31/17 Cell Sites Legacy New CDMA Base Stations (sites) 568 908 nTelos 3G sites still requiring upgrade 0 67 Sites with 2nd LTE carrier 550 777 Sites with three carriers, including a 2nd carrier @ 1900 MHz 221 180 Sites with 2.5 GHz LTE 134 174 Traffic % LTE traffic 97% 90% Data usage increase (Q over Q) 9.8% 11.5% Avg LTE speeds (Mbps) 6.00 5.90 Avg data usage per subscriber (Gb) 7.2 6.5 Dropped call rate 0.32% 0.46% Blocked call rate 0.15% 0.14%

Cable - RGU Growth by Quarter Customers 77,090 76,471 77,393 77,366 77,925 RGU's/Customer 1.71 1.71 1.71 1.71 1.70 Includes acquisition of Colane Cable (1/1/2016)College students disconnect during summer (2) (1)

Increasing Average Monthly Cable Revenue Average Monthly Revenue per RGU Average Monthly Revenue per Customer* *Average monthly revenue per video subscriber was $159.60 and $181.03 for Q1 2016 and Q1 2017, respectively.
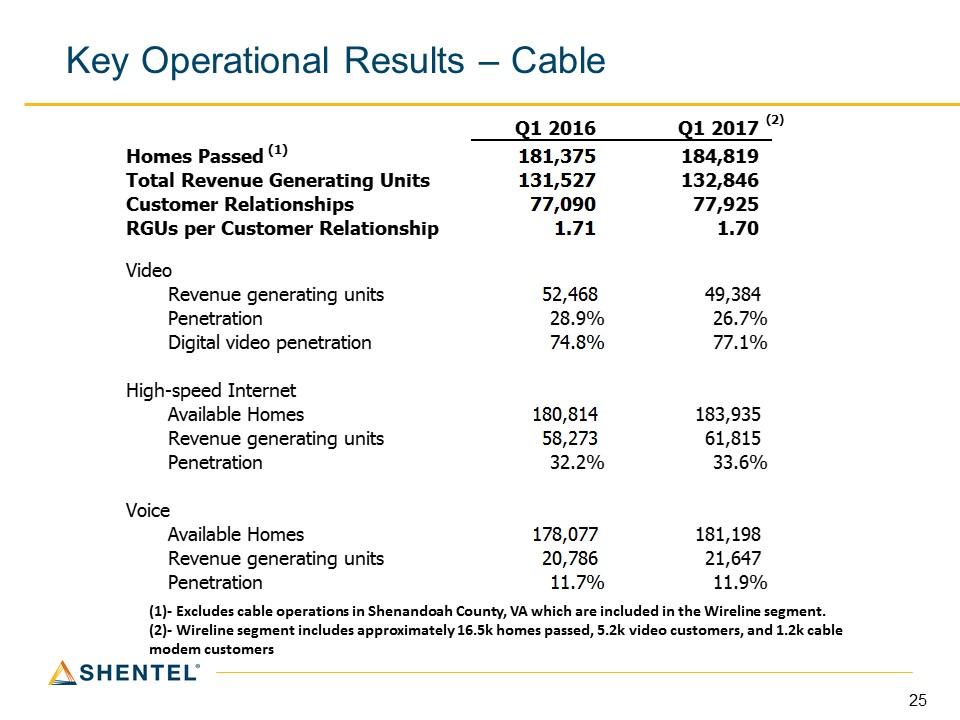
Key Operational Results – Cable (1)- Excludes cable operations in Shenandoah County, VA which are included in the Wireline segment. (2)- Wireline segment includes approximately 16.5k homes passed, 5.2k video customers, and 1.2k cable modem customers (2)
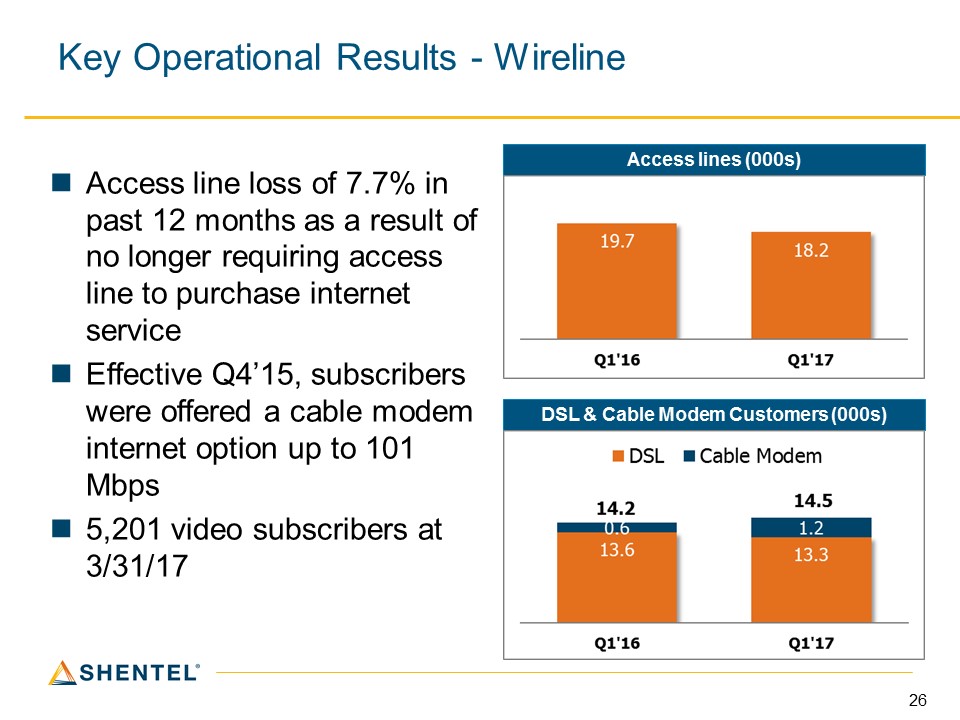
Key Operational Results - Wireline Access line loss of 7.7% in past 12 months as a result of no longer requiring access line to purchase internet serviceEffective Q4’15, subscribers were offered a cable modem internet option up to 101 Mbps5,201 video subscribers at 3/31/17 Access lines (000s) DSL & Cable Modem Customers (000s)
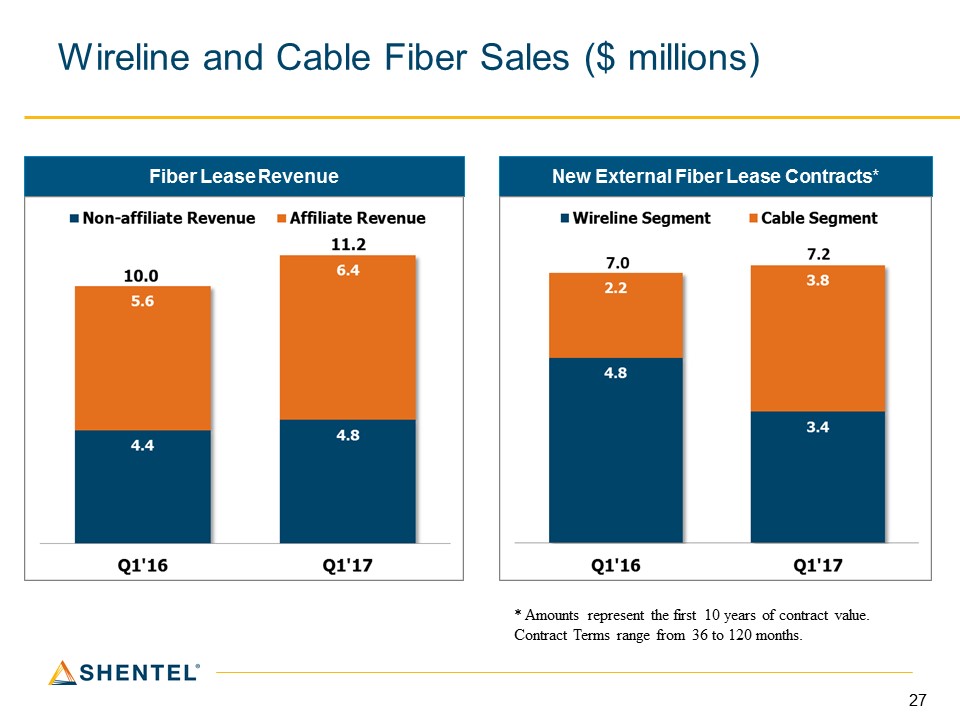
Wireline and Cable Fiber Sales ($ millions) Fiber Lease Revenue New External Fiber Lease Contracts* * Amounts represent the first 10 years of contract value. Contract Terms range from 36 to 120 months.
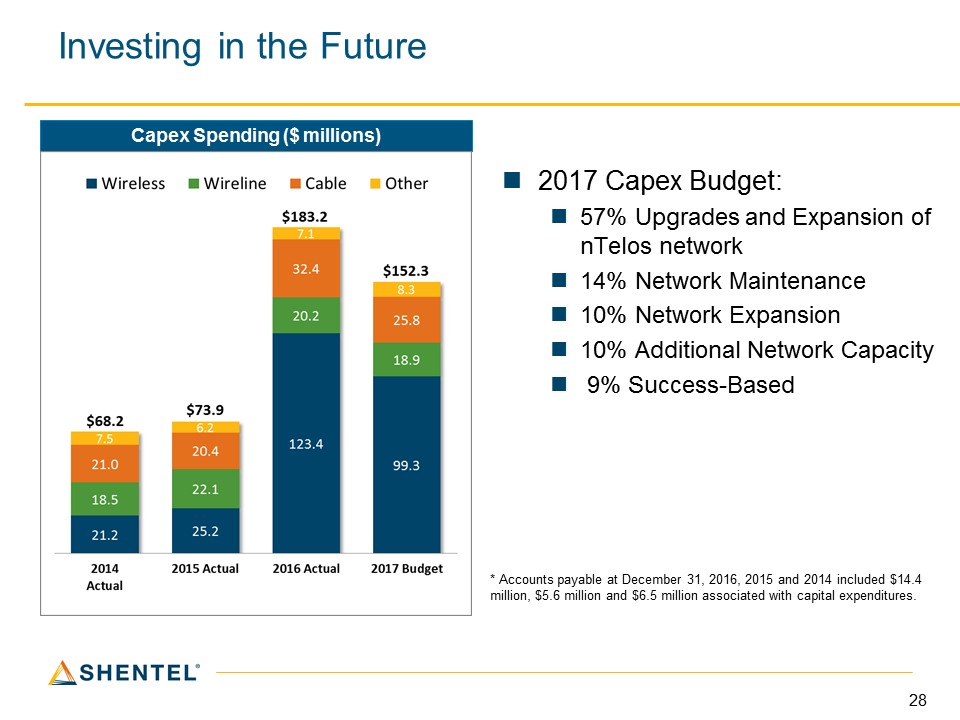
Investing in the Future Capex Spending ($ millions) 2017 Capex Budget:57% Upgrades and Expansion of nTelos network14% Network Maintenance10% Network Expansion10% Additional Network Capacity 9% Success-Based * Accounts payable at December 31, 2016, 2015 and 2014 included $14.4 million, $5.6 million and $6.5 million associated with capital expenditures.

Q&A

Appendix
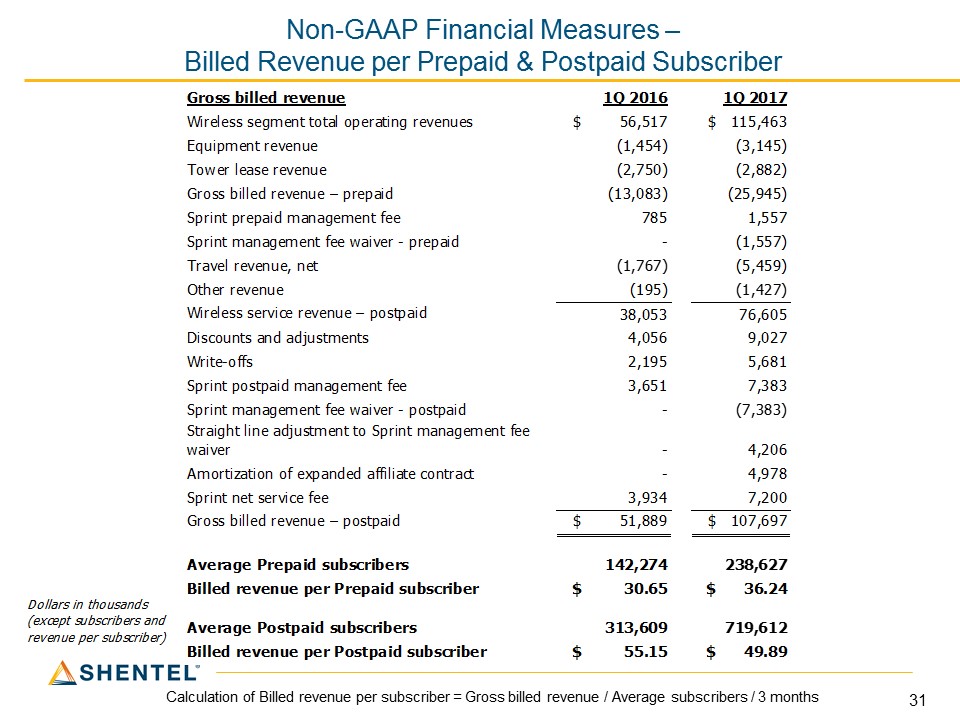
Non-GAAP Financial Measures – Billed Revenue per Prepaid & Postpaid Subscriber Calculation of Billed revenue per subscriber = Gross billed revenue / Average subscribers / 3 months

Non-GAAP Financial Measure – Average Monthly Cable Revenue
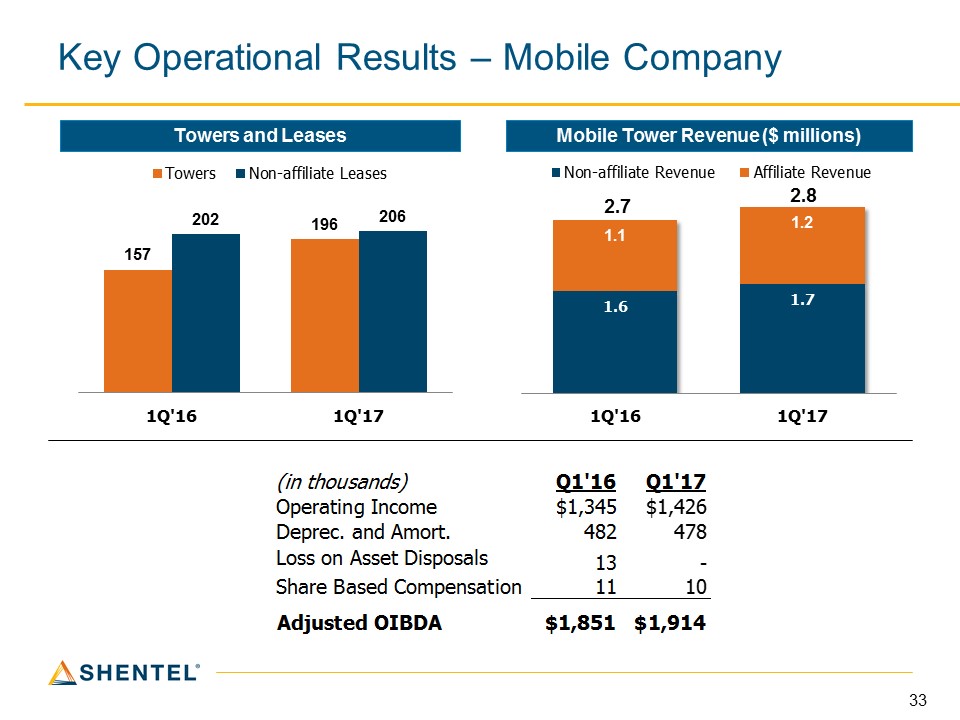
Key Operational Results – Mobile Company Mobile Tower Revenue ($ millions) Towers and Leases