Attached files
| file | filename |
|---|---|
| EX-99.1 - EXHIBIT 99.1 - MEDICAL PROPERTIES TRUST INC | d393172dex991.htm |
| 8-K - FORM 8-K - MEDICAL PROPERTIES TRUST INC | d393172d8k.htm |
Exhibit 99.2
MPT Medical Properties Trust
FIRST QUARTER 2017
Supplemental Information
MEDICALPROPERTIESTRUST.COM
TABLE OF CONTENTS

FORWARD-LOOKING STATEMENT Forward-looking statements involve known and unknown risks, uncertainties and other factors that may cause the actual results of the Company or future events to differ materially from those expressed in or underlying such forward-looking statements, including without limitation: Normalized FFO per share; expected payout ratio, the amount of acquisitions of healthcare real estate, if any; estimated debt metrics, portfolio diversification, capital markets conditions, the repayment of debt arrangements; statements concerning the additional income to the Company as a result of ownership interests in certain hospital operations and the timing of such income; the payment of future dividends, if any; completion of additional debt arrangement, and additional investments; national and international economic, business, real estate and other market conditions; the competitive environment in which the Company operates; the execution of the Company’s business plan; financing risks; the Company’s ability to maintain its status as a REIT for federal income tax purposes; acquisition and development risks; potential environmental and other liabilities; and other factors affecting the real estate industry generally or healthcare real estate in particular. For further discussion of the factors that could affect outcomes, please refer to the “Risk Factors” section of the Company’s Annual Report on Form 10-K for the year ended December 31, 2016, and as updated by the Company’s subsequently filed Quarterly Reports on Form 10-Q and other SEC filings. Except as otherwise required by the federal securities laws, the Company undertakes no obligation to update the information in this report.
On the Cover: IMED Valencia, an acute care hospital in Valencia, Spain that opened in 2017. MPT and certain accounts advised by AXA Investment Managers-Real Estate Assets own the real estate through a joint venture arrangement.
Q1 2017 | SUPPLEMENTAL INFORMATION 2
MEDICALPROPERTIESTRUST.COM
COMPANY OVERVIEW
|
|
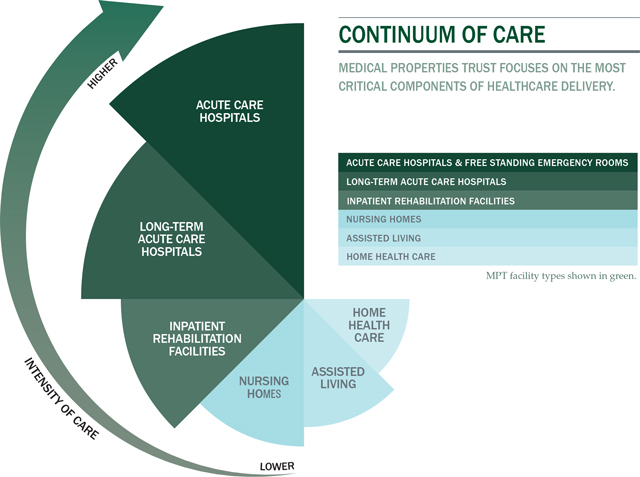
Medical Properties Trust, Inc. is a Birmingham, Alabama based self-advised real estate investment trust formed to capitalize on the changing trends in healthcare delivery by acquiring and developing net-leased healthcare facilities. MPT’s financing model allows hospitals and other healthcare facilities to unlock the value of their underlying real estate in order to fund facility improvements, technology upgrades, staff additions and new construction. Facilities include acute care hospitals, inpatient rehabilitation hospitals, long-term acute care hospitals, and other medical and surgical facilities. |

| OFFICERS | ||
| Edward K. Aldag, Jr. | Chairman, President and Chief Executive Officer | |
| R. Steven Hamner | Executive Vice President and Chief Financial Officer | |
| Emmett E. McLean | Executive Vice President, Chief Operating Officer, Treasurer and Secretary | |
| J. Kevin Hanna | Vice President, Controller and Chief Accounting Officer | |
| BOARD OF DIRECTORS |
MPT Officers, from left: R. Steven Hamner, Emmett E. McLean, J. Kevin Hanna and Edward K. Aldag, Jr. | |
|
Edward K. Aldag, Jr. |
||
| G. Steven Dawson | ||
| R. Steven Hamner | ||
| Robert. E. Holmes, Ph.D. | ||
| Sherry A. Kellett | ||
| William G. McKenzie | ||
| D. Paul Sparks, Jr. | ||
| Michael G. Stewart | ||
| C. Reynolds Thompson, III
|
||
| CORPORATE HEADQUARTERS | ||
|
Medical Properties Trust, Inc. |
||
| 1000 Urban Center Drive, Suite 501 Birmingham, AL 35242 |
||
|
(205) 969-3755 |
||
| (205) 969-3756 (fax) www.medicalpropertiestrust.com |

Q1 2017 | SUPPLEMENTAL INFORMATION 3
MEDICALPROPERTIESTRUST.COM
COMPANY OVERVIEW(continued)

Q1 2017 | SUPPLEMENTAL INFORMATION 4
MEDICALPROPERTIESTRUST.COM
FINANCIAL INFORMATION
RECONCILIATION OF NET INCOME TO FUNDS FROM OPERATIONS
(Unaudited)
(Amounts in thousands except per share data)
| For the Three Months Ended | ||||||||
| March 31, 2017 | March 31, 2016 | |||||||
| FFO INFORMATION: |
||||||||
| Net income attributable to MPT common stockholders |
$ | 67,970 | $ | 57,927 | ||||
| Participating securities’ share in earnings |
(125 | ) | (144 | ) | ||||
|
|
|
|
|
|||||
| Net income, less participating securities’ share in earnings |
$ | 67,845 | $ | 57,783 | ||||
| Depreciation and amortization (A) |
28,099 | 21,472 | ||||||
| Gain on sale of real estate |
(7,413 | ) | (40 | ) | ||||
|
|
|
|
|
|||||
| Funds from operations |
$ | 88,531 | $ | 79,215 | ||||
| Unutilized financing fees / debt refinancing costs |
13,629 | 4 | ||||||
| Write-off of straight line rent and other |
1,117 | — | ||||||
| Acquisition expenses, net of tax benefit (A) |
2,645 | 4,233 | ||||||
|
|
|
|
|
|||||
| Normalized funds from operations |
$ | 105,922 | $ | 83,452 | ||||
|
|
|
|
|
|||||
| Share-based compensation |
1,971 | 1,695 | ||||||
| Debt costs amortization |
1,617 | 1,835 | ||||||
| Additional rent received in advance (B) |
(300 | ) | (300 | ) | ||||
| Straight-line rent revenue and other |
(16,182 | ) | (10,829 | ) | ||||
|
|
|
|
|
|||||
| Adjusted funds from operations |
$ | 93,028 | $ | 75,853 | ||||
|
|
|
|
|
|||||
| PER DILUTED SHARE DATA: |
||||||||
| Net income, less participating securities’ share in earnings |
$ | 0.21 | $ | 0.24 | ||||
| Depreciation and amortization (A) |
0.09 | 0.09 | ||||||
| Gain on sale of real estate |
(0.02 | ) | — | |||||
|
|
|
|
|
|||||
| Funds from operations |
$ | 0.28 | $ | 0.33 | ||||
| Unutilized financing fees / debt refinancing costs |
0.04 | — | ||||||
| Write-off of straight line rent and other |
— | — | ||||||
| Acquisition expenses, net of tax benefit (A) |
0.01 | 0.02 | ||||||
|
|
|
|
|
|||||
| Normalized funds from operations |
$ | 0.33 | $ | 0.35 | ||||
|
|
|
|
|
|||||
| Share-based compensation |
0.01 | 0.01 | ||||||
| Debt costs amortization |
— | 0.01 | ||||||
| Additional rent received in advance (B) |
— | — | ||||||
| Straight-line rent revenue and other |
(0.05 | ) | (0.05 | ) | ||||
|
|
|
|
|
|||||
| Adjusted funds from operations |
$ | 0.29 | $ | 0.32 | ||||
|
|
|
|
|
|||||
| (A) | Includes our share of real estate depreciation and acquisition expenses from unconsolidated joint ventures. These amounts are included with the activity of all of our equity interests in the “Other income (expense)” line on the consolidated statements of income. |
| (B) | Represents additional rent received from one tenant in advance of when we can recognize as revenue for accounting purposes. This additional rent is being recorded to revenue on a straight-line basis over the lease life. |
Investors and analysts following the real estate industry utilize funds from operations, or FFO, as a supplemental performance measure. FFO, reflecting the assumption that real estate asset values rise or fall with market conditions, principally adjusts for the effects of GAAP depreciation and amortization of real estate assets, which assumes that the value of real estate diminishes predictably over time. We compute FFO in accordance with the definition provided by the National Association of Real Estate Investment Trusts, or NAREIT, which represents net income (loss) (computed in accordance with GAAP), excluding gains (losses) on sales of real estate and impairment charges on real estate assets, plus real estate depreciation and amortization and after adjustments for unconsolidated partnerships and joint ventures.
In addition to presenting FFO in accordance with the NAREIT definition, we also disclose normalized FFO, which adjusts FFO for items that relate to unanticipated or non-core events or activities or accounting changes that, if not noted, would make comparison to prior period results and market expectations less meaningful to investors and analysts. We believe that the use of FFO, combined with the required GAAP presentations, improves the understanding of our operating results among investors and the use of normalized FFO makes comparisons of our operating results with prior periods and other companies more meaningful. While FFO and normalized FFO are relevant and widely used supplemental measures of operating and financial performance of REITs, they should not be viewed as a substitute measure of our operating performance since the measures do not reflect either depreciation and amortization costs or the level of capital expenditures and leasing costs necessary to maintain the operating performance of our properties, which can be significant economic costs that could materially impact our results of operations. FFO and normalized FFO should not be considered an alternative to net income (loss) (computed in accordance with GAAP) as indicators of our financial performance or to cash flow from operating activities (computed in accordance with GAAP) as an indicator of our liquidity.
We calculate adjusted funds from operations, or AFFO, by subtracting from or adding to normalized FFO (i) unbilled rent revenue, (ii) non-cash share-based compensation expense, and (iii) amortization of deferred financing costs. AFFO is an operating measurement that we use to analyze our results of operations based on the receipt, rather than the accrual, of our rental revenue and on certain other adjustments. We believe that this is an important measurement because our leases generally have significant contractual escalations of base rents and therefore result in recognition of rental income that is not collected until future periods, and costs that are deferred or are non-cash charges. Our calculation of AFFO may not be comparable to AFFO or similarly titled measures reported by other REITs. AFFO should not be considered as an alternative to net income (calculated pursuant to GAAP) as an indicator of our results of operations or to cash flow from operating activities (calculated pursuant to GAAP) as an indicator of our liquidity.
Q1 2017 | SUPPLEMENTAL INFORMATION 5
MEDICALPROPERTIESTRUST.COM
FINANCIAL INFORMATION
DEBT SUMMARY
(as of March 31, 2017)
($ amounts in thousands)
| Debt Instrument |
Rate Type | Rate | Balance | |||||||||
| Northland – Mortgage Capital Term Loan |
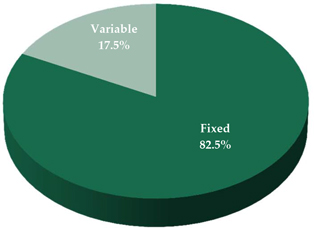
Fixed | 6.20 | % | 13,020 | ||||||||
| 2021 Credit Facility Revolver |
Variable | 2.24 | % | 380,000 | ||||||||
| 2022 Term Loan |
Variable | 2.49 | % | 200,000 | ||||||||
| 4.000% Notes Due 2022 (Euro) (A) |
Fixed | 4.00 | % | 532,600 | ||||||||
| 6.375% Notes Due 2022 |
Fixed | 6.38 | % | 350,000 | ||||||||
| 6.375% Notes Due 2024 |
Fixed | 6.38 | % | 500,000 | ||||||||
| 5.500% Notes Due 2024 |
Fixed | 5.50 | % | 300,000 | ||||||||
| 3.325% Notes Due 2025 (Euro) (A) |
Fixed | 3.33 | % | 532,600 | ||||||||
| 5.250% Notes Due 2026 |
Fixed | 5.25 | % | 500,000 | ||||||||
|
|
|
|||||||||||
| $ | 3,308,220 | |||||||||||
| Debt premium |
1,726 | |||||||||||
| Debt issuance costs |
(31,960 | ) | ||||||||||
|
|
|
|
|
|||||||||
| Weighted average rate |
4.54 | % | $ | 3,277,986 | ||||||||
|
|
|
|
|
|||||||||
Rate Type as Percentage of Total Debt
| (A) | Represents bonds issued in euros and converted to U.S. dollars at March 31, 2017. |
Q1 2017 | SUPPLEMENTAL INFORMATION 6
MEDICALPROPERTIESTRUST.COM
FINANCIAL INFORMATION
DEBT MATURITY SCHEDULE
($ amounts in thousands)
| Debt Instrument |
2017 | 2018 | 2019 | 2020 | 2021 | 2022 | 2023 | 2024 | 2025 | 2026 | ||||||||||||||||||||||||||||||
| Northland – Mortgage Capital Term Loan |
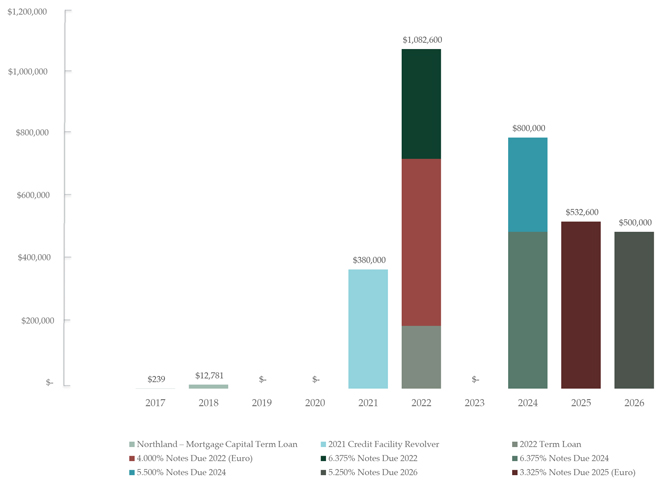
$ | 239 | $ | 12,781 | $ | — | $ | — | $ | — | $ | — | $ | — | $ | — | $ | — | $ | — | ||||||||||||||||||||
| 2021 Credit Facility Revolver |
— | — | — | — | 380,000 | — | — | — | — | — | ||||||||||||||||||||||||||||||
| 2022 Term Loan |
— | — | — | — | — | 200,000 | — | — | — | — | ||||||||||||||||||||||||||||||
| 4.000% Notes Due 2022 (Euro) |
— | — | — | — | — | 532,600 | — | — | — | — | ||||||||||||||||||||||||||||||
| 6.375% Notes Due 2022 |
— | — | — | — | — | 350,000 | — | — | — | — | ||||||||||||||||||||||||||||||
| 6.375% Notes Due 2024 |
— | — | — | — | — | — | — | 500,000 | — | — | ||||||||||||||||||||||||||||||
| 5.500% Notes Due 2024 |
— | — | — | — | — | — | — | 300,000 | — | — | ||||||||||||||||||||||||||||||
| 3.325% Notes Due 2025 (Euro) |
— | — | — | — | — | — | — | — | 532,600 | — | ||||||||||||||||||||||||||||||
| 5.250% Notes Due 2026 |
— | — | — | — | — | — | — | — | — | 500,000 | ||||||||||||||||||||||||||||||
|
|
|
|
|
|
|
|
|
|
|
|
|
|
|
|
|
|
|
|
|
|||||||||||||||||||||
| $ | 239 | $ | 12,781 | $ | — | $ | — | $ | 380,000 | $ | 1,082,600 | $ | — | $ | 800,000 | $ | 532,600 | $ | 500,000 | |||||||||||||||||||||
|
|
|
|
|
|
|
|
|
|
|
|
|
|
|
|
|
|
|
|
|
|||||||||||||||||||||
Q1 2017 | SUPPLEMENTAL INFORMATION 7
MEDICALPROPERTIESTRUST.COM
FINANCIAL INFORMATION
PRO FORMA NET DEBT / ANNUALIZED EBITDA
(Unaudited)
(Amounts in thousands)
| For the Three Months Ended | ||||
| March 31, 2017 | ||||
| Net income attributable to MPT common stockholders |
$ | 67,970 | ||
| Pro forma adjustments for capital transactions and acquisitions that occurred after the period (A) |
15,642 | |||
|
|
|
|||
| Pro forma net income |
$ | 83,612 | ||
| Add back: |
||||
| Interest expense |
38,029 | |||
| Debt refinancing costs |
13,629 | |||
| Depreciation and amortization |
29,468 | |||
| Stock-based compensation |
1,971 | |||
| Mid-quarter acquisitions / divestitures |
385 | |||
| Gain on sale of real estate and other asset dispositions, net |
(7,413 | ) | ||
| Acquisition expenses |
2,767 | |||
| Income tax expense |
867 | |||
|
|
|
|||
| 1Q 2017 Pro forma EBITDA |
$ | 163,315 | ||
|
|
|
|||
| Annualization |
$ | 653,260 | ||
|
|
|
|||
| Total debt |
$ | 3,277,986 | ||
| Pro forma changes to debt balance after March 31, 2017 (A) |
(116,000 | ) | ||
| Cash (A) |
(225,740 | ) | ||
|
|
|
|||
| Net debt |
$ | 2,936,246 | ||
|
|
|
|||
| Net debt / pro forma annualized EBITDA |
4.5x | |||
| (A) | Reflects net proceeds from recent equity offering and impact from previously disclosed investments, including two RCCH facilities, eight Steward facilities, two Alecto facilities, and 14 facilities in Germany. |
Q1 2017 | SUPPLEMENTAL INFORMATION 8
MEDICALPROPERTIESTRUST.COM
PORTFOLIO INFORMATION
LEASE AND MORTGAGE LOAN MATURITY SCHEDULE
(as of March 31, 2017)
($ amounts in thousands)
| Years of Maturities (A) (B) |
Total Properties | Base Rent/Interest (C) | Percent of Total Base Rent/Interest |
|||||||||
| 2017 |
— | $ | — | — | ||||||||
| 2018 |
1 | 2,067 | 0.3 | % | ||||||||
| 2019 |
2 | 5,054 | 0.8 | % | ||||||||
| 2020 |
5 | 10,685 | 1.8 | % | ||||||||
| 2021 |
3 | 13,397 | 2.2 | % | ||||||||
| 2022 |
15 | 74,275 | 12.4 | % | ||||||||
| 2023 |
4 | 12,885 | 2.2 | % | ||||||||
| 2024 |
1 | 2,273 | 0.4 | % | ||||||||
| 2025 |
7 | 22,846 | 3.8 | % | ||||||||
| 2026 |
5 | 24,755 | 4.1 | % | ||||||||
| Thereafter |
200 | 430,241 | 72.0 | % | ||||||||
|
|
|
|
|
|
|
|||||||
| 243 | $ | 598,478 | 100.0 | % | ||||||||
|
|
|
|
|
|
|
|||||||
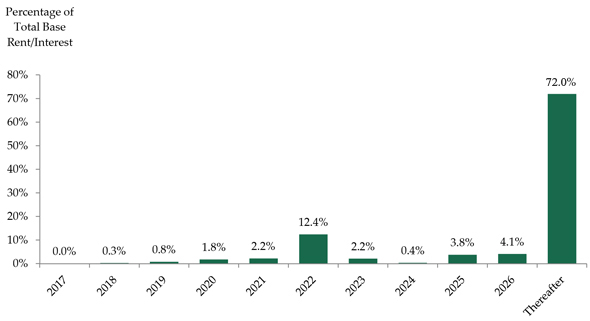
| (A) | Excludes four of our facilities that are under development, our Twelve Oaks facility that is not fully occupied, and the nine properties that we own through joint venture arrangements. In addition, the schedule reflects post March 31, 2017 transactions and commitments, including the the acquisition of two RCCH facilities, eight Steward facilities, two Alecto facilities and 14 facilities in Germany. |
| (B) | Lease/Loan expiration is based on the fixed term of the lease/loan and does not factor in potential renewal options provided for in our agreements. |
| (C) | Represents base rent/interest income on an annualized basis but does not include tenant recoveries, additional rents and other lease-related adjustments to revenue (i.e., straight-line rents and deferred revenues). |
Q1 2017 | SUPPLEMENTAL INFORMATION 9
MEDICALPROPERTIESTRUST.COM
PORTFOLIO INFORMATION
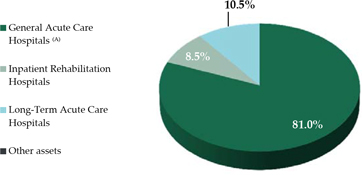
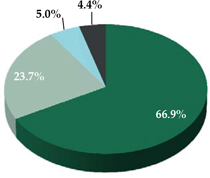
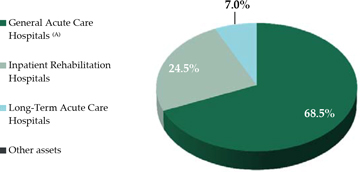
INVESTMENTS AND REVENUE BY ASSET TYPE
(March 31, 2017)
($ amounts in thousands)
| Asset Types |
Total Gross Assets (B) |
Percentage of Gross Assets |
YTD Revenue |
Percentage of Total Revenue |
||||||||||||
| General Acute Care Hospitals (A) |
$ | 4,982,643 | 66.9 | % | $ | 107,126 | 68.5 | % | ||||||||
| Inpatient Rehabilitation Hospitals |
1,765,365 | 23.7 | % | 38,279 | 24.5 | % | ||||||||||
| Long-Term Acute Care Hospitals |
373,179 | 5.0 | % | 10,992 | 7.0 | % | ||||||||||
| Other assets |
324,635 | 4.4 | % | — | — | |||||||||||
|
|
|
|
|
|
|
|
|
|||||||||
| Total |
$ | 7,445,822 | 100.0 | % | $ | 156,397 | 100.0 | % | ||||||||
|
|
|
|
|
|
|
|
|
|||||||||
| Domestic Investments by Asset Type
|
Domestic Revenue by Asset Type | |
|
| |
| Total Investments by Asset Type
|
Total Revenue by Asset Type | |
|
| |
| (A) | Includes three medical office buildings. |
| (B) | Represents investment concentration as a percentage of gross real estate assets, other loans, and equity investments, assuming all binding real estate commitments on new investments and unfunded amounts on development deals and commenced capital improvement projects are fully funded. |
Q1 2017 | SUPPLEMENTAL INFORMATION 10
MEDICALPROPERTIESTRUST.COM
PORTFOLIO INFORMATION
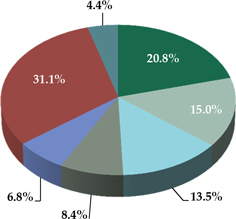
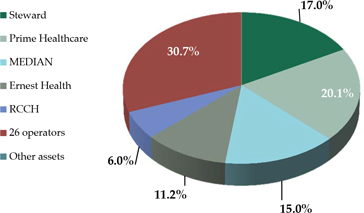
INVESTMENTS AND REVENUE BY OPERATOR
(March 31, 2017)
($ amounts in thousands)
| Operators |
Total Gross Assets (A) |
Percentage of Gross Assets |
YTD Revenue |
Percentage of Total Revenue |
||||||||||||
| Steward |
$ | 1,551,292 | 20.8 | % | $ | 26,584 | 17.0 | % | ||||||||
| Prime Healthcare |
1,115,356 | 15.0 | % | 31,511 | 20.1 | % | ||||||||||
| MEDIAN |
1,006,432 | 13.5 | % | 23,450 | 15.0 | % | ||||||||||
| Ernest Health |
627,971 | 8.4 | % | 17,520 | 11.2 | % | ||||||||||
| RCCH |
506,265 | 6.8 | % | 9,306 | 6.0 | % | ||||||||||
| 26 operators |
2,313,871 | 31.1 | % | 48,026 | 30.7 | % | ||||||||||
| Other assets |
324,635 | 4.4 | % | — | — | |||||||||||
|
|
|
|
|
|
|
|
|
|||||||||
| Total |
$ | 7,445,822 | 100.0 | % | $ | 156,397 | 100.0 | % | ||||||||
|
|
|
|
|
|
|
|
|
|||||||||
| (A) | Represents investment concentration as a percentage of gross real estate assets, other loans, and equity investments, assuming all binding real estate commitments on new investments and unfunded amounts on development deals and commenced capital improvement projects are fully funded. |
| Investments by Operator
|
Revenue by Operator | |
|
| |
Q1 2017 | SUPPLEMENTAL INFORMATION 11
MEDICALPROPERTIESTRUST.COM
PORTFOLIO INFORMATION
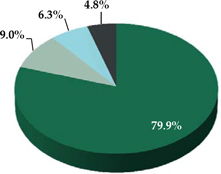
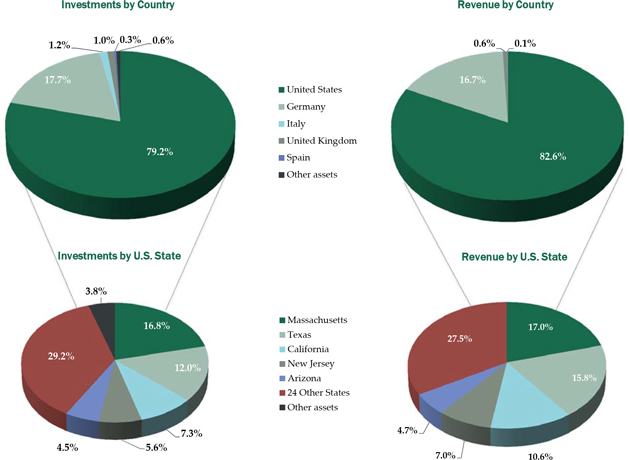
INVESTMENTS AND REVENUE BY U.S. STATE AND COUNTRY
(March 31, 2017)
($ amounts in thousands)
| U.S. States and Other Countries |
Total Gross Assets (A) |
Percentage of Gross Assets |
YTD Revenue |
Percentage of Total Revenue |
||||||||||||
| Massachusetts |
$ | 1,250,000 | 16.8 | % | $ | 26,584 | 17.0 | % | ||||||||
| Texas |
893,749 | 12.0 | % | 24,737 | 15.8 | % | ||||||||||
| California |
542,886 | 7.3 | % | 16,565 | 10.6 | % | ||||||||||
| New Jersey |
416,490 | 5.6 | % | 10,943 | 7.0 | % | ||||||||||
| Arizona |
331,833 | 4.5 | % | 7,332 | 4.7 | % | ||||||||||
| 24 Other States |
2,175,466 | 29.2 | % | 43,056 | 27.5 | % | ||||||||||
| Other assets |
284,070 | 3.8 | % | — | — | |||||||||||
|
|
|
|
|
|
|
|
|
|||||||||
| United States |
$ | 5,894,494 | 79.2 | % | $ | 129,217 | 82.6 | % | ||||||||
| Germany |
$ | 1,320,487 | 17.7 | % | $ | 26,190 | 16.7 | % | ||||||||
| Italy |
91,555 | 1.2 | % | — | — | |||||||||||
| United Kingdom |
75,939 | 1.0 | % | 885 | 0.6 | % | ||||||||||
| Spain |
22,782 | 0.3 | % | 105 | 0.1 | % | ||||||||||
| Other assets |
40,565 | 0.6 | % | — | — | |||||||||||
|
|
|
|
|
|
|
|
|
|||||||||
| International |
$ | 1,551,328 | 20.8 | % | $ | 27,180 | 17.4 | % | ||||||||
|
|
|
|
|
|
|
|
|
|||||||||
| Total |
$ | 7,445,822 | 100.0 | % | $ | 156,397 | 100.0 | % | ||||||||
|
|
|
|
|
|
|
|
|
|||||||||
| (A) | Represents investment concentration as a percentage of gross real estate assets, other loans, and equity investments, assuming all binding real estate commitments on new investments and unfunded amounts on development deals and commenced capital improvement projects are fully funded. |
Q1 2017 | SUPPLEMENTAL INFORMATION 12
MEDICALPROPERTIESTRUST.COM
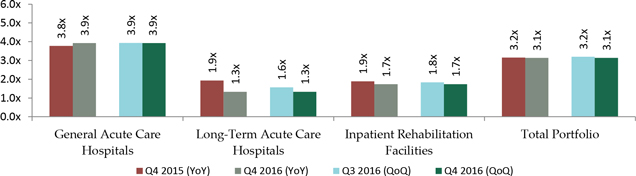
PORTFOLIO INFORMATION
Same Store EBITDAR(1) Rent Coverage
YOY and Sequential Quarter Comparisons by Property Type
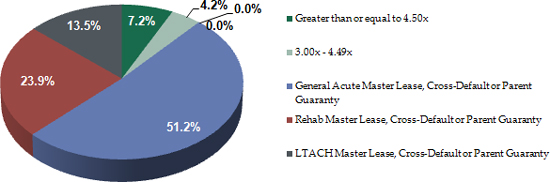
Stratification of Portfolio EBITDAR Rent Coverage
| EBITDAR Rent Coverage TTM |
Investment (in thousands) |
No. of Facilities | Percentage of Investment |
|||||||
| Greater than or equal to 4.50x |
$ | 193,532 | 4 | 7.2 | % | |||||
| 3.00x - 4.49x |
$ | 115,000 | 1 | 4.2 | % | |||||
| Total Master Leased, Cross-Defaulted and/or with Parent Guaranty: 2.5x |
$ | 2,397,478 | 78 | 88.6 | % | |||||
| General Acute Master Leased, Cross-Defaulted and/or with Parent Guaranty: 3.0x |
$ | 1,386,075 | 30 | 51.2 | % | |||||
| Inpatient Rehabilitation Facilities Master Leased, Cross-Defaulted and/or with Parent Guaranty: 1.7x |
$ | 647,245 | 31 | 23.9 | % | |||||
| Long-Term Acute Care Hospitals Master Leased, Cross-Defaulted and/or with Parent Guaranty: 1.3x |
$ | 364,158 | 17 | 13.5 | % | |||||
Notes:
Same Store represents properties with at least 24 months of financial reporting data. Properties that do not provide financial reporting and disposed assets are not included.
All data presented is on a trailing twelve month basis.
| (1) | EBITDAR adjusted for non-recurring items. |
Q1 2017 | SUPPLEMENTAL INFORMATION 13
MEDICALPROPERTIESTRUST.COM
PORTFOLIO INFORMATION
SUMMARY OF COMPLETED ACQUISITIONS / DEVELOPMENT PROJECTS FOR THE
THREE MONTHS ENDED MARCH 31, 2017
($ amounts in thousands)
| Operator |
Location | Costs Incurred as of 03/31/2017 |
Rent Commencement Date |
Acquisition/ Development |
||||||||||||
| MEDIAN |
Germany | $ | 9,004 | 1/30/2017 | Acquisition | |||||||||||
| Adeptus Health |
Mesa, Arizona | 52,000 | 2/10/2017 | Development | ||||||||||||
| Adeptus Health |
Austin, Texas | 5,264 | 3/2/2017 | Development | ||||||||||||
|
|
|
|||||||||||||||
| $ | 66,268 | |||||||||||||||
|
|
|
|||||||||||||||
SUMMARY OF CURRENT INVESTMENT COMMITMENTS AS OF MARCH 31, 2017
($ amounts in thousands)
| Operator |
Location | Commitment | Acquisition/ Development |
|||||||||
| MEDIAN & Affiliates |
Germany | $ | 199,305 | Acquisition | ||||||||
| RCCH |
Idaho & Washington | 105,000 | Acquisition | |||||||||
| Steward |
Florida, Ohio & Pennsylvania | 301,292 | Acquisition | |||||||||
| Alecto |
Ohio & West Virginia | 40,000 | Acquisition | |||||||||
| Circle |
United Kingdom | 40,485 | Development | |||||||||
|
|
|
|||||||||||
| $ | 686,082 | |||||||||||
|
|
|
|||||||||||
SUMMARY OF CURRENT DEVELOPMENT PROJECTS AS OF MARCH 31, 2017
($ amounts in thousands)
| Operator |
Commitment | Costs Incurred as of 03/31/2017 |
Estimated Completion Date |
|||||||||
| Adeptus Health |
$ | 12,220 | $ | 7,939 | 2Q 2017 | |||||||
| Ernest Health |
28,067 | 5,231 | 4Q 2017 | |||||||||
| Adeptus Health |
7,804 | 1,771 | 1Q 2018 | |||||||||
|
|
|
|
|
|||||||||
| $ | 48,091 | $ | 14,941 | |||||||||
|
|
|
|
|
|||||||||
Q1 2017 | SUPPLEMENTAL INFORMATION 14
MEDICALPROPERTIESTRUST.COM
FINANCIAL STATEMENTS
MEDICAL PROPERTIES TRUST, INC. AND SUBSIDIARIES
Consolidated Statements of Income
(Unaudited)
(Amounts in thousands, except per share data)
| For the Three Months Ended | ||||||||
| March 31, 2017 | March 31, 2016 | |||||||
| Revenues |
||||||||
| Rent billed |
$ | 96,763 | $ | 74,061 | ||||
| Straight-line rent |
12,779 | 8,217 | ||||||
| Income from direct financing leases |
17,880 | 18,951 | ||||||
| Interest and fee income |
28,975 | 33,770 | ||||||
|
|
|
|
|
|||||
| Total revenues |
156,397 | 134,999 | ||||||
| Expenses |
||||||||
| Real estate depreciation and amortization |
27,586 | 21,142 | ||||||
| Property-related |
1,328 | 901 | ||||||
| Acquisition expenses |
2,756 | (1,065 | ) | |||||
| General and administrative |
13,197 | 11,471 | ||||||
|
|
|
|
|
|||||
| Total operating expenses |
44,867 | 32,449 | ||||||
|
|
|
|
|
|||||
| Operating income |
111,530 | 102,550 | ||||||
| Interest expense |
(38,029 | ) | (39,369 | ) | ||||
| Gain on sale of real estate and other asset dispositions, net |
7,413 | 40 | ||||||
| Unutilized financing fees/debt refinancing costs |
(13,629 | ) | (4 | ) | ||||
| Other income (expense) |
1,767 | (4,672 | ) | |||||
| Income tax expense |
(867 | ) | (319 | ) | ||||
|
|
|
|
|
|||||
| Income from continuing operations |
68,185 | 58,226 | ||||||
| Loss from discontinued operations |
— | (1 | ) | |||||
|
|
|
|
|
|||||
| Net income |
68,185 | 58,225 | ||||||
| Net income attributable to non-controlling interests |
(215 | ) | (298 | ) | ||||
|
|
|
|
|
|||||
| Net income attributable to MPT common stockholders |
$ | 67,970 | $ | 57,927 | ||||
|
|
|
|
|
|||||
| Earnings per common share – basic and diluted: |
||||||||
| Income from continuing operations |
$ | 0.21 | $ | 0.24 | ||||
| Loss from discontinued operations |
— | — | ||||||
|
|
|
|
|
|||||
| Net income attributable to MPT common stockholders |
$ | 0.21 | $ | 0.24 | ||||
|
|
|
|
|
|||||
| Weighted average shares outstanding – basic |
321,057 | 237,510 | ||||||
| Weighted average shares outstanding – diluted |
321,423 | 237,819 | ||||||
| Dividends declared per common share |
$ | 0.24 | $ | 0.22 | ||||
Q1 2017 | SUPPLEMENTAL INFORMATION 15
MEDICALPROPERTIESTRUST.COM
FINANCIAL STATEMENTS
MEDICAL PROPERTIES TRUST, INC. AND SUBSIDIARIES
Consolidated Balance Sheets
(Amounts in thousands, except per share data)
| March 31, 2017 | December 31, 2016 | |||||||
| (Unaudited) | (A) | |||||||
| ASSETS |
||||||||
| Real estate assets |
||||||||
| Land, buildings and improvements, intangible lease assets, and other |
$ | 4,310,407 | $ | 4,317,866 | ||||
| Net investment in direct financing leases |
650,388 | 648,102 | ||||||
| Mortgage loans |
1,060,397 | 1,060,400 | ||||||
|
|
|
|
|
|||||
| Gross investment in real estate assets |
6,021,192 | 6,026,368 | ||||||
| Accumulated depreciation and amortization |
(351,462 | ) | (325,125 | ) | ||||
|
|
|
|
|
|||||
| Net investment in real estate assets |
5,669,730 | 5,701,243 | ||||||
| Cash and cash equivalents |
446,948 | 83,240 | ||||||
| Interest and rent receivables |
61,912 | 57,698 | ||||||
| Straight-line rent receivables |
129,879 | 116,861 | ||||||
| Other assets |
472,261 | 459,494 | ||||||
|
|
|
|
|
|||||
| Total Assets |
$ | 6,780,730 | $ | 6,418,536 | ||||
|
|
|
|
|
|||||
| LIABILITIES AND EQUITY |
||||||||
| Liabilities |
||||||||
| Debt, net |
$ | 3,277,986 | $ | 2,909,341 | ||||
| Accounts payable and accrued expenses |
194,311 | 207,711 | ||||||
| Deferred revenue |
19,411 | 19,933 | ||||||
| Lease deposits and other obligations to tenants |
32,451 | 28,323 | ||||||
|
|
|
|
|
|||||
| Total Liabilities |
3,524,159 | 3,165,308 | ||||||
| Equity |
||||||||
| Preferred stock, $0.001 par value. Authorized 10,000 shares; no shares outstanding |
— | — | ||||||
| Common stock, $0.001 par value. Authorized 500,000 shares; issued and outstanding - 320,801 shares at March 31, 2017 and 320,514 shares at December 31, 2016 |
321 | 321 | ||||||
| Additional paid in capital |
3,777,163 | 3,775,336 | ||||||
| Distributions in excess of net income |
(443,315 | ) | (434,114 | ) | ||||
| Accumulated other comprehensive loss |
(86,611 | ) | (92,903 | ) | ||||
| Treasury shares, at cost |
(777 | ) | (262 | ) | ||||
|
|
|
|
|
|||||
| Total Medical Properties Trust, Inc. Stockholders’ Equity |
3,246,781 | 3,248,378 | ||||||
| Non-controlling interests |
9,790 | 4,850 | ||||||
|
|
|
|
|
|||||
| Total Equity |
3,256,571 | 3,253,228 | ||||||
|
|
|
|
|
|||||
| Total Liabilities and Equity |
$ | 6,780,730 | $ | 6,418,536 | ||||
|
|
|
|
|
|||||
| (A) | Financials have been derived from the prior year audited financial statements. |
Q1 2017 | SUPPLEMENTAL INFORMATION 16
MEDICALPROPERTIESTRUST.COM
FINANCIAL STATEMENTS
OTHER INCOME GENERATING ASSETS AS OF MARCH 31, 2017
($ amounts in thousands)
| Operator |
Investment | Annual Interest Rate |
YTD RIDEA Income (A) |
Security / Credit Enhancements | ||||||||||
| Non-Operating Loans |
||||||||||||||
| Vibra Healthcare acquisition loan(B) |
$ | 5,962 | 10.25 | % | Secured and cross-defaulted with real estate, other agreements and guaranteed by Parent | |||||||||
| Alecto working capital |
12,500 | 11.44 | % | Secured and cross-defaulted with real estate and guaranteed by Parent | ||||||||||
| IKJG/HUMC working capital |
5,784 | 10.40 | % | Secured and cross-defaulted with real estate and guaranteed by Parent | ||||||||||
| Ernest Health |
22,823 | 9.33 | % | Secured and cross-defaulted with real estate and guaranteed by Parent | ||||||||||
| Other |
13,763 | |||||||||||||
|
|
|
|||||||||||||
| 60,832 | ||||||||||||||
| Operating Loans |
||||||||||||||
| Ernest Health (C) |
93,200 | 15.00 | % | $ | 3,866 | Secured and cross-defaulted with real estate and guaranteed by Parent | ||||||||
|
|
|
|
|
|||||||||||
| 93,200 | 3,866 | |||||||||||||
| Equity investments(D) |
||||||||||||||
| Domestic |
62,974 | 887 | ||||||||||||
| International(E) |
118,692 | 1,351 | (F) | |||||||||||
| (A) | Income earned on operating loans is reflected in the interest income line of the income statement. |
| (B) | Original amortizing acquisition loan was $41 million; loan matures in 2019. |
| (C) | Cash rate is 10% effective March 1, 2014. Due to compounding, effective interest rate is 16.6%. |
| (D) | All earnings in income from equity investments are reported on a one quarter lag basis. |
| (E) | Includes equity investments in Spain, Italy, and Germany. |
| (F) | Excludes our share of real estate depreciation and acquisition expenses of certain unconsolidated joint ventures. |
Q1 2017 | SUPPLEMENTAL INFORMATION 17

MPT
Medical Properties Trust
1000 Urban Center Drive, Suite 501
Birmingham, AL 35242
(205) 969-3755 NYSE: MPW
www.medicalpropertiestrust.com
Contact:
Tim Berryman, Director - Investor Relations
(205) 397-8589 or tberryman@medicalpropertiestrust.com
or
Charles Lambert, Managing Director - Capital Markets
(205) 397-8897 or
clambert@medicalpropertiestrust.com
AT THE VERY HEART OF HEALTHCARE.R