Attached files
| file | filename |
|---|---|
| 8-K - 8-K - BANC OF CALIFORNIA, INC. | d387296d8k.htm |
| EX-99.1 - EX-99.1 - BANC OF CALIFORNIA, INC. | d387296dex991.htm |
May 3, 2017 2017 First Quarter Earnings Investor Presentation Exhibit 99.2
When used in this presentation and in documents filed with or furnished to the Securities and Exchange Commission (the “SEC”), in press releases or other public shareholder communications, or in oral statements made with the approval of an authorized executive officer, the words or phrases “believe,” “will,” “should,” “will likely result,” “are expected to,” “will continue,” “is anticipated,” “estimate,” “project,” “plans,” or similar expressions are intended to identify “forward-looking statements” within the meaning of the Private Securities Litigation Reform Act of 1995. You are cautioned not to place undue reliance on any forward-looking statements, which speak only as of the date made. These statements may relate to future financial performance, strategic plans or objectives, revenue, expense or earnings projections, or other financial items of Banc of California Inc. and its affiliates (“BANC,” the “Company,” “we,” “us” or “our”). By their nature, these statements are subject to numerous uncertainties that could cause actual results to differ materially from those anticipated in the statements. Factors that could cause actual results to differ materially from the results anticipated or projected include, but are not limited to, the following: (i) pending governmental investigations may result in adverse findings, reputational damage, the imposition of sanctions and other negative consequences; (ii) management time and resources may be diverted to address pending governmental investigations as well as any related litigation; (iii) the recent resignation of our former chief executive officer might cause a loss of confidence among certain customers who may withdraw their deposits or terminate their business relationships with us, notwithstanding the hiring of our new chief executive officer; (iv) our performance may be adversely affected by the management transition resulting from the recent resignation of our former chief executive officer, notwithstanding the hiring of our new chief executive officer; (v) risks that the Company’s acquisitions and dispositions, including the acquisitions of branches from Banco Popular, The Private Bank of California, and CS Financial, Inc., the disposition of the Banc Home Loans Division, and the acquisition and disposition of The Palisades Group, may disrupt current plans and operations, the potential difficulties in customer and employee retention as a result of those transactions and the amount of the costs, fees, expenses and charges related to those transactions; (vi) the credit risks of lending activities, which may be affected by further deterioration in real estate markets and the financial condition of borrowers, may lead to increased loan and lease delinquencies, losses and nonperforming assets in our loan portfolio, and may result in our allowance for loan and lease losses not being adequate to cover actual losses and require us to materially increase our loan and lease loss reserves; (vii) the quality and composition of our securities and loan portfolios; (viii) changes in general economic conditions, either nationally or in our market areas; (ix) continuation of the historically low short-term interest rate environment, changes in the levels of general interest rates, and the relative differences between short- and long-term interest rates, deposit interest rates, our net interest margin and funding sources; (x) fluctuations in the demand for loans and leases, the number of unsold homes and other properties and fluctuations in commercial and residential real estate values in our market area; (xi) results of examinations of us by regulatory authorities and the possibility that any such regulatory authority may, among other things, require us to increase our allowance for loan and lease losses, write-down asset values, increase our capital levels, or affect our ability to borrow funds or maintain or increase deposits, which could adversely affect our liquidity and earnings; (xii) legislative or regulatory changes that adversely affect our business, including changes in regulatory capital or other rules; (xiii) our ability to control operating costs and expenses; (xiv) staffing fluctuations in response to product demand or the implementation of corporate strategies that affect our work force and potential associated charges; (xv) errors in our estimates in determining fair value of certain of our assets, which may result in significant declines in valuation; (xvi) the network and computer systems on which we depend could fail or experience a security breach; (xvii) our ability to attract and retain key members of our senior management team; (xviii) costs and effects of litigation, including settlements and judgments; (xix) increased competitive pressures among financial services companies; (xx) changes in consumer spending, borrowing and saving habits; (xxi) adverse changes in the securities markets; (xxii) earthquake, fire or other natural disasters affecting the condition of real estate collateral; (xxiii) the availability of resources to address changes in laws, rules or regulations or to respond to regulatory actions; (xxiv) inability of key third-party providers to perform their obligations to us; (xxv) changes in accounting policies and practices, as may be adopted by the financial institution regulatory agencies or the Financial Accounting Standards Board or their application to our business or final audit adjustments, including additional guidance and interpretation on accounting issues and details of the implementation of new accounting methods; (xxvi) war or terrorist activities; and (xxvii) other economic, competitive, governmental, regulatory, and technological factors affecting our operations, pricing, products and services and the other risks described from time to time in other documents that we file with or furnish to the SEC. You should not place undue reliance on forward-looking statements, and we undertake no obligation to update any such statements to reflect circumstances or events that occur after the date on which the forward-looking statement is made. Forward-looking Statements
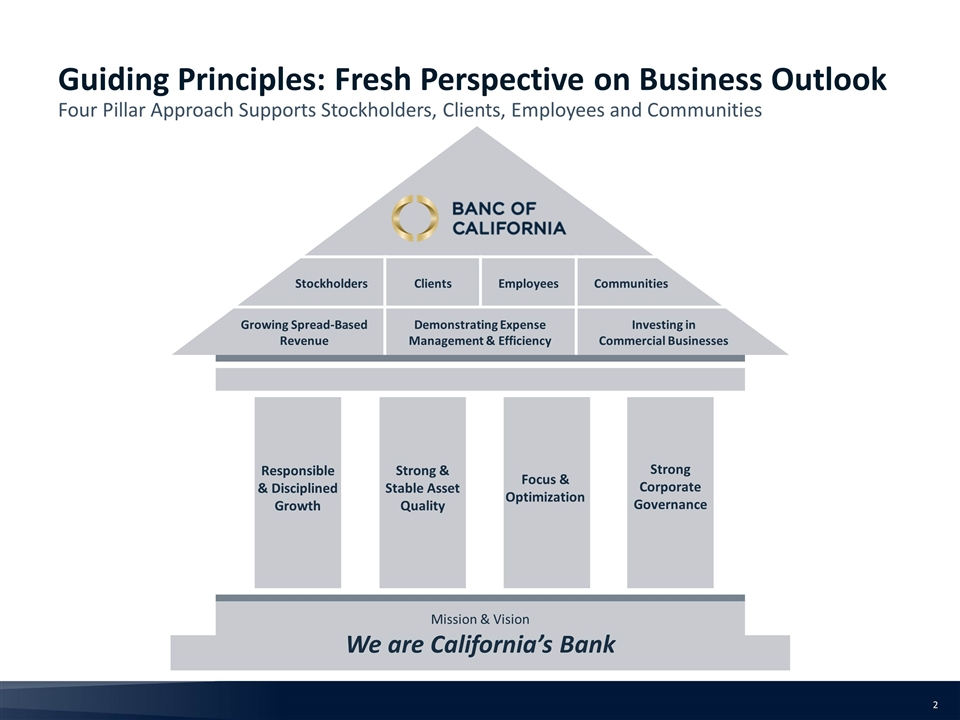
Guiding Principles: Fresh Perspective on Business Outlook Four Pillar Approach Supports Stockholders, Clients, Employees and Communities Mission & Vision We are California’s Bank Responsible & Disciplined Growth Strong & Stable Asset Quality Focus & Optimization Growing Spread-Based Revenue Demonstrating Expense Management & Efficiency Investing in Commercial Businesses Stockholders Clients Employees Communities Strong Corporate Governance
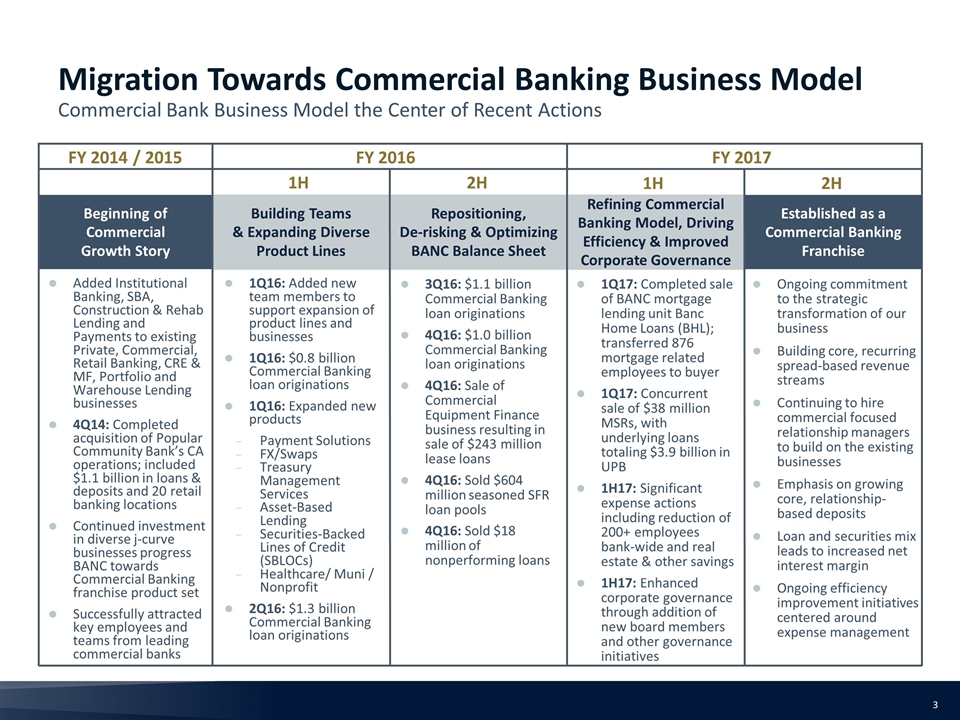
Refining Commercial Banking Model, Driving Efficiency & Improved Corporate Governance Migration Towards Commercial Banking Business Model Commercial Bank Business Model the Center of Recent Actions Added Institutional Banking, SBA, Construction & Rehab Lending and Payments to existing Private, Commercial, Retail Banking, CRE & MF, Portfolio and Warehouse Lending businesses 4Q14: Completed acquisition of Popular Community Bank’s CA operations; included $1.1 billion in loans & deposits and 20 retail banking locations Continued investment in diverse j-curve businesses progress BANC towards Commercial Banking franchise product set Successfully attracted key employees and teams from leading commercial banks 1Q16: Added new team members to support expansion of product lines and businesses 1Q16: $0.8 billion Commercial Banking loan originations 1Q16: Expanded new products Payment Solutions FX/Swaps Treasury Management Services Asset-Based Lending Securities-Backed Lines of Credit (SBLOCs) Healthcare/ Muni / Nonprofit 2Q16: $1.3 billion Commercial Banking loan originations 3Q16: $1.1 billion Commercial Banking loan originations 4Q16: $1.0 billion Commercial Banking loan originations 4Q16: Sale of Commercial Equipment Finance business resulting in sale of $243 million lease loans 4Q16: Sold $604 million seasoned SFR loan pools 4Q16: Sold $18 million of nonperforming loans 1Q17: Completed sale of BANC mortgage lending unit Banc Home Loans (BHL); transferred 876 mortgage related employees to buyer 1Q17: Concurrent sale of $38 million MSRs, with underlying loans totaling $3.9 billion in UPB 1H17: Significant expense actions including reduction of 200+ employees bank-wide and real estate & other savings 1H17: Enhanced corporate governance through addition of new board members and other governance initiatives 2H Beginning of Commercial Growth Story Building Teams & Expanding Diverse Product Lines Repositioning, De-risking & Optimizing BANC Balance Sheet Established as a Commercial Banking Franchise 1H FY 2016 FY 2014 / 2015 2H 1H FY 2017 Ongoing commitment to the strategic transformation of our business Building core, recurring spread-based revenue streams Continuing to hire commercial focused relationship managers to build on the existing businesses Emphasis on growing core, relationship-based deposits Loan and securities mix leads to increased net interest margin Ongoing efficiency improvement initiatives centered around expense management
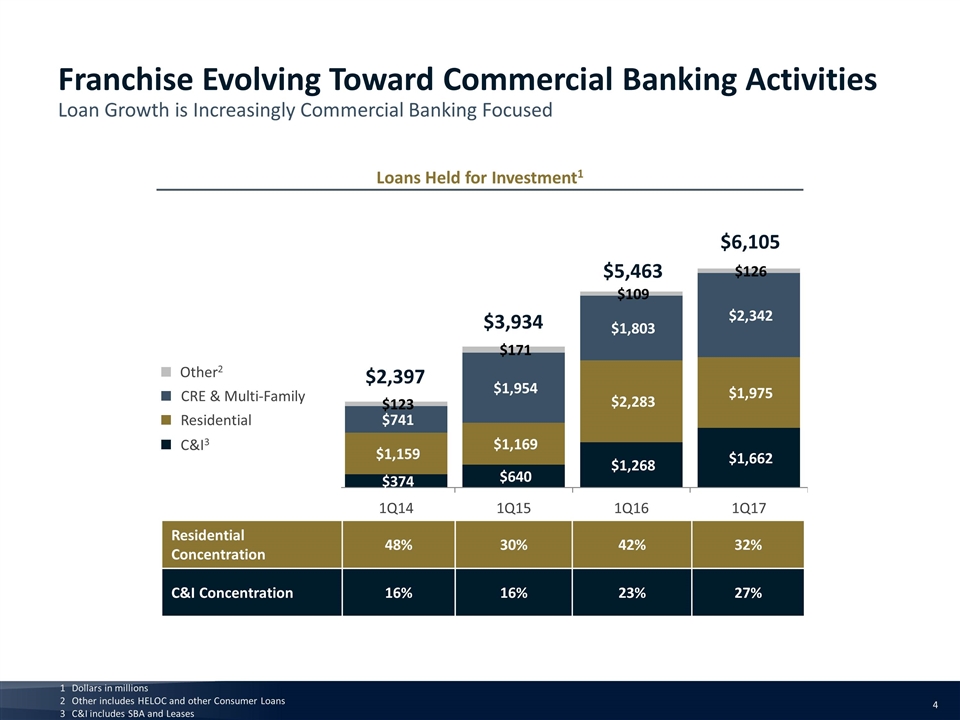
Dollars in millions Other includes HELOC and other Consumer Loans C&I includes SBA and Leases Loans Held for Investment1 $2,397 C&I3 Other2 Residential CRE & Multi-Family $3,934 $5,463 $6,105 Residential Concentration 48% 30% 42% 32% C&I Concentration 16% 16% 23% 27% Franchise Evolving Toward Commercial Banking Activities Loan Growth is Increasingly Commercial Banking Focused
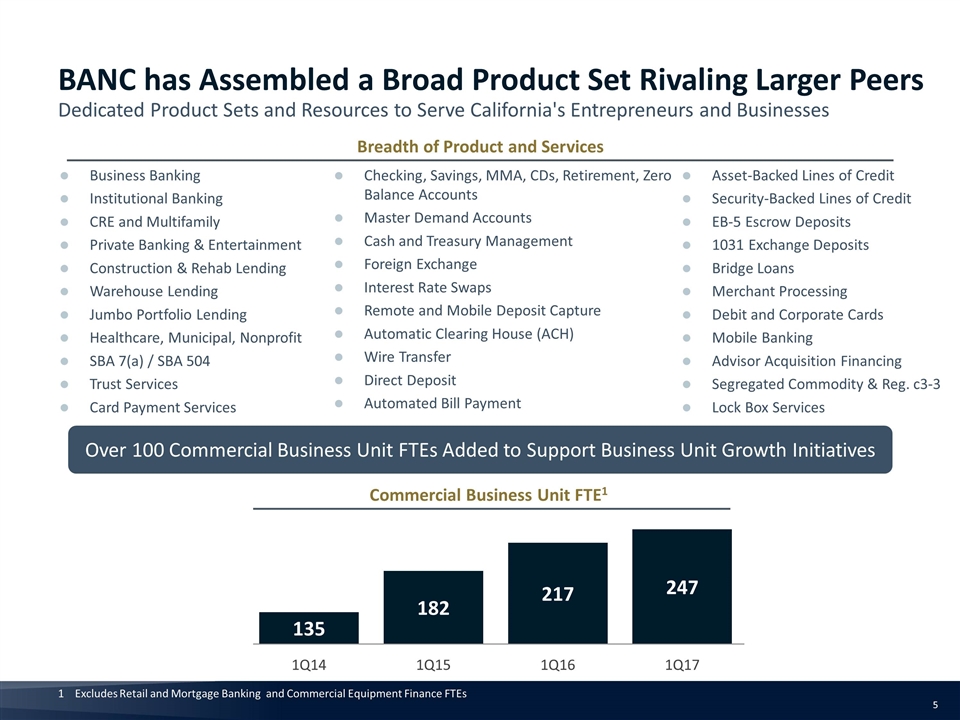
Breadth of Product and Services Asset-Backed Lines of Credit Security-Backed Lines of Credit EB-5 Escrow Deposits 1031 Exchange Deposits Bridge Loans Merchant Processing Debit and Corporate Cards Mobile Banking Advisor Acquisition Financing Segregated Commodity & Reg. c3-3 Lock Box Services Checking, Savings, MMA, CDs, Retirement, Zero Balance Accounts Master Demand Accounts Cash and Treasury Management Foreign Exchange Interest Rate Swaps Remote and Mobile Deposit Capture Automatic Clearing House (ACH) Wire Transfer Direct Deposit Automated Bill Payment Over 100 Commercial Business Unit FTEs Added to Support Business Unit Growth Initiatives Commercial Business Unit FTE1 1 Excludes Retail and Mortgage Banking and Commercial Equipment Finance FTEs Business Banking Institutional Banking CRE and Multifamily Private Banking & Entertainment Construction & Rehab Lending Warehouse Lending Jumbo Portfolio Lending Healthcare, Municipal, Nonprofit SBA 7(a) / SBA 504 Trust Services Card Payment Services BANC has Assembled a Broad Product Set Rivaling Larger Peers Dedicated Product Sets and Resources to Serve California's Entrepreneurs and Businesses
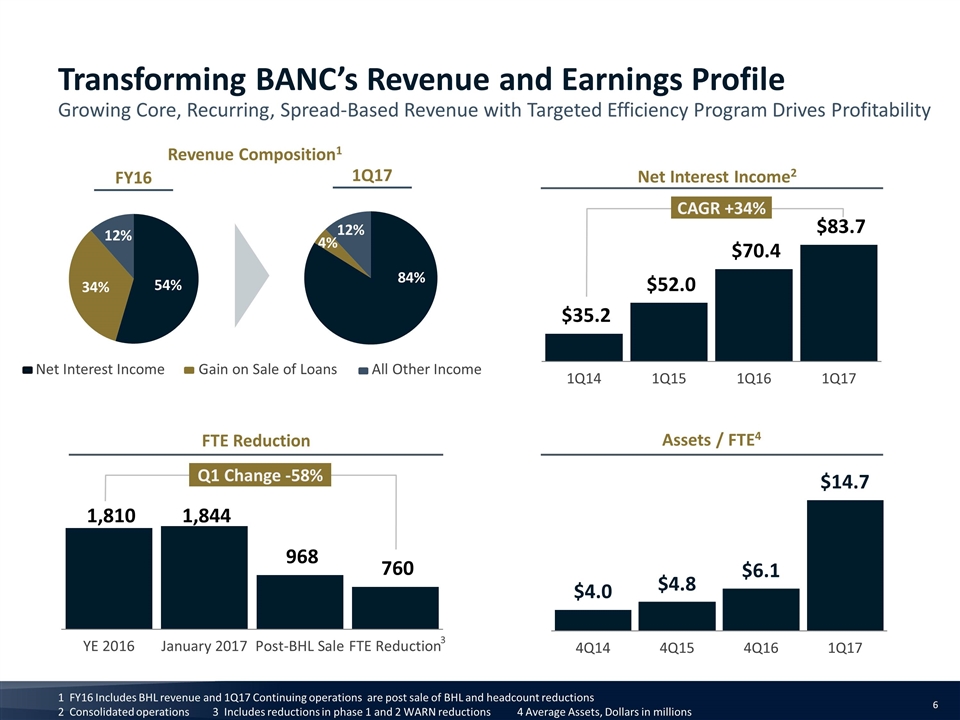
Transforming BANC’s Revenue and Earnings Profile Growing Core, Recurring, Spread-Based Revenue with Targeted Efficiency Program Drives Profitability FY16 1Q17 Net Interest Income Gain on Sale of Loans All Other Income Net Interest Income2 CAGR +34% Q1 Change -58% Assets / FTE4 1 FY16 Includes BHL revenue and 1Q17 Continuing operations are post sale of BHL and headcount reductions 2 Consolidated operations 3 Includes reductions in phase 1 and 2 WARN reductions 4 Average Assets, Dollars in millions FTE Reduction Revenue Composition1 3
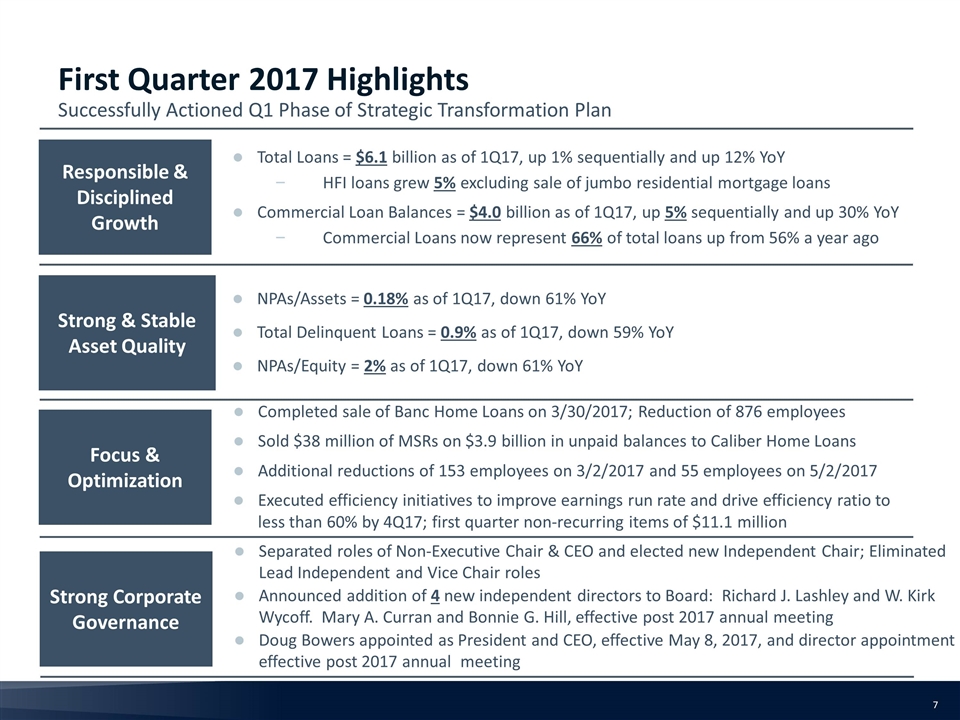
57% 57% Responsible & Disciplined Growth Strong & Stable Asset Quality Focus & Optimization Total Loans = $6.1 billion as of 1Q17, up 1% sequentially and up 12% YoY HFI loans grew 5% excluding sale of jumbo residential mortgage loans Commercial Loan Balances = $4.0 billion as of 1Q17, up 5% sequentially and up 30% YoY Commercial Loans now represent 66% of total loans up from 56% a year ago NPAs/Assets = 0.18% as of 1Q17, down 61% YoY Total Delinquent Loans = 0.9% as of 1Q17, down 59% YoY NPAs/Equity = 2% as of 1Q17, down 61% YoY Completed sale of Banc Home Loans on 3/30/2017; Reduction of 876 employees Sold $38 million of MSRs on $3.9 billion in unpaid balances to Caliber Home Loans Additional reductions of 153 employees on 3/2/2017 and 55 employees on 5/2/2017 Executed efficiency initiatives to improve earnings run rate and drive efficiency ratio to less than 60% by 4Q17; first quarter non-recurring items of $11.1 million Strong Corporate Governance Separated roles of Non-Executive Chair & CEO and elected new Independent Chair; Eliminated Lead Independent and Vice Chair roles Announced addition of 4 new independent directors to Board: Richard J. Lashley and W. Kirk Wycoff. Mary A. Curran and Bonnie G. Hill, effective post 2017 annual meeting Doug Bowers appointed as President and CEO, effective May 8, 2017, and director appointment effective post 2017 annual meeting First Quarter 2017 Highlights Successfully Actioned Q1 Phase of Strategic Transformation Plan
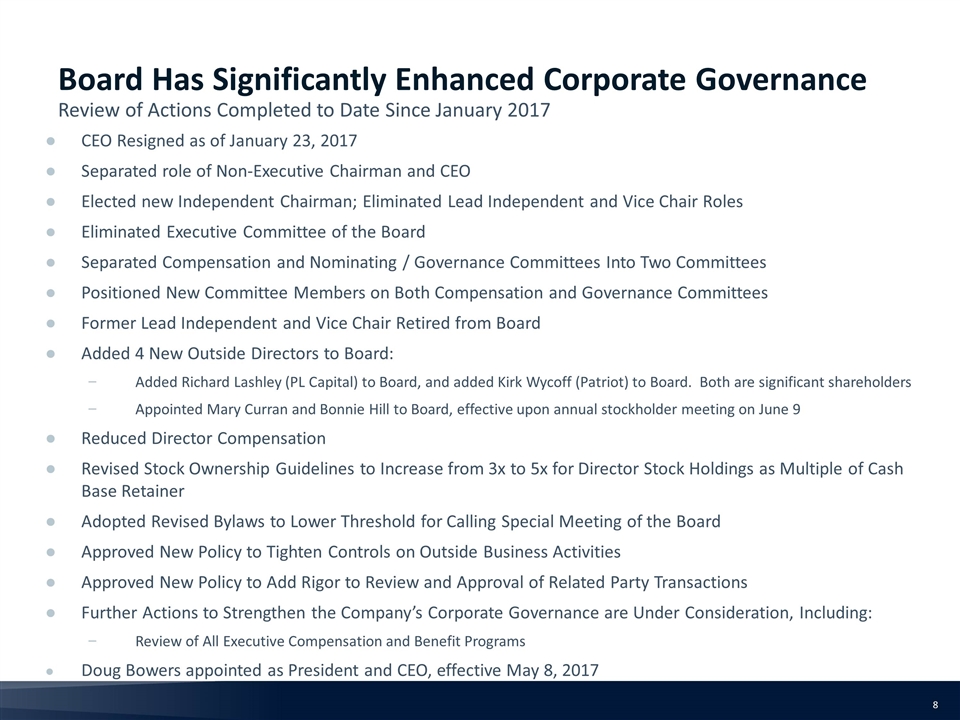
CEO Resigned as of January 23, 2017 Separated role of Non-Executive Chairman and CEO Elected new Independent Chairman; Eliminated Lead Independent and Vice Chair Roles Eliminated Executive Committee of the Board Separated Compensation and Nominating / Governance Committees Into Two Committees Positioned New Committee Members on Both Compensation and Governance Committees Former Lead Independent and Vice Chair Retired from Board Added 4 New Outside Directors to Board: Added Richard Lashley (PL Capital) to Board, and added Kirk Wycoff (Patriot) to Board. Both are significant shareholders Appointed Mary Curran and Bonnie Hill to Board, effective upon annual stockholder meeting on June 9 Reduced Director Compensation Revised Stock Ownership Guidelines to Increase from 3x to 5x for Director Stock Holdings as Multiple of Cash Base Retainer Adopted Revised Bylaws to Lower Threshold for Calling Special Meeting of the Board Approved New Policy to Tighten Controls on Outside Business Activities Approved New Policy to Add Rigor to Review and Approval of Related Party Transactions Further Actions to Strengthen the Company’s Corporate Governance are Under Consideration, Including: Review of All Executive Compensation and Benefit Programs Doug Bowers appointed as President and CEO, effective May 8, 2017 Board Has Significantly Enhanced Corporate Governance Review of Actions Completed to Date Since January 2017
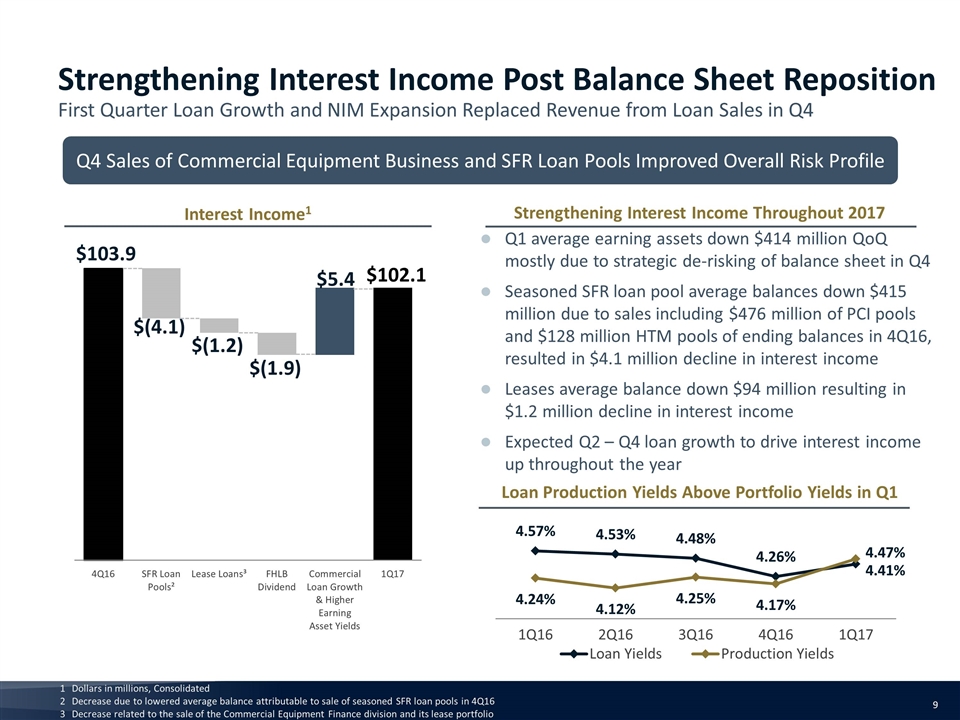
Strengthening Interest Income Post Balance Sheet Reposition First Quarter Loan Growth and NIM Expansion Replaced Revenue from Loan Sales in Q4 Dollars in millions, Consolidated Decrease due to lowered average balance attributable to sale of seasoned SFR loan pools in 4Q16 Decrease related to the sale of the Commercial Equipment Finance division and its lease portfolio Q4 Sales of Commercial Equipment Business and SFR Loan Pools Improved Overall Risk Profile Interest Income1 Q1 average earning assets down $414 million QoQ mostly due to strategic de-risking of balance sheet in Q4 Seasoned SFR loan pool average balances down $415 million due to sales including $476 million of PCI pools and $128 million HTM pools of ending balances in 4Q16, resulted in $4.1 million decline in interest income Leases average balance down $94 million resulting in $1.2 million decline in interest income Expected Q2 – Q4 loan growth to drive interest income up throughout the year Strengthening Interest Income Throughout 2017 Loan Production Yields Above Portfolio Yields in Q1 $102.1
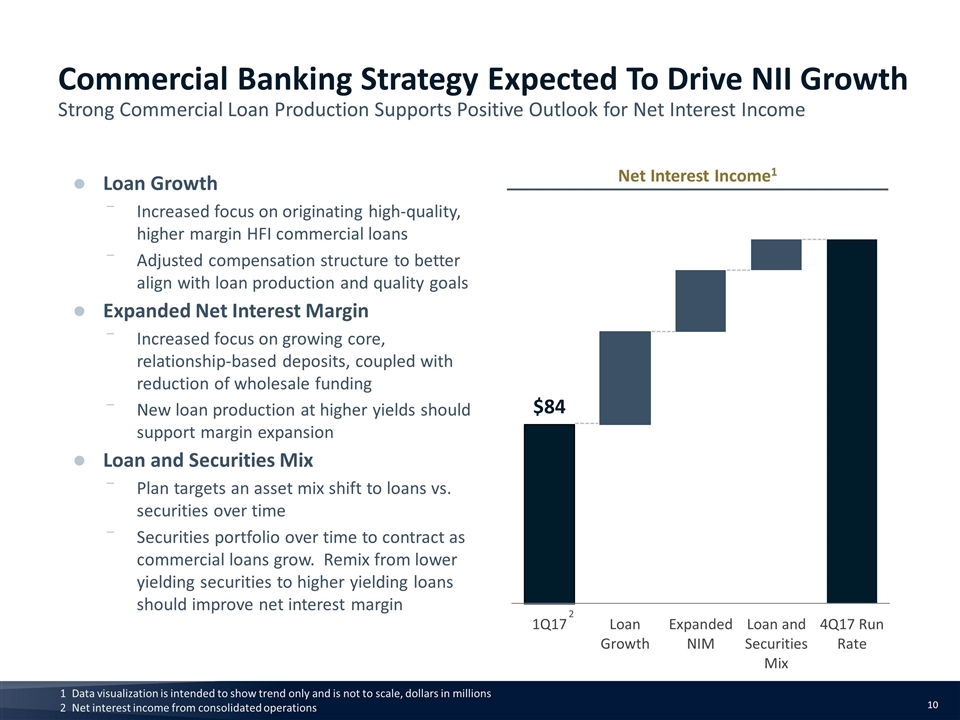
Commercial Banking Strategy Expected To Drive NII Growth Strong Commercial Loan Production Supports Positive Outlook for Net Interest Income Data visualization is intended to show trend only and is not to scale, dollars in millions Net interest income from consolidated operations Net Interest Income1 Loan Growth Increased focus on originating high-quality, higher margin HFI commercial loans Adjusted compensation structure to better align with loan production and quality goals Expanded Net Interest Margin Increased focus on growing core, relationship-based deposits, coupled with reduction of wholesale funding New loan production at higher yields should support margin expansion Loan and Securities Mix Plan targets an asset mix shift to loans vs. securities over time Securities portfolio over time to contract as commercial loans grow. Remix from lower yielding securities to higher yielding loans should improve net interest margin 2
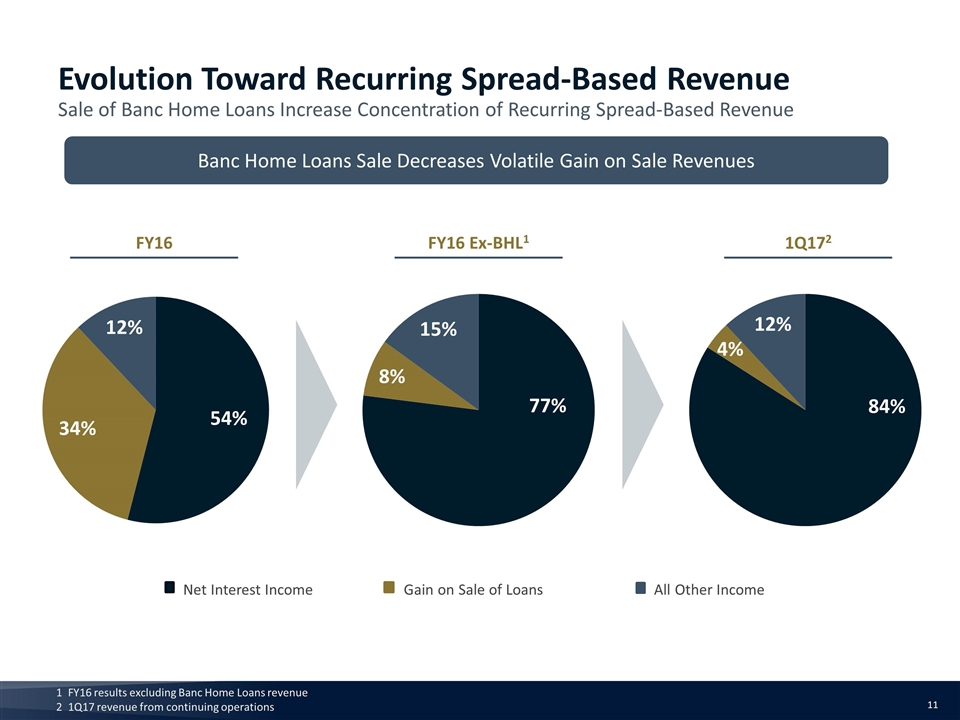
FY16 FY16 Ex-BHL1 1Q172 Net Interest Income Gain on Sale of Loans All Other Income Evolution Toward Recurring Spread-Based Revenue Sale of Banc Home Loans Increase Concentration of Recurring Spread-Based Revenue FY16 results excluding Banc Home Loans revenue 1Q17 revenue from continuing operations Banc Home Loans Sale Decreases Volatile Gain on Sale Revenues
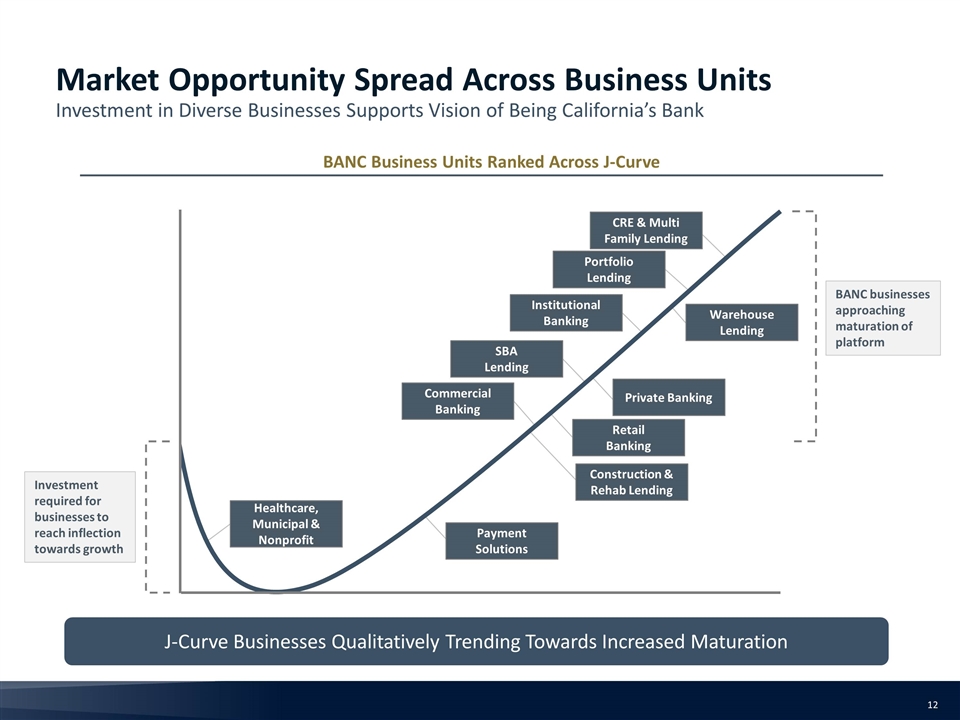
BANC businesses approaching maturation of platform BANC Business Units Ranked Across J-Curve J-Curve Businesses Qualitatively Trending Towards Increased Maturation CRE & Multi Family Lending Commercial Banking Private Banking Construction & Rehab Lending SBA Lending Warehouse Lending Retail Banking Institutional Banking Payment Solutions Healthcare, Municipal & Nonprofit Portfolio Lending Investment required for businesses to reach inflection towards growth Market Opportunity Spread Across Business Units Investment in Diverse Businesses Supports Vision of Being California’s Bank
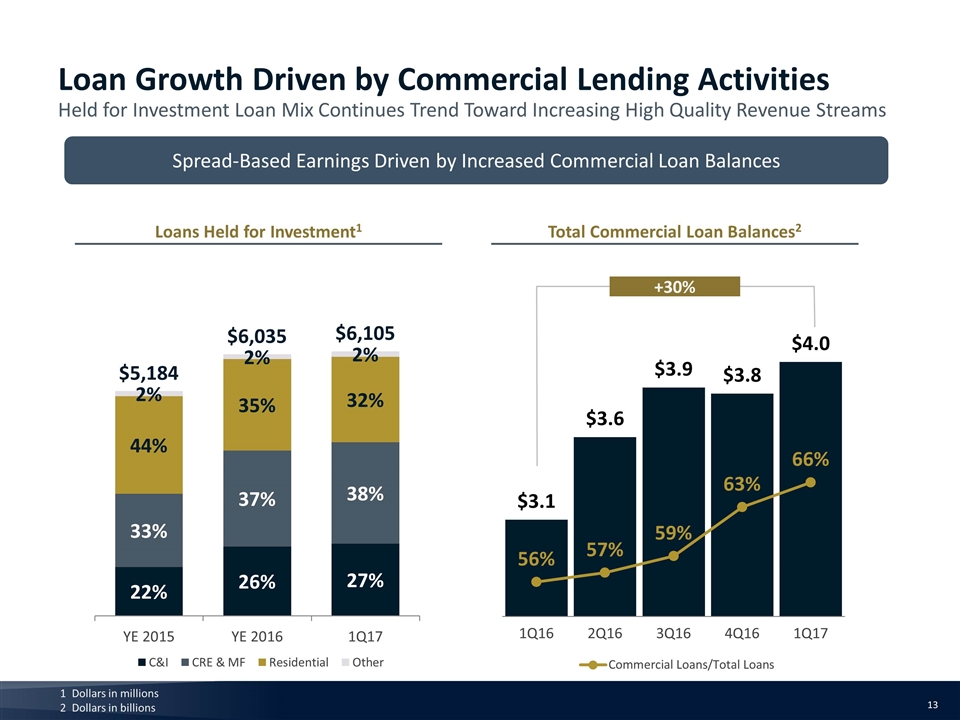
+30% Loan Growth Driven by Commercial Lending Activities Held for Investment Loan Mix Continues Trend Toward Increasing High Quality Revenue Streams Dollars in millions Dollars in billions Spread-Based Earnings Driven by Increased Commercial Loan Balances Loans Held for Investment1 Total Commercial Loan Balances2
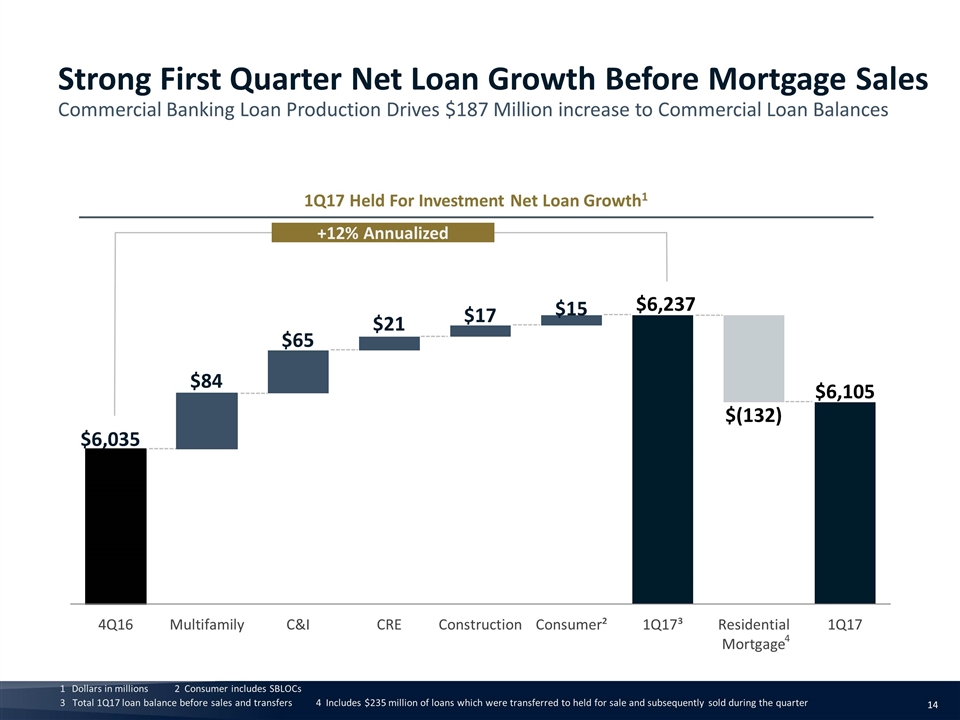
Strong First Quarter Net Loan Growth Before Mortgage Sales Commercial Banking Loan Production Drives $187 Million increase to Commercial Loan Balances Dollars in millions 2 Consumer includes SBLOCs 3 Total 1Q17 loan balance before sales and transfers 4 Includes $235 million of loans which were transferred to held for sale and subsequently sold during the quarter 1Q17 Held For Investment Net Loan Growth1 +12% Annualized 4
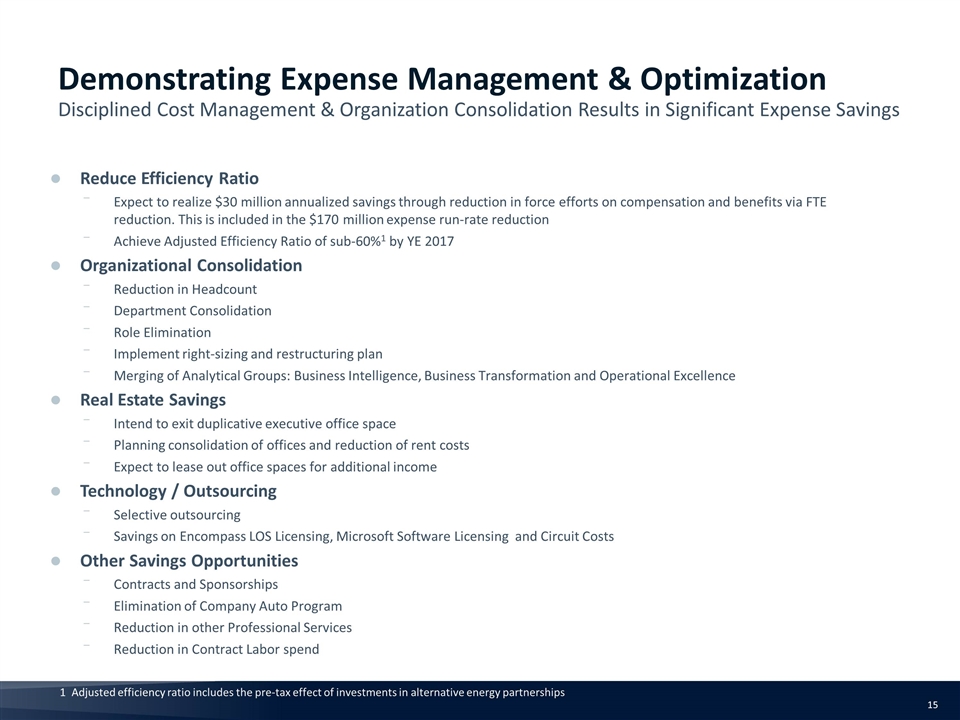
Reduce Efficiency Ratio Expect to realize $30 million annualized savings through reduction in force efforts on compensation and benefits via FTE reduction. This is included in the $170 million expense run-rate reduction Achieve Adjusted Efficiency Ratio of sub-60%1 by YE 2017 Organizational Consolidation Reduction in Headcount Department Consolidation Role Elimination Implement right-sizing and restructuring plan Merging of Analytical Groups: Business Intelligence, Business Transformation and Operational Excellence Real Estate Savings Intend to exit duplicative executive office space Planning consolidation of offices and reduction of rent costs Expect to lease out office spaces for additional income Technology / Outsourcing Selective outsourcing Savings on Encompass LOS Licensing, Microsoft Software Licensing and Circuit Costs Other Savings Opportunities Contracts and Sponsorships Elimination of Company Auto Program Reduction in other Professional Services Reduction in Contract Labor spend Demonstrating Expense Management & Optimization Disciplined Cost Management & Organization Consolidation Results in Significant Expense Savings Adjusted efficiency ratio includes the pre-tax effect of investments in alternative energy partnerships
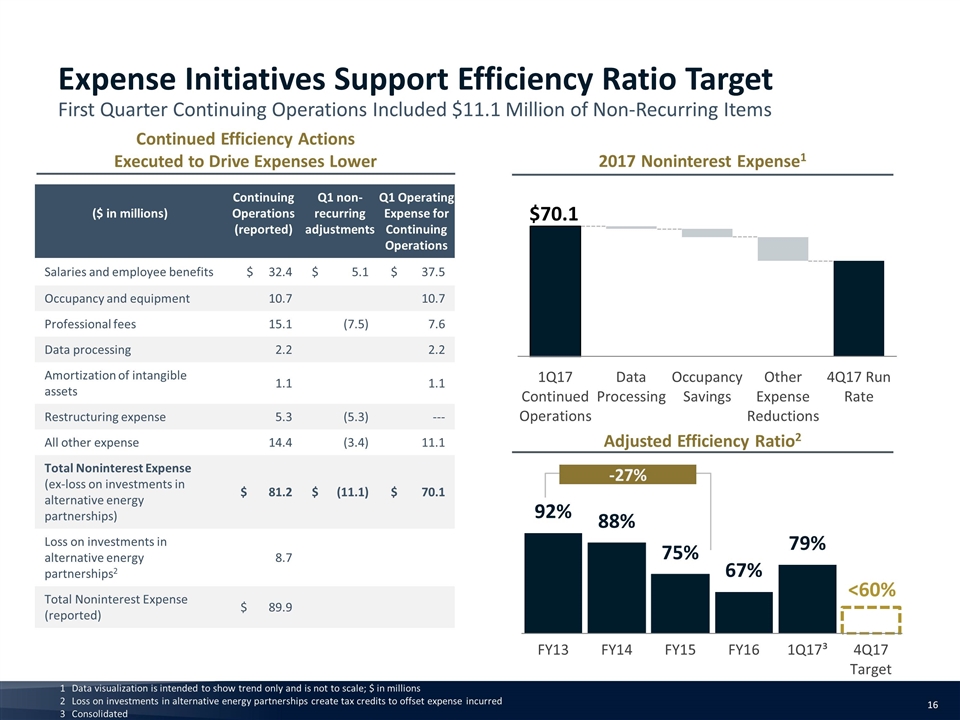
Expense Initiatives Support Efficiency Ratio Target First Quarter Continuing Operations Included $11.1 Million of Non-Recurring Items 2017 Noninterest Expense1 ($ in millions) Continuing Operations (reported) Q1 non-recurring adjustments Q1 Operating Expense for Continuing Operations Salaries and employee benefits $ 32.4 $ 5.1 $ 37.5 Occupancy and equipment 10.7 10.7 Professional fees 15.1 (7.5) 7.6 Data processing 2.2 2.2 Amortization of intangible assets 1.1 1.1 Restructuring expense 5.3 (5.3) --- All other expense 14.4 (3.4) 11.1 Total Noninterest Expense (ex-loss on investments in alternative energy partnerships) $ 81.2 $ (11.1) $ 70.1 Loss on investments in alternative energy partnerships2 8.7 Total Noninterest Expense (reported) $ 89.9 Data visualization is intended to show trend only and is not to scale; $ in millions Loss on investments in alternative energy partnerships create tax credits to offset expense incurred Consolidated Adjusted Efficiency Ratio2 -27% Continued Efficiency Actions Executed to Drive Expenses Lower
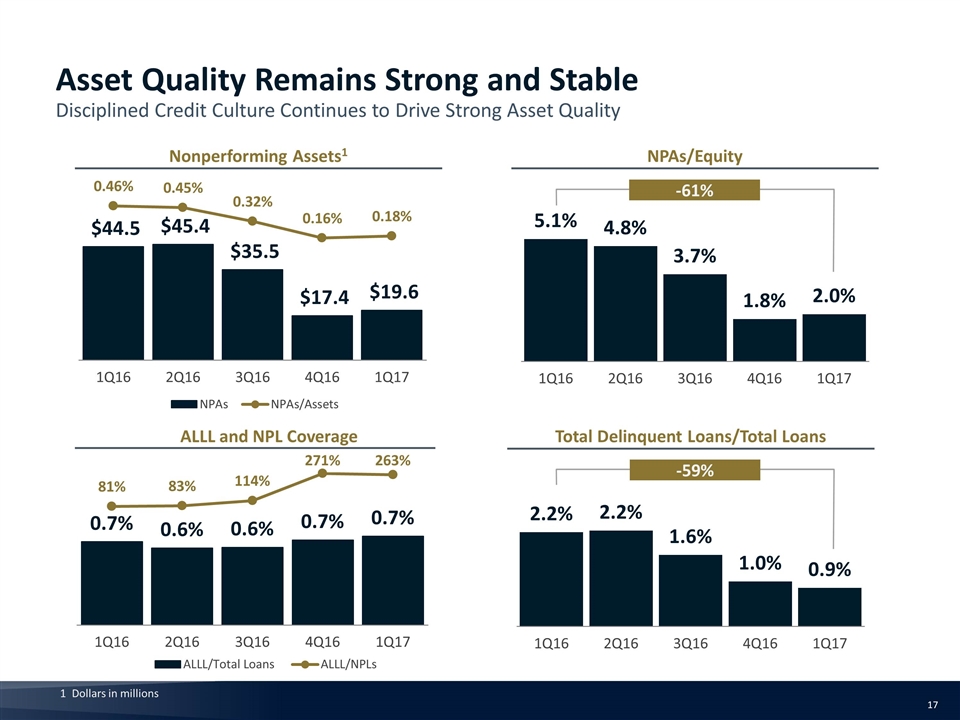
NPAs/Equity Nonperforming Assets1 ALLL and NPL Coverage Total Delinquent Loans/Total Loans -61% -59% Dollars in millions Asset Quality Remains Strong and Stable Disciplined Credit Culture Continues to Drive Strong Asset Quality
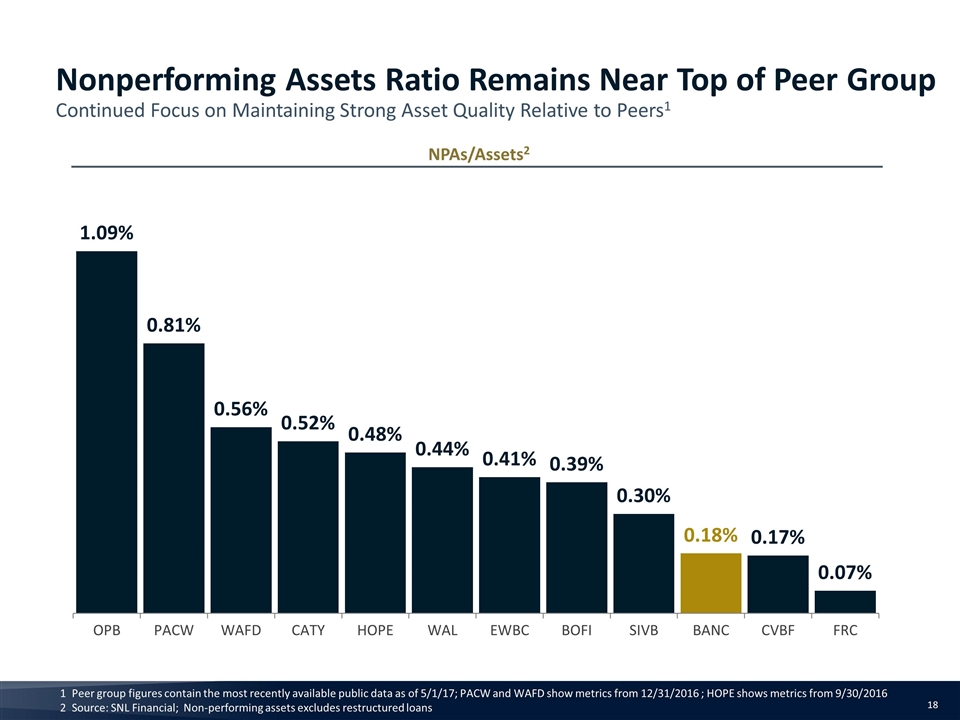
NPAs/Assets2 Peer group figures contain the most recently available public data as of 5/1/17; PACW and WAFD show metrics from 12/31/2016 ; HOPE shows metrics from 9/30/2016 Source: SNL Financial; Non-performing assets excludes restructured loans Nonperforming Assets Ratio Remains Near Top of Peer Group Continued Focus on Maintaining Strong Asset Quality Relative to Peers1
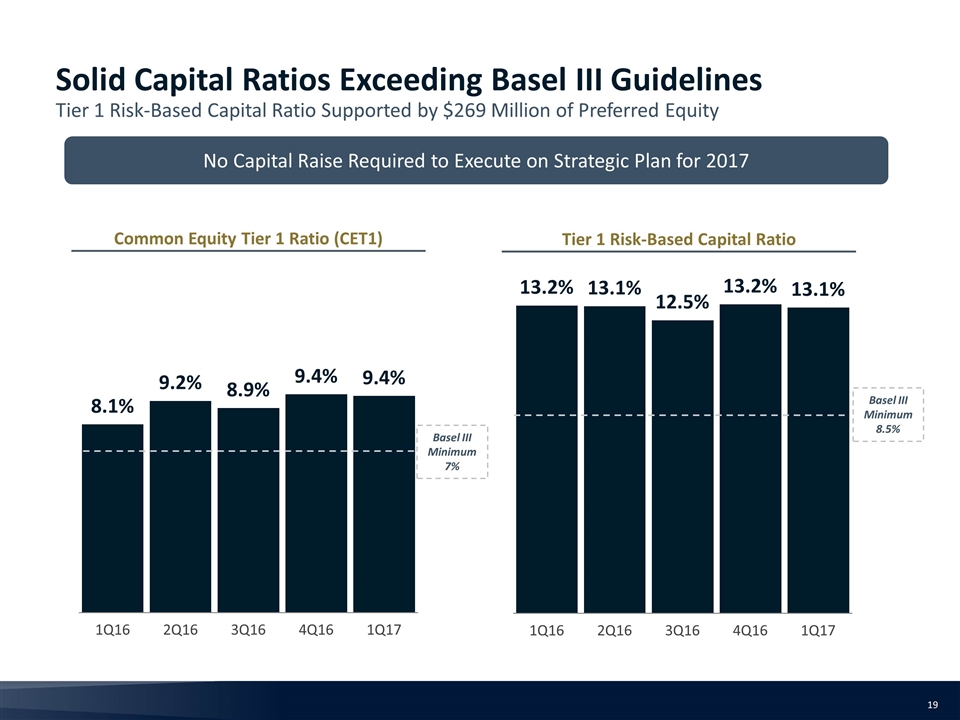
Solid Capital Ratios Exceeding Basel III Guidelines Tier 1 Risk-Based Capital Ratio Supported by $269 Million of Preferred Equity Common Equity Tier 1 Ratio (CET1) Tier 1 Risk-Based Capital Ratio No Capital Raise Required to Execute on Strategic Plan for 2017 Basel III Minimum 7% Basel III Minimum 8.5%
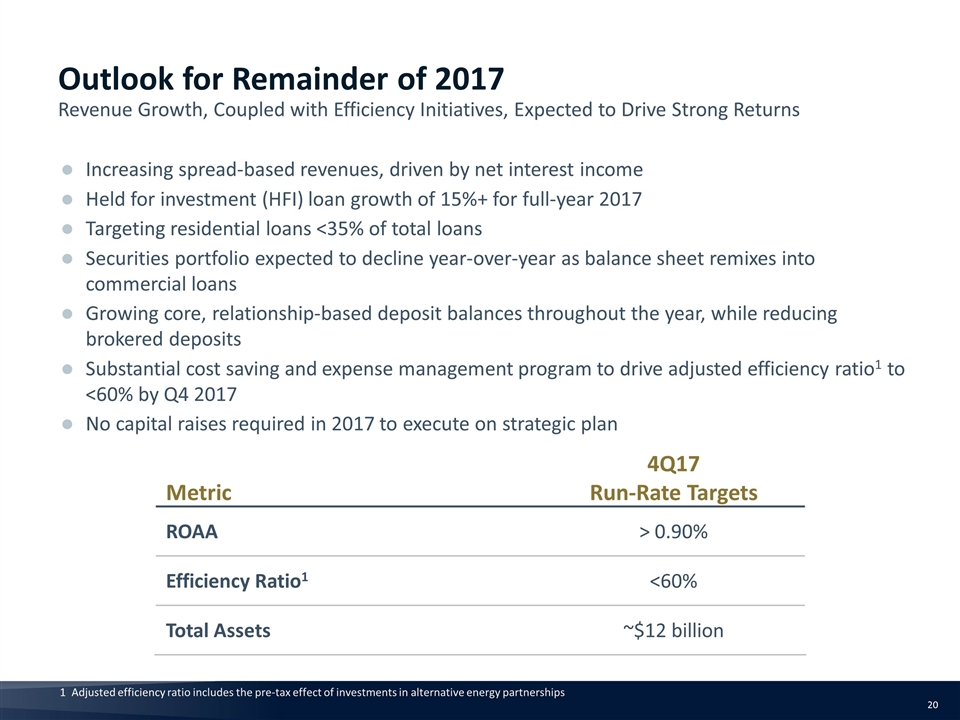
Adjusted efficiency ratio includes the pre-tax effect of investments in alternative energy partnerships Metric 4Q17 Run-Rate Targets ROAA > 0.90% Efficiency Ratio1 <60% Total Assets ~$12 billion Increasing spread-based revenues, driven by net interest income Held for investment (HFI) loan growth of 15%+ for full-year 2017 Targeting residential loans <35% of total loans Securities portfolio expected to decline year-over-year as balance sheet remixes into commercial loans Growing core, relationship-based deposit balances throughout the year, while reducing brokered deposits Substantial cost saving and expense management program to drive adjusted efficiency ratio1 to <60% by Q4 2017 No capital raises required in 2017 to execute on strategic plan Outlook for Remainder of 2017 Revenue Growth, Coupled with Efficiency Initiatives, Expected to Drive Strong Returns
