Attached files
| file | filename |
|---|---|
| 8-K - 8-K - JANUS CAPITAL GROUP INC | a17-12109_18k.htm |
Exhibit 99.1
Janus Henderson Group A client-focused, global active asset manager May 2017
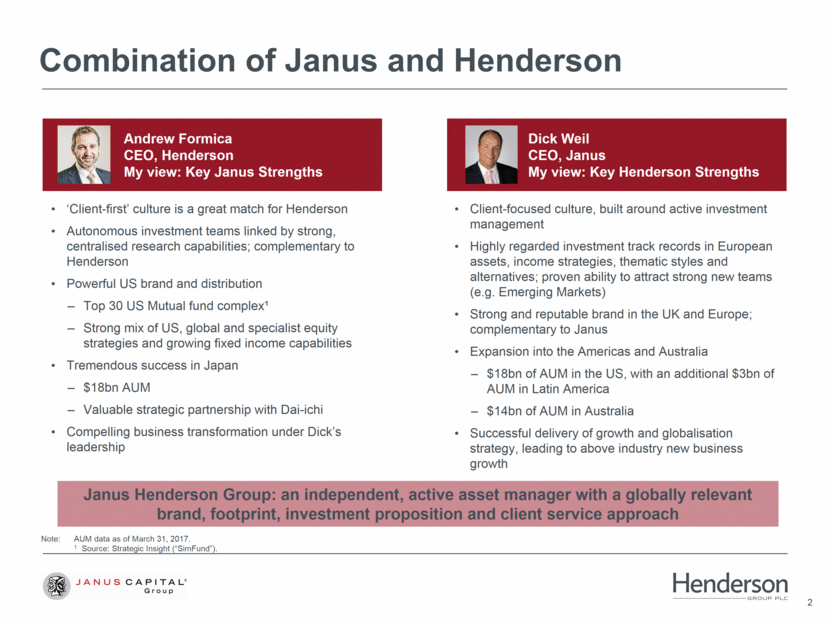
Combination of Janus and Henderson Andrew Formica CEO, Henderson My view: Key Janus Strengths ‘Client-first’ culture is a great match for Henderson Autonomous investment teams linked by strong, centralised research capabilities; complementary to Henderson Powerful US brand and distribution Top 30 US Mutual fund complex¹ Strong mix of US, global and specialist equity strategies and growing fixed income capabilities Tremendous success in Japan $18bn AUM Valuable strategic partnership with Dai-ichi Compelling business transformation under Dick’s leadership Dick Weil CEO, Janus My view: Key Henderson Strengths Client-focused culture, built around active investment management Highly regarded investment track records in European assets, income strategies, thematic styles and alternatives; proven ability to attract strong new teams (e.g. Emerging Markets) Strong and reputable brand in the UK and Europe; complementary to Janus Expansion into the Americas and Australia $18bn of AUM in the US, with an additional $3bn of AUM in Latin America $14bn of AUM in Australia Successful delivery of growth and globalisation strategy, leading to above industry new business growth Janus Henderson Group: an independent, active asset manager with a globally relevant brand, footprint, investment proposition and client service approach Note: AUM data as of March 31, 2017. 1 Source: Strategic Insight (“SimFund”).
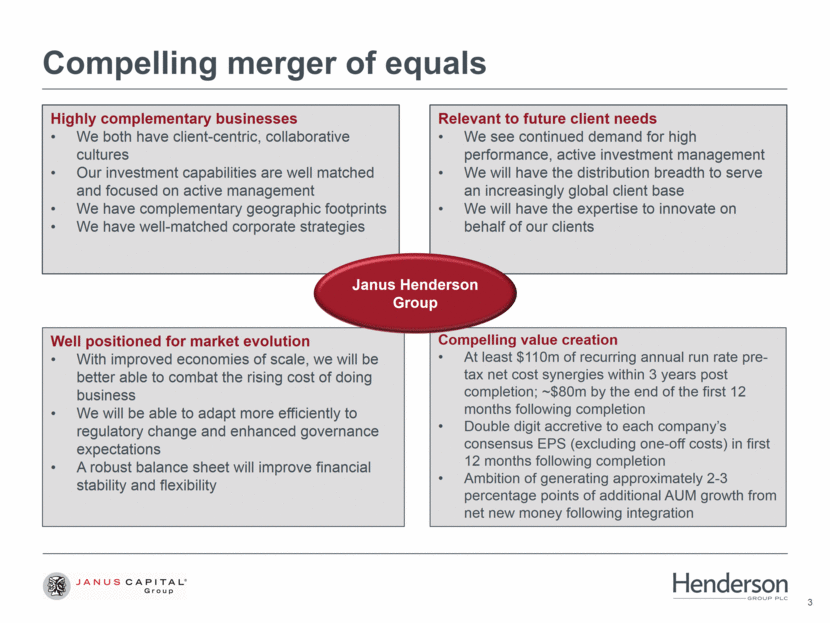
Compelling value creation At least $110m of recurring annual run rate pre-tax net cost synergies within 3 years post completion; ~$80m by the end of the first 12 months following completion Double digit accretive to each company’s consensus EPS (excluding one-off costs) in first 12 months following completion Ambition of generating approximately 2-3 percentage points of additional AUM growth from net new money following integration Highly complementary businesses We both have client-centric, collaborative cultures Our investment capabilities are well matched and focused on active management We have complementary geographic footprints We have well-matched corporate strategies Relevant to future client needs We see continued demand for high performance, active investment management We will have the distribution breadth to serve an increasingly global client base We will have the expertise to innovate on behalf of our clients Well positioned for market evolution With improved economies of scale, we will be better able to combat the rising cost of doing business We will be able to adapt more efficiently to regulatory change and enhanced governance expectations A robust balance sheet will improve financial stability and flexibility Compelling merger of equals Janus Henderson Group
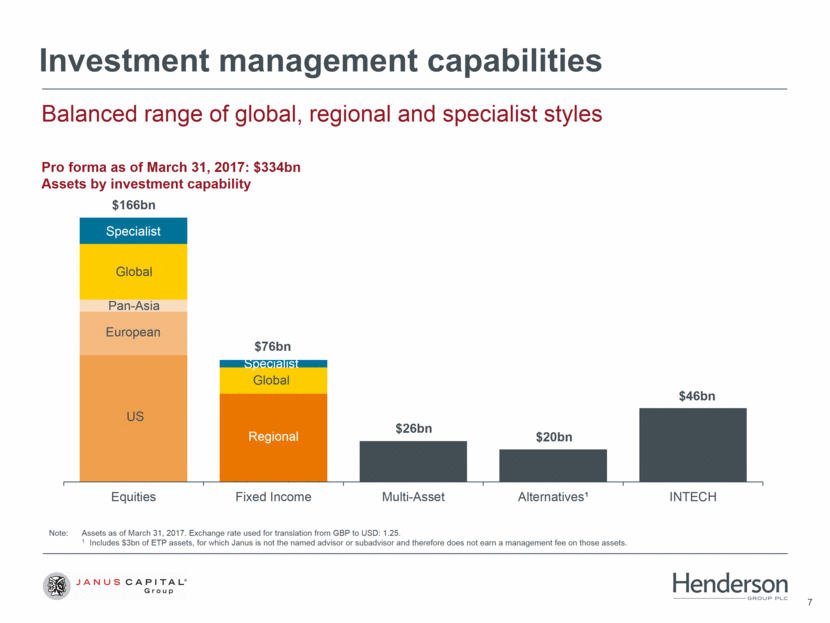
Americas2 Global diversification Global asset manager with strong positions in the US, UK, Europe, Japan and Australia Henderson Janus Note: Assets as of March 31, 2017. Exchange rate used for translation from GBP to USD: 1.25 1 Includes $3bn of ETP assets, for which Janus is not the named advisor or subadvisor and therefore does not earn a management fee on those assets. 2 Includes Latin America. EMEA $69bn $32bn Pan Asia $19bn $27bn $8bn Phil Wagstaff Global Head of Distribution My View: The Opportunity With truly global investment and distribution capabilities, we have significant opportunities to cross sell and broaden our client base $179bn By learning from each other to create best practice client management (client & prospect tiering; a clean product shop window; improved client experience through smart use of big data and technology), we can gain market share 3 Casey Quirk Distribution Benchmarking Study, 2015. Average 3-year net new flow (“NNF”) / Opening AUM (2012 – 2014 NNF, 2011 AUM). Firms with robust architecture Sales and redemptions by client management architecture³ We are building brand strength worldwide to retain clients and drive sales Brand status³ Avg 3yr NNF³ Perceived perf. vs Actual Star performers 16.3% Strong brand 4.3% Inv. specialists (0.4%) Under performers (7.8%) ¹ 158 21 Americas² 66 25 3 7 UK Cont. Europe 18 14 6 1 13 2 Japan Australia Other 20% 14% 14% 16% Rest of peers Gross sales (as a % of AUM) Redemptions (as a % of AUM)
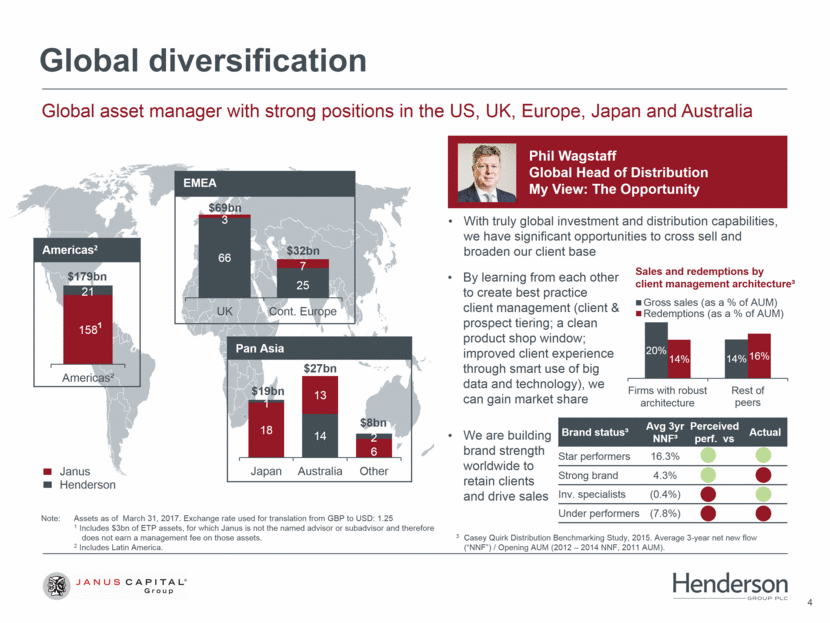
Global distribution strength Nearly 600 people worldwide Australia distribution Henderson Janus Janus Henderson Key opportunities Broader distribution for Janus Global Research (‘buy’ rated by a leading asset consultant) and Janus / Kapstream fixed income +527% +4% US distribution Key opportunities Broader distribution and client base for Henderson products, as well as new channels (retirement, insurance, fund supermarkets) Scale advantages with ratings providers and wirehouses +12% +505% +148% +32% EMEA and LatAm distribution Asia distribution Key opportunities Dai-ichi relationship in Japan Key opportunities Broader distribution for Janus product range: value, thematic, mathematical and regional equities; global and thematic fixed income +101% +66% Global distribution +18% +567% Note: Illustrative data as of February 9, 2017. 3 17 20 266 44 276 38 206 230 47 25 62 354 292 588
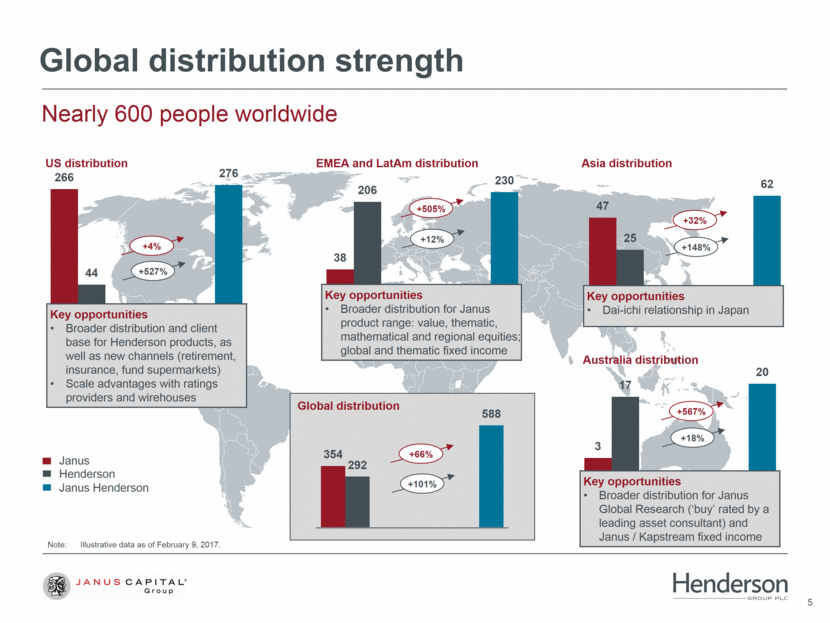
Investment management capabilities Complementary expertise across the two firms Equities Fixed Income Multi-Asset Alternatives¹ Note: Assets as of March 31, 2017. Exchange rate used for translation from GBP to USD: 1.25 1 Includes $3bn of ETP assets, for which Janus is not the named advisor or subadvisor and therefore does not earn a management fee on those assets. Pro forma as of March 31, 2017: $334bn Assets by investment capability Enrique Chang Global Chief Investment Officer My View: The Opportunity We have the opportunity to create a collaborative investment team with global expertise, focused on strong risk-adjusted returns An increased global investment footprint will provide the teams with broader access to fundamental insights across equity and fixed income securities There are interesting opportunities to expand our alternatives and asset allocation capabilities By collaborating and learning from each other (for example in our approaches to investment research), we aim to ultimately deliver the best solutions for our clients We will continue to attract and retain the best investment talent by valuing the expertise of our managers and providing them with strong global distribution INTECH Henderson Janus $46bn $20bn $166bn $26bn $76bn
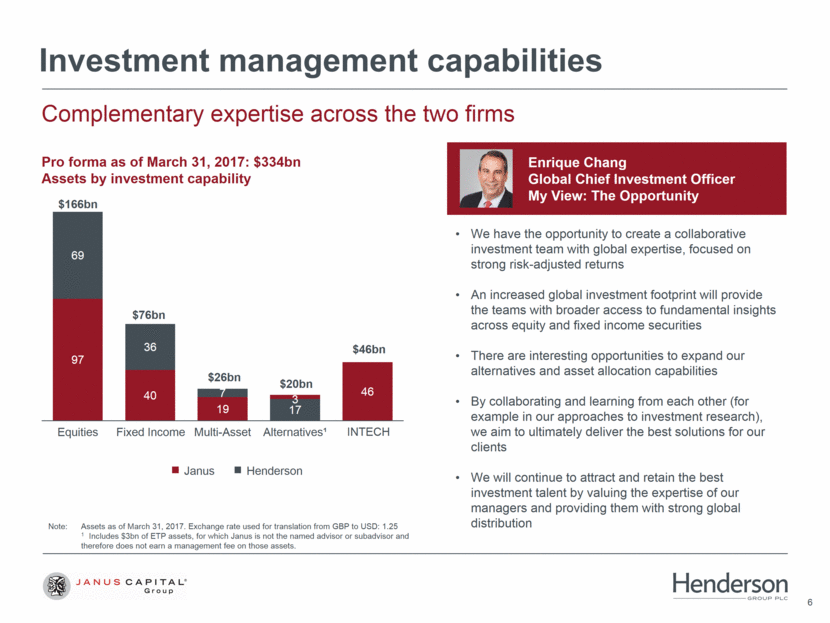
Investment management capabilities Balanced range of global, regional and specialist styles Pro forma as of March 31, 2017: $334bn Assets by investment capability $46bn $20bn $166bn $26bn $76bn Specialist Global US European Pan-Asia Regional Global Specialist Note: Assets as of March 31, 2017. Exchange rate used for translation from GBP to USD: 1.25. 1 Includes $3bn of ETP assets, for which Janus is not the named advisor or subadvisor and therefore does not earn a management fee on those assets. Equities Fixed Income Multi-Asset Alternatives¹ INTECH
Strategic relationship with Dai-ichi Life Holdings Committed long-term shareholder Janus’ largest shareholder, holding 20% of issued shares; expected dilution to ~9% of Janus Henderson on close Dai-ichi intends to increase ownership interest in Janus Henderson to at least 15% Dai-ichi will have a seat on the Janus Henderson Group Board Supported the build-out of Janus’ Japanese business Invested $2.2bn of general account assets1 Asset Management One has helped distribute another $6.6bn across investment strategies1 Relationship will assist with ongoing growth in Japan Dai-ichi has already funded ~$350 million into Henderson’s products – European Corporate Bond and Global Growth Distribution efforts of additional products through Asset Management One are ongoing Strategic alliance with Japan Post Insurance Dai-ichi relationship: Key milestones August 2012 October 2012 December 2012 December 2013 October 2016 December 2016 January 2017 Announce Dai-ichi agreement Receive initial general account funding Merger of four Dai-ichi and Mizuho companies to create AM One; strategic alliance with Japan Post Insurance Reach $2bn general account commitment Reach 20% ownership via open market purchase Total Janus AUM distributed through AM One (formerly DIAM) reaches $6.5bn Initial general account funding into Henderson’s European Corporate Bond strategy 1 As of March 31, 2017
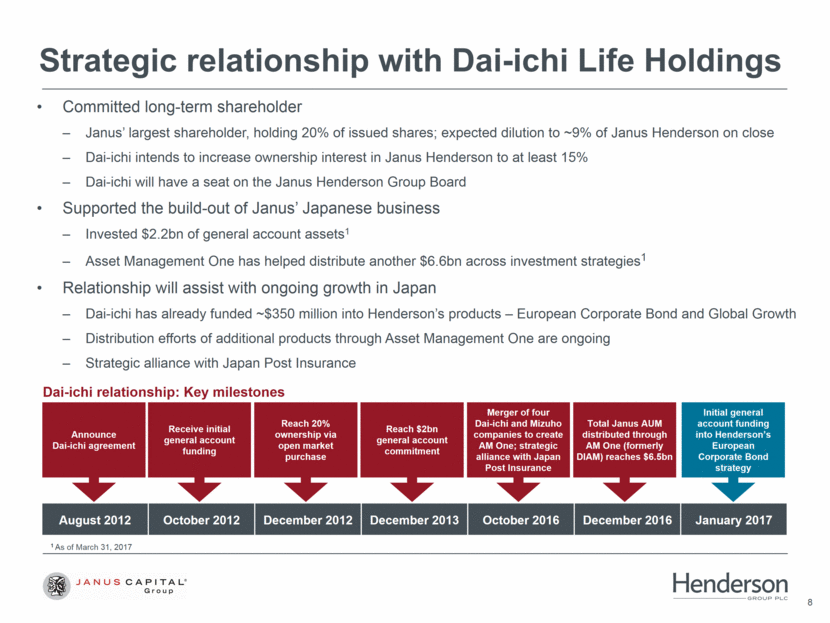
Financial benefits At least $110m of recurring annual run rate pre-tax net cost synergies within 3 years post completion; ~$80m by the end of the first 12 months following completion Majority expected from staff operating expenses in internal support functions and non-staff related operating expenses ~25% from removing duplication of investment and research teams, together with economies of scale in trading activities ~20% from reducing headcount in distribution and marketing functions Integration-related costs of $185m, $125m of which will be incurred by the end of FY2017 and the balance in the following two years Transaction-related costs of $65m Cost synergies Value creation Expected to be double digit accretive to each company’s consensus EPS (excluding one-off costs) in the first 12 months following completion Revenue synergies: 1) Dai-ichi relationship; 2) Cross-sell opportunities; and 3) New joint initiatives With no added leverage associated with the transaction, the combined firm will have a strong balance sheet creating financial stability and providing flexibility to invest the business for future growth The Board is expected to adopt a progressive dividend policy, increasing the dividend broadly in line with growth in adjusted operating income over the medium term, with a pay-out ratio consistent with Henderson’s past practice Roger Thompson Chief Financial Officer My View: The Value
Progress to date Transaction has been approved by Janus Capital Group and Henderson Group shareholders Integration team has had seven months to prepare for close We have made the very difficult personnel decisions across both organizations US fund shareholder voting has met the requirements outlined in the merger agreement, and we are on track for the combination of Janus and Henderson’s mutual fund trusts into a single trust Brand and fund documentation in place for Day 1; sales training well advanced; product prioritisation agreed Office moves planned for Day 1 Henderson FY2014, 2015 and 2016 accounts converted to US GAAP We have received all necessary regulatory approvals to proceed Ongoing monitoring of staff morale and cultural differences
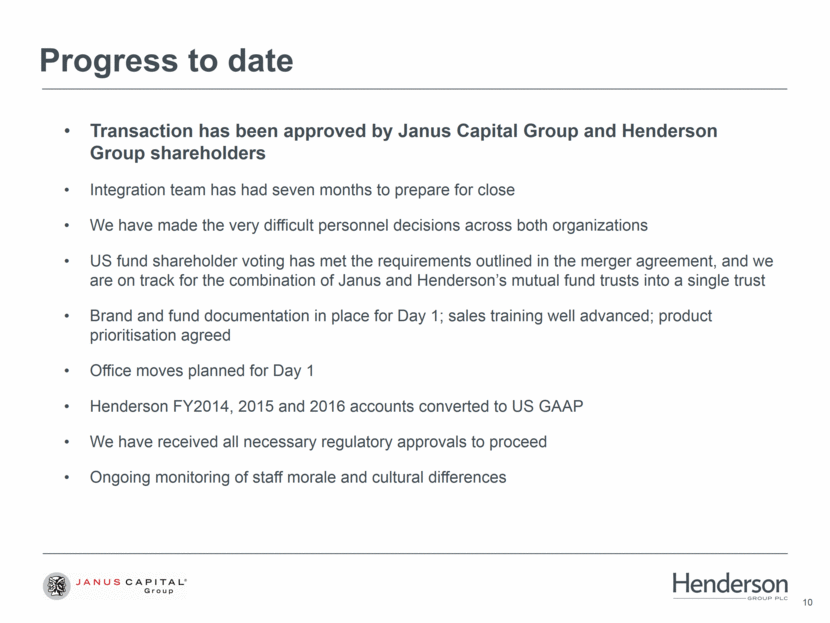
Drew Elder, Head of US Distribution “In the US we see the most immediate promise coming from an expanded actively managed product set in areas of strong client interest, including non-US equities in developed and emerging markets, income-oriented equities, and credit-oriented fixed income strategies.” Graham Kitchen, Global Head of Equities “As a leading active equity manager with global scale, Janus Henderson will have the diversity and strength in depth to deliver superior investment performance to clients, worldwide.” Kumar Palghat, Global Head of Fixed Income “The merger gives us the opportunity to create a global multi-disciplinary network of investment research and skill, providing us with richer and deeper insights into fixed income markets, enhancing our ability to identify great risk adjusted opportunities for the benefit of all clients, and to really understand the relative value of these on a global basis. All time zones execution capability means we'll be able to put ideas to work quickly in client portfolios. We are creating a truly global network, borne out of established local expertise in all fixed income markets.” Jennifer McPeek, Chief Operating & Strategy Officer “We are integrating our firms to have a combined global operating platform, which will create cost efficiencies and also superior operating capabilities, both internally and with outsource providers. We’ll drive savings through greater bargaining power with vendors and suppliers, and leverage all of our data and technology investments across a much bigger asset base. We’ll be able to do more, better!” Roger Thompson, CFO “For the first time, both firms will have global investment capabilities and distribution. Expense synergies alone mean the deal is accretive: more exciting are the opportunities for revenue growth.” Bruce Koepfgen, Head of North America “The strategic importance of our partnership with Dai-ichi Life cannot be overstated. Our four year partnership with them has exceeded all expectations and we are eager to extend the benefits of that relationship to the entire Janus Henderson family. It is difficult to imagine a more positive partnership with greater potential.” Greg Jones, Head of EMEA & LatAm Distribution “We are optimistic about early growth opportunities in EMEA and LatAm as we combine two highly talented sales teams and create a truly global product range. Longer term, we look forward to having the freedom to manufacture new product, for example developing a range of compelling asset allocation strategies.” The opportunity Rob Adams, Head of Asia Pacific “Janus Henderson in Australia will be in an even better position to continue our strong growth path. The expansion of our capability set and service offer positions us as a true market leader and significantly improves our ability to form deeper relationships across all channels.”
Aligned vision of success Become the leading, trusted global active investment manager A clear focus on our clients Commitment to delivering superior risk adjusted returns Passionate about best-in-class service to our clients Attracting and retaining the best employee talent in the industry A deeply collaborative culture
Appendix
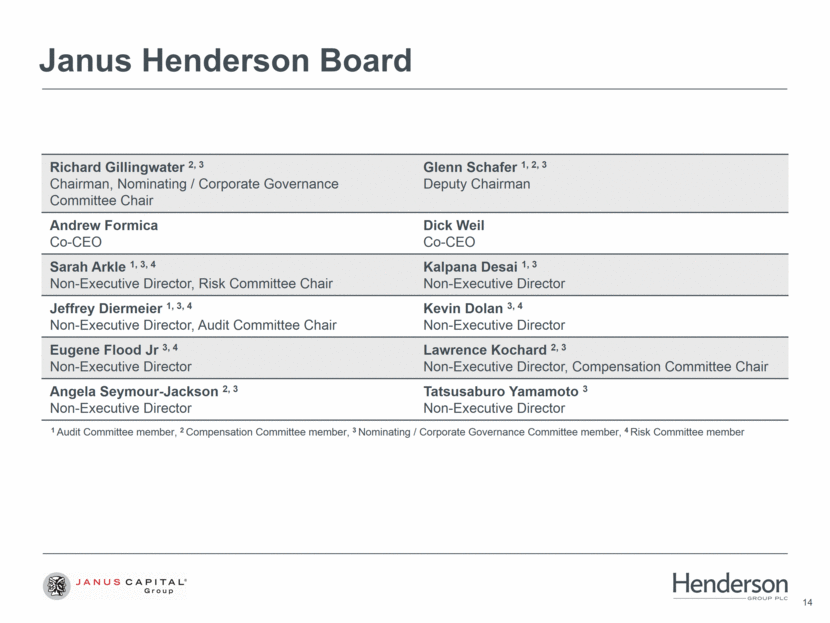
Janus Henderson Board Richard Gillingwater 2, 3 Chairman, Nominating / Corporate Governance Committee Chair Glenn Schafer 1, 2, 3 Deputy Chairman Andrew Formica Co-CEO Dick Weil Co-CEO Sarah Arkle 1, 3, 4 Non-Executive Director, Risk Committee Chair Kalpana Desai 1, 3 Non-Executive Director Jeffrey Diermeier 1, 3, 4 Non-Executive Director, Audit Committee Chair Kevin Dolan 3, 4 Non-Executive Director Eugene Flood Jr 3, 4 Non-Executive Director Lawrence Kochard 2, 3 Non-Executive Director, Compensation Committee Chair Angela Seymour-Jackson 2, 3 Non-Executive Director Tatsusaburo Yamamoto 3 Non-Executive Director 1 Audit Committee member, 2 Compensation Committee member, 3 Nominating / Corporate Governance Committee member, 4 Risk Committee member
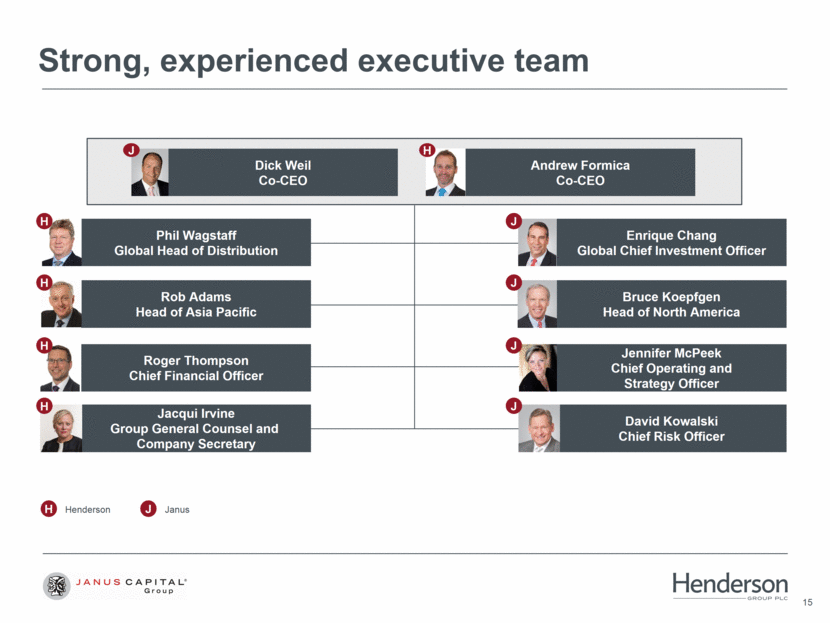
Strong, experienced executive team J H Henderson Janus Dick Weil Co-CEO Andrew Formica Co-CEO David Kowalski Chief Risk Officer Jennifer McPeek Chief Operating and Strategy Officer Enrique Chang Global Chief Investment Officer Rob Adams Head of Asia Pacific Roger Thompson Chief Financial Officer Jacqui Irvine Group General Counsel and Company Secretary Bruce Koepfgen Head of North America Phil Wagstaff Global Head of Distribution H J H H H J J J J H
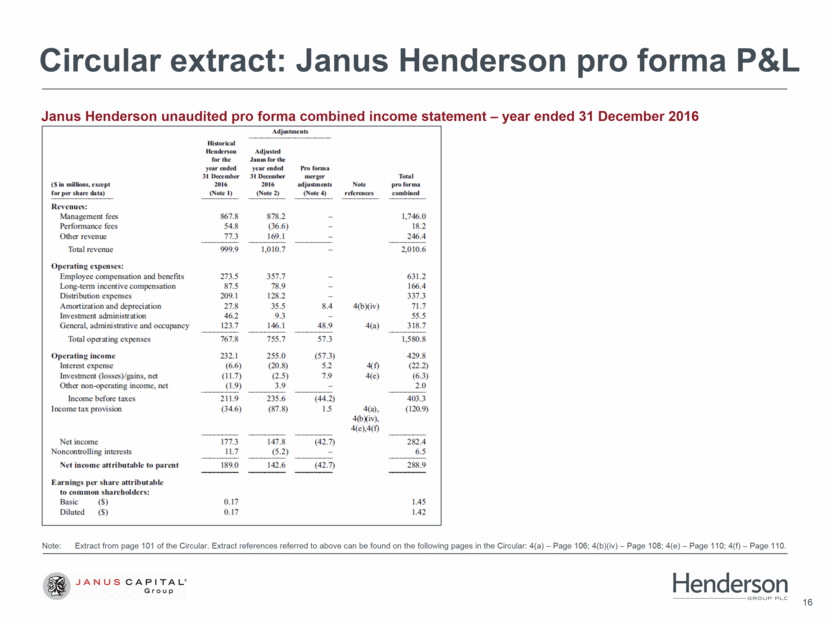
Circular extract: Janus Henderson pro forma P&L Janus Henderson unaudited pro forma combined income statement – year ended 31 December 2016 Note: Extract from page 101 of the Circular. Extract references referred to above can be found on the following pages in the Circular: 4(a) – Page 106; 4(b)(iv) – Page 108; 4(e) – Page 110; 4(f) – Page 110. Adjustments Historical Henderson Adjusted for the J antis for the year ended year ended Pro forma 31 December 31 December merger Total (Sin Millions, except 2016 2016 adjustments Note pro forma Ica’ per share data) (Note I) (Note 2) (Note 4) references comb in udRevenes: Management fees 867.8 8782 1,746.0 Performance fees 54.8 (36.6) 18.2 Other revenue 77.3 169.1 246.4 Total revenue 990.0 1,010.7 2.010.6 Operating expenses: Employee compensation and benefits 273.5 357.7 631.2 Long-tom incentive compensation 87.5 78.9 166.4 Distribution expenses 209.1 1282 337.3 Amortization and depreciation 27.8 35.5 8.4 4(b)(iv) 71.7 Investment administration 46.2 9.3 555 General, administrative and occupancy 123.7 146.1 48.9 4(a) 318.7 Total operating expenses 767.8 755.7 57.3 1580.8 Operating income 232.1 255.0 (57.3) 429.8 Interest expense (6.6) (20.8) 5.2 (4)(f) (212) Investment (losses)/pins, net (11.7) (2.5) 7.9 4(e) (6.3) Other non-operating income, net (1.9) 3.9 7.0 Income before taxes 211.9 235.6 (44.2) 4033 Income tax provision (34.6) (87.8) 13 4(a), 4(b)(iv), 4(e),4(f) (120.9) Net income 177.3 147.8 (42.7) 282.4 Noncontroling interests 11.7 (5.2) 6.5 Net income attributable to parent 189.0 142.6 (42.7) 288.9 Earnings per share attributable to common shareholders: Basic ($) 0.17 1.45 Diluted ($) 0.17 1.42
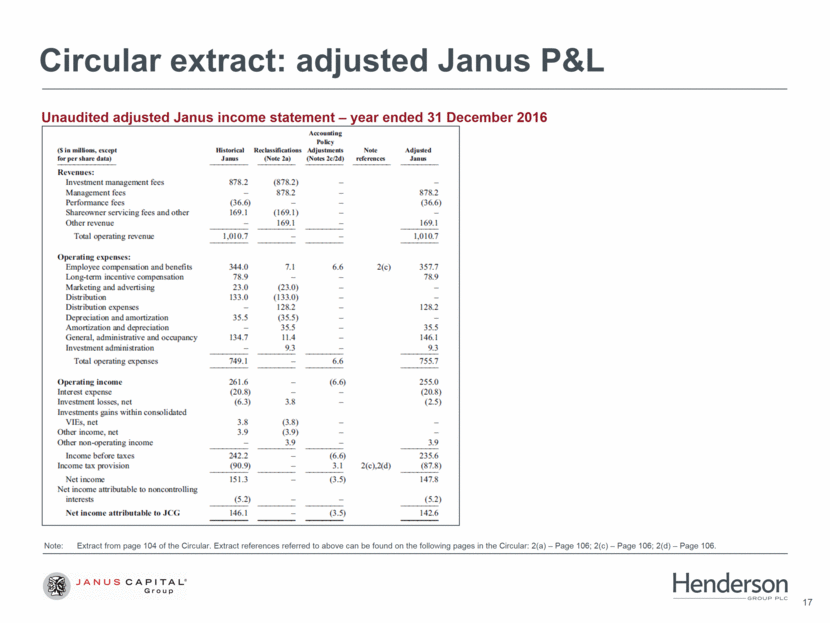
Circular extract: adjusted Janus P&L Unaudited adjusted Janus income statement – year ended 31 December 2016 Note: Extract from page 104 of the Circular. Extract references referred to above can be found on the following pages in the Circular: 2(a) – Page 106; 2(c) – Page 106; 2(d) – Page 106. (S in millions, except Cur per share data) Historical Janus 878_2 Accounting Reclassifications Adjustments (Note 2a) (Notes 2c/2d) (878_2) 878_2 Note references Adjusted Jauus 878_2 Revenues: Investment management fees Management fees Performance fees (36_6) — (36.6) Shareowner servicing fees and other 169_1 (169_1) Other revenue 169_1 169_1 Total operating revenue 1,010_7 1,010_7 Operating expenses: Employee compensation and benefits 344_0 7_1 6.6 2(c) 357_7 Lang-term incentive compensation 78.9 — 78.9 Marketing and advertising 210 (210) Distribution 1310 (1310) Distribution expenses 128.2 128.2 Depreciation and amortization 35.5 (35.5) Amortization and depreciation 35_5 35_5 General, administrative and occupancy 134_7 11.4 146_1 Investment administration 9.3 9.3 Total operating expenses 749. I 6_6 755.7 Operating income 261_6 — (6_6) 255_0 Interest expense (20_8) — (20.8) Investment lasses, net (6_3) 18 (15) Investments gains within consolidated VlEs, net 18 (18) Other income, net 19 (19) Other non-operating income 3_9 3.9 Income before taxes 242_2 (6_6) 235_6 Income tax provision (90_9) 3.1 2(c),2(d) (87_8) Net income 151_3 (3_5) 147_8 Net income attributable to noncontrolling interests (5_2) (52) Net income attributable to .1(2(.; 146_1 (15) 1416
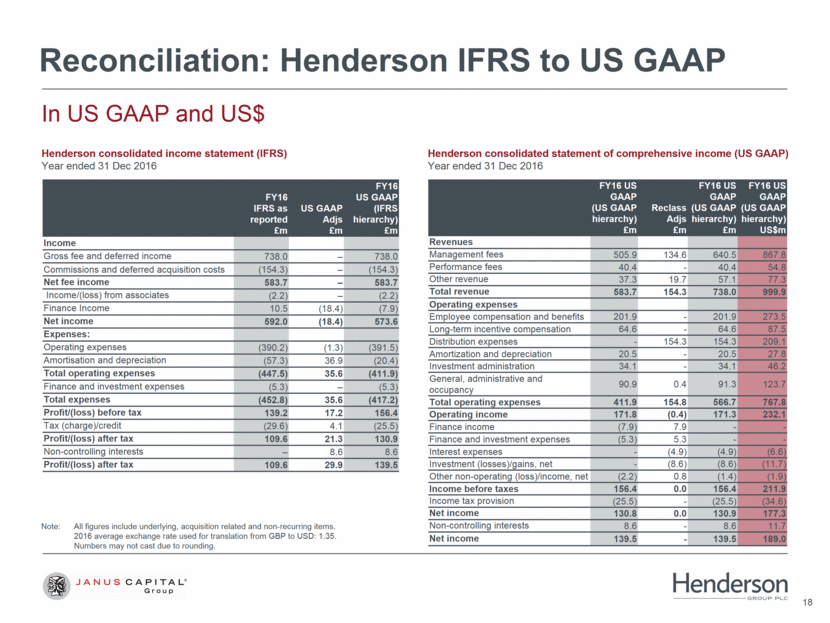
Reconciliation: Henderson IFRS to US GAAP In US GAAP and US$ Henderson consolidated income statement (IFRS) Year ended 31 Dec 2016 Henderson consolidated statement of comprehensive income (US GAAP) Year ended 31 Dec 2016 FY16 IFRS as reported £m US GAAP Adjs £m FY16 US GAAP (IFRS hierarchy) £m Income Gross fee and deferred income 738.0 – 738.0 Commissions and deferred acquisition costs (154.3) – (154.3) Net fee income 583.7 – 583.7 Income/(loss) from associates (2.2) – (2.2) Finance Income 10.5 (18.4) (7.9) Net income 592.0 (18.4) 573.6 Expenses: Operating expenses (390.2) (1.3) (391.5) Amortisation and depreciation (57.3) 36.9 (20.4) Total operating expenses (447.5) 35.6 (411.9) Finance and investment expenses (5.3) – (5.3) Total expenses (452.8) 35.6 (417.2) Profit/(loss) before tax 139.2 17.2 156.4 Tax (charge)/credit (29.6) 4.1 (25.5) Profit/(loss) after tax 109.6 21.3 130.9 Non-controlling interests – 8.6 8.6 Profit/(loss) after tax 109.6 29.9 139.5 FY16 US GAAP (US GAAP hierarchy) £m Reclass Adjs £m FY16 US GAAP (US GAAP hierarchy) £m FY16 US GAAP (US GAAP hierarchy) US$m Revenues Management fees 505.9 134.6 640.5 867.8 Performance fees 40.4 - 40.4 54.8 Other revenue 37.3 19.7 57.1 77.3 Total revenue 583.7 154.3 738.0 999.9 Operating expenses Employee compensation and benefits 201.9 - 201.9 273.5 Long-term incentive compensation 64.6 - 64.6 87.5 Distribution expenses - 154.3 154.3 209.1 Amortization and depreciation 20.5 - 20.5 27.8 Investment administration 34.1 - 34.1 46.2 General, administrative and occupancy 90.9 0.4 91.3 123.7 Total operating expenses 411.9 154.8 566.7 767.8 Operating income 171.8 (0.4) 171.3 232.1 Finance income (7.9) 7.9 - - Finance and investment expenses (5.3) 5.3 - - Interest expenses - (4.9) (4.9) (6.6) Investment (losses)/gains, net - (8.6) (8.6) (11.7) Other non-operating (loss)/income, net (2.2) 0.8 (1.4) (1.9) Income before taxes 156.4 0.0 156.4 211.9 Income tax provision (25.5) - (25.5) (34.6) Net income 130.8 0.0 130.9 177.3 Non-controlling interests 8.6 - 8.6 11.7 Net income 139.5 - 139.5 189.0 Note: All figures include underlying, acquisition related and non-recurring items. 2016 average exchange rate used for translation from GBP to USD: 1.35. Numbers may not cast due to rounding.
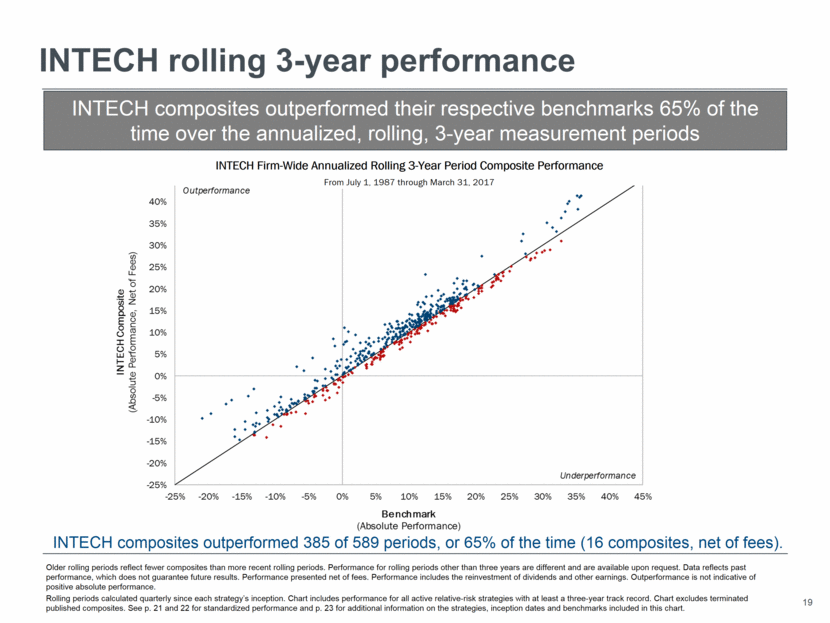
Older rolling periods reflect fewer composites than more recent rolling periods. Performance for rolling periods other than three years are different and are available upon request. Data reflects past performance, which does not guarantee future results. Performance presented net of fees. Performance includes the reinvestment of dividends and other earnings. Outperformance is not indicative of positive absolute performance. Rolling periods calculated quarterly since each strategy’s inception. Chart includes performance for all active relative-risk strategies with at least a three-year track record. Chart excludes terminated published composites. See p. 21 and 22 for standardized performance and p. 23 for additional information on the strategies, inception dates and benchmarks included in this chart. INTECH Firm-Wide Annualized Rolling 3-Year Period Composite Performance INTECH rolling 3-year performance INTECH composites outperformed their respective benchmarks 65% of the time over the annualized, rolling, 3-year measurement periods From July 1, 1987 through March 31, 2017 INTECH composites outperformed 385 of 589 periods, or 65% of the time (16 composites, net of fees). -25% -20% -15% -10% -5% 0% 5% 10% 15% 20% 25% 30% 35% 40% 45% -25% -20% -15% -10% -5% 0% 5% 10% 15% 20% 25% 30% 35% 40% 45% Benchmark (Absolute Performance) INTECH strategies outperformed 385 of 589 periods, or 65% of the time (16 composites, net of fees). Underperformance Outperformance INTECH Composite (Absolute Performance, Net of Fees) Annualized Rolling Three - Year Performance
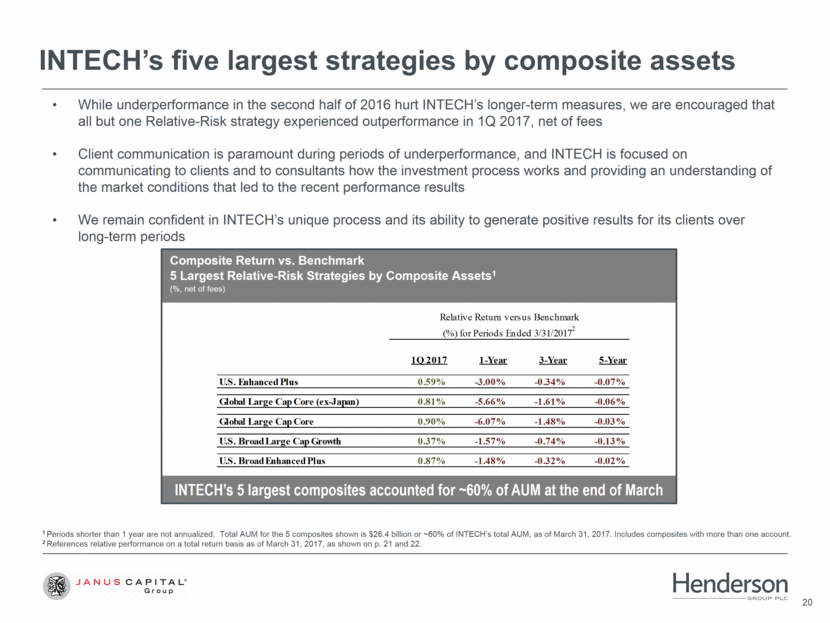
While underperformance in the second half of 2016 hurt INTECH’s longer-term measures, we are encouraged that all but one Relative-Risk strategy experienced outperformance in 1Q 2017, net of fees Client communication is paramount during periods of underperformance, and INTECH is focused on communicating to clients and to consultants how the investment process works and providing an understanding of the market conditions that led to the recent performance results We remain confident in INTECH’s unique process and its ability to generate positive results for its clients over long-term periods INTECH’s 5 largest composites accounted for ~60% of AUM at the end of March Composite Return vs. Benchmark 5 Largest Relative-Risk Strategies by Composite Assets1 (%, net of fees) INTECH’s five largest strategies by composite assets 1 Periods shorter than 1 year are not annualized. Total AUM for the 5 composites shown is $26.4 billion or ~60% of INTECH’s total AUM, as of March 31, 2017. Includes composites with more than one account. 2 References relative performance on a total return basis as of March 31, 2017, as shown on p. 21 and 22. 1Q 2017 1-Year 3-Year 5-Year U.S. Enhanced Plus 0.59% -3.00% -0.34% -0.07% Global Large Cap Core (ex-Japan) 0.81% -5.66% -1.61% -0.06% Global Large Cap Core 0.90% -6.07% -1.48% -0.03% U.S. Broad Large Cap Growth 0.37% -1.57% -0.74% -0.13% U.S. Broad Enhanced Plus 0.87% -1.48% -0.32% -0.02% Relative Return versus Benchmark (%) for Periods Ended 3/31/2017 2
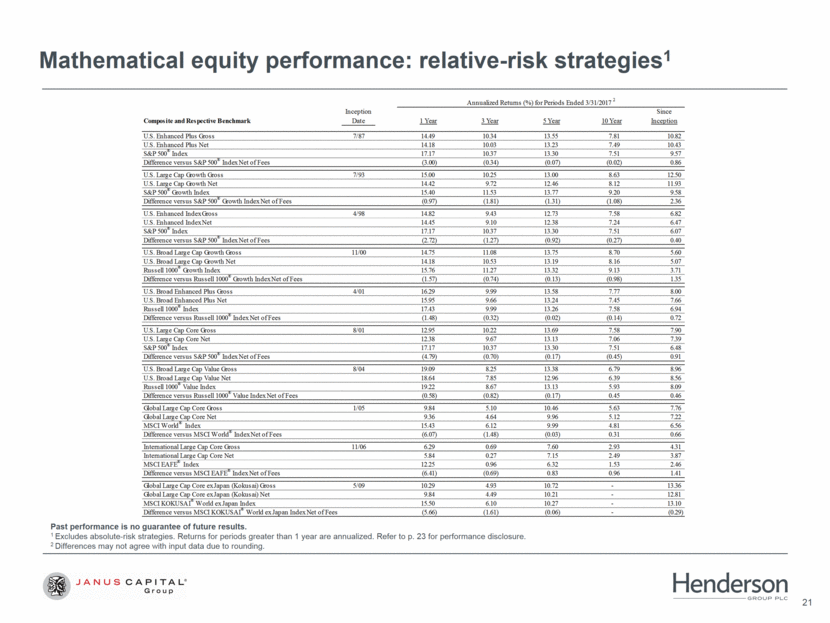
Mathematical equity performance: relative-risk strategies1 Past performance is no guarantee of future results. 1 Excludes absolute-risk strategies. Returns for periods greater than 1 year are annualized. Refer to p. 23 for performance disclosure. 2 Differences may not agree with input data due to rounding. Inception Since Composite and Respective Benchmark Date 1 Year 3 Year 5 Year 10 Year Inception U.S. Enhanced Plus Gross 7/87 14.49 10.34 13.55 7.81 10.82 U.S. Enhanced Plus Net 14.18 10.03 13.23 7.49 10.43 S&P 500 ® Index 17.17 10.37 13.30 7.51 9.57 Difference versus S&P 500 ® Index Net of Fees (3.00) (0.34) (0.07) (0.02) 0.86 U.S. Large Cap Growth Gross 7/93 15.00 10.25 13.00 8.63 12.50 U.S. Large Cap Growth Net 14.42 9.72 12.46 8.12 11.93 S&P 500 ® Growth Index 15.40 11.53 13.77 9.20 9.58 Difference versus S&P 500 ® Growth Index Net of Fees (0.97) (1.81) (1.31) (1.08) 2.36 U.S. Enhanced Index Gross 4/98 14.82 9.43 12.73 7.58 6.82 U.S. Enhanced Index Net 14.45 9.10 12.38 7.24 6.47 S&P 500 ® Index 17.17 10.37 13.30 7.51 6.07 Difference versus S&P 500 ® Index Net of Fees (2.72) (1.27) (0.92) (0.27) 0.40 U.S. Broad Large Cap Growth Gross 11/00 14.75 11.08 13.75 8.70 5.60 U.S. Broad Large Cap Growth Net 14.18 10.53 13.19 8.16 5.07 Russell 1000 ® Growth Index 15.76 11.27 13.32 9.13 3.71 Difference versus Russell 1000 ® Growth Index Net of Fees (1.57) (0.74) (0.13) (0.98) 1.35 U.S. Broad Enhanced Plus Gross 4/01 16.29 9.99 13.58 7.77 8.00 U.S. Broad Enhanced Plus Net 15.95 9.66 13.24 7.45 7.66 Russell 1000 ® Index 17.43 9.99 13.26 7.58 6.94 Difference versus Russell 1000 ® Index Net of Fees (1.48) (0.32) (0.02) (0.14) 0.72 U.S. Large Cap Core Gross 8/01 12.95 10.22 13.69 7.58 7.90 U.S. Large Cap Core Net 12.38 9.67 13.13 7.06 7.39 S&P 500 ® Index 17.17 10.37 13.30 7.51 6.48 Difference versus S&P 500 ® Index Net of Fees (4.79) (0.70) (0.17) (0.45) 0.91 U.S. Broad Large Cap Value Gross 8/04 19.09 8.25 13.38 6.79 8.96 U.S. Broad Large Cap Value Net 18.64 7.85 12.96 6.39 8.56 Russell 1000 ® Value Index 19.22 8.67 13.13 5.93 8.09 Difference versus Russell 1000 ® Value Index Net of Fees (0.58) (0.82) (0.17) 0.45 0.46 Global Large Cap Core Gross 1/05 9.84 5.10 10.46 5.63 7.76 Global Large Cap Core Net 9.36 4.64 9.96 5.12 7.22 MSCI World ® Index 15.43 6.12 9.99 4.81 6.56 Difference versus MSCI World ® Index Net of Fees (6.07) (1.48) (0.03) 0.31 0.66 International Large Cap Core Gross 11/06 6.29 0.69 7.60 2.93 4.31 International Large Cap Core Net 5.84 0.27 7.15 2.49 3.87 MSCI EAFE ® Index 12.25 0.96 6.32 1.53 2.46 Difference versus MSCI EAFE ® Index Net of Fees (6.41) (0.69) 0.83 0.96 1.41 Global Large Cap Core ex Japan (Kokusai) Gross 5/09 10.29 4.93 10.72 - 13.36 Global Large Cap Core ex Japan (Kokusai) Net 9.84 4.49 10.21 - 12.81 MSCI KOKUSAI ® World ex Japan Index 15.50 6.10 10.27 - 13.10 Difference versus MSCI KOKUSAI ® World ex Japan Index Net of Fees (5.66) (1.61) (0.06) - (0.29) Annualized Returns (%) for Periods Ended 3/31/2017 2
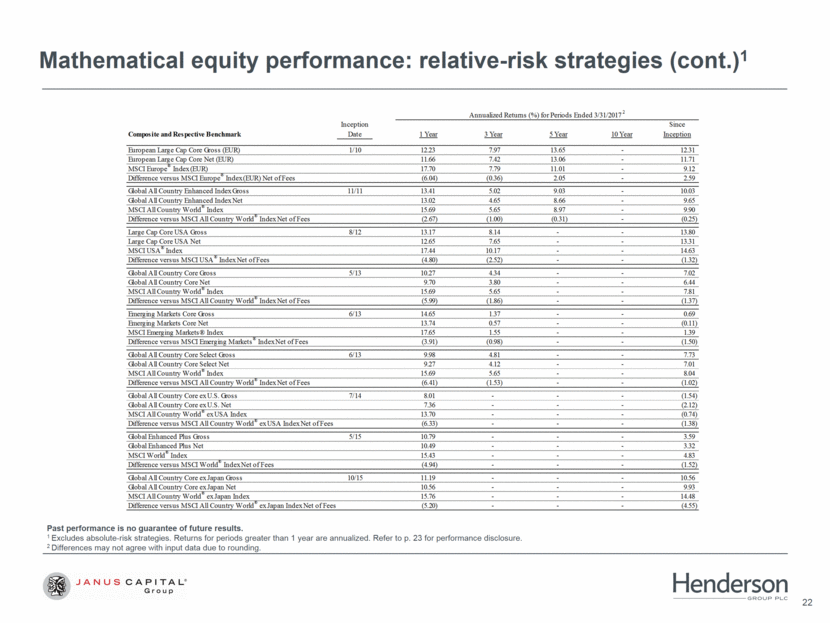
Mathematical equity performance: relative-risk strategies (cont.)1 Past performance is no guarantee of future results. 1 Excludes absolute-risk strategies. Returns for periods greater than 1 year are annualized. Refer to p. 23 for performance disclosure. 2 Differences may not agree with input data due to rounding. Inception Since Composite and Respective Benchmark Date 1 Year 3 Year 5 Year 10 Year Inception European Large Cap Core Gross (EUR) 1/10 12.23 7.97 13.65 - 12.31 European Large Cap Core Net (EUR) 11.66 7.42 13.06 - 11.71 MSCI Europe ® Index (EUR) 17.70 7.79 11.01 - 9.12 Difference versus MSCI Europe ® Index (EUR) Net of Fees (6.04) (0.36) 2.05 - 2.59 Global All Country Enhanced Index Gross 11/11 13.41 5.02 9.03 - 10.03 Global All Country Enhanced Index Net 13.02 4.65 8.66 - 9.65 MSCI All Country World ® Index 15.69 5.65 8.97 - 9.90 Difference versus MSCI All Country World ® Index Net of Fees (2.67) (1.00) (0.31) - (0.25) Large Cap Core USA Gross 8/12 13.17 8.14 - - 13.80 Large Cap Core USA Net 12.65 7.65 - - 13.31 MSCI USA ® Index 17.44 10.17 - - 14.63 Difference versus MSCI USA ® Index Net of Fees (4.80) (2.52) - - (1.32) Global All Country Core Gross 5/13 10.27 4.34 - - 7.02 Global All Country Core Net 9.70 3.80 - - 6.44 MSCI All Country World ® Index 15.69 5.65 - - 7.81 Difference versus MSCI All Country World ® Index Net of Fees (5.99) (1.86) - - (1.37) Emerging Markets Core Gross 6/13 14.65 1.37 - - 0.69 Emerging Markets Core Net 13.74 0.57 - - (0.11) MSCI Emerging Markets® Index 17.65 1.55 - - 1.39 Difference versus MSCI Emerging Markets ® Index Net of Fees (3.91) (0.98) - - (1.50) Global All Country Core Select Gross 6/13 9.98 4.81 - - 7.73 Global All Country Core Select Net 9.27 4.12 - - 7.01 MSCI All Country World ® Index 15.69 5.65 - - 8.04 Difference versus MSCI All Country World ® Index Net of Fees (6.41) (1.53) - - (1.02) Global All Country Core ex U.S. Gross 7/14 8.01 - - - (1.54) Global All Country Core ex U.S. Net 7.36 - - - (2.12) MSCI All Country World ® ex USA Index 13.70 - - - (0.74) Difference versus MSCI All Country World ® ex USA Index Net of Fees (6.33) - - - (1.38) Global Enhanced Plus Gross 5/15 10.79 - - - 3.59 Global Enhanced Plus Net 10.49 - - - 3.32 MSCI World ® Index 15.43 - - - 4.83 Difference versus MSCI World ® Index Net of Fees (4.94) - - - (1.52) Global All Country Core ex Japan Gross 10/15 11.19 - - - 10.56 Global All Country Core ex Japan Net 10.56 - - - 9.93 MSCI All Country World ® ex Japan Index 15.76 - - - 14.48 Difference versus MSCI All Country World ® ex Japan Index Net of Fees (5.20) - - - (4.55) Annualized Returns (%) for Periods Ended 3/31/2017 2
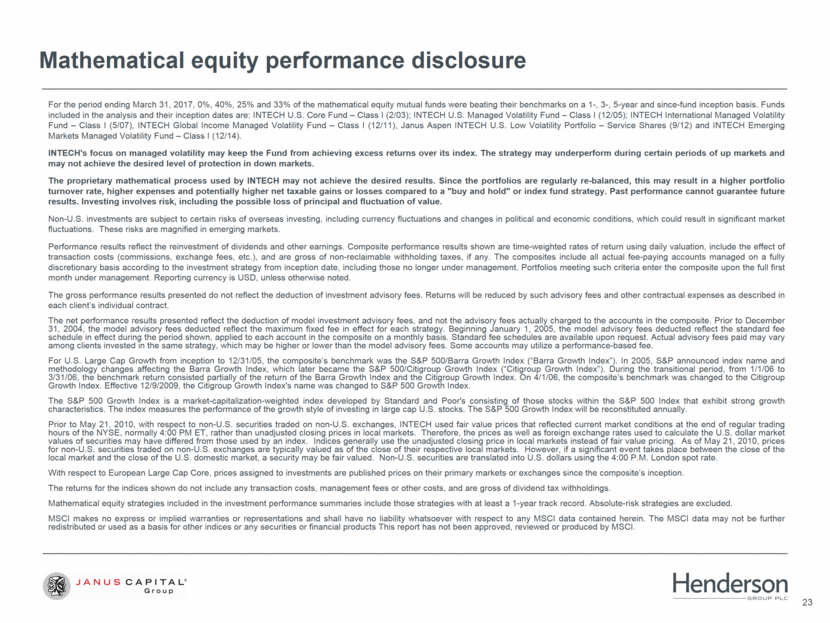
For the period ending March 31, 2017, 0%, 40%, 25% and 33% of the mathematical equity mutual funds were beating their benchmarks on a 1-, 3-, 5-year and since-fund inception basis. Funds included in the analysis and their inception dates are: INTECH U.S. Core Fund – Class I (2/03); INTECH U.S. Managed Volatility Fund – Class I (12/05); INTECH International Managed Volatility Fund – Class I (5/07), INTECH Global Income Managed Volatility Fund – Class I (12/11), Janus Aspen INTECH U.S. Low Volatility Portfolio – Service Shares (9/12) and INTECH Emerging Markets Managed Volatility Fund – Class I (12/14). INTECH's focus on managed volatility may keep the Fund from achieving excess returns over its index. The strategy may underperform during certain periods of up markets and may not achieve the desired level of protection in down markets. The proprietary mathematical process used by INTECH may not achieve the desired results. Since the portfolios are regularly re-balanced, this may result in a higher portfolio turnover rate, higher expenses and potentially higher net taxable gains or losses compared to a "buy and hold" or index fund strategy. Past performance cannot guarantee future results. Investing involves risk, including the possible loss of principal and fluctuation of value. Non-U.S. investments are subject to certain risks of overseas investing, including currency fluctuations and changes in political and economic conditions, which could result in significant market fluctuations. These risks are magnified in emerging markets. Performance results reflect the reinvestment of dividends and other earnings. Composite performance results shown are time-weighted rates of return using daily valuation, include the effect of transaction costs (commissions, exchange fees, etc.), and are gross of non-reclaimable withholding taxes, if any. The composites include all actual fee-paying accounts managed on a fully discretionary basis according to the investment strategy from inception date, including those no longer under management. Portfolios meeting such criteria enter the composite upon the full first month under management. Reporting currency is USD, unless otherwise noted. The gross performance results presented do not reflect the deduction of investment advisory fees. Returns will be reduced by such advisory fees and other contractual expenses as described in each client’s individual contract. The net performance results presented reflect the deduction of model investment advisory fees, and not the advisory fees actually charged to the accounts in the composite. Prior to December 31, 2004, the model advisory fees deducted reflect the maximum fixed fee in effect for each strategy. Beginning January 1, 2005, the model advisory fees deducted reflect the standard fee schedule in effect during the period shown, applied to each account in the composite on a monthly basis. Standard fee schedules are available upon request. Actual advisory fees paid may vary among clients invested in the same strategy, which may be higher or lower than the model advisory fees. Some accounts may utilize a performance-based fee. For U.S. Large Cap Growth from inception to 12/31/05, the composite’s benchmark was the S&P 500/Barra Growth Index (“Barra Growth Index”). In 2005, S&P announced index name and methodology changes affecting the Barra Growth Index, which later became the S&P 500/Citigroup Growth Index (“Citigroup Growth Index”). During the transitional period, from 1/1/06 to 3/31/06, the benchmark return consisted partially of the return of the Barra Growth Index and the Citigroup Growth Index. On 4/1/06, the composite’s benchmark was changed to the Citigroup Growth Index. Effective 12/9/2009, the Citigroup Growth Index's name was changed to S&P 500 Growth Index. The S&P 500 Growth Index is a market-capitalization-weighted index developed by Standard and Poor's consisting of those stocks within the S&P 500 Index that exhibit strong growth characteristics. The index measures the performance of the growth style of investing in large cap U.S. stocks. The S&P 500 Growth Index will be reconstituted annually. Prior to May 21, 2010, with respect to non-U.S. securities traded on non-U.S. exchanges, INTECH used fair value prices that reflected current market conditions at the end of regular trading hours of the NYSE, normally 4:00 PM ET, rather than unadjusted closing prices in local markets. Therefore, the prices as well as foreign exchange rates used to calculate the U.S. dollar market values of securities may have differed from those used by an index. Indices generally use the unadjusted closing price in local markets instead of fair value pricing. As of May 21, 2010, prices for non-U.S. securities traded on non-U.S. exchanges are typically valued as of the close of their respective local markets. However, if a significant event takes place between the close of the local market and the close of the U.S. domestic market, a security may be fair valued. Non-U.S. securities are translated into U.S. dollars using the 4:00 P.M. London spot rate. With respect to European Large Cap Core, prices assigned to investments are published prices on their primary markets or exchanges since the composite’s inception. The returns for the indices shown do not include any transaction costs, management fees or other costs, and are gross of dividend tax withholdings. Mathematical equity strategies included in the investment performance summaries include those strategies with at least a 1-year track record. Absolute-risk strategies are excluded. MSCI makes no express or implied warranties or representations and shall have no liability whatsoever with respect to any MSCI data contained herein. The MSCI data may not be further redistributed or used as a basis for other indices or any securities or financial products This report has not been approved, reviewed or produced by MSCI. Mathematical equity performance disclosure
