Attached files
| file | filename |
|---|---|
| EX-99.1 - EX-99.1 - INDEPENDENCE REALTY TRUST, INC. | irt-ex991_8.htm |
| 8-K - 8-K EARNINGS RELEASE - INDEPENDENCE REALTY TRUST, INC. | irt-8k_20170502.htm |
Exhibit 99.2

Q1 2017 Earnings Release &
Supplemental Information

|
Company Information |
|
3 |
|
|
|
|
|
Forward-Looking Statements |
|
4 |
|
|
|
|
|
Earnings Release Text |
|
5 |
|
|
|
|
|
Financial Highlights |
|
9 |
|
|
|
|
|
Balance Sheets |
|
10 |
|
|
|
|
|
Statements of Operations, FFO & CORE FFO |
|
|
|
Trailing 5 Quarters |
|
11 |
|
Three Months Ended March 31, 2017 |
|
12 |
|
|
|
|
|
Adjusted EBITDA Reconciliations |
|
|
|
Trailing 5 Quarters |
|
13 |
|
Three Months Ended March 31, 2017 |
|
13 |
|
|
|
|
|
Same-Store Portfolio Net Operating Income |
|
|
|
Trailing 5 Quarters |
|
14 |
|
Three Months Ended March 31, 2017 |
|
15 |
|
|
|
|
|
Net Operating Income Bridge |
|
16 |
|
|
|
|
|
Debt and Capitalization Overview |
|
17 |
|
|
|
|
|
Property Summary |
|
18 |
|
|
|
|
|
NOI Exposure by Market |
|
19 |
|
|
|
|
|
Definitions |
|
20 |
2
March 31, 2017
Company Information:
Independence Realty Trust, Inc. (NYSE MKT: IRT) is an internally-managed real estate investment trust that seeks to own well-located apartment properties in geographic submarkets that it believes support strong occupancy and the potential for growth in rental rates. IRT seeks to provide stockholders with attractive risk-adjusted returns, with an emphasis on distributions and capital appreciation. As of March 31, 2017, IRT’s portfolio consists of 47 properties with 13,198 apartment units located in 16 states.
|
Corporate Headquarters |
|
Two Logan Square |
|
|
|
100 N. 18th Street, 23rd Floor |
|
|
|
Philadelphia, Pa 19103 |
|
|
|
215.207.2100 |
|
|
|
|
|
Trading Symbol |
|
NYSE MKT: “IRT” |
|
|
|
|
|
Investor Relations Contact |
|
Andres Viroslav |
|
|
|
Two Logan Square |
|
|
|
100 N. 18th Street, 23rd Floor |
|
|
|
Philadelphia, Pa 19103 |
|
|
|
215.207.2100 |
|
|
|
For the Three Months Ended |
|
|||||||||||||||||
|
|
|
March 31, 2017 |
|
|
December 31, 2016 |
|
|
September 30, 2016 |
|
|
June 30, 2016 |
|
|
March 31, 2016 |
|
|||||
|
Common Shares: |
|
|
|
|
|
|
|
|
|
|
|
|
|
|
|
|
|
|
|
|
|
Share Price, period end |
|
$ |
9.37 |
|
|
$ |
8.92 |
|
|
$ |
9.00 |
|
|
$ |
8.18 |
|
|
$ |
7.12 |
|
|
Share Price, high |
|
$ |
9.45 |
|
|
$ |
9.15 |
|
|
$ |
10.70 |
|
|
$ |
8.21 |
|
|
$ |
7.78 |
|
|
Share Price, low |
|
$ |
8.57 |
|
|
$ |
7.74 |
|
|
$ |
8.05 |
|
|
$ |
6.75 |
|
|
$ |
5.97 |
|
|
Dividends declared |
|
$ |
0.18 |
|
|
$ |
0.18 |
|
|
$ |
0.18 |
|
|
$ |
0.18 |
|
|
$ |
0.18 |
|
|
Dividend yield, period end |
|
|
7.7 |
% |
|
|
8.1 |
% |
|
|
8.0 |
% |
|
|
8.8 |
% |
|
|
10.1 |
% |
3
Forward-Looking Statements
This supplemental information may contain certain forward-looking statements within the meaning of Section 27A of the Securities Act of 1933, as amended, and Section 21E of the Securities Exchange Act of 1934, as amended. Such forward-looking statements can generally be identified by our use of forward-looking terminology such as “may,” “will,” “expect,” “intend,” “anticipate,” “estimate,” “believe,” “seek,” “outlook,” “assumption,” “projected,” “strategy”, “guidance” or other similar words. Because such statements include risks, uncertainties and contingencies, actual results may differ materially from the expectations, intentions, beliefs, plans or predictions of the future expressed or implied by such forward-looking statements. These forward looking statements are based upon the current beliefs and expectations of IRT’s management and are inherently subject to significant business, economic and competitive uncertainties and contingencies, many of which are difficult to predict and generally not within IRT’s control. In addition, these forward-looking statements are subject to assumptions with respect to future business strategies and decisions that are subject to change. Such forward-looking statements include, but are not limited to, IRT’s previously provided 2017 EPS and CFFO guidance, including, without limitation, future projected EPS and CFFO per diluted share allocated to common shareholders; the assumptions underlying such guidance, including, without limitation, information concerning the assumed same store communities, including, without limitation, the number of properties/units, property revenue growth, controllable property operating expense growth, real estate tax and insurance expense increase, property NOI growth, the level of corporate expenses, the assumed level of transaction/investment volume and the level of capital expenditures; the anticipated benefits and the expected financial impact of IRT’s internalization of its management, including, without limitation, any anticipated annual expense savings. These statements are not guarantees of future performance and involve certain risks, uncertainties and assumptions that are difficult to predict. Although IRT believes the expectations reflected in any forward-looking statements are based on reasonable assumptions, IRT can give no assurance that IRT’s expectations will be attained and therefore, actual outcomes and results may differ materially from what is expressed or forecasted in such forward looking statements. Some of the factors that may affect outcomes and results include, but are not limited to: whether IRT will be able to sell its Class C communities and use the proceeds to acquire higher quality communities, whether the previously provided assumptions underlying the guidance and projections previously provided in this supplemental information can be achieved, including, without limitation, whether IRT’s 2017 same store portfolio of communities will perform with respect to the identified metrics within the assumed ranges, whether IRT will keep the identified corporate expenses within the assumed range, whether the transaction/investment volume for acquisitions and dispositions will be in the assumed range, and whether the capital expenditures will be within the assumed range; whether the anticipated benefits and financial performance resulting from internalization will be achieved, including, without limitation, the expected cost savings; national, regional and local economic climates; changes in financial markets and interest rates, or to the business or financial condition of IRT; changes in market demand for rental apartment homes and competitive pricing from projected apartment industry dynamics, demographic and employment information; IRT’s maintenance of real estate investment trust (“REIT”) status; availability of financing and capital; dividends are subject to the discretion of IRT’s Board of Directors, and will depend on IRT’s financial condition, results of operations, capital requirements, compliance with applicable laws and agreements and any other factors deemed relevant by IRT’s Board; risks associated with pursuing additional strategic acquisitions, including risks associated with the need to raise additional capital to fund the acquisitions; and those additional risks and factors discussed in reports filed with the Securities and Exchange Commission (“SEC”) by IRT from time to time, including those discussed under the heading “Risk Factors” in IRT’s most recently filed reports on Forms 10-K and 10-Q. IRT undertakes no obligation to update these forward-looking statements to reflect events or circumstances after the date hereof or to reflect the occurrence of unanticipated events, except as may be required by law.
4
Independence Realty Trust Announces First Quarter 2017 Financial Results and Closes Refinancing of Existing Line of Credit
PHILADELPHIA, PA — May 2, 2017 — Independence Realty Trust, Inc. (“IRT”) (NYSE MKT: IRT), an internally-managed multi-family apartment REIT, today announced its first quarter 2017 financial results and the refinancing of its existing secured credit facility with a new $300.0 million unsecured credit facility. All per share results are reported on a diluted basis.
Results for the Quarter
|
|
• |
Earnings per share (“EPS”) was $0.06 for the quarter ended March 31, 2017 as compared to $0.00 for the quarter ended March 31, 2016. |
|
|
• |
Core Funds from Operations (“CFFO”) per share of $0.18 for the quarter ended March 31, 2017 as compared to $0.21 for the quarter ended March 31, 2016. |
|
|
• |
Earnings before interest, taxes, depreciation and amortization and before acquisition expenses (“Adjusted EBITDA”), of $19.5 million for the quarter ended March 31, 2017 as compared to $18.9 million for the quarter ended March 31, 2016. |
Property Acquisitions
|
|
• |
As previously announced, on February 27, 2017, IRT acquired a 216 unit apartment community located in Tampa, Florida for a purchase price of $29.8 million using available cash and its line of credit to fund the acquisition. The apartment community was constructed in 1985 and was extensively renovated in 2016. Situated in the Northdale neighborhood of Tampa and more specifically in the Dale Mabry retail corridor, the community benefits from its close proximity to retail, highly rated schools and easy access to Tampa's major highways. The property contains one and two bedroom units with an average unit size of 925 square feet. As of February 22, 2017, the occupancy of the property was 93% and had an average effective rent per occupied unit of $1,192 ($1.29/sf) for the three months ending January 31, 2017. |
New Line of Credit Refinancing
|
|
• |
On May 1, 2017, IRT closed on a new $300.0 million unsecured credit facility refinancing the previous secured credit facility. The new facility is comprised of a $50.0 million term loan and a revolving commitment of up to $250.0 million. The maturity date on the new term loan is May 1, 2022 and the maturity date on borrowings outstanding under the revolving commitment is May 1, 2021, extending the September 17, 2018 maturity of the previous secured credit facility. Borrowings under the revolving commitment can be extended through two, six-month extension options. The new unsecured credit facility also provides for an accordion feature allowing for an additional $200 million of capacity resulting in a maximum borrowing capacity of $500 million, a portion of which may be drawn as an incremental term loan with a maturity date of five years from the date of such draw. The exercise of the accordion is subject to customary terms and conditions. Based on our leverage levels as of closing, IRT’s annual interest cost would be LIBOR plus 145 basis points under the term loan and LIBOR plus 150 basis points for borrowings outstanding under the revolving commitments, an annual savings of approximately 35 to 40 basis points from IRT’s previous secured credit facility. The new facility is unsecured and improves IRT’s flexibility to effectively manage its assets by creating a pool of unencumbered assets. |
|
|
• |
The new facility was arranged by Citigroup Global Markets Inc., Keybanc Capital Markets and The Huntington National Bank, who acted as Joint Lead Arrangers. Citigroup Global Markets Inc. and Keybanc Capital Markets acted as Joint Bookrunners. Citigroup Global Markets Inc. and The Huntington National Bank acted as Co-Syndication Agents. Keybank National Association acted as Agent. Bank of America, N.A., Capital One, National Association, Citizens Bank, N.A., Comerica Bank and Regions Bank acted as Co-Documentation Agents. |
“Our first full quarter as an internally managed REIT demonstrated the long-term potential we have to unlock value,” said Scott Schaeffer, IRT’s Chairman and CEO. “The combination of our uniquely positioned portfolio and strong operating capabilities yielded year-over-year same-store NOI growth of 5.2%. Our recently completed Tampa acquisition underscores our ongoing investment strategy to upgrade our portfolio by rotating capital out of lower-growth assets and into higher-quality communities located in submarkets with compelling growth fundamentals. The overwhelming lender participation in our new unsecured credit facility speaks volumes about our strength as an internally-managed multi-family apartment REIT. Looking ahead, we see tremendous accretive
5
opportunities to maximize operating efficiencies within our core portfolio, to recycle capital at attractive economics, and, using our new unsecured credit facility, to prudently manage our balance sheet for long-term flexibility.”
Same-Store Property Operating Results
|
|
First Quarter 2017 Compared to First Quarter 2016(1) |
|
Rental income |
4.2% increase |
|
Total revenues |
4.8% increase |
|
Property level operating expenses |
4.1% increase |
|
Net operating income (“NOI”) |
5.2% increase |
|
Portfolio average occupancy |
1.0% increase to 93.9% |
|
Portfolio average rental rate |
3.7% increase to $1,007 |
|
NOI Margin |
0.3% increase to 59.8% |
|
|
(1) |
Same store portfolio for the three months ended March 31, 2017 and 2016 consists of 42 properties with 11,676 apartment units. |
Capital Expenditures
For the three months ended March 31, 2017, our recurring capital expenditures for the total portfolio was $1.8 million, or $135 per unit.
Selected Financial Information
See Schedule I to this Release for selected financial information for IRT.
Non-GAAP Financial Measures and Definitions
IRT discloses the following non-GAAP financial measures in this release: funds from operations (“FFO”), CFFO, Adjusted EBITDA and NOI. A reconciliation of IRT’s reported net income (loss) to its FFO and CFFO is included as Schedule II to this release. A reconciliation of IRT’s same store NOI to its reported net income (loss) is included as Schedule III to this release. A reconciliation of IRT’s Adjusted EBITDA, to net income (loss) is included as Schedule IV to this release. See Schedule V to this release for management’s respective definitions and rationales for the usefulness of each of these non-GAAP financial measures and other definitions used in this release.
Distributions
On April 12, 2017, IRT’s Board of Directors declared monthly cash dividends for the second quarter of 2017 on IRT’s shares of common stock in the amount of $0.06 per share per month. The monthly dividends total $0.18 per share for the second quarter. The month for which each dividend was declared is set forth below, with the relevant amount per share, record date and payment date set forth opposite the month:
|
Month |
|
|
|
Amount |
|
|
|
Record Date |
|
|
|
Payment Date |
|
April 2017 |
|
|
|
$0.06 |
|
|
|
04/28/2017 |
|
|
|
05/15/2017 |
|
May 2017 |
|
|
|
$0.06 |
|
|
|
05/31/2017 |
|
|
|
06/15/2017 |
|
June 2017 |
|
|
|
$0.06 |
|
|
|
06/30/2017 |
|
|
|
07/17/2017 |
Conference Call
All interested parties can listen to the live conference call webcast at 9:30 AM ET on Tuesday, May 2, 2017 from the investor relations section of the IRT website at www.irtliving.com or by dialing 1.844.775.2542, access code 6292257. For those who are not available to listen to the live call, the replay will be available shortly following the live call from the investor relations section of IRT’s website and telephonically until Tuesday, May 9, 2017, by dialing 855.859.2056, access code 6292257.
6
IRT produces supplemental information that includes details regarding the performance of the portfolio, financial information, non-GAAP financial measures, same-store information and other useful information for investors. The supplemental information is available via the Company's website, www.irtliving.com, through the "Investor Relations" section.
About Independence Realty Trust, Inc.
Independence Realty Trust, Inc. (NYSE MKT: IRT) is an internally-managed real estate investment trust that seeks to own well-located apartment properties in geographic submarkets that it believes support strong occupancy and the potential for growth in rental rates. IRT seeks to provide stockholders with attractive risk-adjusted returns, with an emphasis on distributions and capital appreciation. As of March 31, 2017, IRT’s portfolio consists of 47 properties with 13,198 apartment units located in 16 states.
7
This press release may contain certain forward-looking statements within the meaning of Section 27A of the Securities Act of 1933, as amended, and Section 21E of the Securities Exchange Act of 1934, as amended. Such forward-looking statements can generally be identified by our use of forward-looking terminology such as “may,” “will,” “expect,” “intend,” “anticipate,” “estimate,” “believe,” “seek,” “outlook,” “assumption,” “projected,” “strategy”, “guidance” or other similar words. Because such statements include risks, uncertainties and contingencies, actual results may differ materially from the expectations, intentions, beliefs, plans or predictions of the future expressed or implied by such forward-looking statements. These forward looking statements are based upon the current beliefs and expectations of IRT’s management and are inherently subject to significant business, economic and competitive uncertainties and contingencies, many of which are difficult to predict and generally not within IRT’s control. In addition, these forward-looking statements are subject to assumptions with respect to future business strategies and decisions that are subject to change. Such forward-looking statements include, but are not limited to, IRT’s previously provided 2017 EPS and CFFO guidance, including, without limitation, future projected EPS and CFFO per diluted share allocated to common shareholders; the assumptions underlying such guidance, including, without limitation, information concerning the assumed same store communities, including, without limitation, the number of properties/units, property revenue growth, controllable property operating expense growth, real estate tax and insurance expense increase, property NOI growth, the level of corporate expenses, the assumed level of transaction/investment volume and the level of capital expenditures; the anticipated benefits and the expected financial impact of IRT’s internalization of its management, including, without limitation, any anticipated annual expense savings. These statements are not guarantees of future performance and involve certain risks, uncertainties and assumptions that are difficult to predict. Although IRT believes the expectations reflected in any forward-looking statements are based on reasonable assumptions, IRT can give no assurance that IRT’s expectations will be attained and therefore, actual outcomes and results may differ materially from what is expressed or forecasted in such forward looking statements. Some of the factors that may affect outcomes and results include, but are not limited to: whether IRT will be able to sell its Class C communities and use the proceeds to acquire higher quality communities, whether the previously provided assumptions underlying the guidance and projections previously provided in this press release can be achieved, including, without limitation, whether IRT’s 2017 same store portfolio of communities will perform with respect to the identified metrics within the assumed ranges, whether IRT will keep the identified corporate expenses within the assumed range, whether the transaction/investment volume for acquisitions and dispositions will be in the assumed range, and whether the capital expenditures will be within the assumed range; whether the anticipated benefits and financial performance resulting from internalization will be achieved, including, without limitation, the expected cost savings; national, regional and local economic climates; changes in financial markets and interest rates, or to the business or financial condition of IRT; changes in market demand for rental apartment homes and competitive pricing from projected apartment industry dynamics, demographic and employment information; IRT’s maintenance of real estate investment trust (“REIT”) status; availability of financing and capital; dividends are subject to the discretion of IRT’s Board of Directors, and will depend on IRT’s financial condition, results of operations, capital requirements, compliance with applicable laws and agreements and any other factors deemed relevant by IRT’s Board; risks associated with pursuing additional strategic acquisitions, including risks associated with the need to raise additional capital to fund the acquisitions; and those additional risks and factors discussed in reports filed with the Securities and Exchange Commission (“SEC”) by IRT from time to time, including those discussed under the heading “Risk Factors” in IRT’s most recently filed reports on Forms 10-K and 10-Q. IRT undertakes no obligation to update these forward-looking statements to reflect events or circumstances after the date hereof or to reflect the occurrence of unanticipated events, except as may be required by law.
Independence Realty Trust, Inc. Contact
Andres Viroslav
215.207.2100
aviroslav@irtliving.com
8
|
|
|
For the Three Months Ended |
|
|
|||||||||||||||||
|
|
|
March 31, 2017 |
|
|
December 31, 2016 |
|
|
September 30, 2016 |
|
|
June 30, 2016 |
|
|
March 31, 2016 |
|
|
|||||
|
Selected Financial Information: |
|
|
|
|
|
|
|
|
|
|
|
|
|
|
|
|
|
|
|
|
|
|
Operating Statistics: |
|
|
|
|
|
|
|
|
|
|
|
|
|
|
|
|
|
|
|
|
|
|
Net income available to common shares |
|
$ |
4,077 |
|
|
$ |
(40,980 |
) |
|
$ |
2,267 |
|
|
$ |
28,987 |
|
|
$ |
(75 |
) |
|
|
Earnings (loss) per share -- diluted |
|
$ |
0.06 |
|
|
$ |
(0.61 |
) |
|
$ |
0.05 |
|
|
$ |
0.61 |
|
|
$ |
- |
|
|
|
Total property revenue |
|
$ |
38,895 |
|
|
$ |
38,002 |
|
|
$ |
38,364 |
|
|
$ |
38,327 |
|
|
$ |
38,666 |
|
|
|
Total property operating expenses |
|
$ |
15,992 |
|
|
$ |
15,560 |
|
|
$ |
16,107 |
|
|
$ |
15,623 |
|
|
$ |
15,858 |
|
|
|
Net operating income |
|
$ |
22,903 |
|
|
$ |
22,442 |
|
|
$ |
22,257 |
|
|
$ |
22,704 |
|
|
$ |
22,808 |
|
|
|
NOI margin |
|
|
58.9 |
% |
|
|
59.1 |
% |
|
|
58.0 |
% |
|
|
59.2 |
% |
|
|
59.0 |
% |
|
|
Adjusted EBITDA |
|
$ |
19,512 |
|
|
$ |
18,544 |
|
|
$ |
18,373 |
|
|
$ |
18,688 |
|
|
$ |
18,924 |
|
|
|
FFO per share -- diluted |
|
$ |
0.17 |
|
|
$ |
(0.50 |
) |
|
$ |
0.20 |
|
|
$ |
0.18 |
|
|
$ |
0.18 |
|
|
|
CORE FFO per share -- diluted |
|
$ |
0.18 |
|
|
$ |
0.17 |
|
|
$ |
0.21 |
|
|
$ |
0.22 |
|
|
$ |
0.21 |
|
|
|
Dividends per share |
|
$ |
0.18 |
|
|
$ |
0.18 |
|
|
$ |
0.18 |
|
|
$ |
0.18 |
|
|
$ |
0.18 |
|
|
|
CORE FFO payout ratio |
|
|
100.0 |
% |
|
|
105.9 |
% |
|
|
85.7 |
% |
|
|
81.8 |
% |
|
|
85.7 |
% |
|
|
Portfolio Data: |
|
|
|
|
|
|
|
|
|
|
|
|
|
|
|
|
|
|
|
|
|
|
Total gross assets |
|
$ |
1,390,589 |
|
|
$ |
1,370,243 |
|
|
$ |
1,374,353 |
|
|
$ |
1,368,217 |
|
|
$ |
1,404,359 |
|
|
|
Total number of properties |
|
|
47 |
|
|
|
46 |
|
|
|
46 |
|
|
|
46 |
|
|
|
48 |
|
|
|
Total units |
|
|
13,198 |
|
|
|
12,982 |
|
|
|
12,982 |
|
|
|
12,982 |
|
|
|
13,502 |
|
|
|
Period end occupancy |
|
|
94.7 |
% |
|
|
94.5 |
% |
|
|
94.3 |
% |
|
|
93.7 |
% |
|
|
94.2 |
% |
|
|
Total portfolio average occupancy |
|
|
93.8 |
% |
|
|
93.8 |
% |
|
|
94.1 |
% |
|
|
94.4 |
% |
|
|
93.5 |
% |
|
|
Total portfolio average effective monthly rent, per unit |
|
$ |
978 |
|
|
$ |
977 |
|
|
$ |
977 |
|
|
$ |
961 |
|
|
$ |
952 |
|
|
|
Same store period end occupancy (a) |
|
|
94.8 |
% |
|
|
93.9 |
% |
|
|
93.7 |
% |
|
|
94.3 |
% |
|
|
93.7 |
% |
|
|
Same store portfolio average occupancy (a) |
|
|
93.9 |
% |
|
|
93.7 |
% |
|
|
94.3 |
% |
|
|
94.4 |
% |
|
|
92.9 |
% |
|
|
Same store portfolio average effective monthly rent, per unit (a) |
|
$ |
1,007 |
|
|
$ |
998 |
|
|
$ |
999 |
|
|
$ |
981 |
|
|
$ |
971 |
|
|
|
Capitalization: |
|
|
|
|
|
|
|
|
|
|
|
|
|
|
|
|
|
|
|
|
|
|
Total debt |
|
$ |
765,695 |
|
|
$ |
743,817 |
|
|
$ |
880,581 |
|
|
$ |
880,288 |
|
|
$ |
940,336 |
|
|
|
Common share price, period end |
|
$ |
9.37 |
|
|
$ |
8.92 |
|
|
$ |
9.00 |
|
|
$ |
8.18 |
|
|
$ |
7.12 |
|
|
|
Market equity capitalization |
|
$ |
674,591 |
|
|
$ |
641,393 |
|
|
$ |
453,823 |
|
|
$ |
412,493 |
|
|
$ |
358,913 |
|
|
|
Total market capitalization |
|
$ |
1,440,286 |
|
|
$ |
1,385,210 |
|
|
$ |
1,334,404 |
|
|
$ |
1,292,781 |
|
|
$ |
1,299,249 |
|
|
|
Total debt/total gross assets |
|
|
55.1 |
% |
|
|
54.3 |
% |
|
|
64.1 |
% |
|
|
64.3 |
% |
|
|
67.0 |
% |
|
|
Net debt to adjusted EBITDA |
|
|
9.7 |
x |
|
|
9.7 |
x |
|
|
11.6 |
x |
|
|
11.4 |
x |
|
|
12.1 |
x |
|
|
Interest coverage |
|
|
2.6 |
x |
|
|
2.4 |
x |
|
|
2.1 |
x |
|
|
2.1 |
x |
|
|
1.9 |
x |
|
|
Common shares and OP Units: |
|
|
|
|
|
|
|
|
|
|
|
|
|
|
|
|
|
|
|
|
|
|
Shares outstanding |
|
|
69,125,681 |
|
|
|
68,996,070 |
|
|
|
47,509,731 |
|
|
|
47,476,250 |
|
|
|
47,458,250 |
|
|
|
OP units outstanding |
|
|
2,869,050 |
|
|
|
2,908,949 |
|
|
|
2,915,008 |
|
|
|
2,950,816 |
|
|
|
2,950,816 |
|
|
|
Common shares and OP units outstanding |
|
|
71,994,731 |
|
|
|
71,905,019 |
|
|
|
50,424,739 |
|
|
|
50,427,066 |
|
|
|
50,409,066 |
|
|
|
Weighted average common shares and units |
|
|
71,656,205 |
|
|
|
70,036,948 |
|
|
|
50,229,637 |
|
|
|
50,134,620 |
|
|
|
50,113,693 |
|
|
|
(a) |
Same store portfolio consists of 42 properties which represents 11,676 units. |
9
Dollars in thousands, except per share data
|
|
|
As of |
|
|||||||||||||||||
|
|
|
March 31, 2017 |
|
|
December 31, 2016 |
|
|
September 30, 2016 |
|
|
June 30, 2016 |
|
|
March 31, 2016 |
|
|||||
|
Assets |
|
|
|
|
|
|
|
|
|
|
|
|
|
|
|
|
|
|
|
|
|
Investments in real estate at cost |
|
$ |
1,280,840 |
|
|
$ |
1,249,356 |
|
|
$ |
1,316,725 |
|
|
$ |
1,314,115 |
|
|
$ |
1,357,338 |
|
|
Less: accumulated depreciation |
|
|
(59,055 |
) |
|
|
(51,511 |
) |
|
|
(52,824 |
) |
|
|
(45,059 |
) |
|
|
(44,422 |
) |
|
Investments in real estate, net |
|
|
1,221,785 |
|
|
|
1,197,845 |
|
|
|
1,263,901 |
|
|
|
1,269,056 |
|
|
|
1,312,916 |
|
|
Real estate held for sale |
|
|
61,102 |
|
|
|
60,786 |
|
|
|
- |
|
|
|
- |
|
|
|
- |
|
|
Cash and cash equivalents |
|
|
10,065 |
|
|
|
20,892 |
|
|
|
29,247 |
|
|
|
28,051 |
|
|
|
21,924 |
|
|
Restricted cash |
|
|
5,575 |
|
|
|
5,518 |
|
|
|
8,028 |
|
|
|
6,779 |
|
|
|
7,015 |
|
|
Accounts receivable and other assets |
|
|
3,794 |
|
|
|
5,211 |
|
|
|
5,066 |
|
|
|
3,985 |
|
|
|
2,795 |
|
|
Derivative assets |
|
|
4,292 |
|
|
|
3,867 |
|
|
|
- |
|
|
|
- |
|
|
|
- |
|
|
Intangible assets, net |
|
|
373 |
|
|
|
118 |
|
|
|
- |
|
|
|
- |
|
|
|
- |
|
|
Total assets |
|
$ |
1,306,986 |
|
|
$ |
1,294,237 |
|
|
$ |
1,306,242 |
|
|
$ |
1,307,871 |
|
|
$ |
1,344,650 |
|
|
Liabilities and Equity |
|
|
|
|
|
|
|
|
|
|
|
|
|
|
|
|
|
|
|
|
|
Total indebtedness |
|
$ |
765,695 |
|
|
$ |
743,817 |
|
|
$ |
880,581 |
|
|
$ |
880,288 |
|
|
$ |
940,336 |
|
|
Accounts payable and accrued expenses |
|
|
13,154 |
|
|
|
14,028 |
|
|
|
22,231 |
|
|
|
17,807 |
|
|
|
16,089 |
|
|
Accrued interest payable |
|
|
540 |
|
|
|
491 |
|
|
|
830 |
|
|
|
701 |
|
|
|
1,175 |
|
|
Dividends payable |
|
|
4,301 |
|
|
|
4,297 |
|
|
|
3,009 |
|
|
|
3,009 |
|
|
|
3,007 |
|
|
Derivative liabilities |
|
|
— |
|
|
|
— |
|
|
|
696 |
|
|
|
1,163 |
|
|
|
— |
|
|
Other liabilities |
|
|
2,952 |
|
|
|
2,913 |
|
|
|
2,857 |
|
|
|
2,955 |
|
|
|
3,071 |
|
|
Total liabilities |
|
|
786,642 |
|
|
|
765,546 |
|
|
|
910,204 |
|
|
|
905,923 |
|
|
|
963,678 |
|
|
Equity |
|
|
|
|
|
|
|
|
|
|
|
|
|
|
|
|
|
|
|
|
|
Shareholders' Equity: |
|
|
|
|
|
|
|
|
|
|
|
|
|
|
|
|
|
|
|
|
|
Preferred shares, $0.01 par value per share |
|
|
— |
|
|
|
— |
|
|
|
— |
|
|
|
— |
|
|
|
— |
|
|
Common shares, $0.01 par value per share |
|
|
691 |
|
|
|
690 |
|
|
|
475 |
|
|
|
475 |
|
|
|
475 |
|
|
Additional paid in capital |
|
|
565,006 |
|
|
|
564,633 |
|
|
|
381,106 |
|
|
|
380,532 |
|
|
|
380,152 |
|
|
Accumulated other comprehensive income (loss) |
|
|
4,097 |
|
|
|
3,683 |
|
|
|
(727 |
) |
|
|
(1,195 |
) |
|
|
(26 |
) |
|
Retained earnings (deficit) |
|
|
(70,608 |
) |
|
|
(62,181 |
) |
|
|
(8,833 |
) |
|
|
(2,601 |
) |
|
|
(23,094 |
) |
|
Total shareholders' equity |
|
|
499,186 |
|
|
|
506,825 |
|
|
|
372,021 |
|
|
|
377,211 |
|
|
|
357,507 |
|
|
Noncontrolling Interests |
|
|
21,158 |
|
|
|
21,866 |
|
|
|
24,017 |
|
|
|
24,737 |
|
|
|
23,465 |
|
|
Total equity |
|
|
520,344 |
|
|
|
528,691 |
|
|
|
396,038 |
|
|
|
401,948 |
|
|
|
380,972 |
|
|
Total liabilities and equity |
|
$ |
1,306,986 |
|
|
$ |
1,294,237 |
|
|
$ |
1,306,242 |
|
|
$ |
1,307,871 |
|
|
$ |
1,344,650 |
|
10
STATEMENTS OF OPERATIONS, FFO & CORE FFO
TRAILING 5 QUARTERS
Dollars in thousands, except per share data
|
|
|
For the Three Months Ended |
|
|||||||||||||||||
|
|
|
March 31, 2017 |
|
|
December 31, 2016 |
|
|
September 30, 2016 |
|
|
June 30, 2016 |
|
|
March 31, 2016 |
|
|||||
|
Revenue: |
|
|
|
|
|
|
|
|
|
|
|
|
|
|
|
|
|
|
|
|
|
Rental income |
|
$ |
34,737 |
|
|
$ |
34,145 |
|
|
$ |
34,333 |
|
|
$ |
34,185 |
|
|
$ |
34,753 |
|
|
Reimbursement and other property income |
|
|
4,158 |
|
|
|
3,857 |
|
|
|
4,031 |
|
|
|
4,142 |
|
|
|
3,913 |
|
|
Total property revenue |
|
|
38,895 |
|
|
|
38,002 |
|
|
|
38,364 |
|
|
|
38,327 |
|
|
|
38,666 |
|
|
Property management and other income |
|
|
247 |
|
|
|
29 |
|
|
|
- |
|
|
|
- |
|
|
|
- |
|
|
Total revenue |
|
|
39,142 |
|
|
|
38,031 |
|
|
|
38,364 |
|
|
|
38,327 |
|
|
|
38,666 |
|
|
Expenses: |
|
|
|
|
|
|
|
|
|
|
|
|
|
|
|
|
|
|
|
|
|
Real estate operating expenses |
|
|
15,992 |
|
|
|
15,560 |
|
|
|
16,107 |
|
|
|
15,623 |
|
|
|
15,858 |
|
|
Property management expenses |
|
|
1,538 |
|
|
|
1,137 |
|
|
|
1,219 |
|
|
|
1,229 |
|
|
|
1,262 |
|
|
General and administrative expenses |
|
|
2,100 |
|
|
|
2,790 |
|
|
|
2,665 |
|
|
|
2,787 |
|
|
|
2,622 |
|
|
Acquisition and integration expenses |
|
|
122 |
|
|
|
6 |
|
|
|
19 |
|
|
|
8 |
|
|
|
10 |
|
|
Depreciation and amortization expense |
|
|
7,607 |
|
|
|
7,897 |
|
|
|
7,765 |
|
|
|
7,635 |
|
|
|
11,527 |
|
|
Total expenses |
|
|
27,359 |
|
|
|
27,390 |
|
|
|
27,775 |
|
|
|
27,282 |
|
|
|
31,279 |
|
|
Operating Income (loss) |
|
|
11,783 |
|
|
|
10,641 |
|
|
|
10,589 |
|
|
|
11,045 |
|
|
|
7,387 |
|
|
Interest expense |
|
|
(7,448 |
) |
|
|
(7,720 |
) |
|
|
(8,820 |
) |
|
|
(9,018 |
) |
|
|
(9,977 |
) |
|
Other income (expense) |
|
|
(5 |
) |
|
|
(2 |
) |
|
|
(2 |
) |
|
|
— |
|
|
|
— |
|
|
Net gains (losses) on sale of assets |
|
|
(85 |
) |
|
|
3 |
|
|
|
(1 |
) |
|
|
29,321 |
|
|
|
2,453 |
|
|
Gains (losses) on extinguishment of debt |
|
|
— |
|
|
|
(652 |
) |
|
|
— |
|
|
|
(558 |
) |
|
|
— |
|
|
Gains (losses) on TSRE merger and property acquisitions |
|
|
— |
|
|
|
— |
|
|
|
641 |
|
|
|
— |
|
|
|
91 |
|
|
Management internalization expense |
|
|
— |
|
|
|
(44,976 |
) |
|
|
— |
|
|
|
— |
|
|
|
— |
|
|
Net income (loss) |
|
|
4,245 |
|
|
|
(42,706 |
) |
|
|
2,407 |
|
|
|
30,790 |
|
|
|
(46 |
) |
|
(Income) loss allocated to noncontrolling interests |
|
|
(168 |
) |
|
|
1,726 |
|
|
|
(140 |
) |
|
|
(1,803 |
) |
|
|
(29 |
) |
|
Net income (loss) available to common shares |
|
$ |
4,077 |
|
|
$ |
(40,980 |
) |
|
$ |
2,267 |
|
|
$ |
28,987 |
|
|
$ |
(75 |
) |
|
EPS - basic |
|
$ |
0.06 |
|
|
$ |
(0.61 |
) |
|
$ |
0.05 |
|
|
$ |
0.61 |
|
|
$ |
- |
|
|
Weighted-average shares outstanding - Basic |
|
|
68,787,155 |
|
|
|
67,126,993 |
|
|
|
47,215,918 |
|
|
|
47,183,804 |
|
|
|
47,093,343 |
|
|
EPS - diluted |
|
$ |
0.06 |
|
|
$ |
(0.61 |
) |
|
$ |
0.05 |
|
|
$ |
0.61 |
|
|
$ |
- |
|
|
Weighted-average shares outstanding - Diluted |
|
|
68,958,786 |
|
|
|
67,126,993 |
|
|
|
47,314,629 |
|
|
|
47,229,736 |
|
|
|
47,093,343 |
|
|
Funds From Operations (FFO): |
|
|
|
|
|
|
|
|
|
|
|
|
|
|
|
|
|
|
|
|
|
Net Income (loss) |
|
$ |
4,245 |
|
|
$ |
(42,706 |
) |
|
$ |
2,407 |
|
|
$ |
30,790 |
|
|
$ |
(46 |
) |
|
Add-Back (Deduct): |
|
|
|
|
|
|
|
|
|
|
|
|
|
|
|
|
|
|
|
|
|
Depreciation |
|
|
7,595 |
|
|
|
7,897 |
|
|
|
7,765 |
|
|
|
7,635 |
|
|
|
11,527 |
|
|
Net (gains) losses on sale of assets |
|
|
85 |
|
|
|
(3 |
) |
|
|
1 |
|
|
|
(29,321 |
) |
|
|
(2,453 |
) |
|
FFO |
|
$ |
11,925 |
|
|
$ |
(34,812 |
) |
|
$ |
10,173 |
|
|
$ |
9,104 |
|
|
$ |
9,028 |
|
|
FFO per share--diluted |
|
$ |
0.17 |
|
|
$ |
(0.50 |
) |
|
$ |
0.20 |
|
|
$ |
0.18 |
|
|
$ |
0.18 |
|
|
CORE Funds From Operations (CFFO): |
|
|
|
|
|
|
|
|
|
|
|
|
|
|
|
|
|
|
|
|
|
FFO |
|
$ |
11,925 |
|
|
$ |
(34,812 |
) |
|
$ |
10,173 |
|
|
$ |
9,104 |
|
|
$ |
9,028 |
|
|
Add-Back (Deduct): |
|
|
|
|
|
|
|
|
|
|
|
|
|
|
|
|
|
|
|
|
|
Stock compensation expense |
|
|
388 |
|
|
|
390 |
|
|
|
247 |
|
|
|
380 |
|
|
|
205 |
|
|
Amortization of deferred financing costs |
|
|
519 |
|
|
|
521 |
|
|
|
597 |
|
|
|
749 |
|
|
|
1,197 |
|
|
Acquisition and integration expenses |
|
|
122 |
|
|
|
6 |
|
|
|
19 |
|
|
|
8 |
|
|
|
10 |
|
|
Other depreciation and amortization |
|
|
12 |
|
|
|
— |
|
|
|
— |
|
|
|
— |
|
|
|
— |
|
|
(Gains) losses on extinguishment of debt |
|
|
— |
|
|
|
652 |
|
|
|
— |
|
|
|
558 |
|
|
|
— |
|
|
Management internalization expense |
|
|
— |
|
|
|
44,976 |
|
|
|
— |
|
|
|
— |
|
|
|
— |
|
|
(Gains) losses on TSRE merger and property acquisitions |
|
|
— |
|
|
|
— |
|
|
|
(641 |
) |
|
|
— |
|
|
|
(91 |
) |
|
CFFO |
|
$ |
12,966 |
|
|
$ |
11,733 |
|
|
$ |
10,395 |
|
|
$ |
10,799 |
|
|
$ |
10,349 |
|
|
CFFO per share--diluted |
|
$ |
0.18 |
|
|
$ |
0.17 |
|
|
$ |
0.21 |
|
|
$ |
0.22 |
|
|
$ |
0.21 |
|
|
Weighted-average shares and units outstanding |
|
|
71,656,205 |
|
|
|
70,036,948 |
|
|
|
50,229,637 |
|
|
|
50,134,620 |
|
|
|
50,113,693 |
|
11
STATEMENTS OF OPERATIONS, FFO & CORE FFO
THREE MONTHS ENDED MARCH 31, 2017
Dollars in thousands, except per share data
|
|
|
For the Three Months Ended March 31, |
|
|||||
|
|
|
2017 |
|
|
2016 |
|
||
|
Revenue: |
|
|
|
|
|
|
|
|
|
Rental income |
|
$ |
34,737 |
|
|
$ |
34,753 |
|
|
Reimbursement and other property income |
|
|
4,158 |
|
|
|
3,913 |
|
|
Total property revenue |
|
|
38,895 |
|
|
|
38,666 |
|
|
Property management and other income |
|
|
247 |
|
|
|
— |
|
|
Total revenue |
|
|
39,142 |
|
|
|
38,666 |
|
|
Expenses: |
|
|
|
|
|
|
|
|
|
Real estate operating expenses |
|
|
15,992 |
|
|
|
15,858 |
|
|
Property management expenses |
|
|
1,538 |
|
|
|
1,262 |
|
|
General and administrative expenses |
|
|
2,100 |
|
|
|
2,622 |
|
|
Acquisition and integration expenses |
|
|
122 |
|
|
|
10 |
|
|
Depreciation and amortization expense |
|
|
7,607 |
|
|
|
11,527 |
|
|
Total expenses |
|
|
27,359 |
|
|
|
31,279 |
|
|
Operating Income (loss) |
|
|
11,783 |
|
|
|
7,387 |
|
|
Interest expense |
|
|
(7,448 |
) |
|
|
(9,977 |
) |
|
Other income (expense) |
|
|
(5 |
) |
|
|
— |
|
|
Net gains (losses) on sale of assets |
|
|
(85 |
) |
|
|
2,453 |
|
|
Gains (losses) on extinguishment of debt |
|
|
— |
|
|
|
— |
|
|
Gains (losses) on TSRE merger and property acquisitions |
|
|
— |
|
|
|
91 |
|
|
Net income (loss) |
|
|
4,245 |
|
|
|
(46 |
) |
|
(Income) loss allocated to noncontrolling interests |
|
|
(168 |
) |
|
|
(29 |
) |
|
Net income (loss) available to common shares |
|
$ |
4,077 |
|
|
$ |
(75 |
) |
|
EPS - basic |
|
$ |
0.06 |
|
|
$ |
- |
|
|
Weighted-average shares outstanding - Basic |
|
|
68,787,155 |
|
|
|
47,093,343 |
|
|
EPS - diluted |
|
$ |
0.06 |
|
|
$ |
- |
|
|
Weighted-average shares outstanding - Diluted |
|
|
68,958,786 |
|
|
|
47,093,343 |
|
|
|
|
|
|
|
|
|
|
|
|
Funds From Operations (FFO): |
|
|
|
|
|
|
|
|
|
Net Income (loss) |
|
$ |
4,245 |
|
|
$ |
(46 |
) |
|
Adjustments: |
|
|
|
|
|
|
|
|
|
Real estate depreciation and amortization |
|
|
7,595 |
|
|
|
11,527 |
|
|
Net (gains) losses on sale of assets |
|
|
85 |
|
|
|
(2,453 |
) |
|
Funds From Operations |
|
$ |
11,925 |
|
|
$ |
9,028 |
|
|
FFO per share--diluted |
|
$ |
0.17 |
|
|
$ |
0.18 |
|
|
Core Funds From Operations (CFFO): |
|
|
|
|
|
|
|
|
|
Funds From Operations |
|
$ |
11,925 |
|
|
$ |
9,028 |
|
|
Adjustments: |
|
|
|
|
|
|
|
|
|
Stock compensation expense |
|
|
388 |
|
|
|
205 |
|
|
Amortization of deferred financing costs |
|
|
519 |
|
|
|
1,197 |
|
|
Acquisition and integration expenses |
|
|
122 |
|
|
|
10 |
|
|
Other depreciation and amortization |
|
|
12 |
|
|
|
— |
|
|
(Gains) losses on TSRE merger and property acquisitions |
|
|
— |
|
|
|
(91 |
) |
|
Core Funds From Operations |
|
$ |
12,966 |
|
|
$ |
10,349 |
|
|
CFFO per share--diluted |
|
$ |
0.18 |
|
|
$ |
0.21 |
|
|
Weighted-average shares and units outstanding |
|
|
71,656,205 |
|
|
|
50,113,693 |
|
12
ADJUSTED EBITDA RECONCILIATION AND COVERAGE RATIO
Dollars in thousands, except per share data
|
|
|
Three Months Ended |
|
|||||||||||||||||
|
ADJUSTED EBITDA: |
|
March 31, 2017 |
|
|
December 31, 2016 |
|
|
September 30, 2016 |
|
|
June 30, 2016 |
|
|
March 31, 2016 |
|
|||||
|
Net income (loss) |
|
$ |
4,245 |
|
|
$ |
(42,706 |
) |
|
$ |
2,407 |
|
|
$ |
30,790 |
|
|
$ |
(46 |
) |
|
Add-Back (Deduct): |
|
|
|
|
|
|
|
|
|
|
|
|
|
|
|
|
|
|
|
|
|
Depreciation and amortization |
|
|
7,607 |
|
|
|
7,897 |
|
|
|
7,765 |
|
|
|
7,635 |
|
|
|
11,527 |
|
|
Interest expense |
|
|
7,448 |
|
|
|
7,720 |
|
|
|
8,820 |
|
|
|
9,018 |
|
|
|
9,977 |
|
|
Other (income) expense |
|
|
5 |
|
|
|
2 |
|
|
|
2 |
|
|
|
— |
|
|
|
— |
|
|
Acquisition and integration expenses |
|
|
122 |
|
|
|
6 |
|
|
|
19 |
|
|
|
8 |
|
|
|
10 |
|
|
Net (gains) losses on sale of assets |
|
|
85 |
|
|
|
(3 |
) |
|
|
1 |
|
|
|
(29,321 |
) |
|
|
(2,453 |
) |
|
(Gains) losses on extinguishment of debt |
|
|
— |
|
|
|
652 |
|
|
|
— |
|
|
|
558 |
|
|
|
— |
|
|
Management internalization expense |
|
|
— |
|
|
|
44,976 |
|
|
|
— |
|
|
|
— |
|
|
|
— |
|
|
(Gains) losses on TSRE merger and property acquisitions |
|
|
— |
|
|
|
— |
|
|
|
(641 |
) |
|
|
— |
|
|
|
(91 |
) |
|
Adjusted EBITDA |
|
$ |
19,512 |
|
|
$ |
18,544 |
|
|
$ |
18,373 |
|
|
$ |
18,688 |
|
|
$ |
18,924 |
|
|
|
|
|
|
|
|
|
|
|
|
|
|
|
|
|
|
|
|
|
|
|
|
INTEREST COST: |
|
|
|
|
|
|
|
|
|
|
|
|
|
|
|
|
|
|
|
|
|
Interest expense |
|
$ |
7,448 |
|
|
$ |
7,720 |
|
|
$ |
8,820 |
|
|
$ |
9,018 |
|
|
$ |
9,977 |
|
|
|
|
|
|
|
|
|
|
|
|
|
|
|
|
|
|
|
|
|
|
|
|
INTEREST COVERAGE: |
|
|
2.6 |
x |
|
|
2.4 |
x |
|
|
2.1 |
x |
|
|
2.1 |
x |
|
|
1.9 |
x |
13
SAME STORE PORTFOLIO NET OPERATING INCOME
TRAILING 5 QUARTERS
Dollars in thousands, except per share data
|
|
|
For the Three-Months Ended (a) |
|
|||||||||||||||||
|
|
|
March 31, 2017 |
|
|
December 31, 2016 |
|
|
September 30, 2016 |
|
|
June 30, 2016 |
|
|
March 31, 2016 |
|
|||||
|
Revenue: |
|
|
|
|
|
|
|
|
|
|
|
|
|
|
|
|
|
|
|
|
|
Rental income |
|
$ |
31,762 |
|
|
$ |
31,456 |
|
|
$ |
31,698 |
|
|
$ |
31,135 |
|
|
$ |
30,480 |
|
|
Reimbursement and other property income |
|
|
3,719 |
|
|
|
3,476 |
|
|
|
3,645 |
|
|
|
3,610 |
|
|
|
3,385 |
|
|
Total revenue |
|
|
35,481 |
|
|
|
34,932 |
|
|
|
35,343 |
|
|
|
34,745 |
|
|
|
33,865 |
|
|
Operating Expenses: |
|
|
|
|
|
|
|
|
|
|
|
|
|
|
|
|
|
|
|
|
|
Real estate taxes |
|
|
4,381 |
|
|
|
4,193 |
|
|
|
4,280 |
|
|
|
4,277 |
|
|
|
4,288 |
|
|
Property insurance |
|
|
820 |
|
|
|
796 |
|
|
|
748 |
|
|
|
764 |
|
|
|
742 |
|
|
Personnel expenses |
|
|
3,400 |
|
|
|
3,376 |
|
|
|
3,449 |
|
|
|
3,296 |
|
|
|
3,293 |
|
|
Utilities |
|
|
2,223 |
|
|
|
2,235 |
|
|
|
2,280 |
|
|
|
2,061 |
|
|
|
2,199 |
|
|
Repairs and maintenance |
|
|
1,233 |
|
|
|
1,194 |
|
|
|
1,460 |
|
|
|
1,339 |
|
|
|
1,017 |
|
|
Contract services |
|
|
1,043 |
|
|
|
1,029 |
|
|
|
1,060 |
|
|
|
1,105 |
|
|
|
1,089 |
|
|
Advertising expenses |
|
|
382 |
|
|
|
395 |
|
|
|
399 |
|
|
|
403 |
|
|
|
396 |
|
|
Other expenses |
|
|
791 |
|
|
|
703 |
|
|
|
844 |
|
|
|
721 |
|
|
|
689 |
|
|
Total operating expenses |
|
|
14,273 |
|
|
|
13,921 |
|
|
|
14,520 |
|
|
|
13,966 |
|
|
|
13,713 |
|
|
Same-store net operating income (a) |
|
$ |
21,208 |
|
|
$ |
21,011 |
|
|
$ |
20,823 |
|
|
$ |
20,779 |
|
|
$ |
20,152 |
|
|
Same-store NOI margin |
|
|
59.8 |
% |
|
|
60.1 |
% |
|
|
58.9 |
% |
|
|
59.8 |
% |
|
|
59.5 |
% |
|
Average occupancy |
|
|
93.9 |
% |
|
|
93.2 |
% |
|
|
93.5 |
% |
|
|
93.9 |
% |
|
|
92.9 |
% |
|
Average effective monthly rent, per unit |
|
$ |
1,007 |
|
|
$ |
998 |
|
|
$ |
999 |
|
|
$ |
981 |
|
|
$ |
971 |
|
|
Reconciliation of same-store net operating income to net income (loss) |
|
|
|
|
|
|
|
|
|
|
|
|
|
|
|
|
|
|
|
|
|
Same-store net operating income |
|
$ |
21,208 |
|
|
$ |
21,011 |
|
|
$ |
20,823 |
|
|
$ |
20,779 |
|
|
$ |
20,152 |
|
|
Non same-store net operating income |
|
|
1,695 |
|
|
|
1,431 |
|
|
|
1,434 |
|
|
|
1,925 |
|
|
|
2,656 |
|
|
Property management income |
|
|
247 |
|
|
|
29 |
|
|
|
— |
|
|
|
— |
|
|
|
— |
|
|
Property management expenses |
|
|
(1,538 |
) |
|
|
(1,137 |
) |
|
|
(1,219 |
) |
|
|
(1,229 |
) |
|
|
(1,262 |
) |
|
General and administrative expenses |
|
|
(2,100 |
) |
|
|
(2,790 |
) |
|
|
(2,665 |
) |
|
|
(2,787 |
) |
|
|
(2,622 |
) |
|
Acquisition and integration expenses |
|
|
(122 |
) |
|
|
(6 |
) |
|
|
(19 |
) |
|
|
(8 |
) |
|
|
(10 |
) |
|
Depreciation and amortization expense |
|
|
(7,607 |
) |
|
|
(7,897 |
) |
|
|
(7,765 |
) |
|
|
(7,635 |
) |
|
|
(11,527 |
) |
|
Interest expense |
|
|
(7,448 |
) |
|
|
(7,720 |
) |
|
|
(8,820 |
) |
|
|
(9,018 |
) |
|
|
(9,977 |
) |
|
Other income (expense) |
|
|
(5 |
) |
|
|
(2 |
) |
|
|
(2 |
) |
|
|
— |
|
|
|
— |
|
|
Net gains (losses) on sale of assets |
|
|
(85 |
) |
|
|
3 |
|
|
|
(1 |
) |
|
|
29,321 |
|
|
|
2,453 |
|
|
Gains (losses) on extinguishment of debt |
|
|
— |
|
|
|
(652 |
) |
|
|
— |
|
|
|
(558 |
) |
|
|
— |
|
|
Gains (losses) on TSRE merger and property acquisitions |
|
|
— |
|
|
|
— |
|
|
|
641 |
|
|
|
— |
|
|
|
91 |
|
|
Management internalization expense |
|
|
— |
|
|
|
(44,976 |
) |
|
|
— |
|
|
|
— |
|
|
|
— |
|
|
Net income (loss) |
|
$ |
4,245 |
|
|
$ |
(42,706 |
) |
|
$ |
2,407 |
|
|
$ |
30,790 |
|
|
$ |
(46 |
) |
|
(a) |
Same store portfolio consists of 42 properties which represents 11,676 units. |
14
SAME STORE PORTFOLIO NET OPERATING INCOME
THREE MONTHS ENDED MARCH 31, 2017
Dollars in thousands, except per share data
|
|
|
Three-Months Ended March 31 |
|
|||||||||
|
|
|
2017 |
|
|
2016 |
|
|
% change |
|
|||
|
Revenue: |
|
|
|
|
|
|
|
|
|
|
|
|
|
Rental income |
|
$ |
31,762 |
|
|
$ |
30,480 |
|
|
|
4.2 |
% |
|
Reimbursement and other property income |
|
|
3,719 |
|
|
|
3,385 |
|
|
|
9.9 |
% |
|
Total revenue |
|
|
35,481 |
|
|
|
33,865 |
|
|
|
4.8 |
% |
|
Operating Expenses: |
|
|
|
|
|
|
|
|
|
|
|
|
|
Real estate taxes |
|
|
4,381 |
|
|
|
4,288 |
|
|
|
2.2 |
% |
|
Property insurance |
|
|
820 |
|
|
|
742 |
|
|
|
10.5 |
% |
|
Personnel expenses |
|
|
3,400 |
|
|
|
3,293 |
|
|
|
3.2 |
% |
|
Utilities |
|
|
2,223 |
|
|
|
2,199 |
|
|
|
1.1 |
% |
|
Repairs and maintenance |
|
|
1,233 |
|
|
|
1,017 |
|
|
|
21.2 |
% |
|
Contract services |
|
|
1,043 |
|
|
|
1,089 |
|
|
|
-4.2 |
% |
|
Advertising expenses |
|
|
382 |
|
|
|
396 |
|
|
|
-3.5 |
% |
|
Other expenses |
|
|
791 |
|
|
|
689 |
|
|
|
14.8 |
% |
|
Total operating expenses |
|
|
14,273 |
|
|
|
13,713 |
|
|
|
4.1 |
% |
|
Same-store net operating income (a) |
|
$ |
21,208 |
|
|
$ |
20,152 |
|
|
|
5.2 |
% |
|
Same-store NOI margin |
|
|
59.8 |
% |
|
|
59.5 |
% |
|
|
0.3 |
% |
|
Average occupancy |
|
|
93.9 |
% |
|
|
92.9 |
% |
|
|
1.0 |
% |
|
Average effective monthly rent, per unit |
|
$ |
1,007 |
|
|
$ |
971 |
|
|
|
3.7 |
% |
|
Reconciliation of same-store net operating income to net income (loss) |
|
|
|
|
|
|
|
|
|
|
|
|
|
Same-store portfolio net operating income |
|
$ |
21,208 |
|
|
$ |
20,152 |
|
|
|
|
|
|
Non same-store net operating income |
|
|
1,695 |
|
|
|
2,656 |
|
|
|
|
|
|
Property management income |
|
|
247 |
|
|
|
— |
|
|
|
|
|
|
Property management expenses |
|
|
(1,538 |
) |
|
|
(1,262 |
) |
|
|
|
|
|
General and administrative expenses |
|
|
(2,100 |
) |
|
|
(2,622 |
) |
|
|
|
|
|
Acquisition and integration expenses |
|
|
(122 |
) |
|
|
(10 |
) |
|
|
|
|
|
Depreciation and amortization expense |
|
|
(7,607 |
) |
|
|
(11,527 |
) |
|
|
|
|
|
Interest expense |
|
|
(7,448 |
) |
|
|
(9,977 |
) |
|
|
|
|
|
Other income (expense) |
|
|
(5 |
) |
|
|
— |
|
|
|
|
|
|
Net gains (losses) on sale of assets |
|
|
(85 |
) |
|
|
2,453 |
|
|
|
|
|
|
Gains (losses) on TSRE merger and property acquisitions |
|
|
— |
|
|
|
91 |
|
|
|
|
|
|
Net income (loss) |
|
$ |
4,245 |
|
|
$ |
(46 |
) |
|
|
|
|
|
|
(a) |
Same store portfolio consists of 42 properties which represents 11,676 units. |
15
NET OPERATING INCOME (NOI) BRIDGE
Dollars in thousands, except per share data
|
|
|
For the Three-Months Ended |
|
|||||||||||||||||
|
|
|
March 31, 2017 |
|
|
December 31, 2016 |
|
|
September 30, 2016 |
|
|
June 30, 2016 |
|
|
March 31, 2016 |
|
|||||
|
Property revenue |
|
|
|
|
|
|
|
|
|
|
|
|
|
|
|
|
|
|
|
|
|
Same store (a) |
|
$ |
35,481 |
|
|
$ |
34,932 |
|
|
$ |
35,343 |
|
|
$ |
34,745 |
|
|
$ |
33,865 |
|
|
Non same store |
|
|
3,414 |
|
|
|
3,070 |
|
|
|
3,021 |
|
|
|
3,582 |
|
|
|
4,801 |
|
|
Total property revenue |
|
|
38,895 |
|
|
|
38,002 |
|
|
|
38,364 |
|
|
|
38,327 |
|
|
|
38,666 |
|
|
Property expenses |
|
|
|
|
|
|
|
|
|
|
|
|
|
|
|
|
|
|
|
|
|
Same store (a) |
|
|
14,273 |
|
|
|
13,921 |
|
|
|
14,520 |
|
|
|
13,966 |
|
|
|
13,713 |
|
|
Non same store |
|
|
1,719 |
|
|
|
1,639 |
|
|
|
1,587 |
|
|
|
1,657 |
|
|
|
2,145 |
|
|
Total property expenses |
|
|
15,992 |
|
|
|
15,560 |
|
|
|
16,107 |
|
|
|
15,623 |
|
|
|
15,858 |
|
|
Net operating income |
|
|
|
|
|
|
|
|
|
|
|
|
|
|
|
|
|
|
|
|
|
Same store (a) |
|
|
21,208 |
|
|
|
21,011 |
|
|
|
20,823 |
|
|
|
20,779 |
|
|
|
20,152 |
|
|
Non same store |
|
|
1,695 |
|
|
|
1,431 |
|
|
|
1,434 |
|
|
|
1,925 |
|
|
|
2,656 |
|
|
Total property net operating income |
|
$ |
22,903 |
|
|
$ |
22,442 |
|
|
$ |
22,257 |
|
|
$ |
22,704 |
|
|
$ |
22,808 |
|
|
Reconciliation of NOI to net income (loss) |
|
|
|
|
|
|
|
|
|
|
|
|
|
|
|
|
|
|
|
|
|
Total property net operating income |
|
$ |
22,903 |
|
|
$ |
22,442 |
|
|
$ |
22,257 |
|
|
$ |
22,704 |
|
|
$ |
22,808 |
|
|
Property management income |
|
|
247 |
|
|
|
29 |
|
|
|
— |
|
|
|
— |
|
|
|
— |
|
|
Property management expenses |
|
|
(1,538 |
) |
|
|
(1,137 |
) |
|
|
(1,219 |
) |
|
|
(1,229 |
) |
|
|
(1,262 |
) |
|
General and administrative expenses |
|
|
(2,100 |
) |
|
|
(2,790 |
) |
|
|
(2,665 |
) |
|
|
(2,787 |
) |
|
|
(2,622 |
) |
|
Acquisition and integration expenses |
|
|
(122 |
) |
|
|
(6 |
) |
|
|
(19 |
) |
|
|
(8 |
) |
|
|
(10 |
) |
|
Depreciation and amortization expense |
|
|
(7,607 |
) |
|
|
(7,897 |
) |
|
|
(7,765 |
) |
|
|
(7,635 |
) |
|
|
(11,527 |
) |
|
Interest expense |
|
|
(7,448 |
) |
|
|
(7,720 |
) |
|
|
(8,820 |
) |
|
|
(9,018 |
) |
|
|
(9,977 |
) |
|
Other income (expense) |
|
|
(5 |
) |
|
|
(2 |
) |
|
|
(2 |
) |
|
|
— |
|
|
|
— |
|
|
Net gains (losses) on sale of assets |
|
|
(85 |
) |
|
|
3 |
|
|
|
(1 |
) |
|
|
29,321 |
|
|
|
2,453 |
|
|
Gains (losses) on extinguishment on debt |
|
|
— |
|
|
|
(652 |
) |
|
|
— |
|
|
|
(558 |
) |
|
|
— |
|
|
Gains (losses) on TSRE merger and property acquisitions |
|
|
— |
|
|
|
— |
|
|
|
641 |
|
|
|
— |
|
|
|
91 |
|
|
Management internalization expense |
|
|
— |
|
|
|
(44,976 |
) |
|
|
— |
|
|
|
— |
|
|
|
— |
|
|
Net income (loss) |
|
$ |
4,245 |
|
|
$ |
(42,706 |
) |
|
$ |
2,407 |
|
|
$ |
30,790 |
|
|
$ |
(46 |
) |
|
|
|
|
|
|
|
|
|
|
|
|
|
|
|
|
|
|
|
|
|
|
|
(a) |
Same store portfolio consists of 42 properties which represents 11,676 units. |
16
Debt Summary as of March 31, 2017
(Unaudited, in thousands except shares and per share data)
|
|
|
Amount |
|
|
Rate |
|
|
Type |
|
Weighted Average Maturity (in years) |
|
|
|||
|
Debt: |
|
|
|
|
|
|
|
|
|
|
|
|
|
|
|
|
Credit facility (a) |
|
$ |
172,000 |
|
|
|
2.8 |
% |
|
Floating |
|
|
1.5 |
|
|
|
Mortgages-Fixed rate |
|
|
599,553 |
|
|
|
3.8 |
% |
|
Fixed |
|
|
6.5 |
|
|
|
Unamortized deferred financing costs |
|
|
(5,858 |
) |
|
|
|
|
|
|
|
|
|
|
|
|
Total Debt |
|
|
765,695 |
|
|
|
3.6 |
% |
|
|
|
|
5.3 |
|
|
|
Market Equity Capitalization, at period end |
|
|
674,610 |
|
|
|
|
|
|
|
|
|
|
|
|
|
Total Capitalization |
|
$ |
1,440,305 |
|
|
|
|
|
|
|
|
|
|
|
|
|
|
|
|
|
|
||

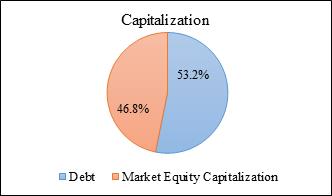

|
(a) |
Credit facility total capacity is $312.5 million, of which $172.0 million was drawn as of March 31, 2017. Credit facility matures on September 17, 2018. This credit facility was refinanced on May 1, 2017 with a new $300.0 million unsecured credit facility. The new facility is comprised of a $50.0 million term loan and a revolving commitment of up to $250.0 million. The maturity date on the new term loan is May 1, 2022 and the maturity date on borrowings outstanding under the revolving commitment is May 1, 2021. |
|
(b) |
As of March 31, 2017, IRT maintained a float-to-fixed interest swap with a $150.0 million notional. This swap, which expires on June 17, 2021 and has a fixed rate of 1.145%, has converted $150.0 million of our floating rate debt to fixed rate debt. |
17
(Unaudited, in thousands except shares and per share data)
|
|
|
|
|
|
|
|
|
|
|
Investments in Real Estate |
|
|
|
|
|
|
|
|
|
|
|
|
|
|
|
|
|
|||||||||
|
Property Name |
|
Location |
|
Acquisition Date |
|
Year Built / Renovated (a) |
|
|
Gross Cost |
|
|
Accumulated Depreciation |
|
|
Net Book Value |
|
|
Units (b) |
|
|
Period End Occupancy (c) |
|
|
Average Occupancy (d) |
|
|
Average Effective Rent per Occupied Unit (e) |
|
||||||||
|
Copper Mill |
|
Austin, TX |
|
4/29/2011 |
|
|
2010 |
|
|
$ |
18,398 |
|
|
$ |
(3,667 |
) |
|
$ |
14,731 |
|
|
|
320 |
|
|
|
98.4% |
|
|
|
95.5% |
|
|
$ |
1,016 |
|
|
Heritage Trace |
|
Newport News, VA |
|
4/29/2011 |
|
|
2010 |
|
|
|
14,444 |
|
|
|
(2,930 |
) |
|
|
11,514 |
|
|
|
200 |
|
|
|
98.0% |
|
|
|
97.6% |
|
|
|
750 |
|
|
Berkshire Square |
|
Indianapolis, IN |
|
9/19/2013 |
|
|
2012 |
|
|
|
13,976 |
|
|
|
(1,031 |
) |
|
|
12,945 |
|
|
|
354 |
|
|
|
90.6% |
|
|
|
90.9% |
|
|
|
618 |
|
|
The Crossings |
|
Jackson, MS |
|
11/22/2013 |
|
|
2012 |
|
|
|
23,492 |
|
|
|
(1,580 |
) |
|
|
21,912 |
|
|
|
432 |
|
|
|
94.4% |
|
|
|
91.6% |
|
|
|
793 |
|
|
TOTAL PROPERTIES HELD-FOR-SALE (g) |
|
|
|
|
|
|
|
|
|
$ |
70,310 |
|
|
$ |
(9,208 |
) |
|
$ |
61,102 |
|
|
|
1,306 |
|
|
|
94.9% |
|
|
|
93.3% |
|
|
$ |
794 |
|
|
|
|
|
|
|
|
|
|
|
|
|
|
|
|
|
|
|
|
|
|
|
|
|
|
|
|
|
|
|
|
|
|
|
|
|
|
|
|
Same Store Properties: |
|
|
|
|
|
|
|
|
|
|
|
|
|
|
|
|
|
|
|
|
|
|
|
|
|
|
|
|
|
|
|
|
|
|
|
|
|
Crestmont |
|
Marietta, GA |
|
4/29/2011 |
|
2010 (f) |
|
|
|
17,183 |
|
|
|
(3,435 |
) |
|
|
13,748 |
|
|
|
228 |
|
|
|
85.5% |
|
|
|
86.4% |
|
|
|
868 |
|
|
|
Runaway Bay |
|
Indianapolis, IN |
|
10/11/2012 |
|
|
2002 |
|
|
|
16,107 |
|
|
|
(1,651 |
) |
|
|
14,456 |
|
|
|
192 |
|
|
|
96.4% |
|
|
|
95.1% |
|
|
|
988 |
|
|
Reserve at Eagle Ridge |
|
Waukegan, IL |
|
1/31/2014 |
|
|
2008 |
|
|
|
29,190 |
|
|
|
(1,944 |
) |
|
|
27,246 |
|
|
|
370 |
|
|
|
95.4% |
|
|
|
92.6% |
|
|
|
996 |
|
|
Windrush |
|
Edmond, OK |
|
2/28/2014 |
|
|
2011 |
|
|
|
9,415 |
|
|
|
(648 |
) |
|
|
8,767 |
|
|
|
160 |
|
|
|
91.9% |
|
|
|
86.1% |
|
|
|
780 |
|
|
Heritage Park |
|
Oklahoma City, OK |
|
2/28/2014 |
|
|
2011 |
|
|
|
17,457 |
|
|
|
(1,182 |
) |
|
|
16,275 |
|
|
|
453 |
|
|
|
95.6% |
|
|
|
90.6% |
|
|
|
657 |
|
|
Raindance |
|
Oklahoma City, OK |
|
2/28/2014 |
|
|
2011 |
|
|
|
14,353 |
|
|
|
(981 |
) |
|
|
13,372 |
|
|
|
504 |
|
|
|
94.4% |
|
|
|
91.6% |
|
|
|
561 |
|
|
Augusta |
|
Oklahoma City, OK |
|
2/28/2014 |
|
|
2011 |
|
|
|
11,700 |
|
|
|
(883 |
) |
|
|
10,817 |
|
|
|
197 |
|
|
|
88.3% |
|
|
|
89.3% |
|
|
|
730 |
|
|
Invitational |
|
Oklahoma City, OK |
|
2/28/2014 |
|
|
2011 |
|
|
|
19,409 |
|
|
|
(1,479 |
) |
|
|
17,930 |
|
|
|
344 |
|
|
|
89.5% |
|
|
|
90.1% |
|
|
|
672 |
|
|
King's Landing |
|
Creve Coeur, MO |
|
3/31/2014 |
|
|
2005 |
|
|
|
32,708 |
|
|
|
(2,292 |
) |
|
|
30,416 |
|
|
|
152 |
|
|
|
92.1% |
|
|
|
92.8% |
|
|
|
1,515 |
|
|
Carrington Park |
|
Little Rock, AR |
|
5/7/2014 |
|
|
1999 |
|
|
|
22,165 |
|
|
|
(1,584 |
) |
|
|
20,581 |
|
|
|
202 |
|
|
|
95.0% |
|
|
|
94.7% |
|
|
|
1,035 |
|
|
Arbors at the Reservoir |
|
Ridgeland, MS |
|
6/4/2014 |
|
|
2000 |
|
|
|
20,803 |
|
|
|
(1,351 |
) |
|
|
19,452 |
|
|
|
170 |
|
|
|
94.1% |
|
|
|
93.2% |
|
|
|
1,168 |
|
|
Walnut Hill |
|
Cordova, TN |
|
8/28/2014 |
|
|
2001 |
|
|
|
28,163 |
|
|
|
(1,813 |
) |
|
|
26,350 |
|
|
|
362 |
|
|
|
97.2% |
|
|
|
93.9% |
|
|
|
961 |
|
|
Lenoxplace |
|
Raleigh, NC |
|
9/5/2014 |
|
|
2012 |
|
|
|
24,442 |
|
|
|
(1,412 |
) |
|
|
23,030 |
|
|
|
268 |
|
|
|
92.2% |
|
|
|
94.6% |
|
|
|
914 |
|
|
Stonebridge Crossing |
|
Cordova, TN |
|
9/15/2014 |
|
|
1994 |
|
|
|
30,226 |
|
|
|
(1,828 |
) |
|
|
28,398 |
|
|
|
500 |
|
|
|
96.4% |
|
|
|
96.1% |
|
|
|
810 |
|
|
Bennington Pond |
|
Groveport, OH |
|
11/24/2014 |
|
|
2000 |
|
|
|
17,830 |
|
|
|
(995 |
) |
|
|
16,835 |
|
|
|
240 |
|
|
|
92.9% |
|
|
|
91.2% |
|
|
|
867 |
|
|
Prospect Park |
|
Louisville, KY |
|
12/8/2014 |
|
|
1990 |
|
|
|
14,223 |
|
|
|
(667 |
) |
|
|
13,556 |
|
|
|
138 |
|
|
|
95.7% |
|
|
|
94.1% |
|
|
|
925 |
|
|
Brookside |
|
Louisville, KY |
|
12/8/2014 |
|
|
1987 |
|
|
|
20,917 |
|
|
|
(1,012 |
) |
|
|
19,905 |
|
|
|
224 |
|
|
|
94.2% |
|
|
|
94.6% |
|
|
|
852 |
|
|
Jamestown |
|
Louisville, KY |
|
12/8/2014 |
|
|
1970 |
|
|
|
35,860 |
|
|
|
(1,750 |
) |
|
|
34,110 |
|
|
|
355 |
|
|
|
96.3% |
|
|
|
95.0% |
|
|
|
1,035 |
|
|
Meadows |
|
Louisville, KY |
|
12/8/2014 |
|
|
1988 |
|
|
|
37,930 |
|
|
|
(1,842 |
) |
|
|
36,088 |
|
|
|
400 |
|
|
|
95.3% |
|
|
|
95.5% |
|
|
|
818 |
|
|
Oxmoor |
|
Louisville, KY |
|
12/8/2014 |
|
1999-2000 |
|
|
|
55,468 |
|
|
|
(2,821 |
) |
|
|
52,647 |
|
|
|
432 |
|
|
|
94.4% |
|
|
|
93.0% |
|
|
|
1,016 |
|
|
|
Stonebridge at the Ranch |
|
Little Rock, AR |
|
12/16/2014 |
|
|
2005 |
|
|
|
31,554 |
|
|
|
(1,622 |
) |
|
|
29,932 |
|
|
|
260 |
|
|
|
97.7% |
|
|
|
94.0% |
|
|
|
942 |
|
|
Iron Rock Ranch |
|
Austin, TX |
|
12/30/2014 |
|
2001-2002 |
|
|
|
35,316 |
|
|
|
(1,745 |
) |
|
|
33,571 |
|
|
|
300 |
|
|
|
96.0% |
|
|
|
94.4% |
|
|
|
1,267 |
|
|
|
Bayview Club |
|
Indianapolis, IN |
|
5/1/2015 |
|
|
2004 |
|
|
|
25,545 |
|
|
|
(1,130 |
) |
|
|
24,415 |
|
|
|
236 |
|
|
|
93.6% |
|
|
|
92.6% |
|
|
|
969 |
|
|
Arbors River Oaks |
|
Memphis, TN |
|
9/17/2015 |
|
2010 (f) |
|
|
|
21,623 |
|
|
|
(779 |
) |
|
|
20,844 |
|
|
|
191 |
|
|
|
97.4% |
|
|
|
95.1% |
|
|
|
1,195 |
|
|
|
Aston |
|
Wake Forest, NC |
|
9/17/2015 |
|
|
2013 |
|
|
|
37,939 |
|
|
|
(1,298 |
) |
|
|
36,641 |
|
|
|
288 |
|
|
|
96.2% |
|
|
|
97.2% |
|
|
|
1,069 |
|
|
Avenues at Craig Ranch |
|
McKinneuy, TX |
|
9/17/2015 |
|
|
2013 |
|
|
|
47,704 |
|
|
|
(1,595 |
) |
|
|
46,109 |
|
|
|
334 |
|
|
|
96.4% |
|
|
|
94.3% |
|
|
|
1,260 |
|
|
Bridge Pointe |
|
Huntsville, AL |
|
9/17/2015 |
|
|
2002 |
|
|
|
15,976 |
|
|
|
(557 |
) |
|
|
15,419 |
|
|
|
178 |
|
|
|
96.6% |
|
|
|
96.6% |
|
|
|
831 |
|
|
Creekstone at RTP |
|
Durham, NC |
|
9/17/2015 |
|
|
2013 |
|
|
|
38,244 |
|
|
|
(1,246 |
) |
|
|
36,998 |
|
|
|
256 |
|
|
|
97.7% |
|
|
|
96.5% |
|
|
|
1,177 |
|
|
Fountains Southend |
|
Charlotte, NC |
|
9/17/2015 |
|
|
2013 |
|
|
|
41,696 |
|
|
|
(1,405 |
) |
|
|
40,291 |
|
|
|
208 |
|
|
|
97.1% |
|
|
|
96.6% |
|
|
|
1,388 |
|
|
Fox Trails |
|
Plano, TX |
|
9/17/2015 |
|
|
1981 |
|
|
|
28,040 |
|
|
|
(869 |
) |
|
|
27,171 |
|
|
|
286 |
|
|
|
94.4% |
|
|
|
93.3% |
|
|
|
1,038 |
|
|
Lakeshore on the Hill |
|
Chattanooga, TN |
|
9/17/2015 |
|
|
2015 |
|
|
|
11,440 |
|
|
|
(407 |
) |
|
|
11,033 |
|
|
|
123 |
|
|
|
97.6% |
|
|
|
97.5% |
|
|
|
945 |
|
|
Millenia 700 |
|
Orlando, FL |
|
9/17/2015 |
|
|
2012 |
|
|
|
47,426 |
|
|
|
(1,585 |
) |
|
|
45,841 |
|
|
|
297 |
|
|
|
95.6% |
|
|
|
95.2% |
|
|
|
1,334 |
|
|
Miller Creek at German Town |
|
Memphis, TN |
|
9/17/2015 |
|
|
2013 |
|
|
|
56,897 |
|
|
|
(2,018 |
) |
|
|
54,879 |
|
|
|
330 |
|
|
|
96.7% |
|
|
|
96.2% |
|
|
|
1,231 |
|
|
Pointe at Canyon Ridge |
|
Atlanta, GA |
|
9/17/2015 |
|
2007 (f) |
|
|
|
48,955 |
|
|
|
(1,465 |
) |
|
|
47,490 |
|
|
|
494 |
|
|
|
93.3% |
|
|
|
94.4% |
|
|
|
953 |
|
|
|
St James at Goose Creek |
|
Goose Creek, SC |
|
9/17/2015 |
|
|
2009 |
|
|
|
31,772 |
|
|
|
(1,092 |
) |
|
|
30,680 |
|
|
|
244 |
|
|
|
96.3% |
|
|
|
94.8% |
|
|
|
1,110 |
|
|
Talison Row at Daniel Island |
|
Daniel Island, SC |
|
9/17/2015 |
|
|
2013 |
|
|
|
47,076 |
|
|
|
(1,577 |
) |
|
|
45,499 |
|
|
|
274 |
|
|
|
91.6% |
|
|
|
93.2% |
|
|
|
1,510 |
|
|
The Aventine Greenville |
|
Greenville, SC |
|
9/17/2015 |
|
|
2013 |
|
|
|
48,105 |
|
|
|
(1,652 |
) |
|
|
46,453 |
|
|
|
346 |
|
|
|
92.5% |
|
|
|
93.8% |
|
|
|
1,130 |
|
|
Trails at Signal Mountain |
|
Chattanooga, TN |
|
9/17/2015 |
|
|
2015 |
|
|
|
14,402 |
|
|
|
(521 |
) |
|
|
13,881 |
|
|
|
172 |
|
|
|
99.4% |
|
|
|
97.3% |
|
|
|
942 |
|
|
Vue at Knoll Trail |
|
Dallas, TX |
|
9/17/2015 |
|
|
2015 |
|
|
|
9,287 |
|
|
|
(243 |
) |
|
|
9,044 |
|
|
|
114 |
|
|
|
93.9% |
|
|
|
95.6% |
|
|
|
905 |
|
|
Waterstone at Brier Creek |
|
Raleigh, NC |
|
9/17/2015 |
|
|
2014 |
|
|
|
38,959 |
|
|
|
(1,314 |
) |
|
|
37,645 |
|
|
|
232 |
|
|
|
96.1% |
|
|
|
95.7% |
|
|
|
1,236 |
|
|
Waterstone Big Creek |
|
Alpharetta, GA |
|
9/17/2015 |
|
|
2014 |
|
|
|
69,674 |
|
|
|
(2,335 |
) |
|
|
67,339 |
|
|
|
370 |
|
|
|
95.7% |
|
|
|
94.0% |
|
|
|
1,354 |
|
|
Westmont Commons |
|
Asheville, NC |
|
9/17/2015 |
|
2003, 2008 |
|
|
|
28,210 |
|
|
|
(977 |
) |
|
|
27,233 |
|
|
|
252 |
|
|
|
94.0% |
|
|
|
95.1% |
|
|
|
1,031 |
|
|
|
|
|
|
|
|
|
|
|
|
|
|
|
|
|
|
|
|
|
|
|
|
|
|
|
|
|
|
|
|
|
|
|
|
|
|
|
|
|
Nom-Same Store Properties: |
|
|
|
|
|
|
|
|
|
|
|
|
|
|
|
|
|
|
|
|
|
|
|
|
|
|
|
|
|
|
|
|
|
|
|
|
|
Lakes of Northdale |
|
Tampa, FL |
|
2/27/2017 |
|
|
2016 |
|
|
|
29,451 |
|
|
|
(53 |
) |
|
|
29,398 |
|
|
|
216 |
|
|
|
91.7% |
|
|
|
91.1% |
|
|
|
432 |
|
|
TOTAL PROPERTIES HELD-FOR-USE |
|
|
|
|
|
|
|
|
|
$ |
1,280,840 |
|
|
$ |
(59,055 |
) |
|
$ |
1,221,785 |
|
|
|
11,892 |
|
|
|
94.7% |
|
|
|
93.8% |
|
|
$ |
996 |
|
|
|
|
|
|
|
|
|
|
|
|
|
|
|
|
|
|
|
|
|
|
|
|
|
|
|
|
|
|
|
|
|
|
|
|
|
|
|
|
TOTAL |
|
|
|
|
|
|
|
|
|
$ |
1,351,150 |
|
|
$ |
(68,263 |
) |
|
$ |
1,282,887 |
|
|
|
13,198 |
|
|
|
94.7% |
|
|
|
93.8% |
|
|
$ |
978 |
|
|
(a) |
All dates are for the later of the year in which construction was completed or the year in which a significant renovation program was completed. |
|
(b) |
Units represent the total number of apartment units available for rent at March 31, 2017. |
|
(c) |
Physical occupancy for each of our properties is calculated as (i) total units rented as of March 31, 2017 divided by (ii) total units available as of March 31, 2017, expressed as a percentage. |
|
(d) |
Average occupancy represents the daily average occupied units for the three-month period ended March 31, 2017. |
|
(e) |
Average monthly effective monthly rent, per unit, represents the average monthly rent for all occupied units for the three-month period ended March 31, 2017. |
|
(f) |
Properties are undergoing renovation. |
|
(g) |
Presents the depreciation that was recognized on these properties while they were classified as held-for-use. |
18
Dollars in thousands, except rent per unit
|
|
|
|
|
|
|
|
|
|
|
|
|
|
|
For the Three Months Ended March 31, 2017 |
|
|||||||||
|
Market |
|
Units |
|
|
Gross Real Estate Assets |
|
|
Period End Occupancy |
|
|
Average Effective Monthly Rent per Unit |
|
|
Net Operating Income (a) |
|
|
% of NOI |
|
||||||
|
Louisville. KY |
|
|
1,549 |
|
|
$ |
164,396 |
|
|
|
95.2 |
% |
|
$ |
937 |
|
|
$ |
2,621 |
|
|
|
11.5 |
% |
|
Memphis, TN |
|
|
1,383 |
|
|
|
136,908 |
|
|
|
96.8 |
% |
|
|
1,003 |
|
|
|
2,458 |
|
|
|
10.8 |
% |
|
Atlanta, GA |
|
|
1,092 |
|
|
|
135,810 |
|
|
|
92.5 |
% |
|
|
1,071 |
|
|
|
2,207 |
|
|
|
9.7 |
% |
|
Raleigh, NC |
|
|
1,044 |
|
|
|
139,583 |
|
|
|
95.5 |
% |
|
|
1,093 |
|
|
|
2,284 |
|
|
|
10.0 |
% |
|
Oklahoma City, OK |
|
|
1,658 |
|
|
|
72,332 |
|
|
|
92.8 |
% |
|
|
651 |
|
|
|
1,499 |
|
|
|
6.6 |
% |
|
Dallas, TX |
|
|
734 |
|
|
|
85,029 |
|
|
|
95.2 |
% |
|
|
1,118 |
|
|
|
1,475 |
|
|
|
6.5 |
% |
|
Charleston, SC |
|
|
518 |
|
|
|
78,848 |
|
|
|
93.8 |
% |
|
|
1,322 |
|
|
|
1,223 |
|
|
|
5.4 |
% |
|
Austin, TX |
|
|
620 |
|
|
|
53,717 |
|
( b ) |
|
97.3 |
% |
|
|
1,137 |
|
|
|
1,161 |
|
|
|
5.1 |
% |
|
Indianapolis, IN |
|
|
782 |
|
|
|
55,635 |
|
( c ) |
|
92.9 |
% |
|
|
815 |
|
|
|
908 |
|
|
|
4.0 |
% |
|
Jackson, MS |
|
|
602 |
|
|
|
44,295 |
|
( d ) |
|
94.4 |
% |
|
|
899 |
|
|
|
900 |
|
|
|
3.9 |
% |
|
Little Rock, AR |
|
|
462 |
|
|
|
53,718 |
|
|
|
95.2 |
% |
|
|
983 |
|
|
|
903 |
|
|
|
4.0 |
% |
|
Greenville, SC |
|
|
346 |
|
|
|
48,105 |
|
|
|
92.5 |
% |
|
|
1,130 |
|
|
|
745 |
|
|
|
3.3 |
% |
|
Orlando, FL |
|
|
297 |
|
|
|
47,426 |
|
|
|
95.6 |
% |
|
|
1,334 |
|
|
|
769 |
|
|
|
3.4 |
% |
|
Tampa-St. Petersburg, FL |
|
|
216 |
|
|
|
29,451 |
|
|
|
91.7 |
% |
|
|
432 |
|
|
|
178 |
|
|
|
0.8 |
% |
|
Chicago, IL |
|
|
370 |
|
|
|
29,189 |
|
|
|
95.4 |
% |
|
|
996 |
|
|
|
579 |
|
|
|
2.5 |
% |
|
Asheville, NC |
|
|
252 |
|
|
|
28,210 |
|
|
|
94.0 |
% |
|
|
1,031 |
|
|
|
539 |
|
|
|
2.4 |
% |
|
Charlotte, NC |
|
|
208 |
|
|
|
41,696 |
|
|
|
97.1 |
% |
|
|
1,342 |
|
|
|
638 |
|
|
|
2.8 |
% |
|
St. Louis, MO |
|
|
152 |
|
|
|
32,708 |
|
|
|
92.1 |
% |
|
|
1,515 |
|
|
|
459 |
|
|
|
2.0 |
% |
|
Chattanooga, TN |
|
|
295 |
|
|
|
25,841 |
|
|
|
98.6 |
% |
|
|
943 |
|
|
|
467 |
|
|
|
2.0 |
% |
|
Columbus, OH |
|
|
240 |
|
|
|
17,830 |
|
|
|
92.9 |
% |
|
|
868 |
|
|
|
331 |
|
|
|
1.4 |
% |
|
Huntsville, AL |
|
|
178 |
|
|
|
15,974 |
|
|
|
96.6 |
% |
|
|
831 |
|
|
|
284 |
|
|
|
1.2 |
% |
|
Norfolk, VA |
|
|
200 |
|
|
|
14,448 |
|
( e ) |
|
98.0 |
% |
|
|
750 |
|
|
|
224 |
|
|
|
1.0 |
% |
|
Total/Weighted Average |
|
|
13,198 |
|
|
$ |
1,351,149 |
|
|
|
94.7 |
% |
|
$ |
976 |
|
|
$ |
22,852 |
|
|
|
100.0 |
% |
|
|
|
|
|
|
|
|
|
|
|
|
|
|
|
|
|
|
|
|
|
|
|
|
|
|
|
|
(a) |
Net operating income for the three months ended March 31, 2017 excludes $98 primarily related to previously sold properties. |
|
|
(b) |
Includes $ 18,399 of properties classified as held-for-sale. |
|
|
(c) |
Includes $ 13,977 of properties classified as held-for-sale. |
|
|
(d) |
Includes $ 23,488 of properties classified as held-for-sale. |
|
|
(e) |
Includes $ 14,445 of properties classified as held-for-sale. |
19
Average Effective Monthly Rent per Unit
Average effective rent per unit represents the average of gross rent amounts, divided by the average occupancy (in units) for the period presented. We believe average effective rent is a helpful measurement in evaluating average pricing. This metric, when presented, reflects the average effective rent per month.
Average Occupancy
Average occupancy represents the average of the daily physical occupancy for the period presented.
Adjusted EBITDA
EBITDA is defined as net income before interest expense including amortization of deferred financing costs, income tax expense, and depreciation and amortization expenses. Adjusted EBITDA is EBITDA before acquisition and integration expenses and certain other non-operating gains or losses related to items such as asset sales, debt extinguishments, gains on the TSRE merger, and management internalization expenses. EBITDA and Adjusted EBITDA are each non-GAAP measures. We consider EBITDA and Adjusted EBITDA to be an appropriate supplemental measure of our performance because it eliminates interest, income taxes, depreciation and amortization, acquisition and integration expenses and other non-operating gains and losses, which permits investors to view income from operations without these non-cash or non-operating items. The table is a reconciliation of net income applicable to common stockholders to Adjusted EBITDA. IRT’s calculation of Adjusted EBITDA differs from the methodology used for calculating Adjusted EBITDA by certain other REITs and, accordingly, IRT’s Adjusted EBITDA may not be comparable to Adjusted EBITDA reported by other REITs.
Funds From Operations (“FFO”) and Core Funds From Operations (“CFFO”)
IRT believes that FFO and CFFO, each of which is a non-GAAP measure, are additional appropriate measures of the operating performance of a REIT and IRT in particular. IRT computes FFO in accordance with the standards established by the National Association of Real Estate Investment Trusts, or NAREIT, as net income or loss (computed in accordance with GAAP), excluding real estate-related depreciation and amortization expense, gains or losses on sales of real estate and the cumulative effect of changes in accounting principles.
CFFO is a computation made by analysts and investors to measure a real estate company’s operating performance by removing the effect of items that do not reflect ongoing property operations, including stock compensation expense, depreciation and amortization of other items not included in FFO, amortization of deferred financing costs, acquisition and integration expenses, and other non-operating gains or losses related to items such as asset sales, debt extinguishments, gains on the TSRE merger, and management internalization expenses, from the determination of FFO. IRT incurs acquisition expenses in connection with acquisitions of real estate properties and expenses those costs when incurred in accordance with U.S. GAAP. As these expenses are one-time and reflective of investing activities rather than operating performance, IRT adds back these costs to FFO in determining CFFO.
IRT’s calculation of CFFO differs from the methodology used for calculating CFFO by certain other REITs and, accordingly, IRT’s CFFO may not be comparable to CFFO reported by other REITs. IRT’s management utilizes FFO and CFFO as measures of IRT’s operating performance, and believes they are also useful to investors, because they facilitate an understanding of IRT’s operating performance after adjustment for certain non-cash or non-operating items that are required by GAAP to be expensed but may not necessarily be indicative of current operating performance and that may not accurately compare IRT’s operating performance between periods. Furthermore, although FFO, CFFO and other supplemental performance measures are defined in various ways throughout the REIT industry, IRT believes that FFO and CFFO may provide IRT and our investors with an additional useful measure to compare IRT’s financial performance to certain other REITs. Neither FFO nor CFFO is equivalent to net income or cash generated from operating activities determined in accordance with GAAP. Furthermore, FFO and CFFO do not represent amounts available for management’s discretionary use because of needed capital replacement or expansion, debt service obligations or other commitments or uncertainties. Neither FFO nor CFFO should be considered as an alternative to net income as an indicator of IRT’s operating performance or as an alternative to cash flow from operating activities as a measure of IRT’s liquidity.
Interest Coverage
Interest coverage is a ratio computed by dividing our Adjusted EBITDA by our interest expense.
20
Net debt, a non-GAAP measure, equals total debt less cash and cash equivalents. The following table provides a reconciliation of total debt to net debt.
IRT presents net debt because management believes it is a useful measure of IRT’s credit position and progress toward reducing leverage. The calculation is limited in that IRT may not always be able to use cash to repay debt on a dollar for dollar basis.
|
|
As of |
|
|||||||||||||||||
|
|
March 31, 2017 |
|
|
December 31, 2016 |
|
|
September 30, 2016 |
|
|
June 30, 2016 |
|
|
March 31, 2016 |
|
|||||
|
Total debt |
$ |
765,695 |
|
|
$ |
743,817 |
|
|
$ |
880,581 |
|
|
$ |
880,288 |
|
|
$ |
940,336 |
|
|
Less: cash and cash equivalents |
|
(10,065 |
) |
|
|
(20,892 |
) |
|
|
(29,247 |
) |
|
|
(28,051 |
) |
|
|
(21,924 |
) |
|
Total net debt |
$ |
755,630 |
|
|
$ |
722,925 |
|
|
$ |
851,334 |
|
|
$ |
852,237 |
|
|
$ |
918,412 |
|
|
|
|
|
|
|
|
|
|
|
|
|
|
|
|
|
|
|
|
|
|
Net Operating Income
IRT believes that Net Operating Income (“NOI”), a non-GAAP measure, is a useful measure of its operating performance. IRT defines NOI as total property revenues less total property operating expenses, excluding depreciation and amortization, asset management fees, property management fees, acquisition expenses and general administrative expenses. In connection with our management internalization which was completed in the fourth quarter of 2016, we modified our calculation of NOI to exclude property management expenses. We retrospectively adjusted previously reported NOI to conform to this change. Other REITs may use different methodologies for calculating NOI, and accordingly, our NOI may not be comparable to other REITs. We believe that this measure provides an operating perspective not immediately apparent from GAAP operating income or net income. We use NOI to evaluate our performance on a same store and non-same store basis because NOI measures the core operations of property performance by excluding corporate level expenses and other items not related to property operating performance and captures trends in rental housing and property operating expenses. However, NOI should only be used as an alternative measure of our financial performance.
Same Store Properties and Same Store Portfolio
IRT reviews its same store properties or portfolio at the beginning of each calendar year. Properties are added into the same store portfolio if they were owned at the beginning of the previous year. Properties that are held-for-sale or have been sold are excluded from the same store portfolio.
Total Gross Assets
Total Gross Assets equals total assets plus accumulated depreciation and accumulated amortization, including fully depreciated or amortized real estate and real estate related assets. The following table provides a reconciliation of total assets to total gross assets.
|
|
As of |
|
|||||||||||||||||
|
|
March 31, 2017 |
|
|
December 31, 2016 |
|
|
September 30, 2016 |
|
|
June 30, 2016 |
|
|
March 31, 2016 |
|
|||||
|
Total assets |
$ |
1,306,986 |
|
|
$ |
1,294,237 |
|
|
$ |
1,306,242 |
|
|
$ |
1,307,871 |
|
|
$ |
1,344,650 |
|
|
Plus: Accumulated Depreciation (a) |
|
68,262 |
|
|
|
60,719 |
|
|
|
52,824 |
|
|
|
45,059 |
|
|
|
44,422 |
|
|
Plus: Accumulated Amortization |
|
15,341 |
|
|
|
15,287 |
|
|
|
15,287 |
|
|
|
15,287 |
|
|
|
15,287 |
|
|
Total gross assets |
$ |
1,390,589 |
|
|
$ |
1,370,243 |
|
|
$ |
1,374,353 |
|
|
$ |
1,368,217 |
|
|
$ |
1,404,359 |
|
|
|
(a) |
Includes previously recognized depreciation on properties that are classified as held-for-sale. |
21