Attached files
| file | filename |
|---|---|
| EX-99.1 - EX-99.1 - Frontier Communications Parent, Inc. | d375997dex991.htm |
| 8-K - FORM 8-K - Frontier Communications Parent, Inc. | d375997d8k.htm |
Investor Update First Quarter 2017 May 2, 2017 Exhibit 99.2
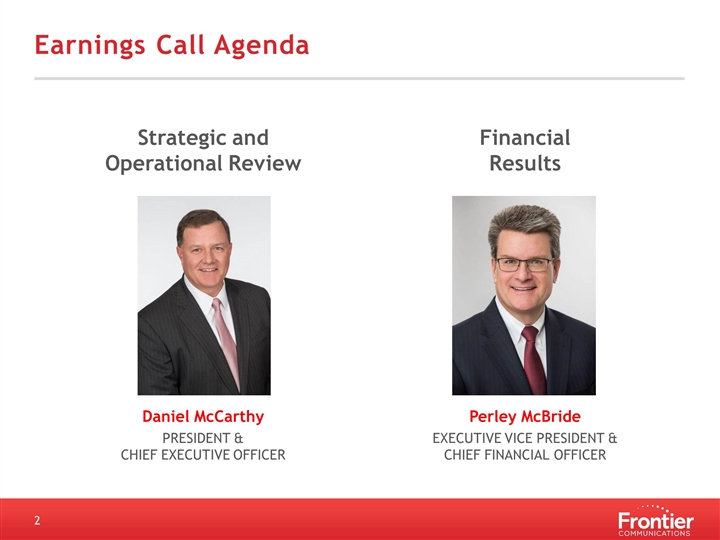
Earnings Call Agenda Strategic and Operational Review Daniel McCarthy President & Chief Executive Officer Financial Results Perley McBride Executive Vice President & Chief Financial Officer
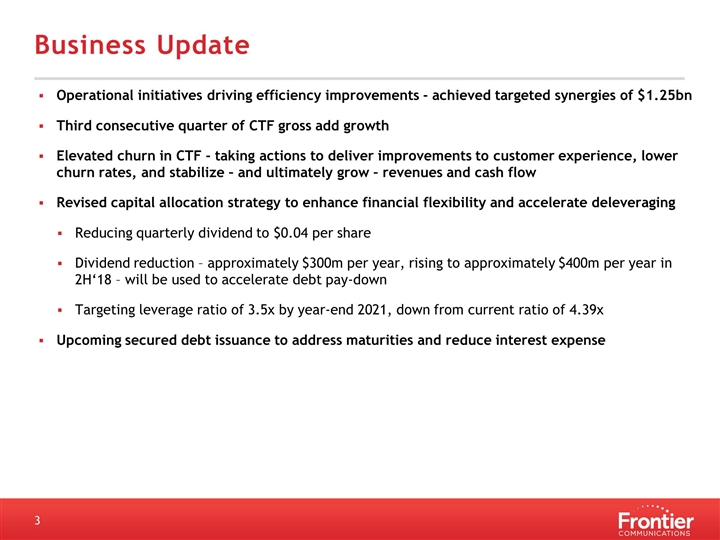
Business Update Operational initiatives driving efficiency improvements - achieved targeted synergies of $1.25bn Third consecutive quarter of CTF gross add growth Elevated churn in CTF - taking actions to deliver improvements to customer experience, lower churn rates, and stabilize – and ultimately grow – revenues and cash flow Revised capital allocation strategy to enhance financial flexibility and accelerate deleveraging Reducing quarterly dividend to $0.04 per share Dividend reduction – approximately $300m per year, rising to approximately $400m per year in 2H‘18 – will be used to accelerate debt pay-down Targeting leverage ratio of 3.5x by year-end 2021, down from current ratio of 4.39x Upcoming secured debt issuance to address maturities and reduce interest expense
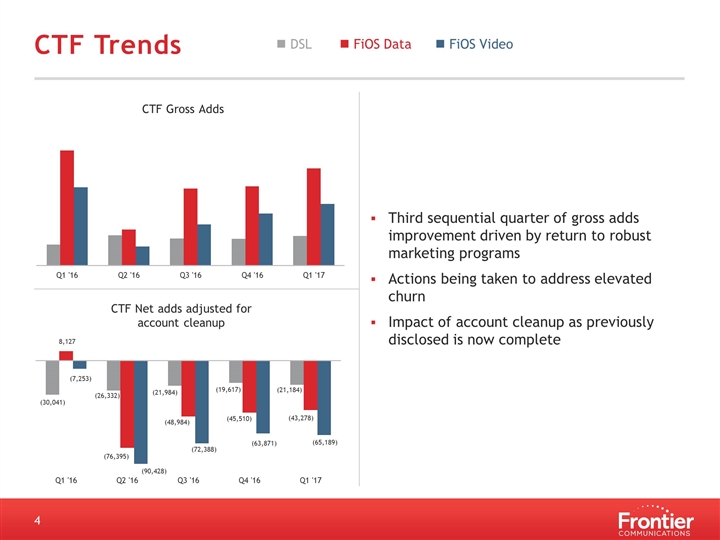
CTF Trends Third sequential quarter of gross adds improvement driven by return to robust marketing programs Actions being taken to address elevated churn Impact of account cleanup as previously disclosed is now complete n DSL n FiOS Data n FiOS Video
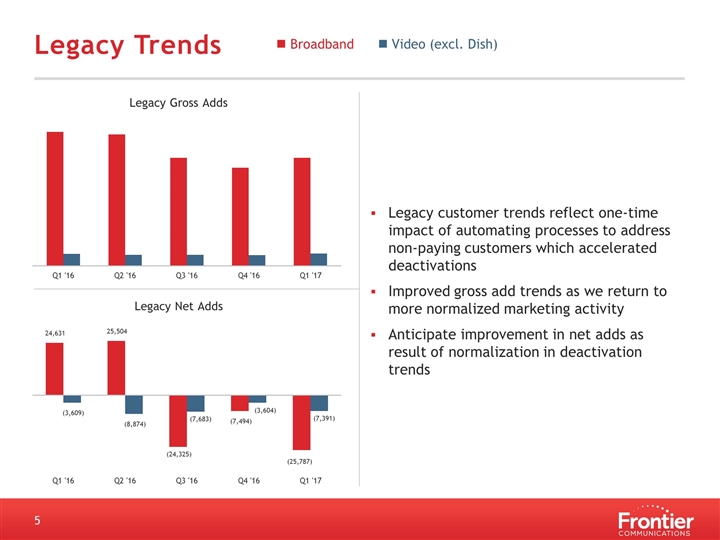
Legacy Trends n Broadband n Video (excl. Dish) Legacy customer trends reflect one-time impact of automating processes to address non-paying customers which accelerated deactivations Improved gross add trends as we return to more normalized marketing activity Anticipate improvement in net adds as result of normalization in deactivation trends
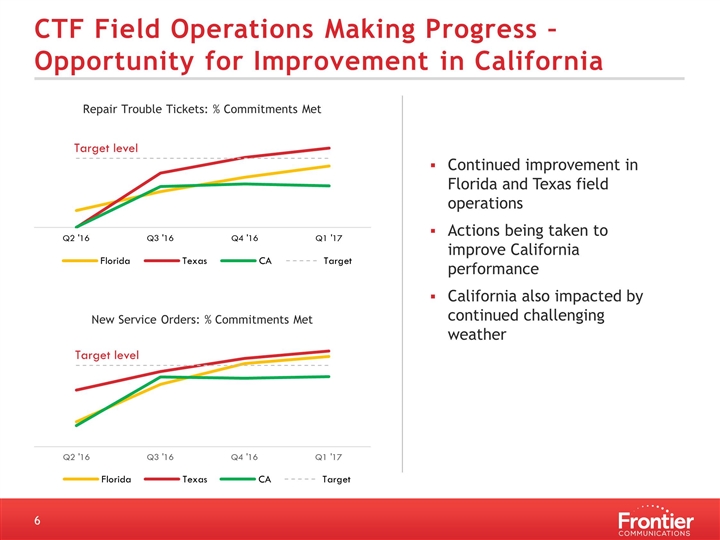
CTF Field Operations Making Progress – Opportunity for Improvement in California Continued improvement in Florida and Texas field operations Actions being taken to improve California performance California also impacted by continued challenging weather New Service Orders: % Commitments Met Target level Repair Trouble Tickets: % Commitments Met Target level
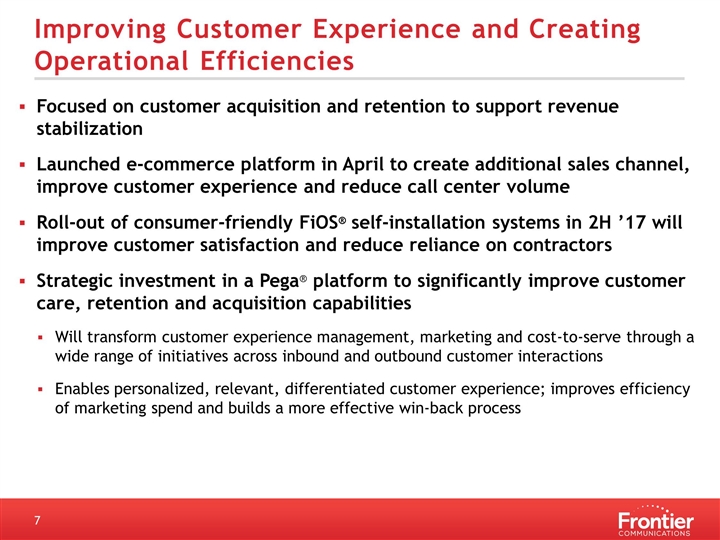
Improving Customer Experience and Creating Operational Efficiencies Focused on customer acquisition and retention to support revenue stabilization Launched e-commerce platform in April to create additional sales channel, improve customer experience and reduce call center volume Roll-out of consumer-friendly FiOS® self-installation systems in 2H ’17 will improve customer satisfaction and reduce reliance on contractors Strategic investment in a Pega® platform to significantly improve customer care, retention and acquisition capabilities Will transform customer experience management, marketing and cost-to-serve through a wide range of initiatives across inbound and outbound customer interactions Enables personalized, relevant, differentiated customer experience; improves efficiency of marketing spend and builds a more effective win-back process
2017 Business Priorities Continue to enhance customer experience and improve churn rates Maintain momentum of performance improvements in the CTF markets Implement expense reductions to increase efficiencies and maintain free cash flow Continue copper network upgrades Execute on commercial strategy, including expansion of pipeline
Financial Review Perley McBride Executive Vice President & Chief Financial Officer
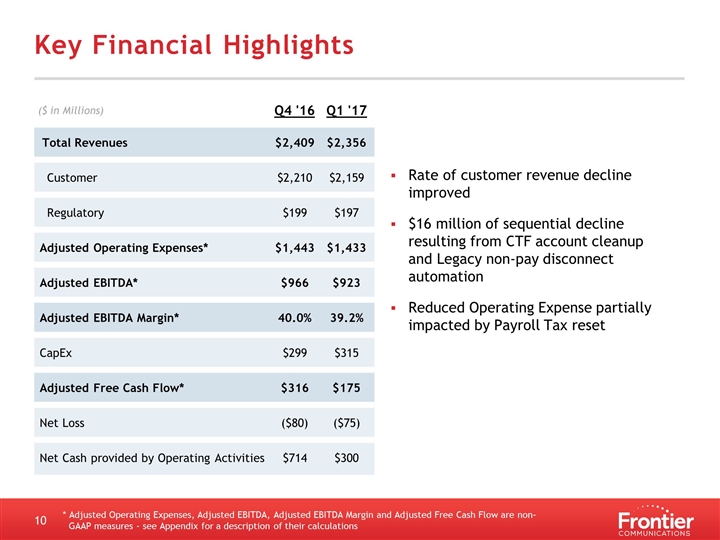
Key Financial Highlights * Adjusted Operating Expenses, Adjusted EBITDA, Adjusted EBITDA Margin and Adjusted Free Cash Flow are non-GAAP measures - see Appendix for a description of their calculations Rate of customer revenue decline improved $16 million of sequential decline resulting from CTF account cleanup and Legacy non-pay disconnect automation Reduced Operating Expense partially impacted by Payroll Tax reset ($ in Millions) Q4 '16 Q1 '17 Total Revenues $2,409 $2,356 Customer $2,210 $2,159 Regulatory $199 $197 Adjusted Operating Expenses* $1,443 $1,433 Adjusted EBITDA* $966 $923 Adjusted EBITDA Margin* 40.0% 39.2% CapEx $299 $315 Adjusted Free Cash Flow* $316 $175 Net Loss ($80) ($75) Net Cash provided by Operating Activities $714 $300
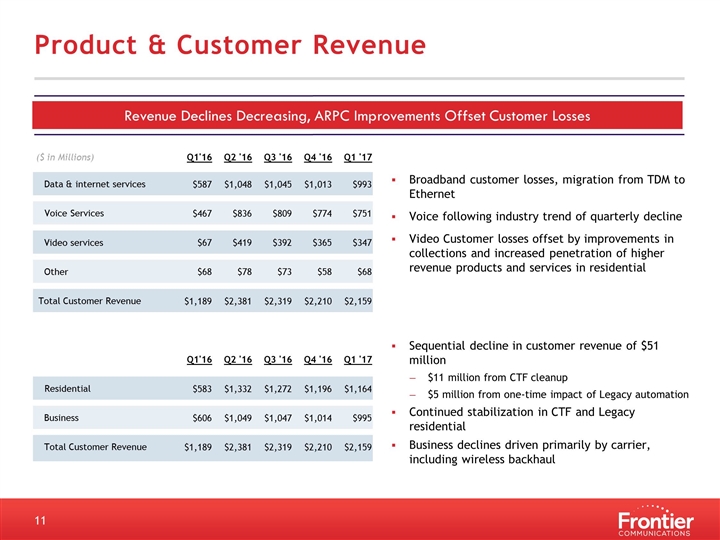
($ in Millions) Q1'16 Q2 '16 Q3 '16 Q4 '16 Q1 '17 Data & internet services $587 $1,048 $1,045 $1,013 $993 Voice Services $467 $836 $809 $774 $751 Video services $67 $419 $392 $365 $347 Other $68 $78 $73 $58 $68 Total Customer Revenue $1,189 $2,381 $2,319 $2,210 $2,159 Q1'16 Q2 '16 Q3 '16 Q4 '16 Q1 '17 Residential $583 $1,332 $1,272 $1,196 $1,164 Business $606 $1,049 $1,047 $1,014 $995 Total Customer Revenue $1,189 $2,381 $2,319 $2,210 $2,159 Product & Customer Revenue Revenue Declines Decreasing, ARPC Improvements Offset Customer Losses Broadband customer losses, migration from TDM to Ethernet Voice following industry trend of quarterly decline Video Customer losses offset by improvements in collections and increased penetration of higher revenue products and services in residential Sequential decline in customer revenue of $51 million $11 million from CTF cleanup $5 million from one-time impact of Legacy automation Continued stabilization in CTF and Legacy residential Business declines driven primarily by carrier, including wireless backhaul
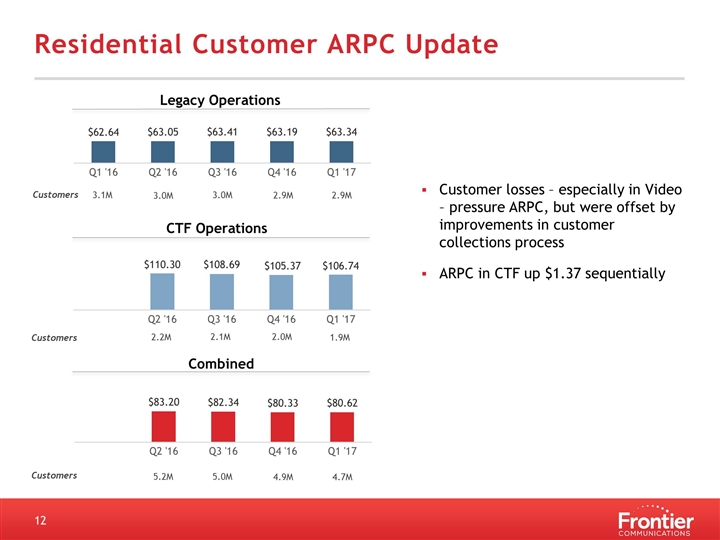
Residential Customer ARPC Update 3.0M 2.9M 2.9M Customers 3.0M 3.1M Legacy Operations CTF Operations 2.2M 2.0M 1.9M 2.1M Customers 5.2M 4.9M 4.7M Customers 5.0M Combined Customer losses – especially in Video – pressure ARPC, but were offset by improvements in customer collections process ARPC in CTF up $1.37 sequentially
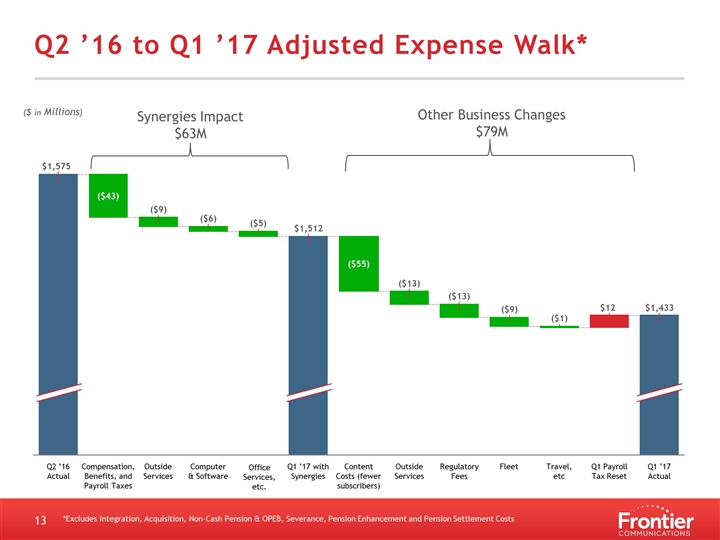
Q2 ’16 to Q1 ’17 Adjusted Expense Walk* Travel, etc , etc. Compensation, Benefits, and Payroll Taxes Synergies Impact $63M Other Business Changes $79M ($ in Millions) *Excludes Integration, Acquisition, Non-Cash Pension & OPEB, Severance, Pension Enhancement and Pension Settlement Costs
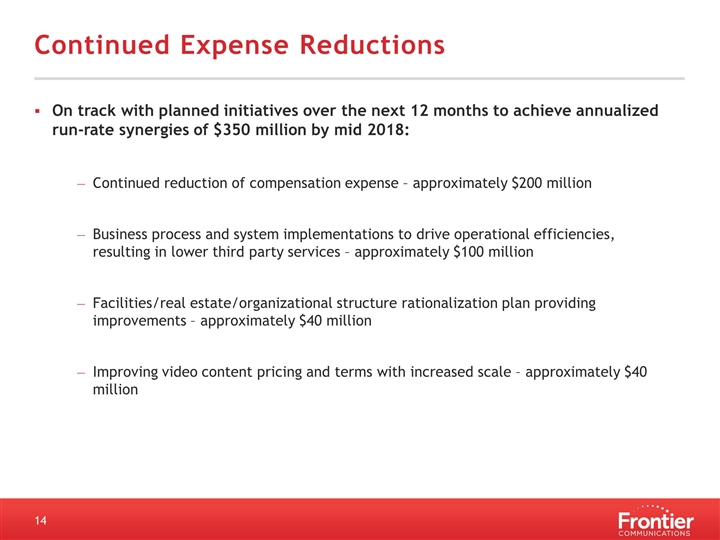
Continued Expense Reductions On track with planned initiatives over the next 12 months to achieve annualized run-rate synergies of $350 million by mid 2018: Continued reduction of compensation expense – approximately $200 million Business process and system implementations to drive operational efficiencies, resulting in lower third party services – approximately $100 million Facilities/real estate/organizational structure rationalization plan providing improvements – approximately $40 million Improving video content pricing and terms with increased scale – approximately $40 million
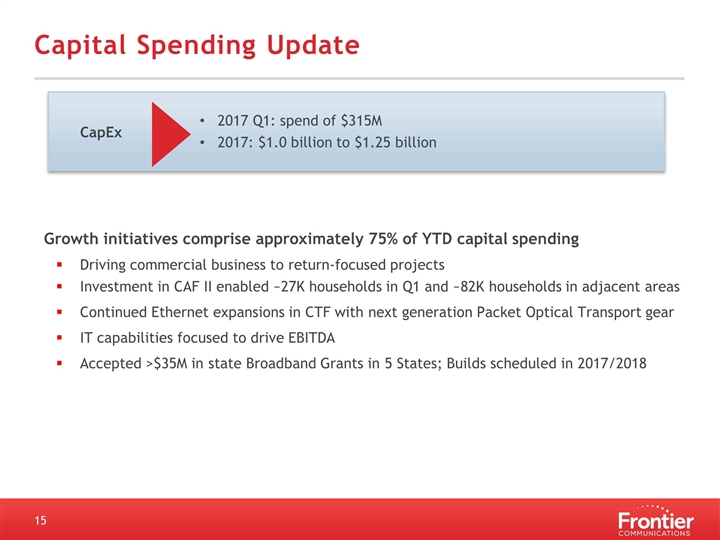
Capital Spending Update Growth initiatives comprise approximately 75% of YTD capital spending Driving commercial business to return-focused projects Investment in CAF II enabled ~27K households in Q1 and ~82K households in adjacent areas Continued Ethernet expansions in CTF with next generation Packet Optical Transport gear IT capabilities focused to drive EBITDA Accepted >$35M in state Broadband Grants in 5 States; Builds scheduled in 2017/2018 2017 Q1: spend of $315M 2017: $1.0 billion to $1.25 billion CapEx
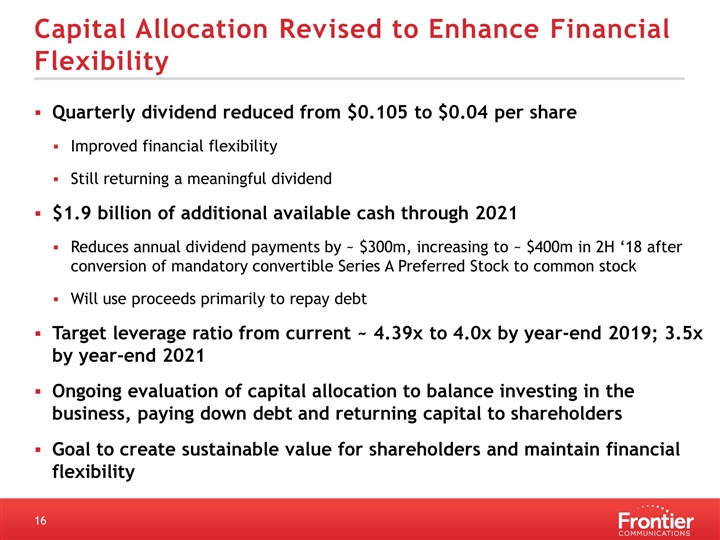
Capital Allocation Revised to Enhance Financial Flexibility Quarterly dividend reduced from $0.105 to $0.04 per share Improved financial flexibility Still returning a meaningful dividend $1.9 billion of additional available cash through 2021 Reduces annual dividend payments by ~ $300m, increasing to ~ $400m in 2H ‘18 after conversion of mandatory convertible Series A Preferred Stock to common stock Will use proceeds primarily to repay debt Target leverage ratio from current ~ 4.39x to 4.0x by year-end 2019; 3.5x by year-end 2021 Ongoing evaluation of capital allocation to balance investing in the business, paying down debt and returning capital to shareholders Goal to create sustainable value for shareholders and maintain financial flexibility

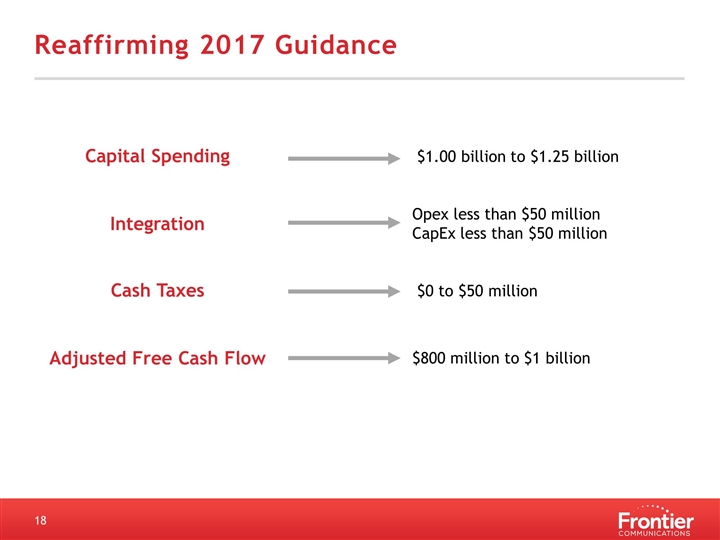
Capital Spending $1.00 billion to $1.25 billion Integration Opex less than $50 million CapEx less than $50 million Cash Taxes $0 to $50 million Adjusted Free Cash Flow $800 million to $1 billion Reaffirming 2017 Guidance
Conclusion Daniel McCarthy President & Chief Executive Officer
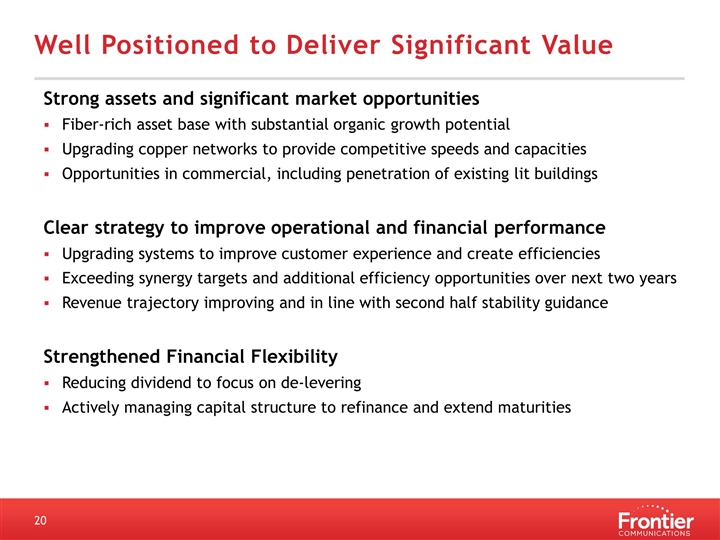
Well Positioned to Deliver Significant Value Strong assets and significant market opportunities Fiber-rich asset base with substantial organic growth potential Upgrading copper networks to provide competitive speeds and capacities Opportunities in commercial, including penetration of existing lit buildings Clear strategy to improve operational and financial performance Upgrading systems to improve customer experience and create efficiencies Exceeding synergy targets and additional efficiency opportunities over next two years Revenue trajectory improving and in line with second half stability guidance Strengthened Financial Flexibility Reducing dividend to focus on de-levering Actively managing capital structure to refinance and extend maturities

Appendix
Safe Harbor Statement Forward-looking language This earnings release contains "forward-looking statements," related to future, not past, events. Forward-looking statements address our expected future business and financial performance and financial condition, and contain words such as "expect," "anticipate," "intend," "plan," "believe," "seek," "see," "will," "would," or "target." Forward-looking statements by their nature address matters that are, to different degrees, uncertain. For us, particular uncertainties that could cause our actual results to be materially different than those expressed in our forward-looking statements include: competition from cable, wireless and wireline carriers, satellite, and OTT companies, and the risk that we will not respond on a timely or profitable basis; our ability to successfully adjust to changes in the communications industry, including the effects of technological changes and competition on our capital expenditures, products and service offerings; our ability to implement successfully our organizational structure changes; risks related to the operation of properties acquired from Verizon, including our ability to retain or obtain customers in those markets, our ability to realize anticipated cost savings, and our ability to meet commitments made in connection with the acquisition; reductions in revenue from our voice customers that we cannot offset with increases in revenue from broadband and video subscribers and sales of other products and services; our ability to maintain relationships with customers, employees or suppliers; our ability to attract/retain key talent; the impact of regulation and regulatory, investigative and legal proceedings and legal compliance risks; continued reductions in switched access revenues as a result of regulation, competition or technology substitutions; the effects of changes in the availability of federal and state universal service funding or other subsidies to us and our competitors; our ability to effectively manage service quality in our territories and meet mandated service quality metrics; our ability to successfully introduce new product offerings; the effects of changes in accounting policies or practices, including potential future impairment charges with respect to our intangible assets; our ability to effectively manage our operations, operating expenses, capital expenditures, debt service requirements and cash paid for income taxes and liquidity, which may affect payment of dividends on our common and preferred shares; the effects of changes in both general and local economic conditions on the markets that we serve; the effects of increased medical expenses and pension and postemployment expenses; the effects of changes in income tax rates, tax laws, regulations or rulings, or federal or state tax assessments; our ability to successfully renegotiate union contracts; changes in pension plan assumptions, interest rates, regulatory rules and/or the value of our pension plan assets, which could require us to make increased contributions to the pension plan in 2017 and beyond; adverse changes in the credit markets; adverse changes in the ratings given to our debt securities by nationally accredited ratings organizations; the availability and cost of financing in the credit markets; covenants in our indentures and credit agreements that may limit our operational and financial flexibility; the effects of state regulatory cash management practices that could limit our ability to transfer cash among our subsidiaries or dividend funds up to the parent company; the effects of severe weather events or other natural or man-made disasters, which may increase our operating expenses or adversely impact customer revenue; the impact of potential information technology or data security breaches or other disruptions; and the risks and other factors contained in our filings with the U.S. Securities and Exchange Commission, including our reports on Forms 10-K and 10-Q. Any of the foregoing events, or other events, could cause our results to vary from management’s forward-looking statements included in this earnings release. These risks and uncertainties may cause our actual future results to be materially different than those expressed in our forward-looking statements. We have no obligation to update or revise these forward-looking statements and do not undertake to do so.
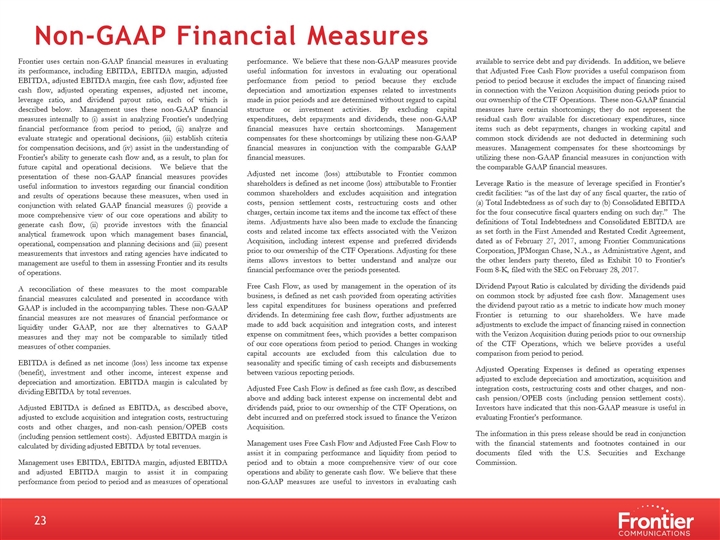
Non-GAAP Financial Measures Frontier uses certain non-GAAP financial measures in evaluating its performance, including EBITDA, EBITDA margin, adjusted EBITDA, adjusted EBITDA margin, free cash flow, adjusted free cash flow, adjusted operating expenses, adjusted net income, leverage ratio, and dividend payout ratio, each of which is described below. Management uses these non-GAAP financial measures internally to (i) assist in analyzing Frontier's underlying financial performance from period to period, (ii) analyze and evaluate strategic and operational decisions, (iii) establish criteria for compensation decisions, and (iv) assist in the understanding of Frontier's ability to generate cash flow and, as a result, to plan for future capital and operational decisions. We believe that the presentation of these non-GAAP financial measures provides useful information to investors regarding our financial condition and results of operations because these measures, when used in conjunction with related GAAP financial measures (i) provide a more comprehensive view of our core operations and ability to generate cash flow, (ii) provide investors with the financial analytical framework upon which management bases financial, operational, compensation and planning decisions and (iii) present measurements that investors and rating agencies have indicated to management are useful to them in assessing Frontier and its results of operations. A reconciliation of these measures to the most comparable financial measures calculated and presented in accordance with GAAP is included in the accompanying tables. These non-GAAP financial measures are not measures of financial performance or liquidity under GAAP, nor are they alternatives to GAAP measures and they may not be comparable to similarly titled measures of other companies. EBITDA is defined as net income (loss) less income tax expense (benefit), investment and other income, interest expense and depreciation and amortization. EBITDA margin is calculated by dividing EBITDA by total revenues. Adjusted EBITDA is defined as EBITDA, as described above, adjusted to exclude acquisition and integration costs, restructuring costs and other charges, and non-cash pension/OPEB costs (including pension settlement costs). Adjusted EBITDA margin is calculated by dividing adjusted EBITDA by total revenues. Management uses EBITDA, EBITDA margin, adjusted EBITDA and adjusted EBITDA margin to assist it in comparing performance from period to period and as measures of operational performance. We believe that these non-GAAP measures provide useful information for investors in evaluating our operational performance from period to period because they exclude depreciation and amortization expenses related to investments made in prior periods and are determined without regard to capital structure or investment activities. By excluding capital expenditures, debt repayments and dividends, these non-GAAP financial measures have certain shortcomings. Management compensates for these shortcomings by utilizing these non-GAAP financial measures in conjunction with the comparable GAAP financial measures. Adjusted net income (loss) attributable to Frontier common shareholders is defined as net income (loss) attributable to Frontier common shareholders and excludes acquisition and integration costs, pension settlement costs, restructuring costs and other charges, certain income tax items and the income tax effect of these items. Adjustments have also been made to exclude the financing costs and related income tax effects associated with the Verizon Acquisition, including interest expense and preferred dividends prior to our ownership of the CTF Operations. Adjusting for these items allows investors to better understand and analyze our financial performance over the periods presented. Free Cash Flow, as used by management in the operation of its business, is defined as net cash provided from operating activities less capital expenditures for business operations and preferred dividends. In determining free cash flow, further adjustments are made to add back acquisition and integration costs, and interest expense on commitment fees, which provides a better comparison of our core operations from period to period. Changes in working capital accounts are excluded from this calculation due to seasonality and specific timing of cash receipts and disbursements between various reporting periods. Adjusted Free Cash Flow is defined as free cash flow, as described above and adding back interest expense on incremental debt and dividends paid, prior to our ownership of the CTF Operations, on debt incurred and on preferred stock issued to finance the Verizon Acquisition. Management uses Free Cash Flow and Adjusted Free Cash Flow to assist it in comparing performance and liquidity from period to period and to obtain a more comprehensive view of our core operations and ability to generate cash flow. We believe that these non-GAAP measures are useful to investors in evaluating cash available to service debt and pay dividends. In addition, we believe that Adjusted Free Cash Flow provides a useful comparison from period to period because it excludes the impact of financing raised in connection with the Verizon Acquisition during periods prior to our ownership of the CTF Operations. These non-GAAP financial measures have certain shortcomings; they do not represent the residual cash flow available for discretionary expenditures, since items such as debt repayments, changes in working capital and common stock dividends are not deducted in determining such measures. Management compensates for these shortcomings by utilizing these non-GAAP financial measures in conjunction with the comparable GAAP financial measures. Leverage Ratio is the measure of leverage specified in Frontier’s credit facilities: “as of the last day of any fiscal quarter, the ratio of (a) Total Indebtedness as of such day to (b) Consolidated EBITDA for the four consecutive fiscal quarters ending on such day.” The definitions of Total Indebtedness and Consolidated EBITDA are as set forth in the First Amended and Restated Credit Agreement, dated as of February 27, 2017, among Frontier Communications Corporation, JPMorgan Chase, N.A., as Administrative Agent, and the other lenders party thereto, filed as Exhibit 10 to Frontier’s Form 8-K, filed with the SEC on February 28, 2017. Dividend Payout Ratio is calculated by dividing the dividends paid on common stock by adjusted free cash flow. Management uses the dividend payout ratio as a metric to indicate how much money Frontier is returning to our shareholders. We have made adjustments to exclude the impact of financing raised in connection with the Verizon Acquisition during periods prior to our ownership of the CTF Operations, which we believe provides a useful comparison from period to period. Adjusted Operating Expenses is defined as operating expenses adjusted to exclude depreciation and amortization, acquisition and integration costs, restructuring costs and other charges, and non-cash pension/OPEB costs (including pension settlement costs). Investors have indicated that this non-GAAP measure is useful in evaluating Frontier’s performance. The information in this press release should be read in conjunction with the financial statements and footnotes contained in our documents filed with the U.S. Securities and Exchange Commission.
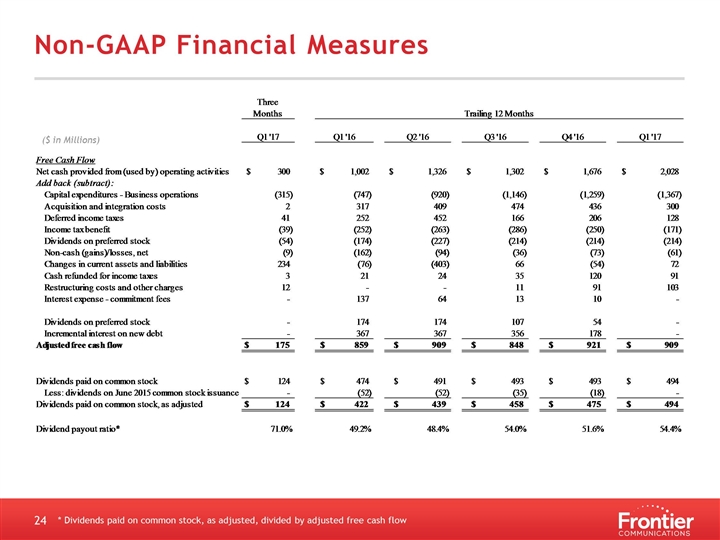
Non-GAAP Financial Measures * Dividends paid on common stock, as adjusted, divided by adjusted free cash flow ($ in Millions)
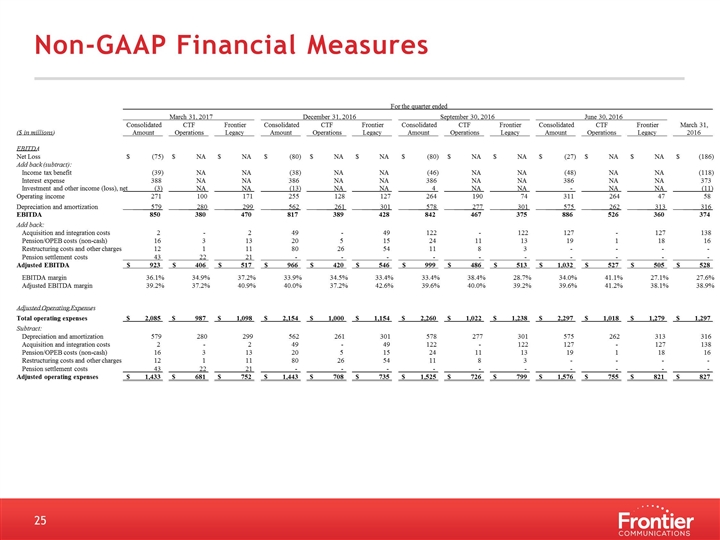
Non-GAAP Financial Measures ($ in millions) EBITDA Net Loss $ (75) $ NA $ NA $ (80) $ NA $ NA $ (80) $ NA $ NA $ (27) $ NA $ NA $ (186) Add back (subtract): Income tax benefit (39) NA NA (38) NA NA (46) NA NA (48) NA NA (118) Interest expense 388 NA NA 386 NA NA 386 NA NA 386 NA NA 373 Investment and other income (loss), net (3) NA NA (13) NA NA 4 NA NA - NA NA (11) Operating income 271 100 171 255 128 127 264 190 74 311 264 47 58 Depreciation and amortization 579 280 299 562 261 301 578 277 301 575 262 313 316 EBITDA 850 380 470 817 389 428 842 467 375 886 526 360 374 Add back: Acquisition and integration costs 2 - 2 49 - 49 122 - 122 127 - 127 138 Pension/OPEB costs (non-cash) 16 3 13 20 5 15 24 11 13 19 1 18 16 Restructuring costs and other charges 12 1 11 80 26 54 11 8 3 - - - - Pension settlement costs 43 22 21 - - - - - - - - - - Adjusted EBITDA $ 923 $ 406 $ 517 $ 966 $ 420 $ 546 $ 999 $ 486 $ 513 $ 1,032 $ 527 $ 505 $ 528 EBITDA margin 36.1% 34.9% 37.2% 33.9% 34.5% 33.4% 33.4% 38.4% 28.7% 34.0% 41.1% 27.1% 27.6% Adjusted EBITDA margin 39.2% 37.2% 40.9% 40.0% 37.2% 42.6% 39.6% 40.0% 39.2% 39.6% 41.2% 38.1% 38.9% Adjusted Operating Expenses Total operating expenses $ 2,085 $ 987 $ 1,098 $ 2,154 $ 1,000 $ 1,154 $ 2,260 $ 1,022 $ 1,238 $ 2,297 $ 1,018 $ 1,279 $ 1,297 Subtract: Depreciation and amortization 579 280 299 562 261 301 578 277 301 575 262 313 316 Acquisition and integration costs 2 - 2 49 - 49 122 - 122 127 - 127 138 Pension/OPEB costs (non-cash) 16 3 13 20 5 15 24 11 13 19 1 18 16 Restructuring costs and other charges 12 1 11 80 26 54 11 8 3 - - - - Pension settlement costs 43 22 21 - - - - - - - - - - Adjusted operating expenses $ 1,433 $ 681 $ 752 $ 1,443 $ 708 $ 735 $ 1,525 $ 726 $ 799 $ 1,576 $ 755 $ 821 $ 827 CTF Frontier December 31, 2016 Consolidated CTF Frontier June 30, 2016 Consolidated CTF Frontier March 31, Amount Operations Legacy 2016 For the quarter ended Amount Operations Legacy March 31, 2017 Consolidated CTF Frontier Amount Operations Legacy Amount Operations Legacy September 30, 2016 Consolidated
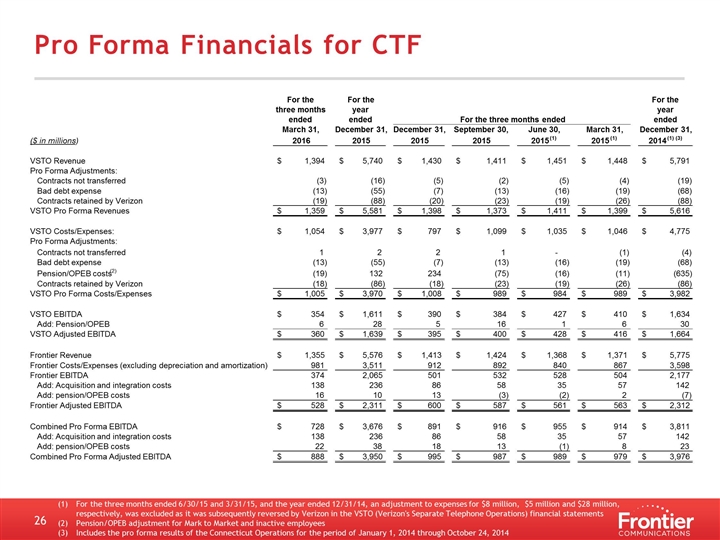
Pro Forma Financials for CTF For the three months ended 6/30/15 and 3/31/15, and the year ended 12/31/14, an adjustment to expenses for $8 million, $5 million and $28 million, respectively, was excluded as it was subsequently reversed by Verizon in the VSTO (Verizon's Separate Telephone Operations) financial statements Pension/OPEB adjustment for Mark to Market and inactive employees Includes the pro forma results of the Connecticut Operations for the period of January 1, 2014 through October 24, 2014 For the For the For the three months year year ended ended ended March 31, December 31, December 31, September 30, June 30, March 31, December 31, ($ in millions) 2016 2015 2015 2015 2015 (1) 2015 (1) 2014 (1) (3) VSTO Revenue 1,394 $ 5,740 $ 1,430 $ 1,411 $ 1,451 $ 1,448 $ 5,791 $ Pro Forma Adjustments: Contracts not transferred (3) (16) (5) (2) (5) (4) (19) Bad debt expense (13) (55) (7) (13) (16) (19) (68) Contracts retained by Verizon (19) (88) (20) (23) (19) (26) (88) VSTO Pro Forma Revenues 1,359 $ 5,581 $ 1,398 $ 1,373 $ 1,411 $ 1,399 $ 5,616 $ VSTO Costs/Expenses: 1,054 $ 3,977 $ 797 $ 1,099 $ 1,035 $ 1,046 $ 4,775 $ Pro Forma Adjustments: Contracts not transferred 1 2 2 1 - (1) (4) Bad debt expense (13) (55) (7) (13) (16) (19) (68) Pension/OPEB costs (2) (19) 132 234 (75) (16) (11) (635) Contracts retained by Verizon (18) (86) (18) (23) (19) (26) (86) VSTO Pro Forma Costs/Expenses 1,005 $ 3,970 $ 1,008 $ 989 $ 984 $ 989 $ 3,982 $ VSTO EBITDA 354 $ 1,611 $ 390 $ 384 $ 427 $ 410 $ 1,634 $ Add: Pension/OPEB 6 28 5 16 1 6 30 VSTO Adjusted EBITDA 360 $ 1,639 $ 395 $ 400 $ 428 $ 416 $ 1,664 $ Frontier Revenue 1,355 $ 5,576 $ 1,413 $ 1,424 $ 1,368 $ 1,371 $ 5,775 $ Frontier Costs/Expenses (excluding depreciation and amortization) 981 3,511 912 892 840 867 3,598 Frontier EBITDA 374 2,065 501 532 528 504 2,177 Add: Acquisition and integration costs 138 236 86 58 35 57 142 Add: pension/OPEB costs 16 10 13 (3) (2) 2 (7) Frontier Adjusted EBITDA 528 $ 2,311 $ 600 $ 587 $ 561 $ 563 $ 2,312 $ Combined Pro Forma EBITDA 728 $ 3,676 $ 891 $ 916 $ 955 $ 914 $ 3,811 $ Add: Acquisition and integration costs 138 236 86 58 35 57 142 Add: pension/OPEB costs 22 38 18 13 (1) 8 23 Combined Pro Forma Adjusted EBITDA 888 $ 3,950 $ 995 $ 987 $ 989 $ 979 $ 3,976 $ For the three months ended
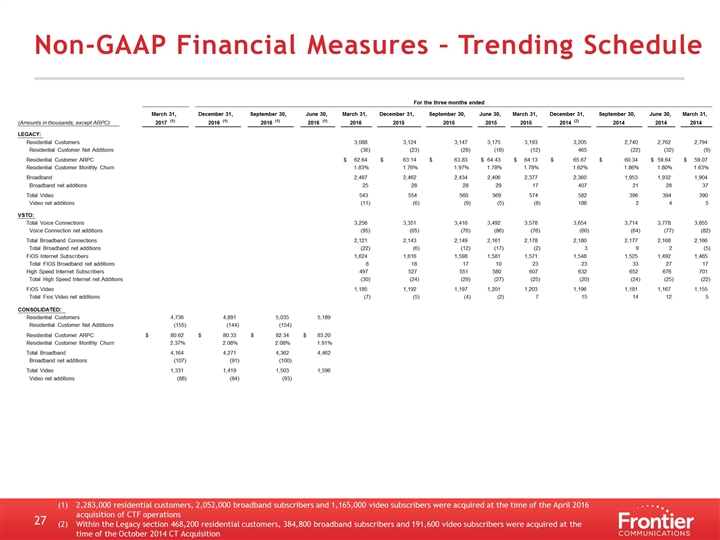
Non-GAAP Financial Measures – Trending Schedule 2,283,000 residential customers, 2,052,000 broadband subscribers and 1,165,000 video subscribers were acquired at the time of the April 2016 acquisition of CTF operations Within the Legacy section 468,200 residential customers, 384,800 broadband subscribers and 191,600 video subscribers were acquired at the time of the October 2014 CT Acquisition March 31, December 31, September 30, June 30, March 31, December 31, September 30, June 30, March 31, December 31, September 30, June 30, March 31, (Amounts in thousands, except ARPC) 2017 (1) 2016 (1) 2016 (1) 2016 (1) 2016 2015 2015 2015 2015 2014 (2) 2014 2014 2014 LEGACY: Residential Customers 3,088 3,124 3,147 3,175 3,193 3,205 2,740 2,762 2,794 Residential Customer Net Additions (36) (23) (28) (18) (12) 465 (22) (32) (9) Residential Customer ARPC 62.64 $ 63.14 $ 63.83 $ 64.43 $ 64.13 $ 65.67 $ 60.34 $ 59.64 $ 59.07 $ Residential Customer Monthly Churn 1.83% 1.76% 1.97% 1.78% 1.78% 1.62% 1.86% 1.80% 1.63% Broadband 2,487 2,462 2,434 2,406 2,377 2,360 1,953 1,932 1,904 Broadband net additions 25 28 28 29 17 407 21 28 37 Total Video 543 554 560 569 574 582 396 394 390 Video net additions (11) (6) (9) (5) (8) 186 2 4 5 VSTO: Total Voice Connections 3,256 3,351 3,416 3,492 3,578 3,654 3,714 3,778 3,855 Voice Connection net additions (95) (65) (76) (86) (76) (60) (64) (77) (82) Total Broadband Connections 2,121 2,143 2,149 2,161 2,178 2,180 2,177 2,168 2,166 Total Broadband net additions (22) (6) (12) (17) (2) 3 9 2 (5) FiOS Internet Subscribers 1,624 1,616 1,598 1,581 1,571 1,548 1,525 1,492 1,465 Total FIOS Broadband net additions 8 18 17 10 23 23 33 27 17 High Speed Internet Subscribers 497 527 551 580 607 632 652 676 701 Total High Speed Internet net Additions (30) (24) (29) (27) (25) (20) (24) (25) (22) FiOS Video 1,185 1,192 1,197 1,201 1,203 1,196 1,181 1,167 1,155 Total Fios Video net additions (7) (5) (4) (2) 7 15 14 12 5 CONSOLIDATED: Residential Customers 4,736 4,891 5,035 5,189 Residential Customer Net Additions (155) (144) (154) Residential Customer ARPC 80.62 $ 80.33 $ 82.34 $ 83.20 $ Residential Customer Monthly Churn 2.37% 2.08% 2.08% 1.91% Total Broadband 4,164 4,271 4,362 4,462 Broadband net additions (107) (91) (100) Total Video 1,331 1,419 1,503 1,596 Video net additions (88) (84) (93) For the three months ended
