Attached files
UNITED STATES SECURITIES AND EXCHANGE COMMISSION
Washington, D.C. 20549
FORM 10-K
☒ ANNUAL REPORT PURSUANT TO SECTION 13 OR 15(d) OF THE SECURITIES EXCHANGE ACT OF 1934
For the fiscal year ended December 31, 2017
or
☐ TRANSITION REPORT PURSUANT TO SECTION 13 OR 15(d) OF THE SECURITIES EXCHANGE ACT OF 1934
For the transition period from _________ to ___________
Commission file number 001-11001

FRONTIER COMMUNICATIONS CORPORATION
(Exact name of registrant as specified in its charter)
|
Delaware |
06-0619596 |
|
|
(State or other jurisdiction of |
(I.R.S. Employer Identification No.) |
|
|
incorporation or organization) |
|
|
|
|
|
|
|
401 Merritt 7 |
|
|
|
Norwalk, Connecticut |
|
06851 |
|
(Address of principal executive offices) |
|
(Zip Code) |
|
|
|
|
Registrant's telephone number, including area code: (203) 614-5600
Securities registered pursuant to Section 12(b) of the Act:
|
Title of each class |
|
Name of each exchange on which registered |
|
Common Stock, par value $0.25 per share |
|
The NASDAQ Stock Market LLC |
|
Series A Participating Preferred Stock Purchase Rights 11.125% Mandatory Convertible Preferred Stock, Series A |
|
The NASDAQ Stock Market LLC The NASDAQ Global Select Market |
Securities registered pursuant to Section 12(g) of the Act: NONE
Indicate by check mark if the registrant is a well-known seasoned issuer, as defined in Rule 405 of the Securities Act. Yes _X_ No ___
Indicate by check mark if the registrant is not required to file reports pursuant to Section 13 or 15(d) of the Act. Yes No X
Indicate by check mark whether the registrant (1) has filed all reports required to be filed by Section 13 or 15(d) of the Securities Exchange Act of 1934 during the preceding 12 months (or for such shorter period that the registrant was required to file such reports), and (2) has been subject to such filing requirements for the past 90 days. Yes X No __
Indicate by check mark whether the registrant has submitted electronically and posted on its corporate Website, if any, every Interactive Data File required to be submitted and posted pursuant to Rule 405 of Regulation S-T during the preceding 12 months (or for such shorter period that the registrant was required to submit and post such files). Yes X No __
Indicate by check mark if disclosure of delinquent filers pursuant to Item 405 of Regulation S-K is not contained herein, and will not be contained, to the best of registrant's knowledge, in definitive proxy or information statements incorporated by reference in Part III of this Form 10-K or any amendment to this Form 10-K. ☐
Indicate by check mark whether the registrant is a large accelerated filer, an accelerated filer, a non-accelerated filer, a smaller reporting company, or an emerging growth company. See definition of “accelerated filer,” “large accelerated filer”, “smaller reporting company”, and “emerging growth company” in Rule 12b-2 of the Exchange Act. (Check one):
Large Accelerated Filer ☒ Accelerated Filer ☐ Non-Accelerated Filer ☐
Smaller Reporting Company ☐ Emerging Growth Company ☐
If an emerging growth company, indicate by check mark if the registrant has elected not to use the extended transition period for complying with any new or revised financial accounting standards provided pursuant to Section 13(a) of the Exchange Act. ☐
Indicate by check mark whether the registrant is a shell company (as defined in Rule 12b-2 of the Exchange Act). Yes No X
The aggregate market value of common stock held by non-affiliates of the registrant on June 30, 2017 was $1,358,686,000 based on the closing price of $17.40 per share (on a post-split basis) on such date. The number of shares outstanding of the registrant's common stock as of February 10, 2018 was 78,408,000.
DOCUMENT INCORPORATED BY REFERENCE
Portions of the Proxy Statement for Frontier’s 2018 Annual Meeting of Stockholders are incorporated by reference into Part III of this Form 10-K.
FRONTIER COMMUNICATIONS CORPORATION AND SUBSIDIARIES
TABLE OF CONTENTS
|
PART I |
Page No. |
|
|
|
|
Item 1. Business |
2 |
|
|
|
|
Item 1A. Risk Factors |
12 |
|
|
|
|
Item 1B. Unresolved Staff Comments |
23 |
|
|
|
|
Item 2. Properties |
23 |
|
|
|
|
Item 3. Legal Proceedings |
23 |
|
|
|
|
Item 4. Mine Safety Disclosures |
23 |
|
|
|
|
PART II |
|
|
|
|
|
Item 5. Market for Registrant’s Common Equity, Related Stockholder Matters and Issuer |
|
|
24 |
|
|
|
|
|
Item 6. Selected Financial Data |
27 |
|
|
|
|
Item 7. Management’s Discussion and Analysis of Financial Condition and Results of |
|
|
28 |
|
|
|
|
|
Item 7A. Quantitative and Qualitative Disclosures About Market Risk |
52 |
|
|
|
|
52 |
|
|
|
|
|
Item 9. Changes in and Disagreements with Accountants on Accounting and Financial |
|
|
53 |
|
|
|
|
|
Item 9A. Controls and Procedures |
53 |
|
|
|
|
Item 9B. Other Information |
53 |
|
|
|
|
PART III |
|
|
|
|
|
Item 10. Directors, Executive Officers and Corporate Governance |
54 |
|
|
|
|
Item 11. Executive Compensation |
55 |
|
|
|
|
Item 12. Security Ownership of Certain Beneficial Owners and Management and Related |
|
|
55 |
|
|
|
|
|
Item 13. Certain Relationships and Related Transactions, and Director Independence |
55 |
|
|
|
|
55 |
|
|
|
|
|
PART IV |
|
|
|
|
|
56 |
|
|
|
|
|
61 |
|
|
|
|
|
F-1 |
FRONTIER COMMUNICATIONS CORPORATION AND SUBSIDIARIES
PART I
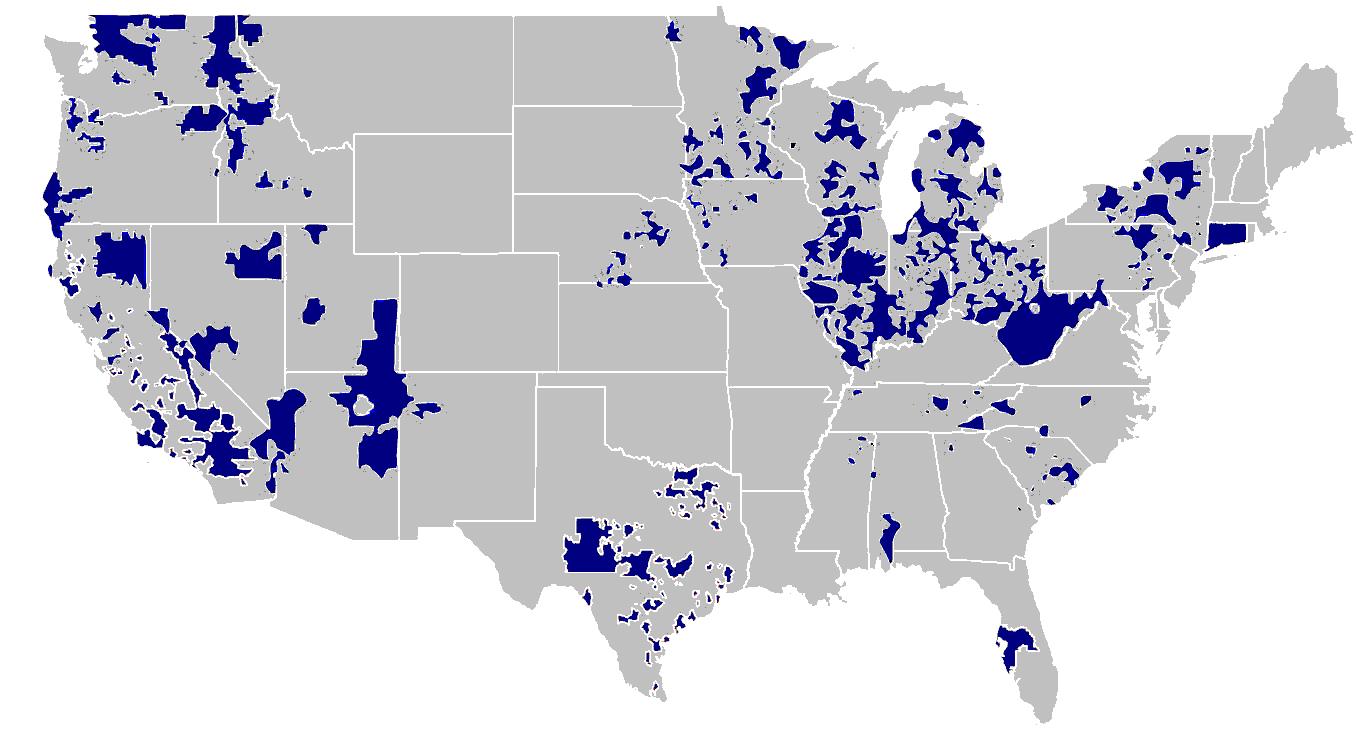
Frontier Communications Corporation (Frontier) is a provider of communications services in the United States, with approximately 4.9 million customers, 3.9 million broadband subscribers and 22,700 employees, operating in 29 states. In recent years, Frontier has completed multiple acquisitions. On April 1, 2016, we acquired the wireline operations of Verizon Communications, Inc. in California, Texas and Florida for a purchase price of $10,540 million in cash and assumed debt.
Frontier’s Service Territories
How We Serve Our Customers
We conduct business with both consumer and commercial customers.
Consumer. We provide broadband, video, voice and other services and products to our consumer customers. We deliver these services generally over a combination of fiber and copper-based networks.
Commercial (small, medium and large enterprise business (SME) as well as wholesale customers).
Commercial. We provide a broad range of services to our SME customers, including broadband service, Ethernet service, traditional circuit-based services (TDM services) and voice services. We also offer advanced hardware and network solutions and services.
|
o |
Larger Enterprise: Fortune 1000, multi-location companies, large government entities, large educational institutions, and non-profits. |
|
o |
Medium Business: Single or multi-location companies and mid-sized government entities, educational institutions and non-profits. |
|
o |
Small Business: Mostly single-location businesses, the smaller of which have purchase patterns similar to consumer customers. |
2
FRONTIER COMMUNICATIONS CORPORATION AND SUBSIDIARIES
|
o |
Wholesale: Wholesale customers are often referred to as carriers or service providers and include national operators such as AT&T and Verizon; Local Exchange Companies that need to access locations within Frontier’s footprint to offer local services; and wireless carriers and integrated carriers that offer a variety of services across all of these categories. Wholesale customers buy both voice and data services to supplement their own network infrastructure. |
Services and Products
We offer a broad portfolio of communications services for consumer and commercial customers. These services are offered on either a standalone basis or in a bundled package, depending on each customer’s needs.
Data and Internet services. We offer a comprehensive range of broadband and networking services. The principal consumer service we provide is broadband internet service. Commercial services include a complete portfolio of Ethernet services, dedicated internet, software defined wide area network (SDWAN), multiprotocol label switching (MPLS), time division multiplexing (TDM) data transport services and optical transport services. These services are all supported by 24/7 technical support and an advanced network operations center. We also offer wireless broadband services (using unlicensed spectrum) in select markets utilizing networks that we own or operate.
Video services. We offer video services under FiOS® brand in portions of California, Texas, Florida, Indiana, Oregon and Washington, and the VantageTM brand in portions of Connecticut, North Carolina, South Carolina, Minnesota, Illinois, New York, and Ohio. We also offer satellite TV video service to our customers under an agency relationship with DISH® in all of our markets.
Voice services. We provide voice services, including data-based VoIP, long-distance and voice messaging services, to consumer and commercial customers in all of our markets. These services are billed monthly in advance. Long-distance service to and from points outside our operating properties are provided by interconnection with the facilities of interexchange carriers. Our long-distance services are billed in advance for unlimited use service, and billed in arrears for services on a per minute-of-use basis.
We also offer packages of communications services. These packages permit customers to bundle their products and services, including voice service, video and Internet services, and other product offerings.
Access services. We offer a range of access services. Our switched access services allow other carriers to use our facilities to originate and terminate their local and long-distance voice traffic. These services are generally offered on a month-to-month basis and the service is billed primarily on a minutes-of-use basis. Switched access charges are based on access rates filed with the Federal Communications Commission (FCC) for interstate services and with the respective state regulatory agency for intrastate services. See “Regulatory Environment” below.
Advanced Hardware and Network Solutions. We offer our SME customers various hardware and network solutions utilizing cloud functionality and Customer Premise Equipment (CPE). We offer third-party communications equipment tailored to their specific business needs by partnering with Mitel, Cisco, Ingram Micro, Airbus, Avaya, Hewlett Packard, Adtran and other equipment manufacturers. CPE is typically sold in conjunction with voice, data and Internet services, and may also be sold on a standalone basis.
Frontier Operating Strategies
Consumer Business
Improve Customer Experience and Retention. We provide multiple service and product options to our consumer customers. Our strategy is to foster relationships and loyalty throughout the customer lifecycle in order to improve experiences, reduce churn and grow revenue. Our plan to retain customers includes providing easier access to account services and trouble-shooting options through online portals and user interfaces. We incorporate and utilize customer feedback to improve our product offerings with the goal of improving the overall customer experience for our subscribers. We focus and refine our marketing strategy for sales and retention to drive further improvement in the business.
New Customer Acquisition. We focus on broadband as the core growth component of our service offerings, either bundled with our voice and/or video services, or on a standalone basis. We seek to attract and retain a greater number of customers and increase average revenue per customer (ARPC). We are committed to
3
FRONTIER COMMUNICATIONS CORPORATION AND SUBSIDIARIES
growing our customer base through providing higher broadband speeds and capacity that will enable us to reach new markets, target new customers, and grow the business while maximizing our full footprint.
Improve Revenue Trends. As we expand the range of services we offer customers, increase the capabilities of our networks, and increase the penetration of our services, we increase our revenue opportunity and are better positioned to increase the average amount of revenue we can receive from a customer.
Commercial Business
Improve Revenue Trends. Our strategy is to achieve revenue growth in our Commercial business through the acquisition of new customers, increasing the penetration of services with existing customers, and improved retention of existing customers.
Offer a Competitive Product Portfolio. We offer both traditional services as well as an expanding range of advanced, packet-based services, such as Ethernet, SDWAN, Unified Communication as a Service (UCaaS) cloud-based connectivity for our large enterprise customers, and more cost-effective integrated voice and data services for our medium and small business customers.
New Customer Acquisition. We have increased our sales force with an emphasis on adding new customers and increasing penetration of existing customers, particularly in areas where we have a robust fiber network.
Improve Customer Experience and Retention. We plan to grow our revenues in the commercial sector through increased retention and deepening of existing customer relationships. The proper alignment of our sales force, service personnel, and resources will enable us to provide excellent service to our existing enterprise, medium and small business customers, while obtaining the greatest opportunities for revenue growth and expansion.
Company-Wide
Invest in our Network through Capital Expenditures. Our investment focus is the enhancement of our existing network and the expansion of fiber-based infrastructure in our network. We continue to upgrade network hardware, expand transport capacity of our middle-mile and data backbone, and enhance our video capabilities. Similarly, we are focused on enhancing our premium Ethernet service offerings across our network for our commercial customers.
Improve Productivity and Operational Efficiency. We continuously engage in productivity initiatives with a focus on simplifying our processes, eliminating redundancies and further reducing our cost structure while improving our customer service capabilities. We continue to migrate our network and systems to common operating platforms in order to increase efficiency and we have been migrating traffic to a common architecture to eliminate duplication.
Network Architecture and Technology
Our local exchange carrier networks consist of host central office and remote sites, primarily equipped with digital and Internet Protocol switches. The outside plant consists of transport and distribution delivery networks connecting our host central office with remote central offices and ultimately with our customers. We own fiber optic and copper cable, which have been deployed in our networks and are the primary transport technologies between our host and remote central offices and interconnection points with other incumbent carriers.
We have expanded and enhanced our fiber optic and copper transport systems to support increasing demand for high bandwidth transport services. We routinely enhance our network and upgrade with the latest Internet Protocol Transport and routing equipment, Reconfigurable Optical Add/Drop Multiplexers (ROADM) transport systems, Very High Bit-Rate Digital Subscriber Line (VDSL) broadband equipment, and VoIP switches. These systems support advanced services such as Ethernet, Dedicated Internet, Multiprotocol Label Switching (MPLS) transport, VoIP, and SDWAN. The network is designed with redundancy and auto-failover capability on our major circuits.
We connect to households and business locations in our service territory using a combination of fiber optic and copper technologies. In some cases we provide direct fiber into a residence or a business premises. In other cases a location is served with a hybrid combination of fiber and copper. Residences in our service territory are served by fiber-to-the-home (FTTH) and by fiber-to-the-node (FTTN), meaning fiber carries the traffic to an intermediate location where the
4
FRONTIER COMMUNICATIONS CORPORATION AND SUBSIDIARIES
signals are converted to copper wire for the final delivery to the household. We provide data, video, and voice services to customers over both of these architectures. Additionally, fixed wireless broadband (FWB) will play an important part of our future broadband strategy and could be deployed for some business Ethernet services. FWB is delivered by the use of an antenna on a Frontier base location and another antenna at the customer location.
Rapid and significant changes in technology are occurring in the communications industry. Our success will depend, in part, on our ability to anticipate and adapt to technological changes. We believe that our next generation network architecture strategy will enable us to respond to these ongoing technological changes efficiently. In addition, we anticipate reducing costs through the sharing of best practices across operations, centralization or standardization of functions and processes, and deployment of technologies and systems that provide for greater efficiencies and profitability. We will continue to make strategic enhancements to our network, with a focus on higher return investments.
Competitive Positioning
Competition for consumer customers comes from cable operators, wireless carriers and online video providers, among others.
|
- |
Cable operators: In a majority of our markets, cable operators offer high speed Internet, video and voice services similar to ours, and compete with us aggressively on speed and price by marketing their offerings with significant promotional period pricing. |
|
- |
Wireless carriers: Wireless operators primarily compete with us for broadband, video, and voice services in our markets by offering increasingly larger data packages to mobile customers. The percentage of homes with a landline telephone has been declining, a trend we expect will continue. |
|
- |
Online video providers: Many consumers are opting for internet-delivered video services (Over the Top, or OTT) through online service providers rather than traditional, multi-channel video. In response, we have made investments in our network to deliver OTT video content to consumers who might not opt for traditional video services. The percentage of homes with a video product has been declining, a trend we expect will continue. |
Many consumer customers prefer to bundle their voice, data, Internet and video services with a single provider. In areas where we do not directly offer a network-based video service, we offer satellite TV video service through DISH. This can positively impact acquisition of new customers and retention of existing customers, representing a critical factor for the attachment of video, broadband and voice products. As of December 31, 2017, 50% of our consumer customers subscribed to at least two service offerings, and 17% subscribed to at least three service offerings.
Competition for commercial customers comes from telecommunications providers, cable operators, Competitive Local Exchange Companies and other enterprises, some of which are substantially larger than us. As compared to our consumer customers, these customers often require more sophisticated and more data-centered solutions (e.g., IP PBX, E911 networks, Ethernet and SIP trunking).
In order to remain competitive, we continue to evolve our product offerings to stay current with the changing needs of the market, to provide strong customer service and support, to invest in our network so we maintain adequate capacity and can deliver new capabilities as needed, and to package our offerings to make them attractive to customers.
5
FRONTIER COMMUNICATIONS CORPORATION AND SUBSIDIARIES
Regulatory Environment
Some of our operations are subject to regulation by the FCC and various state regulatory agencies, often called public service or utility commissions. We expect federal and state lawmakers, the FCC and the state regulatory agencies to continue to revise the statutes and regulations governing communications services.
Regulation of our business
We are subject to federal, state and local regulation and we have various regulatory authorizations for our regulated service offerings. At the federal level, the FCC generally exercises jurisdiction over information services, interstate or international telecommunications services and over facilities to the extent they are used to provide, originate or terminate interstate or international services. State regulatory commissions generally exercise jurisdiction over intrastate telecommunications services and the facilities used to provide, originate or terminate those services. Most of our local exchange companies operate as incumbent carriers in the states in which they operate and are certified in those states to provide local telecommunications services. Certain federal and state agencies, including attorneys general, monitor and exercise oversight related to consumer protection issues. In addition, local governments often regulate the public rights-of-way necessary to install and operate networks and may require service providers to obtain licenses or franchises regulating their use of public rights-of-way. Municipalities and other local government agencies also may regulate other limited aspects of our business, by requiring us to obtain cable franchises and construction permits and to abide by applicable building codes.
Some states’ regulatory agencies have substantial oversight over incumbent telephone companies, and their interconnection with competitive providers and provision of non-discriminatory network access to certain network elements to them. Under the Federal Telecommunications Act of 1996, state regulatory commissions have jurisdiction to arbitrate and review interconnection disputes and agreements between incumbent telephone companies and competitive local exchange carriers, in accordance with rules set by the FCC. The FCC and some state regulatory commissions also impose fees on providers of telecommunications services to support state universal service programs. Many of the states in which we operate require prior approvals or notifications for certain acquisitions and transfers of assets, customers, or ownership of regulated entities.
Additionally, in some states we are subject to operating restrictions and minimum service quality standards. Failure to meet such restrictions may result in penalties. We also are required to report certain financial information. At the federal level and in a number of the states in which we operate, we are subject to price cap or incentive regulation plans under which prices for regulated services are capped. Some of these plans have limited terms and, as they expire, we may need to renegotiate with various states. These negotiations could impact rates, service quality and/or infrastructure requirements, which could also impact our earnings and capital expenditures. In other states in which we operate, we are subject to rate of return regulation that limits levels of earnings and returns on investments. Approximately 19% of our total access lines at December 31, 2017 are in state jurisdictions under the rate of return regulatory model. We continue to advocate for no or reduced regulation with various regulatory agencies in those states. In some of the states we operate in we have already been successful in reducing or eliminating price regulation on end-user services.
Federal Regulatory Environment
Frontier, along with all telecommunications providers, is subject to FCC rules governing privacy of specified customer information. Among other things, these rules obligate carriers to implement procedures to: protect specified customer information from inappropriate disclosure; obtain customer permission to use specified information in marketing; authenticate customers before disclosing account information; and annually certify compliance with the FCC’s rules. Although most of these regulations are generally consistent with our business plans, they may restrict our flexibility in operating our business.
Some regulations are, or could in the future be, the subject of judicial proceedings, legislative hearings and administrative proposals or challenges that could change the manner in which the entire industry operates. Neither the outcome of any of these developments, nor their potential impact on us, can be predicted at this time. Regulation can change rapidly in the communications industry, and such changes may have an adverse effect on us.
The current status of material regulatory initiatives is as follows:
6
FRONTIER COMMUNICATIONS CORPORATION AND SUBSIDIARIES
Federal High-Cost Subsidies: The FCC has adopted rules changing the eligibility requirements for federal subsidies offered to wireline carriers providing service to high-cost, low-density markets, as well as the amounts of such subsidies, as follows:
Connect America Fund (CAF): On November 18, 2011, the FCC adopted the Universal Service Fund (USF)/Intercarrier Compensation (ICC) Report and Order (the 2011 Order), which changed how federal subsidies are calculated and disbursed, and began the transition of the high-cost component of the Federal USF, which supported voice services in high-cost areas, to the CAF, which supports broadband deployment in high-cost areas. Frontier received $133 million from 2012 through 2014 across two rounds of CAF Phase I funding to make broadband available to approximately 194,600 previously unserved or underserved locations. We completed deployment of broadband service to the first round of CAF Phase I households in 2015 and to the second round of CAF Phase I locations in March 2017 as required by the FCC rules.
On April 29, 2015, the FCC released offers of support to price cap carriers under the CAF Phase II program. The intent of these offers is to provide long-term support for carriers for establishing and providing broadband service with at least 10 Mbps downstream/1 Mbps upstream speeds in high cost areas unserved by a competitor. Frontier accepted the CAF Phase II offer in 29 states, including our CTF properties, which provides for $332 million in annual support through 2020, and a commitment to make broadband available to approximately 774,000 households. CAF Phase II support is a successor to the approximately $156 million in annual USF frozen high cost support that Frontier had been receiving prior to the CTF acquisition, and the $42 million in annual transitional USF frozen high cost support that Verizon had been receiving in California and Texas. In addition to the annual support levels, these amounts also include frozen support phasedown amounts in states where the annual CAF II funding is less than the prior annual frozen high cost support funding. The frozen support phasedown support was $17 million in 2017 and is expected to be $9 million in 2018.
In 2017, the FCC adopted a competitive bidding process to distribute approximately $200 million per year in CAF Phase II funding in those high-cost areas where price cap carriers declined the FCC’s offer of support, possibly presenting a new support and deployment opportunity. The FCC released the eligible areas in December 2017 but the competitive bidding process has not yet been fully finalized. Therefore, Frontier is unable to determine whether it will participate in any competitive bid process at this time.
Intercarrier Compensation: In the 2011 Order, the FCC also reformed Intercarrier Compensation, which is the payment framework that governs how carriers compensate each other for the exchange of interstate switched traffic, and began a multi-year transition to the new rates. The 2011 Order provided for the gradual elimination of effectively all terminating traffic charges by July 2017. Frontier’s switched access revenue declined sequentially in the third quarter of 2017, reflecting the rate reductions mandated by the 2011 Order, and we anticipate that we have experienced nearly all of the rate decline related to the 2011 Order. Frontier has been able to recover a significant portion of those lost revenues through end user rates and other replacement support mechanisms, a trend we expect will continue. There are no longer any active Intercarrier Compensation-related challenges to the 2011 Order. However, the 2011 Order did not resolve all questions on originating access rates. The FCC continues to consider the possibility of a transition of originating access rates, although the impact on Frontier, if any, is unknown at this time. Our total revenue for Intercarrier Compensation was $7 million for the year ended December 31, 2017.
Special Access: In April 2016, the FCC released a Notice of Proposed Rulemaking on special access or “business data” services. It sought comment on proposed changes to the way the FCC regulates traditional special access services based on market competition, and on a proposal to adopt pricing rules for Ethernet services in markets that are found to be “noncompetitive.” In August 2017, the FCC’s decision in this proceeding, which deregulates the market for end user special access services where the market is determined to be competitive and deregulates the transport market nationwide, became effective. This decision is generally favorable in that it gives Frontier more flexibility to operate its business in a deregulated fashion like its competitors in the market. Frontier is in the process of implementing various aspects of this decision and otherwise adjusting its rates on select business data service elements in response to market conditions. Some aspects of the decision are under appeal by stakeholders, including Frontier. Whether the appeals will be successful on any grounds is unknown.
Intrastate Services: Some state regulatory commissions regulate some of the rates ILECs charge for intrastate services, including originating switched access rates for intrastate access services paid by providers of intrastate long-distance services. Some states also have their own open proceedings to address reform to originating intrastate access charges and other intercarrier compensation and state universal service funds. Although the FCC has pre-empted state jurisdiction on most access charges, some states could consider moving forward with their proceedings.
7
FRONTIER COMMUNICATIONS CORPORATION AND SUBSIDIARIES
We cannot predict when or how these matters will be decided or the effect on our subsidy or switched access revenues. Our total revenue for Intrastate switched access services was $53 million for the year ended December 31, 2017, spread across all the states we serve.
Current and Potential Internet Regulatory Obligations and Privacy: In December 2017 the FCC voted to overturn the FCC’s 2015 decision in which it had asserted jurisdiction over broadband service, declared broadband a “Title II” telecommunications service, and imposed rules to “preserve a Free and Open Internet” (i.e., net neutrality). Specifically, the FCC voted to eliminate explicit bans on blocking, throttling and paid prioritization in favor of requiring Internet service providers (ISPs) to be fully transparent about their practices. Both the FCC and Federal Trade Commission (FTC) will now have a role in ensuring that the ISPs are managing their network in the manner in which they publicly state they are.
The December 2017 decision also puts ISPs on an equal footing with other online web companies with respect to privacy rules, with the FTC being the lead agency on privacy enforcement. This decision follows Congress’s March 2017 action under the Congressional Review Act to vacate the 2015 rules that created a separate and more onerous privacy regime for ISPs than other online web companies. Frontier’s Internet service will now be subject to the same privacy rules as online web companies, including disclosure of its practices to consumers, which is Frontier’s current practice.
The December 2017 ruling is not yet effective and will likely be appealed in court. Meanwhile, the 2015 ruling is still under appeal, though it now appears moot. Frontier continues to comply with the existing regulatory requirements, and it is unclear whether the pending or future appeals will have any impact on the regulatory structure.
Video programming
Federal, state and local governments extensively regulate the video services industry. Our FiOS and Vantage video services are subject to, among other things: subscriber privacy regulations; requirements that we carry a local broadcast station or obtain consent to carry a local or distant broadcast station; rules for franchise renewals and transfers; the manner in which program packages are marketed to subscribers; and program access requirements.
We provide video programming in some of our markets in California, Connecticut, Florida, Illinois, Indiana, Minnesota, New York, North Carolina, Ohio, Oregon, South Carolina, Texas and Washington pursuant to franchises, permits and similar authorizations issued by state and local franchising authorities. Most franchises are subject to termination proceedings in the event of a material breach. In addition, most franchises require payment of a franchise fee as a requirement to the granting of authority.
Many franchises establish comprehensive facilities and service requirements, as well as specific customer service standards and monetary penalties for non-compliance. In many cases, franchises are terminable if the franchisee fails to comply with material provisions set forth in the franchise agreement governing system operations. We believe that we are in compliance and meeting all material standards and requirements. Franchises are generally granted for fixed terms of at least ten years and must be periodically renewed. Local franchising authorities may resist granting a renewal if either past performance or the prospective operating proposal is considered inadequate.
Environmental regulation
The local exchange carrier subsidiaries we operate are subject to federal, state and local laws and regulations governing the use, storage, disposal of, and exposure to hazardous materials, the release of pollutants into the environment and the remediation of contamination. As an owner and former owner of property, we are subject to environmental laws that could impose liability for the entire cost of cleanup at contaminated sites, including sites formerly owned by us, regardless of fault or the lawfulness of the activity that resulted in contamination. We believe that our operations are in substantial compliance with applicable environmental laws and regulations.
Segment Information
We currently operate in one reportable segment.
Financial Information about Foreign and Domestic Operations and Export Sales
We have no foreign operations.
8
FRONTIER COMMUNICATIONS CORPORATION AND SUBSIDIARIES
General
The dollar amount of our order backlog is not a significant consideration in our business and is not a meaningful metric for us. We have no material contracts or subcontracts that may be subject to renegotiation of profits or termination at the election of the federal government.
Intellectual Property
We believe that we have the trademarks, trade names and intellectual property licenses that are necessary for the operation of our business.
We own or have the rights to use various trademarks, service marks and trade names referred to in this report. Solely for convenience, we refer to trademarks, service marks and trade names in this prospectus without the ™, SM and ® symbols. Such references are not intended to indicate, in any way, that we will not assert, to the fullest extent permitted by law, our rights to our trademarks, service marks and trade names. Other trademarks, trade names or service marks appearing in this report are the property of their respective owners.
Employees
As of December 31, 2017, we had approximately 22,700 employees, as compared to approximately 28,300 employees as of December 31, 2016. During 2017, reduction in workforce activities resulted in the severance of approximately 1,300 employees. Approximately 16,000 of our total employees are represented by unions as of December 31, 2017. The number of employees covered by a collective bargaining agreement that expired in 2017, but have been extended and are still effective for 2018, is approximately 1,400. The number of employees covered by collective bargaining agreements that expire in 2018 is approximately 4,300. We consider our relations with our employees to be good.
Available Information
We are subject to the informational requirements of the Securities Exchange Act of 1934 (the Exchange Act). Accordingly, we file periodic reports, proxy statements and other information with the Securities and Exchange Commission (SEC). These reports, proxy statements and other information may be obtained by visiting the Public Reference Room of the SEC at 100 F Street, NE, Washington, D.C. 20549 or by calling the SEC at 1-800-SEC-0330. In addition, the SEC maintains an Internet site (www.sec.gov) that contains reports, proxy and information statements and other information regarding Frontier and other issuers that file electronically.
We make available, free of charge on our website, our Annual Report on Form 10-K, Quarterly Reports on Form 10-Q, Current Reports on Form 8-K and amendments to these reports filed or furnished pursuant to Section 13(a) or 15(d) of the Exchange Act, as soon as practicable after we electronically file these documents with, or furnish them to, the SEC. These documents may be accessed through our website at www.frontier.com under “Investor Relations.” The information posted or linked on our website is not part of, or incorporated by reference into, this report. We also make our Annual Report available in printed form upon request at no charge.
We also make available on our website, as noted above, or in printed form upon request, free of charge, our Corporate Governance Guidelines, Code of Business Conduct and Ethics, Specific Code of Business Conduct and Ethics Provisions for Certain Officers, and the charters for the Audit, Compensation, and Nominating and Corporate Governance committees of the Board of Directors. Stockholders may request printed copies of these materials by writing to: 401 Merritt 7, Norwalk, Connecticut 06851 Attention: Corporate Secretary.
9
FRONTIER COMMUNICATIONS CORPORATION AND SUBSIDIARIES
Forward-Looking Statements
This Annual Report on Form 10-K contains "forward-looking statements," related to future events. Forward-looking statements address our expected future business and financial performance and financial condition, and contain words such as "expect," "anticipate," "intend," "plan," "believe," "seek," "see," "may," “will,” "would," or "target." Forward-looking statements by their nature address matters that are, to different degrees, uncertain. For us, particular uncertainties that could cause our actual results to be materially different than those expressed in our forward-looking statements include:
|
· |
competition from cable, wireless and wireline carriers, satellite, and OTT companies, and the risk that we will not respond on a timely or profitable basis; |
|
· |
our ability to successfully adjust to changes in the communications industry, including the effects of technological changes and competition on our capital expenditures, products and service offerings; |
|
· |
our ability to implement organizational structure changes successfully; |
|
· |
risks related to the operation of our properties, including our ability to retain or obtain customers in our Legacy markets and those acquired from Verizon; |
|
· |
our ability to realize anticipated cost savings and our ability to meet commitments made in connection with the Verizon acquisition; |
|
· |
reductions in revenue from our voice customers that we cannot offset with increases in revenue from broadband and video subscribers and sales of other products and services; |
|
· |
our ability to maintain relationships with customers, employees or suppliers; |
|
· |
the effects of governmental legislation and regulation on our business, such as the repeal of net neutrality, including costs, disruptions, possible limitations on operating flexibility and changes to the competitive landscape resulting from such legislation or regulation; |
|
· |
the impact of regulatory, investigative and legal proceedings and legal compliance risks; |
|
· |
government infrastructure projects (such as highway construction) that impact our capital expenditures; |
|
· |
continued reductions in switched access revenues as a result of regulation, competition or technology substitutions; |
|
· |
the effects of changes in the availability of federal and state universal service funding or other subsidies to us and our competitors; |
|
· |
our ability to meet our remaining CAF II funding obligations on a timely basis, it could be subject to penalties or obligations to return certain CAF II funds; |
|
· |
our ability to effectively manage service quality in our territories and meet mandated service quality metrics; |
|
· |
our ability to successfully introduce new product offerings; |
|
· |
the effects of changes in accounting policies or practices, including potential future impairment charges with respect to our intangible assets; |
|
· |
our ability to effectively manage our operations, operating expenses, capital expenditures, debt service requirements and cash paid for income taxes and liquidity; |
10
FRONTIER COMMUNICATIONS CORPORATION AND SUBSIDIARIES
|
· |
the effects of changes in both general and local economic conditions in the markets that we serve; |
|
· |
the effects of increased medical expenses and pension and postemployment expenses; |
|
· |
the effects of changes in income tax rates, tax laws, regulations or rulings, or federal or state tax assessments, including the risk that such changes may benefit our competitors more than us; |
|
· |
our ability to successfully renegotiate union contracts; |
|
· |
changes in pension plan assumptions, interest rates, discount rates, regulatory rules and/or the value of our pension plan assets, which could require us to make increased contributions to the pension plan in 2018 and beyond; |
|
· |
adverse changes in the credit markets; |
|
· |
adverse changes in the ratings given to our debt securities by nationally accredited ratings organizations; |
|
· |
the availability and cost of financing in the credit markets; |
|
· |
covenants in our indentures and credit agreements that may limit our operational and financial flexibility as well as our ability to access the capital markets in the future; |
|
· |
the effects of state regulatory cash management practices that could limit our ability to transfer cash among our subsidiaries or dividend funds up to the parent company; |
|
· |
the effects of severe weather events or other natural or man-made disasters, which has, and may in the future, increase our operating and capital expenses or adversely impact customer revenue; and |
|
· |
the impact of potential information technology or data security breaches or other disruptions. |
Any of the foregoing events, or other events, could cause our results to vary from management’s forward-looking statements included in this report. You should consider these important factors, as well as the risks set forth under Item 1A. “Risk Factors,” in evaluating any statement in this report or otherwise made by us or on our behalf. We have no obligation to update or revise these forward-looking statements and do not undertake to do so.
Investors should also be aware that while we do, at various times, communicate with securities analysts, it is against our policy to disclose to them selectively any material non-public information or other confidential information. Accordingly, investors should not assume that we agree with any statement or report issued by an analyst, irrespective of the content of the statement or report. To the extent that reports issued by securities analysts contain any projections, forecasts or opinions, such reports are not our responsibility.
11
FRONTIER COMMUNICATIONS CORPORATION AND SUBSIDIARIES
Before you make an investment decision with respect to any of our securities, you should carefully consider all the information we have included in this Annual Report on Form 10-K and our subsequent filings with the SEC. In particular, you should carefully consider the risk factors described below and the risks and uncertainties related to “Forward-Looking Statements,” any of which could materially adversely affect our business, operating results, financial condition and the actual outcome of matters as to which forward-looking statements are made in this annual report. The risks and uncertainties described below are not the only ones facing Frontier. Additional risks and uncertainties that are not presently known to us or that we currently deem immaterial or that are not specific to us, such as general economic conditions, may also adversely affect our business and operations. The following risk factors should be read in conjunction with the balance of this annual report, including the consolidated financial statements and related notes included in this report.
Risks Related to Our Business
We have experienced declining revenues and may experience further declines in our revenues going forward.
We have experienced declining revenues as a result of declining voice services revenues, lower switched and nonswitched access revenues and declining video and data services revenues. Such declines have been driven primarily by customer losses, changing technology and consumer behavior (such as wireless displacement of wireline use, e-mail use, instant messaging and increasing use of VoIP), increased competition, regulatory constraints and financial decisions by governmental authorities. There can be no assurances that we will be able to stabilize or increase our revenues in the future. Future declines in our revenues could materially and adversely impact our ability to execute on our business strategy, comply with our financial covenants, repay our debts as they become due, negotiate with third parties or attract and retain employees.
We may be unable to stabilize or grow our revenues and cash flows despite the initiatives we have implemented.
We must produce adequate revenues and operating cash flows that, when combined with cash on hand and funds available under our revolving credit facility and other financings, will be sufficient to service our debt, fund our capital expenditures, pay our taxes, and fund our pension and other employee benefit obligations. We have experienced revenue declines in 2017 and 2016 as compared to prior years. While we have identified potential areas of opportunity and implemented several revenue and cost initiatives, we cannot assure you that these efforts will be successful or that these initiatives will improve our financial position or our results of operations.
We face intense competition.
The communications industry is extremely competitive. Through mergers and various service expansion strategies, service providers are striving to provide integrated solutions both within and across geographic markets. Our competitors include competitive local exchange carriers, Internet service providers, wireless companies, OTT, VoIP providers and cable companies, some of which may be subject to less regulation than we are. These entities may provide services competitive with the services that we offer or intend to introduce. For example, our competitors may seek to introduce networks in our legacy markets that are competitive with or superior to our copper-based networks in those markets. We also believe that wireless and cable providers have increased their penetration of various services in our markets. We expect that competition will remain robust. Our revenue and cash flow will be adversely impacted if we cannot reverse our customer losses or continue to provide high-quality services.
We cannot predict which of the many possible future technologies, products or services will be important in order to maintain our competitive position or what expenditures will be required to develop and provide these technologies, products or services. Our ability to compete successfully will depend on the effectiveness of capital expenditure investments in our properties, our marketing efforts, our ability to anticipate and respond to various competitive factors affecting the industry, including a changing regulatory environment that may affect our business and that of our competitors differently, new services that may be introduced, changes in consumer preferences, or habits, demographic trends, economic conditions and pricing strategies by competitors. Increasing competition may
12
FRONTIER COMMUNICATIONS CORPORATION AND SUBSIDIARIES
reduce our revenues and increase our marketing and other costs as well as require us to increase our capital expenditures and thereby decrease our cash flows.
Some of our competitors have superior resources, which may place us at a disadvantage.
Some of our competitors have market presence, engineering, technical, marketing and financial capabilities, substantially greater than ours. In addition, some of these competitors are able to raise capital at a lower cost than we are able to. Consequently, some of these competitors may be able to develop and expand their communications and network infrastructures more quickly, adapt more swiftly to new or emerging technologies and changes in customer requirements, take advantage of acquisition and other opportunities more readily and devote greater resources to the marketing and sale of their products and services than we will be able to. Additionally, the greater brand name recognition of some competitors may require us to price our services at lower levels in order to retain or obtain customers. Finally, the cost advantages and greater financial resources of some of these competitors may give them the ability to reduce their prices for an extended period of time if they so choose. Our business and results of operations may be materially adversely impacted if we are not able to effectively compete.
Weak economic conditions may decrease demand for our services or necessitate increased discounts.
We could be adversely impacted by weak economic conditions or their effects. Downturns in the economy and competition in our markets have in the past, and could in the future, cause some of our customers to reduce or eliminate their purchases of our basic and enhanced voice services, broadband and video services and make it difficult for us to obtain new customers or retain existing customers. In addition, if economic conditions are depressed or further deteriorate, our customers may delay or discontinue payment for our services or seek more competitive pricing from other service providers, or we may be required to offer increased discounts in order to retain our customers, which could have a material adverse effect on our business or results of operations.
Disruption in our networks, infrastructure and information technology may cause us to lose customers and/or incur additional expenses.
To attract and retain customers, we must provide reliable service. Some of the risks to our networks, infrastructure and information technology include physical damage, security breaches, capacity limitations, power surges or outages, software defects and other disruptions beyond our control, such as natural disasters and acts of terrorism. From time to time in the ordinary course of business, we experience disruptions in our service due to factors such as cable damage, theft of our equipment, inclement weather and service failures of our third-party service providers. We could experience more significant disruptions in the future. We could also face disruptions due to capacity limitations if changes in our customers’ usage patterns for our broadband services result in a significant increase in capacity utilization, such as through increased usage of video or peer-to-peer file sharing applications. We could also face disruptions in our networks if third-party providers elect not to continue doing business with us or put their services up for auction and we are not able to retain their services as a result. Disruptions may cause interruptions in service or reduced capacity for customers, either of which could cause us to lose customers, or increase our operating expense, all of which could adversely affect our business, revenues and cash flows.
Our business is sensitive to the creditworthiness of our wholesale customers.
We have substantial business relationships with other communications carriers for which we provide service. While bankruptcies or insolvency of these carriers have not had a material adverse effect on our business in recent years, future bankruptcies or insolvencies in the industry could result in the loss of significant customers, as well as cause more price competition and an increased allowance for doubtful accounts receivable. Such bankruptcies and insolvencies may be more likely in the future if economic conditions stagnate. As a result, our revenues and results of operations could be materially and adversely affected.
A significant portion of our workforce is represented by labor unions.
As of December 31, 2017, we had approximately 22,700 employees. Approximately 16,000 of our total employees were represented by unions and were subject to collective bargaining agreements. As of December 31, 2017, we had approximately 1,400 employees covered by a collective bargaining agreement that expired in 2017, but have been extended and are still effective for 2018. Of the union-represented employees as of December 31, 2017, approximately 4,300, or 27%, of the unionized workforce are covered by collective agreements that expire in
13
FRONTIER COMMUNICATIONS CORPORATION AND SUBSIDIARIES
2018 and approximately 7,600, or 48%, of the unionized workforce are covered by collective bargaining agreements that expire in 2019.
We cannot predict the outcome of negotiations of the collective bargaining agreements covering our employees. If we are unable to reach new agreements or renew existing agreements, employees subject to collective bargaining agreements may engage in strikes, work slowdowns or other labor actions, which could materially disrupt our ability to provide services. New labor agreements or the renewal of existing agreements may impose significant new costs on us, which could adversely affect our financial condition and results of operations in the future.
If we are unable to hire or retain key personnel, we may be unable to operate our business successfully.
Our success will depend in part upon the continued services of our management. We cannot guarantee that our key personnel will not leave or compete with us. The loss, incapacity or unavailability for any reason of key members of our management team could have a material impact on our business. In addition, our financial results and our ability to compete will suffer if we are unable to attract or retain other qualified personnel in the future.
We may be unable to realize the anticipated benefits of recent acquisitions.
In recent years, we have completed multiple acquisitions. We cannot assure you that we will be able to realize the full benefit of any anticipated growth opportunities or cost synergies from such acquisitions or that these benefits will be realized within the expected time frames.
We have a significant amount of goodwill and other intangible assets on our balance sheet. We recorded goodwill impairments in 2017 and if our goodwill or other intangible assets become further impaired, we may be required to record additional non-cash charges a non-cash charge to earnings and reduce our stockholders’ equity.
Under generally accepted accounting principles, intangible assets are reviewed for impairment on an annual basis or more frequently whenever events or circumstances indicate that their carrying value may not be recoverable. Frontier monitors relevant circumstances, including general economic conditions, enterprise value EBITDA multiples for other providers of communications services, our overall financial performance, and the market prices for our stock, and the potential impact that changes in such circumstances might have on the valuation of Frontier’s goodwill or other intangible assets. As a result of the continued decline in the share price of our common stock in each of the four quarters in 2017, we tested goodwill for impairment. Our second and fourth quarter quantitative assessments indicated that the carrying value of the enterprise exceeded its fair value and, therefore, an impairment existed. We recorded goodwill impairments totaling $2,748 million for 2017.If our goodwill or other intangible assets are determined to be further impaired in the future, we may be required to record a non-cash charge to earnings during the period in which the impairment is determined, which would reduce our stockholders’ equity.
We may complete a future significant strategic transaction that may not achieve intended results or could increase the number of our outstanding shares or amount of outstanding debt.
We continuously evaluate and may in the future enter into additional strategic transactions. Any such transaction could happen at any time, could be material to our business and could take any number of forms, including, for example, an acquisition, merger or a sale of certain of our assets.
Evaluating potential transactions and integrating completed ones may divert the attention of our management from ordinary operating matters. The success of these potential transactions will depend, in part, on our ability to realize the anticipated growth opportunities and cost synergies through the successful integration of the businesses we acquire with our existing business. Even if we are successful in integrating acquired businesses, we cannot assure you that these integrations will result in the realization of the full benefit of any anticipated growth opportunities or cost synergies or that these benefits will be realized within the expected time frames. In addition, acquired businesses may have unanticipated liabilities or contingencies.
If we complete an acquisition, investment or other strategic transaction, we may require additional financing that could result in an increase in the number of our outstanding shares of stock or the aggregate amount and/or cost of our debt, which may result in an adverse impact to our ratings. The number of shares of our stock or the
14
FRONTIER COMMUNICATIONS CORPORATION AND SUBSIDIARIES
aggregate principal amount of our debt that we may issue may be significant. Moreover, the terms of any debt financing may be expensive or adversely impact our results of operations.
We have in the past and may in the future consider disposing of certain assets or asset groups. We may not be able to dispose of such assets on terms that are attractive to us, or at all. To the extent we consummate such a transaction, we may experience operational challenges in segregating such assets.
In the past, we have disposed of assets for a variety of reasons, and we may, from time to time, consider disposing of other assets or asset groups in the future. We may not be able to dispose of any such assets on terms that are attractive to us, or at all, which could adversely impact our financial condition or results of operation. In addition, to the extent we consummate an agreement for the sale and disposition of an asset or asset group, we may experience operational difficulties segregating them from our retained assets and operations, which could impact the execution or timing for such dispositions and could result in disruptions to our operations and/or claims for damages, among other things.
Negotiations with the providers of content for our video systems may not be successful, potentially resulting in our inability to carry certain programming channels on our FiOS and Vantage video systems, which could result in the loss of subscribers. Alternatively, because of the power of some content providers, we may be forced to pay an increasing amount for some content, resulting in higher expenses and lower profitability.
We must negotiate with the content owners of the programming that we carry on our multichannel video systems (marketed as FiOS video and Vantage video). These content owners are the exclusive provider of the channels they offer. If we are unable to reach a mutually-agreed contract with a content owner, including pricing and carriage provisions, our existing agreements to carry this content may not be renewed, resulting in the blackout of these channels. The loss of content could result in our loss of customers who place a high value on the particular content that is lost. In addition, many content providers own multiple channels. As a result, we typically have to negotiate the pricing for multiple channels rather than one, and carry and pay for content that customers do not value, in order to have access to other content that customers do value. Some of our competitors have materially larger scale than we do, and may, as a result, be better positioned than we are in such negotiations. As a result of these factors, the expense of content acquisition may continue to increase, and this could result in higher expenses and lower profitability.
Risks Related to Liquidity, Financial Resources and Capitalization
We currently have a significant amount of indebtedness, including secured indebtedness, and are contractually permitted to incur substantial additional indebtedness and grant substantial additional liens in the future. Such debt and debt service obligations may adversely affect us.
We have a significant amount of indebtedness, which amounted to $17.9 billion outstanding at December 31, 2017, of which $3.6 billion was secured. We also have access to a $850 million secured Revolving Credit Facility, which currently is undrawn.
The terms of our indentures and credit facilities allow us to incur substantial additional indebtedness and grant substantial additional liens in the future. In addition, these terms do not prevent us or our restricted subsidiaries from incurring various types of obligations that do not constitute “indebtedness” under these terms.
If we incur any additional indebtedness that ranks equally with our senior notes and debentures, the holders of that new debt will be entitled to share ratably with holders of our senior notes and debentures in any proceeds distributed in connection with any insolvency, liquidation, reorganization, dissolution or other winding up of Frontier. If any such additional indebtedness is secured, it will be effectively senior to our unsecured senior notes and debentures to the extent of the collateral securing such indebtedness. This may have the effect of reducing the probability of payment, or the amount of proceeds paid, to holders of our senior notes and debentures.
In addition, to the extent other new debt is added to our and our subsidiaries’ current debt levels, the substantial leverage risks described below would increase.
15
FRONTIER COMMUNICATIONS CORPORATION AND SUBSIDIARIES
The potential significant negative consequences on our financial condition and results of operations that could result from our substantial debt include:
|
· |
limitations on our ability to obtain additional debt or equity financing on favorable terms or at all; |
|
· |
instances in which we are unable to comply with the covenants contained in our indentures and credit agreements or to generate cash sufficient to make required debt payments, which circumstances have the potential of accelerating the maturity of some or all of our outstanding indebtedness; |
|
· |
the possibility that we may trigger the springing maturity provisions in our credit agreements; |
|
· |
the allocation of a substantial portion of our cash flow from operations to service our debt, thus reducing the amount of our cash flows available for other purposes, including capital expenditures and dividends that would otherwise improve our competitive position, results of operations or stock price; |
|
· |
requiring us to issue debt or equity securities or to sell some of our core assets, possibly on unfavorable terms, to meet payment obligations; |
|
· |
compromising our flexibility to plan for, or react to, competitive challenges in our business and the telecommunications industry; and |
|
· |
the possibility of our being put at a competitive disadvantage with competitors who, relative to their size, do not have as much debt as we do, and competitors who may be in a more favorable position to access additional capital resources. |
In addition, our senior notes and debentures are rated below “investment grade” by independent rating agencies. This has resulted in higher borrowing costs for us. We cannot assure that these rating agencies will not lower our debt ratings further, if in the rating agencies’ judgment such an action is appropriate. A further lowering of a rating would likely increase our future borrowing costs and reduce our access to capital. Our negotiations with vendors, customers and business partners can be negatively impacted if they deem us a credit risk as a result of our credit rating.
The indentures and agreements governing our debt, including our senior notes and debentures and our credit facilities, contain covenants that impose restrictions on us and certain of our subsidiaries that may affect our ability to operate our business, make payments on our debt, and pay dividends.
The indentures and agreements governing our existing indebtedness contain covenants that, among other things, limit our ability and the ability of certain of our subsidiaries to:
|
· |
incur additional indebtedness, guarantee indebtedness or issue preferred stock; |
|
· |
create liens; |
|
· |
enter into mergers or consolidations, or transfer or sell all or substantially all of our assets; |
|
· |
pay dividends on, or make distributions in respect of, or redeem or repurchase, capital stock, make certain investments or make other restricted payments; |
|
· |
make certain asset sales; |
|
· |
enter into agreements that might prevent certain of our subsidiaries from making distributions, loans or advances to us or other subsidiaries; and |
|
· |
engage in transactions with affiliates. |
In addition, our credit facilities require us to comply with additional covenants, including financial ratios. Any future indebtedness may also require us to comply with similar or other covenants. These restrictions on our ability to operate our business could seriously harm our business by, among other things, limiting our ability to take advantage of financings, mergers, acquisitions and other corporate opportunities.
16
FRONTIER COMMUNICATIONS CORPORATION AND SUBSIDIARIES
Various risks, uncertainties and events beyond our control could affect our ability to comply with these covenants. Failure to comply with any of the covenants in our existing or future financing indentures and agreements could result in a default under those documents and under other agreements containing cross-default provisions. A default would permit lenders to accelerate the maturity of the debt and to foreclose upon any collateral securing the debt. Under these circumstances, we might not have sufficient funds or other resources to satisfy all of our obligations. In addition, the limitations imposed by indentures and credit agreements on our ability to incur additional debt and to take other actions might significantly impair our ability to obtain other financing.
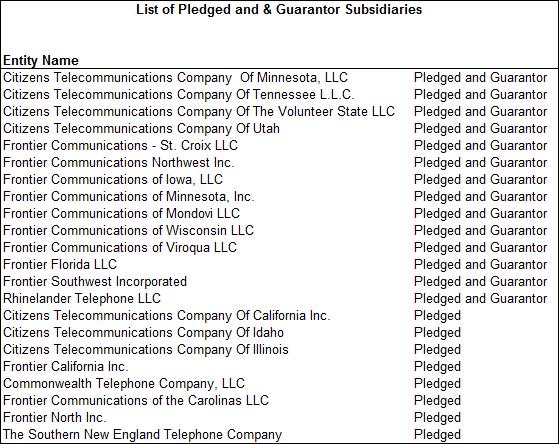
Frontier is primarily a holding company and, as a result, we rely on the receipt of funds from our subsidiaries in order to meet our cash needs and service our indebtedness, including our senior notes and debentures.
Frontier is primarily a holding company and its principal assets consist of the shares of capital stock or other equity instruments of its subsidiaries. As a holding company, we depend on dividends, distributions and other payments from our subsidiaries to fund our obligations, including those arising under our senior notes and debentures, and meet our cash needs. We cannot assure you that the operating results of our subsidiaries at any given time will be sufficient to make dividends, distributions or other payments to us in order to allow us to make payments on our indebtedness, including our senior notes and debentures. In addition, the payment of these dividends, distributions and other payments, as well as other transfers of assets, between our subsidiaries and from our subsidiaries to us may be subject to legal, regulatory or contractual restrictions. Some state regulators have imposed and others may consider imposing on regulated companies, including us, cash management practices that could limit the ability of such regulated companies to transfer cash between subsidiaries or to the parent company. While none of the existing state regulations materially affects our cash management, any changes to the existing regulations or imposition of new regulations or restrictions may materially adversely affect our ability to transfer cash within our consolidated companies.
Our senior notes and debentures are structurally subordinated to liabilities of our subsidiaries.
Our subsidiaries have not guaranteed our senior notes and debentures. As a result, holders of such securities will not have any claim as a creditor against our subsidiaries. Accordingly, all obligations of our subsidiaries (including any liens granted by our subsidiaries on any of their assets to secure any of our obligations) will have to be satisfied before any of the assets of such subsidiaries would be available for distribution, upon a liquidation or otherwise. In addition, our subsidiaries may be able to incur $1.4 billion of additional debt (including secured debt), subject to the contractual limitations in our debt instruments applicable to such subsidiaries. Holders or our senior notes and debentures would be structurally subordinated to any such future debt as well.
Our senior notes and debentures are unsecured and subordinated to any secured indebtedness.
Our senior notes and debentures are unsecured and therefore are subordinated to our existing and future secured indebtedness, to the extent of the value of the assets securing such indebtedness. At December 31, 2017, our secured indebtedness consisted of obligations under the JPM Credit Agreement, the CoBank Credit Agreements, the Revolving Credit Agreement, Term Loan B and the Continuing Agreement for Standby Letters of Credit between Frontier and Deutsche Bank AG New York Branch and Bank of Tokyo – Mitsubishi UFJ, LTD, each of which is secured by the security package under the JPM Credit Agreement which includes pledges of the equity interests in certain Frontier subsidiaries and guaranties by certain Frontier subsidiaries. In the event of a bankruptcy or similar proceeding, the assets that serve as collateral for our secured indebtedness will be available to satisfy the obligations under the secured indebtedness before any payments are made on the senior notes and debentures from the proceeds of such assets. The indentures governing our senior notes and debentures permit us, subject to specified limitations, to incur a substantial amount of additional secured debt.
Our variable rate indebtedness subjects us to interest rate risk, which could cause our debt service obligations to increase.
17
FRONTIER COMMUNICATIONS CORPORATION AND SUBSIDIARIES
At December 31, 2017, approximately 20% of our total debt is subject to variable rates of interest. Borrowings under our credit facilities are at variable rates of interest and expose us to interest rate risk. If interest rates were to increase, our debt service obligations on the variable rate indebtedness would increase even though the amount borrowed remained the same, and our net income and cash flows, including cash available for servicing our indebtedness, would correspondingly decrease. In the future, we may enter into interest rate swaps that involve the exchange of floating for fixed rate interest payments in order to reduce interest rate volatility. However, we might not maintain interest rate swaps with respect to all of our variable rate indebtedness, and any swaps we enter into might not fully mitigate our interest rate risk.
We may not have sufficient funds to repurchase our senior notes upon a change of control triggering event.
The terms of our senior notes require us to make an offer to repurchase the notes upon the occurrence of a Change of Control and Ratings Decline (as defined in the indentures governing the notes) at a purchase price equal to 101% of the respective principal amounts of the notes plus accrued and unpaid interest to, but not including, the date of the purchase. It is possible that we would not have sufficient funds at the time of such a change of control triggering event to make the required repurchase of the applicable series of notes and would be required to obtain third party financing to do so. We may not be able to obtain this financing on commercially reasonable terms, or on terms acceptable to us, or at all. In addition, the occurrence of certain change of control events may constitute an event of default under the terms of our credit facilities. Such an event of default would entitle the lenders under our credit facilities to, among other things, cause all outstanding debt thereunder to become due and payable.
Any future payment of dividends on our capital stock will be at the sole discretion of our Board of Directors and subject to certain important limitations, including legal and contractual restrictions.
The amount and timing of future dividend payments, if any, on our common stock and Series A Preferred Stock will be made at the sole discretion of our Board of Directors based on factors such as cash flow and cash requirements, capital expenditures requirements, financial condition, covenants in our debt instruments and legal restrictions. Under Delaware law, our Board of Directors may only declare and pay dividends on shares of our capital stock out of our statutory “surplus” (which is the amount equal to total assets minus total liabilities, in each case at fair market value, minus statutory capital), or if there is no such surplus, out of our net profits for the then current or immediately preceding fiscal year. In addition, our ability to declare and pay dividends is restricted by our existing financing arrangements and may be restricted by future financing arrangements. For example, our credit agreements prohibit us from using proceeds from our revolving credit facility to fund dividend payments if the undrawn amount under the revolver is less than $250 million, and we may not pay dividends on our common stock in excess of $2.40 per share in any fiscal year. As such, there can be no assurances that we will declare and pay any future dividends on our capital stock.
We expect to make contributions to our pension plan in future years, the amount of which will be impacted by volatility in asset values related to Frontier’s pension plan and/or changes in pension plan assumptions.
Frontier made contributions of $75 million, net of the Differential payment received (See note 17), and $28 million to its pension plan in 2017 and 2016, respectively, and we expect to continue to make contributions in future years. Volatility in our asset values, liability calculations, or returns may impact the costs of maintaining our pension plan and our future funding requirements. Any future material contribution could have a negative impact on our liquidity by reducing cash flows.
Significant changes in discount rates, rates of return on pension assets, mortality tables and other factors could adversely affect our earnings and equity and increase our pension funding requirements.
Pension costs and obligations are determined using actual results as well as actuarial valuations that involve several assumptions. The most critical assumptions are the discount rate, the long-term expected return on assets and mortality tables. Other assumptions include salary increases and retirement age. Some of these
18
FRONTIER COMMUNICATIONS CORPORATION AND SUBSIDIARIES
assumptions, such as the discount rate and return on pension assets, are reflective of economic conditions and largely out of our control. Changes in the pension assumptions could adversely affect our earnings, equity and funding requirements.
Risks Related to Regulation and Oversight
Changes in federal or state regulations may reduce the switched access charge revenues we receive.
A portion of Frontier’s total revenues ($165 million, or 2%, in 2017 and $170 million, or 2%, in 2016) are derived from switched access charges paid by other carriers for services we provide in originating intrastate and interstate long-distance traffic. Frontier expects a portion of our revenues will continue to be derived from switched access charges paid by these carriers for these services. The rates Frontier can charge for switched access are regulated by the FCC and state regulatory agencies.
In 2011, the FCC adopted the 2011 Order regarding Intercarrier Compensation, which is the payment framework that governs how carriers compensate each other for the exchange of voice traffic between carriers. The 2011 Order began a multi-year transition that moves the rate for terminating traffic to near zero by 2017, with the final phase down of a subset of traffic in 2018. Additionally, the 2011 Order requires VoIP providers to pay interstate terminating interconnection charges and requires all carriers terminating traffic to provide appropriate call information, thus prohibiting so-called “phantom traffic.” The FCC also reformed the Universal Service Fund in this order to shift the High-Cost portion of the fund from supporting voice services to supporting broadband deployment in high-cost areas.
However, the 2011 Order did not resolve all questions on Intercarrier Compensation. The FCC continues to consider the possibility of transitioning originating access rates in the future. We cannot predict when or how the FCC would implement any changes originating access rates, and future reductions in these revenues may directly affect our profitability and cash flows as these regulatory revenues do not have an equal level of associated variable expenses.
In August 2017, the FCC decision to deregulate the market for special access services where the market is determined to be competitive and the transport market nationwide became effective. Some aspects of that decision are under appeal by stakeholders. We cannot predict the outcome of that appeal or the impact of future changes on our results or operations.
Certain states also have their own open proceedings to address reform to originating intrastate access charges, other intercarrier compensation, and state universal service funds. Although the FCC has pre-empted state jurisdiction on most access charges, many states could consider moving forward with their proceedings. We cannot predict when or how these matters will be decided or the effect on our subsidy or switched access revenues. However, future reductions in our subsidy or switched access revenues may directly affect our profitability and cash flows as those regulatory revenues do not have an equal level of associated variable expenses.
A portion of Frontier’s revenues are derived from federal and state subsidies. To the extent the federal or any state government reduces such subsidies, our operating income could be materially and adversely impacted.
A portion of Frontier’s total revenues ($395 million, or 4%, in 2017 and $409 million, or 5%, in 2016) are derived from federal and state subsidies for rural and high-cost support, that consists of CAF II support, Federal High Cost support, and various state subsidies. The FCC’s 2011 Order changed how federal subsidies are calculated and disbursed. These changes transitioned the USF (Universal Service Fund), which supported voice services in high-cost areas, to the CAF (Connect America Fund), which supports broadband deployment in high-cost areas. Federal subsidies represented approximately 92% of subsidy revenue in 2017 and 89% in 2016, with the remainder being state subsidies.
Frontier is required to contribute to the Universal Service Fund. The FCC allows Frontier to recover these contributions through a USF Surcharge on customers’ bills. This surcharge accounted for $216 million of revenue in 2017 and $217 million in 2016.
19
FRONTIER COMMUNICATIONS CORPORATION AND SUBSIDIARIES
Future reductions in these subsidies, or in our ability to recover Universal Service Fund contributions, could have a material adverse effect on our business or results of operations.
Frontier and our industry will likely remain highly regulated, and we could incur substantial compliance costs that could constrain our ability to compete in our target markets.
As an incumbent local exchange carrier, some of the services we offer are subject to significant regulation from federal, state and local authorities. This regulation could impact our ability to change our rates, especially on our basic voice services and our access rates, and could impose substantial compliance costs on us. In some jurisdictions, regulation may restrict our ability to expand our service offerings. In addition, changes to the regulations that govern our business (including any implementation of the 2011 Order) may have an adverse effect on our business by reducing the allowable fees that we may charge, imposing additional compliance costs, reducing the amount of subsidies or otherwise changing the nature of our operations and the competition in our industry. At this time, it is unknown how these regulations will affect Frontier’s operations or ability to compete in the future.
Other FCC rulemakings and state regulatory proceedings, including those relating to intercarrier compensation, universal service and broadband services, could have a substantial adverse impact on our operations.
In December 2017, the FCC voted to roll back the FCC’s 2015 Order applying the Title II framework to broadband services. This decision restores the light touch regulatory treatment of broadband service in place prior to 2015 and preserves the FCC’s transparency requirements. The decision also clarifies that the Federal Trade Commission is the proper venue for enforcement of the transparency requirements and privacy practices. Several parties are expected to appeal this order and may seek a stay of its provisions.
Our Internet access offerings could become subject to additional laws and regulations as they are adopted or applied to the Internet. As the significance of the Internet expands, federal, state and local governments may pass laws and adopt rules and regulations, including those directed at privacy, or apply existing laws and regulations to the Internet (including Internet access services), and related matters are under consideration in both federal and state legislative and regulatory bodies. Although the FCC has pre-empted state jurisdiction on network neutrality and privacy, many states could consider moving forward with legislation on these or other Internet-related issues. At least two states, Montana and New York have already taken executive action directed at reinstating aspects of the FCC’s 2015 Order. We cannot predict whether the outcome of expected or pending challenges to the FCC’s order or future proceedings will prove beneficial or detrimental to our competitive position.
We are subject to the oversight of certain federal and state agencies that have in the past, and may in the future, investigate or pursue enforcement actions against us relating to consumer protection matters.
Certain federal and state agencies, including state attorneys general, monitor and exercise oversight related to consumer protection matters, including those affecting the communications industry. Such agencies have in the past, and may in the future, choose to launch an inquiry or investigation of our business practices in response to customer complaints or other publicized customer service issues or disruptions. Such inquiries or investigations could result in reputational harm, enforcement actions, litigation, fines, settlements and/or operational and financial conditions being placed on the company, any of which could materially and adversely affect our business.
20
FRONTIER COMMUNICATIONS CORPORATION AND SUBSIDIARIES
Tax legislation may adversely affect our business and financial condition.
Tax laws are dynamic and continually change as new laws are passed and new interpretations of the law are issued or applied. On December 22, 2017, the U.S. government enacted comprehensive tax legislation commonly referred to as the Tax Cuts and Jobs Act (the TCJA). The TCJA makes broad and complex changes to the U.S. tax code and, among other things, includes changes to U.S. federal tax rates, imposes significant additional limitations on the deductibility of interest, allows for the expensing of capital expenditures, and imposes limitations on the use of net operating losses arising in taxable years beginning after December 31, 2017. The reduction of the U.S. corporate tax rate results in a decreased valuation of our deferred tax asset and liabilities. The overall impact of the new federal tax law is uncertain and our business and financial condition could be adversely affected. In addition, it is uncertain if and to what extent various states will conform to the newly enacted federal tax law. The determination of the benefit from (provision for) income taxes requires complex estimations, significant judgments and significant knowledge and experience concerning the applicable tax laws. Given that we are still in the transition period for the accounting for income tax effects of the TCJA, the current assessment on deferred tax assets (liabilities) is based on the currently available information and guidance. If in the future any element of the tax reform changes the related accounting guidance for income tax, it could affect our income tax position and we may need to adjust the benefit from (provision for) income taxes accordingly.
Risks Related to Technology
We may be unable to meet the technological needs or expectations of our customers, and may lose customers as a result.
The telecommunications industry is subject to significant changes in technology, and replacing or upgrading our infrastructure to keep pace with such technological changes could result in significant capital expenditures. If we do not replace or upgrade technology and equipment and manage broadband speeds and capacity as necessary, we may be unable to compete effectively because we will not be able to meet the needs or expectations of our customers.
In addition, enhancements to product offerings may influence our customers to consider other service providers, such as cable operators or wireless providers. We may be unable to attract new or retain existing customers from cable companies due to their deployment of enhanced broadband and VoIP technology. In addition, new capacity services for wireless broadband technologies may permit our competitors to offer broadband data services to our customers throughout most or all of our service areas. Any resulting inability to attract new or retain existing customers could adversely impact our business and results of operations in a material manner.
We rely on network and information systems and other technology, and a disruption or failure of such networks, systems or technology as a result of computer viruses, cyber-attacks, misappropriation of data or other malfeasance, as well as outages, accidental releases of information or similar events, may disrupt our business and materially impact our results of operations, financial condition and cash flows.
We maintain security measures, disaster recovery plans and business continuity plans for our business and are continuously working to upgrade our existing technology systems and provide employee training around the cyber risks we face. Nevertheless, our information technology networks and infrastructure may be subject to damage, disruptions or shutdowns due to computer viruses, cyber-attacks or breaches, employee or third-party error or malfeasance, power outages, telecommunication or utility failures, systems failures, natural disasters or other catastrophic events.
Further, our network and information systems are subject to various risks related to third parties and other parties we may not fully control. We use encryption and authentication technology licensed from third parties to provide secure transmission of confidential information, including our business data and customer information. Similarly, we rely on employees in our network operations centers, data centers, call centers and retail stores to follow our procedures when handling sensitive information. While we select our third-party business partners and employees carefully, we do not always control their actions, which could expose us to cyber-security risks. In addition, our customers using our network to access the Internet may become victim to malicious and abusive Internet activities, such as unsolicited mass advertising (or spam), peer-to-peer file sharing, distribution of viruses, worms and other destructive or disruptive software; these activities could adversely affect our network, result in excessive call volume at our call centers and damage our or our customers’ equipment and data.
21
FRONTIER COMMUNICATIONS CORPORATION AND SUBSIDIARIES
Any unauthorized access, computer viruses, accidental or intentional release of confidential information or other disruptions could result in misappropriation of our or our customers’ sensitive information; reputational harm; increased costs, such as those relating to remediation or future protection; customer dissatisfaction, which could lead to a decline in customers and revenue; and legal claims or proceedings, fines and other liabilities. There can be no assurance that the impact of such incidents would not be material to our results of operations, financial condition or cash flows.
22
FRONTIER COMMUNICATIONS CORPORATION AND SUBSIDIARIES
Item 1B. Unresolved Staff Comments
None.
We own property, which consists primarily of land and buildings, office and warehouse facilities, central office equipment, software, outside plant and related equipment. Outside communications plant includes aerial and underground cable, conduit, poles and wires. Central office equipment includes digital switches and peripheral equipment. As such, our properties do not provide a basis for description by character or location of principal units. All of our property is considered to be in good working condition and suitable for its intended purpose.
Our gross investment in property, by category, as of December 31, 2017, was as follows:
|
|
|||
|
($ in millions) |
|||
|
|
|||
|
Land |
$ |
231 | |
|
Buildings and leasehold improvements |
2,282 | ||
|
General support |
1,570 | ||
|
Central office/electronic circuit equipment |
8,137 | ||
|
Poles |
1,095 | ||
|
Cable, fiber and wire |
10,997 | ||
|
Conduit |
1,646 | ||
|
Construction work in progress |
538 | ||
|
Total |
$ |
26,496 | |
|
|
|||
|
|
See Note 19 of the Notes to Consolidated Financial Statements included in Part IV of this report.
We are party to various legal proceedings (including individual, class and putative class actions, governmental investigations) arising in the normal course of our business covering a wide range of matters and types of claims including, but not limited to, general contracts, billing disputes, rights of access, taxes and surcharges, consumer protection, advertising, trademark and patent infringement, employment, regulatory, tort, claims of competitors and disputes with other carriers. Litigation is subject to uncertainty and the outcome of individual matters is not predictable. However, we believe that the ultimate resolution of all such matters, after considering insurance coverage or other indemnities to which we are entitled, will not have a material adverse effect on our financial position, results of operations, or cash flows.
Item 4. Mine Safety Disclosures
23
FRONTIER COMMUNICATIONS CORPORATION AND SUBSIDIARIES
PART II
Item 5. Market for Registrant's Common Equity, Related Stockholder Matters and Issuer Purchases of Equity Securities
Our common stock is currently traded on the NASDAQ Global Select Market under the symbol FTR. The amount and timing of dividends payable on our common stock are within the sole discretion of our Board of Directors. Dividends on shares of the Series A Preferred Stock are payable on a cumulative basis when, as and if declared by our Board of Directors (or an authorized committee thereof) at an annual rate of 11.125% on the liquidation preference of $100.00 per share, on the last business day of March, June, September and December of each year, up to the mandatory conversion date of June 29, 2018. Series A Preferred Stock dividends of $214 million were paid in each of 2017 and 2016. Cash dividends paid to common shareholders were $266 million and $493 million in 2017 and 2016, respectively. The declaration and payment of future dividends on our common stock is at the discretion of our Board of Directors, and will depend upon many factors, including our financial condition, results of operations, growth prospects, funding requirements, payment of cumulative dividends on Series A Preferred Stock, applicable law, restrictions in agreements governing our indebtedness and other factors our Board of Directors deems relevant.
A portion of the dividends on common stock may be classified as total ordinary dividends and represents qualified dividends, and a portion of the dividends is classified as non-dividend distributions and represents a return of capital. For the year ended December 31, 2017, all dividends on common stock were classified as non-dividend distributions and represented a return of capital.
The following table indicates the high and low intra-day sales prices per share of common stock, as reported by the NASDAQ Global Select Market, and sets forth dividends paid per share of common stock during the periods indicated.
|
|
||||||||||||||||||
|
|
2017 |
2016 |
||||||||||||||||
|
|
High |
Low |
Dividend |
High |
Low |
Dividend |
||||||||||||
|
First Quarter |
$ |
57.30 |
$ |
28.80 |
$ |
0.600 |
$ |
87.75 |
$ |
57.15 |
$ |
1.575 | ||||||
|
Second Quarter |
$ |
32.85 |
$ |
16.50 |
$ |
0.600 |
$ |
86.25 |
$ |
68.55 |
$ |
1.575 | ||||||
|
Third Quarter |
$ |
18.21 |
$ |
11.65 |
$ |
0.600 |
$ |
78.30 |
$ |
61.05 |
$ |
1.575 | ||||||
|
Fourth Quarter |
$ |
12.83 |
$ |
6.08 |
$ |
0.600 |
$ |
65.40 |
$ |
46.50 |
$ |
1.575 | ||||||
As of February 10, 2018, the approximate number of security holders of record of our common stock was 235,270. This information was obtained from our transfer agent, Computershare Inc.
24
FRONTIER COMMUNICATIONS CORPORATION AND SUBSIDIARIES
STOCKHOLDER RETURN PERFORMANCE GRAPH
The following performance graph compares the cumulative total return of our common stock to the S&P 500 Stock Index and to the S&P Telecommunication Services Index for the five-year period commencing December 31, 2012.
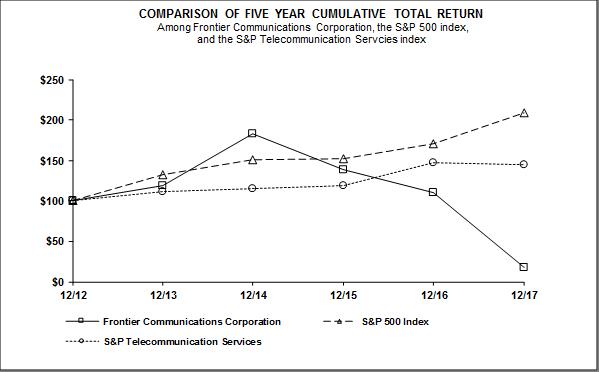
The graph assumes that $100 was invested on December 31, 2012 in each of our common stock, the S&P 500 Stock Index and the S&P Telecommunication Services Index and that all dividends were reinvested.
|
|
||||||
|
|
INDEXED RETURNS |
|||||
|
|
Base |
Years Ending |
||||
|
|
Period |
|||||
|
Company / Index |
12/12 |
12/13 |
12/14 |
12/15 |
12/16 |
12/17 |
|
Frontier Communications Corporation |
100 |
119.36 | 182.62 | 138.38 | 110.15 | 18.24 |
|
S&P 500 Index |
100 |
132.39 | 150.51 | 152.59 | 170.84 | 208.14 |
|
S&P Telecommunication Services |
100 |
111.47 | 114.80 | 118.70 | 146.58 | 144.75 |
|
|
||||||
The foregoing performance graph and related information shall not be deemed “soliciting material” or to be “filed” with the SEC, nor shall such information be incorporated by reference into any future filings under the Securities Act of 1933 or the Securities Exchange Act of 1934, each as amended, except to the extent we specifically incorporate it by reference into such filing.
RECENT SALES OF UNREGISTERED SECURITIES, USE OF PROCEEDS FROM REGISTERED SECURITIES
There were no unregistered sales of equity securities during the fourth quarter of 2017.
25
FRONTIER COMMUNICATIONS CORPORATION AND SUBSIDIARIES
ISSUER PURCHASES OF EQUITY SECURITIES
|
|
|||||||
|
Period |
Total Number of Shares Purchased |
Average Price Paid per Share |
|||||
|
|
|||||||
|
October 1, 2017 to October 31, 2017 |
|||||||
|
Employee Transactions (1) |
9,220 |
$ |
11.65 |
||||
|
|
|||||||
|
November 1, 2017 to November 30, 2017 |
|||||||
|
Employee Transactions (1) |
11 |
$ |
11.86 |
||||
|
|
|||||||
|
December 1, 2017 to December 31, 2017 |
|||||||
|
Employee Transactions (1) |
169 |
$ |
11.55 |
||||
|
|
|||||||
|
Totals October 1, 2017 to December 31, 2017 |
|||||||
|
Employee Transactions (1) |
9,400 |
$ |
11.65 |
||||
(1)Includes restricted shares withheld (under the terms of grants under employee stock compensation plans) to offset minimum tax withholding obligations that occur upon the vesting of restricted shares. Frontier’s stock compensation plans provide that the value of shares withheld shall be the average of the high and low price of our common stock on the date the relevant transaction occurs.
26
FRONTIER COMMUNICATIONS CORPORATION AND SUBSIDIARIES
Item 6. Selected Financial Data
The following tables present selected historical consolidated financial information of Frontier for the periods indicated. The selected historical consolidated financial information of Frontier as of and for each of the five fiscal years in the period ended December 31, 2017 has been derived from Frontier’s historical consolidated financial statements. The selected historical consolidated financial information as of December 31, 2017 and 2016 and for each of the years in the three-year period ended December 31, 2017 is derived from the audited historical consolidated financial statements of Frontier included elsewhere in this Annual Report. The selected historical consolidated financial information as of December 31, 2015, 2014 and 2013 and for each of the years ended December 31, 2014 and 2013 is derived from the audited historical consolidated financial statements of Frontier not included in this Annual Report.
|
|
|||||||||||||||
|
|
Year Ended December 31, (1) |
||||||||||||||
|
($ in millions, except per share amounts) |
2017 |
2016 |
2015 |
2014 |
2013 |
||||||||||
|
|
|||||||||||||||
|
Revenue |
$ |
9,128 |
$ |
8,896 |
$ |
5,576 |
$ |
4,772 |
$ |
4,762 | |||||
|
Operating Income (loss) |
$ |
(1,568) |
$ |
888 |
$ |
745 |
$ |
820 |
$ |
981 | |||||
|
Net income (loss) (2) (3) (4) (5) |
$ |
(1,804) |
$ |
(373) |
$ |
(196) |
$ |
133 |
$ |
115 | |||||
|
Net income (loss) attributable to Frontier |
|||||||||||||||
|
common shareholders (2) (3) (4) (5) (6) |
$ |
(2,018) |
$ |
(587) |
$ |
(316) |
$ |
133 |
$ |
113 | |||||
|
Net income (loss) attributable to Frontier |
|||||||||||||||
|
common shareholders per basic |
|||||||||||||||
|
share (2) (3) (4) (5) (6) |
$ |
(25.99) |
$ |
(7.61) |
$ |
(4.41) |
$ |
1.93 |
$ |
1.67 | |||||
|
Net income (loss) attributable to Frontier |
|||||||||||||||
|
common shareholders per diluted |
|||||||||||||||
|
share (2) (3) (4) (5) (6) |
$ |
(25.99) |
$ |
(7.61) |
$ |
(4.41) |
$ |
1.93 |
$ |
1.67 | |||||
|
Cash dividends declared (and paid) per |
|||||||||||||||
|
common share |
$ |
3.42 |
$ |
6.35 |
$ |
6.31 |
$ |
6.05 |
$ |
6.04 | |||||
|
Cash dividends declared (and paid) per share |
|||||||||||||||
|
of Series A Preferred Stock |
$ |
11.125 |
$ |
11.125 |
$ |
6.24 |
(7) |
$ |
- |
$ |
- |
||||
|
|
|||||||||||||||
|
|
As of December 31, |
||||||||||||||
|
($ in millions) |
2017 |
2016 |
2015 |
2014 |
2013 |
||||||||||
|
|
|||||||||||||||
|
Total assets |
$ |
24,884 |
$ |
29,013 |
$ |
27,084 |
$ |
18,810 |
$ |
16,540 | |||||
|
Long-term debt |
$ |
16,970 |
$ |
17,560 |
$ |
15,508 |
$ |
9,393 |
$ |
7,810 | |||||
|
Total shareholders' equity of Frontier |
$ |
2,274 |
$ |
4,519 |
$ |
5,614 |
$ |
3,658 |
$ |
4,056 | |||||
|
(1) |
Operating results include activities for the CTF operations from the date of their acquisition from Verizon on April 1, 2016 and the Connecticut operations from the date of their acquisition from AT&T on October 24, 2014. |
|
(2) |
Operating results include the pre-tax impacts of losses on retirement of debt of $88 million ($58 million after tax) and $160 million ($99 million after tax) for 2013, respectively. |
|
(3) |
Operating results include pre-tax acquisition and integration costs of $25 million ($16 million after tax), $436 million ($283 million after tax), $236 million ($133 million after tax), $142 million ($91 million after tax) and $10 million ($6 million after tax) for 2017, 2016, 2015, 2014 and 2013, respectively. |
|
(4) |
Operating results include pre-tax restructuring costs and other charges of $82 million ($52 million after tax), $91 million ($59 million after tax), $2 million ($1 million after tax), $2 million ($1 million after tax) and $12 million ($7 million after tax) for 2017, 2016, 2015, 2014 and 2013, respectively. |
|
(5) |
Operating results include pre-tax pension settlement costs of $83 million ($53 million after tax) and $44 million ($27 million after tax) for 2017 and 2013, respectively. |
|
(6) |
Operating results include pre-tax goodwill impairment charges of $2,748 million ($2,354 million after tax) for 2017. |
|
(7) |
Represents dividends on the 11.125% Mandatory Convertible Preferred Stock, Series A, from the issuance date of June 10, 2015 through December 31, 2015. |
27
FRONTIER COMMUNICATIONS CORPORATION AND SUBSIDIARIES
Item 7. Management’s Discussion and Analysis of Financial Condition and Results of Operations
Introduction
(a) Results of Operations
2017 Compared to 2016
On April 1, 2016, we completed our acquisition of Verizon’s wireline properties in California, Texas, and Florida (the CTF Acquisition, of the CTF Operations). Frontier’s scope of operations and balance sheet changed materially as a result of the completion of the CTF Acquisition. Historical financial and operating data presented for Frontier includes the results of the CTF Operations that were acquired in the CTF Acquisition from the date of acquisition on April 1, 2016. As a result our financial results for 2017 include CTF Operations for the full year of 2017, while financial results for 2016 only included CTF Operations for the final nine months of 2016.
On July 10, 2017, we effected a one for fifteen reverse stock split of our common stock. The reverse stock split reduced the number of common shares issued (which includes outstanding shares and treasury shares) from approximately 1,193,000,000 shares to 80,000,000 shares, and reduced shares outstanding from 1,178,000,000 shares to 79,000,000 shares. In addition, and at the same time, the total number of shares of common stock that Frontier is authorized to issue changed from 1,750,000,000 shares to 175,000,000 shares. There was no change in the par value of the common stock, and no fractional shares were issued. All share and per share amounts in the financial discussion below have been retroactively adjusted for all periods presented to give effect to the reverse stock split. As a result of our reverse stock split the conversion rates of our Series A Preferred Stock were proportionately adjusted.
The sections below include tables that present customer counts, average monthly consumer revenue per customer (ARPC) and consumer customer churn. We define churn as the number of consumer customer deactivations during the month divided by the number of consumer customers at the beginning of the month and utilize the average of each monthly churn in the period.
Management believes that consumer customer counts and average monthly revenue per customer are important factors in evaluating our consumer customer trends. Among the key services we provide to consumer customers are voice service, data service and video service. We continue to explore the potential to provide additional services to our customer base, with the objective of meeting all of our customers’ communications needs.
28
FRONTIER COMMUNICATIONS CORPORATION AND SUBSIDIARIES
The following should be read in conjunction with Item 7. “Management’s Discussion and Analysis of Financial Condition and Results of Operations” included in our Annual Report on Form 10-K for the year ended December 31, 2017.
|
|
As of or for the year ended |
||||||||
|
|
December 31, 2017 |
December 31, 2016 |
% Increase (Decrease) |
||||||
|
|
|||||||||
|
Customers (in thousands) |
4,850 | 5,393 | (10) |
% |
|||||
|
|
|||||||||
|
Consumer customer metrics |
|||||||||
|
Customers (in thousands) |
4,397 | 4,891 | (10) |
% |
|||||
|
Net customer additions/(losses) |
(494) | 1,767 |
(1) |
(128) |
% |
||||
|
Average monthly consumer |
|||||||||
|
revenue per customer |
$ |
80.96 |
$ |
77.47 | 5 |
% |
|||
|
Customer monthly churn |
2.17% | 1.98% | 10 |
% |
|||||
|
|
|||||||||
|
Commercial customer metrics |
|||||||||
|
Customers (in thousands) |
453 | 502 | (10) |
% |
|||||
|
|
|||||||||
|
Broadband subscriber metrics |
|||||||||
|
(in thousands) |
|||||||||
|
Broadband subscribers |
3,938 | 4,271 | (8) |
% |
|||||
|
Net subscriber additions/(losses) |
(333) | 1,809 |
(2) |
(118) |
% |
||||
|
|
|||||||||
|
Video (excl. DISH) subscriber metrics |
|||||||||
|
(in thousands) |
|||||||||
|
Video subscribers (in thousands) |
961 | 1,145 | (16) |
% |
|||||
|
Net subscriber additions/(losses) |
(184) | 903 |
(2) |
(120) |
% |
||||
|
|
|||||||||
|
DISH subscriber metrics |
|||||||||
|
(in thousands) |
|||||||||
|
DISH subscribers (in thousands) |
235 | 274 | (14) |
% |
|||||
|
Net subscriber additions/(losses) |
(39) | (38) |
(2) |
3 |
% |
||||
|
|
|||||||||
|
Employees (3) |
22,736 | 28,332 | (20) |
% |
|||||
|
|
|||||||||
|
|
|||||||||
|
|
|||||||||
|
(1) |
2,283,000 consumer customers, 250,000 commercial customers and 2,533,000 total customers were acquired at the time of the April 2016 CTF Acquisition. |
|
(2) |
2,052,000 broadband subscribers and 1,165,000 video subscribers were acquired at the time of the April 2016 CTF Acquisition. |
|
(3) |
At December 31, 2016, we had approximately 1,900 employees in our Frontier Secure Strategic Partnerships business, which was sold in May 2017. |
29
FRONTIER COMMUNICATIONS CORPORATION AND SUBSIDIARIES
Customer Trends and Revenue Performance
We provide service and product options in our consumer and commercial offerings in each of our markets. As of December 31, 2017, 67% of our consumer broadband customers were subscribed to at least one other service offering.
We had approximately 4.4 million and 4.9 million total consumer customers as of December 31, 2017 and 2016, respectively. Our average monthly consumer customer churn was 2.17% for the year ended December 31, 2017 (1.91% for Frontier legacy and 2.56% for CTF Operations) compared to 1.98% (1.76% for Frontier legacy and 2.46% for CTF Operations) for 2016. The consolidated average monthly consumer revenue per customer (consumer ARPC) increased by $3.49 or 5% to $80.96 during 2017 compared to the prior year. The overall increase in consumer ARPC is a result of the increased revenue provided by a full year of CTF operations in 2017 compared to only nine months in 2016. This increase was partially offset by a decrease in video services.
We had approximately 453,000 and 502,000 total commercial customers as of December 31, 2017 and 2016, respectively. We lost approximately 49,000 commercial customers during the year ended December 31, 2017 compared to an increase of 213,000 customers for the prior year. Frontier expects the declines in voice services revenue and wireless backhaul revenues from commercial customers to continue in 2018. Our Ethernet product revenues from our SME (small business, medium business and larger enterprise customers) and carrier customers grew 11% for the Frontier legacy operations during 2017, compared to the prior year period. The prior year increase in customers was driven by 250,000 new customers acquired from Verizon in the CTF Acquisition.
We had approximately 3.9 million and 4.3 million broadband subscribers as of December 31, 2017 and 2016, respectively. During the year ended December 31, 2017, we lost approximately 333,000 net broadband subscribers compared to an increase of 1,809,000 for the prior year. The prior year increase in subscribers was driven by 2,052,000 new subscribers acquired from Verizon in the CTF Acquisition.
We offer video services to certain of our customers under the FiOS® brand in portions of California, Texas, Florida, Indiana, Oregon, and Washington, and under the Vantage brand in portions of Connecticut, North Carolina, South Carolina, Minnesota, Illinois, New York, and Ohio. We also offer satellite TV video service to our customers under an agency relationship with DISH® in all of our markets. For the year ended December 31, 2017, we lost approximately 223,000 net video subscribers across all markets. At December 31, 2017, we had 961,000 linear video subscribers that are served with FiOS or Vantage video service. In addition to our linear video subscribers, we have approximately 235,000 DISH satellite video customers.
30
FRONTIER COMMUNICATIONS CORPORATION AND SUBSIDIARIES
REVENUE
|
|
|||||||||||||
|
|
For the year ended December 31, |
$ Increase |
% Increase |
||||||||||
|
($ in millions) |
2017 |
2016 |
(Decrease) |
(Decrease) |
|||||||||
|
|
|||||||||||||
|
Data and Internet services (1) |
$ |
3,862 |
$ |
3,693 |
$ |
169 | 5 |
% |
|||||
|
Voice services |
2,864 | 2,886 | (22) | (1) |
% |
||||||||
|
Video services |
1,304 | 1,244 | 60 | 5 |
% |
||||||||
|
Other |
322 | 276 | 46 | 17 |
% |
||||||||
|
Customer revenue (1) |
8,352 | 8,099 | 253 | 3 |
% |
||||||||
|
Switched access and |
|||||||||||||
|
subsidy |
776 | 797 | (21) | (3) |
% |
||||||||
|
Total revenue (1) |
$ |
9,128 |
$ |
8,896 |
$ |
232 | 3 |
% |
|||||
|
|
|||||||||||||
|
|
|||||||||||||
|
|
|||||||||||||
|
|
For the year ended December 31, |
$ Increase |
% Increase |
||||||||||
|
($ in millions) |
2017 |
2016 |
(Decrease) |
(Decrease) |
|||||||||
|
|
|||||||||||||
|
Consumer |
$ |
4,476 |
$ |
4,383 |
$ |
93 | 2 |
% |
|||||
|
Commercial(1) |
3,876 | 3,716 | 160 | 4 |
% |
||||||||
|
Customer revenue (1) |
8,352 | 8,099 | 253 | 3 |
% |
||||||||
|
Switched access and |
|||||||||||||
|
subsidy |
776 | 797 | (21) | (3) |
% |
||||||||
|
Total revenue (1) |
$ |
9,128 |
$ |
8,896 |
$ |
232 | 3 |
% |
|||||
|
|
|||||||||||||
(1) Includes revenue from Frontier Secure Strategic Partnerships business, which was sold in May of 2017, of $40 million and $84 million for the year ended December 31, 2017 and 2016, respectively.
We generate revenues primarily through either a monthly recurring fee or a fee based on usage, and revenue recognition is not dependent upon significant judgments by management, with the exception of a determination of the provision for uncollectible amounts.
The increase of $232 million in consolidated total revenue was primarily due to the additional revenue provided by a full year of CTF Operations in 2017 compared to only nine months in 2016. This increase was partially offset by decreased voice and data and Internet services revenues driven by a decline in customers.
Consolidated customer revenue increased $93 million due to consumer customer revenue and $160 million due to commercial customer revenues. The increase in consumer customer revenue was primarily due additional revenue provided by a full year of CTF Operations in 2017 compared to only nine months in 2016. This increase was partially offset by decreases in voice, data and internet, and video services revenue. We have experienced declines in the number of traditional voice customers and switched access minutes of use as a result of competition and the availability of substitutes, a trend we expect to continue. The increase in consolidated commercial customer revenue was primarily driven by additional revenue provided by a full year of CTF Operations in 2017 compared to only nine months in 2016. This increase was partially offset by decreases in our voice services revenue and nonswitched revenue including wireless backhaul revenue and decreased revenues related to our Frontier Secure Strategic Partnerships business which was sold in May 2017.
Consolidated switched access and subsidy revenue represented 9% of our revenues for the year ended December 31, 2017. Switched access revenue was $165 million for the year ended December 31, 2017, or 2% of our revenues, which decreased from $170 million, or 2% of our revenues, in the prior year period. The decrease was driven by reduced rates which were mandated by the 2011 Order with a related decline in operating expenses. Subsidy revenue, including CAF Phase II subsidies, was $611 million for the year ended December 31, 2017, or 7% of our revenues, which decreased from $626 million, or 7% of our revenues, in the prior year period.
31
FRONTIER COMMUNICATIONS CORPORATION AND SUBSIDIARIES
We categorize our products, services, and other revenues into the following five categories:
Data and Internet Services
Data and internet services include broadband services for consumer and commercial customers. We also provide data transmission services to high volume commercial customers and other carriers with dedicated high capacity circuits (“nonswitched access”) including services to wireless providers (“wireless backhaul”).
Consolidated data and Internet services revenue for the year ended December 31, 2017 increased $169 million as compared with 2016. Consolidated data services revenue for the year ended December 31, 2017 increased $81 million, or 4%, to $2,240 million due to the additional revenue provided by a full year of CTF Operations in 2017 compared to only nine months in 2016. This increase was partially offset by a reduction in revenue as a result of the sale of the Frontier Secure Strategic Partnerships business in May 2017 and a decrease in the total number of broadband subscribers. Consolidated nonswitched access revenues for the year ended December 31, 2017 increased $88 million, or 6%, to $1,622 million as compared with 2016 due to additional revenue provided by a full year of CTF Operations in 2017 compared to only nine months in 2016. This increase was partially offset by lower monthly recurring revenue for wireless backhaul and other carrier services. We expect wireless data usage to continue to increase, which may drive the need for additional wireless backhaul capacity. Despite the need for additional capacity, in the near term, we anticipate that our overall wireless backhaul revenues (which comprise approximately 3% of consolidated total revenues) will continue to decline in 2018, as our carrier customers migrate to Ethernet solutions at lower price points or migrate to our competitors.
Voice Services
Voice services include traditional local and long-distance wireline services, data-based Voice over Internet Protocol (VoIP) services, as well as voice messaging services offered to our consumer and commercial customers. Voice services also include the long-distance voice origination and termination services that we provide to our commercial customers and other carriers.
The decrease of $22 million in voice services revenue was primarily due to the continued loss of voice customers and decreases in long-distance revenue among those customers that do not have a bundled long-distance plan, which was partially offset by additional revenues resulting from a full year of CTF Operations in 2017 compared to only nine months in 2016.
Video Services
Video services include revenues generated from services provided directly to consumer customers through the FiOS video and Vantage video brands, and through DISH satellite TV services.
The increase of $60 million in video services revenue was primarily due to additional revenue provided by a full year of CTF Operations in 2017 compared to only nine months in 2016. The increase was partially offset by reduced revenue resulting from a decrease in the total number of video subscribers.
Other
Other customer revenue includes sales of customer premise equipment to our commercial customers and directory services, less our provision for bad debts.
The increase of $46 million in other revenue was primarily due to a decrease in uncollectibles, which was partially offset by a decrease in maintenance contracts.
Switched Access and Subsidy
Switched access and subsidy revenues include revenues derived from allowing other carriers to use our network to originate and/or terminate their local and long-distance voice traffic (“switched access”). These services are primarily billed on a minutes-of-use basis applying tariffed rates filed with the FCC or state agencies. We also receive cost subsidies from state and federal authorities, including the Connect America Fund.
The decrease of $21 million in switched access and subsidy revenue was primarily due to decreases in subsidies from the state high cost, offset by additional revenue provided by a full year of CTF Operations in 2017 compared to 2016. We expect that switched access revenue will continue to decline in 2018.
32
FRONTIER COMMUNICATIONS CORPORATION AND SUBSIDIARIES
2017 OPERATING EXPENSES COMPARED TO 2016
NETWORK ACCESS EXPENSE
|
|
|||||||||||||
|
|
For the year ended December 31, |
$ Increase |
% Increase |
||||||||||
|
($ in millions) |
2017 |
2016 |
(Decrease) |
(Decrease) |
|||||||||
|
|
|||||||||||||
|
Network access expenses |
$ |
1,597 |
$ |
1,470 |
$ |
127 | 9 |
% |
|||||
|
|
|||||||||||||
Network access expenses include access charges and other third-party costs directly attributable to connecting customer locations to our network, and video content costs. Such access charges and other third-party costs exclude network related expenses, depreciation and amortization, and employee related expenses.
The increase in network access expenses was primarily due to additional expenses resulting from a full year of CTF Operations in 2017 compared to only nine months in 2016. These increases were partially offset by lower video content costs.
NETWORK RELATED EXPENSES
|
|
|||||||||||||
|
|
For the year ended December 31, |
$ Increase |
% Increase |
||||||||||
|
($ in millions) |
2017 |
2016 |
(Decrease) |
(Decrease) |
|||||||||
|
|
|||||||||||||
|
Network related expenses |
$ |
1,959 |
$ |
1,887 |
$ |
72 | 4 |
% |
|||||
|
|
|||||||||||||
Network related expenses include expenses associated with the delivery of services to customers and the operation and maintenance of our network, such as facility rent, utilities, maintenance and other costs, as well as salaries, wages and related benefits associated with personnel who are responsible for the delivery of services, and the operation and maintenance of our network.
The increase in network related expenses was primarily due to additional expenses resulting from a full year of CTF Operations in 2017 compared to only nine months in 2016 and an increase in outside services (primarily related to storm-related costs) which was partially offset by reduced compensation costs related to lower employee headcount and certain benefits, including pension and OPEB expense (as discussed below). There was also a reduction in rent expense as a result of more of the vehicle fleet being financed under capital leases than operating leases.
SELLING, GENERAL, AND ADMINISTRATIVE EXPENSES
|
|
|||||||||||||
|
|
For the year ended December 31, |
$ Increase |
% Increase |
||||||||||
|
($ in millions) |
2017 |
2016 |
(Decrease) |
(Decrease) |
|||||||||
|
|
|||||||||||||
|
Selling, general and |
|||||||||||||
|
administrative expenses |
$ |
2,018 |
$ |
2,093 |
$ |
(75) | (4) |
% |
|||||
|
|
|||||||||||||
Selling, general and administrative expenses (SG&A expenses) include the salaries, wages and related benefits and the related costs of corporate and sales personnel, travel, insurance, non-network related rent, advertising and other administrative expenses.
The decrease in SG&A expenses was primarily driven by decreased employee headcount, compensation costs, certain benefits, including pension and OPEB expense (as discussed below), reduced marketing costs, lower outside services costs and facilities. There were approximately $52 million of additional SG&A expense during the year ended December 31, 2016 related to the Frontier Secure Strategic Partnerships business, which was sold in May 2017. The decrease was partially offset by additional expenses resulting from a full year of CTF Operations in 2017 compared to only nine months in 2016.
33
FRONTIER COMMUNICATIONS CORPORATION AND SUBSIDIARIES
Pension and OPEB costs
Frontier allocates pension/OPEB expense to network related expenses and SG&A expenses. Total consolidated pension and OPEB costs, excluding pension settlement costs and special termination benefits, for the year ended December 31, 2017 and 2016 were as follows:
|
|
||||||
|
|
For the year ended December 31, |
|||||
|
($ in millions) |
2017 |
2016 |
||||
|
|
||||||
|
Total pension/OPEB |
||||||
|
costs |
$ |
120 |
$ |
129 | ||
|
Less: costs capitalized into |
||||||
|
capital expenditures |
(26) | (25) | ||||
|
Net pension/OPEB expense |
$ |
94 |
$ |
104 | ||
|
|
||||||
DEPRECIATION AND AMORTIZATION
The fair value estimates related to the allocation of the purchase price of the CTF Operations to Other intangibles were revised and finalized during the first quarter of 2017 from the previous estimates as of December 31, 2016. The allocation that was reported as of December 31, 2016 for Other intangibles increased $100 million, from $2,162 million to $2,262 million. These measurement period adjustments resulted in higher amortization expense during 2017 ($20 million of which is attributable to 2016).
|
|
||||||||||||||
|
|
For the year ended December 31, |
$ Increase |
% Increase |
|||||||||||
|
($ in millions) |
2017 |
2016 |
(Decrease) |
(Decrease) |
||||||||||
|
|
||||||||||||||
|
Depreciation expense |
$ |
1,485 |
$ |
1,388 |
$ |
97 | 7 |
% |
||||||
|
Amortization expense |
699 | 643 | 56 | 9 |
% |
|||||||||
|
|
$ |
2,184 |
$ |
2,031 |
$ |
153 | 8 |
% |
||||||
|
|
||||||||||||||
Depreciation and amortization expense for the year ended December 31, 2017 increased as compared to 2016. The increase of $97 million in depreciation expense was due to additional depreciation of assets used for a full year of CTF Operations during 2017 compared to only nine months in 2016, which was partially offset by lower net asset bases as compared to 2016. The increase of $56 million in amortization expense was due to a full year of amortization of the CTF customer base during 2017 compared to amortization expense of only nine months in 2016.
GOODWILL IMPAIRMENT
As a result of the continued decline in the share price of our common stock in each of the four quarters in 2017, we tested goodwill for impairment. Our second and fourth quarter quantitative assessments indicated that the carrying value of the enterprise exceeded its fair value and, therefore, an impairment existed. We recorded goodwill impairments totaling $2,748 million for 2017. The driver for the impairment in the second quarter was a reduction in our profitability and utilized EBITDA estimate, which when applied to our market multiple resulted in a lower enterprise valuation. During the fourth quarter, the impairment was largely driven by a lower enterprise valuation resulting from a reduction in utilized market multiple from 5.8x to 5.5x reflecting the lower outlook for our industry as a whole. The revaluation of our net deferred tax liabilities which resulted from the enactment of Tax Cut and Job Act, caused further goodwill impairment. Further declines in our profitability or share price could result in additional impairment in the future.
34
FRONTIER COMMUNICATIONS CORPORATION AND SUBSIDIARIES
ACQUISITION AND INTEGRATION COSTS
|
|
||||||||||||
|
|
For the year ended December 31, |
$ Increase |
% Increase |
|||||||||
|
($ in millions) |
2017 |
2016 |
(Decrease) |
(Decrease) |
||||||||
|
|
||||||||||||
|
Acquisition and integration costs |
$ |
25 |
$ |
436 |
$ |
(411) | (94) |
% |
||||
|
|
||||||||||||
Acquisition costs include financial advisory, accounting, regulatory, legal and other related costs. Integration costs include expenses that are incremental and directly related to the acquisition, which were incurred to integrate the network and information technology platforms. Integration costs also include costs to achieve synergies and operational efficiencies directly associated with the acquisition.
We invested $34 million and $142 million in capital expenditures related to the CTF Acquisition during 2017 and 2016, respectively.
PENSION SETTLEMENT COSTS
|
|
|||||||||||||
|
|
For the year ended December 31, |
$ Increase |
% Increase |
||||||||||
|
($ in millions) |
2017 |
2016 |
(Decrease) |
(Decrease) |
|||||||||
|
|
|||||||||||||
|
Pension Settlement Costs |
$ |
83 |
$ |
- |
$ |
83 |
NM |
||||||
|
|
|||||||||||||
|
NM - Not meaningful |
|||||||||||||
The Pension Plan contains provisions that provide certain employees with the option of receiving a lump sum payment upon retirement. Frontier’s accounting policy is to record these payments as a settlement only if, in the aggregate, they exceed the sum of the annual service and interest costs for the Pension Plan’s net periodic pension benefit cost. During the year ended December 31, 2017, lump sum pension settlement payments to terminated or retired individuals amounted to $486 million, which exceeded the settlement threshold of $224 million, and as a result, Frontier recognized non-cash settlement charges totaling $83 million during 2017. The non-cash charge accelerated the recognition of a portion of the previously deferred unrecognized actuarial losses, which are included in Other comprehensive income, in the Pension Plan.
RESTRUCTURING COSTS AND OTHER CHARGES
|
|
||||||||||||
|
|
For the year ended December 31, |
$ Increase |
% Increase |
|||||||||
|
($ in millions) |
2017 |
2016 |
(Decrease) |
(Decrease) |
||||||||
|
|
||||||||||||
|
Restructuring costs and |
||||||||||||
|
other charges |
$ |
82 |
$ |
91 |
$ |
(9) | (10) |
% |
||||
|
|
||||||||||||
Restructuring costs and other charges consist of expenses related to changes in the composition of our business, including workforce reductions, the sale of business lines or divisions, and corresponding changes to our retirement plans.
The $9 million decrease in restructuring costs and other charges was primarily driven by a reduction in special termination benefits related to the pension plan, partially offset by increased severance expense related to workforce reductions.
35
FRONTIER COMMUNICATIONS CORPORATION AND SUBSIDIARIES
OTHER NON-OPERATING INCOME AND EXPENSE
|
|
|||||||||||||
|
|
|||||||||||||
|
|
For the year ended December 31, |
$ Increase |
% Increase |
||||||||||
|
($ in millions) |
2017 |
2016 |
(Decrease) |
(Decrease) |
|||||||||
|
|
|||||||||||||
|
Investment and other income, net |
$ |
3 |
$ |
27 |
$ |
(24) | (89) |
% |
|||||
|
Losses on early extinguishment of debt |
|||||||||||||
|
and debt exchanges |
$ |
88 |
$ |
7 |
$ |
81 |
NM |
||||||
|
Interest expense |
$ |
1,534 |
$ |
1,531 |
$ |
3 | 0 |
% |
|||||
|
Income tax benefit |
$ |
(1,383) |
$ |
(250) |
$ |
(1,133) |
NM |
||||||
|
|
|||||||||||||
|
NM - Not meaningful |
|||||||||||||
Investment and Other Income, Net
The decrease in investment and other income, net was due to less restricted cash on hand earning interest during 2017 as compared to the prior year, and the impact of a nonrecurring gain on the expiration/settlement of customer advances in 2016.
Losses on Early Extinguishment of Debt and Debt Exchanges
The increase in loss on extinguishment of debt and debt exchanges was primarily driven by premiums to retire certain notes and the unamortized original issuance costs, which was slightly offset by discounts received on the retirement of certain notes.
Interest expense
Interest expense was relatively flat as compared to 2016. Our composite average borrowing rate as of December 31, 2017 and 2016 was 8.44% and 8.55%, respectively.
Income tax benefit
The increase of $1,133 million in income tax benefit was driven by a decrease in the federal tax rate on our deferred tax liabilities, net of deferred tax assets, partially offset by the tax impact of goodwill impairments during the year, along with an increased pre-tax loss. The effective tax rate for the year ended December 31, 2017 was 43.4% as compared with 40.2% for the year ended December 31, 2016. The decrease in our net deferred tax liabilities was largely driven by the enactment of the Tax Cuts and Jobs Act on December 22, 2017. We received $51 million in federal and state tax refunds in 2017 as compared to net cash refunds of $120 million in 2016.
Net loss attributable to Frontier common shareholders
Net loss attributable to Frontier common shareholders for 2017 was a net loss of $2,018 million, or $25.99 per share, as compared to a net loss of $587 million, or $7.61 per share, in 2016.
Diluted net loss attributable to Frontier common shareholders
Diluted net loss attributable to Frontier common shareholders for 2017 was a net loss of $2,018 million, or $25.99 per share, as compared to a net loss of $587 million, or $7.61 per share, in 2016.
36
FRONTIER COMMUNICATIONS CORPORATION AND SUBSIDIARIES
2016 Compared to 2015
On April 1, 2016, we completed our acquisition of Verizon’s wireline properties in California, Texas, and Florida (the CTF Acquisition). Frontier’s scope of operations and balance sheet changed materially as a result of the completion of the CTF Acquisition. Historical financial and operating data presented for Frontier includes the results of the CTF Operations that were acquired in the CTF Acquisition from the date of acquisition on April 1, 2016 and is not indicative of future operating results. The financial discussion below includes a comparative analysis of our results of operations on a historical basis for Frontier operations as of and for the years ended December 31, 2016 and 2015. Unless otherwise noted, the variance explanations discussed below are based upon an analysis of the 2016 financial data for Frontier legacy operations (excluding the CTF Operations) in comparison to 2015.
The sections below include tables that present customer counts, average monthly revenue per customer (ARPC) and consumer customer churn which we define as the average of the amount of consumer customer deactivations during the month divided by the number of consumer customers at the beginning of the month. The following also categorizes revenue into customer revenue (consumer and commercial) and regulatory revenue (switched access and subsidy). The decline in the number of customers was partially offset by increased penetration of additional higher revenue generating products and services sold to both consumer and commercial customers, which has increased our average monthly revenue per customer in 2016 as compared to 2015. Similar to other wireline providers, we have experienced declines in the number of traditional voice customers, switched access minutes of use and rates per switched access minute of use, due to the FCC’s intercarrier compensation reform, as a result of competition and the availability of substitutes, a trend which we expect will continue.
Management believes that consumer customer counts and average monthly revenue per customer are important factors in evaluating our consumer customer trends. Among the key services we provide to consumer customers are voice service, data service and video service. We continue to explore the potential to provide additional services to our customer base, with the objective of meeting all of our customers’ communications needs.
2016 CUSTOMER RELATED METRICS COMPARED TO 2015
|
|
As of or for the year ended December 31, |
|||||||||
|
|
2016 |
% Increase (Decrease) |
2015 |
|||||||
|
|
||||||||||
|
Customers (in thousands) |
5,393 |
(1) |
58 |
% |
3,413 | |||||
|
|
||||||||||
|
Consumer customer metrics: |
||||||||||
|
Customers (in thousands) |
4,891 |
(1) |
57 |
% |
3,124 | |||||
|
Average monthly consumer |
||||||||||
|
revenue per customer |
$ |
77.47 | 21 |
% |
$ |
63.93 | ||||
|
Customer monthly churn |
1.98% | 9 |
% |
1.82% | ||||||
|
|
||||||||||
|
Commercial customer metrics: |
||||||||||
|
Customers (in thousands) |
502 |
(1) |
74 |
% |
289 | |||||
|
Average monthly commercial |
||||||||||
|
revenue per customer |
$ |
673.72 | (2) |
% |
$ |
690.88 | ||||
|
|
||||||||||
|
Broadband subscribers (in thousands) |
4,271 |
(2) |
73 |
% |
2,462 | |||||
|
Video subscribers (in thousands) |
1,419 |
(2) |
156 |
% |
554 | |||||
|
Switched access minutes of use (in thousands) |
19,450 | 27 |
% |
15,327 | ||||||
|
|
||||||||||
|
Employees |
28,332 | 48 |
% |
19,160 | ||||||
|
(1) |
2,283,000 consumer customers, 250,000 commercial customers and 2,533,000 total customers were acquired at the time of the April 2016 CTF Acquisition. |
|
(2) |
2,052,000 broadband subscribers and 1,165,000 video subscribers were acquired at the time of the April 2016 CTF Acquisition. |
Customer Trends
We provide service and product options in our consumer and commercial offerings to the customer base in each of our markets which results in a better customer experience that allows us to maximize retention of existing customers
37
FRONTIER COMMUNICATIONS CORPORATION AND SUBSIDIARIES
and attract new customers. As of December 31, 2016, 63% of our consumer broadband customers were subscribed to at least one other service offering.
During 2016, we gained approximately 2.0 million customers, net, as compared to a loss of 96,000 customers, net, in 2015. Although we added approximately 2.5 million customers in 2016 following the CTF Acquisition, we lost a net of approximately 553,000 customers across all of our markets. These customer losses were more heavily weighted in the newly acquired CTF markets due to transition disruptions following the acquisition, resulting in higher than normal customer churn, as well as the suspension of collection activities prior to and after the closing of the CTF Acquisition, and the suspension of marketing efforts for a period of time following the acquisition. These actions resulted in fewer additions than would otherwise have been achieved.
We had approximately 4.9 million and 3.1 million total consumer customers as of December 31, 2016 and 2015, respectively Although we added approximately 2.3 million total consumer customers attributable to the CTF Acquisition in 2016, we lost approximately 516,000 consumer customers, net, during 2016, composed of losses in both our legacy markets and in the CTF markets, principally driven by declines in voice customers. Our consumer customer monthly churn was 1.98% for 2016. Average monthly consumer revenue per customer (consumer ARPC) increased $13.54, or 21%, to $77.47 during 2016 as compared to 2015. The overall increase in consumer ARPC is a result of higher video revenue from our CTF Operations and improvements in data services revenue for our legacy operations, partially offset by lower voice services revenue. We expect to improve our video and data subscriber trends for our Frontier legacy and CTF operations. We anticipate continuing declines in voice services revenue as fewer consumer customers subscribe to landline voice services.
We had approximately 0.5 million and 0.3 million total commercial customers as of December 31, 2016 and 2015, respectively. Although we added 250,000 total commercial customers attributable to the CTF Acquisition in 2016, we lost approximately 38,000 commercial customers, net in 2016, composed of losses in both our legacy markets and in the CTF markets. Average monthly commercial revenue per customer (commercial ARPC) decreased $17.16, or 2%, to $673.72 during 2016 as compared to 2015. The commercial ARPC decrease is primarily attributable to our CTF markets having lower ARPC per SME (small business, medium business and larger enterprise customers) customer and proportionally fewer wholesale customers relative to total commercial customers as compared to our legacy markets. We have seen modest increases in our revenues from small/medium/enterprise (SME) customers throughout 2016, and our Ethernet product revenues from our SME and carrier customers has grown by 8% for the Frontier legacy operations during 2016.
At December 31, 2016, we had approximately 1.8 million more broadband subscribers than we did at December 31, 2015. We added 2,052,000 subscribers as part of the CTF Acquisition; however, we lost approximately 243,000 net subscribers, primarily due to fewer gross activations and higher customer churn. At December 31, 2016, 57% of our consolidated consumer broadband customers subscribed to speeds in excess of our 6 Mbps basic speed tier, up from 29% at December 31, 2015.
We offer video services under the Vantage brand to our customers in Connecticut, South Carolina, Minnesota, and Illinois and under the FiOS® brand in California, Texas, and Florida (and on a limited basis in Indiana, Oregon and Washington). We also offer satellite TV video service to our customers under an agency relationship with DISH® in all of our markets. During the year, we added 1,165,000 video subscribers in the CTF Acquisition. For the full year, we lost approximately 300,000 net video subscribers across all markets. At December 31, 2016, we had 1.14 million linear video subscribers that are served with FiOS or Vantage video service. In addition to our linear video subscribers, we have 274,000 DISH satellite video customers.
38
FRONTIER COMMUNICATIONS CORPORATION AND SUBSIDIARIES
2016 REVENUE COMPARED TO 2015
|
|
||||||||||||||||||||
|
|
For the Year Ended December 31, |
|||||||||||||||||||
|
|
2016 |
2015 |
||||||||||||||||||
|
|
Frontier Legacy (excluding CTF Operations) |
|||||||||||||||||||
|
|
Consolidated |
CTF |
$ Increase |
% Increase |
||||||||||||||||
|
($ in millions) |
Amount |
Operations |
Amount |
(Decrease) |
(Decrease) |
Amount |
||||||||||||||
|
|
||||||||||||||||||||
|
Voice services |
$ |
2,886 |
$ |
1,077 |
$ |
1,809 |
$ |
(213) | (11) |
% |
$ |
2,022 | ||||||||
|
Data and Internet services |
3,693 | 1,366 | 2,327 | (10) | (0) |
% |
2,337 | |||||||||||||
|
Video services |
1,244 | 978 | 266 | (19) | (7) |
% |
285 | |||||||||||||
|
Other |
276 | 26 | 250 | (5) | (2) |
% |
255 | |||||||||||||
|
Customer revenue |
8,099 | 3,447 | 4,652 | (247) | (5) |
% |
4,899 | |||||||||||||
|
Switched access and |
||||||||||||||||||||
|
subsidy |
797 | 175 | 622 | (55) | (8) |
% |
677 | |||||||||||||
|
Total revenue |
$ |
8,896 |
$ |
3,622 |
$ |
5,274 |
$ |
(302) | (5) |
% |
$ |
5,576 | ||||||||
|
|
||||||||||||||||||||
|
|
||||||||||||||||||||
|
|
For the Year Ended December 31, |
|||||||||||||||||||
|
|
2016 |
2015 |
||||||||||||||||||
|
|
Frontier Legacy (excluding CTF Operations) |
|||||||||||||||||||
|
|
Consolidated |
CTF |
$ Increase |
% Increase |
||||||||||||||||
|
($ in millions) |
Amount |
Operations |
Amount |
(Decrease) |
(Decrease) |
Amount |
||||||||||||||
|
|
||||||||||||||||||||
|
Consumer |
$ |
4,383 |
$ |
2,092 |
$ |
2,291 |
$ |
(141) | (6) |
% |
$ |
2,432 | ||||||||
|
Commercial |
3,716 | 1,355 | 2,361 | (106) | (4) |
% |
2,467 | |||||||||||||
|
Customer revenue |
8,099 | 3,447 | 4,652 | (247) | (5) |
% |
4,899 | |||||||||||||
|
Switched access and |
||||||||||||||||||||
|
subsidy |
797 | 175 | 622 | (55) | (8) |
% |
677 | |||||||||||||
|
Total revenue |
$ |
8,896 |
$ |
3,622 |
$ |
5,274 |
$ |
(302) | (5) |
% |
$ |
5,576 | ||||||||
|
|
||||||||||||||||||||
REVENUE
Consolidated total revenue for 2016 increased $3,320 million to $8,896 million as compared to 2015. Excluding additional revenue of $3,622 million in 2016 attributable to CTF operations, our revenue for 2016 decreased $302 million, or 5%, as compared to 2015. This decline in 2016 is primarily the result of decreases in voice services revenues and lower switched and nonswitched access revenue, partially offset by an increase in data services revenue, each as described in more detail below.
Customer revenue for the year ended December 31, 2016 increased $3,200 million to $8,099 million as compared to 2015. Excluding additional customer revenue of $3,447 million attributable to the CTF Operations, our customer revenue for 2016 decreased $247 million, or 5%, as compared to 2015.
Consolidated consumer customer revenue for the year ended December 31, 2016 increased $1,951 million, or 80%, as compared to 2015. Consolidated consumer customer revenue for the year ended December 31, 2016 included $2,092 million of revenue attributable to the CTF Operations. Consumer customer revenues for our legacy operations for the year ended December 31, 2016 decreased $141 million, or 6%, compared to 2015, primarily as a result of decreases in voice services revenue, partially offset by increases in data services revenue. Similar to other wireline providers, we have experienced declines in the number of traditional voice customers and switched access minutes of use as a result of competition and the availability of substitutes, a trend we expect to continue. The consolidated monthly average revenue per customer (ARPC) for our consumer customers increased 21% for the year ended December 31, 2016 as compared to 2015. The overall increase in consumer ARPC is a result of higher video revenue from our CTF Operations and improvements in data services revenue for our legacy operations, partially offset by lower voice services revenue.
Consolidated commercial customer revenue for 2016 increased $1,249 million, or 51%, as compared to 2015. Consolidated commercial customer revenue for 2016 included $1,355 million of revenue attributable to the CTF Operations. Commercial customer revenue for our legacy operations declined $106 million, or 4%, as compared to
39
FRONTIER COMMUNICATIONS CORPORATION AND SUBSIDIARIES
2015, principally as a result of decreases in our voice services revenue and wireless backhaul revenue. The consolidated ARPC for our commercial customers decreased 2%, for the year ended December 31, 2016 as compared with 2015. The commercial ARPC decrease is primarily attributable to our CTF markets having lower ARPC per SME (small business, medium business and larger enterprise customers) customer and proportionally fewer wholesale customers relative to total business customers as compared to our legacy markets.
Consolidated switched access and subsidy revenue of $797 million represented 9% of our revenues for 2016. Switched access revenue was $170 million in 2016, or 2% of our revenues, down from $177 million, or 3% of our revenues, in 2015. The Report and Order released by the FCC on November 18, 2011 (the 2011 Order) provided for the gradual elimination of terminating traffic charges by 2017. Switched access revenue declined sequentially in the third quarter of 2016, reflecting the rate reductions mandated by the 2011 Order, and we anticipate that we have experienced nearly all of the rate decline related to the 2011 Order. We have been able to recover a significant portion of these lost revenues through end user rates and other replacement support mechanisms, a trend we expect will continue throughout 2017. We expect declining revenue trends in switched access revenue to continue in 2017 in our legacy operations. Subsidy revenue, including CAF Phase II subsidies, was $626 million in 2016, or 7% of our revenues, which increased from $500 million, or 9% of our revenues, in 2015.
We categorize our products, services and other revenues among the following five categories:
Voice Services
Voice services revenue for 2016 decreased as compared with 2015, primarily due to the continued loss of voice customers and, to a lesser extent, decreases in individual feature packages, as well as long-distance revenue among those customers that do not have a bundled long-distance plan, partially offset by increased local voice charges to consumer and commercial end users.
Data and Internet Services
Data and Internet services revenue for 2016 decreased as compared with 2015. Data services revenues for 2016 increased $45 million, or 3%, primarily due to higher Frontier Secure revenues. Nonswitched access revenues decreased $55 million, or 6%, primarily due to lower monthly recurring revenues for wireless backhaul and other carrier services. We expect wireless data usage to continue to increase, which may drive the need for additional wireless backhaul capacity.
Video Services
Video services for 2016 decreased primarily due to a decrease in the total number of video subscribers.
Other
Other revenues for 2016 decreased primarily due to lower directory services revenue.
Switched Access and Subsidy
Switched access and subsidy revenue for 2016 decreased as compared to 2015. Subsidy revenues decreased $16 million, or 3% in 2016, primarily attributable to the one-time true-up payments and phasedown support recognized in 2015 in connection with the CAF Phase II program. Switched access revenue decreased $39 million, or 22%, in 2016 primarily due to the impact of the decline in minutes of use related to access line losses and the displacement of minutes of use by wireless and other communications services, combined with the lower rates enacted by the FCC’s intercarrier compensation.
40
FRONTIER COMMUNICATIONS CORPORATION AND SUBSIDIARIES
2016 OPERATING EXPENSES COMPARED TO 2015
NETWORK ACCESS EXPENSE
|
|
|||||||||||||||||||
|
|
For the Year Ended December 31, |
||||||||||||||||||
|
|
2016 |
2015 |
|||||||||||||||||
|
|
Frontier Legacy (excluding CTF Operations) |
||||||||||||||||||
|
|
Consolidated |
CTF |
$ Increase |
% Increase |
|||||||||||||||
|
($ in millions) |
Amount |
Operations |
Amount |
(Decrease) |
(Decrease) |
Amount |
|||||||||||||
|
|
|||||||||||||||||||
|
Network access expenses |
$ |
1,470 |
$ |
852 |
$ |
618 |
$ |
(22) | (3) |
% |
$ |
640 | |||||||
|
|
|||||||||||||||||||
Network access expenses include access charges and other third-party costs directly attributable to connecting customer locations to our network and video content costs. Such access charges and other third-party costs exclude network related expenses, depreciation and amortization, and employee related expenses.
Network access expenses for 2016 decreased in our legacy markets, primarily due to lower long-distance costs and video content costs as a result of a decline in video customers, partially offset by increases in customer premise equipment costs, pole and conduit rental expense, and Frontier Secure costs.
NETWORK RELATED EXPENSES
|
|
|||||||||||||||||||
|
|
For the Year Ended December 31, |
||||||||||||||||||
|
|
2016 |
2015 |
|||||||||||||||||
|
|
Frontier Legacy (excluding CTF Operations) |
||||||||||||||||||
|
|
Consolidated |
CTF |
$ Increase |
% Increase |
|||||||||||||||
|
($ in millions) |
Amount |
Operations |
Amount |
(Decrease) |
(Decrease) |
Amount |
|||||||||||||
|
|
|||||||||||||||||||
|
Network related expenses |
$ |
1,887 |
$ |
623 |
$ |
1,264 |
$ |
(23) | (2) |
% |
$ |
1,287 | |||||||
|
|
|||||||||||||||||||
Network related expenses for 2016 decreased due to lower compensation costs, primarily related to decreased employee headcount, and certain benefits, including incentive compensation, pension and OPEB expense (as discussed below), and a reduction in rental costs for vehicles under operating leases that were modified during 2016, resulting in the classification as capital leases.
SELLING, GENERAL AND ADMINISTRATIVE EXPENSES
|
|
|||||||||||||||||||
|
|
For the Year Ended December 31, |
||||||||||||||||||
|
|
2016 |
2015 |
|||||||||||||||||
|
|
Frontier Legacy (excluding CTF Operations) |
||||||||||||||||||
|
|
Consolidated |
CTF |
$ Increase |
% Increase |
|||||||||||||||
|
($ in millions) |
Amount |
Operations |
Amount |
(Decrease) |
(Decrease) |
Amount |
|||||||||||||
|
|
|||||||||||||||||||
|
Selling, general and |
|||||||||||||||||||
|
administrative expenses |
$ |
2,093 |
$ |
731 |
$ |
1,362 |
$ |
16 | 1 |
% |
$ |
1,346 | |||||||
|
|
|||||||||||||||||||
SG&A expenses for 2016 increased due to higher costs for compensation, primarily related to increased employee headcount due to additional services provided by Frontier Secure, and certain benefits, including pension and OPEB expense (as discussed below), partially offset by lower incentive compensation for the year.
41
FRONTIER COMMUNICATIONS CORPORATION AND SUBSIDIARIES
Pension and OPEB Costs
Total consolidated pension and OPEB costs, excluding special termination benefits of $26 million in 2016, for the years ended December 31, 2016 and 2015 were as follows:
|
|
||||||
|
|
For the year ended December 31, |
|||||
|
($ in millions) |
2016 |
2015 |
||||
|
|
||||||
|
Total pension/OPEB expense |
$ |
129 |
$ |
95 | ||
|
Less: capitalized into |
||||||
|
capital expenditures |
(25) | (20) | ||||
|
Net pension/OPEB costs |
$ |
104 |
$ |
75 | ||
|
|
||||||
DEPRECIATION AND AMORTIZATION
|
|
|||||||||||||||||||
|
|
For the year ended December 31, |
||||||||||||||||||
|
|
2016 |
2015 |
|||||||||||||||||
|
|
Frontier Legacy (excluding CTF Operations) |
||||||||||||||||||
|
|
Consolidated |
CTF |
$ Increase |
% Increase |
|||||||||||||||
|
($ in millions) |
Amount |
Operations |
Amount |
(Decrease) |
(Decrease) |
Amount |
|||||||||||||
|
|
|||||||||||||||||||
|
Depreciation expense |
$ |
1,388 |
$ |
439 |
$ |
949 |
$ |
(34) | (3) |
% |
$ |
983 | |||||||
|
Amortization expense |
643 | 361 | 282 | (55) | (16) |
% |
337 | ||||||||||||
|
|
$ |
2,031 |
$ |
800 |
$ |
1,231 |
$ |
(89) | (7) |
% |
$ |
1,320 | |||||||
|
|
|||||||||||||||||||
Depreciation and amortization expense for 2016 decreased primarily due to the accelerated method of amortization related to the customer base that was acquired in our 2010 Acquisition with Verizon and in the Connecticut Acquisition, combined with changes in the remaining useful lives of certain plant assets and a lower net asset base. There was also an increase in depreciation expense as a result of more of the vehicle fleet being financed under capital leases than operating leases.
42
FRONTIER COMMUNICATIONS CORPORATION AND SUBSIDIARIES
RESTRUCTURING COSTS AND OTHER CHARGES
|
|
||||||||||||||||||||
|
|
For the year ended December 31, |
|||||||||||||||||||
|
|
2016 |
2015 |
||||||||||||||||||
|
|
Frontier Legacy (excluding CTF Operations) |
|||||||||||||||||||
|
|
Consolidated |
CTF |
$ Increase |
% Increase |
||||||||||||||||
|
($ in millions) |
Amount |
Operations |
Amount |
(Decrease) |
(Decrease) |
Amount |
||||||||||||||
|
|
||||||||||||||||||||
|
Restructuring costs |
||||||||||||||||||||
|
and other charges |
$ |
91 |
$ |
34 |
$ |
57 |
$ |
55 |
NM |
$ |
2 | |||||||||
|
|
||||||||||||||||||||
|
NM - Not meaningful |
||||||||||||||||||||
Restructuring costs and other charges increased in 2016 compared to 2015 primarily due to a reduction in the workforce of approximately 1,950 employees resulting in an increase in severance and related expenses of $30 million and pension/OPEB special termination benefit enhancements of $25 million.
ACQUISITION AND INTEGRATION COSTS
|
|
|||||||||||||
|
|
For the year ended December 31, |
||||||||||||
|
|
2016 |
2015 |
|||||||||||
|
|
$ Increase |
% Increase |
|||||||||||
|
($ in millions) |
Amount |
(Decrease) |
(Decrease) |
Amount |
|||||||||
|
|
|||||||||||||
|
CTF Acquisition |
$ |
435 |
$ |
239 | 122 |
% |
$ |
196 | |||||
|
Connecticut Acquisition |
1 | (39) | (98) |
% |
40 | ||||||||
|
Total acquisition and integration costs |
$ |
436 |
$ |
200 | 85 |
% |
$ |
236 | |||||
|
|
|||||||||||||
We invested $142 million and $129 million in capital expenditures related to the CTF Acquisition during the years ended December 31, 2016 and 2015, respectively.
We also invested $24 million in capital expenditures related to the Connecticut Acquisition during 2015.
43
FRONTIER COMMUNICATIONS CORPORATION AND SUBSIDIARIES
OTHER NON-OPERATING INCOME AND EXPENSE
|
|
||||||||||||
|
|
||||||||||||
|
|
For the year ended December 31, |
$ Increase |
% Increase |
|||||||||
|
($ in millions) |
2016 |
2015 |
(Decrease) |
(Decrease) |
||||||||
|
|
||||||||||||
|
Investment and other income, net |
$ |
27 |
$ |
7 |
$ |
20 | 286 |
% |
||||
|
Losses on early extinguishment of debt |
||||||||||||
|
and debt exchanges |
$ |
7 |
$ |
- |
$ |
7 | 0 |
% |
||||
|
Interest expense |
$ |
1,531 |
$ |
1,113 |
$ |
418 | 38 |
% |
||||
|
Income tax expense (benefit) |
$ |
(250) |
$ |
(165) |
$ |
(85) | 52 |
% |
||||
Investment and Other Income, Net
Investment and other income, net for 2016 increased $20 million due to a gain on expiration/settlement of customer advances combined with higher interest and dividend income of $6 million, primarily due to interest earned on restricted cash during 2016.
Loss on Extinguishment of Debt and Debt Exchanges
During the year ended December 31, 2016, Frontier recorded a loss of $7 million resulting from the exchange of senior notes during the year.
Interest expense
Interest expense for 2016 increased, primarily due to additional interest of $755 million in 2016 on the $6 billion senior notes offering and the $1,625 million term loan facility related to the CTF Acquisition. We incurred commitment fees of $10 million and $184 million for the Verizon Bridge Facility (as defined below) related to the CTF Acquisition during 2016 and 2015, respectively. Our composite average borrowing rate as of December 31, 2016 and 2015 was 8.55% and 8.99%, respectively. There was also an increase in interest expense as a result of more of the vehicle fleet being financed under capital leases than operating leases.
Income tax expense (benefit)
Income tax benefit for 2016 increased compared to 2015, primarily due to the increase in pretax loss. The effective tax rate on our pretax loss for 2016 was 40.2% as compared with 45.8% for 2015. Income taxes for 2016 include the impact of $36 million of tax benefits resulting primarily from the adjustment of deferred tax balances due to the CTF Acquisition in 2016.
We received $120 million in tax refunds in 2016 as compared to net cash taxes paid of $28 million in 2015.
Net loss attributable to Frontier common shareholders
Net loss attributable to Frontier common shareholders for 2016 was a net loss of $587 million, or $7.61 per share, as compared to a net loss of $316 million, or $4.41 per share, in 2015.
Diluted net loss attributable to Frontier common shareholders
Diluted net loss attributable to Frontier common shareholders for 2016 was a net loss of $587 million, or $7.61 per share, as compared to a net loss of $316 million, or $4.41 per share, in 2015.
44
FRONTIER COMMUNICATIONS CORPORATION AND SUBSIDIARIES
(b) Liquidity and Capital Resources
Analysis of Cash Flows
As of December 31, 2017, we had unrestricted cash and cash equivalents aggregating $362 million and restricted cash of $14 million. Restricted cash represents funds held as collateral by certain insurance carriers, of which $7 million was released in January 2018, and the remainder expected to be released in the first quarter of 2018. Our primary source of funds during 2017 was cash generated from operations, restricted and unrestricted cash, and additional borrowings. In 2017, we used cash flow from operations, restricted cash, and cash on hand to principally fund all of our cash investing and financing activities, primarily capital expenditures, dividends, and debt repayments. On April 1, 2016, we used the restricted cash obtained from net proceeds of the September 2015 senior notes offering and June 2015 equity offerings, along with additional borrowings and cash on hand, to finance the CTF Acquisition.
At December 31, 2017, we had a working capital deficit of $1,185 million, including $656 million of long-term debt due within one year, as compared to a working capital deficit of $788 million at December 31, 2016. The decline in working capital is primarily due to an increase in long term debt due within one year of $293 million as compared to the prior year related to senior notes reaching maturity during 2018. Although we have a working capital deficit as of December 31, 2017, after deducting current debt maturities, the majority of the balance relates to current advanced billings of $270 million that will be recognized as revenue over the next twelve months.
Cash Flows provided by Operating Activities
Cash flows provided by operating activities increased $174 million, or 10%, to $1,850 million in 2017 as compared to 2016. The increase was primarily the result of the addition of our CTF operations, partially offset by unfavorable changes in working capital along with higher interest expense and acquisition and integration costs.
We received $51 million in tax refunds in 2017 as compared to tax refunds of $120 million and net cash taxes paid of $28 million in 2016 and 2015, respectively.
In connection with the CTF and Connecticut Acquisitions, Frontier recognized acquisition and integration costs of $25 million during 2017 compared to $436 million during 2016. Interest expense of $755 million was incurred during 2016 related to the September 2015 debt offering and the JPM Credit Agreement (as defined below) compared to $189 million in interest expense during 2015. Additionally, Frontier incurred $10 million of interest expense related to the Verizon Bridge Facility in 2016 compared to $184 million during 2015.
Cash Flows used by Investing Activities
Capital Expenditures
In 2017, 2016 and 2015, our capital expenditures were, respectively, $1,188 million, $1,401 million and $863 million (including $34 million, $142 million and $153 million of integration-related capital expenditures in 2017, 2016 and 2015, respectively, associated with the CTF Acquisition and the Connecticut Acquisition). In addition to the capital expenditures mentioned above, network expansion funded by the previously received Connect America Fund (CAF) Phase I funds amounted to $22 million in 2015. Capital expenditures related to CAF Phase II are included in our reported amounts for capital expenditures.
CTF Acquisition
On April 1, 2016, Frontier acquired the wireline operations of Verizon in California, Texas and Florida for a purchase price of $10,540 million in cash and assumed debt (the CTF Acquisition), pursuant to the February 5, 2015 Securities Purchase Agreement, as amended. In addition, Frontier and Verizon settled the working capital and net debt adjustments with $15 million paid to Frontier in October 2016.
45
FRONTIER COMMUNICATIONS CORPORATION AND SUBSIDIARIES
Cash Flows used by and provided from Financing Activities
Proceeds from Long Term Debt Borrowings
During 2017, 2016, and 2015 we borrowed $1,500 million, $1,940 million, and $6,603 million, respectively, of debt consisting of $1,500 million, $1,940 million, and $3 million, respectively, of senior secured debt. Refer to note 7 for details of the specific transactions.
Debt Reduction
During 2017, 2016 and 2015, we retired an aggregate principal amount of $1,815 million, $453 million and $298 million, respectively, of debt consisting of $1,655 million, $23 million and $295 million, respectively, of senior unsecured debt and $1 million during 2016 and 2015, of rural utilities service loan contracts. Of these amounts, $159 million, $430 million and $3 million of related to secured debt during 2017, 2016 and 2015, respectively. Refer to note 7 for details of the specific transactions.
Subject to limitations contained in our indentures and credit facilities, we may from time to time make repurchases of our debt in the open market, through tender offers, by exercising rights to call or in privately negotiated transactions. We may also refinance existing debt or exchange existing debt for newly issued debt obligations.
Common Stock Offering
On June 10, 2015, prior to the reverse stock split, we completed a registered offering of 150,000,000 shares of our common stock, par value $0.25 per share, at an offering price of $5 per share. On June 24, 2015, Frontier issued an additional 15,000,000 shares of common stock in connection with the over-allotment option that was exercised in full by the underwriters. Aggregate net proceeds were approximately $799 million after deducting commissions and expenses. We used the net proceeds from this offering to fund a portion of the acquisition price of the CTF Acquisition and for related fees and expenses.
Mandatory Convertible Preferred Stock (Series A) Offering
On June 10, 2015, we also completed a registered offering of 17,500,000 shares of our 11.125% Mandatory Convertible Preferred Stock, Series A, par value $0.01 per share (the “Series A Preferred Stock”), at an offering price of $100 per share. On June 24, 2015, Frontier issued an additional 1,750,000 shares of Series A Preferred Stock in connection with the over-allotment option that was exercised in full by the underwriters. Aggregate net proceeds of the offering were $1,866 million after deducting commissions and expenses. We used the net proceeds from this offering to fund a portion of the acquisition price of the CTF Acquisition and for related fees and expenses. All shares of Series A Preferred Stock will convert to common stock on June 30, 2018 at a ratio of 1.33:1.
Capital Resources
Our primary source of cash is cash flows from operations. We believe our operating cash flows, existing cash balances, existing revolving credit facility and access to the capital markets, as necessary, will be adequate to finance our working capital requirements, fund capital expenditures, make required debt interest and principal payments, pay taxes and support our short-term and long-term operating strategies for the next twelve months. A number of factors, including but not limited to, losses of customers, pricing pressure from increased competition, lower subsidy and switched access revenues, and the impact of economic conditions may negatively affect our cash generated from operations. As of December 31, 2017, we had $656 million and $804 million of debt maturing in 2018 and 2019, respectively.
Term Loan and Credit Facilities
On February 27, 2017, Frontier entered into a first amended and restated credit agreement with JPMorgan Chase Bank, N.A., as administrative agent, and the lenders party thereto, pursuant to which Frontier combined its revolving credit agreement, dated as of June 2, 2014, and its term loan credit agreement, dated as of August 12, 2015. Under the JPM Credit Agreement, as further amended on June 15, 2017 by Increase Joinder No.1 (as so amended, the JPM Credit Agreement), Frontier has a $1,625 million senior secured term loan A facility (the Term Loan A) maturing on March 31, 2021, an $850 million undrawn secured revolving credit facility maturing on February 27, 2022 (the Revolver), and $1,500 million senior secured term loan B facility (the Term Loan B) maturing on June 15, 2024. The determination of interest rates for each of the facilities under the JPM Credit Agreement is based on margins over the Base Rate (as defined in the JPM Credit Agreement) or over LIBOR, at the election of Frontier. Interest rate margins on the Term Loan A and Revolver (ranging from 0.75% to 1.75% for Base Rate borrowings and 1.75% to 2.75% for LIBOR borrowings) are subject to adjustment based on Frontier’s Total Leverage Ratio (as defined in the JPM Credit Agreement). The interest rate on the Term Loan A as of December 31, 2017 was LIBOR plus 2.75%. Interest rate margins on the Term Loan B (2.75% for Base Rate borrowings and 3.75% for LIBOR borrowings) are not subject to adjustment. The security package under the JPM Credit Agreement, which includes pledges of the equity interests in
46
FRONTIER COMMUNICATIONS CORPORATION AND SUBSIDIARIES
certain Frontier subsidiaries and guaranties by certain Frontier subsidiaries. As of December 31, 2017, no borrowing had been made under the revolving credit facility. Letters of credit, which may be issued under the revolver up to a maximum of $134 million, reduce available borrowing capacity under the revolving credit facility. Letters of credit issued under the revolver totaled $63 million and $0 as of December 31, 2017 and 2016, respectively. The revolving credit facility is available for general corporate purposes but may not be used to fund dividend payments if the undrawn amount under the revolver is less than $250 million.
Frontier has two senior secured credit agreements with CoBank, ACB, as administrative agent, lead arranger and a lender, and the other lenders party thereto: the first, drawn in 2011 (the 2011 CoBank Credit Agreement), was refinanced on October 12, 2016 with a similar facility for $315 million, maturing on October 12, 2021 (the 2016 CoBank Credit Agreement), and the second, drawn in 2014 (the 2014 CoBank Credit Agreement), matures on October 24, 2019.
On March 29, 2017, Frontier amended the 2014 and 2016 CoBank Credit Agreements. The amendments provide that interest rate margins under each of these facilities will range from 0.875% to 3.875% for Base Rate borrowings and 1.875% to 4.875% for LIBOR borrowings, subject to adjustment based on our Total Leverage Ratio, as defined in each credit agreement. The interest rate on each of the facilities as of December 31, 2017 was LIBOR plus 3.875%. In addition, the amendments provide for increases in the maximum Leverage Ratio and expansion of the security package identical to those contained in the JPM Credit Agreement.
On January 25, 2018 Frontier further amended its credit agreements with JP Morgan Chase and CoBank (JPM Credit Amendment). The amendments expand the security package to include interests of certain subsidiaries previously not pledged and also update the net leverage ratio maintenance test covenant, which provides Frontier with greater flexibility in executing on operational initiatives going forward, as detailed in the section below.
Letters of Credit Facility
Frontier has a Continuing Agreement for Standby Letters of Credit with Deutsche Bank AG New York Branch and Bank of Tokyo – Mitsubishi UFJ, LTD. (the LC Agreements), Frontier can also issue letters of credit under the revolver up to a maximum of $134 million. As of December 31, 2017, $129 million and $63 million of undrawn Standby Letters of Credit had been issued under the LC Agreements and revolver respectively. Borrowings under the LC Agreements are secured by a security package identical to those contained in the JPM Credit Amendment.
Covenants
The terms and conditions contained in our indentures, the CoBank Credit Agreements, and the JPM Credit Agreement include the timely payment of principal and interest when due, the maintenance of our corporate existence, keeping proper books and records in accordance with GAAP, restrictions on the incurrence of liens on our assets securing indebtedness and our subsidiaries’ assets, restrictions on the incurrence of indebtedness by our subsidiaries and restrictions on asset sales and transfers, mergers and other changes in corporate control subject to important qualifications and exceptions. We would be restricted from declaring dividends by the CoBank Credit Agreements and the JPM Credit Agreement if an event of default occurred and was continuing at the time or would result from the dividend declaration. In addition, under the Certificate of Designations of our 11.125% Mandatory Convertible Preferred Stock, Series A, we would be restricted from paying dividends on our common stock if we failed to declare and pay dividends on our Series A Preferred Stock.
The JPM Credit Amendment replaced Frontiers existing net leverage ratio test with a first lien net leverage ratio maintenance test which provides for a maximum first lien net leverage ratio of 1.50 to 1.00 as of the last day of any fiscal quarter, stepping down to 1.35 to 1.00 for the fiscal quarters ending June 30, 2020 and thereafter. The Amendments also modify the covenants to provide for junior lien capacity on any indebtedness permitted under the credit agreements, while limiting the incurrence of first lien debt. Additionally, the amendment prohibit us from using proceeds from our revolving credit facility to fund dividend payments if the undrawn amount under the revolver is less than $250 million, and we may not pay dividends on our common stock in excess of $2.40 per share in any fiscal year.
Indentures for our senior unsecured debt obligations limit our ability to create liens on our assets securing indebtedness and our subsidiaries’ assets or merge or consolidate with other companies, our subsidiaries’ ability to borrow funds and to engage in change of control transactions, subject to important exceptions and qualifications. The indentures for our 8.875% Senior Notes due 2020, our 10.50% Senior Notes due 2022, and our 11.00% Senior Notes due 2025 contain covenants that are customary for similarly rated issuers. Among other things, these covenants limit our ability to incur additional indebtedness if our leverage ratio exceeds 4.5 to 1 (as defined in the indentures), limits liens and subsidiary debt to 1.25 times EBITDA (as defined in the indentures), limits cumulative restricted payments,
47
FRONTIER COMMUNICATIONS CORPORATION AND SUBSIDIARIES
including dividends, to cumulative EBITDA less 1.4 times cumulative interest expense (as defined in the indenture), if our leverage ratio does not exceed 4.5 to 1, and limits cumulative restricted payments, including dividends, to a lesser amount during periods, if any, in which our leverage ratio exceeds 4.5 to 1, and restricts our ability to divest substantially all of the assets of Frontier.
As of December 31, 2017, we were in compliance with all of our indenture and credit facility covenants.
Dividends
The Board of Directors has suspended the quarterly cash dividend on the Company’s common stock beginning with the first quarter of 2018. The declaration and payment of future dividends on our common stock is at the discretion of our Board of Directors, and will depend upon many factors, including our financial condition, results of operations, growth prospects, funding requirements, payment of cumulative dividends on Series A Preferred Stock, applicable law, restrictions in agreements governing our indebtedness and other factors our Board of Directors deem relevant.
Off-Balance Sheet Arrangements
We do not maintain any off-balance sheet arrangements, transactions, obligations or other relationships with unconsolidated entities that would be expected to have a material current or future effect upon our financial statements.
Future Contractual Obligations and Commitments
A summary of our future contractual obligations and commercial commitments as of December 31, 2017 is as follows:
|
|
|||||||||||||||||||||
|
|
Payments due by period |
||||||||||||||||||||
|
($ in millions) |
Total |
2018 |
2019 |
2020 |
2021 |
2022 |
Thereafter |
||||||||||||||
|
|
|||||||||||||||||||||
|
Long-term debt obligations, |
|||||||||||||||||||||
|
excluding interest |
$ |
17,863 |
$ |
656 |
$ |
804 |
$ |
1,132 |
$ |
2,558 |
$ |
2,703 |
$ |
10,010 | |||||||
|
Interest on long-term debt |
11,136 | 1,488 | 1,437 | 1,380 | 1,246 | 1,128 | 4,457 | ||||||||||||||
|
Operating lease obligations |
571 | 80 | 25 | 29 | 26 | 23 | 388 | ||||||||||||||
|
Capital lease obligations |
119 | 41 | 29 | 19 | 12 | 9 | 9 | ||||||||||||||
|
Financing lease obligations |
100 | 9 | 9 | 10 | 10 | 10 | 52 | ||||||||||||||
|
Purchase obligations |
126 | 37 | 40 | 31 | 7 | 2 | 9 | ||||||||||||||
|
Liability for uncertain tax positions |
12 | 1 |
- |
1 |
- |
- |
10 | ||||||||||||||
|
Total |
$ |
29,927 |
$ |
2,312 |
$ |
2,344 |
$ |
2,602 |
$ |
3,859 |
$ |
3,875 |
$ |
14,935 | |||||||
|
|
|||||||||||||||||||||
During 2017, we increased our outstanding performance letters of credit from $125 million to $192 million at December 31, 2017.
On April 29, 2015, the FCC released its right of first refusal offer of support to price cap carriers under the CAF Phase II program, which is intended to provide long-term support for broadband in high-cost unserved or underserved areas. In June 2015, Frontier accepted the CAF Phase II offer, which provides for $332 million in annual support, including $49 million in annual support related to the properties acquired in the CTF Acquisition, through 2020 to make available 10 Mbps downstream/1 Mbps upstream broadband service to approximately 774,000 households across certain of the 29 states where we now operate.
To the extent we do not enable the required number of households with 10 Mbps downstream/1 Mbps upstream broadband service by the end of the CAF Phase II term, we will be required to return a portion of the funds previously received.
Critical Accounting Policies and Estimates
The preparation of our financial statements requires management to make estimates and assumptions. There are inherent uncertainties with respect to such estimates and assumptions; accordingly, it is possible that actual results could differ from those estimates and changes to estimates could occur in the near term. The estimates which require the most significant judgment are listed below.
These critical accounting estimates have been reviewed with our independent registered public accounting firm and with the Audit Committee of our Board of Directors. For a discussion of these and other accounting policies, see Note 1 of the Notes to Consolidated Financial Statements.
48
FRONTIER COMMUNICATIONS CORPORATION AND SUBSIDIARIES
Allowance for Doubtful Accounts
We maintain an allowance for doubtful accounts based on our estimate of our ability to collect accounts receivable. Our estimates are based on assumptions and other considerations, including payment history, customer financial performance, carrier billing disputes and aging analysis. Our estimation process includes general and specific reserves and varies by customer category. In 2017 and 2016, we had no “critical estimates” related to bankruptcies of communications companies or any other significant customers. See Notes 1 and 4 of the Notes to Consolidated Financial Statements for additional discussion.
Indefinite-lived Intangibles
Our indefinite-lived intangibles consist of goodwill and trade name, which were generated as a result of business combinations. We test for impairment of these assets annually as of December 31 or more frequently, whenever events occur, or facts and circumstances change that make it more likely than not that the fair value of a reporting unit has been reduced below its carrying amount. Events that might indicate impairment include, but are not limited to, strategic decisions made in response to economic and competitive conditions, the impact of the economic environment on our customer base, material negative changes in relationships with significant customers, and/or a significant decline in our stock price for a sustained period.
We early adopted ASU 2017-04 “Intangibles – Goodwill and Other (Topic 350): Simplifying the Test for Goodwill Impairment” (“ASU 2017-04”) during the second quarter of 2017. In accordance with ASU 2017-04, our annual goodwill impairment test (and interim test if determined to be necessary) will consist of comparing the fair value of our reporting unit to its carrying value. To the extent that the carrying value exceeds fair value, an impairment will be recognized.
For the purpose of our goodwill impairment test, we first assess qualitative factors to determine if it is more likely than not that fair value of the reporting unit is less than the carrying amount. If it is less, an additional quantitative evaluation must be performed. Our quantitative assessment consists of using a market multiples approach to determine fair value. Marketplace company comparisons and analyst reports within the wireline telecommunications industry have historically supported a range of fair values of multiples between 4.4x and 6.5x annualized EBITDA (defined as operating income, net of acquisition and integration costs, pension/OPEB expense, pension settlement costs, stock-based compensation expense, goodwill impairment, storm-related costs, and restructuring costs and other charges, as well as depreciation and amortization).
During 2017, our common stock declined and traded at historically low prices. As a result, we tested goodwill for impairment in each of the four quarters in 2017. Our second and fourth quarter quantitative assessments indicated that the carrying value of the enterprise exceeded its fair value and, therefore, an impairment existed. We recorded goodwill impairments totaling $2,748 million for 2017. The driver for the impairment in the second quarter was a reduction in our profitability and utilized EBITDA estimate, which when applied to our market multiple resulted in a lower enterprise valuation. During the fourth quarter, the impairment was largely driven by a lower enterprise valuation resulting from a reduction in utilized market multiple from 5.8x to 5.5x reflecting our lower stock price and a lower outlook for wireline communications companies. The revaluation of our net deferred tax liabilities which resulted from the enactment of Tax Cut and Job Act, caused further goodwill impairment (see Note 12). The first and third quarter quantitative assessments, did not result in goodwill impairment charges. In estimating the enterprise fair value we used 5.8x as the multiple for the first three quarters of 2017 and 5.5x for the fourth quarter test.
The market multiples approach that we use incorporates significant estimates and assumptions related to the forecasted results for the remainder of the year, including revenues, expenses, and the achievement of other cost synergies. Our assessment includes many qualitative factors that require significant judgment. Alternative interpretations of these factors could have resulted in different conclusions regarding the need for, or size of, an impairment. Continued declines in our profitability or cash flows or in sustained low trading prices of our common stock may result in further impairment.
The enterprise fair value is sensitive to the amount of EBITDA generated by Frontier and the EBITDA multiple used in the calculation. Significant changes in the assumptions or estimates used in our impairment analyses, such as a reduction in profitability and/or cash flows, could result in a non-cash goodwill and indefinite-lived intangible asset impairment charge and materially affect our operating results. The market multiples approach is sensitive to changes in the estimated annual EBITDA, with each $100 million change equating to approximately $550 million of estimated enterprise value. Similarly, a ten-basis point change in the multiple used would affect the estimated enterprise value by approximately $355 million. Sustained low trading prices for our common stock could also affect the reconciliation of our market capitalization and indicate further impairment.
49
FRONTIER COMMUNICATIONS CORPORATION AND SUBSIDIARIES
We also considered whether the carrying values of finite-lived intangible assets and property plant and equipment may not be recoverable or whether the carrying value of certain finite-lived intangible assets were impaired, noting no impairment was present as of December 31, 2017.
Depreciation and Amortization
The calculation of depreciation and amortization expense is based upon the estimated useful lives of the underlying property, plant and equipment and identifiable finite-lived intangible assets. Depreciation expense is principally based on the composite group method for substantially all of our property, plant and equipment assets. The estimates for remaining lives of the various asset categories are determined annually, based on an independent study. Among other considerations, these studies include models that consider actual usage, replacement history and assumptions about technology evolution for each category of asset. The latest study was completed in the fourth quarter of 2017 and did not result in any significant changes in remaining lives for any of our asset categories. A one year decrease in the estimated useful lives of our property, plant and equipment would result in an increase of approximately $180 million to depreciation expense.
Our finite-lived intangibles consist principally of customer base; $2,760 million from the 2010 Acquisition, $570 million from the Connecticut Acquisition and $2,190 million from the CTF Acquisition. These customer bases are being amortized on an accelerated method because this method most closely resembles the projected underlying revenue streams. In assigning lives, which range from between eight and 12 years, a separate evaluation and determination is made for consumer and commercial customers.
See Notes 5 and 6 of the Notes to Consolidated Financial Statements for additional discussion.
Asset Impairments
We review long-lived assets to be held and used, including customer lists and long-lived assets to be disposed of for impairment whenever events or changes in circumstances indicate that the carrying amount of such assets may not be recoverable. When triggering events are identified, recoverability of assets to be held and used is measured by comparing the carrying amount of the asset to the future undiscounted net cash flows expected to be generated by the asset. Recoverability of assets held for sale is measured by comparing the carrying amount of the assets to their estimated fair market value. If any assets are considered to be impaired, the impairment is measured by the amount by which the carrying amount of the assets exceeds the estimated fair value. Also, we periodically reassess the useful lives of our tangible and intangible assets to determine whether any changes are required.
Pension and Other Postretirement Benefits
We sponsor a defined benefit pension plan covering a significant number of our current and former employees as well as other postretirement benefit plans that provide medical, dental, life insurance and other benefits for covered retired employees and their beneficiaries and covered dependents. As of December 31, 2017, the unfunded benefit obligation for these plans recorded on our consolidated balance sheet was $1,705 million. During 2017, we contributed $75 million to these plans net of the differential (see note 17), and recorded $208 million of expense before capitalization, including $83 million of pension settlement costs and $5 million of special termination benefits. Pension and other postretirement benefit costs and obligations are dependent upon various actuarial assumptions, the most significant of which are the discount rate and the expected long-term rate of return on plan assets.
Our discount rate assumption is determined annually with assistance from our actuaries based on the pattern of expected future benefit payments and the prevailing rates available on long-term, high quality corporate bonds with durations approximate to that of our benefit obligation. As of December 31, 2017, and 2016, we utilized an estimation technique that is based upon a settlement model (Bond:Link) that permits us to closely match cash flows to the expected payments to participants. This rate can change from year-to-year based on market conditions that affect corporate bond yields.
We are utilizing a discount rate of 3.70% as of December 31, 2017 for our qualified pension plan, compared to rates of 4.10% and 4.50% in 2016 and 2015, respectively. The discount rate for postretirement plans as of December 31, 2017 was a range of 3.70% to 3.80% compared to a range of 4.10% to 4.30% in 2016 and 4.50% to 4.70% in 2015.
50
FRONTIER COMMUNICATIONS CORPORATION AND SUBSIDIARIES
In the following table, we show the estimated sensitivity of our pension and other postretirement benefit plan liabilities to a 25 basis point change in the discount rate as of December 31, 2017:
|
|
||||||
|
($ in millions) |
Increase in Discount Rate of 25 bps |
Decrease in Discount Rate of 25 bps |
||||
|
Pension plans |
||||||
|
Projected benefit obligation |
$ |
(83) |
$ |
87 | ||
|
|
||||||
|
Other postretirement plans |
||||||
|
Accumulated postretirement benefit obligation |
$ |
(36) |
$ |
38 | ||
|
|
||||||
In developing the expected long-term rate of return assumption, we considered published surveys of expected market returns, 10 and 20 year actual returns of various major indices, and our own historical 5 year, 10 year and 20 year investment returns. The expected long-term rate of return on plan assets is based on an asset allocation assumption of 40% in long-duration fixed income securities, and 60% in equity securities and other investments. We review our asset allocation at least annually and make changes when considered appropriate. Our asset return assumption is made at the beginning of our fiscal year. In 2017, 2016 and 2015, our expected long-term rate of return on plan assets was 7.50%, 7.50% and 7.75%, respectively. Our actual return on plan assets in 2017 was 16.50%. For 2018, we will assume a rate of return of 7.50%. Our pension plan assets are valued at fair value as of the measurement date.
For additional information regarding our pension and other postretirement benefits see Note 17 to the Notes to Consolidated Financial Statements.
Income Taxes
We file a consolidated federal income tax return. We utilize the asset and liability method of accounting for income taxes. Under the asset and liability method, deferred income taxes are recorded for the tax effect of temporary differences between the financial statement basis and the tax basis of assets and liabilities using tax rates expected to be in effect when the temporary differences are expected to reverse. Actual income taxes could vary from these estimates due to future changes in governing law or review by taxing authorities.
We use a “more likely than not” threshold to the recognition and derecognition of uncertain tax positions either taken or expected to be taken in Frontier’s income tax returns. The total amount of our gross tax liability for tax positions that may not be sustained under a “more likely than not” threshold amounts to $12 million as of December 31, 2017 including interest of $1 million. For additional information regarding our accounting for income taxes see Note 12 of the Notes to Consolidated Financial Statements.
Business Combinations
We allocate the total cost of an acquisition to the underlying net assets based on their respective estimated fair values. As part of this allocation process, we identify and attribute values and estimated lives to the intangible assets acquired. These determinations involve significant estimates and assumptions about several highly subjective variables, including future cash flows, discount rates, and asset lives. There are also different valuation models for each component, the selection of which requires considerable judgment. Our estimates and assumptions may be based, in part, on the availability of listed market prices or other transparent market data. These determinations will affect the amount of amortization expense recognized in future periods. We base our fair value estimates on assumptions we believe are reasonable, but recognize that the assumptions are inherently uncertain. Depending on the size of the purchase price of a particular acquisition and the mix of intangible assets acquired, the purchase price allocation could be materially impacted by applying a different set of assumptions and estimates. Frontier allocated $9,871 million and $2,018 million in total consideration to the “fair market value” of the assets and liabilities acquired in the CTF Acquisition and the Connecticut Acquisition, respectively. The estimates of the fair values assigned to property, plant and equipment, customer list and goodwill, are more fully described in Note 3 of the Notes to Consolidated Financial Statements.
Recent Accounting Pronouncements
See Note 2 of the Notes to Consolidated Financial Statements included in Part IV of this report for additional information related to recent accounting pronouncements.
51
FRONTIER COMMUNICATIONS CORPORATION AND SUBSIDIARIES
Item 7A. Quantitative and Qualitative Disclosures about Market Risk
We are exposed to market risk in the normal course of our business operations due to ongoing investing and funding activities, including those associated with our pension plan assets. Market risk refers to the potential change in fair value of a financial instrument as a result of fluctuations in interest rates and equity prices. We do not hold or issue derivative instruments, derivative commodity instruments or other financial instruments for trading purposes. As a result, we do not undertake any specific actions to cover our exposure to market risks, and we are not party to any market risk management agreements other than in the normal course of business. Our primary market risk exposures from interest rate risk and equity price risk are as follows:
Interest Rate Exposure
Our exposure to market risk for changes in interest rates relates primarily to the interest-bearing portion of our pension investment portfolio and the related actuarial liability for pension obligations, as well as our floating rate indebtedness. As of December 31, 2017, 80% of our long-term debt had fixed interest rates. We had no interest rate swap agreements related to our fixed rate or variable rate debt in effect at December 31, 2017 and 2016. We believe that our currently outstanding obligation exposure to interest rate changes is minimal.
Our objectives in managing our interest rate risk are to limit the impact of interest rate changes on earnings and cash flows and to lower our overall borrowing costs. To achieve these objectives, only 20% of our outstanding borrowings at December 31, 2017 have floating interest rates. Our undrawn $850 million revolving credit facility has interest rates that float with the LIBO Rate, as defined. Consequently, we have limited material future earnings or cash flow exposures from changes in interest rates on our debt. An adverse change in interest rates would increase the amount that we pay on our variable rate obligations and could result in fluctuations in the fair value of our fixed rate obligations. Based upon our overall interest rate exposure at December 31, 2017, a near-term change in interest rates would not materially affect our consolidated financial position, results of operations or cash flows.
At December 31, 2017, the fair value of our long-term debt was estimated to be approximately $14 billion, based on prevailing interest rates, our overall weighted average borrowing rate of 8.44% and our overall weighted average maturity of approximately six years. As of December 31, 2017, there has been no significant change in the weighted average maturity applicable to our obligations since December 31, 2016.
Equity Price Exposure
Our exposure to market risks for changes in equity security prices as of December 31, 2017 is limited to our pension plan assets. We have no other security investments of any significant amount.
Our Pension Plan assets decreased from $2,766 million at December 31, 2016 to $2,674 million at December 31, 2017, a decrease of $92 million, or 3%. This decrease was a result of benefit payments of $544 million, primarily lump sum settlements of $486 million, partially offset by positive investment returns of $378 million, net of investment management and administrative fees, and contributions in excess of the Differential (as defined below) of $74 million, during 2017.
As part of the CTF Acquisition, Verizon was required to make a cash payment to Frontier for the difference in assets initially transferred by Verizon into the Pension Plan and the related obligation (the Differential). During 2017, we received the $131 million Differential payment from Verizon, and have remitted an equivalent amount to the Pension Plan as of December 31, 2017. As the Differential was reflected as a receivable of the Pension Plan at December 31, 2016, the cash funding had no impact to plan assets.
Item 8. Financial Statements and Supplementary Data
The following documents are filed as part of this Report:
1. Financial Statements - See Index on page F-1.
2. Supplementary Data - Quarterly Financial Data is included in the Financial Statements (see 1. above).
3. Schedule of Pledged Subsidiary Financial Data
52
FRONTIER COMMUNICATIONS CORPORATION AND SUBSIDIARIES
Item 9.Changes in and Disagreements with Accountants on Accounting and Financial Disclosure
None.
Item 9A.Controls and Procedures
(i)Evaluation of Disclosure Controls and Procedures
We carried out an evaluation, under the supervision and with the participation of our management, including our principal executive officer and principal financial officer, regarding the effectiveness of our disclosure controls and procedures (as defined in Rules 13a–15(e) and 15d–15(e) under the Securities Exchange Act of 1934, as amended). Based upon this evaluation, our principal executive officer and principal financial officer concluded, as of the end of the period covered by this report, December 31, 2017, that our disclosure controls and procedures were effective.
(ii) Internal Control Over Financial Reporting
(a) Management’s annual report on internal control over financial reporting
Our management report on internal control over financial reporting appears on page F-2.
(b) Report of registered public accounting firm
The report of KPMG LLP, our independent registered public accounting firm, on internal control over financial reporting appears on page F-4.
(c) Changes in internal control over financial reporting
We reviewed our internal control over financial reporting at December 31, 2017. There have been no changes in our internal control over financial reporting identified in an evaluation thereof that occurred during the last fiscal quarter of 2017 that materially affected, or are reasonably likely to materially affect, our internal control over financial reporting.
None.
53
FRONTIER COMMUNICATIONS CORPORATION AND SUBSIDIARIES
PART III
Item 10. Directors, Executive Officers and Corporate Governance
Certain of the information required by this Item is incorporated by reference from our definitive proxy statement for the 2018 Annual Meeting of Stockholders to be filed with the SEC pursuant to Regulation 14A within 120 days after December 31, 2017.
Executive Officers of the Registrant
Our Executive Officers as of February 28, 2018 were:
|
Name |
Age |
Current Position and Officer |
|
Kenneth W. Arndt |
53 |
Executive Vice President, Commercial Sales Operations |
|
Donald Daniels |
50 |
Senior Vice President and Controller |
|
Steve Gable |
44 |
Executive Vice President and Chief Technology Officer |
|
Chris D. Levendos |
50 |
Executive Vice President, Field Operations |
|
John Maduri |
56 |
Executive Vice President, Consumer Sales, Marketing and Product |
|
R. Perley McBride |
52 |
Executive Vice President and Chief Financial Officer |
|
Daniel J. McCarthy |
53 |
President and Chief Executive Officer and a Director |
|
Mark D. Nielsen |
53 |
Executive Vice President and Chief Legal Officer |
|
Kathleen Weslock |
62 |
Executive Vice President and Chief People Officer |
There is no family relationship between the directors or executive officers. The term of office of each of the foregoing officers of Frontier is annual and will continue until a successor (if any) has been elected and qualified.
KENNETH W. ARNDT has been with Frontier since 2003 and was appointed Executive Vice President, Commercial Sales Operations, in December 2016. Mr. Arndt previously had oversight of Frontier’s operations in Connecticut, New York, Ohio, Pennsylvania and West Virginia. Before joining Frontier, Mr. Arndt served as Vice President of Marketing for Lucent Technologies and Vice President of Sales and Marketing for Commonwealth Telephone Company in Pennsylvania.
DONALD DANIELS joined Frontier in July 2014 as Senior Vice President and Controller. From October 2002 to July 2014 he held various positions with JetBlue Airways Corporation, including Corporate Controller, Chief Accounting Officer, Vice President and Controller, Assistant Controller, and Director of Financial Reporting. Prior to that Mr. Daniels held various positions of increasing responsibility at Delta Air Lines and Deloitte and Touche, LLP. Mr. Daniels is a veteran of the United States Army and a certified public accountant.
STEVE GABLE became Executive Vice President and Chief Technology Officer of Frontier in April 2015. He joined Frontier in November 2012 as Senior Vice President and Chief Information Officer. Prior to Frontier, Mr. Gable was Executive Vice President/CTO of Tribune Company while also serving as President of Tribune Digital. Before Tribune, Mr. Gable served as Vice President of Technology for Clear Channel Radio.
Chris D. Levendos joined Frontier in June 2017 as Executive Vice President of Field Operations. Mr. Levendos is responsible for the efficiency and effectiveness of operational field service delivery, upgrades, maintenance and repair. Prior to joining Frontier, Mr. Levendos worked at Google Fiber, from April 2015 to May 2017, heading Google Fiber’s Network Deployment and Operations organization. Before that, Mr. Levendos spent 26 years at Verizon, from 1989 to April 2015, last serving as Region Vice President for its New York City wireline operations. Mr. Levendos holds a bachelor’s degree from the State University of New York at Plattsburg and master’s degree from New York University and Stevens Institute of Technology.
John Maduri joined Frontier in July 2017 as Executive Vice President, Consumer Sales, Marketing & Product. He has more than 30 years of experience in the telecommunications industry. From January 2014 to December 2016, Mr. Maduri was President of Cable & Wireless Communications’ Commercial Business Unit, responsible for the strategy and growth of the B2B segment in the Caribbean and Latin America. From 2005 to 2013, Mr. Maduri was CEO of Xplornet Communications Inc. Prior to that, Mr. Maduri served as President, TELUS Business Solutions, a telecommunications company, from 2000 to 2004. Prior to joining Telus, Mr. Maduri held positions of increasing responsibility with Rogers Communications, including Executive Vice President, Finance and Planning, and Chief Financial Officer. He began his career as a Senior Auditor at the Toronto office of Price Waterhouse.
54
FRONTIER COMMUNICATIONS CORPORATION AND SUBSIDIARIES
R. PERLEY MCBRIDE became Chief Financial Officer and Executive Vice President of Frontier on November 4, 2016. Prior to joining Frontier, Mr. McBride was the Chief Financial Officer of Cable & Wireless Communications Plc until its May 2016 acquisition by Liberty Global Plc. Previously, Mr. McBride served as Chief Financial Officer at Leap Wireless International from December 2012 through May 2014 and was part of the Executive team that led the business through its acquisition by AT&T Inc. Prior to Leap Wireless, he served as Executive Vice President of Finance at The Weather Company, owner of The Weather Channel among other assets, between 2010 and 2012. He also served in several senior financial management roles at Frontier between 1999 and 2010, and also between 1994 and 1997.
DANIEL J. McCARTHY has been with Frontier since December 1990 and is the President and Chief Executive Officer. Prior to becoming President and Chief Executive Officer in April 2015, Mr. McCarthy held other positions of responsibility at Frontier, including President and Chief Operating Officer, from April 2012 to April 2015, Executive Vice President and Chief Operating Officer, from January 2006 to April 2012, and Senior Vice President, Field Operations, from December 2004 to December 2005. Mr. McCarthy serves as a Trustee of Sacred Heart University in Fairfield, Connecticut, and of Foundations in Education for the Diocese of Bridgeport, Connecticut. He is a member of the Board of Directors of the Western Connecticut Health Network, the Board of Directors of the Business Council of Fairfield County, and a member of the Business Roundtable. He is also a director of Constellation Brands, Inc.
MARK D. NIELSEN joined Frontier in March 2014 and is Executive Vice President and Chief Legal Officer. Prior to joining Frontier, he was Associate General Counsel and Chief Compliance Officer for Praxair Inc. and Vice President and Assistant General Counsel of Raytheon Company. Before that, Mr. Nielsen served as Chief Legal Counsel, and then Chief of Staff, to Massachusetts Governor Mitt Romney from 2004 to 2007.
KATHLEEN WESLOCK joined Frontier as Executive Vice President and Chief People Officer in July 2015. Previously, she had worked as Senior Vice President/Chief Human Resources Officer at Cisco Systems, Inc. and Senior Vice President, Chief Human Resources Officer & Internal Communications, at SunGard Data Systems. She has also worked as Director of Human Resources, Financial Advisory Services, at Deloitte and Director of Global Human Resources at the global law firm Shearman & Sterling.
Item 11. Executive Compensation
The information required by this Item is incorporated by reference from our definitive proxy statement for the 2018 Annual Meeting of Stockholders to be filed with the SEC pursuant to Regulation 14A within 120 days after December 31, 2017.
Item 12. Security Ownership of Certain Beneficial Owners and Management and Related Stockholder
Matters
The information required by this Item is incorporated by reference from our definitive proxy statement for the 2018 Annual Meeting of Stockholders to be filed with the SEC pursuant to Regulation 14A within 120 days after December 31, 2017.
Item 13. Certain Relationships and Related Transactions, and Director Independence
The information required by this Item is incorporated by reference from our definitive proxy statement for the 2018 Annual Meeting of Stockholders to be filed with the SEC pursuant to Regulation 14A within 120 days after December 31, 2017.
Item 14. Principal Accountant Fees and Services
The information required by this Item is incorporated by reference from our definitive proxy statement for the 2018 Annual Meeting of Stockholders to be filed with the SEC pursuant to Regulation 14A within 120 days after December 31, 2017.
55
FRONTIER COMMUNICATIONS CORPORATION AND SUBSIDIARIES
PART IV
Item 15. Exhibits and Financial Statement Schedules
List of Documents Filed as a Part of This Report:
(1) Index to Consolidated Financial Statements:
Reports of Independent Registered Public Accounting Firm
Consolidated Balance Sheets as of December 31, 2017 and 2016
Consolidated Statements of Operations for the years ended December 31, 2017, 2016 and 2015
Consolidated Statements of Comprehensive Loss for the years ended December 31, 2017, 2016 and 2015
Consolidated Statements of Equity for the years ended December 31, 2017, 2016 and 2015
Consolidated Statements of Cash Flows for the years ended December 31, 2017, 2016 and 2015
Notes to Consolidated Financial Statements
All other schedules have been omitted because the required information is included in the consolidated financial statements or the notes thereto, or is not applicable or not required.
(2) Index to Exhibits:
|
Exhibit No. |
Description |
|
|
2.1 |
||
|
2.2 |
||
|
3.1 |
||
|
3.2 |
||
|
3.3 |
||
|
3.4 |
||
|
3.5 |
||
|
4.1 |
Indenture of Securities, dated as of August 15, 1991, between Frontier and JPMorgan Chase Bank, N.A. (as successor to Chemical Bank), as Trustee (the “August 1991 Indenture”) (filed as Exhibit 4.100.1 to Frontier’s Quarterly Report on Form 10-Q for the fiscal quarter ended September 30, 1991).* |
|
|
4.2 |
||
|
4.3 |
||
|
4.4 |
||
|
4.5 |
||
56
FRONTIER COMMUNICATIONS CORPORATION AND SUBSIDIARIES
|
4.6 |
||
|
4.7 |
||
|
4.8 |
||
|
4.9 |
||
|
4.10 |
||
|
4.11 |
||
|
4.12 |
||
|
4.13 |
Form of Senior Note due 2021 (filed as Exhibit 4.2 to the May 22, 2012 8-K).* |
|
|
4.14 |
||
|
4.15 |
Form of Senior Note due 2023 (filed as Exhibit 4.2 to the August 15, 2012 8-K).* |
|
|
4.16 |
||
|
4.17 |
||
|
4.18 |
||
|
4.19 |
||
|
4.20 |
Form of Senior Note due 2024 (filed as Exhibit 4.2 to the April 10, 2013 8-K).* |
|
|
4.21 |
||
|
4.22 |
||
|
4.23 |
||
|
4.24 |
||
57
FRONTIER COMMUNICATIONS CORPORATION AND SUBSIDIARIES
|
4.25 |
||
|
4.26 |
||
|
4.27 |
||
|
4.28 |
||
|
4.29 |
||
|
4.30 |
||
|
4.31 |
||
|
4.32 |
||
|
4.33 |
||
|
4.34 |
||
|
10.1 |
||
|
10.2 |
||
|
10.3 |
||
|
10.4 |
||
|
10.5 |
||
|
10.6 |
||
|
10.7 |
||
|
10.8 |
||
|
10.9 |
||
58
FRONTIER COMMUNICATIONS CORPORATION AND SUBSIDIARIES
|
10.10 |
||
|
10.11 |
||
|
10.12 |
||
|
10.13 |
||
|
10.14 |
||
|
10.15 |
||
|
10.16 |
||
|
10.17 |
||
|
10.18 |
2009 Equity Incentive Plan (filed as Appendix A to Frontier’s Proxy Statement dated April 6, 2009).* |
|
|
10.19 |
2013 Equity Incentive Plan (filed as Appendix B to the 2013 Proxy Statement).* |
|
|
10.20 |
2017 Equity Incentive Plan (filed as Annex A to Frontier’s Proxy Statement dated March 28, 2017).* |
|
|
10.21 |
||
|
10.22 |
||
|
10.23 |
||
|
10.24 |
||
|
10.25 |
||
|
10.26 |
||
|
10.27 |
||
|
10.28 |
||
|
10.29 |
||
|
10.30 |
||
|
10.31 |
Offer of Employment Letter, dated December 6, 2016, between Frontier and Kenneth Arndt. |
|
|
10.32 |
Offer of Employment Letter, dated October 3, 2012, between Frontier and Steven Gable. |
|
|
10.33 |
||
|
10.34 |
||
|
10.35 |
||
|
10.36 |
||
|
10.37 |
||
|
10.38 |
Form of Indemnification Agreement with Directors and Officers. |
|
|
10.39 |
||
|
10.40 |
||
59
FRONTIER COMMUNICATIONS CORPORATION AND SUBSIDIARIES
|
10.41 |
||
|
12 |
||
|
21 |
||
|
23 |
||
|
31.1 |
||
|
31.2 |
Certification of Principal Financial Officer pursuant to Rule 13a-14(a) under the 1934 Act. |
|
|
32 |
||
|
101.INS |
XBRL Instance Document. |
|
|
101.SCH |
XBRL Taxonomy Extension Schema Document. |
|
|
101.PRE |
XBRL Taxonomy Presentation Linkbase Document. |
|
|
101.CAL |
XBRL Taxonomy Calculation Linkbase Document. |
|
|
101.LAB |
XBRL Taxonomy Label Linkbase Document. |
|
|
101.DEF |
XBRL Taxonomy Extension Definition Linkbase Document. |
|
|
|
||
|
Exhibits 10.13 through 10.41 are management contracts or compensatory plans or arrangements. |
||
|
|
||
|
|
||
|
* Incorporated by reference. |
||
|
|
||
60
FRONTIER COMMUNICATIONS CORPORATION AND SUBSIDIARIES
Pursuant to the requirements of Section 13 or 15(d) of the Securities Exchange Act of 1934, the Registrant has duly caused this report to be signed on its behalf by the undersigned, thereunto duly authorized.
|
|
FRONTIER COMMUNICATIONS CORPORATION |
|
|
(Registrant) |
|
|
|
|
|
|
|
|
By: /s/ Daniel J. McCarthy |
|
|
Daniel J. McCarthy |
|
|
President and Chief Executive Officer |
|
|
|
|
February 28, 2018 |
|
61
FRONTIER COMMUNICATIONS CORPORATION AND SUBSIDIARIES
Pursuant to the requirements of the Securities Exchange Act of 1934, this report has been signed below by the following persons on behalf of the registrant and in the capacities indicated on the 28th day of February 2018.
|
Signature |
|
Title |
|
|
|
|
|
|
|
|
|
/s/ Leroy T. Barnes, Jr. |
|
Director |
|
(Leroy T. Barnes, Jr.) |
|
|
|
|
|
|
|
/s/ Peter C. B. Bynoe |
|
Director |
|
(Peter C. B. Bynoe) |
|
|
|
|
|
|
|
/s/ Donald Daniels |
|
Senior Vice President & Controller |
|
(Donald Daniels) |
|
(Principal Accounting Officer) |
|
|
|
|
|
/s/ Diana S. Ferguson |
|
Director |
|
(Diana S. Ferguson) |
|
|
|
|
|
|
|
/s/ Edward Fraioli |
|
Director |
|
(Edward Fraioli) |
|
|
|
|
|
|
|
/s/ R. Perley McBride |
|
Executive Vice President and Chief Financial Officer |
|
(R. Perley McBride) |
|
(Principal Financial Officer) |
|
|
|
|
|
/s/ Daniel J. McCarthy |
|
Director, President and Chief Executive Officer |
|
(Daniel J. McCarthy) |
|
(Principal Executive Officer) |
|
|
|
|
|
/s/ Pamela D.A. Reeve |
|
Director |
|
(Pamela D.A. Reeve) |
|
|
|
|
|
|
|
/s/ Virginia P. Ruesterholz |
|
Director |
|
(Virginia P. Ruesterholz) |
|
|
|
|
|
|
|
/s/ Howard L. Schrott |
|
Director |
|
(Howard L. Schrott) |
|
|
|
|
|
|
|
/s/ Mark Shapiro |
|
Director |
|
(Mark Shapiro) |
|
|
|
|
|
|
|
/s/ Myron A. Wick III |
|
Director |
|
(Myron A. Wick III) |
|
|
|
|
|
|
|
|
|
|
|
|
|
|
|
|
|
|
|
|
|
|
62
FRONTIER COMMUNICATIONS CORPORATION AND SUBSIDIARIES
Index to Consolidated Financial Statements
|
Item |
Page |
|
|
|
|
Management’s Report on Internal Control Over Financial Reporting |
F-2 |
|
|
|
|
Reports of Independent Registered Public Accounting Firm |
F-3 and F-4 |
|
|
|
|
Consolidated Balance Sheets as of December 31, 2017 and 2016 |
F-5 |
|
|
|
|
Consolidated Statements of Operations for the years ended |
|
|
December 31, 2017, 2016 and 2015 |
F-6 |
|
|
|
|
Consolidated Statements of Comprehensive Loss for the years ended |
|
|
December 31, 2017, 2016 and 2015 |
F-6 |
|
|
|
|
Consolidated Statements of Equity for the years ended |
|
|
December 31, 2017, 2016 and 2015 |
F-7 |
|
|
|
|
Consolidated Statements of Cash Flows for the years ended |
|
|
December 31, 2017, 2016 and 2015 |
F-8 |
|
|
|
|
Notes to Consolidated Financial Statements |
F-9 |
|
|
F-1
Management’s Report On Internal Control Over Financial Reporting
The Board of Directors and Shareholders
Frontier Communications Corporation:
The management of Frontier Communications Corporation and subsidiaries is responsible for establishing and maintaining adequate internal control over financial reporting, as such term is defined in Exchange Act Rules 13a-15(f) and 15d-15(f).
Under the supervision and with the participation of our management, we conducted an evaluation of the effectiveness of our internal control over financial reporting based on the framework in Internal Control-Integrated Framework (2013) issued by the Committee of Sponsoring Organizations of the Treadway Commission (COSO). Based on our evaluation, our management concluded that our internal control over financial reporting was effective as of December 31, 2017.
Our independent registered public accounting firm, KPMG LLP, has audited the consolidated financial statements included in this report and, as part of their audit, has issued their report, included herein, on the effectiveness of our internal control over financial reporting.
|
/s/ Daniel J. McCarthy |
|
/s/ R. Perley McBride |
|
Daniel J. McCarthy |
|
R. Perley McBride |
|
President and Chief Executive Officer |
|
Executive Vice President and Chief Financial Officer |
Norwalk, Connecticut
February 28, 2018
F-2
Report of Independent Registered Public Accounting Firm
To the Stockholders and Board of Directors
Frontier Communications Corporation:
Opinion on the Consolidated Financial Statements
We have audited the accompanying consolidated balance sheets of Frontier Communications Corporation and subsidiaries (the “Company”) as of December 31, 2017 and 2016, and the related consolidated statements of operations, comprehensive loss, equity, and cash flows for each of the years in the three‑year period ended December 31, 2017, and the related notes (collectively, the “consolidated financial statements”). In our opinion, the consolidated financial statements present fairly, in all material respects, the financial position of the Company as of December 31, 2017 and 2016, and the results of its operations and its cash flows for each of the years in the three‑year period ended December 31, 2017, in conformity with U.S. generally accepted accounting principles.
We also have audited, in accordance with the standards of the Public Company Accounting Oversight Board (United States) (“PCAOB”), the Company’s internal control over financial reporting as of December 31, 2017, based on criteria established in Internal Control – Integrated Framework (2013) issued by the Committee of Sponsoring Organizations of the Treadway Commission (COSO) and our report dated February 28, 2018 expressed an unqualified opinion on the effectiveness of the Company’s internal control over financial reporting.
Basis for Opinion
These consolidated financial statements are the responsibility of the management. Our responsibility is to express an opinion on these consolidated financial statements based on our audits. We are a public accounting firm registered with the PCAOB and are required to be independent with respect to the Company in accordance with the U.S. federal securities laws and the applicable rules and regulations of the Securities and Exchange Commission and the PCAOB.
We conducted our audits in accordance with the standards of the PCAOB. Those standards require that we plan and perform the audit to obtain reasonable assurance about whether the consolidated financial statements are free of material misstatement, whether due to error or fraud. Our audits included performing procedures to assess the risks of material misstatement of the consolidated financial statements, whether due to error or fraud, and performing procedures that respond to those risks. Such procedures included examining, on a test basis, evidence regarding the amounts and disclosures in the consolidated financial statements. Our audits also included evaluating the accounting principles used and significant estimates made by management, as well as evaluating the overall presentation of the consolidated financial statements. We believe that our audits provide a reasonable basis for our opinion.
Accompanying Supplemental Information
The supplemental information contained in the Schedule of Pledged Subsidiary Financial Data has been subjected to audit procedures performed in conjunction with the audit of the Company’s consolidated financial statements. The supplemental information is the responsibility of the Company’s management. Our audit procedures included determining whether the supplemental information reconciles to the consolidated financial statements or the underlying accounting and other records, as applicable, and performing procedures to test the completeness and accuracy of the information presented in the supplemental information. In forming our opinion on the supplemental information, we evaluated whether the supplemental information, including its form and content, is presented in conformity with U.S. generally accepted accounting principles. In our opinion, the supplemental information contained in the Schedule of Pledged Subsidiary Financial Data is fairly stated, in all material respects, in relation to the consolidated financial statements as a whole.
|
|
/s/ KPMG LLP |
|
We have served as the Company’s auditor since 1936.
|
|
|
Stamford, Connecticut |
|
|
February 28, 2018 |
|
F-3
Report of Independent Registered Public Accounting Firm
To the Stockholders and Board of Directors
Frontier Communications Corporation:
Opinion on Internal Control Over Financial Reporting
We have audited Frontier Communications Corporation and subsidiaries’ (the “Company”) internal control over financial reporting as of December 31, 2017, based on criteria established in Internal Control – Integrated Framework (2013) issued by the Committee of Sponsoring Organizations of the Treadway Commission. In our opinion, the Company maintained, in all material respects, effective internal control over financial reporting as of December 31, 2017, based on criteria established in Internal Control – Integrated Framework (2013) issued by the Committee of Sponsoring Organizations of the Treadway Commission.
We also have audited, in accordance with the standards of the Public Company Accounting Oversight Board (United States) (“PCAOB”), the consolidated balance sheets of the Company as of December 31, 2017 and 2016, the related consolidated statements of operations, comprehensive loss, equity, and cash flows for each of the years in the three-year period ended December 31, 2017, and the related notes (collectively, the “consolidated financial statements”), and our report dated February 28, 2018 expressed an unqualified opinion on those consolidated financial statements.
Basis for Opinion
The Company’s management is responsible for maintaining effective internal control over financial reporting and for its assessment of the effectiveness of internal control over financial reporting, included in the accompanying Management’s Report On Internal Control Over Financial Reporting. Our responsibility is to express an opinion on the Company’s internal control over financial reporting based on our audit. We are a public accounting firm registered with the PCAOB and are required to be independent with respect to the Company in accordance with the U.S. federal securities laws and the applicable rules and regulations of the Securities and Exchange Commission and the PCAOB.
We conducted our audit in accordance with the standards of the PCAOB. Those standards require that we plan and perform the audit to obtain reasonable assurance about whether effective internal control over financial reporting was maintained in all material respects. Our audit of internal control over financial reporting included obtaining an understanding of internal control over financial reporting, assessing the risk that a material weakness exists, and testing and evaluating the design and operating effectiveness of internal control based on the assessed risk. Our audit also included performing such other procedures as we considered necessary in the circumstances. We believe that our audit provides a reasonable basis for our opinion.
Definition and Limitations of Internal Control Over Financial Reporting
A company’s internal control over financial reporting is a process designed to provide reasonable assurance regarding the reliability of financial reporting and the preparation of financial statements for external purposes in accordance with generally accepted accounting principles. A company’s internal control over financial reporting includes those policies and procedures that (1) pertain to the maintenance of records that, in reasonable detail, accurately and fairly reflect the transactions and dispositions of the assets of the company; (2) provide reasonable assurance that transactions are recorded as necessary to permit preparation of financial statements in accordance with generally accepted accounting principles, and that receipts and expenditures of the company are being made only in accordance with authorizations of management and directors of the company; and (3) provide reasonable assurance regarding prevention or timely detection of unauthorized acquisition, use, or disposition of the company’s assets that could have a material effect on the financial statements.
Because of its inherent limitations, internal control over financial reporting may not prevent or detect misstatements. Also, projections of any evaluation of effectiveness to future periods are subject to the risk that controls may become inadequate because of changes in conditions, or that the degree of compliance with the policies or procedures may deteriorate.
|
|
/s/ KPMG LLP |
|
|
|
|
Stamford, Connecticut |
|
|
February 28, 2018 |
|
F-4
FRONTIER COMMUNICATIONS CORPORATION AND SUBSIDIARIES
CONSOLIDATED BALANCE SHEETS
AS OF DECEMBER 31, 2017 AND 2016
($ in millions and shares in thousands, except for per-share amounts)
|
|
||||||
|
|
2017 |
2016 |
||||
|
ASSETS |
||||||
|
Current assets: |
||||||
|
Cash and cash equivalents |
$ |
362 |
$ |
522 | ||
|
Accounts receivable, less allowances of $69 and $131, respectively |
819 | 938 | ||||
|
Prepaid expenses |
78 | 88 | ||||
|
Income taxes and other current assets |
64 | 108 | ||||
|
Total current assets |
1,323 | 1,656 | ||||
|
|
||||||
|
Property, plant and equipment, net |
14,377 | 14,902 | ||||
|
Goodwill, net |
7,024 | 9,674 | ||||
|
Other intangibles, net |
2,063 | 2,662 | ||||
|
Other assets |
97 | 119 | ||||
|
Total assets |
$ |
24,884 |
$ |
29,013 | ||
|
|
||||||
|
LIABILITIES AND EQUITY |
||||||
|
Current liabilities: |
||||||
|
Long-term debt due within one year |
$ |
656 |
$ |
363 | ||
|
Accounts payable |
564 | 698 | ||||
|
Advanced billings |
270 | 301 | ||||
|
Accrued content costs |
102 | 164 | ||||
|
Accrued other taxes |
156 | 134 | ||||
|
Accrued interest |
401 | 437 | ||||
|
Pension and other postretirement benefits |
29 | 23 | ||||
|
Other current liabilities |
330 | 324 | ||||
|
Total current liabilities |
2,508 | 2,444 | ||||
|
|
||||||
|
Deferred income taxes |
1,139 | 2,516 | ||||
|
Pension and other postretirement benefits |
1,676 | 1,602 | ||||
|
Other liabilities |
317 | 372 | ||||
|
Long-term debt |
16,970 | 17,560 | ||||
|
|
||||||
|
Equity: |
||||||
|
Preferred stock, $0.01 par value (50,000 authorized shares, |
||||||
|
11.125%, Series A, 19,250 shares issued and outstanding) |
- |
- |
||||
|
Common stock, $0.25 par value (175,000 authorized shares, |
||||||
|
79,532 issued, and 78,441 and 78,170 outstanding, |
||||||
|
at December 31, 2017 and 2016, respectively) |
20 | 20 | ||||
|
Additional paid-in capital |
5,034 | 5,561 | ||||
|
Accumulated deficit |
(2,263) | (460) | ||||
|
Accumulated other comprehensive loss, net of tax |
(366) | (387) | ||||
|
Treasury common stock |
(151) | (215) | ||||
|
Total equity |
2,274 | 4,519 | ||||
|
Total liabilities and equity |
$ |
24,884 |
$ |
29,013 | ||
The accompanying Notes are an integral part of these Consolidated Financial Statements.
F-5
FRONTIER COMMUNICATIONS CORPORATION AND SUBSIDIARIES
CONSOLIDATED STATEMENTS OF OPERATIONS
FOR THE YEARS ENDED DECEMBER 31, 2017, 2016 AND 2015
($ in millions and shares in thousands, except for per-share amounts)
|
|
||||||||||
|
|
2017 |
2016 |
2015 |
|||||||
|
|
||||||||||
|
Revenue |
$ |
9,128 |
$ |
8,896 |
$ |
5,576 | ||||
|
|
||||||||||
|
Operating expenses: |
||||||||||
|
Network access expenses |
1,597 | 1,470 | 640 | |||||||
|
Network related expenses |
1,959 | 1,887 | 1,287 | |||||||
|
Selling, general and administrative expenses |
2,018 | 2,093 | 1,346 | |||||||
|
Depreciation and amortization |
2,184 | 2,031 | 1,320 | |||||||
|
Goodwill impairment |
2,748 |
- |
- |
|||||||
|
Acquisition and integration costs |
25 | 436 | 236 | |||||||
|
Pension settlement costs |
83 |
- |
- |
|||||||
|
Restructuring costs and other charges |
82 | 91 | 2 | |||||||
|
Total operating expenses |
10,696 | 8,008 | 4,831 | |||||||
|
|
||||||||||
|
Operating income (loss) |
(1,568) | 888 | 745 | |||||||
|
|
||||||||||
|
Investment and other income, net |
3 | 27 | 7 | |||||||
|
Losses on early extinguishment of debt and debt exchanges |
88 | 7 |
- |
|||||||
|
Interest expense |
1,534 | 1,531 | 1,113 | |||||||
|
|
||||||||||
|
Loss before income taxes |
(3,187) | (623) | (361) | |||||||
|
Income tax benefit |
(1,383) | (250) | (165) | |||||||
|
|
||||||||||
|
Net loss |
(1,804) | (373) | (196) | |||||||
|
Less: Dividends on preferred stock |
214 | 214 | 120 | |||||||
|
|
||||||||||
|
Net loss attributable to |
||||||||||
|
Frontier common shareholders |
$ |
(2,018) |
$ |
(587) |
$ |
(316) | ||||
|
|
||||||||||
|
Basic net loss per share |
||||||||||
|
attributable to Frontier common shareholders |
$ |
(25.99) |
$ |
(7.61) |
$ |
(4.41) | ||||
|
|
||||||||||
|
Diluted net loss per share |
||||||||||
|
attributable to Frontier common shareholders |
$ |
(25.99) |
$ |
(7.61) |
$ |
(4.41) | ||||
|
|
||||||||||
|
Total weighted average shares outstanding - basic |
77,736 | 77,607 | 72,308 | |||||||
|
|
||||||||||
|
Total weighted average shares outstanding - diluted |
77,736 | 77,607 | 72,308 | |||||||
|
|
||||||||||
CONSOLIDATED STATEMENTS OF COMPREHENSIVE LOSS
FOR THE YEARS ENDED DECEMBER 31, 2017, 2016 AND 2015
($ in millions)
|
|
|||||||||
|
|
2017 |
2016 |
2015 |
||||||
|
|
|||||||||
|
Net loss |
$ |
(1,804) |
$ |
(373) |
$ |
(196) | |||
|
Other comprehensive income (loss), net of tax |
21 | (34) | 51 | ||||||
|
|
|||||||||
|
Comprehensive loss |
$ |
(1,783) |
$ |
(407) |
$ |
(145) | |||
The accompanying Notes are an integral part of these Consolidated Financial Statements.
F-6
FRONTIER COMMUNICATIONS CORPORATION AND SUBSIDIARIES
CONSOLIDATED STATEMENTS OF EQUITY
FOR THE YEARS ENDED DECEMBER 31, 2017, 2016 AND 2015
($ in millions and shares in thousands)
|
|
||||||||||||||||||||||||||
|
|
Retained |
Accumulated |
||||||||||||||||||||||||
|
|
Additional |
Earnings |
Other |
Treasury |
||||||||||||||||||||||
|
|
Preferred Stock |
Common Stock |
Paid-In |
(Accumulated |
Comprehensive |
Common Stock |
Total |
|||||||||||||||||||
|
|
Shares |
Amount |
Shares |
Amount |
Capital |
Deficit) |
Loss |
Shares |
Amount |
Equity |
||||||||||||||||
|
Balance December 31, 2014 |
- |
$ |
- |
68,532 |
$ |
17 |
$ |
4,230 |
$ |
109 |
$ |
(404) | (1,701) |
$ |
(294) |
$ |
3,658 | |||||||||
|
Issuance of common stock |
- |
- |
11,000 | 3 | 796 |
- |
- |
- |
- |
799 | ||||||||||||||||
|
Issuance of preferred stock |
19,250 |
- |
- |
- |
1,866 |
- |
- |
- |
- |
1,866 | ||||||||||||||||
|
Stock plans |
- |
- |
- |
- |
(4) |
- |
- |
49 | 16 | 12 | ||||||||||||||||
|
Dividends on common stock |
- |
- |
- |
- |
(456) |
- |
- |
- |
- |
(456) | ||||||||||||||||
|
Dividends on preferred stock |
- |
- |
- |
- |
(120) |
- |
- |
- |
- |
(120) | ||||||||||||||||
|
Net loss |
- |
- |
- |
- |
- |
(196) |
- |
- |
- |
(196) | ||||||||||||||||
|
Other comprehensive income, |
||||||||||||||||||||||||||
|
net of tax |
- |
- |
- |
- |
- |
- |
51 |
- |
- |
51 | ||||||||||||||||
|
Balance December 31, 2015 |
19,250 |
- |
79,532 | 20 | 6,312 | (87) | (353) | (1,652) | (278) | 5,614 | ||||||||||||||||
|
Stock plans |
- |
- |
- |
- |
(44) |
- |
- |
290 | 63 | 19 | ||||||||||||||||
|
Dividends on common stock |
- |
- |
- |
- |
(493) |
- |
- |
- |
- |
(493) | ||||||||||||||||
|
Dividends on preferred stock |
- |
- |
- |
- |
(214) |
- |
- |
- |
- |
(214) | ||||||||||||||||
|
Net loss |
- |
- |
- |
- |
- |
(373) |
- |
- |
- |
(373) | ||||||||||||||||
|
Other comprehensive loss, net |
||||||||||||||||||||||||||
|
of tax |
- |
- |
- |
- |
- |
- |
(34) |
- |
- |
(34) | ||||||||||||||||
|
Balance December 31, 2016 |
19,250 |
- |
79,532 | 20 | 5,561 | (460) | (387) | (1,362) | (215) | 4,519 | ||||||||||||||||
|
Cumulative-effect adjustment |
||||||||||||||||||||||||||
|
from adoption of ASU 2016-09 |
- |
- |
- |
- |
- |
1 |
- |
- |
- |
1 | ||||||||||||||||
|
Stock plans |
- |
- |
- |
- |
(47) |
- |
- |
271 | 64 | 17 | ||||||||||||||||
|
Dividends on common stock |
- |
- |
- |
- |
(266) |
- |
- |
- |
- |
(266) | ||||||||||||||||
|
Dividends on preferred stock |
- |
- |
- |
- |
(214) |
- |
- |
- |
- |
(214) | ||||||||||||||||
|
Net loss |
- |
- |
- |
- |
- |
(1,804) |
- |
- |
- |
(1,804) | ||||||||||||||||
|
Other comprehensive income, |
||||||||||||||||||||||||||
|
net of tax |
- |
- |
- |
- |
- |
- |
21 |
- |
- |
21 | ||||||||||||||||
|
Balance December 31, 2017 |
19,250 |
$ |
- |
79,532 |
$ |
20 |
$ |
5,034 |
$ |
(2,263) |
$ |
(366) | (1,091) |
$ |
(151) |
$ |
2,274 | |||||||||
|
|
||||||||||||||||||||||||||
The accompanying Notes are an integral part of these Consolidated Financial Statements.
F-7
FRONTIER COMMUNICATIONS CORPORATION AND SUBSIDIARIES
CONSOLIDATED STATEMENTS OF CASH FLOWS
FOR THE YEARS ENDED DECEMBER 31, 2017, 2016 AND 2015
($ in millions)
|
|
2017 |
2016 |
2015 |
||||||
|
|
|||||||||
|
Cash flows provided from provided from (used by) operating activities: |
|||||||||
|
Net loss |
$ |
(1,804) |
$ |
(373) |
$ |
(196) | |||
|
Adjustments to reconcile net loss to net cash provided from |
|||||||||
|
operating activities: |
|||||||||
|
Depreciation and amortization |
2,184 | 2,031 | 1,320 | ||||||
|
Loss on early extinguishment of debt and debt exchanges |
88 | 7 |
- |
||||||
|
Pension settlement costs |
83 |
- |
- |
||||||
|
Pension/OPEB costs |
17 | 79 | 10 | ||||||
|
Special termination benefits |
5 | 26 |
- |
||||||
|
Stock based compensation expense |
14 | 24 | 27 | ||||||
|
Amortization of deferred financing costs |
33 | 46 | 191 | ||||||
|
Other adjustments |
(14) | (12) |
- |
||||||
|
Deferred income taxes |
(1,385) | (206) | (167) | ||||||
|
Goodwill Impairment |
2,748 |
- |
- |
||||||
|
Change in accounts receivable |
122 | (19) | 62 | ||||||
|
Change in accounts payable and other liabilities |
(315) | (12) | 116 | ||||||
|
Change in prepaid expenses, income taxes and other current assets |
74 | 85 | (48) | ||||||
|
Net cash provided from operating activities |
1,850 | 1,676 | 1,315 | ||||||
|
|
|||||||||
|
Cash flows provided from (used by) investing activities: |
|||||||||
|
Cash paid for CTF Acquisition |
- |
(9,871) |
- |
||||||
|
Capital expenditures - Business operations |
(1,154) | (1,259) | (710) | ||||||
|
Capital expenditures - Integration activities |
(34) | (142) | (153) | ||||||
|
Network expansion funded by Connect America Fund - Phase 1 |
- |
- |
(22) | ||||||
|
Proceeds on sale of assets |
110 | 8 | 22 | ||||||
|
Cash paid for an acquisition, net of cash acquired |
- |
- |
(17) | ||||||
|
Other |
24 | 5 | 2 | ||||||
|
Net cash used by investing activities |
(1,054) | (11,259) | (878) | ||||||
|
|
|||||||||
|
Cash flows provided from (used by) financing activities: |
|||||||||
|
Long-term debt payments |
(1,811) | (453) | (298) | ||||||
|
Proceeds from long-term debt borrowings |
1,500 | 1,940 | 6,603 | ||||||
|
Financing costs paid |
(15) | (39) | (119) | ||||||
|
Proceeds from issuance of common stock, net |
- |
- |
799 | ||||||
|
Proceeds from issuance of preferred stock, net |
- |
- |
1,866 | ||||||
|
Dividends paid on common stock |
(266) | (493) | (456) | ||||||
|
Dividends paid on preferred stock |
(214) | (214) | (120) | ||||||
|
Premium paid to retire debt |
(86) |
- |
- |
||||||
|
Capital lease obligation payments |
(42) | (8) |
- |
||||||
|
Other |
(8) | (8) | (14) | ||||||
|
Net cash provided from (used by) financing activities |
(942) | 725 | 8,261 | ||||||
|
Increase/(Decrease) in cash, cash equivalents and restricted cash |
(146) | (8,858) | 8,698 | ||||||
|
Cash, cash equivalents and restricted cash at January 1, |
522 | 9,380 | 682 | ||||||
|
Cash, cash equivalents and restricted cash at December 31, |
$ |
376 |
$ |
522 |
$ |
9,380 | |||
|
|
|||||||||
|
Supplemental cash flow information: |
|||||||||
|
Cash paid (received) during the period for: |
|||||||||
|
Interest |
$ |
1,548 |
$ |
1,467 |
$ |
728 | |||
|
Income taxes (refunds), net |
$ |
(51) |
$ |
(120) |
$ |
28 | |||
|
|
|||||||||
|
Non-cash investing and financing activities: |
|||||||||
|
Financing obligation for contributions of real property to pension plan |
$ |
- |
$ |
15 |
$ |
- |
|||
|
Reduction of pension obligation |
$ |
- |
$ |
15 |
$ |
- |
|||
|
Increase (decrease) in capital expenditures due to changes |
|||||||||
|
in accounts payable |
$ |
50 |
$ |
(60) |
$ |
(56) | |||
|
Capital lease obligations |
$ |
17 |
$ |
111 |
$ |
- |
|||
|
|
|||||||||
The accompanying Notes are an integral part of these Consolidated Financial Statements.
F-8
FRONTIER COMMUNICATIONS CORPORATION AND SUBSIDIARIES
Notes to Consolidated Financial Statements
(1) Description of Business and Summary of Significant Accounting Policies:
(a) Description of Business:
Frontier Communications Corporation (Frontier) is the fourth largest Incumbent Local Exchange Carrier (ILEC) in the United States, with approximately 4.9 million customers, 3.9 million broadband subscribers and 22,700 employees, operating in 29 states. Frontier was incorporated in 1935, originally under the name of Citizens Utilities Company and was known as Citizens Communications Company until July 31, 2008. Frontier and its subsidiaries are referred to as “we,” “us,” “our,” “Frontier,” or the “Company” in this report.
Effective April 1, 2016, Frontier’s scope of operations and balance sheet changed materially as a result of the completion of the CTF Acquisition, as described in Note 3 - Acquisitions. Historical financial data presented for Frontier is not indicative of the future financial position or operating results for Frontier, and includes the results of the CTF Operations, as defined in Note 3 – Acquisitions, from the date of acquisition on April 1, 2016.
(b) Basis of Presentation and Use of Estimates:
Our consolidated financial statements have been prepared in accordance with accounting principles generally accepted in the United States of America (GAAP). Certain reclassifications of amounts previously reported have been made to conform to the current presentation. All significant intercompany balances and transactions have been eliminated in consolidation.
For our financial statements as of and for the period ended December 31, 2017, we evaluated subsequent events and transactions for potential recognition or disclosure through the date that we filed this Form 10-K with the Securities and Exchange Commission (SEC).
The preparation of our financial statements in conformity with GAAP requires management to make estimates and assumptions that affect (i) the reported amounts of assets and liabilities at the date of the financial statements, (ii) the disclosure of contingent assets and liabilities, and (iii) the reported amounts of revenue and expenses during the reporting period. Actual results may differ from those estimates. Estimates and judgments are used when accounting for the allowance for doubtful accounts, asset impairments, indefinite-lived intangibles, depreciation and amortization, income taxes, business combinations, and pension and other postretirement benefits, among others.
On July 10, 2017, we effected a one for fifteen reverse stock split of our common stock. The reverse stock split reduced the number of common shares issued (which includes outstanding shares and treasury shares) from approximately 1,193,000,000 shares to 80,000,000 shares, and reduced shares outstanding from 1,178,000,000 shares to 79,000,000 shares. In addition, and at the same time, the total number of shares of common stock that Frontier is authorized to issue changed from 1,750,000,000 shares to 175,000,000 shares. There was no change in the par value of the common stock, and no fractional shares were issued. All share and per share amounts in the financial statements and footnotes have been retroactively adjusted for all periods presented to give effect to the reverse stock split. As a result of our reverse stock split the conversion rates of our Series A Preferred Stock were proportionately adjusted.
(c) Cash Equivalents:
We consider all highly liquid investments with an original maturity of three months or less to be cash equivalents. Restricted cash of $14 million is included within “Income taxes and other current assets” on our consolidated balance sheet as of December 31, 2017. This amount represents funds held as collateral by certain insurance carriers, of which $7 million was released in January 2018, and the remainder expected to be released in the first quarter of 2018.
(d) Revenue Recognition:
Revenue is recognized when services are provided or when products are delivered to customers. Revenue that is billed in advance includes monthly recurring network access services (including data services), special access services and monthly recurring voice, video and related charges. The unearned portion of these fees is initially deferred as a component of “Advanced billings” on our consolidated balance sheet and recognized as revenue over the period that the services are provided. Revenue that is billed in arrears includes non-recurring network access services (including data services), switched access services and non-recurring voice
F-9
FRONTIER COMMUNICATIONS CORPORATION AND SUBSIDIARIES
Notes to Consolidated Financial Statements
and video services. The earned but unbilled portion of these fees is recognized as revenue in our consolidated statements of operations and accrued in “Accounts Receivable” on our consolidated balance sheet in the period that the services are provided. Excise taxes are recognized as a liability when billed. Installation fees and their related direct and incremental costs are initially deferred and recognized as revenue and expense over the average term of a customer relationship. We recognize as current period expense the portion of installation costs that exceeds installation fee revenue.
Frontier collects various taxes from its customers and subsequently remits these taxes to governmental authorities. Substantially all of these taxes are recorded through the consolidated balance sheet and presented on a net basis in our consolidated statements of operations. We also collect Universal Service Fund (USF) surcharges from customers (primarily federal USF) that we have recorded on a gross basis in our consolidated statements of operations and included within “Revenue” and “Network related expenses” of $216 million, $217 million and $151 million for the years ended December 31, 2017, 2016 and 2015, respectively.
In 2015 we accepted the FCC’s Connect America Fund (CAF) Phase II offer of support, which is a successor to and augments the USF frozen high cost support that we had been receiving pursuant to a 2011 FCC order. Upon completion of the CTF Acquisition, Frontier assumed the CAF Phase II support and related obligations that Verizon had previously accepted with regard to California and Texas. CAF Phase II funding is a program intended to subsidize the high cost of establishing and delivering communications services to certain unserved or underserved areas. We are recognizing these subsidies into revenue on a straight line basis, which is consistent with how the costs related to these subsidies are being and are expected to be incurred. CAF Phase II is a multi-year program which requires us to deploy broadband to a specified number of households in each of the states where funding was accepted. Failure to meet our deployment obligations at the end of the program in 2020 will result in a return of a portion of the funding received. We regularly evaluate our ability to meet our broadband deployment obligations and adjust revenue accordingly.
We categorize our products, services and other revenues among the following five categories:
|
|
· |
|
Data and Internet services include broadband services for consumer and commercial customers. We provide data transmission services to high volume commercial customers and other carriers with dedicated high capacity circuits (“nonswitched access”) including services to wireless providers (“wireless backhaul”); |
|
|
· |
|
Voice services include traditional local and long-distance wireline services, Voice over Internet Protocol (VoIP) services, as well as a number of unified messaging services offered to our consumer and commercial customers. Voice services also include the long-distance voice origination and termination services that we provide to our commercial customers and other carriers; |
|
|
· |
|
Video services include revenues generated from services provided directly to consumer customers through the FiOS® and Vantage video brands, and through DISH® satellite TV services; |
|
|
· |
|
Other customer revenue includes sales of customer premise equipment to our commercial customers and directory services, less our provision for bad debts; and |
|
|
· |
|
Switched Access and Subsidy revenues include revenues derived from allowing other carriers to use our network to originate and/or terminate their local and long-distance voice traffic (“switched access”). These services are primarily billed on a minutes-of-use basis applying tariffed rates filed with the FCC or state agencies. We also receive cost subsidies from state and federal authorities, including the Connect America Fund Phase II. |
F-10
FRONTIER COMMUNICATIONS CORPORATION AND SUBSIDIARIES
Notes to Consolidated Financial Statements
The following table provides a summary of revenues from external customers by the categories of Frontier’s products and services:
|
|
||||||||||
|
|
For the year ended December 31, |
|||||||||
|
($ in millions) |
2017 |
2016 |
2015 |
|||||||
|
|
||||||||||
|
Data and Internet services |
$ |
3,862 |
$ |
3,693 |
$ |
2,337 | ||||
|
Voice services |
2,864 | 2,886 | 2,022 | |||||||
|
Video services |
1,304 | 1,244 | 285 | |||||||
|
Other |
322 | 276 | 255 | |||||||
|
Customer revenue |
8,352 | 8,099 | 4,899 | |||||||
|
Switched access and subsidy |
776 | 797 | 677 | |||||||
|
Total revenue |
$ |
9,128 |
$ |
8,896 |
$ |
5,576 | ||||
|
|
||||||||||
(e) Property, Plant and Equipment:
Property, plant and equipment are stated at original cost, including capitalized interest, or fair market value as of the date of acquisition for acquired properties. Maintenance and repairs are charged to operating expenses as incurred. The gross book value of routine property, plant and equipment retirements is charged against accumulated depreciation.
(f) Goodwill and Other Intangibles:
Goodwill represents the excess of purchase price over the fair value of identifiable tangible and intangible net assets acquired. We undertake studies to determine the fair values of assets and liabilities acquired and allocate purchase prices to assets and liabilities, including property, plant and equipment, goodwill and other identifiable intangibles. We examine the carrying value of our goodwill and trade name annually as of December 31, or more frequently, as circumstances warrant, to determine whether there are any impairment losses. We test for goodwill impairment at the “operating segment” level, as that term is defined in GAAP.
We determined that we have one operating segment based on a number of factors that our management uses to evaluate and run our business operations, including similarities of customers, products and technology. We tested goodwill for impairment as of December 31, 2017 as a result of the continued decline in share price of our common stock since September 30, 2017, the date of our last goodwill impairment test. Refer to Note 6 for a discussion of our goodwill impairment testing and results as of December 31, 2017. As stated in Note 2, we early adopted ASU No. 2017-04, “Simplifying the Test for Goodwill Impairment” during 2017 in conjunction with our goodwill impairment assessment.
Frontier amortizes finite-lived intangible assets over their estimated useful lives on the accelerated method of sum of the years digits. We review such intangible assets at least annually as of December 31 to assess whether any potential impairment exists and whether factors exist that would necessitate a change in useful life and a different amortization period.
(g) Impairment of Long-Lived Assets and Long-Lived Assets to Be Disposed Of:
We review long-lived assets to be held and used, including customer lists, and long-lived assets to be disposed of for impairment whenever events or changes in circumstances indicate that the carrying amount of such assets may not be recoverable. Recoverability of assets to be held and used is measured by comparing the carrying amount of the asset to the future undiscounted net cash flows expected to be generated by the asset. Recoverability of assets held for sale is measured by comparing the carrying amount of the assets to their estimated fair market value. If any assets are considered to be impaired, the impairment is measured by the amount by which the carrying amount of the assets exceeds the estimated fair value. Also, we periodically reassess the useful lives of our tangible and intangible assets to determine whether any changes are required.
F-11
FRONTIER COMMUNICATIONS CORPORATION AND SUBSIDIARIES
Notes to Consolidated Financial Statements
(h) Income Taxes and Deferred Income Taxes:
We file a consolidated federal income tax return. We utilize the asset and liability method of accounting for income taxes. Under the asset and liability method, deferred income taxes are recorded for the tax effect of temporary differences between the financial statement basis and the tax basis of assets and liabilities using tax rates expected to be in effect when the temporary differences are expected to reverse.
(i) Stock Plans:
We have various stock-based compensation plans. Awards under these plans are granted to eligible employees and directors. Awards may be made in the form of incentive stock options, non-qualified stock options, stock appreciation rights, restricted stock, restricted stock units or other stock-based awards, including awards with performance, market and time-vesting conditions. Our general policy is to issue shares from treasury upon the grant of restricted shares, earning of performance shares and the exercise of options.
The compensation cost recognized is based on awards ultimately expected to vest. GAAP requires forfeitures to be estimated and revised, if necessary, in subsequent periods if actual forfeitures differ from those estimates.
(j) Net Loss Per Share Attributable to Frontier Common Shareholders:
Basic net loss per common share is computed using the weighted average number of common shares outstanding during the period being reported on, excluding unvested restricted stock awards. The impact of dividends paid on unvested restricted stock awards have been deducted in the determination of basic and diluted net income (loss) per share attributable to Frontier common shareholders. Except when the effect would be antidilutive, diluted net income per common share reflects the dilutive effect of certain common stock equivalents, as described further in Note 13 – Net Loss Per Common Share.
(2) Recent Accounting Pronouncements:
Recent Accounting Pronouncements Not Yet Adopted
Revenue Recognition
In May 2014, the Financial Accounting Standards Board (FASB) issued Accounting Standards Update (ASU) No. 2014-09, “Revenue from Contracts with Customers.” This standard, along with its related amendments, requires companies to recognize revenue to depict the transfer of promised goods or services to customers in an amount that reflects the consideration to which they expect to be entitled in exchange for those goods or services. This new standard will be adopted by Frontier for annual and interim reporting periods beginning with the first quarter of 2018.
The FASB allows two adoption methods under ASC 606. Companies are permitted to either apply the requirements retrospectively to all prior periods presented, or apply the requirements in the year of adoption, through a cumulative adjustment. We currently plan to adopt the standard in the first quarter of 2018, using the “modified retrospective method.” Under that method, we will apply the rules to all contracts existing as of January 1, 2018, recognizing, in beginning retained earnings, a cumulative-effect adjustment to include the establishment of contract asset and contract liability accounts with a corresponding adjustment to retained earnings. We will also provide additional disclosures comparing revenue recognized under ASC 606 to revenue as reported prior to the adoption of the standard.
The key changes in the standard that impact our revenue recognition relate to the allocation of contract revenues among various services and equipment, and the timing of when those revenues are recognized. Additionally, the new standard will impact the timing of recognizing costs to obtain contracts. This includes a change in our existing policy related to the way we account for the allocation of discounts, customer incentives, upfront non-recurring charges, customer disputes and commission payments.
We are implementing changes to our systems, processes, policies and internal controls to meet the standard’s reporting and disclosure requirements. We believe the changes will impact service revenue categorization as
F-12
FRONTIER COMMUNICATIONS CORPORATION AND SUBSIDIARIES
Notes to Consolidated Financial Statements
well as Selling, general and administrative expenses, however, we do not anticipate its impact will be material to operating income.
Leases
In February 2016, the FASB issued ASU No. 2016 – 02, “Leases (Topic 842).” This standard, along with its related amendments, establishes the principles to report transparent and economically neutral information about the assets and liabilities that arise from leases. Upon implementation, lessees will need to recognize almost all leases on their balance sheet as a right-of-use asset and a lease liability. It will be critical to identify leases embedded in a contract to avoid misstating the lessee’s balance sheet. The income statement impacts of the leases will depend on the nature of the leasing arrangement and will be similar to existing accounting for operating and capital leases. Classification will be based on criteria that are largely similar to those applied in current lease accounting, but without explicit bright lines. Lessor accounting is similar to the current model, but updated to align with certain changes to the lessee model and the new revenue recognition standard. Existing sale-leaseback guidance, including guidance for real estate, is replaced with a new model applicable to both lessees and lessors. The new guidance is effective for fiscal years beginning after December 15, 2018, including interim periods within those fiscal years using modified retrospective application. Early application is permitted. Frontier is in the initial stages of evaluating the potential impact this new standard may have on the consolidated financial statements.
Compensation – Retirement Benefits
In March 2017, the FASB issued ASU No. 2017-07, “Improving the Presentation of Net Periodic Pension Cost and Net Periodic Postretirement Benefit Cost”. This standard was established to improve the presentation of net periodic pension cost and net periodic postretirement benefit cost by requiring that an employer disaggregate the service cost component of periodic benefit cost from the other components of net benefit cost. The amendments in the update also provide explicit guidance on how to present the service cost component and other components of net benefit cost in the income statement and allow only the service cost components of net benefit cost to be eligible for capitalization. The new guidance is effective for annual periods beginning after December 15, 2017, including interim periods within those annual periods and requires the presentation of the income statement to be applied retrospectively. As a result of the standard, pension settlement costs and certain benefit costs which are currently included in operating expense, would be reported as other non-operating expense and will no longer be capitalized. This will have a material impact on previously reported operating income and may have a material impact to operating income in future periods, however, the impact to pre-tax income is not expected to be material.
Reclassification of Certain Tax Effects from Accumulated Other Comprehensive Income
In February 2018, FASB issued ASU 2018-02, which allows for the reclassification of certain income tax effects related to the Tax Cuts and Jobs Act (the “Tax Act”) between “Accumulated other comprehensive income” and “Retained earnings.” This ASU relates to the requirement that adjustments to deferred tax liabilities and assets related to a change in tax laws or rates to be included in “Income from continuing operations”, even in situations where the related items were originally recognized in “Other comprehensive income” (rather than in “Income from continuing operations”). The amendments in this ASU are effective for all entities for fiscal years beginning after December 15, 2018, and interim periods within those fiscal years, with early adoption permitted. Adoption of this ASU is to be applied either in the period of adoption or retrospectively to each period in which the effect of the change in the tax laws or rates were recognized. We are still evaluating certain aspects of this ASU as well as the related impacts it may have on our financial statements.
F-13
FRONTIER COMMUNICATIONS CORPORATION AND SUBSIDIARIES
Notes to Consolidated Financial Statements
Recently Adopted Accounting Pronouncements
Share-Based Payments - Scope of Modification Accounting
In May 2017, the FASB issued ASU No. 2017-09, Scope of Modification Accounting which amends the scope of modification accounting for share-based payment arrangements. This standard provides guidance on the types of changes to the terms or conditions of share-based payment awards to which an entity would be required to apply modification accounting under ASC 718. Specifically, an entity would not apply modification accounting if the fair value, vesting conditions, and classification of the awards are the same immediately before and after the modification. The new guidance is effective for annual periods beginning after December 15, 2017, including interim periods within those annual periods and early adoption is permitted including in any interim period. Frontier has adopted this standard during the second quarter 2017, with no impact to our share-based payment awards.
Intangibles – Goodwill
In January 2017, the FASB issued ASU No. 2017-04, “Simplifying the Test for Goodwill Impairment.” This standard was established to simplify how an entity is required to test goodwill for impairment by eliminating Step 2 from the goodwill impairment test. Step 2 measures a goodwill impairment loss by comparing the implied fair value of a reporting unit’s goodwill with the carrying amount of that goodwill. Under the amendments in this Update, an entity should perform its annual, or interim, goodwill impairment test by comparing the fair value of a reporting unit with its carrying amount. An entity should recognize an impairment charge for the amount by which the carrying amount exceeds the reporting unit’s fair value; however, the loss recognized should not exceed the total amount of goodwill allocated to that reporting unit. Additionally, an entity should consider income tax effects from any tax deductible goodwill on the carrying amount of the reporting unit when measuring the goodwill impairment loss, if applicable. The FASB also eliminated the requirements for any reporting unit with a zero or negative carrying amount to perform a qualitative assessment and, if it fails that qualitative test, to perform Step 2 of the goodwill impairment test. Therefore, the same impairment assessment applies to all reporting units. An entity is required to disclose the amount of goodwill allocated to each reporting unit with a zero or negative carrying amount of net assets. An entity still has the option to perform the qualitative assessment for a reporting unit to determine if the quantitative impairment test is necessary. Frontier early adopted this standard during in 2017 in conjunction with our goodwill impairment assessment. See Note 1 and Note 6 for further discussion.
Compensation – Stock Compensation
In March 2016, the FASB issued ASU No. 2016-09, “Improvements to Employee Share-Based Payment Accounting,” to amend ASC Topic 718, “Compensation – Stock Compensation.” The ASU is part of the FASB’s ongoing simplification initiative, which is designed to reduce cost and complexity while maintaining or improving the usefulness of the information provided to the users of financial statements. The simplifications address a variety of areas for public entities, including the following: 1) accounting for income taxes, 2) classification of excess tax benefits on the statement of cash flows, 3) forfeitures, 4) minimum statutory tax withholding requirements, 5) classifications of employee taxes paid on the statement of cash flows when an employer withholds shares for tax withholding purposes, and 6) classification of awards with repurchase features. This guidance was effective for Frontier as of the third quarter of 2017. During the year ended December 31, 2017 Frontier recognized $1 million of income tax expense and recorded a cumulative effect adjustment to beginning accumulated deficit of $1 million to recognize all unrecognized deferred tax benefits recorded as of January 1, 2017. For the years ended December 31, 2016 and 2015, Frontier reclassified $10 million and $14 million, respectively, of taxes paid on behalf of employees related to shares withheld from “Cash flows provided from (used by) operations” to “Cash flows used by financing activities” in accordance with the new standard.
(3) Acquisitions:
The CTF Acquisition
On April 1, 2016, Frontier acquired the wireline operations of Verizon Communications, Inc. in California, Texas and Florida for a purchase price of $10,540 million in cash and assumed debt (the CTF Acquisition), pursuant to the February 5, 2015 Securities Purchase Agreement, as amended. In addition, Frontier and Verizon settled the working capital and net debt adjustments with $15 million paid to Frontier in October 2016. As a result of the CTF Acquisition, Frontier now operates these former Verizon properties, which included approximately 2.5
F-14
FRONTIER COMMUNICATIONS CORPORATION AND SUBSIDIARIES
Notes to Consolidated Financial Statements
million total customers, 2.1 million broadband subscribers, and 1.2 million FiOS video subscribers as of April 1, 2016 (the CTF Operations).
Our consolidated statement of operations for the year ended December 31, 2016 includes $3,622 million of revenue and $582 million of operating income related to the nine months of operating results of the CTF Operations since April 1, 2016.
The allocation of the purchase price presented below, which was finalized as of March 31, 2017, represents the effect of recording the estimates of the fair value of assets acquired and liabilities assumed as of the date of the CTF Acquisition, based on the total transaction cash consideration of $9,871 million at December 31, 2017.
|
|
||||
|
($ in millions) |
||||
|
Current assets |
$ |
353 | ||
|
Property, plant & equipment |
6,096 | |||
|
Goodwill |
2,606 | |||
|
Other intangibles - primarily customer base |
2,262 | |||
|
Current liabilities |
(579) | |||
|
Long-term debt |
(544) | |||
|
Other liabilities |
(323) | |||
|
Total net assets acquired |
$ |
9,871 | ||
|
|
||||
The fair value estimates related to the allocation of the purchase price to Other intangibles were revised and updated during the first quarter of 2017 from the previous estimates as of December 31, 2016. The allocation that was reported as of December 31, 2016 for Other intangibles increased $100 million, from $2,162 million to $2,262 million. These measurement period adjustments resulted in $20 million of amortization expense during the first quarter of 2017 that would have been recorded in 2016 if the adjustments had been recognized as of the acquisition date. Other adjustments to the allocation of the purchase price for the CTF Acquisition during the first quarter of 2017 resulted in a $140 million decrease in Property, plant & equipment, a $61 million increase in Current liabilities, and a $98 million increase in Goodwill.
The total consideration exceeded the net estimated fair value of the assets acquired and liabilities assumed by $2,606 million, which we recognized as goodwill. This goodwill is attributable to strategic benefits, including enhanced financial and operational scale, market diversification and leveraged combined networks that we expect to realize. This amount of goodwill associated with the CTF Acquisition will be deductible for income tax purposes.
The following unaudited pro forma financial information presents the combined results of operations of Frontier and the CTF Operations as if the CTF Acquisition had occurred as of January 1, 2015. The pro forma information is not necessarily indicative of what the financial position or results of operations actually would have been had the CTF Acquisition been completed as of January 1, 2015. In addition, the unaudited pro forma financial information is not indicative of, nor does it purport to project, the future financial position or operating results of Frontier. The unaudited pro forma financial information excludes acquisition and integration costs and does not give effect to any estimated and potential cost savings or other operating efficiencies that may result from the CTF Acquisition.
F-15
FRONTIER COMMUNICATIONS CORPORATION AND SUBSIDIARIES
Notes to Consolidated Financial Statements
|
|
|||||||
|
|
(Unaudited) |
||||||
|
|
For the year ended December 31, |
||||||
|
($ in millions, except per share amounts) |
2016 |
2015 |
|||||
|
Revenue |
$ |
10,255 |
$ |
11,157 | |||
|
|
|||||||
|
Operating income |
$ |
1,433 |
$ |
1,529 | |||
|
|
|||||||
|
Net loss attributable to Frontier |
|||||||
|
common shareholders |
$ |
(262) |
$ |
(192) | |||
|
|
|||||||
|
Basic and diluted net loss per |
|||||||
|
share attributable to Frontier |
|||||||
|
common shareholders |
$ |
(3.38) |
$ |
(2.66) | |||
|
|
|||||||
The Connecticut Acquisition
On October 24, 2014, Frontier acquired the wireline properties of AT&T Inc. (AT&T) in Connecticut (the Connecticut Acquisition) for a purchase price of $2,018 million in cash, pursuant to the stock purchase agreement dated December 16, 2013, as amended. Following the Connecticut Acquisition, Frontier now owns and operates the wireline business and fiber optic network servicing consumer, commercial and wholesale customers in Connecticut. Frontier also acquired the AT&T U-verse® video (Vantage) and DISH® satellite TV customers in Connecticut.
Acquisition and Integration Costs
Acquisition costs include legal, financial advisory, accounting, regulatory and other related costs. Integration costs include expenses that are incremental and directly related to the acquisition, and were incurred to integrate the network and information technology platforms and to enable other integration initiatives.
Frontier incurred operating expenses related to the CTF Acquisition and the Connecticut Acquisition, as follows:
|
|
|||||||||
|
|
For the year ended December 31, |
||||||||
|
($ in millions) |
2017 |
2016 |
2015 |
||||||
|
|
|||||||||
|
Acquisition costs: |
|||||||||
|
CTF Acquisition |
$ |
- |
$ |
23 |
$ |
44 | |||
|
Connecticut Acquisition |
- |
- |
1 | ||||||
|
|
- |
23 | 45 | ||||||
|
Integration costs: |
|||||||||
|
CTF Acquisition |
25 | 412 | 152 | ||||||
|
Connecticut Acquisition |
- |
1 | 39 | ||||||
|
|
25 | 413 | 191 | ||||||
|
Total acquisition and |
|||||||||
|
integration costs |
$ |
25 |
$ |
436 |
$ |
236 | |||
|
|
|||||||||
We also invested $34 million, $142 million, and $129 million in capital expenditures related to the CTF Acquisition during the years ended December 31, 2017, 2016, and 2015, respectively. In connection with the Connecticut Acquisition, Frontier invested $24 million in capital expenditures during the year ended December 31, 2015.
F-16
FRONTIER COMMUNICATIONS CORPORATION AND SUBSIDIARIES
Notes to Consolidated Financial Statements
(4) Accounts Receivable:
The components of accounts receivable, net at December 31, 2017 and 2016 are as follows:
|
|
||||||
|
($ in millions) |
2017 |
2016 |
||||
|
Retail and Wholesale |
$ |
801 |
$ |
979 | ||
|
Other |
87 | 90 | ||||
|
Less: Allowance for doubtful accounts |
(69) | (131) | ||||
|
Accounts receivable, net |
$ |
819 |
$ |
938 | ||
An analysis of the activity in the allowance for doubtful accounts for the years ended December 31, 2017, 2016 and 2015 is as follows:
|
|
||||||||||||||||
|
($ in millions) |
Balance at beginning of Period |
Charged to Other Revenue |
Charged (Credited) to Switched and Nonswitched Revenue and Other Accounts |
Write-offs, net of Recoveries |
Balance at end of Period |
|||||||||||
|
2015 |
$ |
72 |
$ |
67 |
$ |
(17) |
$ |
(65) |
$ |
57 | ||||||
|
2016 |
$ |
57 |
$ |
164 |
$ |
15 |
$ |
(105) |
$ |
131 | ||||||
|
2017 |
$ |
131 |
$ |
109 |
$ |
(22) |
$ |
(149) |
$ |
69 | ||||||
|
|
||||||||||||||||
We maintain an allowance for doubtful accounts based on our estimate of our ability to collect accounts receivable. The provision for uncollectible amounts was $87 million, $179 million, and $50 million for the years ended December 31, 2017, 2016 and 2015, respectively. Our allowance for doubtful accounts increased in 2016 primarily as a result of the customer account balances related to CTF Operations subsequent to the CTF Acquisition. Our allowance for doubtful accounts decreased during 2017 primarily as a result of resolutions of carrier disputes and increased collection efforts on delinquent balances in both our CTF and Legacy markets. Resolutions reached with carriers resulted in a reduction of our reserves of $39 million in 2017.
(5) Property, Plant and Equipment:
Property, plant and equipment, net at December 31, 2017 and 2016 are as follows:
|
|
||||||||
|
($ in millions) |
Estimated Useful Lives |
2017 |
2016 |
|||||
|
Land |
N/A |
$ |
231 |
$ |
235 | |||
|
Buildings and leasehold improvements |
41 years |
2,282 | 2,320 | |||||
|
General support |
5 to 17 years |
1,570 | 1,502 | |||||
|
Central office/electronic circuit equipment |
5 to 18 years |
8,137 | 7,683 | |||||
|
Poles |
30 years |
1,095 | 995 | |||||
|
Cable, fiber and wire |
15 to 25 years |
10,997 | 10,292 | |||||
|
Conduit |
55 years |
1,646 | 1,611 | |||||
|
Construction work in progress |
538 | 903 | ||||||
|
Property, plant and equipment |
26,496 | 25,541 | ||||||
|
Less: Accumulated depreciation |
(12,119) | (10,639) | ||||||
|
Property, plant and equipment, net |
$ |
14,377 |
$ |
14,902 | ||||
Property, plant, and equipment includes approximately $171 million and $154 million of fixed assets recognized under capital leases as of December 31, 2017 and 2016, respectively.
F-17
FRONTIER COMMUNICATIONS CORPORATION AND SUBSIDIARIES
Notes to Consolidated Financial Statements
In 2017, we sold certain properties, generating $102 million in net proceeds, of which $97 million relates to property subject to leasebacks. For these properties, we have deferred $66 million in related gains that will be amortized over the related lease terms of two years. For year ended December 31, 2017, amortization of these deferred gains totaled $23 million, which are included in “Selling, general and administrative expenses” on our consolidated income statement. We have remaining deferred gain balances of $43 million, which are included in “Other liabilities.”
Depreciation expense is principally based on the composite group method. Depreciation expense was as follows:
|
|
|||||||||
|
|
For the Year Ended |
||||||||
|
($ in millions) |
2017 |
2016 |
2015 |
||||||
|
|
|||||||||
|
Depreciation expense |
$ |
1,485 |
$ |
1,388 |
$ |
983 | |||
|
|
|||||||||
We adopted new estimated remaining useful lives for certain plant assets as of October 1, 2017, as a result of an annual independent study of the estimated remaining useful lives of our plant assets, with an insignificant impact to depreciation expense.
(6) Goodwill and Other Intangibles:
The changes in the carrying amount of goodwill, net for the years ended December 31, 2017 and 2016 were as follows:
|
|
||||
|
($ in millions) |
Goodwill |
|||
|
Balance at January 1, 2016 |
$ |
7,166 | ||
|
CTF Acquisition (Note 3) |
2,508 | |||
|
Balance at December 31, 2016 |
9,674 | |||
|
CTF Acquisition adjustment |
98 | |||
|
Goodwill impairment |
(2,748) | |||
|
Balance at December 31, 2017 |
$ |
7,024 | ||
|
|
||||
Accumulated goodwill impairment charges were $2,788 million and $40 million as of December 31, 2017 and 2016, respectively.
We are required to perform impairment tests related to our goodwill annually, which we perform as of December 31, or sooner if an indicator of impairment occurs. Due to the continued decline in our stock price we had triggering events in each of the four quarters in 2017.
We use a market multiples approach to determine fair value. Marketplace company comparisons and analyst reports within the wireline telecommunications industry have historically supported a range of fair values of multiples between 4.4x and 6.5x annualized EBITDA (defined as operating income, net of acquisition and integration costs, pension/OPEB expense, pension settlement costs, stock-based compensation expense, goodwill impairment, storm-related costs, and restructuring costs and other charges, as well as depreciation and amortization). We estimated the enterprise fair value using a multiple of 5.8x EBITDA for the first three quarters in 2017 and a multiple of 5.5x EBITDA for the fourth quarter evaluation.
Our second and fourth quarter quantitative assessments indicated that the carrying value of the enterprise exceeded its fair value and, therefore, an impairment existed. We elected to early adopt the simplified goodwill testing method under ASU 2017-04, recording goodwill impairments totaling $2,748 million for 2017. The driver for the impairment in the second quarter was a reduction in our profitability and utilized EBITDA estimate, which when applied to our market multiple resulted in a lower enterprise valuation. During the fourth quarter, the impairment was largely driven by a lower enterprise valuation resulting from a reduction in utilized market multiple from 5.8x to 5.5x reflecting the lower outlook for our industry as a whole. The revaluation of our net
F-18
FRONTIER COMMUNICATIONS CORPORATION AND SUBSIDIARIES
Notes to Consolidated Financial Statements
deferred tax liabilities which resulted from the enactment of Tax Cut and Job Act, caused further goodwill impairment (see Note 12).
Our first and third quarter quantitative assessments indicated that the fair value of the enterprise exceeded its carrying value and, therefore, no indication of impairment existed in either period.
The market multiples approach that we use incorporates significant estimates and assumptions related to the forecasted results for the remainder of the year including revenues, expenses, and the achievement of other cost synergies. Our assessment includes many qualitative factors that require significant judgment. Alternative interpretations of these factors could have resulted in different conclusions regarding the need for, or size of, an impairment. Continued declines in our profitability or cash flows or in the sustained, historically low trading prices of our common stock may result in further impairment.
We also considered whether the carrying values of finite-lived intangible assets and property plant and equipment may not be recoverable or whether the carrying value of certain indefinite-lived intangible assets were impaired, noting no additional impairment was present as of December 31, 2017.
The components of other intangibles at December 31, 2017 and 2016 are as follows:
|
|
||||||||||||||||||
|
|
2017 |
2016 |
||||||||||||||||
|
($ in millions) |
Gross Carrying Amount |
Accumulated Amortization |
Net Carrying Amount |
Gross Carrying Amount |
Accumulated Amortization |
Net Carrying Amount |
||||||||||||
|
Other Intangibles: |
||||||||||||||||||
|
Customer base |
$ |
5,188 |
$ |
(3,294) |
$ |
1,894 |
$ |
5,088 |
$ |
(2,604) |
$ |
2,484 | ||||||
|
Trade name |
122 |
- |
122 | 122 |
- |
122 | ||||||||||||
|
Royalty agreement |
72 | (25) | 47 | 72 | (16) | 56 | ||||||||||||
|
Total other intangibles |
$ |
5,382 |
$ |
(3,319) |
$ |
2,063 |
$ |
5,282 |
$ |
(2,620) |
$ |
2,662 | ||||||
Amortization expense was as follows:
|
|
For the Year Ended |
||||||||
|
($ in millions) |
2017 |
2016 |
2015 |
||||||
|
|
|||||||||
|
Amortization expense |
$ |
699 |
$ |
643 |
$ |
337 | |||
|
|
|||||||||
Amortization expense primarily represents the amortization of our customer base acquired as a result of the CTF Acquisition, the Connecticut Acquisition and the acquisition of certain Verizon properties in 2010 with each based on a useful life of 8 to 12 years on an accelerated method. The approximate weighted average remaining life of our customer base is 6 years and for our royalty agreement is 3 years. Amortization expense based on our current estimate of useful lives, is estimated to be approximately $569 million in 2018, $454 million in 2019, $354 million in 2020, $260 million in 2021, and $173 million in 2022.
F-19
FRONTIER COMMUNICATIONS CORPORATION AND SUBSIDIARIES
Notes to Consolidated Financial Statements
(7) Long-Term Debt:
The activity in our long-term debt from January 1, 2017 to December 31, 2017 is summarized as follows:
|
Year ended December 31, 2017 |
||||||||||||||
|
($ in millions) |
January 1, 2017 |
Payments and Retirements |
New Borrowings |
December 31, 2017 |
Interest Rate at December 31, 2017* |
|||||||||
|
Senior & Subsidiary |
||||||||||||||
|
Unsecured Debt |
$ |
15,900 |
$ |
(1,655) |
$ |
- |
$ |
14,245 |
9.22% |
|||||
|
Senior Secured Debt |
2,151 | (155) | 1,500 | 3,496 |
5.24% |
|||||||||
|
Secured Subsidiary Debt |
100 |
- |
- |
100 |
8.50% |
|||||||||
|
Secured Debt |
19 | (3) |
- |
16 |
5.56% |
|||||||||
|
Rural Utilities Service Loan Contracts |
8 | (1) |
- |
7 |
6.15% |
|||||||||
|
Total Debt |
$ |
18,178 |
$ |
(1,814) |
$ |
1,500 |
$ |
17,863 |
8.44% |
|||||
|
Less: Debt Issuance Costs |
(209) | (183) | ||||||||||||
|
Less: Debt Premium (Discount) |
(46) | (54) | ||||||||||||
|
Less: Current Portion |
(363) | (656) | ||||||||||||
|
Total Long-Term Debt |
$ |
17,560 |
$ |
16,970 | ||||||||||
* Interest rate includes amortization of debt issuance costs and debt premiums or discounts. The interest rates at December 31, 2017 represent a weighted average of multiple issuances.
F-20
FRONTIER COMMUNICATIONS CORPORATION AND SUBSIDIARIES
Notes to Consolidated Financial Statements
Additional information regarding our senior unsecured debt, senior secured debt and subsidiary debt at December 31, 2017 and 2016 is as follows:
|
|
||||||||||
|
|
2017 |
2016 |
||||||||
|
|
||||||||||
|
|
Principal |
Interest |
Principal |
Interest |
||||||
|
($ in millions) |
Outstanding |
Rate |
Outstanding |
Rate |
||||||
|
|
||||||||||
|
Senior Unsecured Debt Due: |
||||||||||
|
4/15/2017 |
$ |
- |
8.250% |
$ |
210 |
8.250% |
||||
|
10/1/2018 |
491 |
8.125% |
583 |
8.125% |
||||||
|
3/15/2019 |
404 |
7.125% |
434 |
7.125% |
||||||
|
4/15/2020 |
619 |
8.500% |
1,169 |
8.500% |
||||||
|
9/15/2020 |
303 |
8.875% |
1,066 |
8.875% |
||||||
|
7/1/2021 |
490 |
9.250% |
500 |
9.250% |
||||||
|
9/15/2021 |
775 |
6.250% |
775 |
6.250% |
||||||
|
4/15/2022 |
500 |
8.750% |
500 |
8.750% |
||||||
|
9/15/2022 |
2,188 |
10.500% |
2,188 |
10.500% |
||||||
|
1/15/2023 |
850 |
7.125% |
850 |
7.125% |
||||||
|
4/15/2024 |
750 |
7.625% |
750 |
7.625% |
||||||
|
1/15/2025 |
775 |
6.875% |
775 |
6.875% |
||||||
|
9/15/2025 |
3,600 |
11.000% |
3,600 |
11.000% |
||||||
|
11/1/2025 |
138 |
7.000% |
138 |
7.000% |
||||||
|
8/15/2026 |
2 |
6.800% |
2 |
6.800% |
||||||
|
1/15/2027 |
346 |
7.875% |
346 |
7.875% |
||||||
|
8/15/2031 |
945 |
9.000% |
945 |
9.000% |
||||||
|
10/1/2034 |
1 |
7.680% |
1 |
7.680% |
||||||
|
7/1/2035 |
125 |
7.450% |
125 |
7.450% |
||||||
|
10/1/2046 |
193 |
7.050% |
193 |
7.050% |
||||||
|
|
13,495 | 15,150 | ||||||||
|
|
||||||||||
|
Senior Secured Debt Due: |
||||||||||
|
10/24/2019 (1) |
245 |
5.445% (Variable) |
280 |
4.145% (Variable) |
||||||
|
3/31/2021 (2) |
1,483 |
4.320% (Variable) |
1,564 |
3.270% (Variable) |
||||||
|
10/12/2021(3) |
276 |
5.445% (Variable) |
307 |
4.145% (Variable) |
||||||
|
6/15/2024 (4) |
1,492 |
5.320% (Variable) |
- |
|||||||
|
|
3,496 | 2,151 | ||||||||
|
|
||||||||||
|
Subsidiary Debentures Due: |
||||||||||
|
5/15/2027 |
200 |
6.750% |
200 |
6.750% |
||||||
|
2/1/2028 |
300 |
6.860% |
300 |
6.860% |
||||||
|
2/15/2028 |
200 |
6.730% |
200 |
6.730% |
||||||
|
10/15/2029 |
50 |
8.400% |
50 |
8.400% |
||||||
|
11/15/2031 |
100 |
8.500% |
100 |
8.500% |
||||||
|
|
850 | 850 | ||||||||
|
|
||||||||||
|
Total |
$ |
17,841 |
8.1% (5) |
$ |
18,151 |
8.3% (5) |
||||
|
|
||||||||||
(1) Represents borrowings under the 2014 CoBank Credit Agreement, as defined below.
(2) Represents borrowings under the JPM Credit Agreement Term Loan A, as defined below.
(3) Represents borrowings under the 2016 CoBank Credit Agreement, as defined below.
(4) Represents borrowings under the JPM Credit Agreement Term Loan B, as defined below.
(5) Interest rate represents a weighted average of the stated interest rates of multiple issuances.
F-21
FRONTIER COMMUNICATIONS CORPORATION AND SUBSIDIARIES
Notes to Consolidated Financial Statements
New Notes Issuances
Upon completion of the CTF Acquisition on April 1, 2016, we assumed additional debt of $600 million, including $200 million aggregate principal amount of 6.75% Senior Notes due May 15, 2027, $300 million aggregate principal amount of 6.86% Senior Notes due February 1, 2028 and $100 million aggregate principal amount of 8.50% Senior Notes due November 15, 2031.
On September 25, 2015, Frontier completed a private offering of $6,600 million aggregate principal amount of unsecured Senior Notes, as follows: $1,000 million of 8.875% Senior Notes due 2020; $2,000 million of 10.50% Senior Notes due 2022; and $3,600 million of 11.00% Senior Notes due 2025. Each was issued at a price equal to 100% of its principal amount. Frontier used the net proceeds from the offering (after deducting underwriting fees) to finance a portion of the cash consideration paid in connection with the CTF Acquisition and to pay related fees and expenses. The net proceeds of the debt offering of $6,485 million were included in “Restricted cash” in the consolidated balance sheet as of December 31, 2015. In June 2016, we completed an exchange offer of registered senior notes for the privately placed senior notes.
Debt Reductions and Conversions
During 2017, Frontier used proceeds from Term Loan B (see definition and note discussion below) and cash on hand to retire $763 million of 8.875% Notes due 2020, $550 million of 8.500% Notes due 2020, $92 million of 8.125% Notes due 2018, $30 million of 7.125% Notes due 2019, and $10 million of 9.250% Notes due 2021. Frontier recorded a loss of $88 million driven primarily by premiums on the retirement of the notes. Additionally, Frontier used cash available on hand for the scheduled retirement of $210 million of 8.25% Senior Notes at maturity.
During 2016, we completed non-cash debt exchanges including related accrued interest, of $397 million of our 8.25% Notes due April 2017 for approximately $147 million of our 8.50% Notes due April 2020, $66 million of our 8.875% Notes due September 2020, and $188 million of our 10.50% Notes due September 2022. A pretax loss of approximately $7 million was recognized and included in our consolidated statement of operations for the year ended December 31, 2016.
During 2015, Frontier used cash available on hand for the scheduled retirement of $97 million of 7.875% Senior Notes, and $105 million 6.625% Senior Notes at maturity.
Term Loans and Credit Facilities
On February 27, 2017, Frontier entered into a first amended and restated credit agreement with JPMorgan Chase Bank, N.A., as administrative agent, and the lenders party thereto, pursuant to which Frontier combined its revolving credit agreement, dated as of June 2, 2014, and its term loan credit agreement, dated as of August 12, 2015. Under the JPM Credit Agreement, as further amended on June 15, 2017 by Increase Joinder No.1 (as so amended, the JPM Credit Agreement), Frontier has a $1,625 million senior secured term loan A facility (the Term Loan A) maturing on March 31, 2021, an $850 million undrawn secured revolving credit facility maturing on February 27, 2022 (the Revolver), and $1,500 million senior secured term loan B facility (the Term Loan B) maturing on June 15, 2024. The maturities of the Term Loan A, the Revolver, and the Term Loan B, in each case if still outstanding, will be accelerated in the following circumstances: (i) if, 91 days before the maturity date of any series of Senior Notes maturing in 2020, 2023 and 2024, more than $500 million in principal amount remains outstanding on such series; or (ii) if, 91 days before the maturity date of the first series of Senior Notes maturing in 2021 or 2022, more than $500 million in principal amount remains outstanding, in the aggregate, on the two series of Senior Notes maturing in such year. The determination of interest rates for each of the facilities under the JPM Credit Agreement is based on margins over the Base Rate (as defined in the JPM Credit Agreement) or over LIBOR, at the election of Frontier. Interest rate margins on the Term Loan A and Revolver (ranging from 0.75% to 1.75% for Base Rate borrowings and 1.75% to 2.75% for LIBOR borrowings) are subject to adjustment based on Frontier’s Total Leverage Ratio (as defined in the JPM Credit Agreement). The interest rate on the Term Loan A as of December 31, 2017 was LIBOR plus 2.75%. Interest rate margins on the Term Loan B (2.75% for Base Rate borrowings and 3.75% for LIBOR borrowings) are not subject to adjustment. The security package under the JPM Credit Agreement includes pledges of the equity interests in certain Frontier subsidiaries and guaranties by certain Frontier subsidiaries. As of December 31, 2017 no borrowing had been made under the revolving credit facility. Letters of credit, which may be issued under the revolver up to a maximum of $134 million, reduce available borrowing capacity under the revolving credit facility. Letters of credit issued under the revolver totaled $63 million and $0 as of December 31, 2017 and 2016,
F-22
FRONTIER COMMUNICATIONS CORPORATION AND SUBSIDIARIES
Notes to Consolidated Financial Statements
respectively. The revolving credit facility is available for general corporate purposes but may not be used to fund dividend payments if the undrawn amount under the revolver is less than $250 million.
Frontier has two senior secured credit agreements with CoBank, ACB, as administrative agent, lead arranger and a lender, and the other lenders party thereto: the first, drawn in 2011 (the 2011 CoBank Credit Agreement), was refinanced on October 12, 2016 with a similar facility for $315 million, maturing on October 12, 2021 (the 2016 CoBank Credit Agreement), and the second, drawn in 2014 (the 2014 CoBank Credit Agreement), matures on October 24, 2019. Repayment of the principal balance will be made in quarterly installments of $8 million which commenced December 31, 2016 for the 2016 CoBank Credit Agreement, and $9 million which commenced on March 31, 2015 for the 2014 CoBank Credit Agreement. The remaining outstanding principal balances to be repaid on the maturity date.
On March 29, 2017, Frontier amended the 2014 and 2016 CoBank Credit Agreements. The amendments provide that interest rate margins under each of these facilities will range from 0.875% to 3.875% for Base Rate borrowings and 1.875% to 4.875% for LIBOR borrowings, subject to adjustment based on our Total Leverage Ratio, as defined in each credit agreement. The interest rate on each of the facilities as of December 31, 2017 was LIBOR plus 3.875%. In addition, the amendments provide for increases in the maximum Leverage Ratio and expansion of the security package identical to those contained in the JPM Credit Agreement.
On January 25, 2018 Frontier further amended its credit agreements with JP Morgan Chase and CoBank (JPM Credit Amendment). The amendments expanded the security package to include interests of certain subsidiaries previously not pledged and replaced the net leverage ratio maintenance test with a first lien net leverage ratio maintenance test.
During 2015, we entered into secured financings totaling $3 million with four year terms and no stated interest rate for certain equipment purchases.
As of December 31, 2017, we were in compliance with all of our debt and credit facility covenants.
Our scheduled principal payments are as follows as of December 31, 2017:
|
|
|||
|
|
Principal |
||
|
($ in millions) |
Payments |
||
|
2018 |
$ |
656 | |
|
2019 |
$ |
804 | |
|
2020 |
$ |
1,132 | |
|
2021 |
$ |
2,558 | |
|
2022 |
$ |
2,703 | |
|
Thereafter |
$ |
10,010 | |
|
|
|||
F-23
FRONTIER COMMUNICATIONS CORPORATION AND SUBSIDIARIES
Notes to Consolidated Financial Statements
Other Obligations
During 2016, Frontier contributed a real estate property with a fair value of $15 million for the purpose of funding a portion of its contribution obligations to its qualified defined benefit pension plan. The pension plan obtained independent appraisals of the property and, based on these appraisals, the pension plan recorded the contribution at its fair value of $15 million. Frontier has entered into a lease for the contributed property with initial terms of 15 years at a combined aggregate annual rent of approximately $2 million. The property is managed on behalf of the pension plan by an independent fiduciary, and the terms of the lease were negotiated with the fiduciary on an arm’s-length basis.
The contribution and leaseback of the property was treated as a financing transaction and, accordingly, Frontier continues to depreciate the carrying value of the property in its financial statements and no gain or loss was recognized. An obligation of $15 million was recorded in our consolidated balance sheet within “Other liabilities” and the liability is reduced annually by a portion of the lease payments made to the pension plan.
During 2017 and 2016, Frontier modified certain operating leases for vehicles which resulted in the classification as capital leases. These agreements have lease terms of 1 to 7 years. These capital lease obligations are included in our consolidated balance sheet within “Other liabilities” and “Other current liabilities.”
In 2012, Frontier entered into a sale and leaseback arrangement for a facility in Everett, Washington and entered into a capital lease for the use of fiber in the state of Minnesota. These agreements have lease terms of 12 and 23 years, respectively. These capital lease obligations are included in our consolidated balance sheet within “Other liabilities” and “Other current liabilities.”
Future minimum payments for finance lease obligations and capital lease obligations as of December 31, 2017 are as follows:
|
|
||||||
|
($ in millions) |
Finance Lease Obligations |
Capital Lease Obligations |
||||
|
Year ending December 31: |
||||||
|
2018 |
$ |
9 |
$ |
41 | ||
|
2019 |
9 | 29 | ||||
|
2020 |
10 | 19 | ||||
|
2021 |
10 | 12 | ||||
|
2022 |
10 | 9 | ||||
|
Thereafter |
52 | 9 | ||||
|
Total future payments |
100 | 119 | ||||
|
Less: Amounts representing interest |
(55) | (14) | ||||
|
Present value of minimum lease payments |
$ |
45 |
$ |
105 | ||
|
|
||||||
F-24
FRONTIER COMMUNICATIONS CORPORATION AND SUBSIDIARIES
Notes to Consolidated Financial Statements
(8) Restructuring Costs
As of December 31, 2017, restructuring related liabilities of $25 million pertaining to employee separation charges are included in “Other current liabilities” in our consolidated balance sheet.
During 2017, restructuring costs and other charges, primarily consisting of severance and other employee-related costs of $68 million, pension/OPEB benefit enhancements of $5 million and the loss recorded on the sale of Frontier’s Secure Strategic Partnerships business of $9 million, totaling $82 million in connection with workforce reductions, are included in “Restructuring costs and other charges” in our consolidated statement of operations for the year ended December 31, 2017.
During 2016, restructuring costs and other charges, primarily consisting of severance and other employee-related costs of $65 million, and pension/OPEB benefit enhancements of $26 million, totaling $91 million in connection with workforce reductions, are included in “Restructuring costs and other charges” in our consolidated statement of operations for the year ended December 31, 2016.
The following is a summary of the changes in the liabilities established for restructuring programs at December 31, 2017:
|
|
||||
|
|
||||
|
|
Restructuring |
|||
|
($ in millions) |
Liability |
|||
|
Balance, January 1, 2016 |
$ |
1 | ||
|
Severance costs |
65 | |||
|
Cash payments during the period |
(19) | |||
|
Balance, December 31, 2016 |
47 | |||
|
Severance costs |
68 | |||
|
Cash payments during the period |
(90) | |||
|
Balance, December 31, 2017 |
$ |
25 | ||
|
|
||||
(9) Investment and Other Income, Net:
The components of investment and other income, net for the years ended December 31, 2017, 2016 and 2015 are as follows:
|
|
|||||||||
|
($ in millions) |
2017 |
2016 |
2015 |
||||||
|
|
|||||||||
|
Interest and dividend income |
$ |
6 |
$ |
13 |
$ |
7 | |||
|
Gain on expiration/settlement of customer advances |
- |
13 |
- |
||||||
|
All other, net |
(3) | 1 |
- |
||||||
|
Total investment and other income, net |
$ |
3 |
$ |
27 |
$ |
7 | |||
|
|
|||||||||
During 2016, we recognized income of $13 million in connection with certain retained liabilities that have terminated, associated with customer advances for construction from our disposed water properties.
(10) Capital Stock:
We are authorized to issue up to 175,000,000 shares of common stock and 50,000,000 shares of preferred stock. The amount and timing of dividends payable on common and preferred stock are, subject to applicable law, within the sole discretion of our Board of Directors.
Common Stock Offering
On June 10, 2015, prior to the reverse stock split (see Footnote 1) we completed a registered offering of 150,000,000 shares of our common stock, par value $0.25 per share, at an offering price of $5 per share. On June
F-25
FRONTIER COMMUNICATIONS CORPORATION AND SUBSIDIARIES
Notes to Consolidated Financial Statements
24, 2015, Frontier issued an additional 15,000,000 shares of common stock in connection with the over-allotment option that was exercised in full by the underwriters. Aggregate net proceeds were approximately $799 million after deducting commissions and estimated expenses. We used the net proceeds from this offering to fund a portion of the acquisition price of the CTF Acquisition and related fees and expenses.
Mandatory Convertible Preferred Stock (Series A) Offering
On June 10, 2015, prior to the reverse stock split, we completed a registered offering of 17,500,000 shares of our 11.125% Mandatory Convertible Preferred Stock, Series A, par value $0.01 per share (the “Series A Preferred Stock”), at an offering price of $100 per share. On June 24, 2015, Frontier issued an additional 1,750,000 shares of Series A Preferred Stock in connection with the over-allotment option that was exercised in full by the underwriters. Aggregate net proceeds of the offering were $1,866 million after deducting commissions and estimated expenses. We used the net proceeds from this offering to fund a portion of the acquisition price of the CTF Acquisition and related fees and expenses.
Unless converted earlier, each share of the Series A Preferred Stock will automatically convert on June 29, 2018 into common stock, (between 1.1348 and 1.3333 shares on a post-split basis) depending on the applicable market value of our common stock, subject to anti-dilution adjustments. Subject to certain restrictions, at any time prior to June 29, 2018, holders of the Series A Preferred Stock may elect to convert all or a portion of their shares into common stock at the minimum conversion rate then in effect.
Dividends on shares of the Series A Preferred Stock are payable on a cumulative basis when, as and if declared by our Board of Directors (or an authorized committee thereof) at an annual rate of 11.125% on the liquidation preference of $100.00 per share, on the last business day of March, June, September and December of each year, commencing on September 30, 2015 to, and including, the mandatory conversion date. Series A Preferred Stock dividends of $214 million, $214 million, and $120 million were paid in 2017, 2016, and 2015 respectively.
Pursuant to the terms of the CTF Acquisition, $1,955 million of the $2,665 million in net proceeds from the equity offerings were deposited into escrow and were included in “Restricted cash” in the consolidated balance sheet as of December 31, 2015. Upon closing of the CTF Acquisition, the funds were released and used to fund a portion of the purchase price.
(11) Stock Plans:
At December 31, 2017, we had seven stock-based compensation plans under which grants were made and awards remained outstanding. No further awards may be granted under six of the plans: the 1996 Equity Incentive Plan (the 1996 EIP), the Amended and Restated 2000 Equity Incentive Plan (the 2000 EIP), the 2009 Equity Incentive Plan (the 2009 EIP), the 2013 Equity Incentive Plan (the 2013 EIP), the Deferred Fee Plan and the Directors’ Equity Plan. At December 31, 2017, there were approximately 5,667,000 shares authorized for grant and approximately 4,361,000 shares available for grant under the 2017 Equity Incentive Plan (the 2017 EIP and together with the 1996 EIP, the 2000 EIP, the 2009 EIP and the 2013 EIPS, the EIPs). Our general policy is to issue treasury shares upon the grant of restricted shares and the exercise of options.
1996, 2000, 2009, 2013, and 2017 Equity Incentive Plans
Since the expiration dates of the 1996 EIP, the 2000 EIP, the 2009 EIP, and the 2013 EIP on May 22, 2006, May 14, 2009, May 8, 2013, and May 10, 2017, respectively, no awards have been or may be granted under the 1996 EIP, the 2000 EIP, the 2009 EIP, and the 2013 EIP. Under the 2017 EIP, awards of our common stock may be granted to eligible employees in the form of incentive stock options, non-qualified stock options, SARs, restricted stock, performance shares or other stock-based awards. As discussed under the Non-Employee Directors’ Compensation Plans below, prior to May 25, 2006 non-employee directors received an award of stock options under the 2000 EIP upon commencement of service. No awards may be granted more than 10 years after the effective date (May 10, 2017) of the 2017 EIP plan. The exercise price of stock options and SARs under the EIPs generally are equal to or greater than the fair market value of the underlying common stock on the date of grant. Stock options are not ordinarily exercisable on the date of grant but vest over a period of time (generally four years). Under the terms of the EIPs, subsequent stock dividends and stock splits have the effect of increasing the option shares outstanding, which correspondingly decrease the average exercise price of outstanding options.
F-26
FRONTIER COMMUNICATIONS CORPORATION AND SUBSIDIARIES
Notes to Consolidated Financial Statements
Performance Shares
On February 15, 2012, Frontier’s Compensation Committee, in consultation with the other non-management directors of Frontier’s Board of Directors and the Committee’s independent executive compensation consultant, adopted the Frontier Long-Term Incentive Plan (the LTIP). LTIP awards are granted in the form of performance shares. The LTIP is currently offered under Frontier’s 2009 EIP, 2013 EIP and 2017 EIP, and participants consist of senior vice presidents and above. The LTIP awards have performance, market and time-vesting conditions.
Beginning in 2012, during the first 90 days of a three-year performance period (a Measurement Period), a target number of performance shares are awarded to each LTIP participant with respect to the Measurement Period. The performance metrics under the LTIP are (1) annual targets for operating cash flow based on a goal set during the first 90 days of each year in the three-year Measurement Period and (2) an overall performance “modifier” set during the first 90 days of the Measurement Period, based on Frontier’s total return to stockholders (i.e., Total Shareholder Return or TSR) relative to the Integrated Telecommunications Services Group (GICS Code 50101020) for the three-year Measurement Period. Operating cash flow performance is determined at the end of each year and the annual results will be averaged at the end of the three-year Measurement Period to determine the preliminary number of shares earned under the LTIP award. The TSR performance measure is then applied to decrease or increase payouts based on Frontier’s three year relative TSR performance. LTIP awards, to the extent earned, will be paid out in the form of common stock shortly following the end of the three-year Measurement Period.
On February 25, 2015, the Compensation Committee granted approximately 665,000 performance shares under the LTIP and set the operating cash flow performance goal for 2015, which applies to the first year in the 2015-2017 measurement period, the second year of the 2014-2016 measurement period and the third year of the 2013-2015 measurement period. On February 11, 2016, the Compensation Committee granted approximately 1,669,000 performance shares under the LTIP and set the operating cash flow performance goal for 2016, which applies to the first year in the 2016-2018 measurement period, the second year of the 2015-2017 measurement period and the third year of the 2014-2016 measurement period. On February 16, 2017, the Compensation Committee of our Board of Directors granted approximately 157,400 performance shares under the Frontier Long Term Incentive Plan (the LTIP) and set the operating cash flow performance goal for 2017, which applies to the first year in the 2017-2019 measurement period, the second year of the 2016-2018 measurement period and the third year of the 2015-2017 measurement period. The number of shares of common stock earned at the end of each three-year Measurement Period may be more or less than the number of target performance shares granted as a result of operating cash flow and TSR performance. An executive must maintain a satisfactory performance rating during the Measurement Period and must be employed by Frontier at the end of the three-year Measurement Period in order for the award to vest. The Compensation Committee will determine the number of shares earned for each three year Measurement Period in February of the year following the end of the Measurement Period.
F-27
FRONTIER COMMUNICATIONS CORPORATION AND SUBSIDIARIES
Notes to Consolidated Financial Statements
The following summary presents information regarding LTIP target performance shares as of December 31, 2017 and changes during the three years then ended with regard to LTIP shares awarded under the 2009 EIP, 2013 EIP, and 2017 EIP:
|
|
||
|
Number of |
||
|
|
Shares |
|
|
|
(in thousands) |
|
|
Balance at December 31, 2014 |
179 | |
|
LTIP target performance shares granted |
49 | |
|
LTIP target performance shares earned |
(50) | |
|
LTIP target performance shares forfeited |
(10) | |
|
Balance at December 31, 2015 |
168 | |
|
LTIP target performance shares granted |
111 | |
|
LTIP target performance shares earned |
(59) | |
|
LTIP target performance shares forfeited |
(30) | |
|
Balance at December 31, 2016 |
190 | |
|
LTIP target performance shares granted |
211 | |
|
LTIP target performance shares earned |
(41) | |
|
LTIP target performance shares forfeited |
(54) | |
|
Balance at December 31, 2017 |
306 | |
|
|
For purposes of determining compensation expense, the fair value of each performance share is measured at the end of each reporting period and, therefore, will fluctuate based on the price of Frontier common stock as well as performance relative to the targets. Frontier recognized an expense, included in “Selling, general, and administrative expenses” of $1 million, $6 million, and $7 million during 2017, 2016 and 2015, respectively, for the LTIP.
Restricted Stock
The following summary presents information regarding unvested restricted stock as of December 31, 2017 and changes during the three years then ended with regard to restricted stock under the 2009 EIP, 2013 EIP, and 2017 EIP:
|
|
||||||||
|
|
Weighted |
|||||||
|
|
Average |
|||||||
|
|
Number of |
Grant Date |
Aggregate |
|||||
|
|
Shares |
Fair Value |
Fair Value |
|||||
|
|
(in thousands) |
(per share) |
(in millions) |
|||||
|
Balance at December 31, 2014 |
512 |
$ |
71.25 |
$ |
52 | |||
|
Restricted stock granted |
188 |
$ |
118.80 |
$ |
13 | |||
|
Restricted stock vested |
(214) |
$ |
73.35 |
$ |
15 | |||
|
Restricted stock forfeited |
(24) |
$ |
76.50 |
|||||
|
Balance at December 31, 2015 |
462 |
$ |
88.95 |
$ |
33 | |||
|
Restricted stock granted |
396 |
$ |
65.40 |
$ |
20 | |||
|
Restricted stock vested |
(248) |
$ |
78.90 |
$ |
13 | |||
|
Restricted stock forfeited |
(61) |
$ |
76.65 |
|||||
|
Balance at December 31, 2016 |
549 |
$ |
78.00 |
$ |
28 | |||
|
Restricted stock granted |
454 |
$ |
47.77 |
$ |
3 | |||
|
Restricted stock vested |
(240) |
$ |
80.86 |
$ |
2 | |||
|
Restricted stock forfeited |
(130) |
$ |
60.92 |
|||||
|
Balance at December 31, 2017 |
633 |
$ |
58.63 |
$ |
4 | |||
|
|
||||||||
F-28
FRONTIER COMMUNICATIONS CORPORATION AND SUBSIDIARIES
Notes to Consolidated Financial Statements
For purposes of determining compensation expense, the fair value of each restricted stock grant is estimated based on the average of the high and low market price of a share of our common stock on the date of grant. Total remaining unrecognized compensation cost associated with unvested restricted stock awards that is deferred at December 31, 2017 was $21 million and the weighted average vesting period over which this cost is expected to be recognized is approximately 1.2 years.
We have granted restricted stock awards to employees in the form of our common stock. None of the restricted stock awards may be sold, assigned, pledged or otherwise transferred, voluntarily or involuntarily, by the employees until the restrictions lapse, subject to limited exceptions. The restrictions are time-based. Compensation expense, recognized in “Selling, general and administrative expenses”, of $18 million, $18 million and $20 million, for the years ended December 31, 2017, 2016 and 2015, respectively, has been recorded in connection with these grants.
Non-Employee Directors’ Compensation Plans
As of October 1, 2013, stock units are credited to the director’s account in an amount that is determined as follows: the total cash value of the fees payable to the director is divided by the closing price of Frontier common stock on the grant date of the units. Units are credited to the director’s account quarterly. Directors must also elect to convert the units to either common stock (convertible on a one-to-one basis) or cash upon retirement or death.
Dividends are paid on stock units held by directors at the same rate and at the same time as we pay dividends on shares of our common stock. Dividends on stock units are paid in the form of additional stock units.
There were 9 directors participating in the Director Plans during all or part of 2017. The total plan units earned were 94,034, 29,618, and 22,279 in 2017, 2016 and 2015, respectively.
To the extent directors elect to receive the distribution of their stock unit account in cash, they are considered liability-based awards. To the extent directors elect to receive the distribution of their stock unit accounts in common stock, they are considered equity-based awards. Compensation expense for stock units that are considered equity-based awards is based on the market value of our common stock at the date of grant. Compensation expense for stock units that are considered liability-based awards is based on the market value of our common stock at the end of each period.
In connection with the Director Plans, there were compensation costs associated with the issuance of stock units of $(5) million, $0 million and ($1) million in 2017, 2016 and 2015, respectively. Cash compensation associated with the Director Plans was $1 million in 2017, 2016 and 2015, respectively. These costs are recognized in “Selling, general and administrative expenses”.
F-29
FRONTIER COMMUNICATIONS CORPORATION AND SUBSIDIARIES
Notes to Consolidated Financial Statements
(12) Income Taxes:
The following is a reconciliation of the provision for income taxes computed at the federal statutory rate to income taxes computed at the effective rates for the years ended December 31, 2017, 2016 and 2015:
|
|
|||||||||
|
|
2017 |
2016 |
2015 |
||||||
|
|
|||||||||
|
Consolidated tax provision at federal statutory rate |
35.0 |
% |
35.0 |
% |
35.0 |
% |
|||
|
State income tax provisions, net of federal income |
|||||||||
|
tax benefit |
1.7 | (0.1) | 8.7 | ||||||
|
Tax reserve adjustment |
0.1 | 0.6 | (0.3) | ||||||
|
Domestic production activities deduction |
- |
(1.9) |
- |
||||||
|
Changes in certain deferred tax balances |
(0.4) | 5.8 | 0.8 | ||||||
|
Goodwill impairment |
(19.1) |
- |
- |
||||||
|
Federal research and development credit |
0.1 | 1.0 | 1.5 | ||||||
|
Non-deductible transaction costs |
- |
- |
0.4 | ||||||
|
Deferred Tax Remeasurement - 2017 Tax Reform |
26.1 |
- |
- |
||||||
|
All other, net |
(0.1) | (0.2) | (0.3) | ||||||
|
Effective tax rate |
43.4 |
% |
40.2 |
% |
45.8 |
% |
|||
Income taxes for the year ended December 31, 2017 includes the tax impact of $608 million related to the goodwill impairment recorded during the year.
On December 22, 2017, the U.S. government enacted comprehensive tax legislation known as the Tax Cut and Jobs Act (the TCJA). The TCJA, makes broad and complex changes to the U.S. tax code. The TCJA reduces the corporate tax rate to 21%, effective January 1, 2018. Under ASC 740, the effects of new legislation are recognized upon enactment. Accordingly, recognition of the tax effects of the TCJA is required in the interim and annual periods that include December 22, 2017.
On December 22, 2017, the SEC staff issued Staff Accounting Bulletin No. 118 (“SAB 118”), which provides guidance on accounting for the tax effects of the TCJA. SAB 118 provides a measurement period that should not extend beyond one year from the TCJA enactment date for companies to complete the accounting under ASC 740, Income Taxes. In accordance with SAB 118, a company must reflect the income tax effects of those aspects of the TCJA for which the accounting under ASC 740 is complete. To the extent that a company’s accounting for certain income tax effects of the TCJA is incomplete but it is able to determine a reasonable estimate, it must record a provisional estimate in the financial statements.
As a result of the reduction of the federal corporate income tax rate, we revalued our net deferred tax liability, as of December 31, 2017. We have recorded a net tax benefit of $830 million to value the liability using the new, lower federal tax rate. Our effective tax rate increased to 43.4% primarily as a result of the revaluation of our net deferred tax liability, partially offset by the 19.1% detriment related to the goodwill impairments. The components of the provisional net tax expense recorded in 2017 are based on currently available information and additional information needs to be prepared, obtained and/or analyzed to determine the final amounts. The provisional tax benefit for the re-measurement of deferred taxes will require additional information necessary for the preparation of our U.S. federal tax return, and further analysis and interpretation of certain provisions of the TCJA impacting deferred taxes, for example, 100% expensing of qualified assets as well as deferred tax items arising from items of income or loss recorded in other comprehensive income, could impact our tax balances as of December 31, 2017.
Income taxes for 2016 include the impact of $36 million of tax benefits resulting primarily from the adjustment of deferred tax balances due to the CTF Acquisition, the impact of $6 million in benefits from the Federal research and development credits, along with a $12 million reversal of benefits related to the domestic production activities deduction.
F-30
FRONTIER COMMUNICATIONS CORPORATION AND SUBSIDIARIES
Notes to Consolidated Financial Statements
Income taxes for 2015 include the impact of a $3 million benefit arising from the adjustment of deferred tax balances and a $5 million benefit from the federal research and development credit.
Amounts pertaining to income tax related accounts of $0 and $55 million are included in “Income taxes and other current assets” in the consolidated balance sheets as of December 31, 2017 and 2016, respectively.
In 2017 and 2016, we received federal and state income tax refunds totaling $51 million and $120 million, respectively.
The components of the net deferred income tax liability (asset) at December 31 are as follows:
|
|
|||||
|
($ in millions) |
2017 |
2016 |
|||
|
|
|||||
|
Deferred income tax liabilities: |
|||||
|
Property, plant and equipment basis differences |
$ |
2,022 |
$ |
2,751 | |
|
Intangibles |
140 | 878 | |||
|
Deferred revenue/expense |
8 | 14 | |||
|
Other, net |
4 | 12 | |||
|
|
$ |
2,174 |
$ |
3,655 | |
|
|
|||||
|
Deferred income tax assets: |
|||||
|
Pension liability |
176 | 273 | |||
|
Tax operating loss carryforward |
960 | 687 | |||
|
Employee benefits |
192 | 255 | |||
|
Accrued expenses |
23 | 44 | |||
|
Lease obligations |
39 | 75 | |||
|
Tax credit |
43 | 30 | |||
|
Allowance for doubtful accounts |
7 | 44 | |||
|
Other, net |
2 | 2 | |||
| 1,442 | 1,410 | ||||
|
Less: Valuation allowance |
(407) | (271) | |||
|
Net deferred income tax asset |
1,035 | 1,139 | |||
|
Net deferred income tax liability |
$ |
1,139 |
$ |
2,516 | |
|
|
|||||
|
|
|||||
Our federal net operating loss carryforward as of December 31, 2017 is estimated at $2.1 billion. The federal loss carryforward will begin to expire after 2036, unless otherwise used.
Our state tax operating loss carryforward as of December 31, 2017 is estimated at $9.3 billion. A portion of our state loss carryforward will continue to expire annually through 2037, unless otherwise used.
Our federal research and development credit and alternative minimum tax credit as of December 31, 2017 is estimated at $18 million and $3 million, respectively. The federal research and development credit will expire between 2034 and 2037, unless otherwise used.
Our various state credits as of December 31, 2017 are estimated at $27 million. The state credits will expire between 2018 and 2022, unless otherwise used.
As of December 31, 2017, Frontier has a valuation allowance of $407 million to reduce deferred tax assets to an amount more likely than not to be realized. This valuation allowance is related to state net operating losses and state tax credits. In evaluating Frontier’s ability to realize its deferred tax assets, management considers whether it is more likely than not that some or all of the deferred tax assets will not be realized. Management also considered the projected reversal of deferred tax liabilities and projected future taxable income in making this assessment. Based upon this assessment, management believes it is more likely than not Frontier will
F-31
FRONTIER COMMUNICATIONS CORPORATION AND SUBSIDIARIES
Notes to Consolidated Financial Statements
realize the benefits of these deductible differences, net of valuation allowance. There was a valuation allowance of $271 million recorded as of December 31, 2016.
The provision (benefit) for federal and state income taxes, as well as the taxes charged or credited to equity of Frontier, includes amounts both payable currently and deferred for payment in future periods as indicated below:
|
|
||||||||
|
|
||||||||
|
($ in millions) |
2017 |
2016 |
2015 |
|||||
|
|
||||||||
|
Income tax expense (benefit): |
||||||||
|
Current: |
||||||||
|
Federal |
$ |
(4) |
$ |
(52) |
$ |
8 | ||
|
State |
5 | 7 | (6) | |||||
|
Total Current |
1 | (45) | 2 | |||||
|
|
||||||||
|
Deferred: |
||||||||
|
Federal |
(1,312) | (145) | (126) | |||||
|
State |
(72) | (60) | (41) | |||||
|
Total Deferred |
(1,384) | (205) | (167) | |||||
|
Total income tax expense (benefit) |
(1,383) | (250) | (165) | |||||
|
|
||||||||
|
Income taxes charged (credited) to equity of Frontier: |
||||||||
|
Utilization of the benefits arising from restricted stock |
(1) | (5) |
- |
|||||
|
Deferred income taxes (benefits) arising from the recognition |
||||||||
|
of additional pension/OPEB liability |
7 | (21) | 36 | |||||
|
|
||||||||
|
Total income taxes charged (credited) to equity of Frontier |
6 | (26) | 36 | |||||
|
Total income taxes |
$ |
(1,377) |
$ |
(276) |
$ |
(129) | ||
|
|
||||||||
U.S. GAAP requires applying a “more likely than not” threshold to the recognition and derecognition of uncertain tax positions either taken or expected to be taken in Frontier’s income tax returns. The total amount of our gross tax liability for tax positions that may not be sustained under a “more likely than not” threshold amounts to $12 million as of December 31, 2017 including interest of $1 million. The amount of our uncertain tax positions, for which it is reasonably possible that the total amounts of unrecognized tax benefits will significantly increase or decrease during the next twelve months, and which would affect our effective tax rate, is $3 million as of December 31, 2017.
Frontier’s policy regarding the classification of interest and penalties is to include these amounts as a component of income tax expense. This treatment of interest and penalties is consistent with prior periods. We are subject
F-32
FRONTIER COMMUNICATIONS CORPORATION AND SUBSIDIARIES
Notes to Consolidated Financial Statements
to income tax examinations generally for the years 2013 forward for federal and 2008 forward for state filing jurisdictions. We also maintain uncertain tax positions in various state jurisdictions.
The following table sets forth the changes in Frontier’s balance of unrecognized tax benefits for the years ended December 31, 2017 and 2016:
|
|
||||||
|
($ in millions) |
2017 |
2016 |
||||
|
Unrecognized tax benefits - beginning of year |
$ |
16 |
$ |
19 | ||
|
Gross increases - prior year tax positions |
- |
3 | ||||
|
Gross increases - current year tax positions |
3 | 3 | ||||
|
Gross decreases - FIN 48 liability release |
(7) | (9) | ||||
|
Gross decreases - expired statute of limitations |
- |
- |
||||
|
Unrecognized tax benefits - end of year |
$ |
12 |
$ |
16 | ||
|
|
||||||
The amounts above exclude $1 million of accrued interest as of December 31, 2017 and 2016, respectively, that we have recorded and would be payable should Frontier’s tax positions not be sustained.
(13) Net Loss Per Common Share:
The reconciliation of the net loss per common share calculation for the years ended December 31, 2017, 2016 and 2015 is as follows:
|
|
||||||||
|
|
||||||||
|
($ in millions and shares in thousands, except per share amounts) |
2017 |
2016 |
2015 |
|||||
|
|
||||||||
|
Net loss used for basic and diluted earnings (loss) |
||||||||
|
per share: |
||||||||
|
Net loss attributable to Frontier common shareholders |
$ |
(2,018) |
$ |
(587) |
$ |
(316) | ||
|
Less: Dividends paid on unvested restricted stock awards |
(2) | (3) | (3) | |||||
|
Total basic net loss attributable to Frontier |
||||||||
|
common shareholders |
$ |
(2,020) |
$ |
(590) |
$ |
(319) | ||
|
|
||||||||
|
Effect of loss related to dilutive stock units |
- |
- |
- |
|||||
|
Total diluted net loss attributable to Frontier |
||||||||
|
common shareholders |
$ |
(2,020) |
$ |
(590) |
$ |
(319) | ||
|
|
||||||||
|
Basic earnings (loss) per share: |
||||||||
|
Total weighted average shares and unvested restricted stock |
||||||||
|
awards outstanding - basic |
78,409 | 78,142 | 72,787 | |||||
|
Less: Weighted average unvested restricted stock awards |
(673) | (535) | (479) | |||||
|
Total weighted average shares outstanding - basic |
77,736 | 77,607 | 72,308 | |||||
|
|
||||||||
|
Basic net loss per share attributable to Frontier |
||||||||
|
common shareholders |
$ |
(25.99) |
$ |
(7.61) |
$ |
(4.41) | ||
|
Diluted earnings (loss) per share: |
||||||||
|
Total weighted average shares outstanding - basic |
77,736 | 77,607 | 72,308 | |||||
|
Effect of dilutive shares |
- |
- |
- |
|||||
|
Total weighted average shares outstanding - diluted |
77,736 | 77,607 | 72,308 | |||||
|
|
||||||||
|
Diluted net loss per share attributable to Frontier |
||||||||
|
common shareholders |
$ |
(25.99) |
$ |
(7.61) |
$ |
(4.41) | ||
|
|
||||||||
F-33
FRONTIER COMMUNICATIONS CORPORATION AND SUBSIDIARIES
Notes to Consolidated Financial Statements
In calculating diluted net loss per common share for the years ended December 31, 2017, 2016, and 2015 the effect of all common stock equivalents is excluded from the computation as the effect would be antidilutive.
Stock Options
For the years ended December 31, 2017, 2016 and 2015, options to purchase 1,334, 2,667 and 3,333 shares, respectively, issuable under employee compensation plans were excluded from the computation of diluted earnings (loss) per share (EPS) for those periods because the exercise prices were greater than the average market price of our common stock and, therefore, the effect would be antidilutive.
Stock Units
At December 31, 2017, 2016 and 2015, we had 203,952, 125,431, and 95,812 stock units, respectively, issued under the Director Plans and the 2013 EIP. These securities have not been included in the diluted income per share of common stock calculation because their inclusion would have an antidilutive effect.
Mandatory Convertible Preferred Stock
The impact of the common share equivalents associated with approximately 19,250,000 shares of Series A Preferred stock described above were not included in the calculation of diluted EPS as of December 31, 2017 and 2016, as their impact was antidilutive.
F-34
FRONTIER COMMUNICATIONS CORPORATION AND SUBSIDIARIES
Notes to Consolidated Financial Statements
(14) Comprehensive Loss:
Comprehensive income (loss) consists of net income (loss) and other gains and losses affecting shareholders’ investment and pension/postretirement benefit (OPEB) liabilities that, under GAAP, are excluded from net income/(loss).
The components of accumulated other comprehensive loss, net of tax at December 31, 2017, 2016 and 2015, and changes for the years then ended, are as follows:
|
|
|||||||||
|
($ in millions) |
Pension Costs |
OPEB Costs |
Total |
||||||
|
Balance at December 31, 2014 (a) |
$ |
(330) |
$ |
(74) |
$ |
(404) | |||
|
Other comprehensive income (loss) before reclassifications |
(51) | 82 | 31 | ||||||
|
Amounts reclassified from accumulated other comprehensive income (loss) |
18 | 2 | 20 | ||||||
|
Net current-period other comprehensive income (loss) |
(33) | 84 | 51 | ||||||
|
Balance at December 31, 2015 (a) |
(363) | 10 | (353) | ||||||
|
Other comprehensive income (loss) before reclassifications |
(65) | 11 | (54) | ||||||
|
Amounts reclassified from accumulated other comprehensive income (loss) |
25 | (5) | 20 | ||||||
|
Net current-period other comprehensive income (loss) |
(40) | 6 | (34) | ||||||
|
Balance at December 31, 2016 (a) |
(403) | 16 | (387) | ||||||
|
Other comprehensive income (loss) before reclassifications |
(12) | (31) | (43) | ||||||
|
Amounts reclassified from accumulated other comprehensive income (loss) |
70 | (6) | 64 | ||||||
|
Net current-period other comprehensive income (loss) |
58 | (37) | 21 | ||||||
|
Balance at December 31, 2017 (a) |
$ |
(345) |
$ |
(21) |
$ |
(366) | |||
|
|
|||||||||
|
(a) |
Pension and OPEB amounts are net of deferred tax balances of $223 million, $231 million, $211 million, and $247 million as of December 31, 2017, 2016, 2015, and 2014, respectively |
As a result of the pension settlement accounting discussed in Note 17, Frontier recorded pension settlement charges totaling $83 million ($51 million net of tax), which were reclassified from accumulated Other comprehensive income (loss) during 2017.
As a result of the CTF Acquisition, the Frontier Communications Pension Plan (the Plan) was remeasured. This remeasurement resulted in a decrease in the discount rate from 4.50% at December 31, 2015 to 4.00% at the date of the CTF Acquisition. This change in the discount rate resulted in a remeasurement charge to Other comprehensive income (loss) of $105 million during 2016.
F-35
FRONTIER COMMUNICATIONS CORPORATION AND SUBSIDIARIES
Notes to Consolidated Financial Statements
The significant items reclassified from each component of accumulated other comprehensive loss for the years ended December 31, 2017, 2016 and 2015 are as follows:
|
|
|||||||||||
|
|
Amount Reclassified from |
||||||||||
|
($ in millions) |
Accumulated Other Comprehensive Loss (a) |
||||||||||
|
|
|||||||||||
|
Details about Accumulated Other Comprehensive Loss Components |
2017 |
2016 |
2015 |
Affected Line Item in the Statement Where Net loss is Presented |
|||||||
|
|
|||||||||||
|
Amortization of Pension Cost Items (b) |
|||||||||||
|
Actuarial gains (losses) |
$ |
(30) |
$ |
(40) |
$ |
(29) | |||||
|
Pension settlement costs |
(83) |
- |
- |
||||||||
|
Reclassifications, pretax |
(113) | (40) | (29) |
loss before income taxes |
|||||||
|
Tax Impact |
43 | 15 | 11 |
Income tax (expense) benefit |
|||||||
|
Reclassifications, net of tax |
$ |
(70) |
$ |
(25) |
$ |
(18) |
Net loss |
||||
|
|
|||||||||||
|
Amortization of OPEB Cost Items (b) |
|||||||||||
|
Prior-service credits/(costs) |
$ |
9 |
$ |
9 |
$ |
5 | |||||
|
Actuarial gains (losses) |
- |
(1) | (8) | ||||||||
|
Reclassifications, pretax |
9 | 8 | (3) |
loss before income taxes |
|||||||
|
Tax impact |
(3) | (3) | 1 |
Income tax (expense) benefit |
|||||||
|
Reclassifications, net of tax |
$ |
6 |
$ |
5 |
$ |
(2) |
Net loss |
||||
|
|
|||||||||||
(a) Amounts in parentheses indicate losses.
(b) These accumulated other comprehensive loss components are included in the computation of net periodic pension and OPEB costs (see Note 17 - Retirement Plans for additional details).
(15) Segment Information:
We operate in one operating and one reportable segment. Frontier provides both regulated and unregulated voice, data and video services to consumer and commercial customers and is typically the incumbent voice services provider in its service areas.
(16) Quarterly Financial Data (Unaudited):
|
($ in millions, except per share amounts) |
First Quarter |
Second Quarter |
Third Quarter |
Fourth Quarter |
Total Year |
||||||||||
|
2017 |
|||||||||||||||
|
|
|||||||||||||||
|
Revenue |
$ |
2,356 |
$ |
2,304 |
$ |
2,251 |
$ |
2,217 |
$ |
9,128 | |||||
|
|
|||||||||||||||
|
Operating income (loss) |
271 | (394) | 309 | (1,754) | (1,568) | ||||||||||
|
|
|||||||||||||||
|
Net loss attributable to Frontier |
|||||||||||||||
|
common shareholders (1) (2) |
(129) | (715) | (92) | (1,082) | (2,018) | ||||||||||
|
|
|||||||||||||||
|
Basic net loss per share attributable |
|||||||||||||||
|
to Frontier common shareholders(1) (2) |
$ |
(1.67) |
$ |
(9.20) |
$ |
(1.19) |
$ |
(13.91) |
$ |
(25.99) | |||||
|
|
|||||||||||||||
|
Diluted net loss per share attributable |
|||||||||||||||
|
to Frontier common shareholders(1) (2) |
$ |
(1.67) |
$ |
(9.21) |
$ |
(1.19) |
$ |
(13.91) |
$ |
(25.99) | |||||
|
(1) |
During the fourth quarter of 2017, we recorded a goodwill impairment charge of $2,078 million ($1,822 million after-tax). Refer to Note 6 for further details. |
|
(2) |
The quarterly net loss per share amounts are rounded to the nearest cent. Annual net loss per share may vary depending on the effect of such rounding. |
F-36
FRONTIER COMMUNICATIONS CORPORATION AND SUBSIDIARIES
Notes to Consolidated Financial Statements
|
|
|||||||||||||||
|
($ in millions, except per share amounts) |
First Quarter |
Second Quarter |
Third Quarter |
Fourth Quarter |
Total Year |
||||||||||
|
|
|||||||||||||||
|
2016 |
|||||||||||||||
|
|
|||||||||||||||
|
Revenue |
$ |
1,355 |
$ |
2,608 |
$ |
2,524 |
$ |
2,409 |
$ |
8,896 | |||||
|
|
|||||||||||||||
|
Operating income |
58 | 311 | 264 | 255 | 888 | ||||||||||
|
|
|||||||||||||||
|
Net loss attributable to Frontier |
|||||||||||||||
|
common shareholders (1) (2) (4) |
(240) | (80) | (134) | (133) | (587) | ||||||||||
|
|
|||||||||||||||
|
Basic net loss per share attributable |
|||||||||||||||
|
to Frontier common shareholders(1) (2) (3) (4) |
$ |
(3.10) |
$ |
(1.05) |
$ |
(1.73) |
$ |
(1.73) |
$ |
(7.61) | |||||
|
|
|||||||||||||||
|
Diluted net loss per share attributable |
|||||||||||||||
|
to Frontier common shareholders(1) (2) (3) (4) |
$ |
(3.10) |
$ |
(1.05) |
$ |
(1.73) |
$ |
(1.73) |
$ |
(7.61) | |||||
|
|
|||||||||||||||
|
(1) |
During the fourth quarter of 2016, we recorded acquisition and integration expenses of $49 million ($48 million after-tax) related to the CTF acquisition in June 2016. |
|
(2) |
During the fourth quarter of 2016, we recorded restructuring costs and other charges of $80 million ($52 million after-tax) related to severance expense and special termination benefits resulting from a reduction in the workforce. |
|
(3) |
The quarterly net loss per share amounts are rounded to the nearest cent. Annual net loss per share may vary depending on the effect of such rounding. |
|
(4) |
The change in revenue, operating income, net loss, and net loss per share during the second quarter of 2016 and each subsequent quarter of 2016 reflects additional results of the CTF Operations related to the CTF Acquisition, as described further in Note 3. |
(17) Retirement Plans:
We sponsor a noncontributory defined benefit pension plan covering a significant number of our former and current employees and other postretirement benefit plans that provide medical, dental, life insurance and other benefits for covered retired employees and their beneficiaries and covered dependents. The pension plan and postretirement benefit plans are closed to the majority of our newly hired employees. The benefits are based on years of service and final average pay or career average pay. Contributions are made in amounts sufficient to meet ERISA funding requirements while considering tax deductibility. Plan assets are invested in a diversified portfolio of equity and fixed-income securities and alternative investments.
The accounting results for pension and other postretirement benefit costs and obligations are dependent upon various actuarial assumptions applied in the determination of such amounts. These actuarial assumptions include the following: discount rates, expected long-term rate of return on plan assets, future compensation increases, employee turnover, healthcare cost trend rates, expected retirement age, optional form of benefit and mortality. We review these assumptions for changes annually with our independent actuaries. We consider our discount rate and expected long-term rate of return on plan assets to be our most critical assumptions.
The discount rate is used to value, on a present value basis, our pension and other postretirement benefit obligations as of the balance sheet date. The same rate is also used in the interest cost component of the pension and postretirement benefit cost determination for the following year. The measurement date used in the selection of our discount rate is the balance sheet date. Our discount rate assumption is determined annually with assistance from our independent actuaries based on the pattern of expected future benefit payments and the prevailing rates available on long-term, high quality corporate bonds that approximate the benefit obligation.
As of December 31, 2017, 2016 and 2015, we utilized an estimation technique that is based upon a settlement model (Bond:Link) that permits us to closely match cash flows to the expected payments to participants. This rate can change from year-to-year based on market conditions that affect corporate bond yields.
As a result of the technique described above, Frontier is utilizing a discount rate of 3.70% as of December 31, 2017 for its qualified pension plan, compared to rates of 4.10% and 4.50% in 2016 and 2015, respectively. The discount rate for postretirement plans as of December 31, 2017 was a range of 3.70% to 3.80% compared to a range of 4.10% to 4.30% in 2016 and 4.50% to 4.70% in 2015.
F-37
FRONTIER COMMUNICATIONS CORPORATION AND SUBSIDIARIES
Notes to Consolidated Financial Statements
The Pension Plan contains provisions that provide certain employees with the option of receiving a lump sum payment upon retirement. Frontier’s accounting policy is to record these payments as a settlement only if, in the aggregate, they exceed the sum of the annual service and interest costs for the Pension Plan’s net periodic pension benefit cost. During year ended December 31, 2017, lump sum pension settlement payments to terminated or retired individuals amounted to $486 million, which exceeded the settlement threshold of $224 million, and as a result, Frontier recognized non-cash settlement charges totaling $83 million during 2017. The non-cash charge accelerated the recognition of a portion of the previously unrecognized actuarial losses in the Pension Plan. These non-cash charges increased our recorded net loss and accumulated deficit, with an offset to accumulated other comprehensive loss in shareholders’ equity.
As a result of the CTF Acquisition, the Frontier Communications Pension Plan (the Plan) was remeasured. This remeasurement resulted in a decrease in the discount rate from 4.50% at December 31, 2015 to 4.00% at the date of the CTF Acquisition. This change in the discount rate resulted in a remeasurement charge to other comprehensive income (loss) of $105 million during 2016.
The expected long-term rate of return on plan assets is applied in the determination of periodic pension and postretirement benefit cost as a reduction in the computation of the expense. In developing the expected long-term rate of return assumption, we considered published surveys of expected market returns, 10 and 20 year actual returns of various major indices, and our own historical 5 year, 10 year and 20 year investment returns. The expected long-term rate of return on plan assets is based on an asset allocation assumption of 40% in long-duration fixed income securities, and 60% in equity securities and other investments. We review our asset allocation at least annually and make changes when considered appropriate. Our pension asset investment allocation decisions are made by the Retirement Investment & Administration Committee (RIAC), a committee comprised of members of management, pursuant to a delegation of authority by the Retirement Plan Committee of the Board of Directors. The RIAC is responsible for reporting its actions to the Retirement Plan Committee. Asset allocation decisions take into account expected market return assumptions of various asset classes as well as expected pension benefit payment streams. When analyzing anticipated benefit payments, management considers both the absolute amount of the payments as well as the timing of such payments. In 2017, 2016 and 2015, our expected long-term rate of return on plan assets was 7.50%, 7.50%, and 7.75%, respectively. For 2018, we will assume a rate of return of 7.50%. Our pension plan assets are valued at fair value as of the measurement date. The measurement date used to determine pension and other postretirement benefit measures for the pension plan and the postretirement benefit plan is December 31. The remeasured funded status of the Pension Plan was approximately 80%, as of December 31, 2017, similar to December 31, 2016.
F-38
FRONTIER COMMUNICATIONS CORPORATION AND SUBSIDIARIES
Notes to Consolidated Financial Statements
Pension Benefits
The following tables set forth the pension plan’s projected benefit obligations, fair values of plan assets and the pension benefit liability recognized on our consolidated balance sheets as of December 31, 2017 and 2016 and the components of total pension benefit cost for the years ended December 31, 2017, 2016 and 2015:
|
|
|||||
|
($ in millions) |
2017 |
2016 |
|||
|
|
|||||
|
Change in projected benefit obligation (PBO) |
|||||
|
PBO at beginning of year |
$ |
3,465 |
$ |
2,142 | |
|
Service cost |
97 | 88 | |||
|
Interest cost |
127 | 122 | |||
|
Actuarial (gain)/loss |
214 | 137 | |||
|
Benefits paid |
(59) | (155) | |||
|
CTF Acquisition PBO |
- |
1,108 | |||
|
Settlements |
(486) |
- |
|||
|
Special termination benefits |
5 | 23 | |||
|
PBO at end of year |
$ |
3,363 |
$ |
3,465 | |
|
|
|||||
|
Change in plan assets |
|||||
|
Fair value of plan assets at beginning of year |
$ |
2,766 |
$ |
1,572 | |
|
Fair value of plan assets for the CTF operations as of acquisition date |
- |
1,120 | |||
|
Actual return on plan assets |
378 | 201 | |||
|
Employer contributions |
206 | 28 | |||
|
Settlements |
(486) |
- |
|||
|
Differential payment received from Verizon |
(131) |
- |
|||
|
Benefits paid |
(59) | (155) | |||
|
Fair value of plan assets at end of year |
$ |
2,674 |
$ |
2,766 | |
|
|
|||||
|
Funded status |
$ |
(689) |
$ |
(699) | |
|
|
|||||
|
Amounts recognized in the consolidated balance sheet |
|||||
|
Pension and other postretirement benefits - current |
$ |
- |
$ |
- |
|
|
Pension and other postretirement benefits - noncurrent |
$ |
(689) |
$ |
(699) | |
|
Accumulated other comprehensive loss |
$ |
556 |
$ |
647 | |
|
|
|||||
In connection with the completion of the CTF Acquisition, certain employees were transferred to the Frontier Communications Pension Plan (the Plan) effective April 1, 2016. Assets of $1,108 million related to the CTF Acquisition were transferred from Verizon and the Verizon pension plan trusts during 2016.
|
|
|||||||||
|
($ in millions) |
2017 |
2016 |
2015 |
||||||
|
|
|||||||||
|
Components of total pension benefit cost |
|||||||||
|
Service cost |
$ |
97 |
$ |
88 |
$ |
55 | |||
|
Interest cost on projected benefit obligation |
127 | 122 | 88 | ||||||
|
Expected return on plan assets |
(186) | (168) | (129) | ||||||
|
Amortization of unrecognized loss |
30 | 40 | 29 | ||||||
|
Net periodic pension benefit cost |
68 | 82 | 43 | ||||||
|
Pension settlement costs |
83 |
- |
- |
||||||
|
Special termination benefits |
5 | 23 |
- |
||||||
|
Total pension benefit cost |
$ |
156 |
$ |
105 |
$ |
43 | |||
|
|
|||||||||
F-39
FRONTIER COMMUNICATIONS CORPORATION AND SUBSIDIARIES
Notes to Consolidated Financial Statements
The expected amortization of deferred unrecognized loss, included in Other comprehensive income, in 2018 is $26 million.
We capitalized $26 million, $25 million and $20 million of pension and OPEB expense into the cost of our capital expenditures during the years ended December 31, 2017, 2016 and 2015, respectively, as the costs relate to our engineering and plant construction activities.
The plan’s weighted average asset allocations at December 31, 2017 and 2016 by asset category are as follows:
|
|
||||||||
|
|
2017 |
2016 |
||||||
|
Asset category: |
||||||||
|
Equity securities |
50 |
% |
50 |
% |
||||
|
Debt securities |
40 |
% |
38 |
% |
||||
|
Alternative investments |
10 |
% |
11 |
% |
||||
|
Cash and other |
- |
% |
1 |
% |
||||
|
Total |
100 |
% |
100 |
% |
||||
|
|
||||||||
The plan’s expected benefit payments over the next 10 years are as follows:
|
|
||||||
|
($ in millions) |
Amount |
|||||
|
2018 |
$ |
265 | ||||
|
2019 |
256 | |||||
|
2020 |
251 | |||||
|
2021 |
245 | |||||
|
2022 |
237 | |||||
|
2023-2027 |
1,122 | |||||
|
Total |
$ |
2,376 | ||||
|
|
||||||
We made total contributions to our pension plan of $75 million, net of the Differential (as defined below), during 2017.
As part of the CTF Acquisition, Verizon was required to make a cash payment to Frontier for the difference in assets initially transferred by Verizon into the Pension Plan and the related obligation (the Differential). In 2017, we received the $131 million Differential payment from Verizon, and have remitted an equivalent amount to the Pension Plan as of December 31, 2017. As the Differential was reflected as a receivable of the Pension Plan at December 31, 2016, the cash funding had no impact to plan assets.
See Note 7 for further discussion of a Frontier contribution of real estate property in 2016 with an aggregate fair value of $15 million for the purpose of funding a portion of its contribution obligations to the Plan. We made total cash contributions to our pension plan during 2016 and 2015 of $13 million and $62 million, respectively.
The accumulated benefit obligation for the plan was $3,363 million and $3,465 million at December 31, 2017 and 2016, respectively.
Assumptions used in the computation of annual pension costs and valuation of the year-end obligations were as follows:
|
|
|||||||||
|
|
2017 |
2016 |
2015 |
||||||
|
Discount rate - used at year end to value obligation |
3.70 |
% |
4.10 |
% |
4.50 |
% |
|||
|
Discount rate - used to compute annual cost |
4.10 |
% |
4.50 |
% |
4.10 |
% |
|||
|
Expected long-term rate of return on plan assets |
7.50 |
% |
7.50 |
% |
7.75 |
% |
|||
|
Rate of increase in compensation levels |
2.50 |
% |
2.50 |
% |
2.50 |
% |
|||
|
|
|||||||||
F-40
FRONTIER COMMUNICATIONS CORPORATION AND SUBSIDIARIES
Notes to Consolidated Financial Statements
Postretirement Benefits Other Than Pensions—“OPEB”
The following tables set forth the OPEB plans’ benefit obligations, fair values of plan assets and the postretirement benefit liability recognized on our consolidated balance sheets as of December 31, 2017 and 2016 and the components of total postretirement benefit cost for the years ended December 31, 2017, 2016 and 2015.
|
|
|||||
|
($ in millions) |
2017 |
2016 |
|||
|
|
|||||
|
Change in benefit obligation |
|||||
|
Benefit obligation at beginning of year |
$ |
925 |
$ |
626 | |
|
CTF Acquisition PBO |
- |
276 | |||
|
Service cost |
21 | 19 | |||
|
Interest cost |
40 | 37 | |||
|
Plan participants' contributions |
7 | 5 | |||
|
Actuarial (gain)/loss |
54 | (18) | |||
|
Benefits paid |
(31) | (23) | |||
|
Special termination benefits |
- |
3 | |||
|
Benefit obligation at end of year |
$ |
1,016 |
$ |
925 | |
|
|
|||||
|
Change in plan assets |
|||||
|
Fair value of plan assets at beginning of year |
$ |
- |
$ |
- |
|
|
Plan participants' contributions |
7 | 5 | |||
|
Employer contribution |
24 | 18 | |||
|
Benefits paid |
(31) | (23) | |||
|
Fair value of plan assets at end of year |
$ |
- |
$ |
- |
|
|
|
|||||
|
Funded status |
$ |
(1,016) |
$ |
(925) | |
|
|
|||||
|
Amounts recognized in the consolidated balance sheet |
|||||
|
Pension and other postretirement benefits - current |
$ |
(29) |
$ |
(23) | |
|
Pension and other postretirement benefits - noncurrent |
$ |
(987) |
$ |
(902) | |
|
Accumulated other comprehensive (gain)/loss |
$ |
33 |
$ |
(29) | |
|
|
|||||
F-41
FRONTIER COMMUNICATIONS CORPORATION AND SUBSIDIARIES
Notes to Consolidated Financial Statements
|
($ in millions) |
2017 |
2016 |
2015 |
||||||
|
|
|||||||||
|
Components of total postretirement benefit cost |
|||||||||
|
Service cost |
$ |
21 |
$ |
19 |
$ |
19 | |||
|
Interest cost on projected benefit obligation |
40 | 37 | 30 | ||||||
|
Amortization of prior service (credit)/costs |
(9) | (9) | (5) | ||||||
|
Amortization of unrecognized loss |
- |
1 | 8 | ||||||
|
Net periodic postretirement benefit cost |
52 | 48 | 52 | ||||||
|
Special termination benefits |
- |
3 |
- |
||||||
|
Total postretirement benefit cost |
$ |
52 |
$ |
51 |
$ |
52 | |||
|
|
|||||||||
The expected amortization of prior service credit in 2018 is $9 million and the expected amortization of unrecognized loss in 2018 is $2 million.
Assumptions used in the computation of annual OPEB costs and valuation of the year-end OPEB obligations were as follows:
|
|
||||||
|
|
2017 |
2016 |
2015 |
|||
|
Discount rate - used at year end to value obligation |
3.70% - 3.80% |
4.10% - 4.30% |
4.50% - 4.70% |
|||
|
Discount rate - used to compute annual cost |
4.10% - 4.30% |
4.50% - 4.70% |
4.10% - 4.20% |
|||
|
|
The OPEB plan’s expected benefit payments over the next 10 years are as follows:
|
|
|||||||||
|
($ in millions) |
Gross Benefit |
Medicare Part D Subsidy |
Total |
||||||
|
2018 |
$ |
30 |
$ |
- |
$ |
30 | |||
|
2019 |
37 |
- |
37 | ||||||
|
2020 |
44 |
- |
44 | ||||||
|
2021 |
49 |
- |
49 | ||||||
|
2022 |
52 |
- |
52 | ||||||
|
2023-2027 |
306 | 2 | 308 | ||||||
|
Total |
$ |
518 |
$ |
2 |
$ |
520 | |||
|
|
|||||||||
For purposes of measuring year-end benefit obligations, we used, depending on medical plan coverage for different retiree groups, a 6.75% annual rate of increase in the per-capita cost of covered medical benefits, gradually decreasing to 5.00% in the year 2025 and remaining at that level thereafter. The effect of a 1% increase in the assumed medical cost trend rates for each future year on the aggregate of the service and interest cost components of the total postretirement benefit cost would be $1 million and the effect on the accumulated postretirement benefit obligation for health benefits would be $22 million. The effect of a 1% decrease in the assumed medical cost trend rates for each future year on the aggregate of the service and interest cost components of the total postretirement benefit cost would be $(1) million and the effect on the accumulated postretirement benefit obligation for health benefits would be $(22) million.
F-42
FRONTIER COMMUNICATIONS CORPORATION AND SUBSIDIARIES
Notes to Consolidated Financial Statements
The amounts in accumulated other comprehensive (gain)/loss before tax that have not yet been recognized as components of net periodic benefit cost at December 31, 2017 and 2016 are as follows:
|
|
||||||||||||
|
|
Pension Plan |
OPEB |
||||||||||
|
($ in millions) |
2017 |
2016 |
2017 |
2016 |
||||||||
|
Net actuarial loss |
$ |
556 |
$ |
647 |
$ |
54 |
$ |
1 | ||||
|
Prior service cost/(credit) |
- |
- |
(21) | (30) | ||||||||
|
Total |
$ |
556 |
$ |
647 |
$ |
33 |
$ |
(29) | ||||
|
|
||||||||||||
The amounts recognized as a component of accumulated other comprehensive loss for the years ended December 31, 2017 and 2016 are as follows:
|
|
||||||||||||
|
|
Pension Plan |
OPEB |
||||||||||
|
($ in millions) |
2017 |
2016 |
2017 |
2016 |
||||||||
|
Accumulated other comprehensive (gain)/loss at |
||||||||||||
|
beginning of year |
$ |
647 |
$ |
584 |
$ |
(29) |
$ |
(20) | ||||
|
|
||||||||||||
|
Net actuarial gain/(loss) recognized during year |
(30) | (40) |
- |
(1) | ||||||||
|
Prior service (cost)/credit recognized during year |
- |
- |
9 | 9 | ||||||||
|
Net actuarial loss/(gain) occurring during year |
22 | 103 | 53 | (17) | ||||||||
|
Settlement loss recognized |
(83) |
- |
- |
- |
||||||||
|
Net amount recognized in comprehensive income |
||||||||||||
|
(loss) for the year |
(91) | 63 | 62 | (9) | ||||||||
|
Accumulated other comprehensive (gain)/loss at |
||||||||||||
|
end of year |
$ |
556 |
$ |
647 |
$ |
33 |
$ |
(29) | ||||
|
|
||||||||||||
401(k) Savings Plans
We sponsor employee retirement savings plans under section 401(k) of the Internal Revenue Code. The plans cover substantially all full-time employees. Under certain plans, we provide matching contributions. Employer contributions were $48 million, $48 million and $28 million for 2017, 2016 and 2015, respectively.
(18) Fair Value of Financial Instruments:
Fair value is defined under GAAP as the exit price associated with the sale of an asset or transfer of a liability in an orderly transaction between market participants at the measurement date. Valuation techniques used to measure fair value under GAAP must maximize the use of observable inputs and minimize the use of unobservable inputs. In addition, GAAP establishes a three-tier fair value hierarchy, which prioritizes the inputs used in measuring fair value.
The three input levels in the hierarchy of fair value measurements are defined by the FASB generally as follows:
Input Level Description of Input
Level 1 Observable inputs such as quoted prices in active markets for identical assets.
Level 2 Inputs other than quoted prices in active markets that are either directly or indirectly observable.
Level 3 Unobservable inputs in which little or no market data exists.
F-43
FRONTIER COMMUNICATIONS CORPORATION AND SUBSIDIARIES
Notes to Consolidated Financial Statements
The following tables represent Frontier’s pension plan assets measured at fair value on a recurring basis as of December 31, 2017 and 2016:
|
|
|||||||||||||
|
|
Fair Value Measurements at December 31, 2017 |
||||||||||||
|
($ in millions) |
Total |
Level 1 |
Level 2 |
Level 3 |
|||||||||
|
Cash and Cash Equivalents |
$ |
37 |
$ |
37 |
$ |
- |
$ |
- |
|||||
|
U.S. Government Obligations |
30 |
- |
30 |
- |
|||||||||
|
Corporate and Other Obligations |
448 |
- |
448 |
- |
|||||||||
|
Common Stock |
523 | 523 |
- |
- |
|||||||||
|
Common/Collective Trusts |
1,215 |
- |
1,215 |
- |
|||||||||
|
Interest in Registered Investment Companies |
324 | 324 |
- |
- |
|||||||||
|
Interest in Limited Partnerships and |
|||||||||||||
|
Limited Liability Companies |
115 |
- |
- |
115 | |||||||||
|
Total investments at fair value |
$ |
2,692 |
$ |
884 |
$ |
1,693 |
$ |
115 | |||||
|
Interest and Dividend Receivable |
6 | ||||||||||||
|
Due from Broker for Securities Sold |
40 | ||||||||||||
|
Receivable Associated with Insurance Contract |
7 | ||||||||||||
|
Due to Broker for Securities Purchased |
(71) | ||||||||||||
|
Total Plan Assets, at Fair Value |
$ |
2,674 | |||||||||||
|
|
|||||||||||||
|
|
|||||||||||||
|
|
Fair Value Measurements at December 31, 2016 |
||||||||||||
|
($ in millions) |
Total |
Level 1 |
Level 2 |
Level 3 |
|||||||||
|
Cash and Cash Equivalents |
$ |
42 |
$ |
42 |
$ |
- |
$ |
- |
|||||
|
U.S. Government Obligations |
29 |
- |
29 |
- |
|||||||||
|
Corporate and Other Obligations |
400 |
- |
400 |
- |
|||||||||
|
Common Stock |
487 | 487 |
- |
- |
|||||||||
|
Common/Collective Trusts |
1,104 |
- |
1,104 |
- |
|||||||||
|
Interest in Registered Investment Companies |
334 | 334 |
- |
- |
|||||||||
|
Interest in Limited Partnerships and |
|||||||||||||
|
Limited Liability Companies |
118 |
- |
- |
118 | |||||||||
|
Total investments at fair value |
$ |
2,514 |
$ |
863 |
$ |
1,533 |
$ |
118 | |||||
|
Receivable for plan assets of the CTF Operations |
258 | ||||||||||||
|
Interest and Dividend Receivable |
6 | ||||||||||||
|
Due from Broker for Securities Sold |
27 | ||||||||||||
|
Receivable Associated with Insurance Contract |
7 | ||||||||||||
|
Due to Broker for Securities Purchased |
(46) | ||||||||||||
|
Total Plan Assets, at Fair Value |
$ |
2,766 | |||||||||||
|
|
|||||||||||||
F-44
FRONTIER COMMUNICATIONS CORPORATION AND SUBSIDIARIES
Notes to Consolidated Financial Statements
There have been no reclassifications of investments between Levels 1, 2 or 3 assets during the years ended December 31, 2017 or 2016.
The tables below set forth a summary of changes in the fair value of the Plan’s Level 3 assets for the years ended December 31, 2017 and 2016:
|
|
|||||||
|
|
Interest in Limited Partnerships and Limited Liability Companies |
||||||
|
($ in millions) |
2017 |
2016 |
|||||
|
Balance, beginning of year |
$ |
118 |
$ |
92 | |||
|
Realized gains |
12 | 7 | |||||
|
Unrealized gains/(losses) |
(2) | 13 | |||||
|
Purchases |
- |
15 | |||||
|
Sales and distributions |
(13) | (9) | |||||
|
Balance, end of year |
$ |
115 |
$ |
118 | |||
|
|
|||||||
F-45
FRONTIER COMMUNICATIONS CORPORATION AND SUBSIDIARIES
Notes to Consolidated Financial Statements
The following table provides further information regarding the redemption of the Plan’s Level 3 investments as well as information related to significant unobservable inputs and the range of values for those inputs for the Plan’s interest in certain limited partnerships and limited liability companies as of December 31, 2017:
|
|
||||||||||
|
|
||||||||||
|
($ in millions) |
Fair Value |
Liquidation Period |
Capitalization Rate |
|||||||
|
Interest in Limited Partnerships and Limited |
||||||||||
|
Liability Companies (d) |
||||||||||
|
|
||||||||||
|
MS IFHF SVP LP Cayman (a) |
$ |
1 |
5 years |
N/A |
||||||
|
MS IFHF SVP LP Alpha (a) |
1 |
5 years |
N/A |
|||||||
|
RII World Timberfund, LLC (b) |
5 |
10 years |
N/A |
|||||||
|
426 E Casino Road, LLC (c) |
15 |
N/A |
7.00% |
|||||||
|
100 Comm Drive, LLC (c) |
9 |
N/A |
8.00% |
|||||||
|
100 CTE Drive, LLC (c) |
10 |
N/A |
9.50% |
|||||||
|
6430 Oakbrook Parkway, LLC (c) |
26 |
N/A |
7.75% |
|||||||
|
8001 West Jefferson, LLC (c) |
26 |
N/A |
8.75% |
|||||||
|
1500 MacCorkle Ave SE, LLC (c) |
14 |
N/A |
8.50% |
|||||||
|
400 S. Pike Road West, LLC (c) |
1 |
N/A |
8.50% |
|||||||
|
601 N US 131, LLC (c) |
1 |
N/A |
9.50% |
|||||||
|
9260 E. Stockton Blvd., LLC (c) |
6 |
N/A |
7.50% |
|||||||
|
Total Interest in Limited Partnerships and Limited |
||||||||||
|
Liability Companies |
$ |
115 | ||||||||
|
|
||||||||||
|
(a) |
The partnerships’ investment objective is to seek capital appreciation principally through investing in investment funds managed by third party investment managers who employ a variety of alternative investment strategies. These instruments are subject to certain withdrawal restrictions. The Plan is in the process of liquidating its interest in the partnerships and distributions are expected to be made over the next four years. |
|
(b) |
The fund’s objective is to realize substantial long-term capital appreciation by investing in timberland properties primarily in South America and Australia. This investment is subject to certain withdrawal restrictions. |
|
(c) |
The entity invests in commercial real estate properties that are leased to Frontier. The leases are triple net, whereby Frontier is responsible for all expenses, including but not limited to, insurance, repairs and maintenance and payment of property taxes. |
|
(d) |
All Level 3 investments have the same redemption frequency (through the liquidation of underlying investments) and redemption notice period (none). |
F-46
FRONTIER COMMUNICATIONS CORPORATION AND SUBSIDIARIES
Notes to Consolidated Financial Statements
The following table summarizes the carrying amounts and estimated fair values for long-term debt at December 31, 2017 and 2016. For the other financial instruments including cash, accounts receivable, restricted cash, long-term debt due within one year, accounts payable and other current liabilities, the carrying amounts approximate fair value due to the relatively short maturities of those instruments.
|
|
||||||||||||
|
|
2017 |
2016 |
||||||||||
|
|
||||||||||||
|
|
Carrying |
Carrying |
||||||||||
|
($ in millions) |
Amount |
Fair Value |
Amount |
Fair Value |
||||||||
|
|
||||||||||||
|
Long-term debt |
$ |
16,970 |
$ |
13,994 |
$ |
17,560 |
$ |
17,539 | ||||
The fair value of our long-term debt is estimated based upon quoted market prices at the reporting date for those financial instruments.
(19) Commitments and Contingencies:
Although from time to time we make short-term purchasing commitments to vendors with respect to capital expenditures, we generally do not enter into firm, written contracts for such activities.
In June 2015, Frontier accepted the Federal Communications Commission’s (FCC) offer of support to price cap carriers under the Connect America Fund (CAF) Phase II program, which is intended to provide long-term support for broadband in high cost unserved or underserved areas. This program provides $332 million in annual support, including $49 million in annual support related to the properties acquired in the CTF Acquisition, through 2020 to make available 10 Mbps downstream/1 Mbps upstream broadband service to approximately 774,000 households across certain of the 29 states where we now operate. To the extent we do not enable the required number of households with 10 Mbps downstream/1 Mbps upstream broadband service by the end of the CAF Phase II term, we will be required to return a portion of the funds previously received.
On April 28, 2016, the FCC completed its inquiry into whether certain terms and conditions contained in specifically identified special access tariff pricing plans offered by four carriers, including Frontier, are just and reasonable. The FCC held that certain of the tariff terms for business data TDM services, specifically DS1s and DS3s, were unreasonable. Specifically, the FCC struck down “excessive” early termination fees and “all-or-nothing” provisions. Frontier has revised its tariffs in accordance with the FCC’s Order. The FCC’s decision has no retroactive effect, and we anticipate no material impact to Frontier from it.
The FCC deferred the issue of how its ruling will affect customers currently purchasing services from these tariffs to a Notice of Proposed Rulemaking. It is seeking comment on proposed changes to the way the FCC regulates traditional special access services and, on a proposal, to adopt pricing rules for Ethernet services in markets that are found to be “noncompetitive.” The potential impact to Frontier of this proceeding is unknown, though any pending initiative could adversely affect our operations or financial results.
We are party to various legal proceedings (including individual, class and putative class actions, governmental investigations) arising in the normal course of our business covering a wide range of matters and types of claims including, but not limited to, general contracts, billing disputes, rights of access, taxes and surcharges, consumer protection, advertising, trademark and patent infringement, employment, regulatory, tort, claims of competitors and disputes with other carriers. Litigation is subject to uncertainty and the outcome of individual matters is not predictable. However, we believe that the ultimate resolution of all such matters, after considering insurance coverage or other indemnities to which we are entitled, will not have a material adverse effect on our financial position, results of operations, or cash flows.
In October 2013, the California Attorney General’s Office notified certain Verizon companies, including one of the subsidiaries that we acquired in the CTF Acquisition, of potential violations of California state hazardous waste statutes primarily arising from the disposal of electronic components, batteries and aerosol cans at certain California facilities. We are cooperating with this investigation. We have accrued an amount for potential penalties that we deem to be probable and reasonably estimated, and we do not expect that any potential penalties, if ultimately incurred, will be material in comparison to the established accrual.
F-47
FRONTIER COMMUNICATIONS CORPORATION AND SUBSIDIARIES
Notes to Consolidated Financial Statements
We accrue an expense for pending litigation when we determine that an unfavorable outcome is probable, and the amount of the loss can be reasonably estimated. Legal defense costs are expensed as incurred. None of our existing accruals for pending matters, after considering insurance coverage, is material. We monitor our pending litigation for the purpose of adjusting our accruals and revising our disclosures accordingly, when required. Litigation is, however, subject to uncertainty, and the outcome of any particular matter is not predictable. We will vigorously defend our interests in pending litigation, and as of this date, we believe that the ultimate resolution of all such matters, after considering insurance coverage or other indemnities to which we are entitled, will not have a material adverse effect on our consolidated financial position, results of operations, or our cash flows.
We conduct certain of our operations in leased premises and also lease certain equipment and other assets pursuant to operating leases. The lease arrangements have terms ranging from 1 to 99 years and several contain rent escalation clauses providing for increases in monthly rent at specific intervals. When rent escalation clauses exist, we record annual rental expense based on the total expected rent payments on a straight-line basis over the lease term. Certain leases also have renewal options. Renewal options that are reasonably assured are included in determining the lease term.
Future minimum rental commitments for all long-term noncancelable operating leases as of December 31, 2017 are as follows:
|
|
|||||||
|
($ in millions) |
Operating Leases |
||||||
|
Year ending December 31: |
|||||||
|
2018 |
$ |
80 | |||||
|
2019 |
25 | ||||||
|
2020 |
29 | ||||||
|
2021 |
26 | ||||||
|
2022 |
23 | ||||||
|
Thereafter |
388 | ||||||
|
Total minimum lease payments |
$ |
571 | |||||
|
|
|||||||
Total rental expense included in our consolidated statements of operations for the years ended December 31, 2017, 2016 and 2015 was $106 million, $137 million and $119 million, respectively.
We are party to contracts with several unrelated long-distance carriers. The contracts provide fees based on traffic they carry for us subject to minimum monthly fees.
At December 31, 2017, the estimated future payments for obligations under our noncancelable long-distance contracts and service agreements are as follows:
|
|
|||||
|
($ in millions) |
Amount |
||||
|
Year ending December 31: |
|||||
|
2018 |
$ |
37 | |||
|
2019 |
40 | ||||
|
2020 |
31 | ||||
|
2021 |
7 | ||||
|
2022 |
2 | ||||
|
Thereafter |
9 | ||||
|
Total |
$ |
126 | |||
|
|
|||||
F-48
FRONTIER COMMUNICATIONS CORPORATION AND SUBSIDIARIES
Notes to Consolidated Financial Statements
At December 31, 2017, we have outstanding performance letters of credit as follows:
|
|
||||||
|
($ in millions) |
Amount |
|||||
|
CNA Financial Corporation (CNA) |
$ |
49 | ||||
|
AIG Insurance |
114 | |||||
|
Zurich |
28 | |||||
|
All other |
1 | |||||
|
Total |
$ |
192 | ||||
|
|
||||||
CNA serves as our insurance carrier with respect to casualty claims (auto liability, general liability and workers’ compensation) with dates of loss prior to June 1, 2017 (except for those claims which arise out of the operations acquired from CTF that have dates of loss prior to April 1, 2016). As our insurance carrier, they administer the casualty claims and make claim payments on our behalf. We reimburse CNA for such services upon presentation of their invoice. To serve as our carrier and make payments on our behalf, CNA requires that we establish a letter of credit in their favor. CNA could potentially draw against this letter of credit if we failed to reimburse CNA in accordance with the terms of our agreement. The amount of the letter of credit is reviewed annually and adjusted based on claims history.
Zurich serves as our insurance carrier with respect to casualty claims (auto liability, general liability and workers’ compensation) with dates of loss from June 1, 2017 and going forward. As our insurance carrier, they administer the casualty claims and make claim payments on our behalf. We reimburse Zurich for such services upon presentation of their invoice. To serve as our carrier and make payments on our behalf, Zurich requires that we establish a letter of credit in their favor. Zurich could potentially draw against this letter of credit if we failed to reimburse Zurich in accordance with the terms of our agreement. The amount of the letter of credit is reviewed annually and adjusted based on claims history.
AIG Insurance serves as our insurance carrier with respect to casualty claims (auto liability, general liability and workers’ compensation) that were acquired from CTF, as well as new claims which arise out of the operations acquired from CTF that have dates of loss prior to April 1, 2016. Sedgwick, a third-party claims administrator, administers the casualty claims and make claim payments on our behalf. We reimburse Sedgwick for such services upon presentation of their invoice. However, to serve as our insurance carrier, AIG Insurance requires that we establish a letter of credit in their favor. AIG Insurance could potentially draw against this letter of credit if we failed to meet the insurance-related and claims-related obligations we assumed in accordance with the terms of our agreement. The amount of the letter of credit is reviewed annually and adjusted based on claims history.
F-49
Schedule of Pledged Subsidiary Financial Data
As of December 31, 2017, the Company’s secured indebtedness consisted of obligations under the JPM Credit Agreement, the 2014 CoBank Credit Agreement, the 2016 CoBank Credit Agreement and the LC Agreements, each of which is secured equally and ratably by pledges of the outstanding equity interests in certain of the Company’s wholly-owned subsidiaries (the “Original Pledged Subsidiaries”). The equity interests of the remaining subsidiaries of the Company are not pledged to secure the obligations under these debt agreements.
In connection with the 2018 Credit Amendment, the Company expanded the security package to include the pledge of the outstanding equity interests in certain wholly-owned subsidiaries of the Company not previously pledged (together with the Original Pledged Subsidiaries, the “Pledged Subsidiaries”).
The financial statements were prepared using Frontier’s historical basis in the assets and liabilities of the Pledged Subsidiaries, and its combined financial statements include all revenue, costs, assets, and liabilities directly attributable to the Pledged Subsidiaries. Historically, Frontier provided certain corporate services to the Pledged Subsidiaries and costs associated with these functions have been allocated to the Pledged Subsidiaries. Management believes these expenses have been allocated using reasonable allocation methodologies to the services provided, primarily based on relative percentage of total net sales, relative percentage of headcount, or specific identification.
The allocations may not reflect the expense the Pledged Subsidiaries would have incurred as a stand-alone company for the periods presented. Actual costs that may have been incurred if the Pledged Subsidiaries had been a stand-alone company would depend on a number of factors, including the chosen organizational structure, what functions were outsourced or performed by employees, and strategic decisions made in certain areas. The total shareholder’s equity represents Frontier’s interest in the Pledged Subsidiaries’ recorded net assets.
Allocated operating expenses include corporate costs, employee benefits (medical, dental and vision), 401(k) contributions, pension and postretirement benefits, stock-based compensation relating to restricted stock issuances, collections on receivables and acquisition and integration costs incurred by Frontier. Operating expenses, excluding depreciation expense, are allocated from Frontier primarily based on customer counts and headcount.
Taxes are allocated from Frontier based on the Pledged Subsidiaries’ relative contribution to the consolidated financial results.
The Pledged Subsidiaries are part of a centralized cash management system with Frontier in which cash received by Frontier on Pledged Subsidiaries’ behalf and cash disbursements made by Frontier on Pledged Subsidiaries’ behalf are recorded through intercompany accounts. These transactions include receipts and disbursements related to income taxes attributable to federal and state jurisdictions and capital expenditures, among others.
The following supplemental financial information presents the consolidating balance sheet information and statement of operations information of the Pledged Subsidiaries, all other Frontier entities, and the Pledged Subsidiaries and all other Frontier entities on a consolidated basis, as of and for the year ended December 31, 2017. A listing of the Pledged Subsidiaries is provided following the financial statements.
Schedule of Pledged Subsidiary Financial Data
CONSOLIDATING BALANCE SHEET INFORMATION
AS OF DECEMBER 31, 2017
($ in millions)
|
|
|||||||||||||
|
|
Pledged & Guarantors Subsidiaries |
All Other Entities |
Intercompany Eliminations |
Total Consolidated Frontier |
|||||||||
|
ASSETS |
|||||||||||||
|
Current assets: |
|||||||||||||
|
Cash and cash equivalents |
$ |
- |
$ |
362 |
$ |
- |
$ |
362 | |||||
|
Accounts receivable, less allowances of $69 |
650 | 199 | (30) | 819 | |||||||||
|
Notes receivable |
- |
67 | (67) |
- |
|||||||||
|
Prepaid expenses |
- |
109 | (31) | 78 | |||||||||
|
Income taxes and other current assets |
43 | 21 |
- |
64 | |||||||||
|
Total current assets |
693 | 758 | (128) | 1,323 | |||||||||
|
|
|||||||||||||
|
Property, plant and equipment, net |
11,546 | 2,831 |
- |
14,377 | |||||||||
|
Goodwill, net |
5,457 | 1,567 |
- |
7,024 | |||||||||
|
Other intangibles, net |
1,923 | 140 |
- |
2,063 | |||||||||
|
Other assets |
31 | 66 |
- |
97 | |||||||||
|
Receivable from (payable to) associated companies |
(3,486) | 1,788 | 1,698 |
- |
|||||||||
|
Investment in associated companies |
(15) | 11,894 | (11,879) |
- |
|||||||||
|
Total assets |
$ |
16,149 |
$ |
19,044 |
$ |
(10,309) |
$ |
24,884 | |||||
|
|
|||||||||||||
|
LIABILITIES AND EQUITY |
|||||||||||||
|
Current liabilities: |
|||||||||||||
|
Long-term debt due within one year |
$ |
- |
$ |
656 |
$ |
- |
$ |
656 | |||||
|
Accounts payable |
218 | 453 | (107) | 564 | |||||||||
|
Advanced billings |
236 | 47 | (13) | 270 | |||||||||
|
Accrued content costs |
- |
102 |
- |
102 | |||||||||
|
Accrued income and other taxes (1) |
577 | (421) |
- |
156 | |||||||||
|
Accrued interest |
16 | 385 |
- |
401 | |||||||||
|
Pension and other postretirement benefits |
- |
29 |
- |
29 | |||||||||
|
Other current liabilities |
116 | 214 |
- |
330 | |||||||||
|
Total current liabilities |
1,163 | 1,465 | (120) | 2,508 | |||||||||
|
|
|||||||||||||
|
Deferred income taxes |
1,226 | (87) |
- |
1,139 | |||||||||
|
Pension and other postretirement benefits |
- |
1,676 |
- |
1,676 | |||||||||
|
Other liabilities |
118 | 199 |
- |
317 | |||||||||
|
Long-term debt |
750 | 16,220 |
- |
16,970 | |||||||||
|
Income taxes accrued- total |
65 | (65) |
- |
- |
|||||||||
|
Advances from (to) associated companies |
340 | (2,038) | 1,698 |
- |
|||||||||
|
|
|||||||||||||
|
Equity: |
|||||||||||||
|
Common stock |
1,442 | (1,383) | (39) | 20 | |||||||||
|
Preferred stock |
- |
- |
- |
- |
|||||||||
|
Additional paid-in capital |
10,021 | 6,916 | (11,903) | 5,034 | |||||||||
|
Retained earnings (accumulated deficit) |
1,024 | (3,205) | (82) | (2,263) | |||||||||
|
Accumulated other comprehensive loss, net of tax |
- |
(375) | 9 | (366) | |||||||||
|
Treasury common stock |
- |
(279) | 128 | (151) | |||||||||
|
Total equity |
12,487 | 1,674 | (11,887) | 2,274 | |||||||||
|
Total liabilities and equity |
$ |
16,149 |
$ |
19,044 |
$ |
(10,309) |
$ |
24,884 | |||||
|
|
|||||||||||||
|
(1) |
Includes amounts receivable and payable from affiliated companies for income tax related balances. |
Schedule of Pledged Subsidiary Financial Data
CONSOLIDATING STATEMENT OF OPERATIONS INFORMATION
FOR THE YEAR ENDED DECEMBER 31, 2017
($ in millions)
|
|
|||||||||||||
|
|
Pledged & Guarantors Subsidiaries |
All Other Entities |
Intercompany Eliminations |
Total Consolidated Frontier |
|||||||||
|
|
|||||||||||||
|
Revenue |
$ |
7,502 |
$ |
1,724 |
$ |
(98) |
$ |
9,128 | |||||
|
|
|||||||||||||
|
Operating expenses: |
|||||||||||||
|
Network access expenses |
1,268 | 384 | (55) | 1,597 | |||||||||
|
Network related expenses |
1,719 | 260 | (20) | 1,959 | |||||||||
|
Selling, general and administrative expenses |
1,906 | 134 | (22) | 2,018 | |||||||||
|
Depreciation and amortization |
1,810 | 374 |
- |
2,184 | |||||||||
|
Goodwill impairment |
2,056 | 692 |
- |
2,748 | |||||||||
|
Acquisition and integration costs |
14 | 11 |
- |
25 | |||||||||
|
Pension settlement costs |
- |
83 |
- |
83 | |||||||||
|
Restructuring costs and other charges |
29 | 53 |
- |
82 | |||||||||
|
Total operating expenses |
8,802 | 1,991 | (97) | 10,696 | |||||||||
|
|
|||||||||||||
|
Operating loss |
(1,300) | (267) | (1) | (1,568) | |||||||||
|
|
|||||||||||||
|
Investment and other income, net |
(21) | 23 | 1 | 3 | |||||||||
|
Losses on early extinguishment of debt and debt exchanges |
- |
88 |
- |
88 | |||||||||
|
Interest expense |
54 | 1,480 |
- |
1,534 | |||||||||
|
|
|||||||||||||
|
Loss before income taxes |
(1,375) | (1,812) |
- |
(3,187) | |||||||||
|
Income tax expense (benefit) |
534 | (1,917) |
- |
(1,383) | |||||||||
|
|
|||||||||||||
|
Net income (loss) |
$ |
(1,909) |
$ |
105 |
$ |
- |
$ |
(1,804) | |||||
Schedule of Pledged Subsidiary Financial Data