Attached files
| file | filename |
|---|---|
| EX-99.1 - EX-99.1 - Cotiviti Holdings, Inc. | ex-99d1.htm |
| 8-K - 8-K - Cotiviti Holdings, Inc. | f8-k.htm |
Exhibit 99.2
|
|
2017 First Quarter Financial Supplement Analytics. Insight. Value. As of March 31, 2017 |
|
|
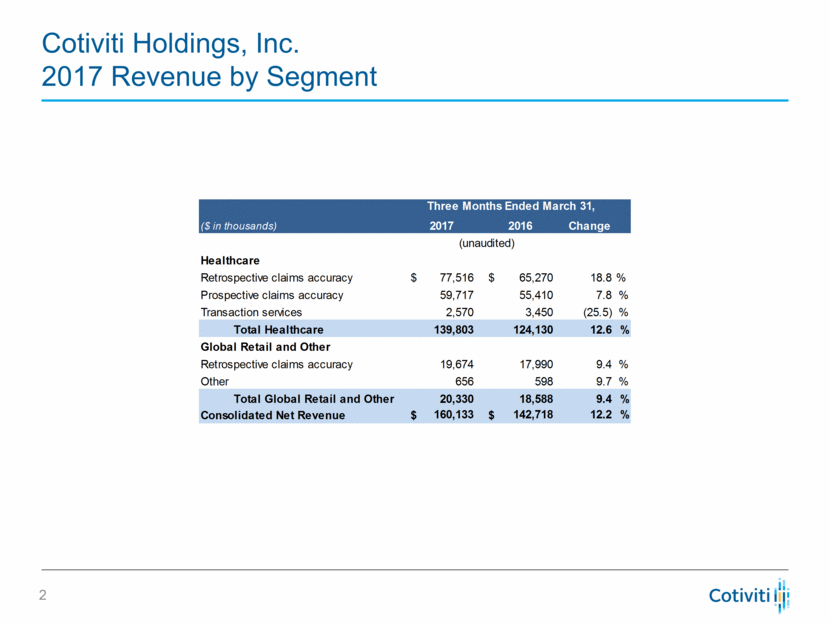
Cotiviti Holdings, Inc. 2017 Revenue by Segment Change Healthcare $ 77,516 $ 65,270 18.8 % 59,717 55,410 7.8 % 2,570 3,450 (25.5) % Total Healthcare 139,803 124,130 12.6 % Global Retail and Other 19,674 17,990 9.4 % Other 656 598 9.7 % 20,330 18,588 9.4 % $ 160,133 $ 142,718 12.2 % (unaudited) Three Months Ended March 31, Total Global Retail and Other Consolidated Net Revenue ($ in thousands) Retrospective claims accuracy Prospective claims accuracy Transaction services Retrospective claims accuracy 2016 2017 |
|
|
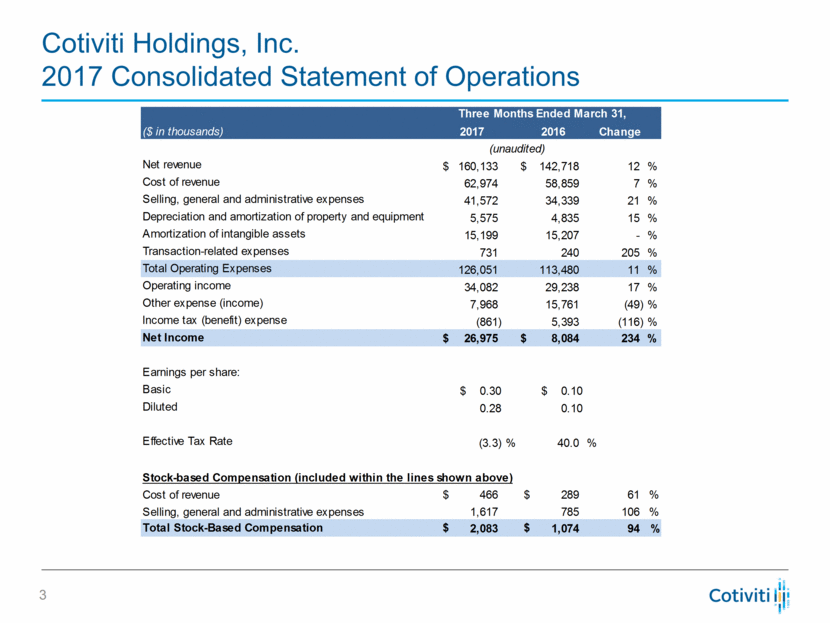
Cotiviti Holdings, Inc. 2017 Consolidated Statement of Operations ($ in thousands) Change Net revenue $ 160,133 $ 142,718 12 % Cost of revenue 62,974 58,859 7 % Selling, general and administrative expenses 41,572 34,339 21 % Depreciation and amortization of property and equipment 5,575 4,835 15 % Amortization of intangible assets 15,199 15,207 - % Transaction-related expenses 731 240 205 % Total Operating Expenses 126,051 113,480 11 % Operating income 34,082 29,238 17 % Other expense (income) 7,968 15,761 (49) % Income tax (benefit) expense (861) 5,393 (116) % Net Income $ 26,975 $ 8,084 234 % Earnings per share: Basic $ 0.30 $ 0.10 Diluted 0.28 0.10 Effective Tax Rate (3.3) % 40.0 % Cost of revenue $ 466 $ 289 61 % Selling, general and administrative expenses 1,617 785 106 % Total Stock-Based Compensation $ 2,083 $ 1,074 94 % Stock-based Compensation (included within the lines shown above) (unaudited) Three Months Ended March 31, 2017 2016 |
|
|
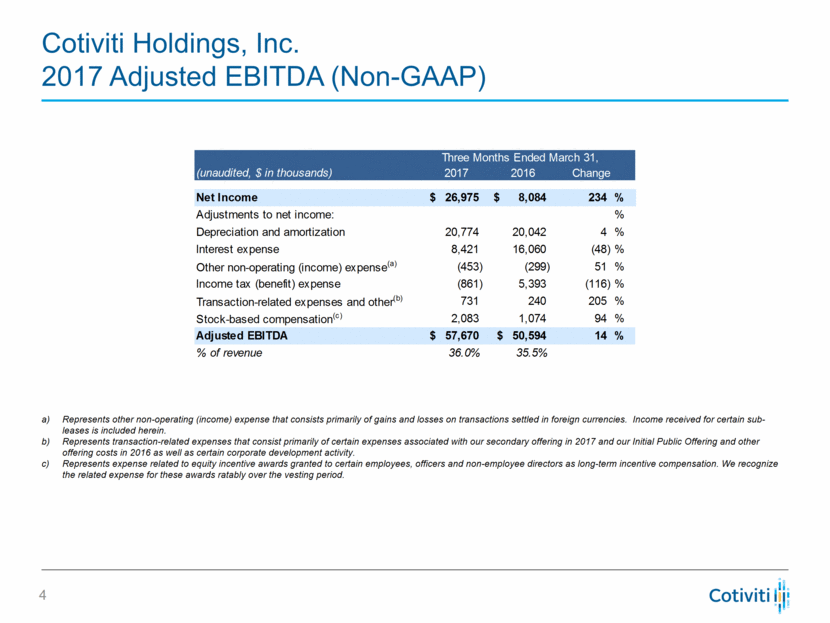
Cotiviti Holdings, Inc. 2017 Adjusted EBITDA (Non-GAAP) Represents other non-operating (income) expense that consists primarily of gains and losses on transactions settled in foreign currencies. Income received for certain sub-leases is included herein. Represents transaction-related expenses that consist primarily of certain expenses associated with our secondary offering in 2017 and our Initial Public Offering and other offering costs in 2016 as well as certain corporate development activity. Represents expense related to equity incentive awards granted to certain employees, officers and non‑employee directors as long‑term incentive compensation. We recognize the related expense for these awards ratably over the vesting period. Change Net Income $ 26,975 $ 8,084 234 % Adjustments to net income: % Depreciation and amortization 20,774 20,042 4 % Interest expense 8,421 16,060 (48) % Other non-operating (income) expense (a) (453) (299) 51 % Income tax (benefit) expense (861) 5,393 (116) % Transaction-related expenses and other (b) 731 240 205 % Stock-based compensation (c) 2,083 1,074 94 % Adjusted EBITDA $ 57,670 $ 50,594 14 % % of revenue 36.0% 35.5% (unaudited, $ in thousands) Three Months Ended March 31, 2017 2016 |
|
|
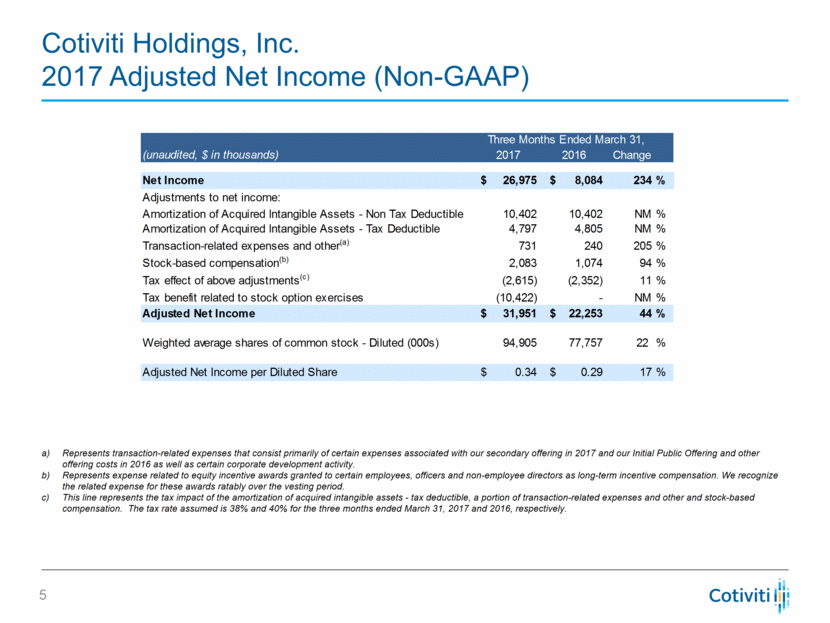
Cotiviti Holdings, Inc. 2017 Adjusted Net Income (Non-GAAP) Represents transaction-related expenses that consist primarily of certain expenses associated with our secondary offering in 2017 and our Initial Public Offering and other offering costs in 2016 as well as certain corporate development activity. Represents expense related to equity incentive awards granted to certain employees, officers and non‑employee directors as long‑term incentive compensation. We recognize the related expense for these awards ratably over the vesting period. This line represents the tax impact of the amortization of acquired intangible assets - tax deductible, a portion of transaction-related expenses and other and stock-based compensation. The tax rate assumed is 38% and 40% for the three months ended March 31, 2017 and 2016, respectively. Change Net Income $ 26,975 $ 8,084 234 % Adjustments to net income: Amortization of Acquired Intangible Assets - Non Tax Deductible 10,402 10,402 NM % Amortization of Acquired Intangible Assets - Tax Deductible 4,797 4,805 NM % Transaction-related expenses and other (a) 731 240 205 % Stock-based compensation (b) 2,083 1,074 94 % Tax effect of above adjustments (c) (2,615) (2,352) 11 % Tax benefit related to stock option exercises (10,422) - NM % Adjusted Net Income $ 31,951 $ 22,253 44 % Weighted average shares of common stock - Diluted (000s) 94,905 77,757 22 % Adjusted Net Income per Diluted Share $ 0.34 $ 0.29 17 % (unaudited, $ in thousands) 2017 2016 Three Months Ended March 31, |
|
|
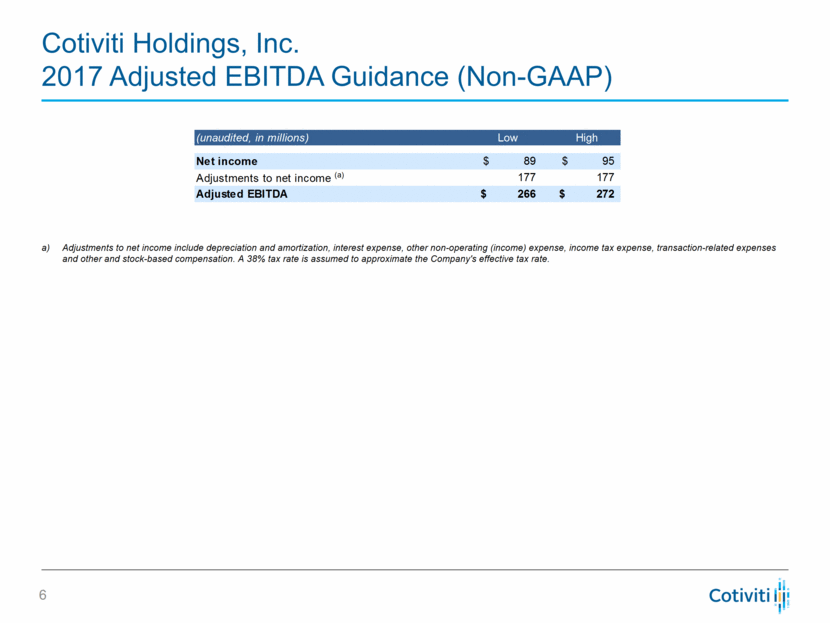
Cotiviti Holdings, Inc. 2017 Adjusted EBITDA Guidance (Non-GAAP) Adjustments to net income include depreciation and amortization, interest expense, other non-operating (income) expense, income tax expense, transaction-related expenses and other and stock-based compensation. A 38% tax rate is assumed to approximate the Company's effective tax rate. (unaudited, in millions) Low High Net income 89 $ 95 $ Adjustments to net income (a) 177 177 Adjusted EBITDA 266 $ 272 $ |
|
|
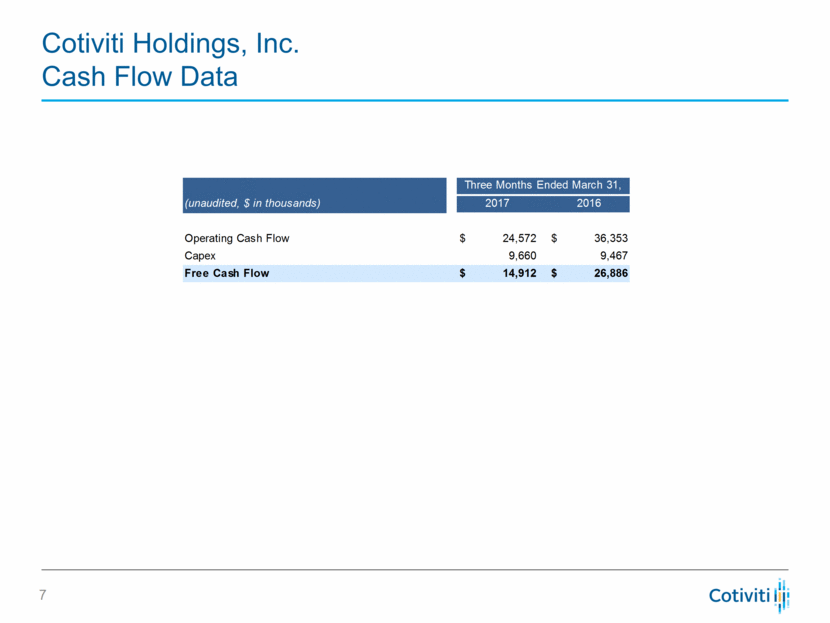
Cotiviti Holdings, Inc. Cash Flow Data Operating Cash Flow $ 24,572 $ 36,353 Capex 9,660 9,467 Free Cash Flow $ 14,912 $ 26,886 (unaudited, $ in thousands) Three Months Ended March 31, 2017 2016 |
|
|
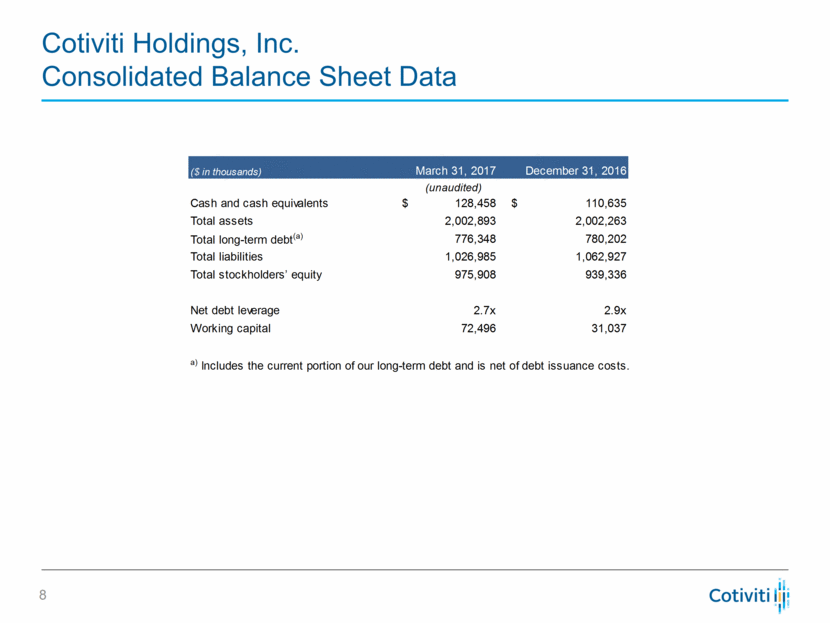
Cotiviti Holdings, Inc. Consolidated Balance Sheet Data ($ in thousands) March 31, 2017 December 31, 2016 (unaudited) Cash and cash equivalents $ 128,458 $ 110,635 Total assets 2,002,893 2,002,263 Total long-term debt (a) 776,348 780,202 Total liabilities 1,026,985 1,062,927 Total stockholders’ equity 975,908 939,336 Net debt leverage 2.7x 2.9x Working capital 72,496 31,037 a) Includes the current portion of our long-term debt and is net of debt issuance costs. |
|
|
Analytics. Insight. Value. Cotiviti |

